Embed Size (px)
Citation preview
FINANCIAL RESULTS
FOR THE SIX MONTHS ENDED SEPTEMBER 2010
Based on US GAAP
Mitsubishi Corporation
2-3-1 Marunouchi, Chiyoda-ku, Tokyo, JAPAN 100-8086 Phone: +81-3-3210-2121 Fax:+81-3-3210-8583
http://www.mitsubishicorp.com/
October 29, 2010Mitsubishi Corporation
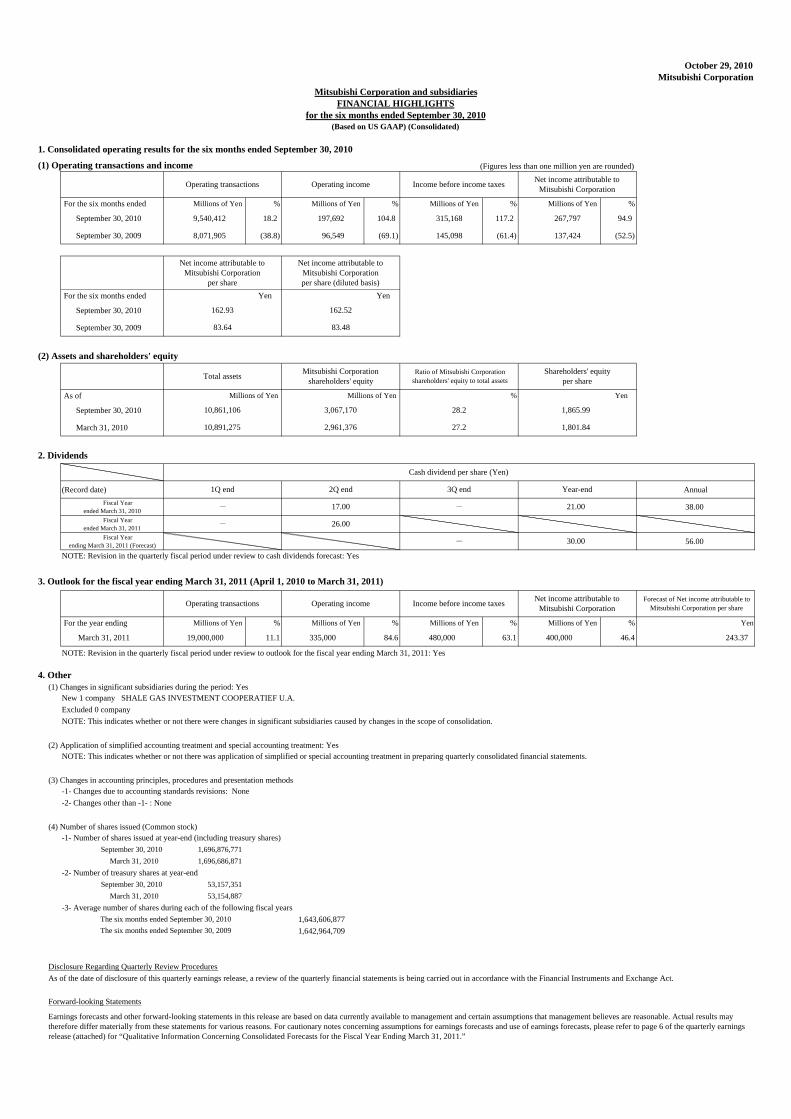
1. Consolidated operating results for the six months ended September 30, 2010
(1) Operating transactions and income (Figures less than one million yen are rounded)
For the six months ended Millions of Yen % Millions of Yen % Millions of Yen % Millions of Yen %
September 30, 2010 9,540,412 18.2 197,692 104.8 315,168 117.2 267,797 94.9
September 30, 2009 8,071,905 (38.8) 96,549 (69.1) 145,098 (61.4) 137,424 (52.5)
For the six months ended
September 30, 2010
September 30, 2009
(2) Assets and shareholders' equity
As of
September 30, 2010
March 31, 2010
2. Dividends
(Record date) Annual Fiscal Year
ended March 31, 2010 38.00 Fiscal Year
ended March 31, 2011 Fiscal Year
ending March 31, 2011 (Forecast) 56.00
NOTE: Revision in the quarterly fiscal period under review to cash dividends forecast: Yes
3. Outlook for the fiscal year ending March 31, 2011 (April 1, 2010 to March 31, 2011)
For the year ending Millions of Yen % Millions of Yen % Millions of Yen % Millions of Yen % Yen
March 31, 2011 19,000,000 11.1 335,000 84.6 480,000 63.1 400,000 46.4 243.37
NOTE: Revision in the quarterly fiscal period under review to outlook for the fiscal year ending March 31, 2011: Yes
4. Other
New 1 company SHALE GAS INVESTMENT COOPERATIEF U.A.Excluded 0 companyNOTE: This indicates whether or not there were changes in significant subsidiaries caused by changes in the scope of consolidation.
(2) Application of simplified accounting treatment and special accounting treatment: YesNOTE: This indicates whether or not there was application of simplified or special accounting treatment in preparing quarterly consolidated financial statements.
(3) Changes in accounting principles, procedures and presentation methods -1- Changes due to accounting standards revisions: None-2- Changes other than -1- : None
(4) Number of shares issued (Common stock) -1- Number of shares issued at year-end (including treasury shares)
September 30, 2010 1,696,876,771March 31, 2010 1,696,686,871
-2- Number of treasury shares at year-endSeptember 30, 2010 53,157,351
March 31, 2010 53,154,887 -3- Average number of shares during each of the following fiscal years
1,643,606,8771,642,964,709
Forward-looking Statements
Earnings forecasts and other forward-looking statements in this release are based on data currently available to management and certain assumptions that management believes are reasonable. Actual results maytherefore differ materially from these statements for various reasons. For cautionary notes concerning assumptions for earnings forecasts and use of earnings forecasts, please refer to page 6 of the quarterly earningsrelease (attached) for “Qualitative Information Concerning Consolidated Forecasts for the Fiscal Year Ending March 31, 2011.”
Disclosure Regarding Quarterly Review ProceduresAs of the date of disclosure of this quarterly earnings release, a review of the quarterly financial statements is being carried out in accordance with the Financial Instruments and Exchange Act.
Cash dividend per share (Yen)
1Q end 2Q end 3Q end Year-end
Operating transactions Operating income Income before income taxes
Forecast of Net income attributable toMitsubishi Corporation per shareOperating transactions Income before income taxes
Net income attributable toMitsubishi Corporation
162.93
83.64
Net income attributable toMitsubishi Corporationper share (diluted basis)
83.48
2,961,37610,891,275
-
Net income attributable toMitsubishi Corporation
(1) Changes in significant subsidiaries during the period: Yes
Net income attributable toMitsubishi Corporation
per shareYen
Millions of Yen
3,067,170
Total assets
Millions of Yen
10,861,106
Mitsubishi Corporationshareholders' equity
Yen
162.52
Shareholders' equityper share
Yen
1,865.99
1,801.84
Ratio of Mitsubishi Corporationshareholders' equity to total assets
%
28.2
27.2
- 26.00
Mitsubishi Corporation and subsidiariesFINANCIAL HIGHLIGHTS
for the six months ended September 30, 2010(Based on US GAAP) (Consolidated)
Operating income
- 30.00
17.00 - 21.00
The six months ended September 30, 2010The six months ended September 30, 2009

Contents
1. Qualitative Information Concerning Consolidated Operating Results……………………. (1) Summary of Results for the Six Months Ended September 2010…………………................. (2) Segment Information………………………………………………………………............
2. Qualitative Information Concerning Consolidated Financial Position…………………….. (1) Changes in Assets, Liabilities and Equity…………………………………………............ (2) Cash Flows…………………………………………………………………………………
3. Qualitative Information Concerning Consolidated Forecasts for the Fiscal Year Ending March 2011…………………………………………………………………………..
4. Other……………………………………………………………………………………........... (1) Significant Changes in Subsidiaries During the Period (Changes in Specified
Subsidiaries Resulting in a Revised Scope of Consolidation)……………………… (2) Application of Simplified Accounting Treatment and Special Accounting Treatment in
Preparing Quarterly Consolidated Financial Statements………………………………… 5. Consolidated Financial Statements (US GAAP) …………………………………………….
(1) Consolidated Balance Sheets (US GAAP)………………………………………………… (2) Consolidated Statements of Income (US GAAP) …………………………………........... (3) Consolidated Statements of Comprehensive Income (US GAAP) ………………………. (4) Consolidated Statements of Cash Flows (US GAAP)………………………………………. (5) Notes Concerning Going Concern Assumption……………………………………............ (6) Basis for Preparation of Consolidated Financial Statements……………………………… (7) Operating Segment Information…………………………………………………………… (8) Notes Concerning Major Changes in Shareholders' Equity…………………………........
1 1 2 4 4 5
6 7
7
7 8 8
10 11 12 13 13 14 14
※ Mitsubishi Corporation will hold an earnings conference for the six months ended September 2010 on November 4, 2010 (Thursday) from 16:00 to 17:30, inviting institutional investors and analysts to the Fuji Room of the Imperial Hotel in Tokyo. The conference can be accessed live in Japanese from the following URL: http://www.mitsubishicorp.com/jp/ja/ir/index.html (English interpretation of the conference will be posted on our web site as soon as it becomes available.)

1. Qualitative Information Concerning Consolidated Operating Results
(1) Summary of Results for the Six Months Ended September 2010 During the first six months of the year ending March 2011, the pace of the economic recovery in industrialized nations softened slightly due to sluggish demand. Contrastingly, China and other emerging nations generally maintained strong economic growth. The Japanese economy saw a slight softening in the increase of exports and production. However, the upturn in personal consumption was maintained, supported by the effects of various policies, resulting in the continuation of a mild economic recovery. Against this backdrop, consolidated operating transactions for the six months ended September 2010 increased 1,468.5 billion yen, or 18.2%, year on year to 9,540.4 billion yen. In addition to a recovery in demand for steel products, this increase reflected higher oil prices and robust growth in automobile and other machinery-related transactions. Gross profit rose 95.7 billion yen, or 18.7%, to 606.1 billion yen due to rising prices for coking coal and other resources, and to strong sales in steel products and automobile-related operations.
Selling, general and administrative expenses declined 6.5 billion yen, or 1.6%, to 405.7 billion yen due to the absence of head office building relocation expenses recorded in the first six months of the year ended March 2010, in addition to the impact of the deconsolidation of subsidiaries.
In other P/L items, there was an improvement in gain on marketable securities and investments-net due primarily to gains on a share transfer at a Chilean iron ore-related subsidiary. Furthermore, dividend income increased from resource-related business investees.
1
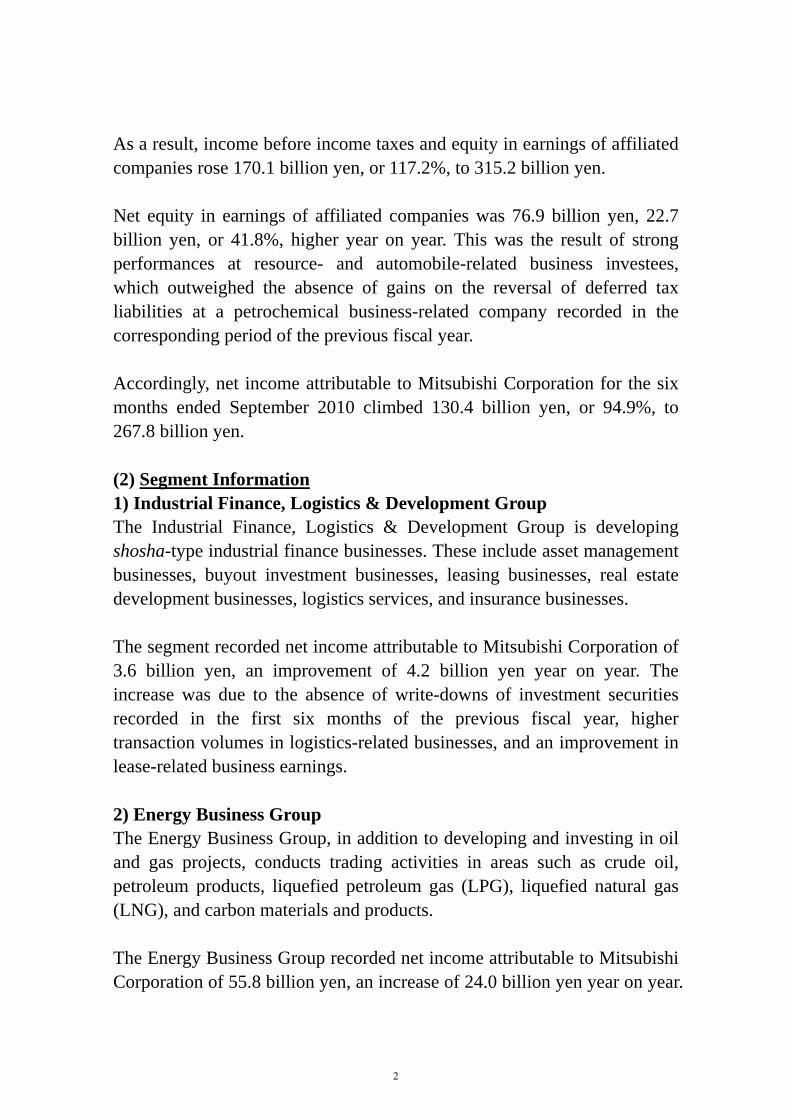
As a result, income before income taxes and equity in earnings of affiliated companies rose 170.1 billion yen, or 117.2%, to 315.2 billion yen. Net equity in earnings of affiliated companies was 76.9 billion yen, 22.7 billion yen, or 41.8%, higher year on year. This was the result of strong performances at resource- and automobile-related business investees, which outweighed the absence of gains on the reversal of deferred tax liabilities at a petrochemical business-related company recorded in the corresponding period of the previous fiscal year.
Accordingly, net income attributable to Mitsubishi Corporation for the six months ended September 2010 climbed 130.4 billion yen, or 94.9%, to 267.8 billion yen. (2) Segment Information 1) Industrial Finance, Logistics & Development Group The Industrial Finance, Logistics & Development Group is developing shosha-type industrial finance businesses. These include asset management businesses, buyout investment businesses, leasing businesses, real estate development businesses, logistics services, and insurance businesses. The segment recorded net income attributable to Mitsubishi Corporation of 3.6 billion yen, an improvement of 4.2 billion yen year on year. The increase was due to the absence of write-downs of investment securities recorded in the first six months of the previous fiscal year, higher transaction volumes in logistics-related businesses, and an improvement in lease-related business earnings. 2) Energy Business Group The Energy Business Group, in addition to developing and investing in oil and gas projects, conducts trading activities in areas such as crude oil, petroleum products, liquefied petroleum gas (LPG), liquefied natural gas (LNG), and carbon materials and products. The Energy Business Group recorded net income attributable to Mitsubishi Corporation of 55.8 billion yen, an increase of 24.0 billion yen year on year.
2

In addition to gains on the sale of shares, this increase reflected higher gross profit at overseas resource-related subsidiaries and higher equity in earnings of overseas resource-related business investments because of rising oil prices. 3) Metals Group The Metals Group trades, develops businesses and invests in a range of fields. These include steel products such as steel sheets and thick plates, steel raw materials such as coking coal and iron ore, and non-ferrous raw materials and products such as copper and aluminum. The segment recorded net income attributable to Mitsubishi Corporation of 147.4 billion yen, representing an increase of 90.3 billion yen year on year. This increase resulted primarily from gains on a share transfer at a Chilean iron ore-related subsidiary and higher equity-method earnings of related business investees, as well as higher sales volumes and sales prices at an Australian resource-related subsidiary (coking coal). 4) Machinery Group The Machinery Group trades machinery in a broad range of fields, in which it also develops businesses and invests. These fields extend from large plants for essential industrial materials, including electricity, gas, petroleum, chemicals and steel, to equipment and machinery for transportation and distribution industries, including ships, trains and automobiles. It is also active in the aerospace and defense industries, and in general industrial equipment and machinery, including construction machinery, machine tools, and agricultural machinery. The segment recorded net income attributable to Mitsubishi Corporation of 27.2 billion yen, an increase of 10.6 billion yen year on year. This increase was mainly due to strong results at overseas automobile-related businesses, notably in Asia.
3
5) Chemicals Group The Chemicals Group trades chemical products in a broad range of fields, in which it also develops businesses and invests. These fields extend from raw materials produced upstream from crude oil and natural gas, minerals and plants, marine resources and so forth, to downstream areas such as plastics, functional materials, electronic materials, food ingredients, fertilizer and fine chemicals. The segment recorded net income attributable to Mitsubishi Corporation of 13.2 billion yen, which was a 6.3 billion yen decline year on year. The decrease reflects the absence of a gain on reversal of deferred tax liabilities of a petrochemical business-related company in the previous fiscal year’s first six months, offset in part by higher earnings due to strong transactions at a petrochemical business-related company. 6) Living Essentials Group The Living Essentials Group provides products and services, develops businesses and invests in various fields closely linked with people’s lives, including foods, clothing, paper, packaging materials, cement, construction materials, medical equipment and nursing care. These fields extend from the procurement of raw materials to the consumer market. The segment recorded net income attributable to Mitsubishi Corporation of 21.3 billion yen, an increase of 2.8 billion yen year on year. The increase was due to higher earnings on transactions and equity-method earnings at general merchandise-related businesses, as well as an increase in equity-method earnings at food-related subsidiaries. 2. Qualitative Information Concerning Consolidated Financial Position (1) Changes in Assets, Liabilities and Equity Total assets at September 30, 2010 were 10,861.1 billion yen, down 30.2 billion yen from March 31, 2010. Although investments in affiliated companies and inventories increased, this was mainly due to decreases in sales of and unrealized gains on listed shares.
4
Total liabilities were 7,492.3 billion yen, down 132.2 billion yen from March 31, 2010. In addition to a decrease in notes, acceptances and accounts payable-trade, this reflected a decline in deferred income taxes resulting from decreases in sales of and unrealized gains on listed shares. Interest-bearing liabilities (net), which are interest-bearing liabilities (gross) minus cash and cash equivalents and time deposits, decreased 25.0 billion yen to 2,930.2 billion yen. The net debt-to-equity ratio, which is net interest-bearing liabilities divided by total equity, was 1.0. Total shareholders’ equity increased 105.8 billion yen from March 31, 2010 to 3,067.2 billion yen. This reflected the first-half consolidated net income attributable to Mitsubishi Corporation, which outweighed a deterioration in foreign currency translation adjustments, and decreases in sales of and unrealized gains on listed shares. (2) Cash Flows Cash and cash equivalents at September 30, 2010 were 1,072.8 billion yen, down 20.6 billion yen from March 31, 2010. (Operating activities) Net cash provided by operating activities was 186.8 billion yen, despite an increase in working capital requirements. Cash was mainly provided by strong cash flows from operating transactions primarily at resource-related subsidiaries and firm growth in dividend income from business investments, mainly resource-related companies. (Investing activities) Net cash used in investing activities was 128.7 billion yen. Net cash was used in investing activities mainly for subscribing to a capital increase at a Chilean iron ore business, and for capital expenditures and the acquisition of working interests, primarily at overseas resource-related subsidiaries, despite proceeds from the sale of shares. As a result of the above, free cash flow, the sum of operating and investing cash flows, was a positive 58.1 billion yen.
5

(Financing activities) Net cash used in financing activities was 58.9 billion yen. Cash was primarily used for the payment of dividends at the Parent. 3. Qualitative Information Concerning Consolidated Forecasts for the Year Ending March 2011 Mitsubishi Corporation has raised its initial full-year projection for consolidated net income attributable to Mitsubishi Corporation by 30.0 billion yen to 400.0 billion yen for the year ending March 2011. This upward revision takes into account the fact that Mitsubishi Corporation’s first-half performance represented an achievement rate of 72% relative to its initial full-year forecast of 370.0 billion yen for consolidated net income attributable to Mitsubishi Corporation. Although the yen has appreciated more than initially assumed, Mitsubishi Corporation has recorded gains on a share exchange at a Chilean iron ore-related subsidiary and both the Metals and Machinery business groups are performing strongly. The revised bottom-line forecast also factors in the economic outlook, including the yen’s current appreciation. (Billion yen)
Revised Full-Year
Forecasts
Previous Full-Year Forecasts
(Announced on May 7, 2010)
Change
Operating transactions
19,000.0 18,800.0 200.0
Consolidated net income attributable to Mitsubishi Corporation
400.0 370.0 30.0
6

Basic assumptions for the full-year forecasts (fiscal year averages):
Revised Full-Year
Forecasts
Previous Full-Year Forecasts
(Announced on May 7, 2010)
Change
Exchange rate 84.5 JPY/US$1 90 JPY/US$1 -5.5 JPY/US$1 Crude oil price 75.5 US$/BBL 75 US$/BBL 0.5 US$/BBL Interest rate (TIBOR)
0.39% 0.45% -0.06%
Note: Earnings forecasts and other forward-looking statements in this release are management’s current views and beliefs in accordance with data currently available, and are subject to a number of risks, uncertainties and other factors that may cause actual results to differ materially from those projected. 4. Other (1) Significant changes in subsidiaries during the period (changes in specified subsidiaries resulting in a revised scope of consolidation) SHALE GAS INVESTMENT COOPERATIEF U.A. became a consolidated subsidiary following a capital increase during the period. (2) Application of Simplified Accounting Treatment and Special Accounting Treatment in Preparing Quarterly Consolidated Financial Statements Consolidated income taxes are calculated based on the estimated tax rate, taking into account tax effects, for the fiscal year relating to the quarterly fiscal period under review.
7

ASSETS
September 30 March 31 Increase or
2010 2010 [-]decrease
Current assets:
Cash and cash equivalents 1,072,830 1,093,478 -20,648
Time deposits 103,625 106,021 -2,396
Short-term investments 54,710 55,757 -1,047
Receivables-trade:
Notes and loans 500,610 518,059 -17,449
Accounts 2,204,767 2,245,566 -40,799
Affiliated companies 212,516 195,922 16,594
Allowance for doubtful receivables (27,846) (30,221) 2,375
Inventories 901,126 858,322 42,804
Advance payments to suppliers 158,416 146,661 11,755
Deferred income taxes 53,513 43,907 9,606
Other current assets 305,231 291,728 13,503
Total current assets 5,539,498 5,525,200 14,298
Investments and noncurrent receivables:
Investments in and advances to affiliated companies 1,306,265 1,238,523 67,742
Other investments 1,494,640 1,630,450 -135,810
Noncurrent notes, loans and accounts receivable-trade 509,374 532,098 -22,724
Allowance for doubtful receivables (28,461) (33,008) 4,547
Total investments and noncurrent receivables 3,281,818 3,368,063 -86,245
Property and equipment:
Property and equipment 2,920,451 2,893,187 27,264
Less accumulated depreciation (1,211,775) (1,195,815) -15,960
Property and equipment - net 1,708,676 1,697,372 11,304
Other assets 331,114 300,640 30,474
Total assets 10,861,106 10,891,275 -30,169
Mitsubishi Corporation and subsidiaries(1) CONSOLIDATED BALANCE SHEETS (US GAAP)
September 30, 2010 and March 31, 2010
Millions of Yen
8

Mitsubishi Corporation and subsidiaries(1) CONSOLIDATED BALANCE SHEETS (US GAAP)
September 30, 2010 and March 31, 2010
LIABILITIES AND EQUITY
September 30 March 31 Increase or
2010 2010 [-]decrease
Current liabilities:
Short-term debt 634,095 555,001 79,094
Current maturities of long-term debt 272,954 408,288 -135,334
Payables-trade:
Notes and acceptances 145,603 152,336 -6,733
Accounts 1,789,524 1,893,754 -104,230
Affiliated companies 137,888 128,929 8,959
Advances from customers 172,547 149,849 22,698
Accrued income taxes 57,029 43,227 13,802
Other accrued expenses 84,785 104,227 -19,442
Other current liabilities 338,976 312,815 26,161
Total current liabilities 3,633,401 3,748,426 -115,025
Noncurrent liabilities:
Long-term debt 3,281,689 3,246,029 35,660
Accrued pension and severance liabilities 49,720 54,592 -4,872
Deferred income taxes 187,399 202,595 -15,196
Other noncurrent liabilities 340,071 372,859 -32,788
Total noncurrent liabilities 3,858,879 3,876,075 -17,196
Total liabilities 7,492,280 7,624,501 -132,221
Mitsubishi Corporation shareholders' equity:
Common stock 203,338 203,228 110
Additional paid-in capital 257,257 254,138 3,119
Retained earnings:
Appropriated for legal reserve 43,620 43,170 450
Unappropriated 2,938,119 2,705,291 232,828
Accumulated other comprehensive income (loss):
Net unrealized gains on securities available-for-sale 259,844 299,983 -40,139
Net unrealized gains on derivatives 16,344 11,922 4,422
Defined benefit pension plans (77,184) (80,386) 3,202
Foreign currency translation adjustments (422,592) (324,398) -98,194
Less treasury stock (151,576) (151,572) -4
Total Mitsubishi Corporation shareholders' equity 3,067,170 2,961,376 105,794
Noncontrolling interest 301,656 305,398 -3,742
Total equity 3,368,826 3,266,774 102,052
Total liabilities and equity 10,861,106 10,891,275 -30,169
Millions of Yen
9
Six monthsended
Six monthsended
September 30, 2010 September 30, 2009 %
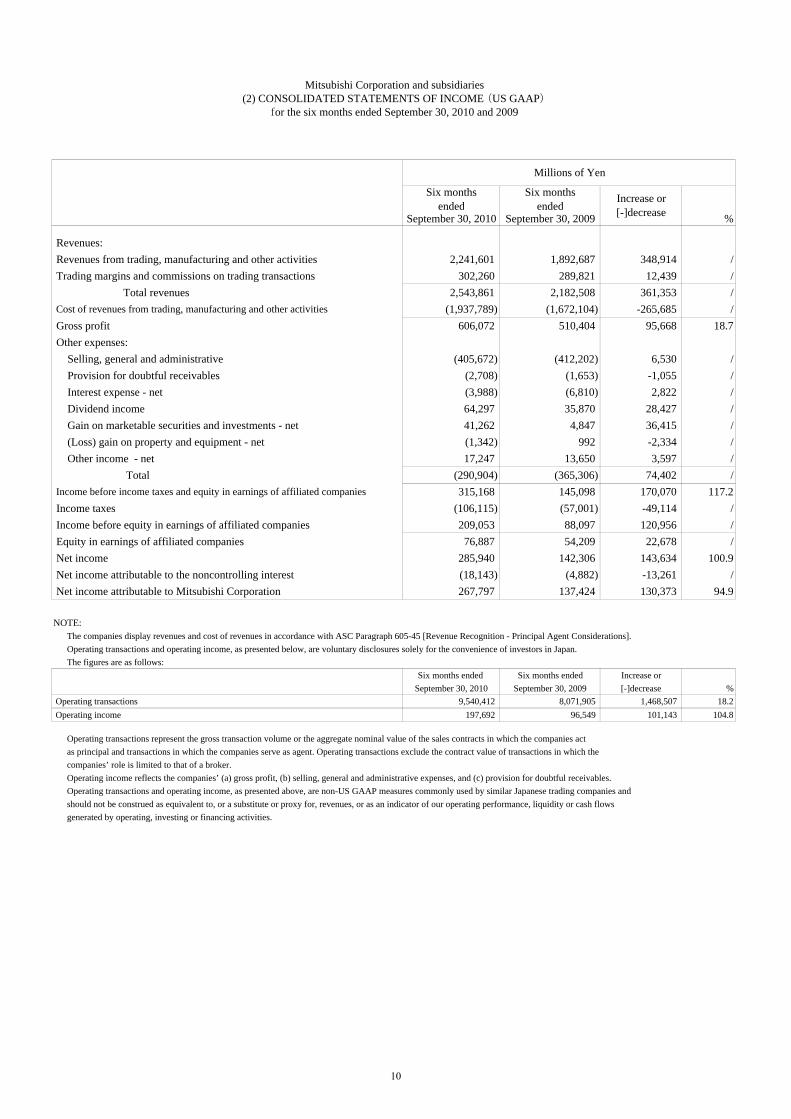
Revenues: Revenues from trading, manufacturing and other activities 2,241,601 1,892,687 348,914 / Trading margins and commissions on trading transactions 302,260 289,821 12,439 / Total revenues 2,543,861 2,182,508 361,353 / Cost of revenues from trading, manufacturing and other activities (1,937,789) (1,672,104) -265,685 / Gross profit 606,072 510,404 95,668 18.7 Other expenses: Selling, general and administrative (405,672) (412,202) 6,530 / Provision for doubtful receivables (2,708) (1,653) -1,055 / Interest expense - net (3,988) (6,810) 2,822 / Dividend income 64,297 35,870 28,427 / Gain on marketable securities and investments - net 41,262 4,847 36,415 / (Loss) gain on property and equipment - net (1,342) 992 -2,334 / Other income - net 17,247 13,650 3,597 / Total (290,904) (365,306) 74,402 / Income before income taxes and equity in earnings of affiliated companies 315,168 145,098 170,070 117.2 Income taxes (106,115) (57,001) -49,114 / Income before equity in earnings of affiliated companies 209,053 88,097 120,956 / Equity in earnings of affiliated companies 76,887 54,209 22,678 / Net income 285,940 142,306 143,634 100.9 Net income attributable to the noncontrolling interest (18,143) (4,882) -13,261 / Net income attributable to Mitsubishi Corporation 267,797 137,424 130,373 94.9
NOTE: The companies display revenues and cost of revenues in accordance with ASC Paragraph 605-45 [Revenue Recognition - Principal Agent Considerations]. Operating transactions and operating income, as presented below, are voluntary disclosures solely for the convenience of investors in Japan. The figures are as follows:
Six months ended Six months ended Increase orSeptember 30, 2010 September 30, 2009 [-]decrease %
Operating transactions 9,540,412 8,071,905 1,468,507 18.2 Operating income 197,692 96,549 101,143 104.8
Operating transactions represent the gross transaction volume or the aggregate nominal value of the sales contracts in which the companies act as principal and transactions in which the companies serve as agent. Operating transactions exclude the contract value of transactions in which the companies’ role is limited to that of a broker. Operating income reflects the companies’ (a) gross profit, (b) selling, general and administrative expenses, and (c) provision for doubtful receivables. Operating transactions and operating income, as presented above, are non-US GAAP measures commonly used by similar Japanese trading companies and should not be construed as equivalent to, or a substitute or proxy for, revenues, or as an indicator of our operating performance, liquidity or cash flows generated by operating, investing or financing activities.
Mitsubishi Corporation and subsidiaries
Increase or[-]decrease
Millions of Yen
for the six months ended September 30, 2010 and 2009(2) CONSOLIDATED STATEMENTS OF INCOME (US GAAP)
10

Six months ended Six months ended
September 30, 2010 September 30, 2009
Comprehensive income Net income 285,940 142,306 Other comprehensive (loss) income, net of tax: Net unrealized (losses) gains on securities available for sale (43,551) 135,863 Net unrealized gains on derivatives 4,443 42,077 Defined benefit pension plans 3,295 1,363 Foreign currency translation adjustments (102,977) 104,781 Total other comprehensive (loss) income, net of tax (138,790) 284,084 Comprehensive income 147,150 426,390 Comprehensive income attributable to the noncontrolling interest (10,062) (14,505) Comprehensive income attributable to Mitsubishi Corporation 137,088 411,885
for the six months ended September 30, 2010 and 2009
Millions of Yen
Mitsubishi Corporation and subsidiaries
(3) CONSOLIDATED STATEMENTS OF COMPREHENSIVE INCOME (US GAAP)
11

Mitsubishi Corporation and subsidiaries(4) CONSOLIDATED STATEMENTS OF CASH FLOWS (US GAAP)
for the six months ended September 30, 2010 and 2009
Six months endedSeptember 30, 2010
Six months endedSeptember 30, 2009
Operating activities:
Net income 285,940 142,306
provided by operating activities:Depreciation and amortization 69,741 68,346 Provision for doubtful receivables 2,708 1,653 Gain on marketable securities and investments - net (41,262) (4,847)Loss (gain) on property and equipment - net 1,342 (992)Equity in earnings of affiliated companies, less dividends received (19,010) (30,024)Changes in operating assets and liabilities: Short-term investments - trading securities 446 9,416 Notes and accounts receivable - trade (5,376) 157,441 Inventories (49,120) 177,100 Notes, acceptances and accounts payable - trade (100,214) (76,037) Other - net 41,599 24,235 Net cash provided by operating activities 186,794 468,597
Investing activities:Expenditures for property and equipment and other assets (124,390) (106,665)Proceeds from sales of property and equipment 5,660 7,602 Investments in and advances to affiliated companies (71,959) (43,466)Sale of investments in and collection of advances to affiliated companies 10,607 18,427 Purchases of available-for-sale securities and other investments (146,785) (106,687)Proceeds from sales of available-for-sale securities and other investments 197,824 112,401 Increase in loans receivable (139,355) (134,886)Collection of loans receivable 138,348 149,847 Net decrease in time deposits 1,302 15,818
Net cash used in investing activities (128,748) (87,609)
Financing activities:Net increase (decrease) in short-term debt 65,961 (627,788)Proceeds from long-term debt 258,407 390,130 Repayment of long-term debt (335,224) (266,585)Payment of dividends (34,519) (26,290)Payment of dividends to the noncontrolling interest (13,856) (11,775)Payment for acquisition of subsidiary's interests from the noncontrolling interest (22) (16,362)Other - net 391 149
Net cash used in financing activities (58,862) (558,521)
Effect of exchange rate changes on cash and cash equivalents (19,832) 769
Net decrease in cash and cash equivalents (20,648) (176,764)
Cash and cash equivalents, beginning of period 1,093,478 1,215,099
Cash and cash equivalents, end of period 1,072,830 1,038,335
Millions of Yen
Adjustments to reconcile net income to net cash
12
(5) Notes Concerning Going Concern Assumption None
(6) Basis for Preparation of Consolidated Financial Statements
The accompanying consolidated financial statements of Mitsubishi Corporation and its subsidiaries have been prepared in accordance with accounting principles generally accepted in the United States of America (U.S. GAAP). The significant differences between U.S. and Japanese accounting standards applicable to the companies relate to the following: (1) Valuation of investments (2) Deferral of gain on sales of properties for tax purposes (3) Derivative instruments and hedge accounting (4) Pension and retirement benefit accounting (5) Accounting for business combinations and goodwill and other intangible assets
13

(7) Operating segment information
Six months ended September 30, 2010
Adjustments
Other and
Eliminations
Gross profit…………………… 23,133 25,756 206,126 86,857 40,065 216,461 598,398 8,141 (467) 606,072
3,100 28,915 14,536 9,258 7,100 11,322 74,231 4,002 (1,346) 76,887
3,572 55,819 147,356 27,226 13,236 21,276 268,485 (2,366) 1,678 267,797
Segment assets………………… 805,639 1,174,078 3,083,044 1,813,957 646,265 2,115,107 9,638,090 2,063,201 (840,185) 10,861,106
Operating transactions………… 80,597 1,887,818 2,207,063 1,860,099 981,265 2,523,685 9,540,527 49,768 (49,883) 9,540,412
Six months ended September 30, 2009
Adjustments
Other and
Eliminations
Gross profit…………………… 22,490 17,518 132,267 72,774 38,771 221,428 505,248 5,682 (526) 510,404
554 20,761 9 5,602 11,837 9,805 48,568 5,756 (115) 54,209
(599) 31,799 57,135 16,554 19,464 18,539 142,892 (7,955) 2,487 137,424
Segment assets………………… 858,091 1,345,235 2,728,720 1,817,820 664,368 2,172,520 9,586,754 1,915,295 (916,904) 10,585,145
Operating transactions………… 90,669 1,484,793 1,688,255 1,416,691 839,850 2,542,895 8,063,153 57,978 (49,226) 8,071,905
NOTE:(1) Operating transactions, as presented above, are voluntary disclosures solely for the convenience of investors in Japan. Operating transactions represent the gross transaction volume or the aggregate nominal value of the sales contracts in which the companies act as principal and transactions in which the companies serve as agent. Operating transactions exclude the contract value of transactions in which the companies’ role is limited to that of a broker. (2) "Other" represents corporate departments which primarily provide services and operational support to the Company and Affiliated companies. This column also includes certain revenues and expenses from business activities related to financing and human resource services that are not allocated to reportable operating segments. Unallocated corporate assets categorized in "Other" consist primarily of cash, time deposits and securities for financial and investment activities.(3) "Adjustments and Eliminations" include certain income and expense items that are not allocated to reportable operating segments and intersegment eliminations.(4) Effective April 1, 2010, the Company transferred parts of the business of the "Industrial Finance, Logistics & Development" and "Machinery" to "Other." The consolidated financial position and the results of operations of related reportable operating segments for the six months ended September 30, 2009 have also been reclassified accordingly.
(8) Notes concerning major changes in shareholders’ equity None
Net income (loss) attributable to Mitsubishi Corporation.………..
Net income (loss) attributable to Mitsubishi Corporation…………
Consolidated
LivingEssentialsMachinery
Equity in earnings of Affiliated companies……………
Millions of YenIndustrialFinance,
Logistics &Development
Equity in earnings of Affiliated companies……………
EnergyBusiness Metals
IndustrialFinance,
Logistics &Development
Total Consolidated
Millions of Yen
Chemicals
LivingEssentials TotalEnergy
Business Metals Machinery Chemicals
14

Consolidated Results for the Six Months Ended September 30, 2010 and Full-Year Forecasts (US GAAP)
Increase ordecrease
Percentage ofachievement
(Billion yen)19,000.0
〔200.0〕1,200.0
〔50.0〕Selling, general and administrative expenses (412.2) (830.6) (405.7) 6.5 b (860.0) 47%Provision for doubtful receivables (1.7) (4.7) (2.7) (1.0) (5.0) 54%
335.0〔55.0〕
Interest expense-net (6.8) (12.6) (4.0) 2.8 (10.0) 40%Dividend income 35.9 91.5 64.3 28.4 100.0 64%Gain (loss) on marketable securities andinvestments-net 4.8 (2.9) 41.3 36.5 dGain (loss) on property and equipment-net 1.0 (15.6) (1.3) (2.3) e 55.0 104%
Other income-net 13.7 52.5 17.2 3.5 f480.0
〔50.0〕Income taxes (57.0) (118.0) (106.1) (49.1) (195.0) 54%
285.0〔15.0〕
Equity in earnings of affiliatedcompanies-net 54.2 113.4 76.9 22.7 g 145.0 53%
430.0〔30.0〕
Net income attributable to noncontrollinginterests (4.9) (16.6) (18.2) (13.3) (30.0) 61%
400.0
〔30.0〕
181.5 378.4 337.6 156.1 575.0 59%〔80.0〕
(*1) Core earnings = Operating income (before the deduction of provision for doubtful receivables) + Interest expense-net + Dividend income + Equity in earnings of affiliated companies
Vs. Mar. 31,2010
Vs. Sept. 30,2010
Total assets 10,585.1 10,891.3 10,861.1 (30.2) 11,100.0 238.9(Current assets) 5,123.4 5,525.2 5,539.5 14.3 5,500.0 (39.5)(Investments and non-currentreceivables) 3,410.0 3,368.1 3,281.8 (86.3) 3,550.0 268.2(Property and equipment-net, other) 2,051.7 1,998.0 2,039.8 41.8 2,050.0 10.2Total shareholders’ equity 2,761.7 2,961.4 3,067.2 105.8 3,050.0 (17.2)Interest-bearing liabilities Gross 4,340.7 4,154.7 4,106.6 (48.1) 4,300.0 193.4 Net 3,204.0 2,955.2 2,930.2 (25.0) 3,200.0 269.8
Debt-to-equity ratio Gross 1.6 1.4 1.3 (0.1) 1.4 0.1 Net 1.2 1.0 1.0 - 1.0 -
(*3) Interest-bearing liabilities do not include the impact of adopting ASC Codification Topic 815, “Derivatives and Hedging”.
Cash flows from operating activities 468.6 760.6 186.8 …
Cash flows from investing activities (87.6) (141.2) (128.7) … Free cash flow 381.0 619.4 58.1
Cash flows from financing activities (558.5) (755.1) (58.9) … Net decrease in cash and cashequivalents (176.8) (121.6) (20.6)
273.1Net income attributable to MitsubisihiCorporation〔Against initial forecast〕
137.4
Mar. 31, 2011 (Forecasts)Mar. 31, 2010
Core earnings〔Against initial forecast〕
Sept. 30, 2009
(*2) Operating transactions and operating income, as presented above, are voluntary disclosures solely for the convenience of investors in Japan. Revenues in accordance with ASCSubtopic 605-45, “Revenue Recognition – Principal Agent Considerations,” was 2,543.9 billion yen and 2,182.5 billion yen for the six months ended Sept. 2010 and the six months endedSept. 2009, respectively.
Six months endedSept. 2009
Year endedMar. 31, 2010
Six months endedSept. 2010
Sept. 30, 2010
294.3
Six months endedSept. 2009
8,071.9
510.4
Year endedMar. 2010
17,098.7
1,016.7
181.4
145.1
96.5
88.1 176.3
142.3 289.7
October 29, 2010Mitsubishi Corporation
Major Year-on-Year ChangesOutline of Results for the First Six Months of Year Ending March 2011
a 51%
67%
Gross profit〔Against initial forecast〕 606.1
Operating transactions〔Against initial forecast〕
95.7
9,540.4 1,468.5
Income before income taxes〔Against initial forecast〕
Operating income〔Against initial forecast〕
Income before noncontrollinginterests〔Against initial forecast〕
Income after income taxes〔Against initial forecast〕
Revised forecasts for theyear ending Mar. 2011Six months ended Sept. 2010
209.1 121.0 73%
101.2 59%
66%
c
50%
197.7
Segment Overview Forecasts for Year Ending March 2011 and Dividend Policy
67%286.0
130.4
170.1315.2
267.8
143.7
Net Income (Loss) by Segment
18.5 21.319.516.6 27.2
57.1
147.431.8
(0.7)(5.5)
13.2
55.8
(0.6)
3.6
▲ 50
0
50
100
150
200
250
300
Six months ended Sept.2009
Six months ended Sept.2010
Industrial Finance,Logistics &DevelopmentEnergy Business
Metals
Machinery
Chemicals
Living Essentials
Adjustments andEliminations
Changes in Net Income Forecasts by Segment
(28.5)
48.0 44.0
25.0 22.038.0 49.0
185.0220.0
73.0
85.0
(7.5)
8.5
8.5
(50.0)
0.0
50.0
100.0
150.0
200.0
250.0
300.0
350.0
400.0
450.0
Forecasts for Year EndingMar. 2011
(Initial)
Forecasts for Year EndingMar. 2011(Revised)
Industrial Finance,Logistics &Development
Energy Business
Metals
Machinery
Chemicals
Living Essentials
Adjustments andEliminations
Three-Year Summary of Six-Months Results Ended Sept. 30
289.2267.8
137.4
197.796.5
312.5
483.9
181.5337.6
0.0
100.0
200.0
300.0
400.0
500.0
600.0
Six months ended Sept.2008
Six months ended Sept.2009
Six months ended Sept.2010
Net income Operating income Core earnings
Assets and Liabilities
Consolidated Income
Cash Flows
a. Gross profit (+95.7 billion yen)Gross profit rose 19% year on year due to higher coking coal, crude oil and other resourceprices, as well as strong sales in automobile-related businesses, particularly in Asia.
b. Selling, general and administrative expenses (Decreased 6.5 billion yen)SG&A expenses improved due to the absence of head office building relocation expensesrecorded in the first six months of the year ended March 2010, and the deconsolidation ofcertain subsidiaries.
c. Net financial income (+31.2 billion yen)Net financial income improved because of higher resource-related dividend income. d. Gain on marketable securities and investments-net (+36.5 billion yen) (1) Write-down of marketable securities (available for sale) -4.2 billion yen [-10.8 billion yen ← -6.6 billion yen](2) Impairment losses on non-performing assets -1.0 billion yen [-8.0 billion yen ← -7.0 billion yen](3) Other realized gains and unrealized gains on shares, etc. +41.7 billion yen [+60.1 billion yen ← +18.4 billion yen] e. Loss on property and equipment-net (-2.3 billion yen)The loss on property and equipment-net reflects the absence of gains on sale of property andequipment recorded at subsidiaries in the first six months of the previous fiscal year.
f. Other income-net (+3.5 billion yen)Increased due to improvement in foreign exchange gains and losses. g. Equity in earnings of affiliated companies-net (+22.7 billion yen)This was the result of strong performances at resource-related and other business investeesoverseas, which outweighed the absence of gains on the reversal of deferred tax liabilities at apetrochemical business-related company recorded in the corresponding period of the previousfiscal year.
Operating activities provided net cash due to strong cash flows fromoperating transactions and firm growth in dividend income fromresource-related business investees, despite an increase in workingcapital requirements.
Investing activities used net cash mainly for acquiring property andequipment and subscribing to a capital increase at an affiliate.
Financing activities used net cash mainly for the payment ofdividends.
(3) Shareholders’ Equity Back Over 3 Trillion YenShareholders’ equity rose 105.8 billion yen from March 31, 2010 to top 3 trillion yen again.Although accumulated other comprehensive income declined due to the impact of the yen’sappreciation and share price falls, this increase reflected higher retained earnings, which wereboosted by the net income result.The net debt-to-equity ratio, an indicator of financial soundness, was 1.0 times, unchanged fromMarch 31, 2010.
[Forward-looking Statements]Earnings forecasts and other forward-looking statements in this release are management’s current viewsand beliefs in accordance with data currently available, and are subject to a number of risks,uncertainties and other factors that may cause actual results to differ materially from those projected.
[Dividend Policy]MC’s basic policy is to target a consolidated payout ratio in the range of 20% to 25%. Inaccordance with this policy, MC plans to raise the annual dividend by 4 yen from its originalforecast to 56 yen, providing it achieves its revised full-year forecast for consolidated netincome attributable to Mitsubishi Corporation of 400.0 billion yen. This would equate to aconsolidated payout ratio of 23%.MC will pay an interim dividend of 26 yen per share, as originally forecast.
[ Change of Major Indices ] Six months Six months Increase or ended Sept. 2010 ended Sept. 2009 decrease Crude Oil (USD/BBL) 76.0 63.5 +12.5 (+20%) Foreign Exchange (YEN/USD) 88.9 95.5 -6.6 (7% yen appreciation) Interest (%) TIBOR 0.38 0.57 -0.19 (-33%)
[Major Changes] □Industrial Finance, Logistics & DevelopmentIncreased due to absence of write-downs of investment securities recorded in the previous fiscalyear, higher transaction volumes in distribution-related businesses, and an improvement inlease-related business earnings. □Energy BusinessIn addition to gains on the sale of shares, this increase reflected higher gross profit at overseasresource-related subsidiaries and higher equity in earnings of overseas resource-relatedbusiness investments because of rising oil prices. □MetalsThis increase resulted primarily from gains on a share transfer at a Chilean iron ore-relatedsubsidiary and higher equity-method earnings of related business investees, as well as fromhigher sales volumes and sales prices at an Australian resource-related subsidiary (cokingcoal). □MachineryIncrease due to strong results at overseas automobile-related businesses, notably in Asia. □ChemicalsDecrease reflects absence of gain on reversal of deferred tax liabilities of a petrochemicalbusiness-related company in the previous fiscal year, offset in part by higher earnings due tostrong transactions at petrochemical business-related companies. □Living EssentialsIncreased due to higher earnings on transactions and equity-method earnings at generalmerchandise-related businesses, as well as an increase in equity-method earnings at food-related subsidiaries.
[Overview]MC has raised its initial full-year forecast for consolidated net income attributable to MitsubishiCorporation by 30.0 billion yen to 400.0 billion yen for the year ending March 2011. This upwardrevision takes into account the fact that MC’s first-half performance represented an achievementrate of 72% relative to its initial full-year forecast of 370.0 billion yen for consolidated net incomeattributable to Mitsubishi Corporation. The revised bottom-line forecast also factors in theeconomic outlook, including the yen’s current appreciation.
72% achievement rate against initialforecast of 370 billion yen
+19%
+105%
+117%
+101%
+95%
+86%
370 billion yen 400 billion yen
(Note) Figures for the first six months of the year ended March 2010 have been restated on the basis ofthe new organization structure following an internal corporate reorganization in April 2010.
(Billion yen)
[Overview](1) Six-Month Net Income Rises 95% Year on YearMC posted net income of 267.8 billion yen, up 95% year on year.The Metals, Energy Business and Machinery segments saw earnings rise sharply due to higherresource prices and recovering demand overseas.All segments recorded higher earnings except Chemicals because of special factors in theprevious fiscal year.
(2) Achievement Rate of 72% Against Initial Full-Year Net Income ForecastNet income represented a high achievement rate of 72% against the initial full-year forecast of370.0 billion yen. Although the yen has appreciated more than initially assumed, MC recordedgains on a share exchange at a Chilean iron ore-related subsidiary and both the Metals andMachinery segments performed strongly.
(Billion yen)
(Billion yen)

October 29, 2010Mitsubishi Corporation
Results for the Six Months EndedSeptember 2010- Supplement -
Results for the Six Months EndedSeptember 2010- Supplement -
October 29, 2010
Mitsubishi Corporation

1
October 29, 2010Mitsubishi Corporation
Gross Profit by Operating Segment
5.1 7.6
221.4 216.5
38.8 40.172.8 86.9
132.3206.1
17.5
25.823.1
22.5
0.0
100.0
200.0
300.0
400.0
500.0
600.0
700.0
Six months ended Sept. 2009 (*) Six months ended Sept. 2010
Industrial Finance,Logistics & Development
Energy Business
Metals
Machinery
Chemicals
Living Essentials
Adjustments andEliminations
(Billion yen) Six months endedSeptember 2009
Six months endedSeptember 2010
Increase ordecrease
Percentage ofchange
Forecasts for year endingMarch 2011 (Original
forecasts)
Percentage ofachievement
Operating transactions 8,071.9 9,540.4 1,468.5 18% 18,800.0 51%
Gross profit 510.4 606.1 95.7 19% 1,150.0 53%
Operating income 96.5 197.7 101.2 105% 280.0 71%
Net income 137.4 267.8 130.4 95% 370.0 72%
Core earnings 181.5 337.6 156.1 86% 495.0 68%
Major Year-on-Year P/L Statement Changes
Comparisons With Past Performance (Quarterly Basis)Comparisons With Past Performance (Quarterly Basis)
0.0
50.0
100.0
150.0
200.0
250.0
300.0
350.0
400.0
450.0
08/1Q 08/2Q 08/3Q 08/4Q 09/1Q 09/2Q 09/3Q 09/4Q 10/1Q 10/2Q
(50.0)
0.0
50.0
100.0
150.0
200.0
08/1Q 08/2Q 08/3Q 08/4Q 09/1Q 09/2Q 09/3Q 09/4Q 10/1Q 10/2Q
Gross profit
Core earnings =Operating income (before the deduction of provision for doubtful receivables) + Interest expense-net + Dividend income + Equity in earnings of affiliated companies
(Billion yen)
(Billion yen)Net income
Net income in this presentation shows the amount of net income attributable to Mitsubishi Corporation, excluding noncontrolling interests. Total shareholders’ equity shows the amount of total equity attributable to Mitsubishi Corporation, excluding noncontrolling interests.
(*) Figures for the first six months of the year ended March 2010 have been restated on the basis of the new organization structure, following an internal corporate reorganization in April 2010.
(Billion yen)

2
October 29, 2010Mitsubishi Corporation
(5.5) (0.7)18.5 21.3
19.5 13.2
16.6 27.2
57.1
147.431.8
55.8
(0.6)
3.6
(50.0)
0 .0
50.0
100.0
150.0
200.0
250.0
300.0
Six m onths ended Sept. 2009 (*) Six m onths ended Sept. 2010
Industrial Finance,
Logistics & Development
Energy Business
Metals
Machinery
Chemicals
Living Essentials
Adjustments and
Eliminations
Industrial Finance, Logistics & Development (+4.2 billion yen)Increased due to absence of write-downs of investment securities recorded in the previous fiscal year, higher transaction volumes in distribution-related businesses, and an improvement in lease-related business earnings.
Energy Business (+75%) In addition to gains on the sale of shares, this increase reflected higher gross profit at overseas resource-related subsidiaries and higher equity in earnings of overseas resource-related business investments because of rising oil prices.
Metals (+158%) This increase resulted primarily from gains on a share transfer at a Chilean iron ore-related subsidiary and higher equity-method earnings of related business investees, as well as higher sales volumes and sales prices at an Australian resource-related subsidiary (coking coal).
Machinery (+64%) Increase due to strong results at overseas automobile-related businesses, notably in Asia.
Chemicals (-32%)Decrease reflects absence of gain on reversal of deferred tax liabilities of a petrochemical business-related company in the previous fiscal year, offset in part by higher earnings due to strong transactions at petrochemical business-related companies.
Living Essentials (+15%) Increased due to higher earnings on transactions and equity-method earnings at general merchandise-related businesses, as well as an increase in equity-method earnings at food-related subsidiaries.
Reasons for Changes by Operating SegmentReasons for Changes by Operating Segment
Six months ended Sept. 2009
Six months ended Sept. 2010
Increase or decrease
Crude oil (Dubai) ($/BBL) 63.5 76.0 +12.5
Copper ($/MT) 5,261 7,135 +1,874
Aluminum ($/MT) 1,648 2,093 +445
Resource Prices
267.8
billion yen
137.4
billion yen
Industrial Finance, Logistics & Development
(*) Figures for the first six months of the year ended March 2010 have been restated on the basis of the new organization structure, following an internal corporate reorganization in April 2010.
Year-on-Year Change of Net Income (Loss) by Operating Segment(Billion yen)

3
October 29, 2010Mitsubishi Corporation
2,930.22,955.2
3,551.2
2,961.4
2,383.4
3,067.2
1.01.0
1.5
0.0
1,000.0
2,000.0
3,000.0
4,000.0
March 31, 2009 March 31, 2010 Sept. 30, 20100.0
1.0
2.0
3.0
Interest-bearing liabilities (net) Total shareholders' equityDebt-to-equity ratio (net)
1. Consolidated net income (267.8 billion yen)
2. Payment of dividends (-34.5 billion yen)
3. Decrease in net unrealized gains on securities available for sale (-40.2 billion yen)
・・・decrease in unrealized gains on listed shareholdings due to falling stock prices
4. Deterioration in foreign currency translation adjustments (-98.2 billion yen)
・・・impact of yen’s appreciation against the US dollar, etc.
Main Reasons for Changes in Total Shareholders’ Equity(Compared to March 31, 2010)
Main Reasons for Changes in Total Shareholders’ Equity(Compared to March 31, 2010)
Currency
Ef f ect on f oreigncurrency
translationadjustments
(Estimate, billiony en)
Sept. 30,2010 rate
(Yen)
Jun. 30, 2010rate (Yen)
Mar. 31, 2010rate (Yen)
(Ref .) Dec.31, 2009
rate (Yen)
US$ (40.0) 83.82 88.48 93.04 92.10
AUS$ (30.0) 81.45 75.08 85.28 82.28
Euro (10.0) 114.24 107.81 124.92 132.00
British Pound (5.0) 132.67 133.07 140.40 146.53
Thai Baht (5.0) 2.76 2.72 2.87 2.76
Shareholders’ Equity and Interest-Bearing Liabilities
(X)(Billion yen)
Effect by Currency on Foreign Currency Translation Adjustments

4
October 29, 2010Mitsubishi Corporation
Forecasts for Year Ending March 2011
(7.5) (28.5)
48.0 44.025.0 22.038.0 49.0
185.0220.0
73.0
85.0
8.5
8.5
(50.0)
0.0
50.0
100.0
150.0
200.0
250.0
300.0
350.0
400.0
450.0 Industrial Finance,Logistics & Development
Energy Business
Metals
Machinery
Chemicals
Living Essentials
Adjustments andEliminations
Reasons for Forecast Revisions by Operating SegmentReasons for Forecast Revisions by Operating Segment
Year Ending Mar. 2011(Original Forecasts)
Year Ending Mar. 2011(Revised Forecasts)
Changes in Net Income Forecasts by Operating Segment
Industrial Finance, Logistics & Development (Unchanged)
Energy Business (+12.0 billion yen)Based on gains on share sales, etc.
Metals (+35.0 billion yen) Based on better than initially expected performance in the
coking coal business, etc.
Machinery (+11.0 billion yen)Based on better-than-expected growth in overseas automobile operations and other factors.
Chemicals (-3.0 billion yen)Reflects one-time tax expenses accompanying adoption of the
consolidated tax filing system, etc.
Living Essentials (-4.0 billion yen)Reflects one-time tax expenses accompanying adoption of the
consolidated tax filing system, etc.
(Billion yen)
Forecasts for YearEnding March 2011(Original Forecasts)
(a)
Forecasts for YearEnding March 2011
(Revised Forecasts) (b)
Change FromOriginal
Forecasts(b-a)
Year EndedMarch 2010
(C)
% of ChangeFrom Previous
Fiscal Year(b-c)/(c)
Operatingtransactions 18,800.0 19,000.0 200.0 17,098.7 11%
Gross profit 1,150.0 1,200.0 50.0 1,016.7 18%
Operating income 280.0 335.0 55.0 181.4 85%
Net income 370.0 400.0 30.0 273.1 46%
Core earnings 495.0 575.0 80.0 378.4 52%
(Forward-looking Statements)
Earnings forecasts and other forward-looking statements in this release are management’s current views and beliefs in accordance with data currently available, and are subject to a number of risks, uncertainties and other factors that may cause actual results to differ materially from those projected.
(Billion yen)
5
October 29, 2010Mitsubishi Corporation
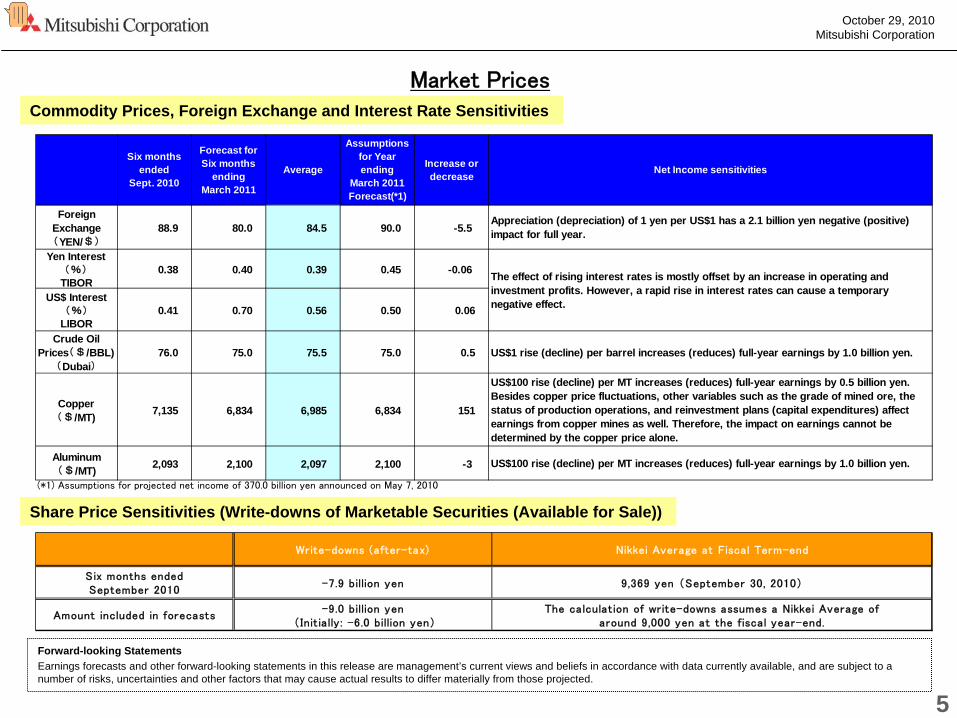
Market Prices
Write-downs (after-tax) Nikkei Average at Fiscal Term-end
Six months endedSeptember 2010
-7.9 billion yen 9,369 yen (September 30, 2010)
Amount included in forecasts-9.0 billion yen
(Init ially : -6.0 billion yen)The calculation of write-downs assumes a Nikkei Average of
around 9,000 yen at the fiscal year-end.
Six monthsended
Sept. 2010
Forecast forSix months
endingMarch 2011
Average
Assumptionsfor Yearending
March 2011Forecast(*1)
Increase ordecrease
ForeignExchange(YEN/$)
88.9 80.0 84.5 90.0 -5.5
Yen Interest(%)
TIBOR0.38 0.40 0.39 0.45 -0.06
US$ Interest(%)
LIBOR0.41 0.70 0.56 0.50 0.06
Crude OilPrices($/BBL)
(Dubai)76.0 75.0 75.5 75.0 0.5
Copper($/MT) 7,135 6,834 6,985 6,834 151
Aluminum($/MT) 2,093 2,100 2,097 2,100 -3
US$100 rise (decline) per MT increases (reduces) full-year earnings by 0.5 billion yen.Besides copper price fluctuations, other variables such as the grade of mined ore, thestatus of production operations, and reinvestment plans (capital expenditures) affectearnings from copper mines as well. Therefore, the impact on earnings cannot bedetermined by the copper price alone.
US$100 rise (decline) per MT increases (reduces) full-year earnings by 1.0 billion yen.
Net Income sensitivities
Appreciation (depreciation) of 1 yen per US$1 has a 2.1 billion yen negative (positive)impact for full year.
The effect of rising interest rates is mostly offset by an increase in operating andinvestment profits. However, a rapid rise in interest rates can cause a temporarynegative effect.
US$1 rise (decline) per barrel increases (reduces) full-year earnings by 1.0 billion yen.
(*1) Assumptions for projected net income of 370.0 billion yen announced on May 7, 2010
Share Price Sensitivities (Write-downs of Marketable Securities (Available for Sale))
Commodity Prices, Foreign Exchange and Interest Rate Sensitivities
Forward-looking StatementsEarnings forecasts and other forward-looking statements in this release are management’s current views and beliefs in accordance with data currently available, and are subject to a number of risks, uncertainties and other factors that may cause actual results to differ materially from those projected.