Embed Size (px)
Citation preview
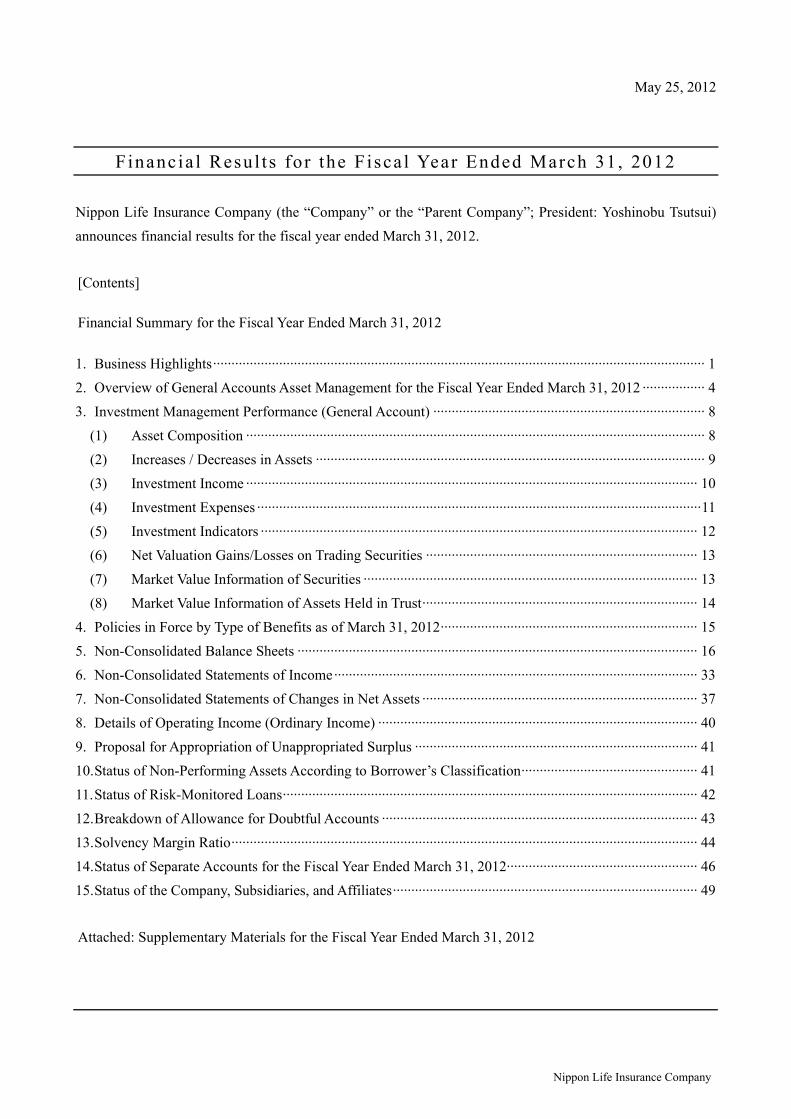
May 25, 2012
F inancia l Resul t s for the Fisca l Year Ended March 31 , 2012
Nippon Life Insurance Company (the “Company” or the “Parent Company”; President: Yoshinobu Tsutsui)
announces financial results for the fiscal year ended March 31, 2012.
[Contents] Financial Summary for the Fiscal Year Ended March 31, 2012
1. ······································································································································ 1 Business Highlights
2. ················· Overview of General Accounts Asset Management for the Fiscal Year Ended March 31, 2012 4
8
8
9
10
11
12
13
13
14
15
16
33
37
40
41
41
42
43
44
46
49
3. ·········································································· Investment Management Performance (General Account)
(1) ····························································································································· Asset Composition
(2) ·········································································································· Increases / Decreases in Assets
(3) ··························································································································· Investment Income
(4) ························································································································· Investment Expenses
(5) ······················································································································· Investment Indicators
(6) ·········································································· Net Valuation Gains/Losses on Trading Securities
(7) ··························································································· Market Value Information of Securities
(8) ··········································································· Market Value Information of Assets Held in Trust
4. ······································································ Policies in Force by Type of Benefits as of March 31, 2012
5. ············································································································· Non-Consolidated Balance Sheets
6. ··································································································· Non-Consolidated Statements of Income
7. ··········································································· Non-Consolidated Statements of Changes in Net Assets
8. ······················································································· Details of Operating Income (Ordinary Income)
9. ············································································· Proposal for Appropriation of Unappropriated Surplus
10. ················································ Status of Non-Performing Assets According to Borrower’s Classification
11. ················································································································· Status of Risk-Monitored Loans
12. ······················································································ Breakdown of Allowance for Doubtful Accounts
13. ······························································································································· Solvency Margin Ratio
14. ···················································· Status of Separate Accounts for the Fiscal Year Ended March 31, 2012
15. ··················································································· Status of the Company, Subsidiaries, and Affiliates
Attached: Supplementary Materials for the Fiscal Year Ended March 31, 2012
Nippon Life Insurance Company
The financial results of the Nippon Life Insurance Company for the fiscal year ended March 31, 2012 will be
submitted to the 65th annual representative policyholders’ meeting for resolution on July 3, 2012. Summaries of
financial results are as follows.
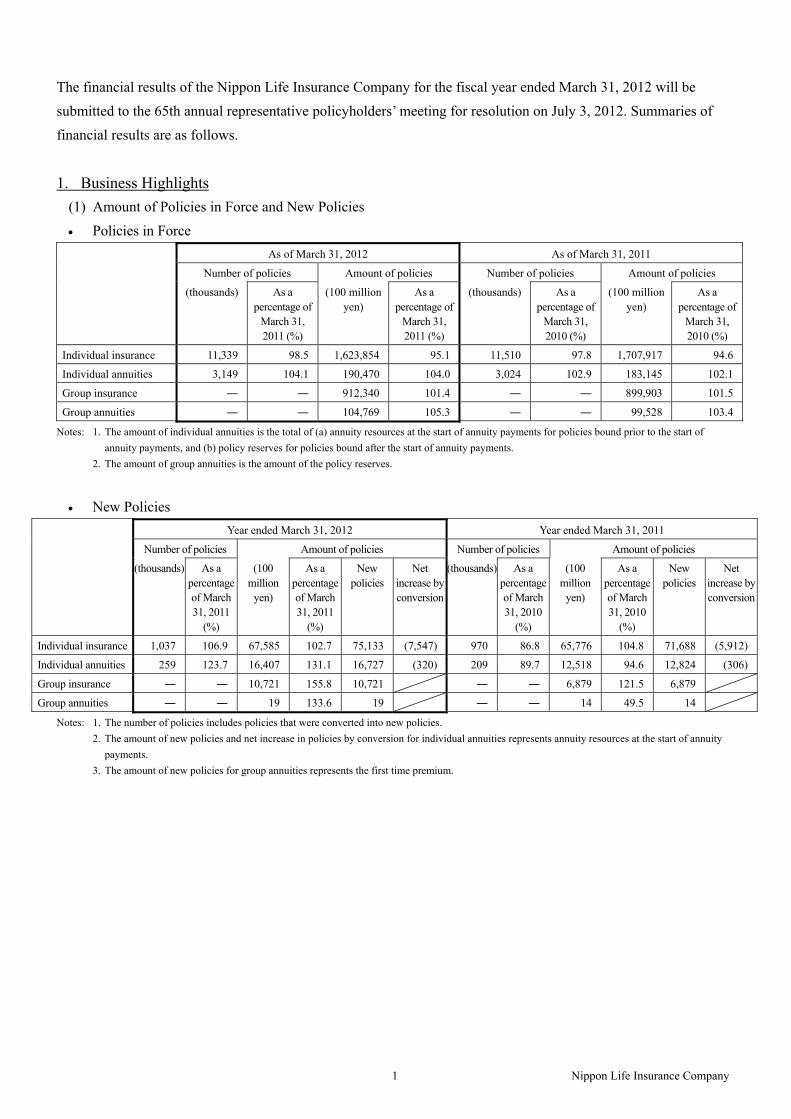
1. Business Highlights
(1) Amount of Policies in Force and New Policies
Policies in Force
As of March 31, 2012 As of March 31, 2011
Number of policies Amount of policies Number of policies Amount of policies
(thousands) As a percentage of
March 31, 2011 (%)
(100 million yen)
As a percentage of
March 31, 2011 (%)
(thousands) As a percentage of
March 31, 2010 (%)
(100 million yen)
As a percentage of
March 31, 2010 (%)
Individual insurance 11,339 98.5 1,623,854 95.1 11,510 97.8 1,707,917 94.6
Individual annuities 3,149 104.1 190,470 104.0 3,024 102.9 183,145 102.1
Group insurance ― ― 912,340 101.4 ― ― 899,903 101.5
Group annuities ― ― 104,769 105.3 ― ― 99,528 103.4
Notes: 1. The amount of individual annuities is the total of (a) annuity resources at the start of annuity payments for policies bound prior to the start of
annuity payments, and (b) policy reserves for policies bound after the start of annuity payments.
2. The amount of group annuities is the amount of the policy reserves.
New Policies
Year ended March 31, 2012 Year ended March 31, 2011
Number of policies Amount of policies Number of policies Amount of policies
(thousands) As a
percentage of March 31, 2011
(%)
(100 million
yen)
As a percentage of March 31, 2011
(%)
New policies
Net increase by conversion
(thousands) As a percentage of March 31, 2010
(%)
(100 million
yen)
As a percentage of March 31, 2010
(%)
New policies
Net increase by conversion
Individual insurance 1,037 106.9 67,585 102.7 75,133 (7,547) 970 86.8 65,776 104.8 71,688 (5,912)
Individual annuities 259 123.7 16,407 131.1 16,727 (320) 209 89.7 12,518 94.6 12,824 (306)
Group insurance ― ― 10,721 155.8 10,721 ― ― 6,879 121.5 6,879
Group annuities ― ― 19 133.6 19 ― ― 14 49.5 14
Notes: 1. The number of policies includes policies that were converted into new policies.
2. The amount of new policies and net increase in policies by conversion for individual annuities represents annuity resources at the start of annuity
payments.
3. The amount of new policies for group annuities represents the first time premium.
1 Nippon Life Insurance Company

(2) Annualized Net Premium
Policies in Force
(100 Million Yen, %)
As of March 31, 2012 As of March 31, 2011 As a percentage of
March 31, 2011 As a percentage of
March 31, 2010
Individual insurance 23,453 99.8 23,507 98.4
Individual annuities 8,204 103.8 7,900 103.4
Total 31,657 100.8 31,408 99.6
Medical coverages, living benefits, etc.
5,900 100.2 5,891 100.6
New Policies
(100 Million Yen, %) Year ended March 31, 2012 Year ended March 31, 2011
As a percentage of March 31, 2011
As a percentage of March 31, 2010
Individual insurance 2,034 115.0 1,768 106.1
Individual annuities 670 121.5 551 67.8
Total 2,704 116.6 2,320 93.6
Medical coverages, living benefits, etc.
364 99.9 365 79.0
Notes: 1. The amount of annualized net premium is the annual premium amount calculated by multiplying factors according to the premium payment method
to a single premium payment amount (for lump-sum payment, the amount is the total premium divided by the insured period).
2. The amount of medical coverages, living benefits, etc. represents annualized premium related to medical benefits (hospitalization benefits and
surgical benefits), living benefits (specified illness benefits and nursing care benefits), and waiver of premium benefits (excluding disability
benefits but including specified illness and nursing care benefits).
3. Annualized new policy net premium includes net increases due to conversions.
(3) Major Profit and Loss Items
(100 Million Yen, %)
Year ended March 31, 2012 Year ended March 31, 2011 As a percentage of
March 31, 2011 As a percentage of
March 31, 2010
Insurance premiums 53,682 109.6 48,964 101.6
Investment income 14,599 94.9 15,383 98.9
Insurance claims and other payments 38,867 101.9 38,130 98.2
Investment expenses 4,144 77.3 5,359 181.0
Operating income 4,815 208.4 2,310 78.7
2 Nippon Life Insurance Company
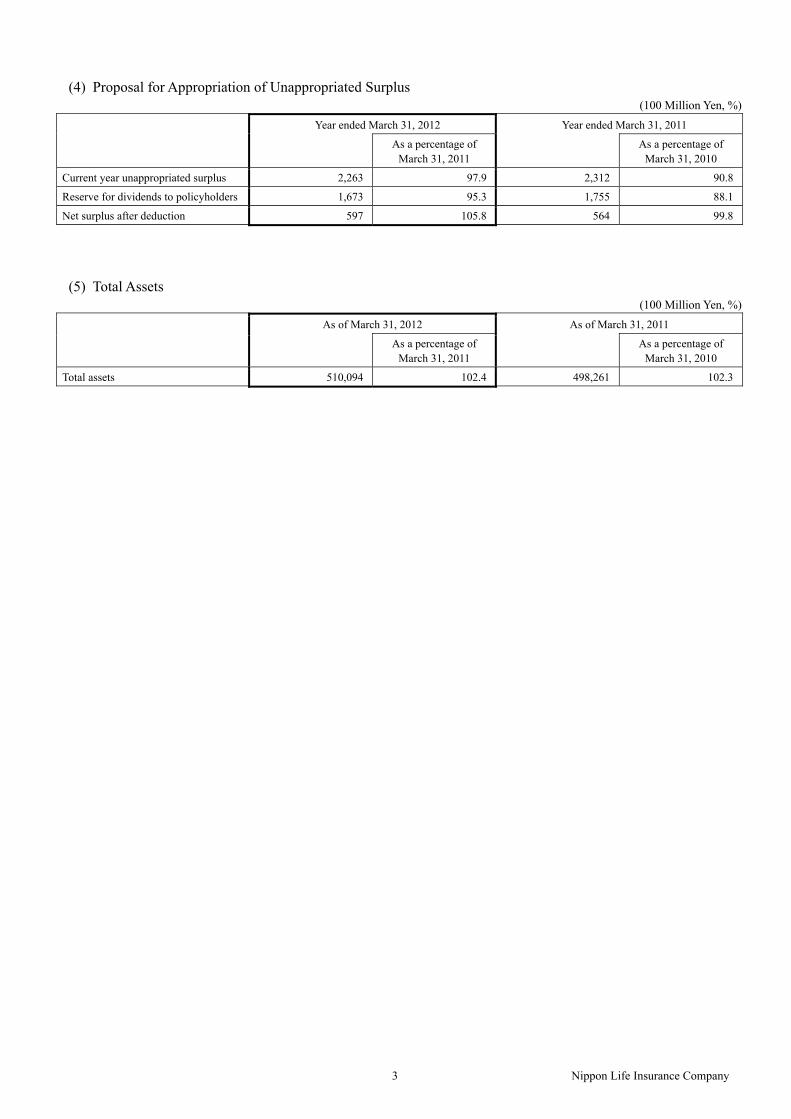
(4) Proposal for Appropriation of Unappropriated Surplus
(100 Million Yen, %)
Year ended March 31, 2012 Year ended March 31, 2011 As a percentage of
March 31, 2011 As a percentage of
March 31, 2010
Current year unappropriated surplus 2,263 97.9 2,312 90.8
Reserve for dividends to policyholders 1,673 95.3 1,755 88.1
Net surplus after deduction 597 105.8 564 99.8
(5) Total Assets
(100 Million Yen, %)
As of March 31, 2012 As of March 31, 2011 As a percentage of
March 31, 2011 As a percentage of
March 31, 2010
Total assets 510,094 102.4 498,261 102.3
3 Nippon Life Insurance Company
2. Overview of General Accounts Asset Management for the Fiscal Year Ended March 31, 2012
(1) Investment Environment
In the fiscal year ended March 31, 2012, although some aspects of the Japanese economy experienced a
slowdown the first half due to the impact of the Great East Japan Earthquake, the economy recovered rapidly
after this on the back of progress made in rebuilding supply chains. Up to the end of the year, a decline in
exports and other factors caused the economy to decelerate. Towards the end of the fiscal year, however,
there was an upturn thanks to the effects of government policies such as eco-car subsidies and demand driven
by reconstruction.
Although there were positive aspects for the Nikkei Stock Average including a recovery to the
¥10,000 level on the back of heightened expectations of a quick recovery from the earthquake, from
the summer onwards, such factors as a recurrence of the sovereign debt problem in the eurozone and
the ongoing appreciation of the yen caused the market to continue to sag, with the Nikkei Stock
Average falling temporarily below the ¥8,500 level. From the turn of the year, the effects of
monetary easing in the eurozone and other areas and expectations of a recovery in the US economy
caused the Nikkei to rebound substantially, bringing it to the ¥10,083 at the end of March.
Having started at 1.25%, the yield rate on 10-year government bonds sagged to 1.03% at the end of
the first half of the fiscal year, primarily because of the worsening of the sovereign debt problem in
the eurozone. Following that, a more hawkish attitude to monetary easing among the Central Banks
of Japan, the US and the eurozone helped cause long-term interest rates to trend flatly, and the yield
rate was 0.99% at the end of March.
In the foreign exchange rate of the yen against the US dollar, the yen appreciated to a record high of
¥75 per the US dollar in October against the background of a decline in expectations of recovery in
the US economy and the debt problem in the eurozone. Despite this, intervention by the government
and the Bank of Japan, in which they bought the US dollars and sold yen, caused a lull in the yen’s
appreciation. In March, the yen depreciated rapidly against the dollar due to such factors as
speculation that Japan’s trade deficit would expand and take root and additional monetary easing by
the Bank of Japan, reaching ¥82.19 per the US dollar at the end of March.
Regarding the foreign exchange rate of the yen against the euro, the yen appreciated from the start of
the fiscal year to the second half of the fiscal year because of concerns that the deepening of the
eurozone debt problem would develop into a financial crisis. Following that, liquidity supply by the
ECB* and agreement regarding additional assistance for Greece helped to depreciate the yen against
the euro, with the exchange rate reaching ¥109.80 per euro at the end of March.
(2) Investment Policy
The Company’s general account assets increased by ¥1,347.9 billion compared to the end of the fiscal year
ended March 31, 2011, totaling ¥49,862.7 billion as of March 31, 2012 (2.8% increase compared to the
* ECB: European Central Bank
4 Nippon Life Insurance Company
previous fiscal year-end).
The Company has positioned yen-denominated assets that can be expected to provide stable income, such as
bonds and loans, as its core asset. From the perspective of improving profits in the mid-to-long term, the
Company invested in assets such as stocks and foreign securities within the scope of acceptable risk while
taking into account business stability.
The Company invested in bonds as sound assets that provide stable interest revenue.
The Company focused on safe and stable prime lendings by accurately assessing credit risks.
For domestic stocks, the Company implemented replacements of issues while focusing the
Company’s attention on the overall state of returns to investors including corporate profitability and
dividends from the point of view of investing for the medium- to long-term.
Regarding foreign securities, the Company invested in foreign-currency-denominated bonds based
on currency movements. Also, the Company increased its balance of foreign bonds that hedge the
risk of exchange rate fluctuations because the difference in domestic and overseas interest rates
remained small with a low level of exchange rate hedge cost.
(3) Status of Investment Income/Expense
Investment income decreased to ¥1,441.2 billion (compared to ¥1,538.3 billion in the fiscal year ended
March 31, 2011). A contributing factor was a decrease in gain on sales of securities, mainly domestic stocks
and foreign securities.
Investment expenses decreased to ¥414.4 billion (compared to ¥501.1 billion in the fiscal year ended March
31, 2011). This was due to factors such as decreases in loss on valuation of securities and loss on sales of
foreign securities.
As a result, the Company’s asset management income and expense balance decreased by ¥10.4 billion
compared to the end of the fiscal year ended March 31, 2011, totaling ¥1,026.8 billion.
(4) Investment Risk Management
Investment risk, which can be categorized into market risk, credit risk, and real estate investment risk, refers
to the risk of losses incurred when the market value of assets and liabilities fluctuate. Because life insurance
is a long-term contract, risk management from a long-term perspective that takes into account liability
characteristics is necessary in asset management. The Company has established an Investment Risk
Management Dept., within its Risk Management Dept., to comprehensively manage investment risk, thereby
thoroughly preparing a system to manage risk and pursue stable returns while keeping losses within an
acceptable range.
a. Market risk management
Market risk refers to the risk of losses incurred when the market value of assets and liabilities fluctuate
due to such factors as fluctuations in interest rates, exchange rates, or stock prices. To manage market
risk, the Company believes it is important to curb excessive losses for each financing and investment
transaction, along with controlling market risk for the Company’s entire portfolio within acceptable
5 Nippon Life Insurance Company
levels.
Establishing maximum holding ceilings
To curb excessive losses on financing and investment transactions, the Company has implemented
maximum holding ceilings based on the nature of the assets and regularly reports to the Risk
Management Committee regarding the status of compliance. The Company has also prepared a
system to control risk to acceptable levels when there is a breach of rules.
Measuring and managing market value-at-risk
To control market risk in the Company’s entire portfolio, the Company uses a statistical analysis
method to rationally calculate market value-at-risk of the portfolio as a whole and conducts
appropriate asset allocation within a range of risk.
b. Credit risk management
Credit risk refers to the risk of incurring losses when the value of assets, primarily loans and bonds,
declines or disappears due to deterioration of the financial condition of the party to whom credit has been
extended. The Company believes that in managing credit risk it is important to examine each transaction
rigorously, set terms appropriate to the level of credit risk involved, and analyze and evaluate accurately
every facet of the risk in the portfolio as a whole.
Managing credit risk in individual transactions
The Company has built systems for rigorous examinations, involving a Credit Dept. independent of
the departments handling financing and investment activities. To build a sound portfolio, the
Company has established interest guidelines to ensure the returns the Company obtains are
commensurate with the risk, a system of internal ratings for classifying the creditworthiness of
borrowers, and credit ceilings to ensure that credit risk is not excessively concentrated in a particular
company or group.
Measuring and managing credit value-at-risk
The Company calculates credit value-at-risk as a measurement of the magnitude of credit risk across
the Company’s portfolio as a whole and monitors whether the magnitude of risk stays within an
appropriate range.
c. Real estate investment risk management
Real estate investment risk refers to the risk of reduced returns caused by factors such as rent fluctuations
as well as losses when real estate values decline due to market deterioration. The Company’s approach to
managing real estate investment risk involves rigorous examination of each investment by a Credit Dept.
independent of the department actually handling the investment and finance activities. The Company has
also developed a system involving warning levels for investment returns and price levels, which enables
us to focus on specific properties whose profitability is suffering.
6 Nippon Life Insurance Company
(5) ALM
For life insurance companies to carry out stable management in the long term, it is important to use the ALM
(Asset/Liability Management) approach as a basis for understanding the situation of liabilities that pay future
insurance benefits (policy reserves) and investment assets, as well as for adjusting investment periods. The
Company analyzes and evaluates 1) liability cash flows, 2) risk of falling short of assumed interest rates, and
3) level of allowed risk for each product, and decides the medium-to-long-term investment plan at the
Managing Directors Meetings and the Risk Management Committee Meetings.
(6) Self-Assessment and Allowance for Doubtful Accounts
Asset self-assessment refers to evaluating individual assets based on the financial condition of each borrower
and its collateral. Assets are classified into four categories (Non-categorized, II, III IV).
To ensure the objectivity of the self-assessment process, the Company has established a highly reliable
framework that includes:
Strict assessment standards based on the Inspection Manual for Insurance Companies of the
Financial Services Agency
Internal audit by the Auditing Dept. independent from the groups handling the actual assessment
External audit by external auditors (certified public accountants)
In the fiscal year ended March 31, 2012, the Company recorded an appropriate allowance for doubtful
accounts according to the same allowance standards as the previous fiscal year.
Allowance for doubtful accounts standard:
Allowance for “Non-categorized” borrowers is provided under the general allowance for doubtful accounts
mainly based on actual loan losses in the previous fiscal year.
Allowance for “On caution” borrowers is provided under the general allowance for doubtful accounts mainly
based on the accumulated actual loan loss ratio (ratio of losses incurred from loans within three years from a
certain date) for the previous three fiscal years.
Regarding corporate loans to “Substandard” borrowers, the Company distinguishes between the portion that
is not secured by collateral, guarantees, or others and calculates the actual loan loss ratio.
Regarding the allowance for “Doubtful,” “Quasi-Bankrupt,” and ”Bankrupt” borrowers, the necessary
amount, concerning the balance calculated by subtracting estimated collectable amounts based on collateral
and guarantees from total loans, is provided as specific allowance for doubtful accounts. The portion for the
amount in “Category IV” is directly deducted from the total loan amount.
7 Nippon Life Insurance Company
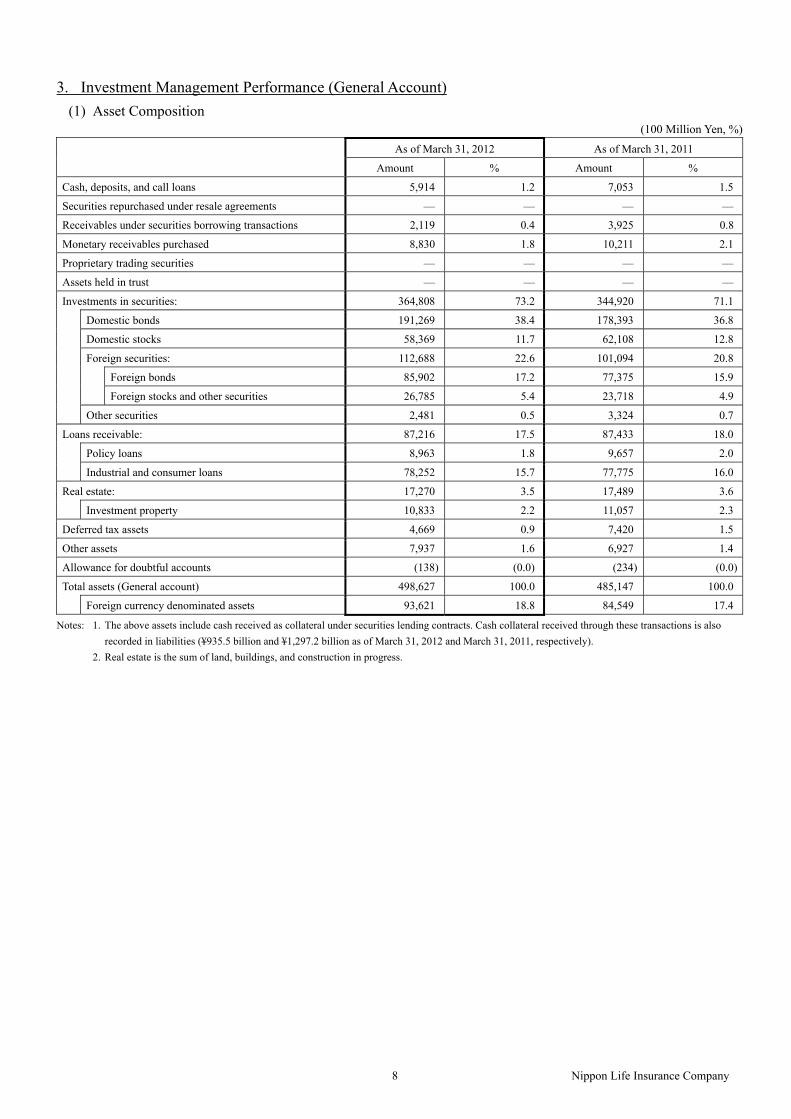
3. Investment Management Performance (General Account)
(1) Asset Composition (100 Million Yen, %)
As of March 31, 2012 As of March 31, 2011
Amount % Amount %
Cash, deposits, and call loans 5,914 1.2 7,053 1.5
Securities repurchased under resale agreements –– –– –– ––
Receivables under securities borrowing transactions 2,119 0.4 3,925 0.8
Monetary receivables purchased 8,830 1.8 10,211 2.1
Proprietary trading securities –– –– –– ––
Assets held in trust –– –– –– ––
Investments in securities: 364,808 73.2 344,920 71.1
Domestic bonds 191,269 38.4 178,393 36.8
Domestic stocks 58,369 11.7 62,108 12.8
Foreign securities: 112,688 22.6 101,094 20.8
Foreign bonds 85,902 17.2 77,375 15.9
Foreign stocks and other securities 26,785 5.4 23,718 4.9
Other securities 2,481 0.5 3,324 0.7
Loans receivable: 87,216 17.5 87,433 18.0
Policy loans 8,963 1.8 9,657 2.0
Industrial and consumer loans 78,252 15.7 77,775 16.0
Real estate: 17,270 3.5 17,489 3.6
Investment property 10,833 2.2 11,057 2.3
Deferred tax assets 4,669 0.9 7,420 1.5
Other assets 7,937 1.6 6,927 1.4
Allowance for doubtful accounts (138) (0.0) (234) (0.0)
Total assets (General account) 498,627 100.0 485,147 100.0
Foreign currency denominated assets 93,621 18.8 84,549 17.4
Notes: 1. The above assets include cash received as collateral under securities lending contracts. Cash collateral received through these transactions is also
recorded in liabilities (¥935.5 billion and ¥1,297.2 billion as of March 31, 2012 and March 31, 2011, respectively).
2. Real estate is the sum of land, buildings, and construction in progress.
8 Nippon Life Insurance Company
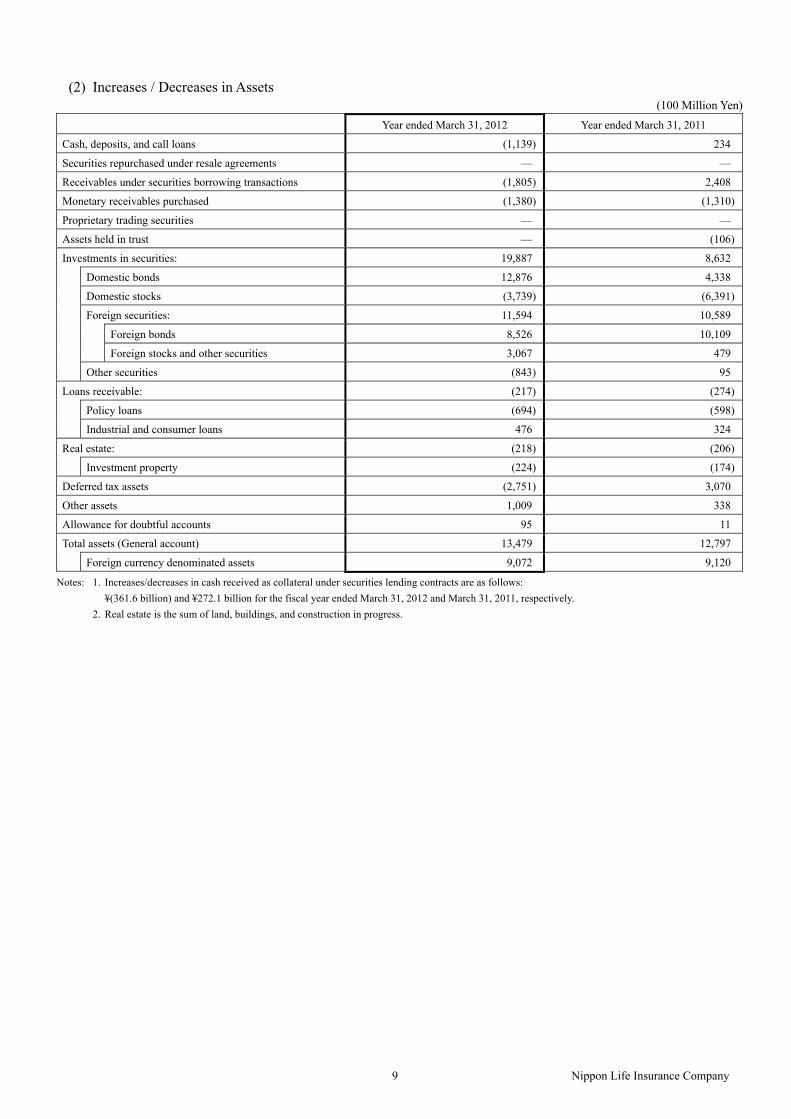
(2) Increases / Decreases in Assets (100 Million Yen)
Year ended March 31, 2012 Year ended March 31, 2011
Cash, deposits, and call loans (1,139) 234
Securities repurchased under resale agreements –– ––
Receivables under securities borrowing transactions (1,805) 2,408
Monetary receivables purchased (1,380) (1,310)
Proprietary trading securities –– ––
Assets held in trust –– (106)
Investments in securities: 19,887 8,632
Domestic bonds 12,876 4,338
Domestic stocks (3,739) (6,391)
Foreign securities: 11,594 10,589
Foreign bonds 8,526 10,109
Foreign stocks and other securities 3,067 479
Other securities (843) 95
Loans receivable: (217) (274)
Policy loans (694) (598)
Industrial and consumer loans 476 324
Real estate: (218) (206)
Investment property (224) (174)
Deferred tax assets (2,751) 3,070
Other assets 1,009 338
Allowance for doubtful accounts 95 11
Total assets (General account) 13,479 12,797
Foreign currency denominated assets 9,072 9,120
Notes: 1. Increases/decreases in cash received as collateral under securities lending contracts are as follows:
¥(361.6 billion) and ¥272.1 billion for the fiscal year ended March 31, 2012 and March 31, 2011, respectively.
2. Real estate is the sum of land, buildings, and construction in progress.
9 Nippon Life Insurance Company
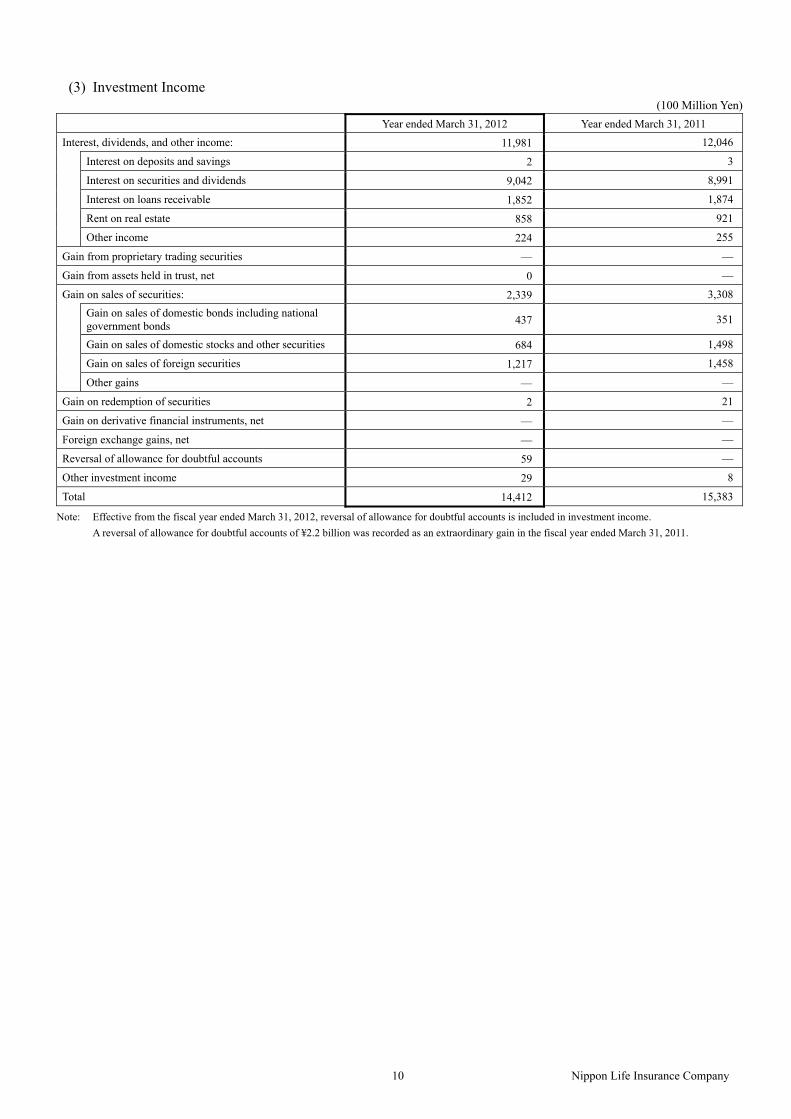
(3) Investment Income (100 Million Yen)
Year ended March 31, 2012 Year ended March 31, 2011
Interest, dividends, and other income: 11,981 12,046
Interest on deposits and savings 2 3
Interest on securities and dividends 9,042 8,991
Interest on loans receivable 1,852 1,874
Rent on real estate 858 921
Other income 224 255
Gain from proprietary trading securities –– ––
Gain from assets held in trust, net 0 ––
Gain on sales of securities: 2,339 3,308
Gain on sales of domestic bonds including national government bonds 437 351
Gain on sales of domestic stocks and other securities 684 1,498
Gain on sales of foreign securities 1,217 1,458
Other gains –– ––
Gain on redemption of securities 2 21
Gain on derivative financial instruments, net –– ––
Foreign exchange gains, net –– ––
Reversal of allowance for doubtful accounts 59 ––
Other investment income 29 8
Total 14,412 15,383
Note: Effective from the fiscal year ended March 31, 2012, reversal of allowance for doubtful accounts is included in investment income.
A reversal of allowance for doubtful accounts of ¥2.2 billion was recorded as an extraordinary gain in the fiscal year ended March 31, 2011.
10 Nippon Life Insurance Company
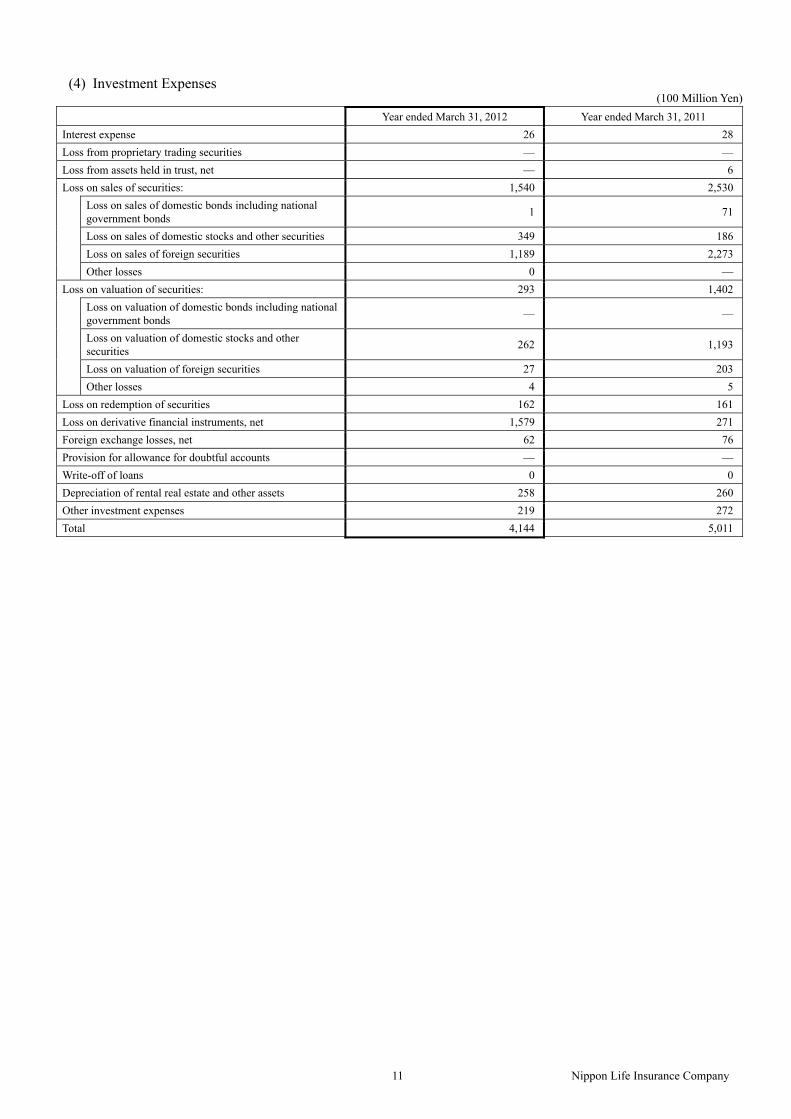
(4) Investment Expenses (100 Million Yen)
Year ended March 31, 2012 Year ended March 31, 2011
Interest expense 26 28
Loss from proprietary trading securities –– ––
Loss from assets held in trust, net –– 6
Loss on sales of securities: 1,540 2,530
Loss on sales of domestic bonds including national government bonds
1 71
Loss on sales of domestic stocks and other securities 349 186
Loss on sales of foreign securities 1,189 2,273
Other losses 0 ––
Loss on valuation of securities: 293 1,402
Loss on valuation of domestic bonds including national government bonds
–– ––
Loss on valuation of domestic stocks and other securities
262 1,193
Loss on valuation of foreign securities 27 203
Other losses 4 5
Loss on redemption of securities 162 161
Loss on derivative financial instruments, net 1,579 271
Foreign exchange losses, net 62 76
Provision for allowance for doubtful accounts –– ––
Write-off of loans 0 0
Depreciation of rental real estate and other assets 258 260
Other investment expenses 219 272
Total 4,144 5,011
11 Nippon Life Insurance Company
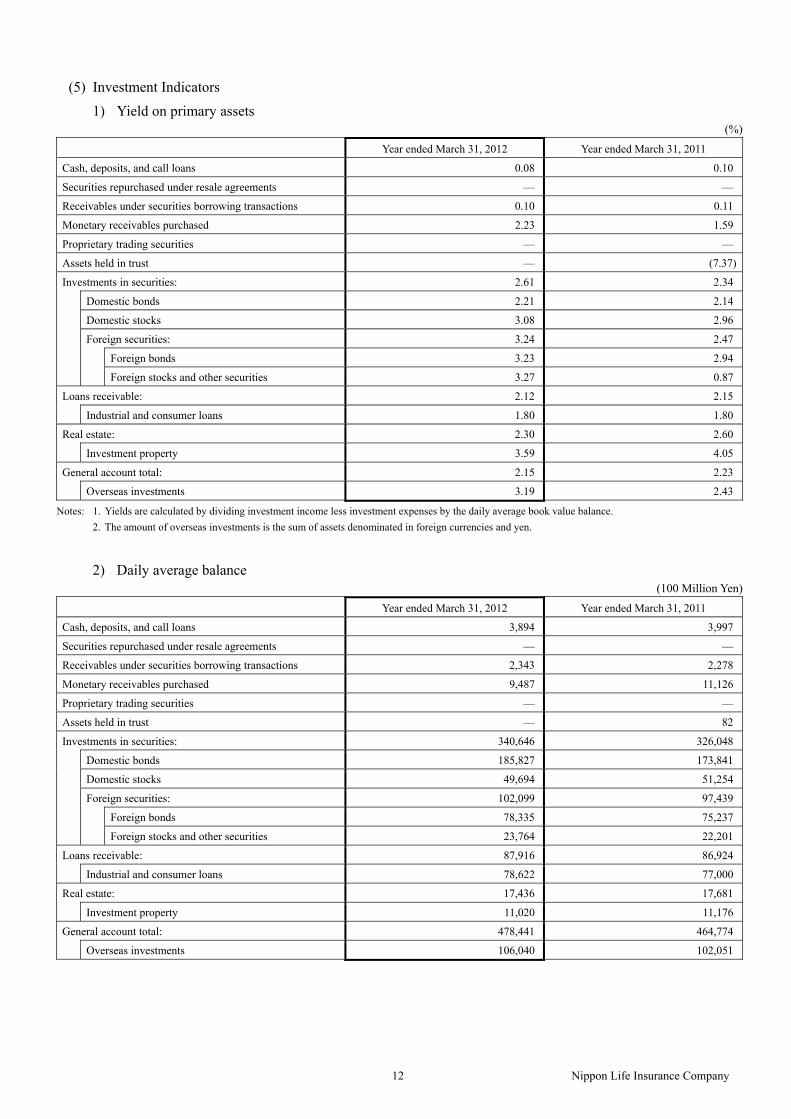
(5) Investment Indicators
1) Yield on primary assets (%)
Year ended March 31, 2012 Year ended March 31, 2011
Cash, deposits, and call loans 0.08 0.10
Securities repurchased under resale agreements –– ––
Receivables under securities borrowing transactions 0.10 0.11
Monetary receivables purchased 2.23 1.59
Proprietary trading securities –– ––
Assets held in trust –– (7.37)
Investments in securities: 2.61 2.34
Domestic bonds 2.21 2.14
Domestic stocks 3.08 2.96
Foreign securities: 3.24 2.47
Foreign bonds 3.23 2.94
Foreign stocks and other securities 3.27 0.87
Loans receivable: 2.12 2.15
Industrial and consumer loans 1.80 1.80
Real estate: 2.30 2.60
Investment property 3.59 4.05
General account total: 2.15 2.23
Overseas investments 3.19 2.43
Notes: 1. Yields are calculated by dividing investment income less investment expenses by the daily average book value balance.
2. The amount of overseas investments is the sum of assets denominated in foreign currencies and yen.
2) Daily average balance (100 Million Yen)
Year ended March 31, 2012 Year ended March 31, 2011
Cash, deposits, and call loans 3,894 3,997
Securities repurchased under resale agreements –– ––
Receivables under securities borrowing transactions 2,343 2,278
Monetary receivables purchased 9,487 11,126
Proprietary trading securities –– ––
Assets held in trust –– 82
Investments in securities: 340,646 326,048
Domestic bonds 185,827 173,841
Domestic stocks 49,694 51,254
Foreign securities: 102,099 97,439
Foreign bonds 78,335 75,237
Foreign stocks and other securities 23,764 22,201
Loans receivable: 87,916 86,924
Industrial and consumer loans 78,622 77,000
Real estate: 17,436 17,681
Investment property 11,020 11,176
General account total: 478,441 464,774
Overseas investments 106,040 102,051
12 Nippon Life Insurance Company
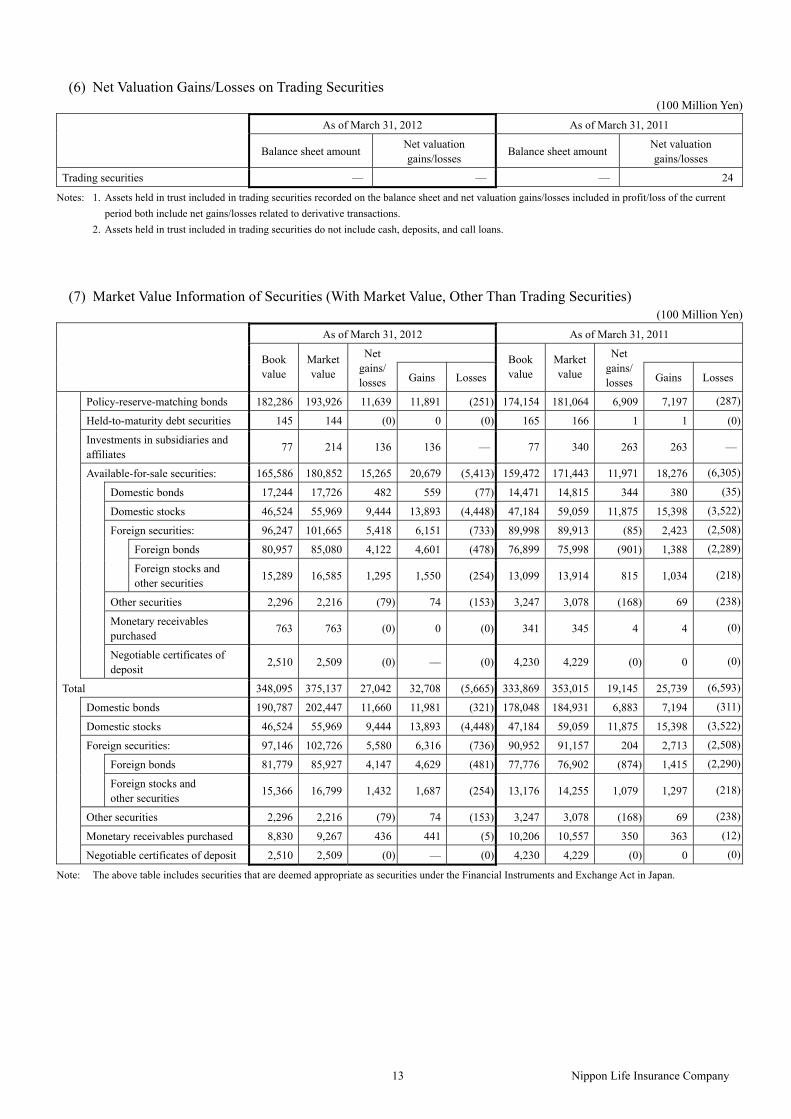
(6) Net Valuation Gains/Losses on Trading Securities (100 Million Yen)
As of March 31, 2012 As of March 31, 2011
Balance sheet amount Net valuation gains/losses
Balance sheet amount Net valuation gains/losses
Trading securities –– –– –– 24
Notes: 1. Assets held in trust included in trading securities recorded on the balance sheet and net valuation gains/losses included in profit/loss of the current
period both include net gains/losses related to derivative transactions.
2. Assets held in trust included in trading securities do not include cash, deposits, and call loans.
(7) Market Value Information of Securities (With Market Value, Other Than Trading Securities) (100 Million Yen)
As of March 31, 2012 As of March 31, 2011
Book value
Market value
Net gains/losses
Book value
Market value
Net gains/ losses GainsGains Losses Losses
Policy-reserve-matching bonds 182,286 193,926 11,639 11,891 (251) 174,154 181,064 6,909 7,197 (287)
Held-to-maturity debt securities 145 144 (0) 0 (0) 165 166 1 1 (0)
Investments in subsidiaries and affiliates
77 214 136 136 –– 77 340 263 263 ––
Available-for-sale securities: 165,586 180,852 15,265 20,679 (5,413) 159,472 171,443 11,971 18,276 (6,305)
Domestic bonds 17,244 17,726 482 559 (77) 14,471 14,815 344 380 (35)
Domestic stocks 46,524 55,969 9,444 13,893 (4,448) 47,184 59,059 11,875 15,398 (3,522)
Foreign securities: 96,247 101,665 5,418 6,151 (733) 89,998 89,913 (85) 2,423 (2,508)
Foreign bonds 80,957 85,080 4,122 4,601 (478) 76,899 75,998 (901) 1,388 (2,289)
Foreign stocks and other securities
15,289 16,585 1,295 1,550 (254) 13,099 13,914 815 1,034 (218)
Other securities 2,296 2,216 (79) 74 (153) 3,247 3,078 (168) 69 (238)
Monetary receivables purchased
763 763 (0) 0 (0) 341 345 4 4 (0)
Negotiable certificates of deposit
2,510 2,509 (0) –– (0) 4,230 4,229 (0) 0 (0)
Total 348,095 375,137 27,042 32,708 (5,665) 333,869 353,015 19,145 25,739 (6,593)
Domestic bonds 190,787 202,447 11,660 11,981 (321) 178,048 184,931 6,883 7,194 (311)
Domestic stocks 46,524 55,969 9,444 13,893 (4,448) 47,184 59,059 11,875 15,398 (3,522)
Foreign securities: 97,146 102,726 5,580 6,316 (736) 90,952 91,157 204 2,713 (2,508)
Foreign bonds 81,779 85,927 4,147 4,629 (481) 77,776 76,902 (874) 1,415 (2,290)
Foreign stocks and other securities
15,366 16,799 1,432 1,687 (254) 13,176 14,255 1,079 1,297 (218)
Other securities 2,296 2,216 (79) 74 (153) 3,247 3,078 (168) 69 (238)
Monetary receivables purchased 8,830 9,267 436 441 (5) 10,206 10,557 350 363 (12)
Negotiable certificates of deposit 2,510 2,509 (0) –– (0) 4,230 4,229 (0) 0 (0)
Note: The above table includes securities that are deemed appropriate as securities under the Financial Instruments and Exchange Act in Japan.
13 Nippon Life Insurance Company
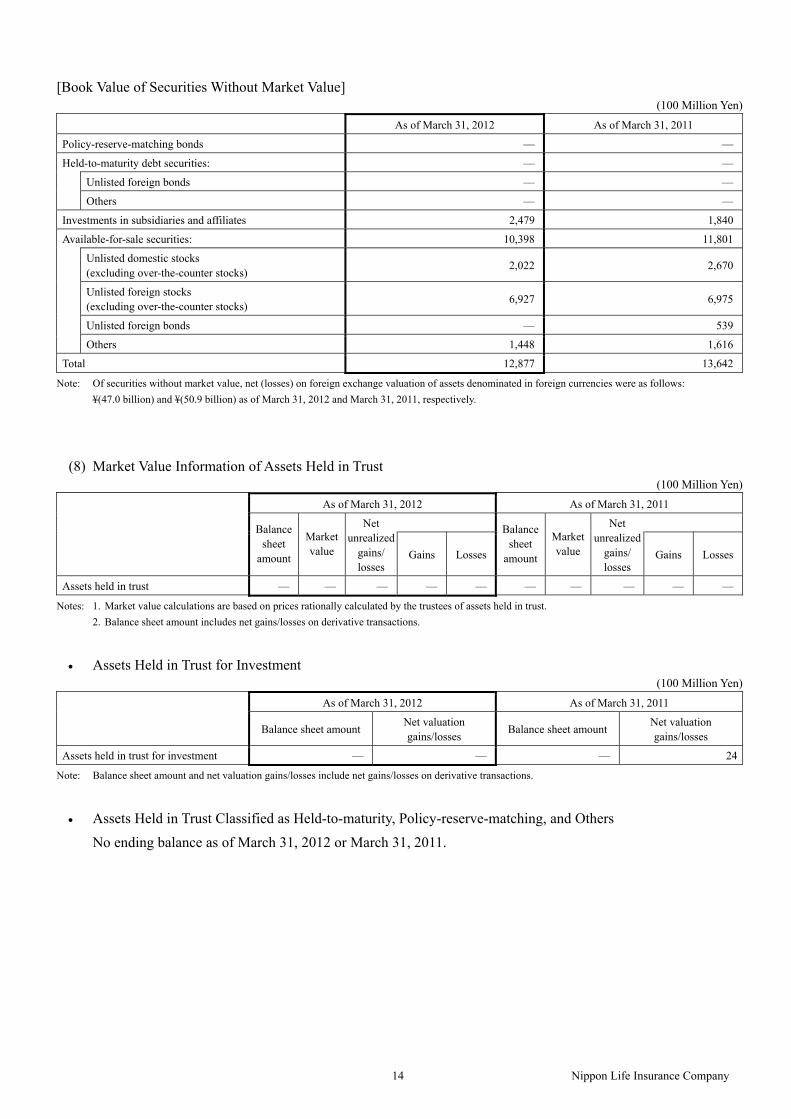
[Book Value of Securities Without Market Value] (100 Million Yen)
As of March 31, 2012 As of March 31, 2011
Policy-reserve-matching bonds –– ––
Held-to-maturity debt securities: –– ––
Unlisted foreign bonds –– ––
Others –– ––
Investments in subsidiaries and affiliates 2,479 1,840
Available-for-sale securities: 10,398 11,801
Unlisted domestic stocks (excluding over-the-counter stocks)
2,022 2,670
Unlisted foreign stocks (excluding over-the-counter stocks)
6,927 6,975
Unlisted foreign bonds –– 539
Others 1,448 1,616
Total 12,877 13,642
Note: Of securities without market value, net (losses) on foreign exchange valuation of assets denominated in foreign currencies were as follows:
¥(47.0 billion) and ¥(50.9 billion) as of March 31, 2012 and March 31, 2011, respectively.
(8) Market Value Information of Assets Held in Trust (100 Million Yen)
As of March 31, 2012 As of March 31, 2011
Balance
sheet amount
Marketvalue
Net unrealized
gains/ losses
Gains Losses
Balance sheet
amount
Market value
Net unrealized
gains/ losses
Gains Losses
Assets held in trust –– –– –– –– –– –– –– –– –– ––
Notes: 1. Market value calculations are based on prices rationally calculated by the trustees of assets held in trust.
2. Balance sheet amount includes net gains/losses on derivative transactions.
Assets Held in Trust for Investment (100 Million Yen)
As of March 31, 2012 As of March 31, 2011
Balance sheet amount Net valuation gains/losses
Balance sheet amount Net valuation gains/losses
Assets held in trust for investment –– –– –– 24
Note: Balance sheet amount and net valuation gains/losses include net gains/losses on derivative transactions.
Assets Held in Trust Classified as Held-to-maturity, Policy-reserve-matching, and Others
No ending balance as of March 31, 2012 or March 31, 2011.
14 Nippon Life Insurance Company

4. Policies in Force by Type of Benefits as of March 31, 2012
Individual insurance Individual annuities Group insurance Total
Number of policies
(thousands)
Amount (100 million
yen)
Number of policies
(thousands)
Amount (100 million
yen)
Number of policies
(thousands)
Amount (100 million
yen)
Number of policies
(thousands)
Amount (100 million
yen)
General 11,337 1,623,810 –– –– 26,775 912,183 38,113 2,535,994
Disaster 5,812 301,854 263 3,101 3,103 36,173 9,179 341,129Death protection
Others 250 3,081 –– –– 77 1,206 328 4,288
Pure endowment 1 43 3,149 190,470 11 156 3,162 190,670
Disaster 7,501 478 341 15 1,606 17 9,449 510
Illness 7,476 475 338 15 –– –– 7,814 490Hospitalization coverage
Others 8,680 571 83 3 64 0 8,828 575
Disability coverage 7,012 –– 83 –– 2,877 –– 9,973 ––
Surgical coverage 11,572 –– 338 –– –– –– 11,910 ––
Group annuities Workers’ asset-formation
insurance/annuities Total
Number of policies
(thousands)
Amount (100 million yen)
Number of policies
(thousands)
Amount (100 million yen)
Number of policies
(thousands)
Amount (100 million yen)
Pure endowment 13,568 104,769 214 4,622 13,782 109,391
Medical care insurance Disability income insurance
Number of policies
(thousands)
Amount (100 million yen)
Number of policies
(thousands)
Amount (100 million yen)
Hospitalization coverage 904 31 Disability income coverage 94 131
Notes: 1. The number of policies for “Group insurance,” “Group annuities,” “Workers asset-formation insurance/annuities,” “Medical care insurance” (group
type), and “Disability income insurance” represents the number of insureds.
2. The amount in “Pure endowment” for “Individual annuities,” “Group insurance” (annuity riders), and “Workers’ asset-formation annuities”
(excluding workers’ asset-formation savings annuities) represents the total of (a) annuity resources at the start of the annuities for policies bound
prior to the start of the annuity payments, and (b) policy reserves for policies bound after the start of the annuity payments. The amount in “Pure
endowment” for “Group annuities,” “Workers’ asset-formation insurance,” and workers’ asset-formation savings annuities represents the amount of
corresponding policy reserves.
3. The amount in “Hospitalization coverage” represents the amount of daily hospitalization benefits.
4. The amount in “Hospitalization coverage” of medical care insurance represents the amount related to hospitalization from illness.
5. The amount in disability income insurance represents the amount of monthly disability benefit payments.
6. The number of insureds and amount of policies for reinsurance written were 16 thousand people and ¥18.8 billion, respectively.
15 Nippon Life Insurance Company
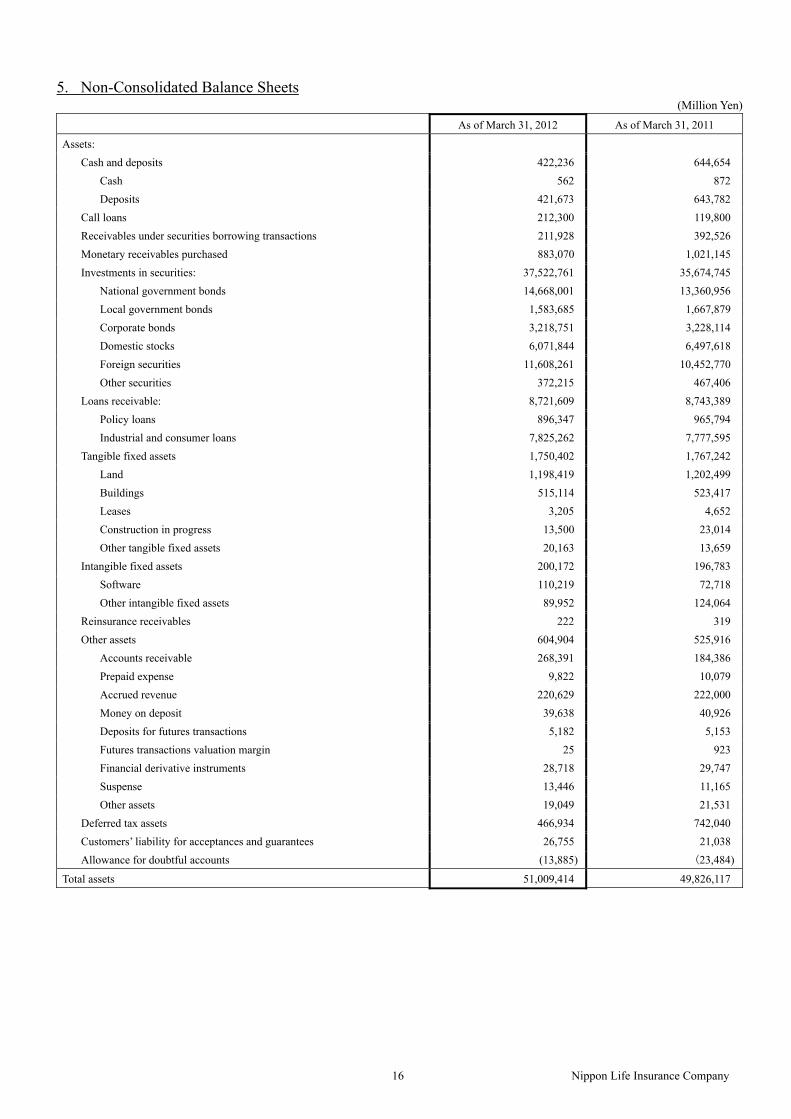
5. Non-Consolidated Balance Sheets (Million Yen)
As of March 31, 2012 As of March 31, 2011
Assets:
Cash and deposits 422,236 644,654
Cash 562 872
Deposits 421,673 643,782
Call loans 212,300 119,800
Receivables under securities borrowing transactions 211,928 392,526
Monetary receivables purchased 883,070 1,021,145
Investments in securities: 37,522,761 35,674,745
National government bonds 14,668,001 13,360,956
Local government bonds 1,583,685 1,667,879
Corporate bonds 3,218,751 3,228,114
Domestic stocks 6,071,844 6,497,618
Foreign securities 11,608,261 10,452,770
Other securities 372,215 467,406
Loans receivable: 8,721,609 8,743,389
Policy loans 896,347 965,794
Industrial and consumer loans 7,825,262 7,777,595
Tangible fixed assets 1,750,402 1,767,242
Land 1,198,419 1,202,499
Buildings 515,114 523,417
Leases 3,205 4,652
Construction in progress 13,500 23,014
Other tangible fixed assets 20,163 13,659
Intangible fixed assets 200,172 196,783
Software 110,219 72,718
Other intangible fixed assets 89,952 124,064
Reinsurance receivables 222 319
Other assets 604,904 525,916
Accounts receivable 268,391 184,386
Prepaid expense 9,822 10,079
Accrued revenue 220,629 222,000
Money on deposit 39,638 40,926
Deposits for futures transactions 5,182 5,153
Futures transactions valuation margin 25 923
Financial derivative instruments 28,718 29,747
Suspense 13,446 11,165
Other assets 19,049 21,531
Deferred tax assets 466,934 742,040
Customers’ liability for acceptances and guarantees 26,755 21,038
Allowance for doubtful accounts (13,885) (23,484)
Total assets 51,009,414 49,826,117
16 Nippon Life Insurance Company
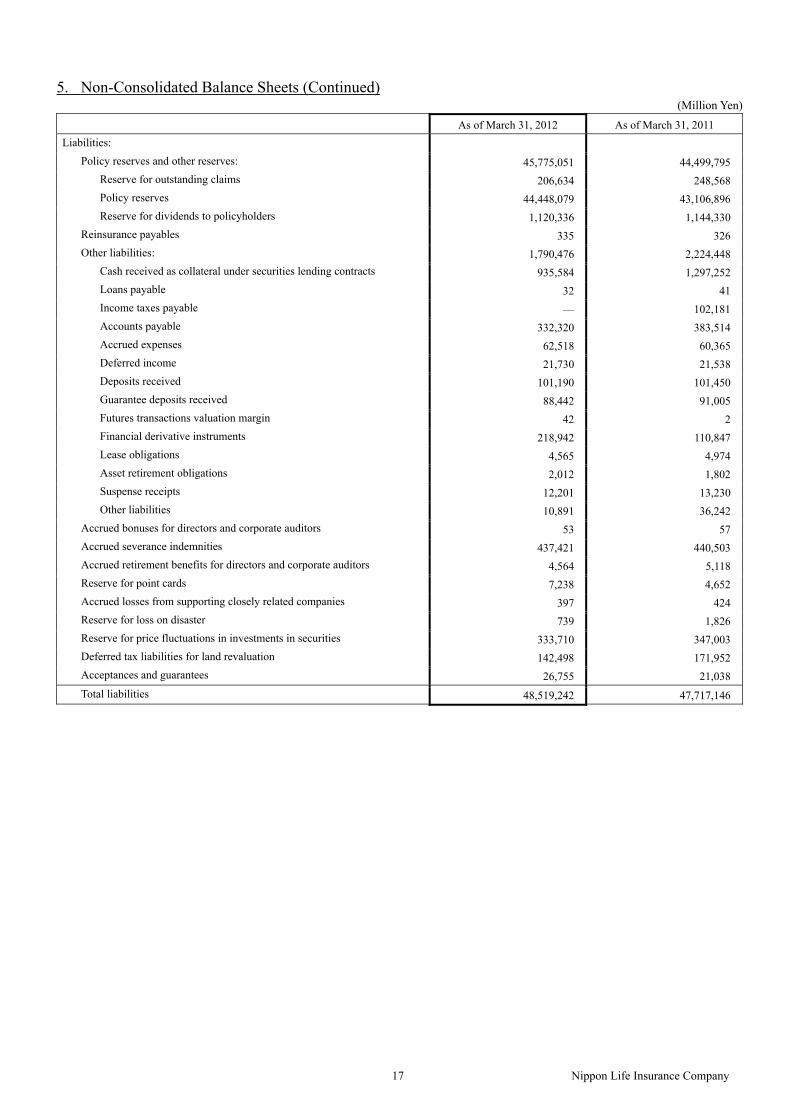
5. Non-Consolidated Balance Sheets (Continued) (Million Yen)
As of March 31, 2012 As of March 31, 2011
Liabilities:
Policy reserves and other reserves: 45,775,051 44,499,795
Reserve for outstanding claims 206,634 248,568
Policy reserves 44,448,079 43,106,896
Reserve for dividends to policyholders 1,120,336 1,144,330
Reinsurance payables 335 326
Other liabilities: 1,790,476 2,224,448
Cash received as collateral under securities lending contracts 935,584 1,297,252
Loans payable 32 41
Income taxes payable –– 102,181
Accounts payable 332,320 383,514
Accrued expenses 62,518 60,365
Deferred income 21,730 21,538
Deposits received 101,190 101,450
Guarantee deposits received 88,442 91,005
Futures transactions valuation margin 42 2
Financial derivative instruments 218,942 110,847
Lease obligations 4,565 4,974
Asset retirement obligations 2,012 1,802
Suspense receipts 12,201 13,230
Other liabilities 10,891 36,242
Accrued bonuses for directors and corporate auditors 53 57
Accrued severance indemnities 437,421 440,503
Accrued retirement benefits for directors and corporate auditors 4,564 5,118
Reserve for point cards 7,238 4,652
Accrued losses from supporting closely related companies 397 424
Reserve for loss on disaster 739 1,826
Reserve for price fluctuations in investments in securities 333,710 347,003
Deferred tax liabilities for land revaluation 142,498 171,952
Acceptances and guarantees 26,755 21,038
Total liabilities 48,519,242 47,717,146
17 Nippon Life Insurance Company
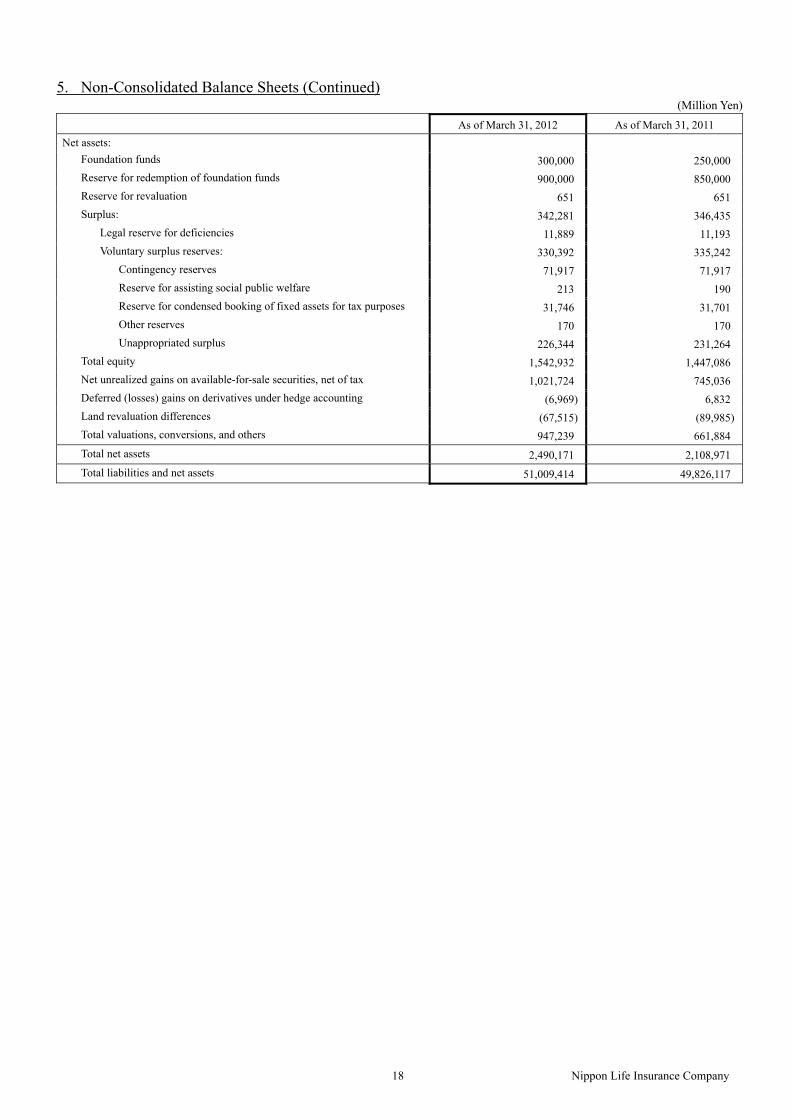
5. Non-Consolidated Balance Sheets (Continued) (Million Yen)
As of March 31, 2012 As of March 31, 2011
Net assets:
Foundation funds 300,000 250,000
Reserve for redemption of foundation funds 900,000 850,000
Reserve for revaluation 651 651
Surplus: 342,281 346,435
Legal reserve for deficiencies 11,889 11,193
Voluntary surplus reserves: 330,392 335,242
Contingency reserves 71,917 71,917
Reserve for assisting social public welfare 213 190
Reserve for condensed booking of fixed assets for tax purposes 31,746 31,701
Other reserves 170 170
Unappropriated surplus 226,344 231,264
Total equity 1,542,932 1,447,086
Net unrealized gains on available-for-sale securities, net of tax 1,021,724 745,036
Deferred (losses) gains on derivatives under hedge accounting (6,969) 6,832
Land revaluation differences (67,515) (89,985)
Total valuations, conversions, and others 947,239 661,884
Total net assets 2,490,171 2,108,971
Total liabilities and net assets 51,009,414 49,826,117
18 Nippon Life Insurance Company
Basis of Presenting the Non-Consolidated Balance Sheet as of March 31, 2012
1. Securities (including items such as deposits and monetary receivables purchased treated as securities based on
the “Accounting Standards for Financial Instruments” (ASBJ* Statement No. 10) and securities within assets
held in trust) are valued as follows:
(1) Trading securities are stated at market value on the balance sheet date. Moving average method is used
for calculating cost of sales.
(2) Held-to-maturity debt securities are valued using the moving average method, net of accumulated
amortization (straight-line).
(3) Policy-reserve-matching bonds are valued using the moving average method, net of accumulated
amortization (straight-line) in accordance with the Industry Audit Committee Report No. 21, “Temporary
Treatment of Accounting and Auditing Concerning Policy-Reserve-Matching Bonds in the Insurance
Industry,” issued by the JICPA**.
(4) Investments in subsidiaries and affiliates (stocks issued by subsidiaries prescribed in Article 2, Paragraph
12 of the Insurance Business Act excluding subsidiaries prescribed in Article 13-5-2, Paragraph 3 of the
Order for Enforcement of the Insurance Business Act and stocks issued by affiliates prescribed in Article
13-5-2, Paragraph 4 of the Order for Enforcement of the Insurance Business Act) are valued using the
moving average method.
(5) Available-for-sale securities
1) For securities with a market value, stocks (including foreign stocks) are valued by using the
average market value during the period of one month before the balance sheet date (cost of sales is
calculated by using the moving average method). Other securities with a market value are valued
by using the market value on the balance sheet date (cost of sales is calculated by using the moving
average method).
2) For securities of which the market value is extremely difficult to determine, public and corporate
bonds (including foreign bonds) for which the difference between the purchase price and face
value is due to interest rate adjustment are valued using the moving average method, net of
accumulated amortization (straight-line). The others are valued at the gross moving average
amount.
Adjustments to market value, net of applicable taxes, are recorded in a separate component of net assets.
* ASBJ: The Accounting Standards Board of Japan ** JICPA: Japanese Institute of Certified Public Accountants
19 Nippon Life Insurance Company

2. Securities that are held for the purpose of matching the duration of outstanding liabilities within the sub-groups
(insurance type, remaining period, and investment policy) of insurance products, such as individual insurance
and annuities, workers’ asset-formation insurance and annuities, and group insurance and annuities are
classified as policy-reserve-matching bonds in accordance with the Industry Audit Committee Report No. 21,
“Temporary Treatment of Accounting and Auditing Concerning Policy-Reserve-Matching Bonds in the
Insurance Industry,” issued by the JICPA.
3. Derivative financial instruments are stated at market value.
4. (1) 1) Tangible fixed assets (except for lease assets related to trading financial leases where ownership is
not transferred and buildings acquired on or after April 1, 1998) are depreciated based on the
declining balance method. Buildings acquired on or after April 1, 1998 are depreciated based on
the straight-line method.
2) Software, which is included within intangible fixed assets, is depreciated based on the straight-line
method.
3) The straight-line method based on lease period is used to calculate the depreciation of lease assets
related to trading financial leases where ownership is not transferred.
(2) The amount of accumulated depreciation of tangible fixed assets was ¥1,141,335 million as of March 31,
2012.
5. Revaluation of land used for operations is performed based on the Act on Revaluation of Land. The amount
related to the valuation difference between the previous and the revalued amount is tax effected and recognized
as deferred tax liabilities for land revaluation within the liability section. The valuation differences, excluding
tax, are recognized as land revaluation differences within the net assets section.
Revaluation Date March 31, 2002
Revaluation Methodology The amount is rationally calculated by using the land listed value and
road rate as prescribed by Article 2, Items 1 and 4, respectively, of the
Order for Enforcement of the Act on Revaluation of Land.
6. Assets and liabilities denominated in foreign currencies are translated into Japanese yen using the “Accounting
Standards for Foreign Currency Transactions” (Business Accounting Council).
Foreign currency-denominated available-for-sale securities of the Company, exchange rates of which have
significantly fluctuated and recovery in which is not expected, are converted to Japanese yen using either the
rate on the balance sheet date or the average one month rate prior to the balance sheet date, whichever indicates
a weaker yen. This translation difference is recorded as a loss on valuation of securities.
20 Nippon Life Insurance Company
7. (1) An allowance for doubtful accounts is recognized in accordance with the Company’s internal Asset
Valuation Regulation and Write-Off/Provision Rule.
1) The allowance for loans receivable from borrowers who are legally or substantially bankrupt, such
as being bankrupt or being in the process of civil rehabilitation proceedings, is recognized based on
the amount of credit remaining after directly deducting amounts expected to be collected through
disposal of collateral or execution of guarantees from the balance of loans receivable (as
mentioned at (3) below).
2) The allowance for loans receivable from borrowers who are not currently legally bankrupt but have
a significant possibility of bankruptcy is recognized at the amounts deemed necessary considering
an assessment of the borrowers’ overall solvency and the amounts remaining after deduction of
amounts expected to be collected through the disposal of collateral or the execution of guarantees.
3) The allowance for loans receivable from borrowers other than the above is provided based on the
borrowers’ balance multiplied by the historical average (of a certain period) percentage of bad
debt.
(2) All credits are assessed by responsible sections in accordance with the Company’s internal Asset
Valuation Regulation. The assessments are verified by the independent Asset Auditing Dept. The results
of the assessments are reflected in the calculation of the allowance for doubtful accounts.
(3) The amount of collateral value or the amount collectible by the execution of guarantees or other methods
directly subtracted from the balance of loans receivable is the estimated uncollectible amount for loans
(including loans with credits secured and/or guaranteed) made to legally or substantially bankrupt
borrowers. The estimated uncollectible amount was ¥1,754 million (including ¥1,114 million of credits
secured and/or guaranteed) as of March 31, 2012.
8. Accrued bonuses for directors and corporate auditors are recognized based on the amount estimated to be paid.
9. (1) Accrued severance indemnities are recognized based on the estimated amount of projected benefit
obligations in excess of the market value of pension plan assets for future severance payments to
employees on the balance sheet date.
21 Nippon Life Insurance Company
(2) Information relating to retirement allowance payments is as follows.
1) Breakdown of retirement benefit obligations as of March 31, 2012:
Million Yen
As of March 31, 2012
a. Retirement benefit obligations ¥(695,766)
b. Pension plan assets ¥267,708
c. Accrued retirement benefit costs (a+b) ¥(428,058)
d. Unrecognized actuarial differences ¥9,300
e. Unrecognized prior service cost ¥(18,663)
f. Accrued severance indemnities (c+d+e) ¥(437,421)
2) Basic information for the calculation of accrued severance indemnities is as follows:
a. Periodic allocation method of estimated
retirement benefits
Straight-line
b. Discount rate 1.6%
c. Expected rate of return on plan assets 1.6%
d. Method of amortizing actuarial differences Amortization is made over a certain period (5
years) using the straight-line method within the
average remaining years of service of employees
one year after the accrual of liabilities.
e. Method of amortizing prior service costs Amortization is made over a certain period (5
years) using the straight-line method within the
average remaining years of service of employees
upon accrual of liabilities.
10. Accrued retirement benefits for directors and corporate auditors are recognized based on estimated payment
amounts under internal rules.
11. Reserve for point cards is recognized based on the amount projected to be incurred for expenses from the use of
points granted to policyholders.
12. Accrued losses from supporting closely related companies are recognized based on amounts that are estimated
to be required in the future for supporting the restructurings of closely related companies.
13. Reserve for loss on disaster is recognized based on the amount that is estimated to be required in order to
prepare for expenditures associated with the Great East Japan Earthquake, such as expenditures for the repair of
22 Nippon Life Insurance Company
tangible fixed assets.
14. Reserve for price fluctuations in investments in securities is recognized based on Article 115 of the Insurance
Business Act.
15. Accounting treatment for financial leases other than from the transfer of ownership is based on the
“Accounting Standards of Lease Transactions” (ASBJ Statement No. 13). For financial leases where the
Company is the lessee, and ownership is not transferred and the lease start date is March 31, 2008 or prior, the
accounting treatment applied is based on the method related to ordinary lease transactions.
16. Hedge accounting is applied based on the following method:
1) The Company mainly applies the mark-to-market method of hedge accounting and deferred hedge
accounting for hedging activities against exposures to foreign exchange rate fluctuations on certain bonds
denominated in foreign currencies. The Company also applies exceptional accounting treatment
(“Tokurei-shori”) for interest rate swaps to hedge cash flow volatility of certain loans receivable, and
applies designated hedge accounting (“Furiate-shori”) for foreign exchange forward contracts and
currency swaps for certain financial assets denominated in foreign currencies.
2) Effectiveness of hedging activities is mainly evaluated by performing a ratio analysis of market value
movement comparisons based on the hedging instruments and hedging methods taken, which is in
accordance with the Company’s internal risk management policies.
17. Consumption taxes and local consumption taxes are accounted for by using the tax exclusion method.
However, consumption taxes paid on certain asset transactions, which are not deductible from consumption
taxes withheld and that are stipulated to be deferred under the Consumption Tax Act, are deferred as prepaid
expenses and amortized over a 5 year period on a straight-line basis. Consumption taxes other than deferred
consumption taxes are recorded to expense as incurred as of March 31, 2012.
18. Policy reserves are reserves set forth in accordance with Article 116 of the Insurance Business Act. Policy
reserves are recognized by performing a calculation based on the following methodology:
1) Reserves for contracts subject to the standard policy reserve are computed in accordance with the method
prescribed by the Prime Minister (Ordinance No. 48 issued by the Ministry of Finance in 1996).
2) Reserves for other contracts are computed based on the net level premium method.
In accordance with Article 69, Paragraph 5 of the Ordinance for Enforcement of the Insurance Business Act,
policy reserves include those that are reserved for a portion of the individual annuity policyholders.
19. The “Accounting Standard for Accounting Changes and Error Corrections” (ASBJ Statement No. 24), the
“Guidance on Accounting Standard for Accounting Changes and Error Corrections” (ASBJ Guidance No. 24) ,
23 Nippon Life Insurance Company
and the “Practical Guidelines on Accounting Standards for Financial Instruments” (JICPA Accounting Practice
Committee Statement No. 14), which was amended to respond to the Accounting Standard and the Guidance,
have been applied from the fiscal year ended March 31, 2012.
Owing to the resulting revisions to the Ordinance for Enforcement of the Insurance Business Act, the following
changes were made.
Reversal of allowance for doubtful accounts, which had previously been presented under extraordinary gains
on the non-consolidated statement of income, was included in investment income.
Operating income increased by ¥5,964 million but there was no impact on net surplus.
20. Regarding the asset management of general accounts (except separate accounts as provided in Article 118,
Paragraph 1 of the Insurance Business Act), in light of the characteristics of life insurance policies, the
Company built a portfolio geared towards mid- to long-term investment and formulated an investment plan
considering the outlook of the investment environment.
Based on this, in order to reliably pay insurance claims and benefits in the future, the Company positioned
yen-denominated assets that can be expected to provide stable income, such as bonds and loans, as the
Company’s core assets, and from the viewpoint of improving profit in the mid- to long-term, the Company
invested in stocks and foreign securities. Also, from the viewpoint of effective asset management, the Company
mainly uses derivative transactions for controlling asset investment risks. Specifically, the Company uses
interest rate swaps for the Company’s interest rate related investments, foreign exchange forward contracts and
currency options and swaps for the Company’s currency related investments, and hedge accounting is applied
with respect to a portion thereof.
The Company mainly applies the mark-to-market method of hedge accounting and deferred hedge accounting
for hedging activities against exposures to foreign exchange rate fluctuations on certain bonds denominated in
foreign currencies. The Company also applies exceptional accounting treatment (“Tokurei-shori”) for interest
rate swaps to hedge cash flow volatility of certain loans receivable, and applies designated hedge accounting
(“Furiate-shori”) for foreign exchange forward contracts and currency swaps for certain financial assets
denominated in foreign currencies. Effectiveness of hedging activities is mainly evaluated by performing a
ratio analysis of market value movement comparisons based on the hedging instruments and hedging methods
taken, which is in accordance with the Company’s internal risk management policies.
Securities are mainly exposed to market risk and credit risk, loans are exposed to credit risk, and derivative
transactions are exposed to market risk and credit risk. Market risk refers to the risk of losses incurred when the
market value of investment assets declines due to such factors as fluctuations in interest rates, exchange rates or
stock prices. Credit risk refers to the risk of incurring losses when the value of assets, primarily loans and
bonds, declines due to deterioration of the financial condition of the party to whom credit has been extended.
These risks are managed according to rules and regulations regarding asset management risks.
To manage market risk, the Company has implemented investment limits based on the nature of the assets in
order to avoid excessive losses for financing and investment transactions. In addition, the Company regularly
reports on the status of compliance to the Risk Management Committee, the advisory body of the Management
Committee, and has also prepared a system to control risk to acceptable levels when there is a breach of rules.
24 Nippon Life Insurance Company

Also, to control market risk in the Company’s portfolio, the Company uses a statistical analysis method to
rationally calculate the market value-at-risk of the portfolio as a whole and conducts appropriate asset
allocation within acceptable boundaries of risk.
To manage credit risk, the Company has built systems for rigorous examinations involving an Assessment
Management Department independent of the departments handling investment and finance activities. The
Company is also striving to build a sound portfolio through the establishment of interest guidelines to ensure
the returns the Company obtains are commensurate with the risk, a system of internal ratings for classifying the
creditworthiness of borrowers, and credit ceilings to ensure that credit risk is not excessively concentrated in a
particular company or group. In addition, the Company calculates credit value-at-risk as a measurement of the
magnitude of credit risk across the Company’s portfolio as a whole, and monitor whether the magnitude of risk
stays within an appropriate range.
21. (1) Balance sheet amounts and market values of major financial instruments and their differences are as
follows: (Million Yen)
Balance sheet amount (*1)
Market value (*2) Difference
Cash and deposits (negotiable certificates of deposit) 250,997 250,997 ––
Available-for-sale securities 250,997 250,997 ––
Monetary receivables purchased 883,070 926,722 43,652
Policy-reserve-matching bonds 806,689 850,341 43,652
Available-for-sale securities 76,381 76,381 ––
Securities 36,243,953 37,377,929 1,133,975
Trading securities 1,041,876 1,041,876 ––
Held-to-maturity debt securities 14,500 14,479 (21)
Policy-reserve-matching bonds 17,421,958 18,542,260 1,120,301
Investments in subsidiaries and affiliates 7,711 21,406 13,695
Available-for-sale securities 17,757,906 17,757,906 ––
Loans receivable (*3) 8,710,573 8,976,875 266,301
Policy loans 896,161 896,161 ––
Industrial and consumer loans 7,814,412 8,080,713 266,301
Derivative financial instruments (*4) [190,224] [190,224] ––
Hedge accounting not applied [81,081] [81,081] ––
Hedge accounting applied [109,143] [109,143] ––
Cash received as collateral under securities lending contracts (*5) [935,584] [935,584] ––
(*1) For transactions for which an allowance for doubtful accounts was recorded, the amount of the
allowance is deducted.
(*2) For securities for which impairment losses were recognized in the fiscal year ended March 31, 2012,
25 Nippon Life Insurance Company
the market value is the balance sheet amount after the impairment losses are deducted.
(*3) The market values of derivative financial instruments that are interest rate swaps under exceptional
accounting treatment (“Tokurei-shori”) or currency swaps under designated hedge accounting
(“Furiate-shori”) are included in the market values of loans receivable because they are accounted
for as an integral part of loans receivable which are hedged items.
(*4) Assets and liabilities generated by derivative financial instruments are offset and presented net. Net
liabilities in total are presented in brackets.
(*5) Cash received as collateral under securities lending contracts is recorded in liabilities and presented
in brackets.
(2) Market value measurement methods for major financial instruments are as follows:
1) Securities, deposits, and monetary receivables purchased treated as securities based on the
“Accounting Standards for Financial Instruments” (ASBJ Statement No. 10)
a. Items with a market price
Market value is measured based on the closing market price on the balance sheet date. However,
the market values of available-for-sale domestic and foreign equity securities are based on the
average market price over a one-month period prior to the balance sheet date.
b. Items without a market price
Market value is measured mainly by discounting future cash flows to the present value.
2) Loans receivable
a. Policy loans
Market value is deemed to approximate book value, due to no repayment deadlines based on
characteristics such as limiting loans to the surrender benefit range, and expected
reimbursement period and interest rate requirements, etc. Thus, the book value is used as the
market value of the policy loans.
b. Industrial and consumer loans
Market value of variable interest rate loans is deemed to approximate book value, because
market interest rates are reflected in future cash flows over the short term. Thus, the book value
is used as the market value of the variable interest rate loans.
Market value of fixed interest rate loans is measured mainly by discounting future cash flows to
the present value.
Loans receivable from legally or substantially bankrupt borrowers or borrowers who are not
currently legally bankrupt but have a high probability of bankruptcy are measured by deducting the
estimated uncollectable amount from the book value directly prior to the decrease.
3) Derivative financial instruments
a. Market value of futures and other market transactions is measured by the liquidation value or
26 Nippon Life Insurance Company
closing market price on the balance sheet date.
b. Market value of exchange contracts and currency options is measured based on theoretical
values calculated by the Company using Telegraphic Transfer Middle rates (TTM) and discount
rates obtained from brokers.
c. Market value of interest rate swaps and currency swaps is measured based on theoretical present
values calculated by discounting future cash flows using published market interest rates, etc.
4) Cash received as collateral under securities lending contracts
The book value is used as market value due to their short-term settlement.
(3) Unlisted equity securities, investments in partnerships whereby partnership assets consist of unlisted
equity securities, and other items without market value are not included in the securities in the table (1).
Balance sheet amounts as of March 31, 2012 by holding purpose are ¥247,911 million and ¥1,030,896
million, respectively, for stocks of subsidiaries and affiliates and for available-for-sale securities.
(4) Matters regarding securities, etc. by purpose of possession are as follows:
1) Trading securities
Securities in the separate accounts are classified as trading securities.
Valuation differences included in the current period income were losses of ¥11,977 million for
securities related to separate accounts.
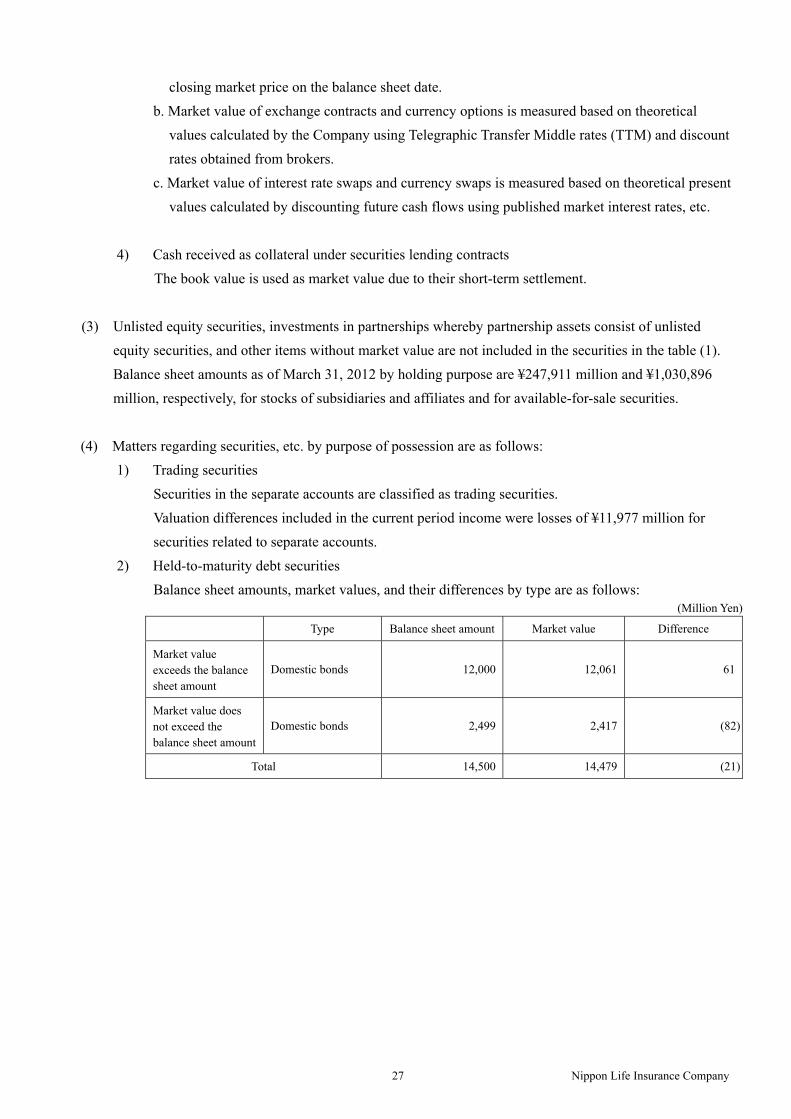
2) Held-to-maturity debt securities
Balance sheet amounts, market values, and their differences by type are as follows: (Million Yen)
Type Balance sheet amount Market value Difference
Market value exceeds the balance sheet amount
Domestic bonds 12,000 12,061 61
Market value does not exceed the balance sheet amount
Domestic bonds 2,499 2,417 (82)
Total 14,500 14,479 (21)
27 Nippon Life Insurance Company
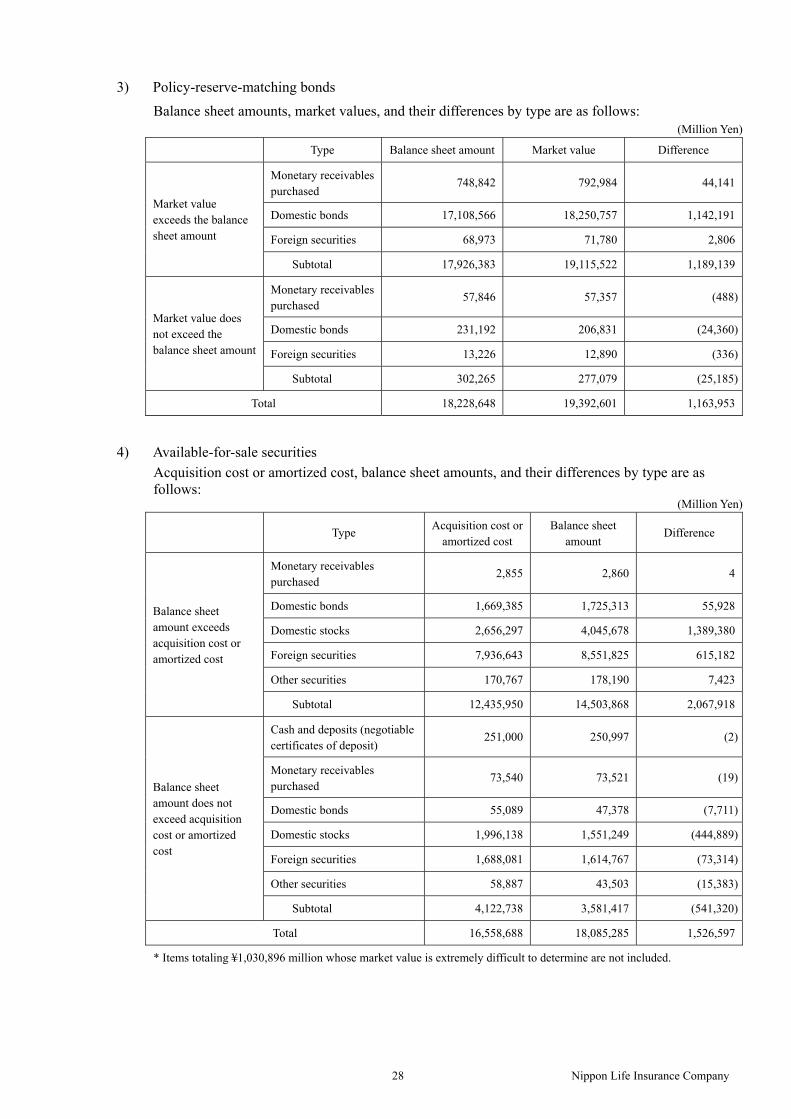
3) Policy-reserve-matching bonds
Balance sheet amounts, market values, and their differences by type are as follows: (Million Yen)
Type Balance sheet amount Market value Difference
Monetary receivables purchased
748,842 792,984 44,141
Domestic bonds 17,108,566 18,250,757 1,142,191
Foreign securities 68,973 71,780 2,806
Market value exceeds the balance sheet amount
Subtotal 17,926,383 19,115,522 1,189,139
Monetary receivables purchased
57,846 57,357 (488)
Domestic bonds 231,192 206,831 (24,360)
Foreign securities 13,226 12,890 (336)
Market value does not exceed the balance sheet amount
Subtotal 302,265 277,079 (25,185)
Total 18,228,648 19,392,601 1,163,953
4) Available-for-sale securities
Acquisition cost or amortized cost, balance sheet amounts, and their differences by type are as follows:
(Million Yen)
Type Acquisition cost or
amortized cost Balance sheet
amount Difference
Monetary receivables purchased
2,855 2,860 4
Domestic bonds 1,669,385 1,725,313 55,928
Domestic stocks 2,656,297 4,045,678 1,389,380
Foreign securities 7,936,643 8,551,825 615,182
Other securities 170,767 178,190 7,423
Balance sheet amount exceeds acquisition cost or amortized cost
Subtotal 12,435,950 14,503,868 2,067,918
Cash and deposits (negotiable certificates of deposit)
251,000 250,997 (2)
Monetary receivables purchased
73,540 73,521 (19)
Domestic bonds 55,089 47,378 (7,711)
Domestic stocks 1,996,138 1,551,249 (444,889)
Foreign securities 1,688,081 1,614,767 (73,314)
Other securities 58,887 43,503 (15,383)
Balance sheet amount does not exceed acquisition cost or amortized cost
Subtotal 4,122,738 3,581,417 (541,320)
Total 16,558,688 18,085,285 1,526,597
* Items totaling ¥1,030,896 million whose market value is extremely difficult to determine are not included.
28 Nippon Life Insurance Company
During the fiscal year ended March 31, 2012, ¥25,760 million in impairment losses was
recognized for items with market value.
Regarding stocks (including foreign stocks) with market value, impairment losses are recognized
for stocks whose market value has fallen significantly from the acquisition price based on the
average market value in the month preceding the balance sheet date, in principle. However, in the
case of a security that meets certain criteria, such as those for which the market value falls
substantially and the fall in the market value in the month preceding the balance sheet date is
substantial, impairment losses are recognized based on the market value on the balance sheet date.
The criteria by which the market value of a stock is judged to have fallen significantly is as
follows:
a. A security for which the ratio of the average market value in the month preceding the final day
of the fiscal year to the acquisition cost is 50% or less.
b. A security for which the ratio of the average market value in the month preceding the final day
of the fiscal year to the acquisition cost is over 50% and 70% or less, and for which the historical
market value, the condition of the issuing company and other aspects of the security meet certain
requirements.
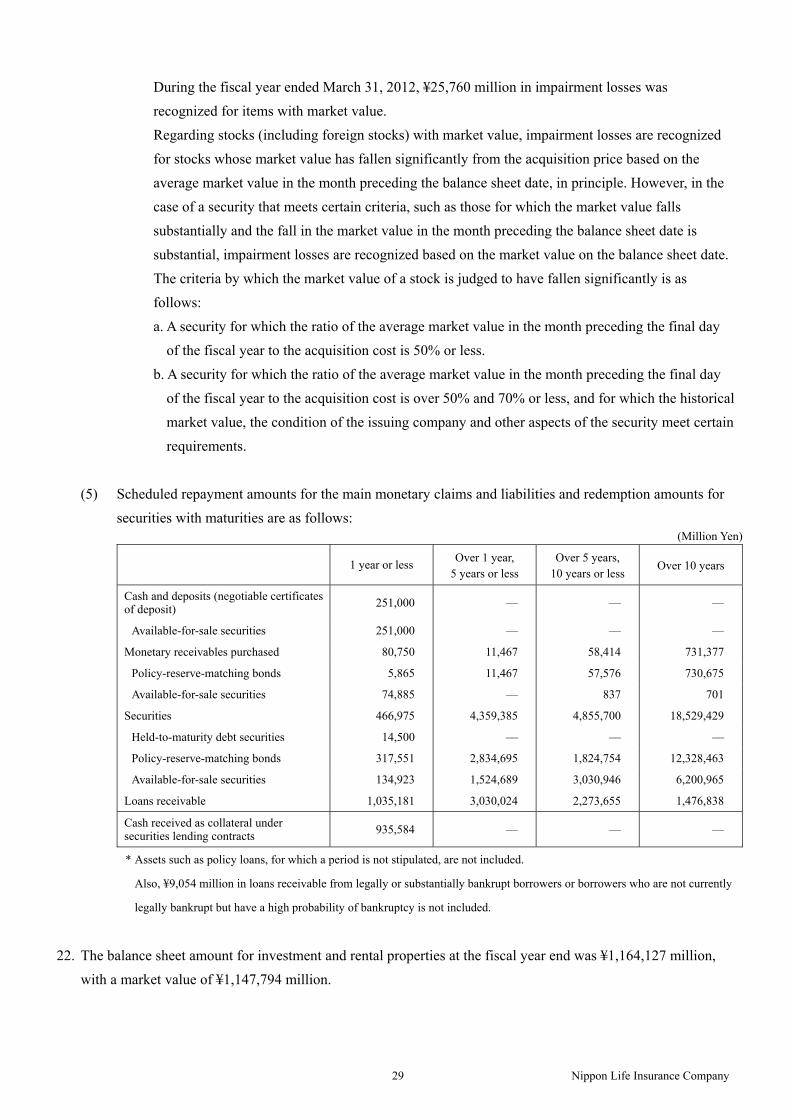
(5) Scheduled repayment amounts for the main monetary claims and liabilities and redemption amounts for
securities with maturities are as follows: (Million Yen)
1 year or less Over 1 year,
5 years or less Over 5 years,
10 years or less Over 10 years
Cash and deposits (negotiable certificates of deposit) 251,000 –– –– ––
Available-for-sale securities 251,000 –– –– ––
Monetary receivables purchased 80,750 11,467 58,414 731,377
Policy-reserve-matching bonds 5,865 11,467 57,576 730,675
Available-for-sale securities 74,885 –– 837 701
Securities 466,975 4,359,385 4,855,700 18,529,429
Held-to-maturity debt securities 14,500 –– –– ––
Policy-reserve-matching bonds 317,551 2,834,695 1,824,754 12,328,463
Available-for-sale securities 134,923 1,524,689 3,030,946 6,200,965
Loans receivable 1,035,181 3,030,024 2,273,655 1,476,838
Cash received as collateral under securities lending contracts 935,584 –– –– ––
* Assets such as policy loans, for which a period is not stipulated, are not included.
Also, ¥9,054 million in loans receivable from legally or substantially bankrupt borrowers or borrowers who are not currently
legally bankrupt but have a high probability of bankruptcy is not included.
22. The balance sheet amount for investment and rental properties at the fiscal year end was ¥1,164,127 million,
with a market value of ¥1,147,794 million.
29 Nippon Life Insurance Company
The Company owns rental office buildings and commercial facilities, the market value of which at the fiscal
year end is the amount measured based mainly on the Real Estate Appraisal Standards.
The amount corresponding to asset retirement obligations which are included in the balance sheet amounts of
investment and rental properties is ¥512 million.
23. (1) The total amount of loans to bankrupt borrowers, delinquent loans, loans that are delinquent for over
three months and restructured loans, which were included in loans receivable, was ¥42,589 million as of
March 31, 2012.
1) The balances of loans to bankrupt borrowers and delinquent loans were ¥3,018million and ¥33,532
million, respectively, as of March 31, 2012.
Loans to bankrupt borrowers are loans for which interest is not accrued as income, except for a
portion of loans written off, and to which any event specified in Article 96, Paragraph 1, Item 3 (a)
to (e) or Item 4 of the Order for Enforcement of the Corporation Tax Act has occurred. Interest is
not accrued as income for the loans since the recovery of principal or interest on the loans is
unlikely due to the fact that principal repayments and interest payments are overdue for a
significant period of time or for other reasons.
Delinquent loans are loans with interest not accrued and exclude loans to bankrupt borrowers and
loans with interest payments extended with the objective of restructuring or supporting the
borrowers.
2) There were no loans delinquent for over three months as of March 31, 2012.
Loans that are delinquent for over three months are loans with principal or interest unpaid for over
three months beginning one day after the due date based on the loan agreement. These loans
exclude loans classified as loans to bankrupt borrowers and delinquent loans.
3) The balance of restructured loans was ¥6,038 million as of March 31, 2012.
Restructured loans are loans that provide certain concessions favorable to borrowers with the intent
of supporting the borrowers’ restructuring, such as by reducing or exempting interest, postponing
principal or interest payments, releasing credits, or providing other benefits to the borrowers.
These loans exclude loans classified as loans to bankrupt borrowers, delinquent loans, and loans
delinquent for over three months.
(2) Direct write-offs of loans receivable decreased the balances of loans to bankrupt borrowers and
delinquent loans by ¥752 million and ¥1,001 million, respectively, as of March 31, 2012.
24. Separate account assets as provided for in Article 118, Paragraph 1 of the Insurance Business Act were
¥1,146,686 million as of March 31, 2012 and are presented with a corresponding liability recorded for the same
amount.
30 Nippon Life Insurance Company
25. The total amount of credits and debits to subsidiaries as of March 31, 2012 were ¥167,125 million and ¥3,381
million, respectively.
26. Changes in the reserve for dividends to policyholders included in policy reserves for the fiscal year ended
March 31, 2012 were as follows:
Million Yen
As of March 31, 2012
a. Balance at the beginning of the current fiscal year ¥1,144,330
b. Transfer to reserve from surplus in the previous fiscal year ¥175,513
c. Dividends to policyholders paid out in the current fiscal year ¥226,595
d. Increase in interest ¥27,087
e. Balance at the end of the current fiscal year (a+b-c+d) ¥1,120,336
27. Assets pledged as collateral by securities, land, and buildings as of March 31, 2012 were ¥1,260,121 million,
¥2,952 million, and ¥274 million, respectively. The total amount of loans covered by the aforementioned assets
as of March 31, 2012 was ¥946,508 million.
These amounts included ¥1,083,818 million of securities deposited and ¥946,476 million of cash received as
collateral under the securities lending contracts secured by cash as of March 31, 2012.
28. ¥100,000 million of foundation funds were offered according to Article 60 of the Insurance Business Act
during the fiscal year ended March 31, 2012.
29. The Company redeemed ¥50,000 million of foundation funds and credited the same amount to reserve for
redemption of foundation funds prescribed in Article 56 of the Insurance Business Act as of March 31, 2012.
30. The total amount of stocks and investments in subsidiaries was ¥255,622 million as of March 31, 2012.
On March 22, 2012, the Company reached an agreement with Reliance Capital Limited, which is the parent
company of Reliance Capital Asset Management Limited, an affiliate of the Reliance Group, on the Company’s
acquisition of 26% of the shares of Reliance Capital Asset Management Limited.
31. The amount of securities lent under lending agreements was ¥2,816,579 million as of March 31, 2012.
32. Assets that can be sold or re-secured are marketable securities lent under lending agreements. These assets
were being held without disposal totaling ¥709,179 million at market value as of March 31, 2012.
33. The amount of commitments related to loans receivable and loans outstanding was ¥137,032 million as of
March 31, 2012.
31 Nippon Life Insurance Company

34. Of the maximum borrowing amount from the Life Insurance Policyholders Protection Corporation of Japan,
which is provided for in Article 37-4 of the Order for Enforcement of the Insurance Business Act, the amount
applied to the Company is estimated to be ¥84,947 million as of March 31, 2012.
The amount contributed to the said corporation is recorded within operating expenses.
35. (1) Total deferred tax assets were ¥1,082,260 million and total deferred tax liabilities were ¥533,903 million
as of March 31, 2012. Among deferred tax assets, the deduction for the valuation allowance was ¥81,422
million. The major components causing deferred tax assets were policy reserves of ¥712,374 million,
accrued severance indemnities of ¥136,388 million, reserve for price fluctuations in investments in
securities of ¥106,193 million, and allowance for doubtful accounts of ¥5,386 million. The major
component causing deferred tax liabilities was net unrealized gains on available-for-sale securities of
¥494,409 million.
(2) The statutory tax rate was 36.1% for the fiscal year ended March 31, 2012. The main factors in the
difference between the statutory tax rate and the effective income tax rate were a decrease of 12.8% due
to the amount of reserve for dividends to policyholders and an impact of 31.3% from a change in the tax
rate.
(3) In line with the promulgation of the “Act for Partial Revision of the Income Tax Act, etc. for the Purpose
of Creating Taxation System Responding to Changes in Economic and Social Structures” (Act No. 114 of
2011) and the “Act on Special Measures for Securing Financial Resources Necessary to Implement
Measures for Reconstruction following the Great East Japan Earthquake” (Act No. 117 of 2011), the
statutory tax rate applied to measure deferred tax assets and liabilities was changed from 36.1%. For
items that are expected to be collected or paid during the period from April 1, 2012 to March 31, 2015,
the rate was changed to 33.2%, and for items that are expected to be collected or paid on or after April 1,
2015, the rate was changed to 30.7%.
As a result of this change, as of March 31, 2012, deferred tax assets and deferred tax liabilities for land
revaluation decreased by ¥61,157 million and ¥25,001 million, respectively, net unrealized gains on
available-for-sale securities and land revaluation differences increased by ¥87,305 million and ¥25,001
million, respectively, and income tax - deferred increased by ¥147,915 million.
36. The amount of policy reserves provided for the portion of reinsurance (hereafter referred to as "policy reserves
for ceded reinsurance") as defined in Article 71, Paragraph 1 of the Ordinance for Enforcement of the Insurance
Business Act was ¥164 million as of March 31, 2012.
37. The amount per Article 30, Paragraph 2 of the Ordinance for Enforcement of the Insurance Business Act was
¥1,015,406 million as of March 31, 2012.
32 Nippon Life Insurance Company
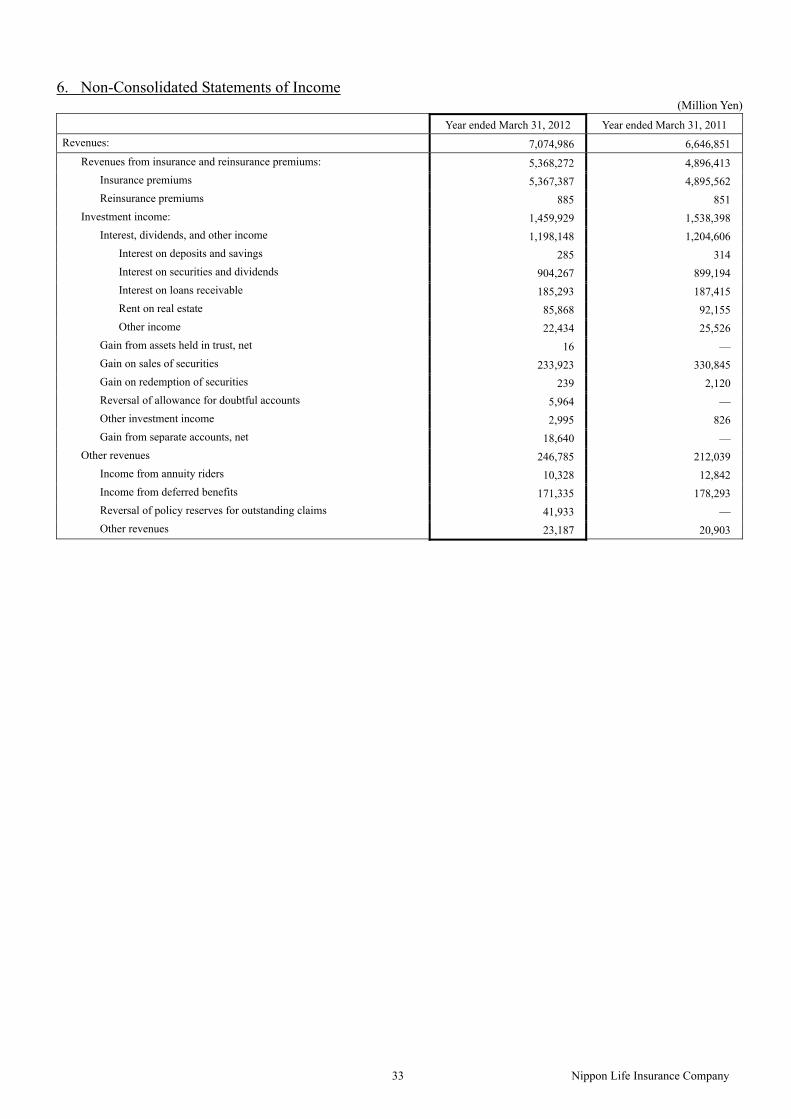
6. Non-Consolidated Statements of Income (Million Yen)
Year ended March 31, 2012 Year ended March 31, 2011
Revenues: 7,074,986 6,646,851
Revenues from insurance and reinsurance premiums: 5,368,272 4,896,413
Insurance premiums 5,367,387 4,895,562
Reinsurance premiums 885 851
Investment income: 1,459,929 1,538,398
Interest, dividends, and other income 1,198,148 1,204,606
Interest on deposits and savings 285 314
Interest on securities and dividends 904,267 899,194
Interest on loans receivable 185,293 187,415
Rent on real estate 85,868 92,155
Other income 22,434 25,526
Gain from assets held in trust, net 16 ––
Gain on sales of securities 233,923 330,845
Gain on redemption of securities 239 2,120
Reversal of allowance for doubtful accounts 5,964 ––
Other investment income 2,995 826
Gain from separate accounts, net 18,640 ––
Other revenues 246,785 212,039
Income from annuity riders 10,328 12,842
Income from deferred benefits 171,335 178,293
Reversal of policy reserves for outstanding claims 41,933 ––
Other revenues 23,187 20,903
33 Nippon Life Insurance Company
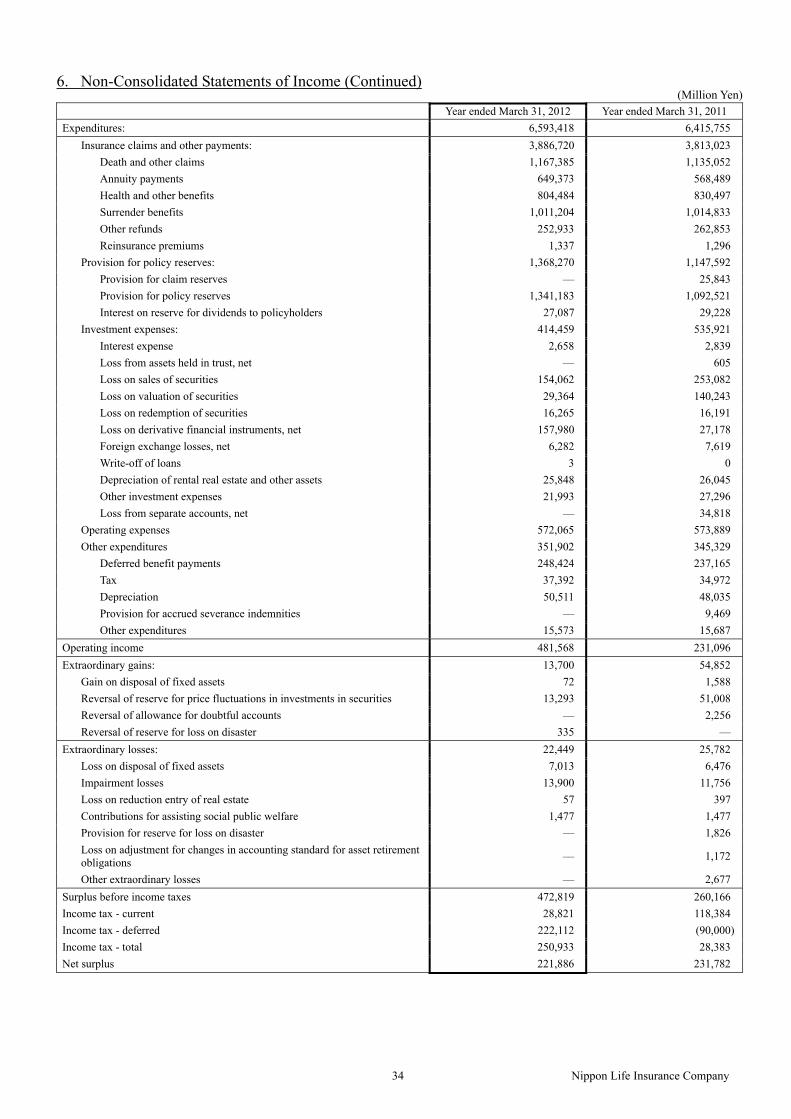
6. Non-Consolidated Statements of Income (Continued) (Million Yen)
Year ended March 31, 2012 Year ended March 31, 2011
Expenditures: 6,593,418 6,415,755
Insurance claims and other payments: 3,886,720 3,813,023
Death and other claims 1,167,385 1,135,052
Annuity payments 649,373 568,489
Health and other benefits 804,484 830,497
Surrender benefits 1,011,204 1,014,833
Other refunds 252,933 262,853
Reinsurance premiums 1,337 1,296
Provision for policy reserves: 1,368,270 1,147,592
Provision for claim reserves –– 25,843
Provision for policy reserves 1,341,183 1,092,521
Interest on reserve for dividends to policyholders 27,087 29,228
Investment expenses: 414,459 535,921
Interest expense 2,658 2,839
Loss from assets held in trust, net –– 605
Loss on sales of securities 154,062 253,082
Loss on valuation of securities 29,364 140,243
Loss on redemption of securities 16,265 16,191
Loss on derivative financial instruments, net 157,980 27,178
Foreign exchange losses, net 6,282 7,619
Write-off of loans 3 0
Depreciation of rental real estate and other assets 25,848 26,045
Other investment expenses 21,993 27,296
Loss from separate accounts, net –– 34,818
Operating expenses 572,065 573,889
Other expenditures 351,902 345,329
Deferred benefit payments 248,424 237,165
Tax 37,392 34,972
Depreciation 50,511 48,035
Provision for accrued severance indemnities –– 9,469
Other expenditures 15,573 15,687
Operating income 481,568 231,096
Extraordinary gains: 13,700 54,852
Gain on disposal of fixed assets 72 1,588
Reversal of reserve for price fluctuations in investments in securities 13,293 51,008
Reversal of allowance for doubtful accounts –– 2,256
Reversal of reserve for loss on disaster 335 ––
Extraordinary losses: 22,449 25,782
Loss on disposal of fixed assets 7,013 6,476
Impairment losses 13,900 11,756
Loss on reduction entry of real estate 57 397
Contributions for assisting social public welfare 1,477 1,477
Provision for reserve for loss on disaster –– 1,826
Loss on adjustment for changes in accounting standard for asset retirement obligations
–– 1,172
Other extraordinary losses –– 2,677
Surplus before income taxes 472,819 260,166
Income tax - current 28,821 118,384
Income tax - deferred 222,112 (90,000)
Income tax - total 250,933 28,383
Net surplus 221,886 231,782
34 Nippon Life Insurance Company
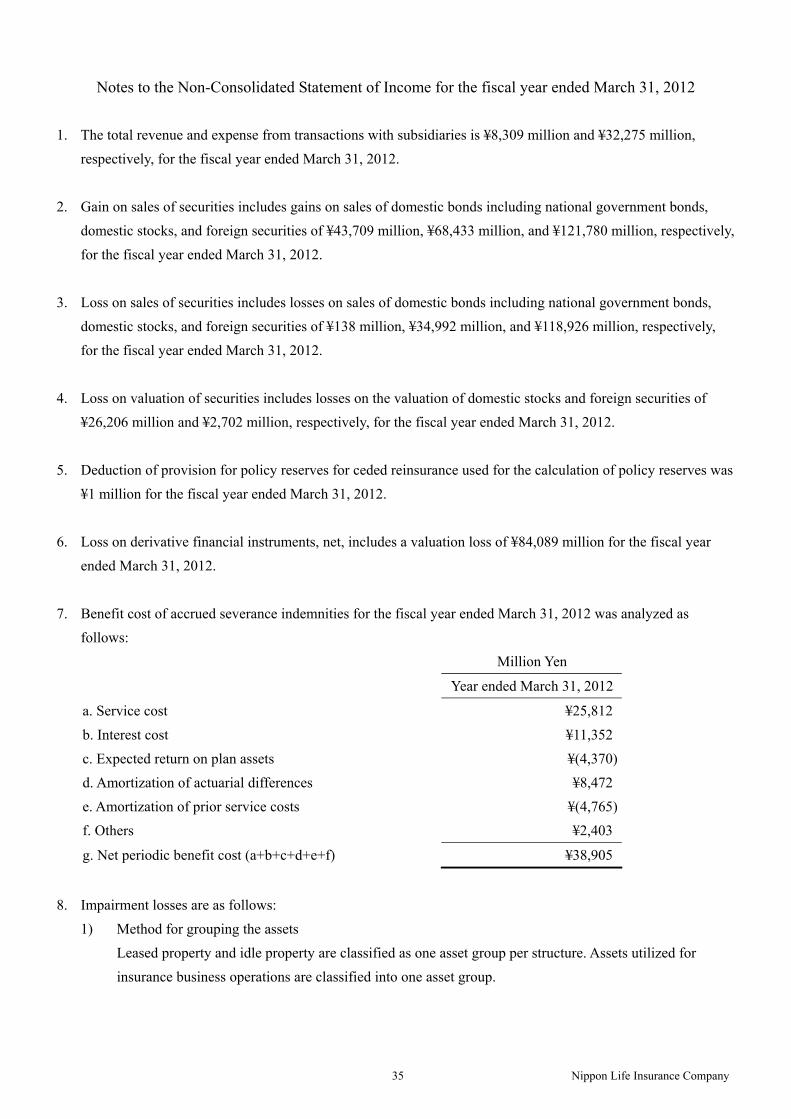
Notes to the Non-Consolidated Statement of Income for the fiscal year ended March 31, 2012
1. The total revenue and expense from transactions with subsidiaries is ¥8,309 million and ¥32,275 million,
respectively, for the fiscal year ended March 31, 2012.
2. Gain on sales of securities includes gains on sales of domestic bonds including national government bonds,
domestic stocks, and foreign securities of ¥43,709 million, ¥68,433 million, and ¥121,780 million, respectively,
for the fiscal year ended March 31, 2012.
3. Loss on sales of securities includes losses on sales of domestic bonds including national government bonds,
domestic stocks, and foreign securities of ¥138 million, ¥34,992 million, and ¥118,926 million, respectively,
for the fiscal year ended March 31, 2012.
4. Loss on valuation of securities includes losses on the valuation of domestic stocks and foreign securities of
¥26,206 million and ¥2,702 million, respectively, for the fiscal year ended March 31, 2012.
5. Deduction of provision for policy reserves for ceded reinsurance used for the calculation of policy reserves was
¥1 million for the fiscal year ended March 31, 2012.
6. Loss on derivative financial instruments, net, includes a valuation loss of ¥84,089 million for the fiscal year
ended March 31, 2012.
7. Benefit cost of accrued severance indemnities for the fiscal year ended March 31, 2012 was analyzed as
follows:
Million Yen
Year ended March 31, 2012
a. Service cost ¥25,812
b. Interest cost ¥11,352
c. Expected return on plan assets ¥(4,370)
d. Amortization of actuarial differences ¥8,472
e. Amortization of prior service costs ¥(4,765)
f. Others ¥2,403
g. Net periodic benefit cost (a+b+c+d+e+f) ¥38,905
8. Impairment losses are as follows:
1) Method for grouping the assets
Leased property and idle property are classified as one asset group per structure. Assets utilized for
insurance business operations are classified into one asset group.
35 Nippon Life Insurance Company
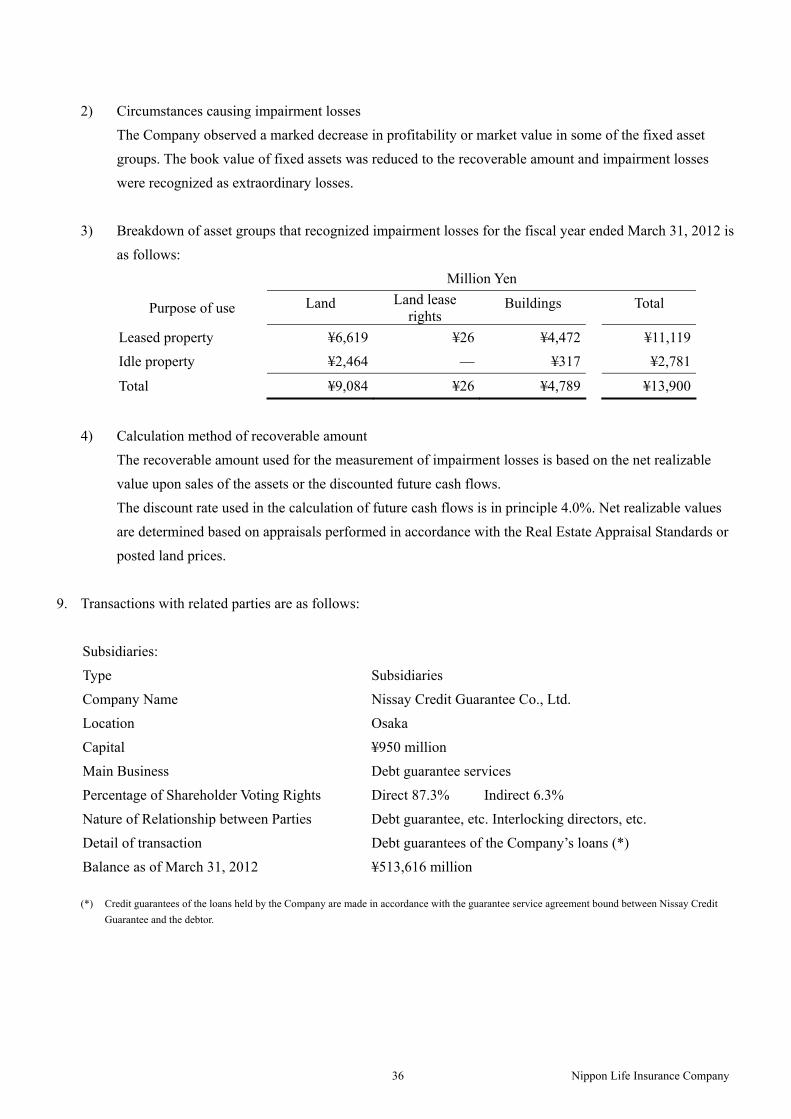
2) Circumstances causing impairment losses
The Company observed a marked decrease in profitability or market value in some of the fixed asset
groups. The book value of fixed assets was reduced to the recoverable amount and impairment losses
were recognized as extraordinary losses.
3) Breakdown of asset groups that recognized impairment losses for the fiscal year ended March 31, 2012 is
as follows:
Million Yen
Purpose of use Land Land lease rights
Buildings Total
Leased property ¥6,619 ¥26 ¥4,472 ¥11,119
Idle property ¥2,464 –– ¥317 ¥2,781
Total ¥9,084 ¥26 ¥4,789 ¥13,900
4) Calculation method of recoverable amount
The recoverable amount used for the measurement of impairment losses is based on the net realizable
value upon sales of the assets or the discounted future cash flows.
The discount rate used in the calculation of future cash flows is in principle 4.0%. Net realizable values
are determined based on appraisals performed in accordance with the Real Estate Appraisal Standards or
posted land prices.
9. Transactions with related parties are as follows:
Subsidiaries:
Type Subsidiaries
Company Name Nissay Credit Guarantee Co., Ltd.
Location Osaka
Capital ¥950 million
Main Business Debt guarantee services
Percentage of Shareholder Voting Rights Direct 87.3% Indirect 6.3%
Nature of Relationship between Parties Debt guarantee, etc. Interlocking directors, etc.
Detail of transaction Debt guarantees of the Company’s loans (*)
Balance as of March 31, 2012 ¥513,616 million
(*) Credit guarantees of the loans held by the Company are made in accordance with the guarantee service agreement bound between Nissay Credit
Guarantee and the debtor.
36 Nippon Life Insurance Company
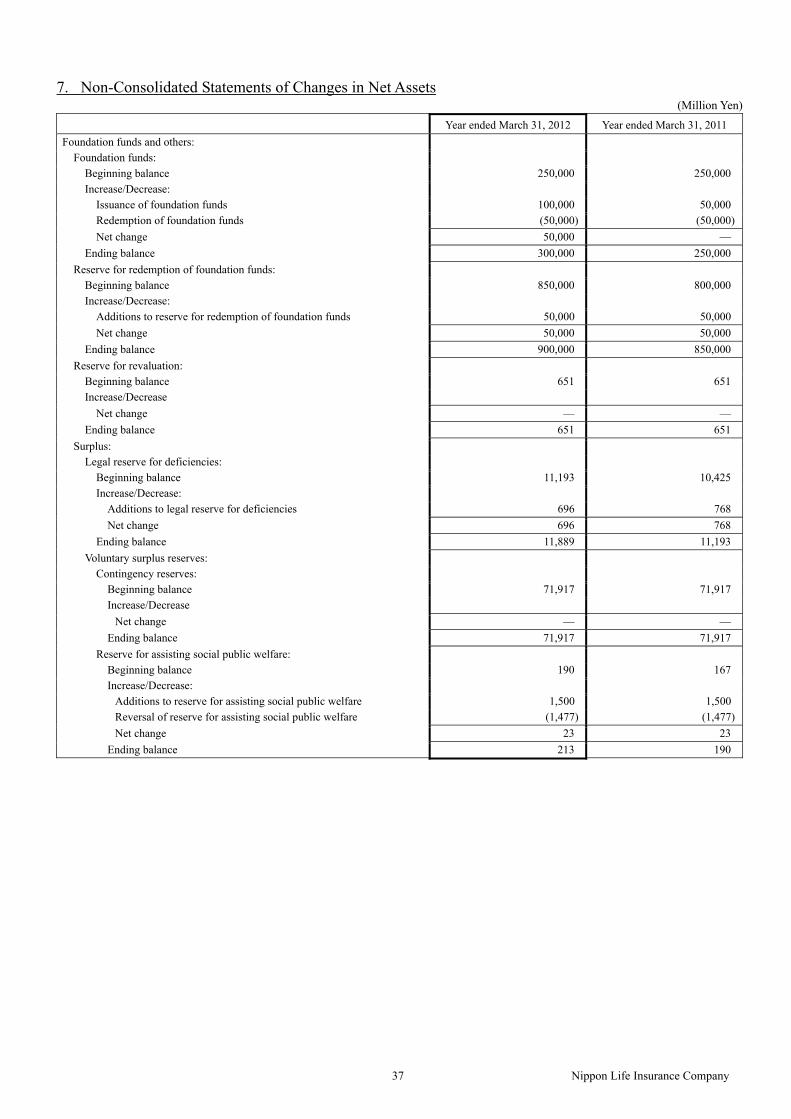
7. Non-Consolidated Statements of Changes in Net Assets (Million Yen)
Year ended March 31, 2012 Year ended March 31, 2011
Foundation funds and others: Foundation funds:
Beginning balance 250,000 250,000
Increase/Decrease: Issuance of foundation funds 100,000 50,000
Redemption of foundation funds (50,000) (50,000)
Net change 50,000 ––
Ending balance 300,000 250,000
Reserve for redemption of foundation funds: Beginning balance 850,000 800,000 Increase/Decrease:
Additions to reserve for redemption of foundation funds 50,000 50,000
Net change 50,000 50,000
Ending balance 900,000 850,000
Reserve for revaluation: Beginning balance 651 651 Increase/Decrease
Net change –– ––
Ending balance 651 651
Surplus: Legal reserve for deficiencies:
Beginning balance 11,193 10,425 Increase/Decrease:
Additions to legal reserve for deficiencies 696 768
Net change 696 768
Ending balance 11,889 11,193
Voluntary surplus reserves: Contingency reserves:
Beginning balance 71,917 71,917
Increase/Decrease
Net change –– ––
Ending balance 71,917 71,917
Reserve for assisting social public welfare: Beginning balance 190 167 Increase/Decrease:
Additions to reserve for assisting social public welfare 1,500 1,500
Reversal of reserve for assisting social public welfare (1,477) (1,477)
Net change 23 23
Ending balance 213 190
37 Nippon Life Insurance Company
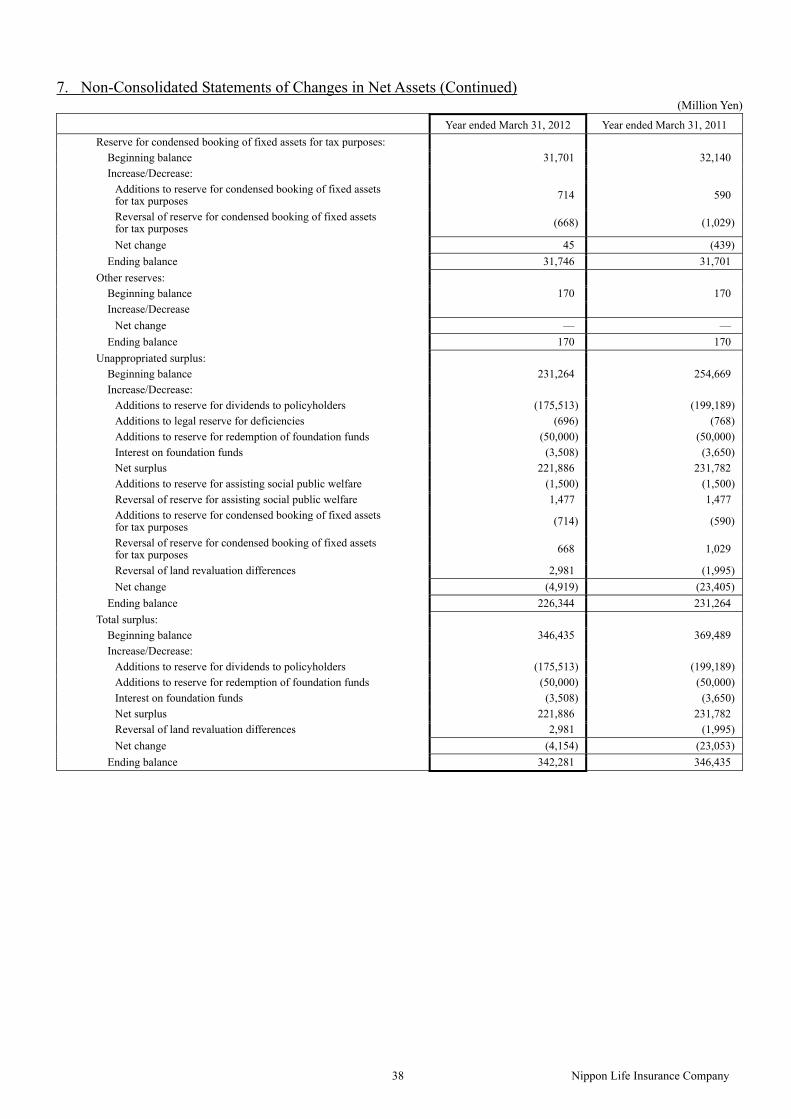
7. Non-Consolidated Statements of Changes in Net Assets (Continued) (Million Yen)
Year ended March 31, 2012 Year ended March 31, 2011
Reserve for condensed booking of fixed assets for tax purposes: Beginning balance 31,701 32,140
Increase/Decrease:
Additions to reserve for condensed booking of fixed assets for tax purposes 714 590
Reversal of reserve for condensed booking of fixed assets for tax purposes (668) (1,029)
Net change 45 (439)
Ending balance 31,746 31,701
Other reserves: Beginning balance 170 170
Increase/Decrease
Net change –– ––
Ending balance 170 170
Unappropriated surplus: Beginning balance 231,264 254,669
Increase/Decrease:
Additions to reserve for dividends to policyholders (175,513) (199,189)Additions to legal reserve for deficiencies (696) (768)
Additions to reserve for redemption of foundation funds (50,000) (50,000)
Interest on foundation funds (3,508) (3,650)Net surplus 221,886 231,782
Additions to reserve for assisting social public welfare (1,500) (1,500)
Reversal of reserve for assisting social public welfare 1,477 1,477 Additions to reserve for condensed booking of fixed assets for tax purposes (714) (590)
Reversal of reserve for condensed booking of fixed assets for tax purposes 668 1,029
Reversal of land revaluation differences 2,981 (1,995)
Net change (4,919) (23,405)
Ending balance 226,344 231,264
Total surplus: Beginning balance 346,435 369,489
Increase/Decrease:
Additions to reserve for dividends to policyholders (175,513) (199,189)Additions to reserve for redemption of foundation funds (50,000) (50,000)
Interest on foundation funds (3,508) (3,650)
Net surplus 221,886 231,782 Reversal of land revaluation differences 2,981 (1,995)
Net change (4,154) (23,053)
Ending balance 342,281 346,435
38 Nippon Life Insurance Company
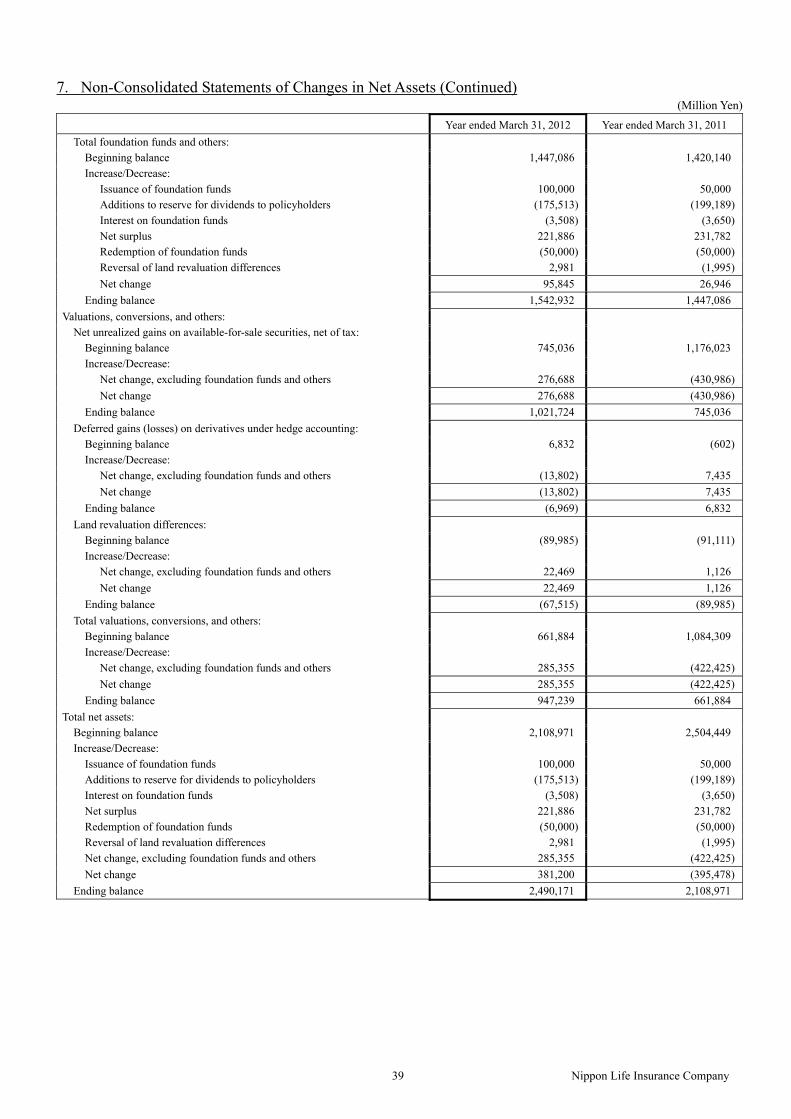
7. Non-Consolidated Statements of Changes in Net Assets (Continued) (Million Yen)
Year ended March 31, 2012 Year ended March 31, 2011
Total foundation funds and others: Beginning balance 1,447,086 1,420,140
Increase/Decrease:
Issuance of foundation funds 100,000 50,000 Additions to reserve for dividends to policyholders (175,513) (199,189)
Interest on foundation funds (3,508) (3,650)
Net surplus 221,886 231,782 Redemption of foundation funds (50,000) (50,000)
Reversal of land revaluation differences 2,981 (1,995)
Net change 95,845 26,946
Ending balance 1,542,932 1,447,086
Valuations, conversions, and others: Net unrealized gains on available-for-sale securities, net of tax:
Beginning balance 745,036 1,176,023
Increase/Decrease:
Net change, excluding foundation funds and others 276,688 (430,986)
Net change 276,688 (430,986)
Ending balance 1,021,724 745,036
Deferred gains (losses) on derivatives under hedge accounting: Beginning balance 6,832 (602)
Increase/Decrease:
Net change, excluding foundation funds and others (13,802) 7,435
Net change (13,802) 7,435
Ending balance (6,969) 6,832
Land revaluation differences: Beginning balance (89,985) (91,111)
Increase/Decrease:
Net change, excluding foundation funds and others 22,469 1,126
Net change 22,469 1,126
Ending balance (67,515) (89,985)
Total valuations, conversions, and others: Beginning balance 661,884 1,084,309
Increase/Decrease:
Net change, excluding foundation funds and others 285,355 (422,425)
Net change 285,355 (422,425)
Ending balance 947,239 661,884
Total net assets: Beginning balance 2,108,971 2,504,449
Increase/Decrease:
Issuance of foundation funds 100,000 50,000 Additions to reserve for dividends to policyholders (175,513) (199,189)
Interest on foundation funds (3,508) (3,650)
Net surplus 221,886 231,782 Redemption of foundation funds (50,000) (50,000)
Reversal of land revaluation differences 2,981 (1,995)
Net change, excluding foundation funds and others 285,355 (422,425)
Net change 381,200 (395,478)
Ending balance 2,490,171 2,108,971
39 Nippon Life Insurance Company
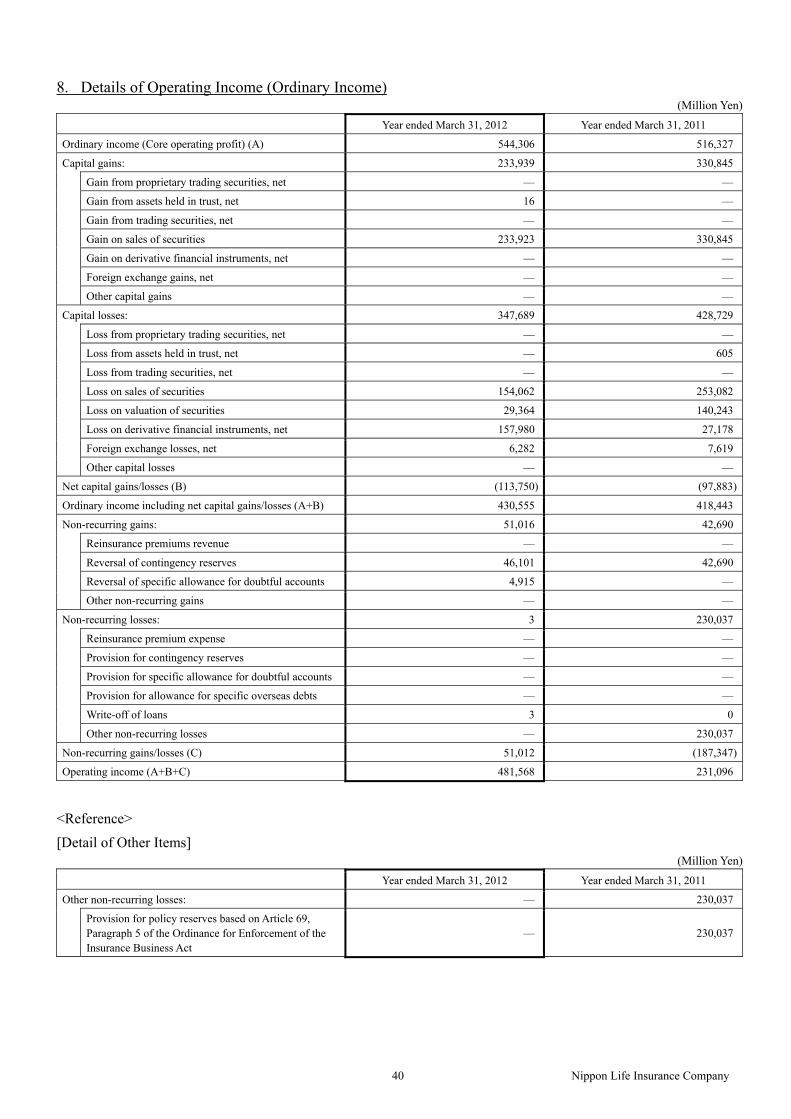
8. Details of Operating Income (Ordinary Income) (Million Yen)
Year ended March 31, 2012 Year ended March 31, 2011
Ordinary income (Core operating profit) (A) 544,306 516,327
Capital gains: 233,939 330,845
Gain from proprietary trading securities, net –– ––
Gain from assets held in trust, net 16 ––
Gain from trading securities, net –– ––
Gain on sales of securities 233,923 330,845
Gain on derivative financial instruments, net –– ––
Foreign exchange gains, net –– ––
Other capital gains –– ––
Capital losses: 347,689 428,729
Loss from proprietary trading securities, net –– ––
Loss from assets held in trust, net –– 605
Loss from trading securities, net –– ––
Loss on sales of securities 154,062 253,082
Loss on valuation of securities 29,364 140,243
Loss on derivative financial instruments, net 157,980 27,178
Foreign exchange losses, net 6,282 7,619
Other capital losses –– ––
Net capital gains/losses (B) (113,750) (97,883)
Ordinary income including net capital gains/losses (A+B) 430,555 418,443
Non-recurring gains: 51,016 42,690
Reinsurance premiums revenue –– ––
Reversal of contingency reserves 46,101 42,690
Reversal of specific allowance for doubtful accounts 4,915 ––
Other non-recurring gains –– ––
Non-recurring losses: 3 230,037
Reinsurance premium expense –– ––
Provision for contingency reserves –– ––
Provision for specific allowance for doubtful accounts –– ––
Provision for allowance for specific overseas debts –– ––
Write-off of loans 3 0
Other non-recurring losses –– 230,037
Non-recurring gains/losses (C) 51,012 (187,347)
Operating income (A+B+C) 481,568 231,096
<Reference>
[Detail of Other Items] (Million Yen)
Year ended March 31, 2012 Year ended March 31, 2011
Other non-recurring losses: –– 230,037
Provision for policy reserves based on Article 69, Paragraph 5 of the Ordinance for Enforcement of the Insurance Business Act
–– 230,037
40 Nippon Life Insurance Company
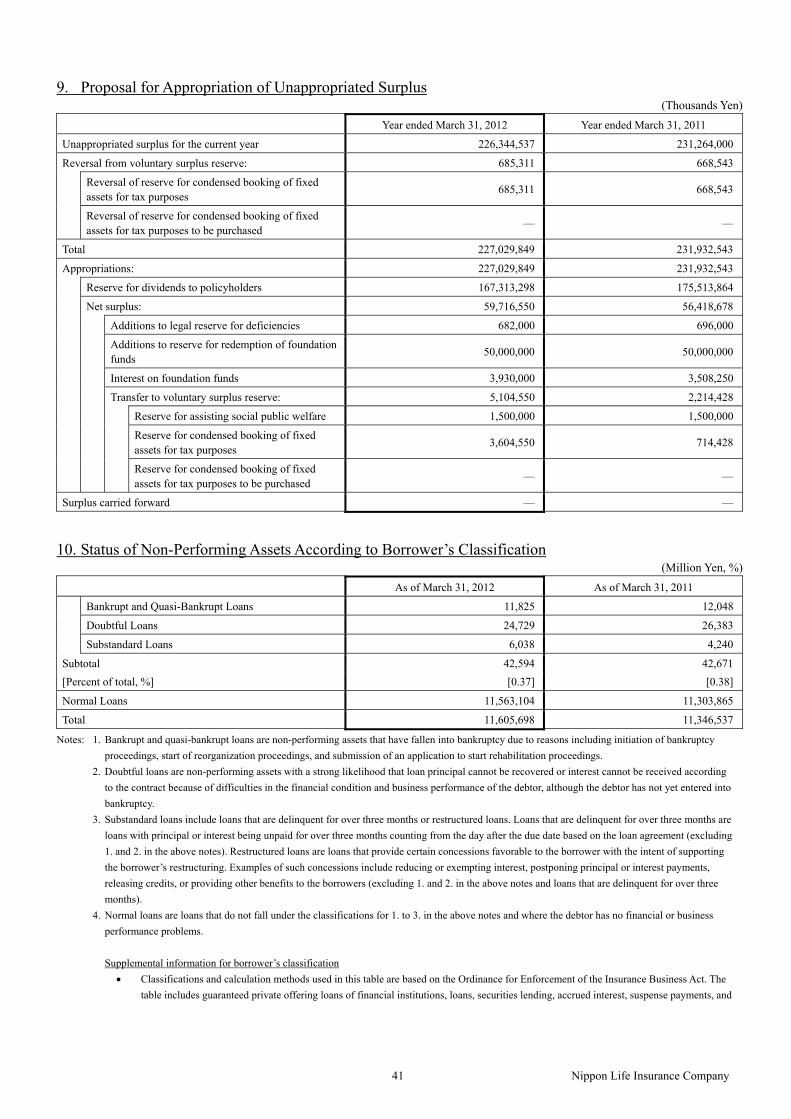
9. Proposal for Appropriation of Unappropriated Surplus (Thousands Yen)
Year ended March 31, 2012 Year ended March 31, 2011
Unappropriated surplus for the current year 226,344,537 231,264,000
Reversal from voluntary surplus reserve: 685,311 668,543
Reversal of reserve for condensed booking of fixed assets for tax purposes
685,311 668,543
Reversal of reserve for condensed booking of fixed assets for tax purposes to be purchased
–– ––
Total 227,029,849 231,932,543
Appropriations: 227,029,849 231,932,543
Reserve for dividends to policyholders 167,313,298 175,513,864
Net surplus: 59,716,550 56,418,678
Additions to legal reserve for deficiencies 682,000 696,000
Additions to reserve for redemption of foundation funds
50,000,000 50,000,000
Interest on foundation funds 3,930,000 3,508,250
Transfer to voluntary surplus reserve: 5,104,550 2,214,428
Reserve for assisting social public welfare 1,500,000 1,500,000
Reserve for condensed booking of fixed assets for tax purposes
3,604,550 714,428
Reserve for condensed booking of fixed assets for tax purposes to be purchased
–– ––
Surplus carried forward –– ––
10. Status of Non-Performing Assets According to Borrower’s Classification (Million Yen, %)
As of March 31, 2012 As of March 31, 2011
Bankrupt and Quasi-Bankrupt Loans 11,825 12,048
Doubtful Loans 24,729 26,383
Substandard Loans 6,038 4,240
Subtotal 42,594 42,671
[Percent of total, %] [0.37] [0.38]
Normal Loans 11,563,104 11,303,865
Total 11,605,698 11,346,537
Notes: 1. Bankrupt and quasi-bankrupt loans are non-performing assets that have fallen into bankruptcy due to reasons including initiation of bankruptcy
proceedings, start of reorganization proceedings, and submission of an application to start rehabilitation proceedings.
2. Doubtful loans are non-performing assets with a strong likelihood that loan principal cannot be recovered or interest cannot be received according
to the contract because of difficulties in the financial condition and business performance of the debtor, although the debtor has not yet entered into
bankruptcy.
3. Substandard loans include loans that are delinquent for over three months or restructured loans. Loans that are delinquent for over three months are
loans with principal or interest being unpaid for over three months counting from the day after the due date based on the loan agreement (excluding
1. and 2. in the above notes). Restructured loans are loans that provide certain concessions favorable to the borrower with the intent of supporting
the borrower’s restructuring. Examples of such concessions include reducing or exempting interest, postponing principal or interest payments,
releasing credits, or providing other benefits to the borrowers (excluding 1. and 2. in the above notes and loans that are delinquent for over three
months).
4. Normal loans are loans that do not fall under the classifications for 1. to 3. in the above notes and where the debtor has no financial or business
performance problems.
Supplemental information for borrower’s classification
Classifications and calculation methods used in this table are based on the Ordinance for Enforcement of the Insurance Business Act. The
table includes guaranteed private offering loans of financial institutions, loans, securities lending, accrued interest, suspense payments, and
41 Nippon Life Insurance Company
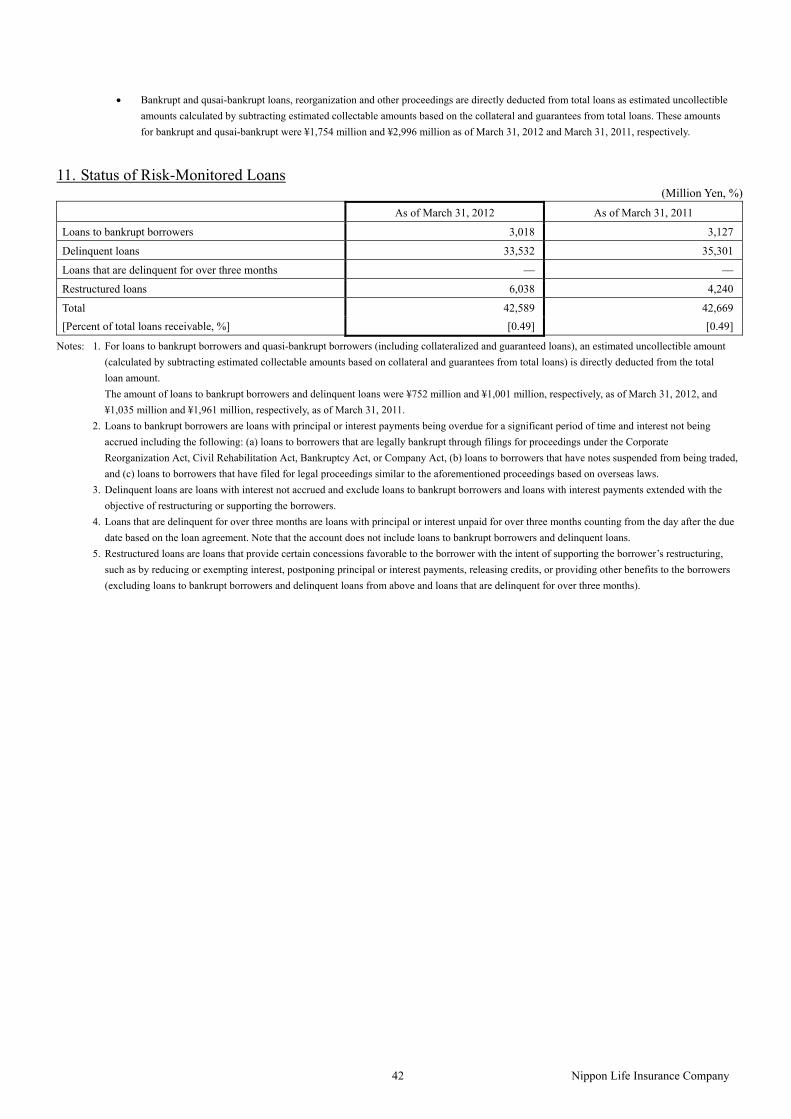
Bankrupt and qusai-bankrupt loans, reorganization and other proceedings are directly deducted from total loans as estimated uncollectible
amounts calculated by subtracting estimated collectable amounts based on the collateral and guarantees from total loans. These amounts
for bankrupt and qusai-bankrupt were ¥1,754 million and ¥2,996 million as of March 31, 2012 and March 31, 2011, respectively.
11. Status of Risk-Monitored Loans (Million Yen, %)
As of March 31, 2012 As of March 31, 2011
Loans to bankrupt borrowers 3,018 3,127
Delinquent loans 33,532 35,301
Loans that are delinquent for over three months –– ––
Restructured loans 6,038 4,240
Total 42,589 42,669
[Percent of total loans receivable, %] [0.49] [0.49]
Notes: 1. For loans to bankrupt borrowers and quasi-bankrupt borrowers (including collateralized and guaranteed loans), an estimated uncollectible amount
(calculated by subtracting estimated collectable amounts based on collateral and guarantees from total loans) is directly deducted from the total
loan amount.
The amount of loans to bankrupt borrowers and delinquent loans were ¥752 million and ¥1,001 million, respectively, as of March 31, 2012, and
¥1,035 million and ¥1,961 million, respectively, as of March 31, 2011.
2. Loans to bankrupt borrowers are loans with principal or interest payments being overdue for a significant period of time and interest not being
accrued including the following: (a) loans to borrowers that are legally bankrupt through filings for proceedings under the Corporate
Reorganization Act, Civil Rehabilitation Act, Bankruptcy Act, or Company Act, (b) loans to borrowers that have notes suspended from being traded,
and (c) loans to borrowers that have filed for legal proceedings similar to the aforementioned proceedings based on overseas laws.
3. Delinquent loans are loans with interest not accrued and exclude loans to bankrupt borrowers and loans with interest payments extended with the
objective of restructuring or supporting the borrowers.
4. Loans that are delinquent for over three months are loans with principal or interest unpaid for over three months counting from the day after the due
date based on the loan agreement. Note that the account does not include loans to bankrupt borrowers and delinquent loans.
5. Restructured loans are loans that provide certain concessions favorable to the borrower with the intent of supporting the borrower’s restructuring,
such as by reducing or exempting interest, postponing principal or interest payments, releasing credits, or providing other benefits to the borrowers
(excluding loans to bankrupt borrowers and delinquent loans from above and loans that are delinquent for over three months).
42 Nippon Life Insurance Company
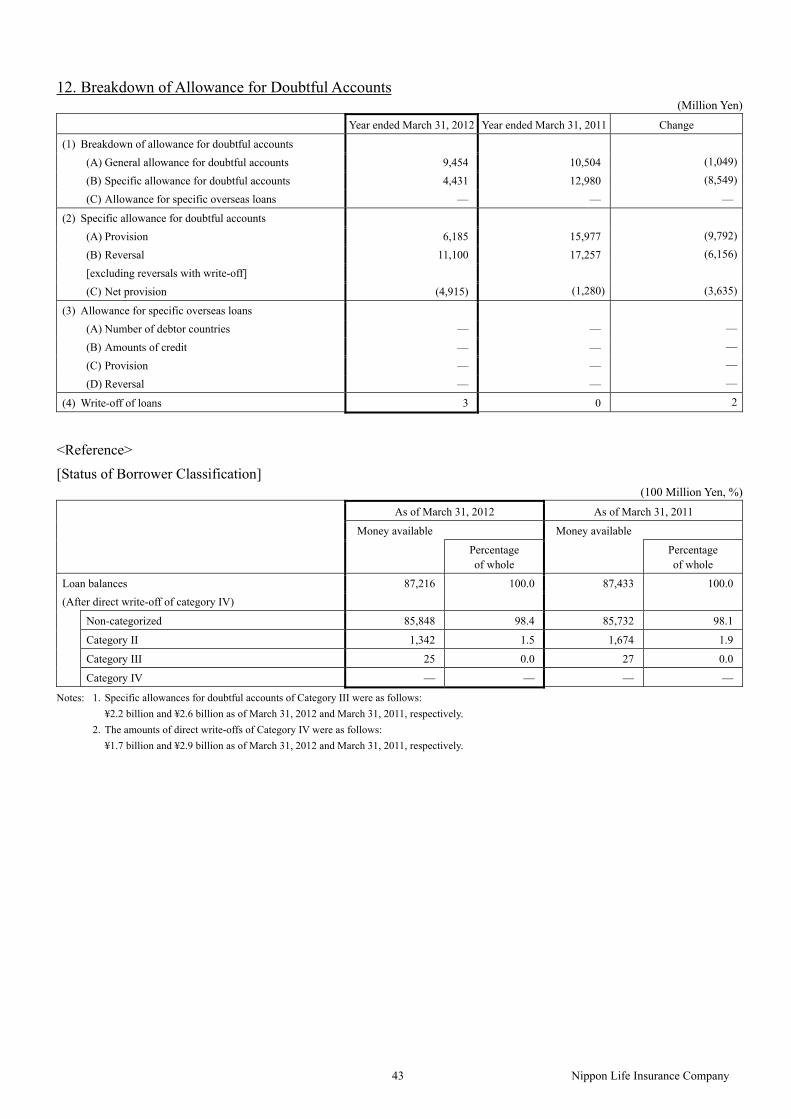
12. Breakdown of Allowance for Doubtful Accounts (Million Yen)
Year ended March 31, 2012 Year ended March 31, 2011 Change
(1) Breakdown of allowance for doubtful accounts (A) General allowance for doubtful accounts 9,454 10,504 (1,049)
(B) Specific allowance for doubtful accounts 4,431 12,980 (8,549)
(C) Allowance for specific overseas loans –– –– ––
(2) Specific allowance for doubtful accounts
(A) Provision 6,185 15,977 (9,792)
(B) Reversal 11,100 17,257 (6,156)
[excluding reversals with write-off]
(C) Net provision (4,915) (1,280) (3,635)
(3) Allowance for specific overseas loans
(A) Number of debtor countries –– –– ––
(B) Amounts of credit –– –– ––
(C) Provision –– –– ––
(D) Reversal –– –– ––
(4) Write-off of loans 3 0 2
<Reference>
[Status of Borrower Classification] (100 Million Yen, %)
As of March 31, 2012 As of March 31, 2011
Money available Money available
Percentage of whole
Percentage of whole
Loan balances 87,216 100.0 87,433 100.0
(After direct write-off of category IV)
Non-categorized 85,848 98.4 85,732 98.1
Category II 1,342 1.5 1,674 1.9
Category III 25 0.0 27 0.0
Category IV –– –– –– ––
Notes: 1. Specific allowances for doubtful accounts of Category III were as follows:
¥2.2 billion and ¥2.6 billion as of March 31, 2012 and March 31, 2011, respectively.
2. The amounts of direct write-offs of Category IV were as follows:
¥1.7 billion and ¥2.9 billion as of March 31, 2012 and March 31, 2011, respectively.
43 Nippon Life Insurance Company
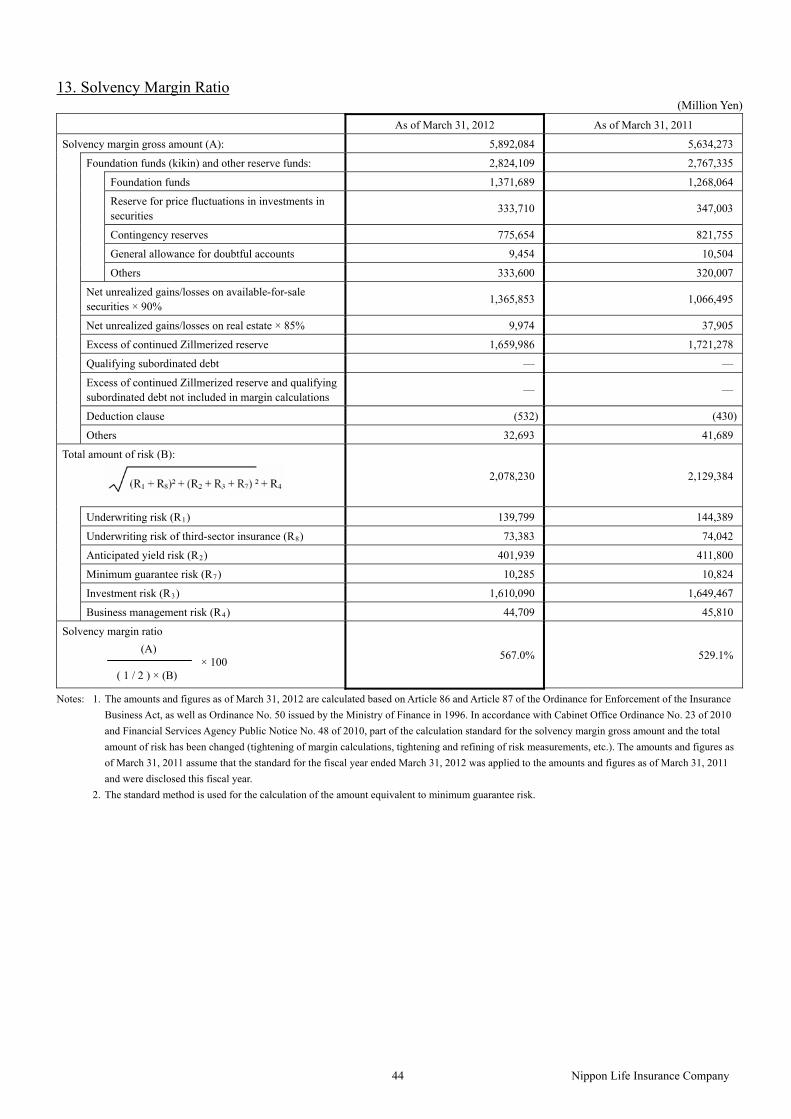
13. Solvency Margin Ratio (Million Yen)
As of March 31, 2012 As of March 31, 2011
Solvency margin gross amount (A): 5,892,084 5,634,273
Foundation funds (kikin) and other reserve funds: 2,824,109 2,767,335
Foundation funds 1,371,689 1,268,064
Reserve for price fluctuations in investments in securities 333,710 347,003
Contingency reserves 775,654 821,755
General allowance for doubtful accounts 9,454 10,504
Others 333,600 320,007
Net unrealized gains/losses on available-for-sale securities × 90% 1,365,853 1,066,495
Net unrealized gains/losses on real estate × 85% 9,974 37,905
Excess of continued Zillmerized reserve 1,659,986 1,721,278
Qualifying subordinated debt –– ––
Excess of continued Zillmerized reserve and qualifying subordinated debt not included in margin calculations
–– ––
Deduction clause (532) (430)
Others 32,693 41,689
Total amount of risk (B):
2,078,230 2,129,384
Underwriting risk (R1) 139,799 144,389
Underwriting risk of third-sector insurance (R8) 73,383 74,042
Anticipated yield risk (R2) 401,939 411,800
Minimum guarantee risk (R7) 10,285 10,824
Investment risk (R3) 1,610,090 1,649,467
Business management risk (R4) 44,709 45,810
Solvency margin ratio
(A) × 100
( 1 / 2 ) × (B)
567.0% 529.1%
Notes: 1. The amounts and figures as of March 31, 2012 are calculated based on Article 86 and Article 87 of the Ordinance for Enforcement of the Insurance
Business Act, as well as Ordinance No. 50 issued by the Ministry of Finance in 1996. In accordance with Cabinet Office Ordinance No. 23 of 2010
and Financial Services Agency Public Notice No. 48 of 2010, part of the calculation standard for the solvency margin gross amount and the total
amount of risk has been changed (tightening of margin calculations, tightening and refining of risk measurements, etc.). The amounts and figures as
of March 31, 2011 assume that the standard for the fiscal year ended March 31, 2012 was applied to the amounts and figures as of March 31, 2011
and were disclosed this fiscal year.
2. The standard method is used for the calculation of the amount equivalent to minimum guarantee risk.
44 Nippon Life Insurance Company
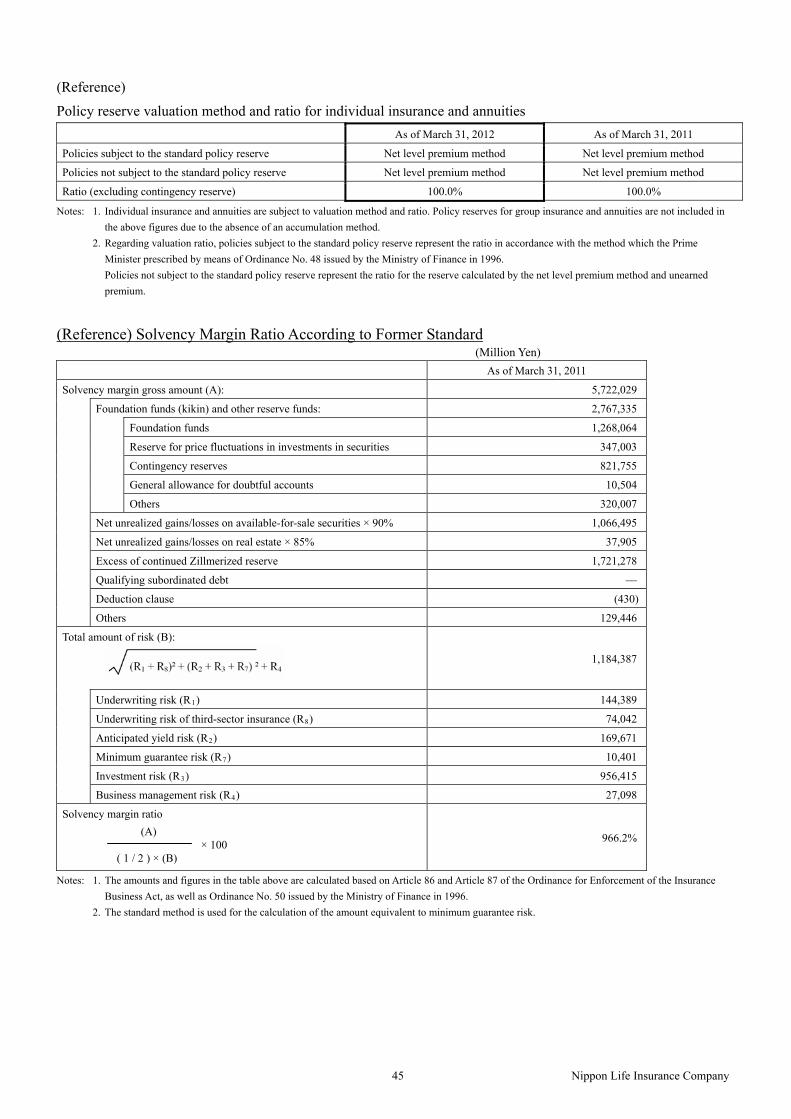
(Reference)
Policy reserve valuation method and ratio for individual insurance and annuities
As of March 31, 2012 As of March 31, 2011
Policies subject to the standard policy reserve Net level premium method Net level premium method
Policies not subject to the standard policy reserve Net level premium method Net level premium method
Ratio (excluding contingency reserve) 100.0% 100.0%
Notes: 1. Individual insurance and annuities are subject to valuation method and ratio. Policy reserves for group insurance and annuities are not included in
the above figures due to the absence of an accumulation method.
2. Regarding valuation ratio, policies subject to the standard policy reserve represent the ratio in accordance with the method which the Prime
Minister prescribed by means of Ordinance No. 48 issued by the Ministry of Finance in 1996.
Policies not subject to the standard policy reserve represent the ratio for the reserve calculated by the net level premium method and unearned
premium.
(Reference) Solvency Margin Ratio According to Former Standard (Million Yen)
As of March 31, 2011
Solvency margin gross amount (A): 5,722,029
Foundation funds (kikin) and other reserve funds: 2,767,335
Foundation funds 1,268,064
Reserve for price fluctuations in investments in securities 347,003
Contingency reserves 821,755
General allowance for doubtful accounts 10,504
Others 320,007
Net unrealized gains/losses on available-for-sale securities × 90% 1,066,495
Net unrealized gains/losses on real estate × 85% 37,905
Excess of continued Zillmerized reserve 1,721,278
Qualifying subordinated debt ––
Deduction clause (430)
Others 129,446
Total amount of risk (B):
1,184,387
Underwriting risk (R1) 144,389
Underwriting risk of third-sector insurance (R8) 74,042
Anticipated yield risk (R2) 169,671
Minimum guarantee risk (R7) 10,401
Investment risk (R3) 956,415
Business management risk (R4) 27,098
Solvency margin ratio
(A) × 100
( 1 / 2 ) × (B)
966.2%
Notes: 1. The amounts and figures in the table above are calculated based on Article 86 and Article 87 of the Ordinance for Enforcement of the Insurance
Business Act, as well as Ordinance No. 50 issued by the Ministry of Finance in 1996.
2. The standard method is used for the calculation of the amount equivalent to minimum guarantee risk.
45 Nippon Life Insurance Company
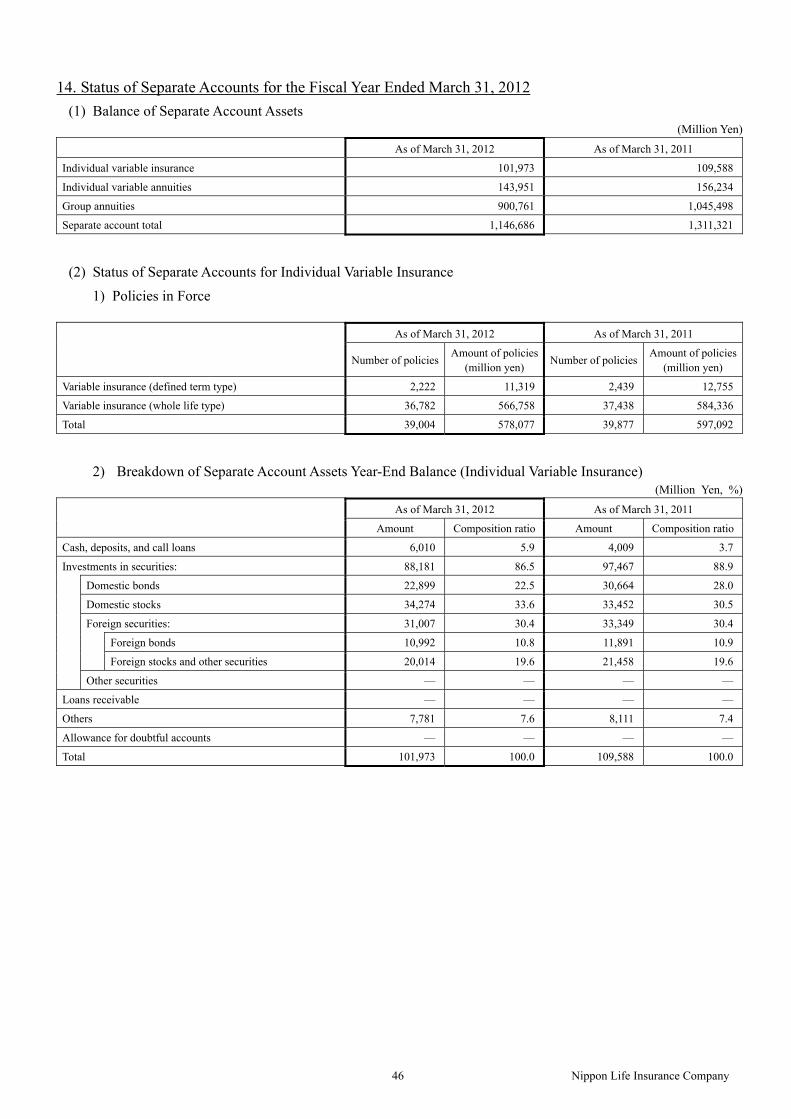
14. Status of Separate Accounts for the Fiscal Year Ended March 31, 2012
(1) Balance of Separate Account Assets (Million Yen)
As of March 31, 2012 As of March 31, 2011
Individual variable insurance 101,973 109,588
Individual variable annuities 143,951 156,234
Group annuities 900,761 1,045,498
Separate account total 1,146,686 1,311,321
(2) Status of Separate Accounts for Individual Variable Insurance
1) Policies in Force
As of March 31, 2012 As of March 31, 2011
Number of policiesAmount of policies
(million yen) Number of policies
Amount of policies(million yen)
Variable insurance (defined term type) 2,222 11,319 2,439 12,755
Variable insurance (whole life type) 36,782 566,758 37,438 584,336
Total 39,004 578,077 39,877 597,092
2) Breakdown of Separate Account Assets Year-End Balance (Individual Variable Insurance) (Million Yen, %)
As of March 31, 2012 As of March 31, 2011
Amount Composition ratio Amount Composition ratio
Cash, deposits, and call loans 6,010 5.9 4,009 3.7
Investments in securities: 88,181 86.5 97,467 88.9
Domestic bonds 22,899 22.5 30,664 28.0
Domestic stocks 34,274 33.6 33,452 30.5
Foreign securities: 31,007 30.4 33,349 30.4
Foreign bonds 10,992 10.8 11,891 10.9
Foreign stocks and other securities 20,014 19.6 21,458 19.6
Other securities –– –– –– ––
Loans receivable –– –– –– ––
Others 7,781 7.6 8,111 7.4
Allowance for doubtful accounts –– –– –– ––
Total 101,973 100.0 109,588 100.0
46 Nippon Life Insurance Company
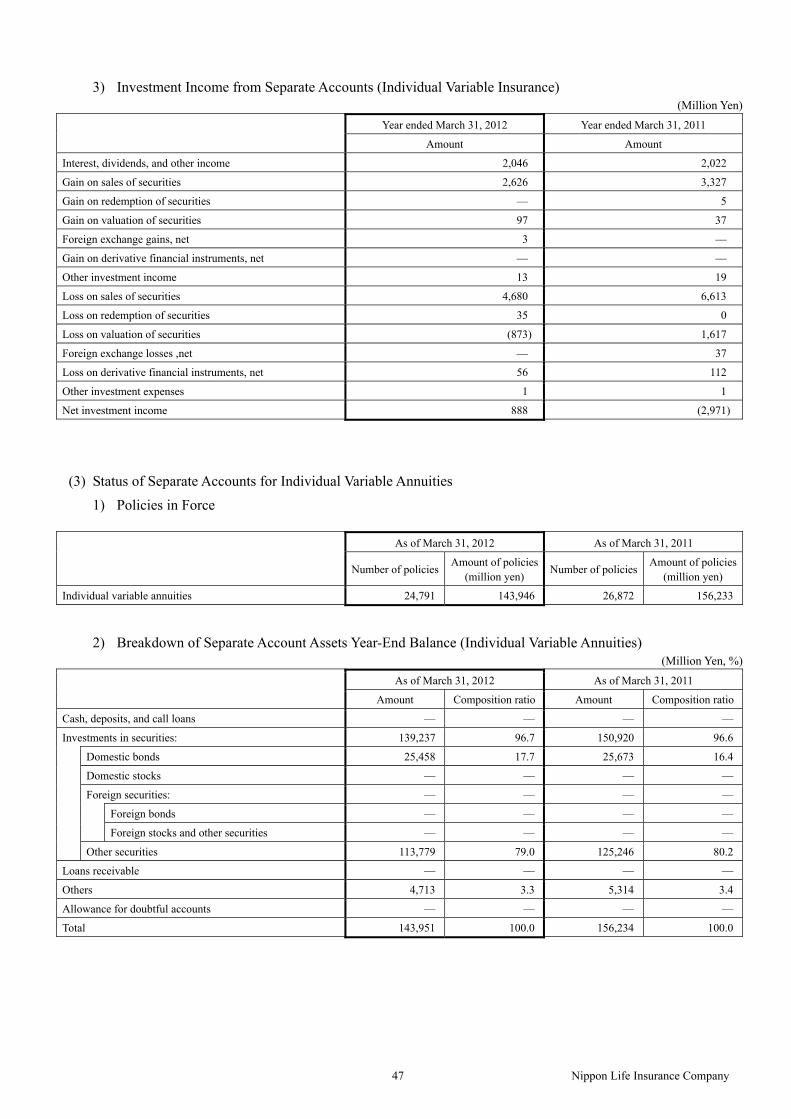
3) Investment Income from Separate Accounts (Individual Variable Insurance) (Million Yen)
Year ended March 31, 2012 Year ended March 31, 2011
Amount Amount
Interest, dividends, and other income 2,046 2,022
Gain on sales of securities 2,626 3,327
Gain on redemption of securities –– 5
Gain on valuation of securities 97 37
Foreign exchange gains, net 3 –– Gain on derivative financial instruments, net –– –– Other investment income 13 19
Loss on sales of securities 4,680 6,613
Loss on redemption of securities 35 0
Loss on valuation of securities (873) 1,617
Foreign exchange losses ,net –– 37
Loss on derivative financial instruments, net 56 112
Other investment expenses 1 1
Net investment income 888 (2,971)
(3) Status of Separate Accounts for Individual Variable Annuities
1) Policies in Force
As of March 31, 2012 As of March 31, 2011
Number of policiesAmount of policies
(million yen) Number of policies
Amount of policies(million yen)
Individual variable annuities 24,791 143,946 26,872 156,233
2) Breakdown of Separate Account Assets Year-End Balance (Individual Variable Annuities) (Million Yen, %)
As of March 31, 2012 As of March 31, 2011
Amount Composition ratio Amount Composition ratio
Cash, deposits, and call loans –– –– –– ––
Investments in securities: 139,237 96.7 150,920 96.6
Domestic bonds 25,458 17.7 25,673 16.4
Domestic stocks –– –– –– ––
Foreign securities: –– –– –– ––
Foreign bonds –– –– –– ––
Foreign stocks and other securities –– –– –– ––
Other securities 113,779 79.0 125,246 80.2
Loans receivable –– –– –– ––
Others 4,713 3.3 5,314 3.4
Allowance for doubtful accounts –– –– –– ––
Total 143,951 100.0 156,234 100.0
47 Nippon Life Insurance Company
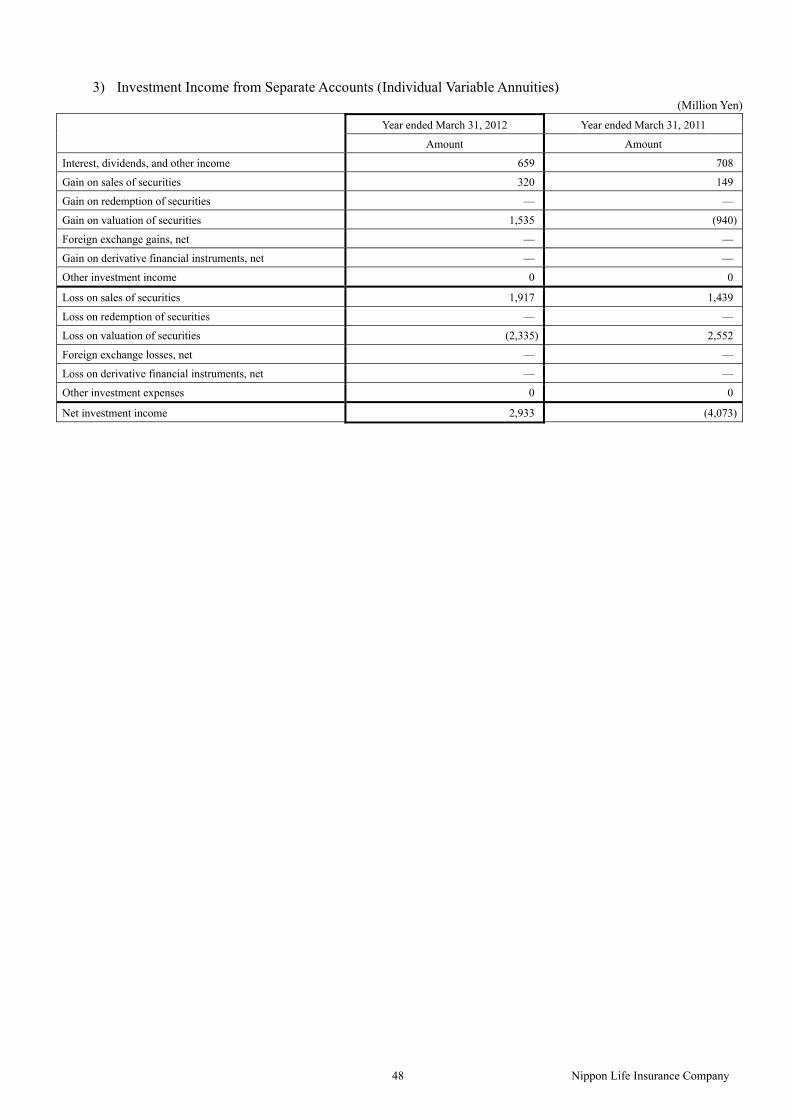
3) Investment Income from Separate Accounts (Individual Variable Annuities) (Million Yen)
Year ended March 31, 2012 Year ended March 31, 2011
Amount Amount
Interest, dividends, and other income 659 708
Gain on sales of securities 320 149
Gain on redemption of securities –– ––
Gain on valuation of securities 1,535 (940)
Foreign exchange gains, net –– ––
Gain on derivative financial instruments, net –– ––
Other investment income 0 0
Loss on sales of securities 1,917 1,439
Loss on redemption of securities –– ––
Loss on valuation of securities (2,335) 2,552
Foreign exchange losses, net –– ––
Loss on derivative financial instruments, net –– ––
Other investment expenses 0 0
Net investment income 2,933 (4,073)
48 Nippon Life Insurance Company
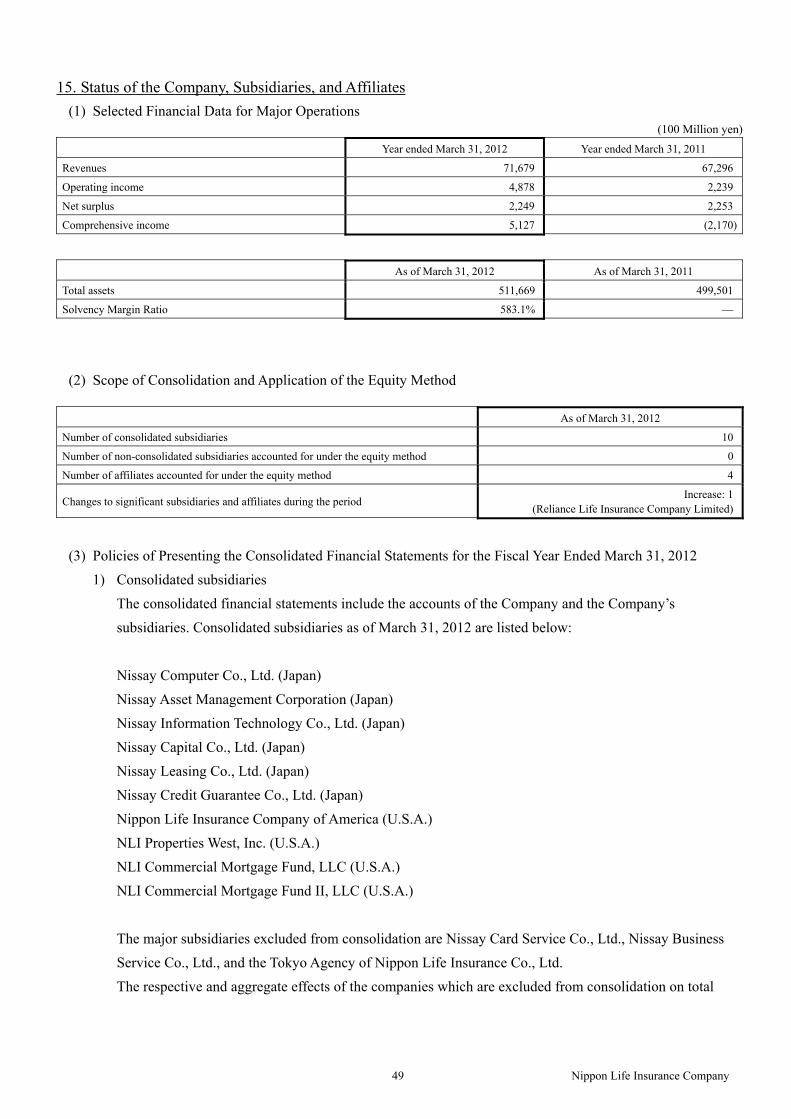
15. Status of the Company, Subsidiaries, and Affiliates
(1) Selected Financial Data for Major Operations (100 Million yen)
Year ended March 31, 2012 Year ended March 31, 2011
Revenues 71,679 67,296
Operating income 4,878 2,239
Net surplus 2,249 2,253
Comprehensive income 5,127 (2,170)
As of March 31, 2012 As of March 31, 2011
Total assets 511,669 499,501
Solvency Margin Ratio 583.1% ––
(2) Scope of Consolidation and Application of the Equity Method
As of March 31, 2012
Number of consolidated subsidiaries 10
Number of non-consolidated subsidiaries accounted for under the equity method 0
Number of affiliates accounted for under the equity method 4
Changes to significant subsidiaries and affiliates during the period Increase: 1
(Reliance Life Insurance Company Limited)
(3) Policies of Presenting the Consolidated Financial Statements for the Fiscal Year Ended March 31, 2012
1) Consolidated subsidiaries
The consolidated financial statements include the accounts of the Company and the Company’s
subsidiaries. Consolidated subsidiaries as of March 31, 2012 are listed below:
Nissay Computer Co., Ltd. (Japan)
Nissay Asset Management Corporation (Japan)
Nissay Information Technology Co., Ltd. (Japan)
Nissay Capital Co., Ltd. (Japan)
Nissay Leasing Co., Ltd. (Japan)
Nissay Credit Guarantee Co., Ltd. (Japan)
Nippon Life Insurance Company of America (U.S.A.)
NLI Properties West, Inc. (U.S.A.)
NLI Commercial Mortgage Fund, LLC (U.S.A.)
NLI Commercial Mortgage Fund II, LLC (U.S.A.)
The major subsidiaries excluded from consolidation are Nissay Card Service Co., Ltd., Nissay Business
Service Co., Ltd., and the Tokyo Agency of Nippon Life Insurance Co., Ltd.
The respective and aggregate effects of the companies which are excluded from consolidation on total
49 Nippon Life Insurance Company
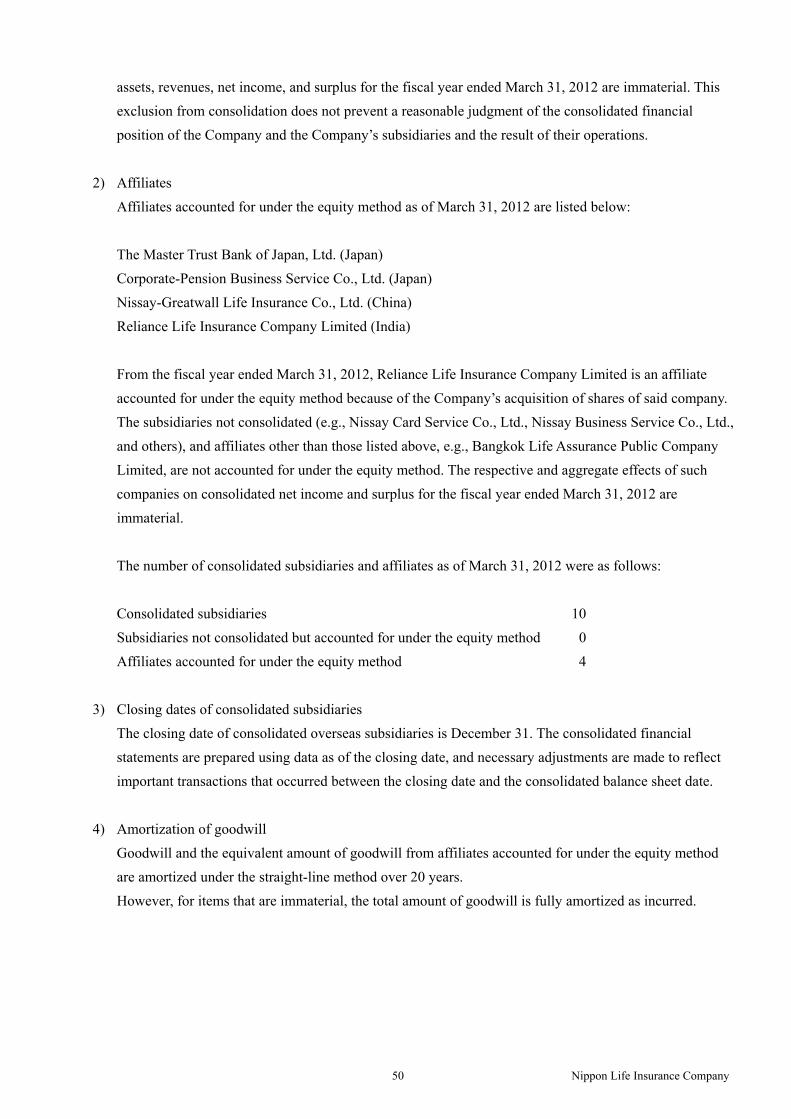
assets, revenues, net income, and surplus for the fiscal year ended March 31, 2012 are immaterial. This
exclusion from consolidation does not prevent a reasonable judgment of the consolidated financial
position of the Company and the Company’s subsidiaries and the result of their operations.
2) Affiliates
Affiliates accounted for under the equity method as of March 31, 2012 are listed below:
The Master Trust Bank of Japan, Ltd. (Japan)
Corporate-Pension Business Service Co., Ltd. (Japan)
Nissay-Greatwall Life Insurance Co., Ltd. (China)
Reliance Life Insurance Company Limited (India)
From the fiscal year ended March 31, 2012, Reliance Life Insurance Company Limited is an affiliate
accounted for under the equity method because of the Company’s acquisition of shares of said company.
The subsidiaries not consolidated (e.g., Nissay Card Service Co., Ltd., Nissay Business Service Co., Ltd.,
and others), and affiliates other than those listed above, e.g., Bangkok Life Assurance Public Company
Limited, are not accounted for under the equity method. The respective and aggregate effects of such
companies on consolidated net income and surplus for the fiscal year ended March 31, 2012 are
immaterial.
The number of consolidated subsidiaries and affiliates as of March 31, 2012 were as follows:
Consolidated subsidiaries 10
Subsidiaries not consolidated but accounted for under the equity method 0
Affiliates accounted for under the equity method 4
3) Closing dates of consolidated subsidiaries
The closing date of consolidated overseas subsidiaries is December 31. The consolidated financial
statements are prepared using data as of the closing date, and necessary adjustments are made to reflect
important transactions that occurred between the closing date and the consolidated balance sheet date.
4) Amortization of goodwill
Goodwill and the equivalent amount of goodwill from affiliates accounted for under the equity method
are amortized under the straight-line method over 20 years.
However, for items that are immaterial, the total amount of goodwill is fully amortized as incurred.
50 Nippon Life Insurance Company
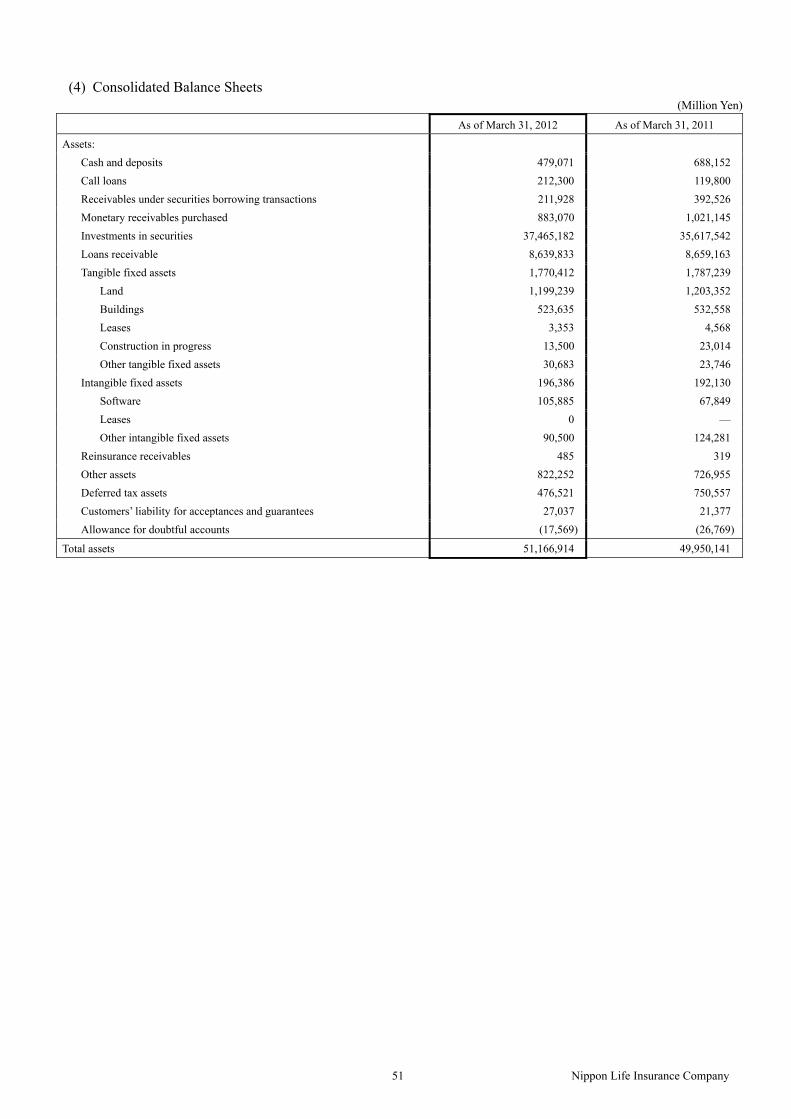
(4) Consolidated Balance Sheets (Million Yen)
As of March 31, 2012 As of March 31, 2011
Assets:
Cash and deposits 479,071 688,152
Call loans 212,300 119,800
Receivables under securities borrowing transactions 211,928 392,526
Monetary receivables purchased 883,070 1,021,145
Investments in securities 37,465,182 35,617,542
Loans receivable 8,639,833 8,659,163
Tangible fixed assets 1,770,412 1,787,239
Land 1,199,239 1,203,352
Buildings 523,635 532,558
Leases 3,353 4,568
Construction in progress 13,500 23,014
Other tangible fixed assets 30,683 23,746
Intangible fixed assets 196,386 192,130
Software 105,885 67,849
Leases 0 ––
Other intangible fixed assets 90,500 124,281
Reinsurance receivables 485 319
Other assets 822,252 726,955
Deferred tax assets 476,521 750,557
Customers’ liability for acceptances and guarantees 27,037 21,377
Allowance for doubtful accounts (17,569) (26,769)
Total assets 51,166,914 49,950,141
51 Nippon Life Insurance Company

(4) Consolidated Balance Sheets (Continued) (Million Yen)
As of March 31, 2012 As of March 31, 2011
Liabilities:
Policy reserves and other reserves: 45,778,374 44,502,877
Reserve for outstanding claims 208,643 250,324
Policy reserves 44,449,394 43,108,223
Reserve for dividends to policyholders 1,120,336 1,144,330
Reinsurance payables 360 326
Other liabilities 1,960,751 2,364,231
Accrued bonuses for directors and corporate auditors 53 57
Accrued severance indemnities 439,850 442,637
Accrued retirement benefits for directors and corporate auditors 4,681 5,215
Reserve for point cards 7,238 4,652
Accrued losses from supporting closely related companies 397 424
Reserve for loss on disaster 739 1,826
Reserve for price fluctuations in investments in securities 333,710 347,003
Deferred tax liabilities 50 51
Deferred tax liabilities for land revaluation 142,498 171,952
Acceptances and guarantees 27,037 21,377
Total liabilities 48,695,744 47,862,633
Net assets:
Foundation funds 300,000 250,000
Reserve for redemption of foundation funds 900,000 850,000
Reserve for revaluation 651 651
Consolidated surplus 379,311 380,448
Total equity 1,579,962 1,481,099
Net unrealized gains on available-for-sale securities, net of tax 1,022,171 745,362
Deferred (losses) gains on derivatives under hedge accounting (6,969) 6,832
Land revaluation differences (67,515) (89,985)
Cumulative translation adjustments (68,619) (67,197)
Total accumulated other comprehensive income 879,066 595,012
Minority interests 12,141 11,395
Total net assets 2,471,169 2,087,507
Total liabilities and net assets 51,166,914 49,950,141
52 Nippon Life Insurance Company
Basis of Presenting the Consolidated Balance Sheet as of March 31, 2012
1. Securities of the Parent Company (including items such as deposits and monetary receivables purchased treated
as securities based on the “Accounting Standards for Financial Instruments” (ASBJ Statement No. 10) and
securities within assets held in trust) are valued as follows:
(1) Trading securities are stated at market value on the balance sheet date. Moving average method is used
for calculating cost of sales.
(2) Held-to-maturity debt securities are valued using the moving average method, net of accumulated
amortization (straight-line).
(3) Policy-reserve-matching bonds are valued using the moving average method, net of accumulated
amortization (straight-line) in accordance with the Industry Audit Committee Report No. 21, “Temporary
Treatment of Accounting and Auditing Concerning Policy-Reserve-Matching Bonds in the Insurance
Industry,” issued by the JICPA.
(4) Investments in subsidiaries and affiliates that are not consolidated nor accounted for by the equity
method (stocks issued by subsidiaries prescribed in Article 2, Paragraph 12 of the Insurance Business Act
excluding subsidiaries prescribed in Article 13-5-2, Paragraph 3 of the Order for Enforcement of the
Insurance Business Act and stocks issued by affiliates prescribed in Article 13-5-2, Paragraph 4 of the
Order for Enforcement of the Insurance Business Act) are valued using the moving average method.
(5) Available-for-sale securities
1) For securities with a market value, stocks (including foreign stocks) are valued by using the
average market value during the period of one month before the balance sheet date (cost of sales is
calculated by using the moving average method). Other securities with a market value are valued
by using the market value on the balance sheet date (cost of sales is calculated by using the moving
average method).
2) For securities of which the market value is extremely difficult to determine, public and corporate
bonds (including foreign bonds) for which the difference between the purchase price and face
value is due to interest rate adjustment are valued using the moving average method, net of
accumulated amortization (straight-line). The others are valued at the gross moving average
amount.
Adjustments to market value, net of applicable taxes, are recorded in a separate component of net assets.
53 Nippon Life Insurance Company
2. Securities that are held for the purpose of matching the duration of outstanding liabilities within the sub-groups
(insurance type, remaining period, and investment policy) of insurance products, such as individual insurance
and annuities, workers’ asset-formation insurance and annuities, and group insurance and annuities are
classified as policy-reserve-matching bonds in accordance with the Industry Audit Committee Report No. 21,
“Temporary Treatment of Accounting and Auditing Concerning Policy-Reserve-Matching Bonds in the
Insurance Industry,” issued by the JICPA.
3. Derivative financial instruments are stated at market value.
4. (1) 1) Tangible fixed assets of the Parent Company (except for lease assets related to trading financial
leases where ownership is not transferred and buildings acquired on or after April 1, 1998) are
depreciated based on the declining balance method. Buildings acquired on or after April 1, 1998
are depreciated based on the straight-line method.
Tangible fixed assets of consolidated subsidiaries are depreciated based mainly on the straight-line
method.
2) Software, which is included within intangible fixed assets, is depreciated based on the straight-line
method.
3) The straight-line method based on lease period is used to calculate the depreciation of lease assets
related to trading financial leases where ownership is not transferred.
(2) The amount of accumulated depreciation of tangible fixed assets was ¥1,164,173 million as of March 31,
2012.
5. Revaluation of land used for operations of the Parent Company is performed based on the Act on Revaluation
of Land. The amount related to the valuation difference between the previous and the revalued amount is tax
effected and recognized as deferred tax liabilities for land revaluation within the liability section. The valuation
differences, excluding tax, are recognized as land revaluation differences within the net assets section.
Revaluation Date March 31, 2002
Revaluation Methodology The amount is rationally calculated by using the land listed value and
road rate as prescribed by Article 2, Items 1 and 4, respectively, of the
Order for Enforcement of the Act on Revaluation of Land.
6. Assets and liabilities denominated in foreign currencies are translated into Japanese yen using the “Accounting
Standards for Foreign Currency Transactions” (Business Accounting Council).
Foreign currency-denominated available-for-sale securities of the Parent Company, exchange rates of which
have significantly fluctuated and recovery in which is not expected, are converted to Japanese yen using either
54 Nippon Life Insurance Company
the rate on the balance sheet date or the average one month rate prior to the balance sheet date, whichever
indicates a weaker yen. This translation difference is recorded as a loss on valuation of securities.
7. (1) An allowance for doubtful accounts of the Parent Company is recognized in accordance with the
Company’s internal Asset Valuation Regulation and Write-Off/Provision Rule.
1) The allowance for loans receivable from borrowers who are legally or substantially bankrupt, such
as being bankrupt or being in the process of civil rehabilitation proceedings, is recognized based on
the amount of credit remaining after directly deducting amounts expected to be collected through
disposal of collateral or execution of guarantees from the balance of loans receivable (as
mentioned at (4) below).
2) The allowance for loans receivable from borrowers who are not currently legally bankrupt but have
a significant possibility of bankruptcy is recognized at the amounts deemed necessary considering
an assessment of the borrowers’ overall solvency and the amounts remaining after deduction of
amounts expected to be collected through the disposal of collateral or the execution of guarantees.
3) The allowance for loans receivable from borrowers other than the above is provided based on the
borrowers’ balance multiplied by the historical average (of a certain period) percentage of bad
debt.
(2) All credits of the Parent Company are assessed by responsible sections in accordance with the
Company’s internal Asset Valuation Regulation. The assessments are verified by the independent Asset
Auditing Dept. The results of the assessments are reflected in the calculation of the allowance for
doubtful accounts.
(3) For consolidated subsidiaries, the Parent Company allocates amounts deemed necessary in accordance
mainly with the Company’s internal Asset Valuation Regulation and Write-Off/Provision Rule.
(4) The amount of collateral value or the amount collectible by the execution of guarantees or other methods
directly subtracted from the balance of loans receivable is the estimated uncollectible amount for loans
(including loans with credits secured and/or guaranteed) made to legally or substantially bankrupt
borrowers. The estimated uncollectible amount was ¥2,668 million (including ¥1,761 million of credits
secured and/or guaranteed) as of March 31, 2012.
8. Accrued bonuses for directors and corporate auditors are recognized based on the amount estimated to be paid.
9. (1) Accrued severance indemnities of the Parent Company are recognized based on the estimated amount of
projected benefit obligations in excess of the market value of pension plan assets for future severance
payments to employees on the balance sheet date.
55 Nippon Life Insurance Company
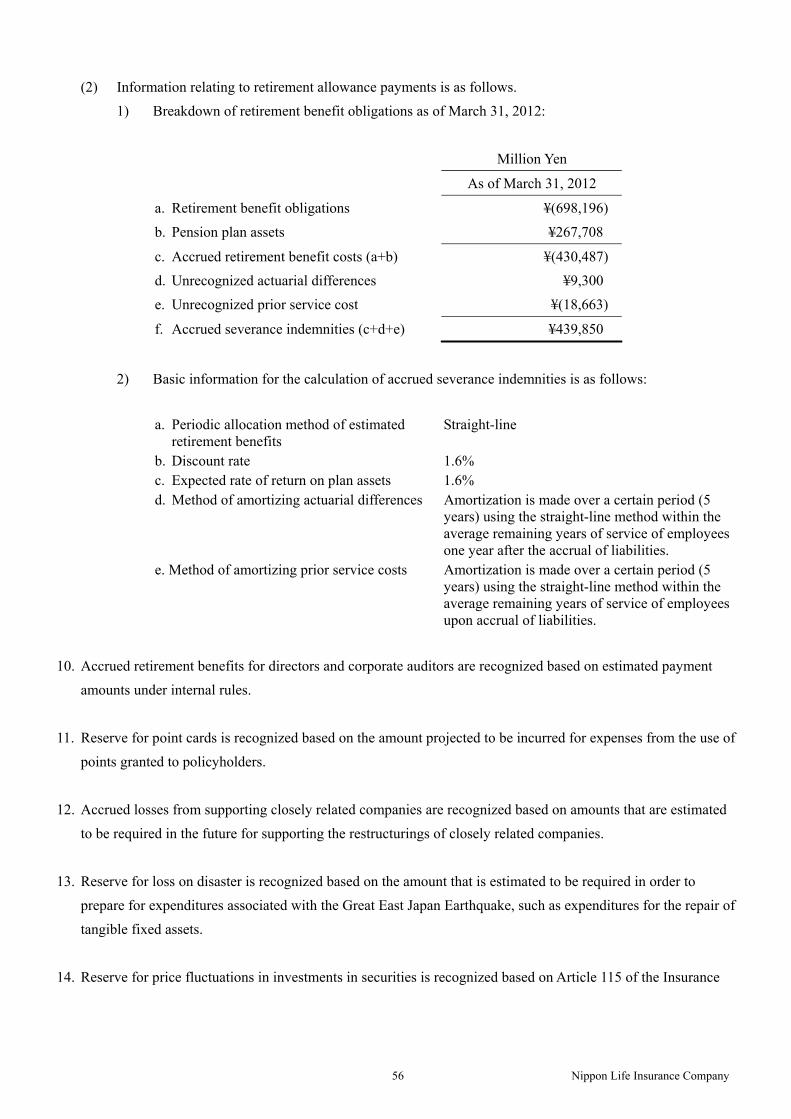
(2) Information relating to retirement allowance payments is as follows.
1) Breakdown of retirement benefit obligations as of March 31, 2012:
Million Yen
As of March 31, 2012
a. Retirement benefit obligations ¥(698,196)
b. Pension plan assets ¥267,708
c. Accrued retirement benefit costs (a+b) ¥(430,487)
d. Unrecognized actuarial differences ¥9,300
e. Unrecognized prior service cost ¥(18,663)
f. Accrued severance indemnities (c+d+e) ¥439,850
2) Basic information for the calculation of accrued severance indemnities is as follows:
a. Periodic allocation method of estimated retirement benefits
Straight-line
b. Discount rate 1.6% c. Expected rate of return on plan assets 1.6% d. Method of amortizing actuarial differences Amortization is made over a certain period (5
years) using the straight-line method within the average remaining years of service of employees one year after the accrual of liabilities.
e. Method of amortizing prior service costs Amortization is made over a certain period (5 years) using the straight-line method within the average remaining years of service of employees upon accrual of liabilities.
10. Accrued retirement benefits for directors and corporate auditors are recognized based on estimated payment
amounts under internal rules.
11. Reserve for point cards is recognized based on the amount projected to be incurred for expenses from the use of
points granted to policyholders.
12. Accrued losses from supporting closely related companies are recognized based on amounts that are estimated
to be required in the future for supporting the restructurings of closely related companies.
13. Reserve for loss on disaster is recognized based on the amount that is estimated to be required in order to
prepare for expenditures associated with the Great East Japan Earthquake, such as expenditures for the repair of
tangible fixed assets.
14. Reserve for price fluctuations in investments in securities is recognized based on Article 115 of the Insurance
56 Nippon Life Insurance Company
Business Act.
15. Accounting treatment for financial leases other than from the transfer of ownership is based on the
“Accounting Standards of Lease Transactions” (ASBJ Statement No. 13).
For financial leases where the Company is the lessee, and ownership is not transferred and the lease start date is
March 31, 2008 or prior, the accounting treatment applied is based on the method related to ordinary lease
transactions.
For financial leases where the Company is the lessor, and ownership is not transferred, the Parent Company
calculates the sales amount and cost of sales at the time of receiving the lease fee.
16. Hedge accounting of the Parent Company is applied based on the following method:
1) The Parent Company mainly applies the mark-to-market method of hedge accounting and deferred hedge
accounting for hedging activities against exposures to foreign exchange rate fluctuations on certain bonds
denominated in foreign currencies. The Parent Company also applies exceptional accounting treatment
(“Tokurei-shori”) for interest rate swaps to hedge cash flow volatility of certain loans receivable, and
applies designated hedge accounting (“Furiate-shori”) for foreign exchange forward contracts and
currency swaps for certain financial assets denominated in foreign currencies.
2) Effectiveness of hedging activities is mainly evaluated by performing a ratio analysis of market value
movement comparisons based on the hedging instruments and hedging methods taken, which is in
accordance with the Parent Company’s internal risk management policies.
17. Consumption taxes and local consumption taxes of the Parent Company are accounted for by using the tax
exclusion method. However, consumption taxes paid on certain asset transactions, which are not deductible
from consumption taxes withheld and that are stipulated to be deferred under the Consumption Tax Act, are
deferred as prepaid expenses and amortized over a 5 year period on a straight-line basis. Consumption taxes
other than deferred consumption taxes are recorded to expense as incurred as of March 31, 2012.
18. Policy reserves of the Parent Company are reserves set forth in accordance with Article 116 of the Insurance
Business Act. Policy reserves are recognized by performing a calculation based on the following methodology:
1) Reserves for contracts subject to the standard policy reserve are computed in accordance with the method
prescribed by the Prime Minister (Ordinance No. 48 issued by the Ministry of Finance in 1996).
2) Reserves for other contracts are computed based on the net level premium method.
In accordance with Article 69, Paragraph 5 of the Ordinance for Enforcement of the Insurance Business Act,
policy reserves include those that are reserved for a portion of the individual annuity policyholders.
19. The “Accounting Standard for Accounting Changes and Error Corrections” (ASBJ Statement No. 24), the
57 Nippon Life Insurance Company
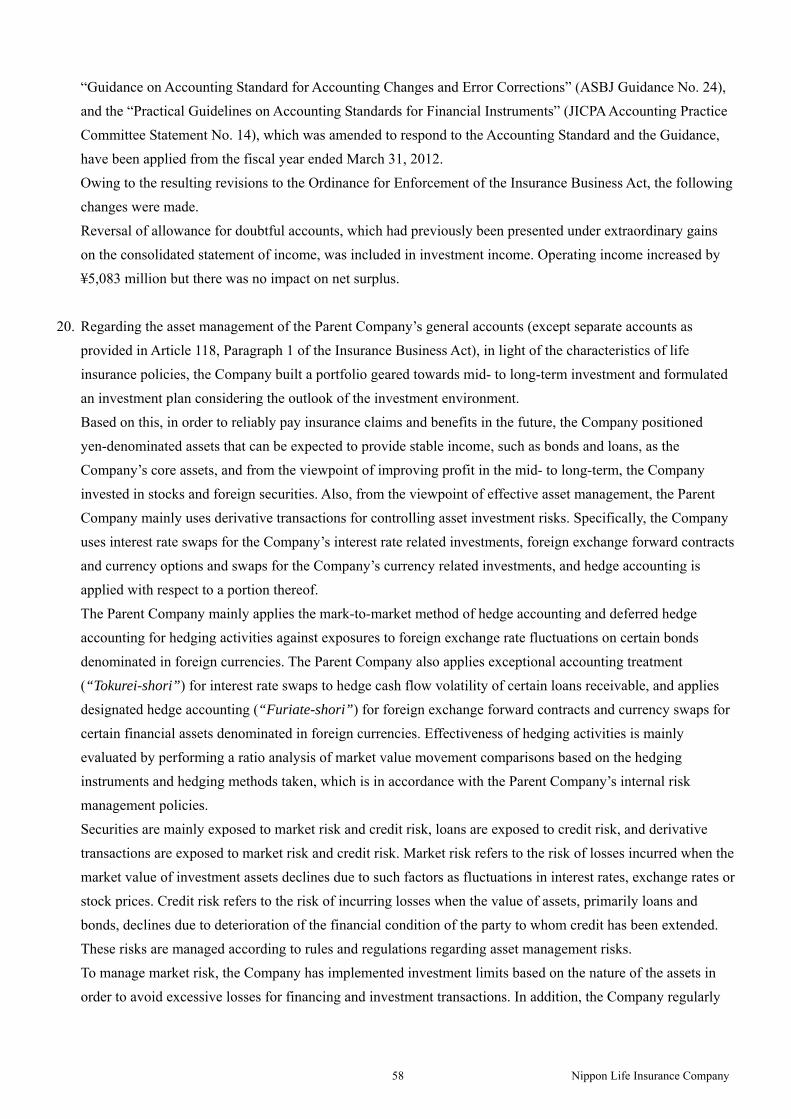
“Guidance on Accounting Standard for Accounting Changes and Error Corrections” (ASBJ Guidance No. 24),
and the “Practical Guidelines on Accounting Standards for Financial Instruments” (JICPA Accounting Practice
Committee Statement No. 14), which was amended to respond to the Accounting Standard and the Guidance,
have been applied from the fiscal year ended March 31, 2012.
Owing to the resulting revisions to the Ordinance for Enforcement of the Insurance Business Act, the following
changes were made.
Reversal of allowance for doubtful accounts, which had previously been presented under extraordinary gains
on the consolidated statement of income, was included in investment income. Operating income increased by
¥5,083 million but there was no impact on net surplus.
20. Regarding the asset management of the Parent Company’s general accounts (except separate accounts as
provided in Article 118, Paragraph 1 of the Insurance Business Act), in light of the characteristics of life
insurance policies, the Company built a portfolio geared towards mid- to long-term investment and formulated
an investment plan considering the outlook of the investment environment.
Based on this, in order to reliably pay insurance claims and benefits in the future, the Company positioned
yen-denominated assets that can be expected to provide stable income, such as bonds and loans, as the
Company’s core assets, and from the viewpoint of improving profit in the mid- to long-term, the Company
invested in stocks and foreign securities. Also, from the viewpoint of effective asset management, the Parent
Company mainly uses derivative transactions for controlling asset investment risks. Specifically, the Company
uses interest rate swaps for the Company’s interest rate related investments, foreign exchange forward contracts
and currency options and swaps for the Company’s currency related investments, and hedge accounting is
applied with respect to a portion thereof.
The Parent Company mainly applies the mark-to-market method of hedge accounting and deferred hedge
accounting for hedging activities against exposures to foreign exchange rate fluctuations on certain bonds
denominated in foreign currencies. The Parent Company also applies exceptional accounting treatment
(“Tokurei-shori”) for interest rate swaps to hedge cash flow volatility of certain loans receivable, and applies
designated hedge accounting (“Furiate-shori”) for foreign exchange forward contracts and currency swaps for
certain financial assets denominated in foreign currencies. Effectiveness of hedging activities is mainly
evaluated by performing a ratio analysis of market value movement comparisons based on the hedging
instruments and hedging methods taken, which is in accordance with the Parent Company’s internal risk
management policies.
Securities are mainly exposed to market risk and credit risk, loans are exposed to credit risk, and derivative
transactions are exposed to market risk and credit risk. Market risk refers to the risk of losses incurred when the
market value of investment assets declines due to such factors as fluctuations in interest rates, exchange rates or
stock prices. Credit risk refers to the risk of incurring losses when the value of assets, primarily loans and
bonds, declines due to deterioration of the financial condition of the party to whom credit has been extended.
These risks are managed according to rules and regulations regarding asset management risks.
To manage market risk, the Company has implemented investment limits based on the nature of the assets in
order to avoid excessive losses for financing and investment transactions. In addition, the Company regularly
58 Nippon Life Insurance Company
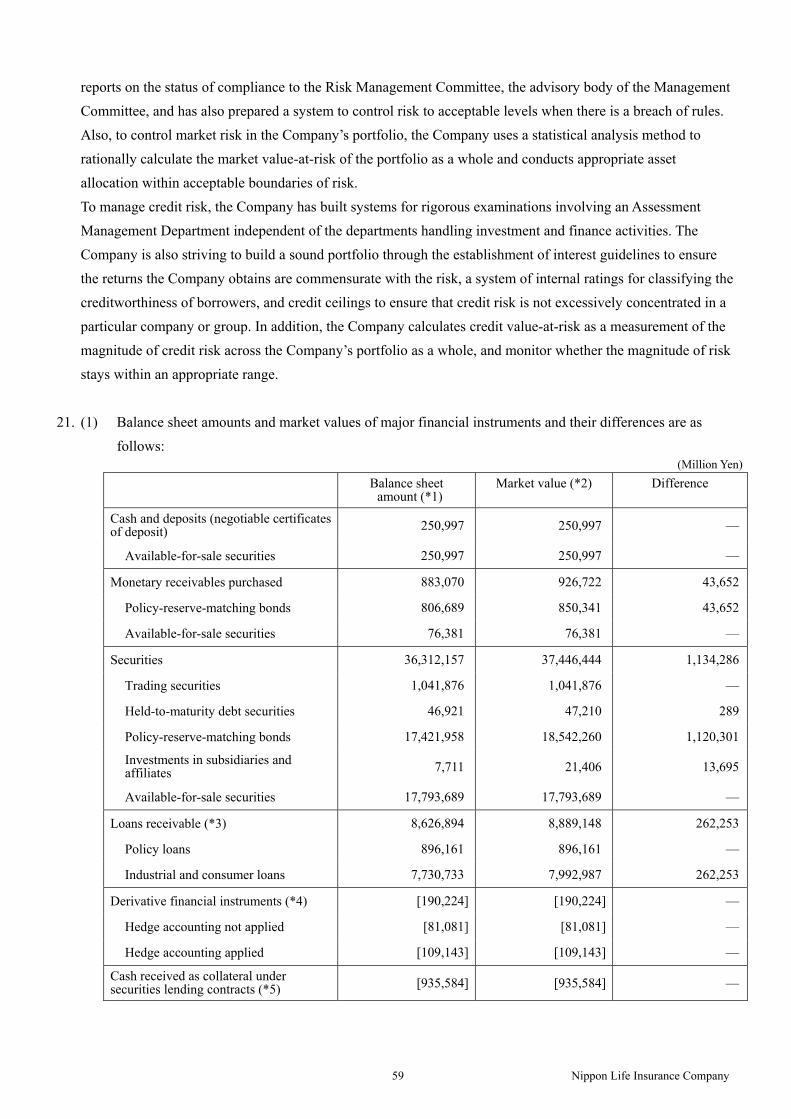
reports on the status of compliance to the Risk Management Committee, the advisory body of the Management
Committee, and has also prepared a system to control risk to acceptable levels when there is a breach of rules.
Also, to control market risk in the Company’s portfolio, the Company uses a statistical analysis method to
rationally calculate the market value-at-risk of the portfolio as a whole and conducts appropriate asset
allocation within acceptable boundaries of risk.
To manage credit risk, the Company has built systems for rigorous examinations involving an Assessment
Management Department independent of the departments handling investment and finance activities. The
Company is also striving to build a sound portfolio through the establishment of interest guidelines to ensure
the returns the Company obtains are commensurate with the risk, a system of internal ratings for classifying the
creditworthiness of borrowers, and credit ceilings to ensure that credit risk is not excessively concentrated in a
particular company or group. In addition, the Company calculates credit value-at-risk as a measurement of the
magnitude of credit risk across the Company’s portfolio as a whole, and monitor whether the magnitude of risk
stays within an appropriate range.
21. (1) Balance sheet amounts and market values of major financial instruments and their differences are as
follows: (Million Yen)
Balance sheet amount (*1)
Market value (*2) Difference
Cash and deposits (negotiable certificates of deposit) 250,997 250,997 ––
Available-for-sale securities 250,997 250,997 ––
Monetary receivables purchased 883,070 926,722 43,652
Policy-reserve-matching bonds 806,689 850,341 43,652
Available-for-sale securities 76,381 76,381 ––
Securities 36,312,157 37,446,444 1,134,286
Trading securities 1,041,876 1,041,876 ––
Held-to-maturity debt securities 46,921 47,210 289
Policy-reserve-matching bonds 17,421,958 18,542,260 1,120,301
Investments in subsidiaries and affiliates 7,711 21,406 13,695
Available-for-sale securities 17,793,689 17,793,689 ––
Loans receivable (*3) 8,626,894 8,889,148 262,253
Policy loans 896,161 896,161 ––
Industrial and consumer loans 7,730,733 7,992,987 262,253
Derivative financial instruments (*4) [190,224] [190,224] ––
Hedge accounting not applied [81,081] [81,081] ––
Hedge accounting applied [109,143] [109,143] ––
Cash received as collateral under securities lending contracts (*5) [935,584] [935,584] ––
59 Nippon Life Insurance Company
(*1) For transactions for which an allowance for doubtful accounts was recorded, the amount of the
allowance is deducted.
(*2) For securities for which impairment losses were recognized in the fiscal year ended March 31, 2012,
the market value is the balance sheet amount after the impairment losses are deducted.
(*3) The market values of derivative financial instruments that are interest rate swaps under exceptional
accounting treatment (“Tokurei-shori”) or currency swaps under designated hedge accounting
(“Furiate-shori”) are included in the market values of loans receivable because they are accounted
for as an integral part of loans receivable which are hedged items.
(*4) Assets and liabilities generated by derivative financial instruments are offset and presented net. Net
liabilities in total are presented in brackets.
(*5) Cash received as collateral under securities lending contracts is recorded in liabilities and presented
in brackets.
(2) Market value measurement methods for the Parent Company’s major financial instruments are as follows:
1) Securities, deposits, and monetary receivables purchased treated as securities based on the
“Accounting Standards for Financial Instruments” (ASBJ Statement No. 10)
a. Items with a market price
Market value is measured based on the closing market price on the balance sheet date. However,
the market values of available-for-sale domestic and foreign equity securities are based on the
average market price over a one-month period prior to the balance sheet date.
b. Items without a market price
Market value is measured mainly by discounting future cash flows to the present value.
2) Loans receivable
a. Policy loans
Market value is deemed to approximate book value, due to no repayment deadlines based on
characteristics such as limiting loans to the surrender benefit range, and expected
reimbursement period and interest rate requirements, etc. Thus, the book value is used as the
market value of the policy loans.
b. Industrial and consumer loans
Market value of variable interest rate loans is deemed to approximate book value, because
market interest rates are reflected in future cash flows over the short term. Thus, the book value
is used as the market value of the variable interest rate loans.
Market value of fixed interest rate loans is measured mainly by discounting future cash flows to
the present value.
Loans receivable from legally or substantially bankrupt borrowers or borrowers who are not
currently legally bankrupt but have a high probability of bankruptcy are measured by deducting
the estimated uncollectable amount from the book value directly prior to the decrease.
60 Nippon Life Insurance Company
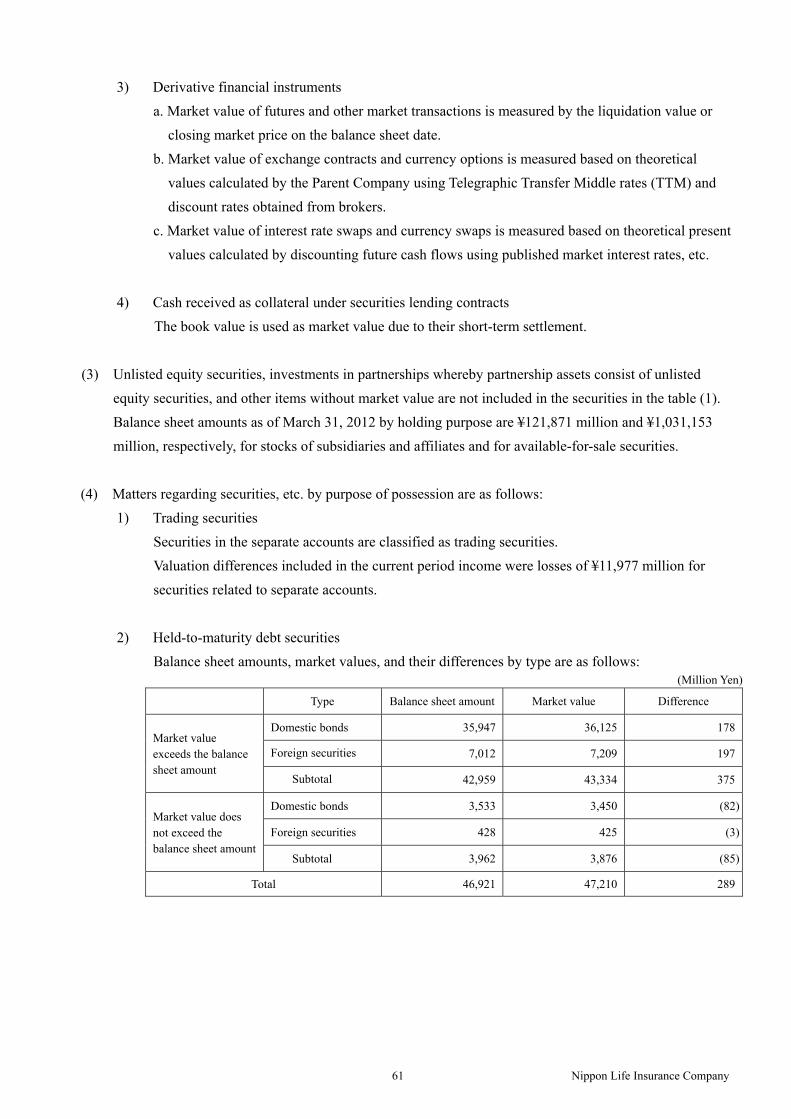
3) Derivative financial instruments
a. Market value of futures and other market transactions is measured by the liquidation value or
closing market price on the balance sheet date.
b. Market value of exchange contracts and currency options is measured based on theoretical
values calculated by the Parent Company using Telegraphic Transfer Middle rates (TTM) and
discount rates obtained from brokers.
c. Market value of interest rate swaps and currency swaps is measured based on theoretical present
values calculated by discounting future cash flows using published market interest rates, etc.
4) Cash received as collateral under securities lending contracts
The book value is used as market value due to their short-term settlement.
(3) Unlisted equity securities, investments in partnerships whereby partnership assets consist of unlisted
equity securities, and other items without market value are not included in the securities in the table (1).
Balance sheet amounts as of March 31, 2012 by holding purpose are ¥121,871 million and ¥1,031,153
million, respectively, for stocks of subsidiaries and affiliates and for available-for-sale securities.
(4) Matters regarding securities, etc. by purpose of possession are as follows:
1) Trading securities
Securities in the separate accounts are classified as trading securities.
Valuation differences included in the current period income were losses of ¥11,977 million for
securities related to separate accounts.
2) Held-to-maturity debt securities
Balance sheet amounts, market values, and their differences by type are as follows: (Million Yen)
Type Balance sheet amount Market value Difference
Domestic bonds 35,947 36,125 178
Foreign securities 7,012 7,209 197 Market value exceeds the balance sheet amount
Subtotal 42,959 43,334 375
Domestic bonds 3,533 3,450 (82)
Foreign securities 428 425 (3)Market value does not exceed the balance sheet amount
Subtotal 3,962 3,876 (85)
Total 46,921 47,210 289
61 Nippon Life Insurance Company

3) Policy-reserve-matching bonds
Balance sheet amounts, market values, and their differences by type are as follows: (Million Yen)
Type Balance sheet amount Market value Difference
Monetary receivables purchased
748,842 792,984 44,141
Domestic bonds 17,108,566 18,250,757 1,142,191
Foreign securities 68,973 71,780 2,806
Market value exceeds the balance sheet amount
Subtotal 17,926,383 19,115,522 1,189,139
Monetary receivables purchased
57,846 57,357 (488)
Domestic bonds 231,192 206,831 (24,360)
Foreign securities 13,226 12,890 (336)
Market value does not exceed the balance sheet amount
Subtotal 302,265 277,079 (25,185)
Total 18,228,648 19,392,601 1,163,953
62 Nippon Life Insurance Company
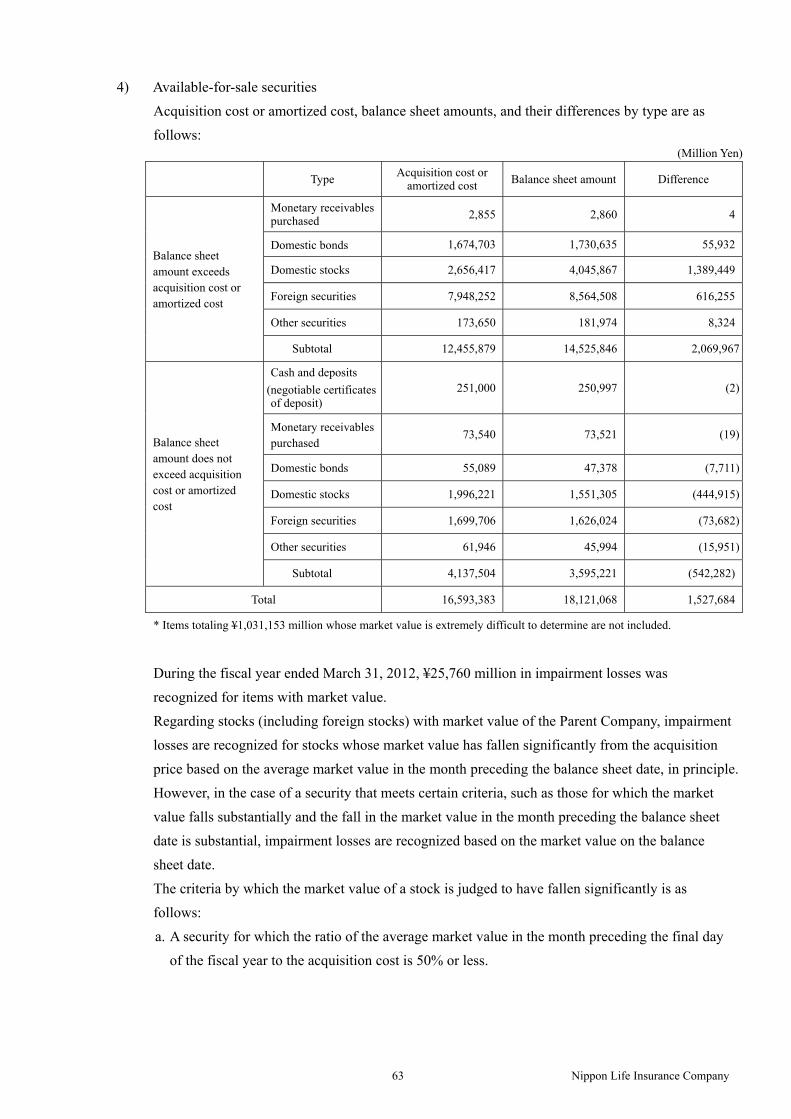
4) Available-for-sale securities
Acquisition cost or amortized cost, balance sheet amounts, and their differences by type are as
follows: (Million Yen)
Type Acquisition cost or
amortized cost Balance sheet amount Difference
Monetary receivables purchased 2,855 2,860 4
Domestic bonds 1,674,703 1,730,635 55,932
Domestic stocks 2,656,417 4,045,867 1,389,449
Foreign securities 7,948,252 8,564,508 616,255
Other securities 173,650 181,974 8,324
Balance sheet amount exceeds acquisition cost or amortized cost
Subtotal 12,455,879 14,525,846 2,069,967
Cash and deposits
(negotiable certificates of deposit)
251,000 250,997 (2)
Monetary receivables purchased
73,540 73,521 (19)
Domestic bonds 55,089 47,378 (7,711)
Domestic stocks 1,996,221 1,551,305 (444,915)
Foreign securities 1,699,706 1,626,024 (73,682)
Other securities 61,946 45,994 (15,951)
Balance sheet amount does not exceed acquisition cost or amortized cost
Subtotal 4,137,504 3,595,221 (542,282)
Total 16,593,383 18,121,068 1,527,684
* Items totaling ¥1,031,153 million whose market value is extremely difficult to determine are not included.
During the fiscal year ended March 31, 2012, ¥25,760 million in impairment losses was
recognized for items with market value.
Regarding stocks (including foreign stocks) with market value of the Parent Company, impairment
losses are recognized for stocks whose market value has fallen significantly from the acquisition
price based on the average market value in the month preceding the balance sheet date, in principle.
However, in the case of a security that meets certain criteria, such as those for which the market
value falls substantially and the fall in the market value in the month preceding the balance sheet
date is substantial, impairment losses are recognized based on the market value on the balance
sheet date.
The criteria by which the market value of a stock is judged to have fallen significantly is as
follows:
a. A security for which the ratio of the average market value in the month preceding the final day
of the fiscal year to the acquisition cost is 50% or less.
63 Nippon Life Insurance Company
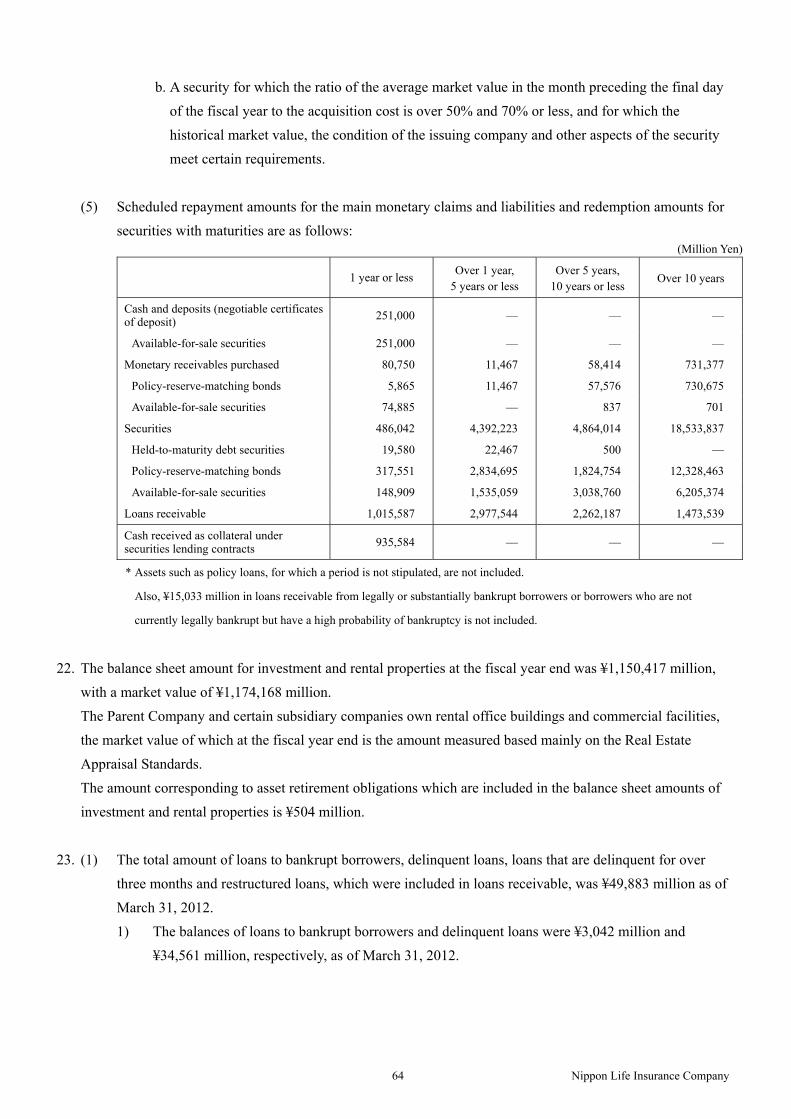
b. A security for which the ratio of the average market value in the month preceding the final day
of the fiscal year to the acquisition cost is over 50% and 70% or less, and for which the
historical market value, the condition of the issuing company and other aspects of the security
meet certain requirements.
(5) Scheduled repayment amounts for the main monetary claims and liabilities and redemption amounts for
securities with maturities are as follows: (Million Yen)
1 year or less Over 1 year,
5 years or less Over 5 years,
10 years or less Over 10 years
Cash and deposits (negotiable certificates of deposit) 251,000 –– –– ––
Available-for-sale securities 251,000 –– –– ––
Monetary receivables purchased 80,750 11,467 58,414 731,377
Policy-reserve-matching bonds 5,865 11,467 57,576 730,675
Available-for-sale securities 74,885 –– 837 701
Securities 486,042 4,392,223 4,864,014 18,533,837
Held-to-maturity debt securities 19,580 22,467 500 ––
Policy-reserve-matching bonds 317,551 2,834,695 1,824,754 12,328,463
Available-for-sale securities 148,909 1,535,059 3,038,760 6,205,374
Loans receivable 1,015,587 2,977,544 2,262,187 1,473,539
Cash received as collateral under securities lending contracts 935,584 –– –– ––
* Assets such as policy loans, for which a period is not stipulated, are not included.
Also, ¥15,033 million in loans receivable from legally or substantially bankrupt borrowers or borrowers who are not
currently legally bankrupt but have a high probability of bankruptcy is not included.
22. The balance sheet amount for investment and rental properties at the fiscal year end was ¥1,150,417 million,
with a market value of ¥1,174,168 million.
The Parent Company and certain subsidiary companies own rental office buildings and commercial facilities,
the market value of which at the fiscal year end is the amount measured based mainly on the Real Estate
Appraisal Standards.
The amount corresponding to asset retirement obligations which are included in the balance sheet amounts of
investment and rental properties is ¥504 million.
23. (1) The total amount of loans to bankrupt borrowers, delinquent loans, loans that are delinquent for over
three months and restructured loans, which were included in loans receivable, was ¥49,883 million as of
March 31, 2012.
1) The balances of loans to bankrupt borrowers and delinquent loans were ¥3,042 million and
¥34,561 million, respectively, as of March 31, 2012.
64 Nippon Life Insurance Company
Loans to bankrupt borrowers are loans for which interest is not accrued as income, except for a
portion of loans written off, and to which any event specified in Article 96, Paragraph 1, Item 3 (a)
to (e) or Item 4 of the Order for Enforcement of the Corporation Tax Act has occurred. Interest is
not accrued as income for the loans since the recovery of principal or interest on the loans is
unlikely due to the fact that principal repayments and interest payments are overdue for a
significant period of time or for other reasons.
Delinquent loans are loans with interest not accrued and exclude loans to bankrupt borrowers and
loans with interest payments extended with the objective of restructuring or supporting the
borrowers.
2) There were no loans delinquent for over three months as of March 31, 2012.
Loans that are delinquent for over three months are loans with principal or interest unpaid for over
three months beginning one day after the due date based on the loan agreement. These loans
exclude loans classified as loans to bankrupt borrowers and delinquent loans.
3) The balance of restructured loans was ¥12,278 million as of March 31, 2012.
Restructured loans are loans that provide certain concessions favorable to borrowers with the intent
of supporting the borrowers’ restructuring, such as by reducing or exempting interest, postponing
principal or interest payments, releasing credits, or providing other benefits to the borrowers.
These loans exclude loans classified as loans to bankrupt borrowers, delinquent loans, and loans
delinquent for over three months.
(2) Direct write-offs of loans receivable decreased the balances of loans to bankrupt borrowers and
delinquent loans by ¥808 million and ¥1,860 million, respectively, as of March 31, 2012.
24. Separate account assets as provided for in Article 118, Paragraph 1 of the Insurance Business Act were
¥1,146,686 million as of March 31, 2012 and are presented with a corresponding liability recorded for the same
amount.
65 Nippon Life Insurance Company

25. Changes in the reserve for dividends to policyholders included in policy reserves for the fiscal year ended
March 31, 2012 were as follows:
Million Yen
As of March 31, 2012
a. Balance at the beginning of the current fiscal year ¥1,144,330
b. Transfer to reserve from surplus in the previous fiscal year ¥175,513
c. Dividends to policyholders paid out in the current fiscal year ¥226,595
d. Increase in interest ¥27,087
e. Balance at the end of the current fiscal year (a+b-c+d) ¥1,120,336
26. Assets pledged as collateral by securities, leases, land, and buildings as of March 31, 2012 were ¥1,260,121
million, ¥6,755 million, ¥2,952 million, and ¥274 million, respectively. The total amount of loans covered by
the aforementioned assets was ¥951,867 million as of March 31, 2012.
These amounts included ¥1,083,818 million of securities deposited and ¥946,476 million of cash received as
collateral, under the securities lending contracts secured by cash, as of March 31, 2012.
27. ¥100,000 million of foundation funds were offered according to Article 60 of the Insurance Business Act
during the fiscal year ended March 31, 2012.
In addition, a resolution was made at the meeting of the Board of Directors on May 23, 2012, to make a
proposal to the Meeting of Representatives to be held on July 3 to change a part of the Articles of Incorporation
to allow an offering of ¥50,000 million of foundation funds during the fiscal year ending March 31, 2013.
28. The Company redeemed ¥50,000 million of foundation funds and credited the same amount to reserve for
redemption of foundation funds prescribed in Article 56 of the Insurance Business Act as of March 31, 2012.
29. The total amount of stocks and investments in non-consolidated subsidiaries and affiliates was ¥129,583
million as of March 31, 2012.
On March 22, 2012, the Company reached an agreement with Reliance Capital Limited, which is the parent
company of Reliance Capital Asset Management Limited, an affiliate of the Reliance Group, on the Company’s
acquisition of 26% of the shares of Reliance Capital Asset Management Limited.
30. The amount of securities lent under lending agreements was ¥2,816,579 million as of March 31, 2012.
31. Assets that can be sold or re-secured are marketable securities lent under lending agreements. These assets
were being held without disposal totaling ¥709,179 million at market value as of March 31, 2012.
66 Nippon Life Insurance Company
32. The amount of commitments related to loans receivable and loans outstanding was ¥67,988 million as of
March 31, 2012.
33. Of the maximum borrowing amount from the Life Insurance Policyholders Protection Corporation of Japan,
which is provided for in Article 37-4 of the Order for Enforcement of the Insurance Business Act, the amount
applied to the Parent Company is estimated to be ¥84,947 million as of March 31, 2012.
The amount contributed to the said corporation is recorded within operating expenses.
34. (1) Total deferred tax assets were ¥1,093,007 million and total deferred tax liabilities were ¥534,997 million
as of March 31, 2012. Among deferred tax assets, the deduction for the valuation allowance was ¥81,538
million. The major components causing deferred tax assets were policy reserves of ¥712,417 million,
accrued severance indemnities of ¥137,252 million, reserve for price fluctuations in investments in
securities of ¥106,193 million, and allowance for doubtful accounts of ¥6,618 million. The major
component causing deferred tax liabilities was net unrealized gains on available-for-sale securities of
¥494,953 million.
(2) The statutory tax rate was 36.1% for the fiscal year ended March 31, 2012. The main factors in the
difference between the statutory tax rate and the effective income tax rate were a decrease of 12.6% due
to the amount of reserve for dividends to policyholders and an impact of 31.0% from a change in the tax
rate.
(3) In line with the promulgation of the “Act for Partial Revision of the Income Tax Act, etc. for the Purpose
of Creating Taxation System Responding to Changes in Economic and Social Structures” (Act No. 114 of
2011) and the “Act on Special Measures for Securing Financial Resources Necessary to Implement
Measures for Reconstruction following the Great East Japan Earthquake” (Act No. 117 of 2011), the
statutory tax rate applied to measure deferred tax assets and liabilities was changed from 36.1%. For
items that are expected to be collected or paid during the period from April 1, 2012 to March 31, 2015,
the rate was changed to 33.2%, and for items that are expected to be collected or paid on or after April 1,
2015, the rate was changed to 30.7%.
As a result of this change, as of March 31, 2012, deferred tax assets and deferred tax liabilities for land
revaluation decreased by ¥61,556 million and ¥25,001 million, respectively, net unrealized gains on
available-for-sale securities and land revaluation differences increased by ¥87,324 million and ¥25,001
million, respectively, and income tax - deferred increased by ¥148,332 million.
67 Nippon Life Insurance Company
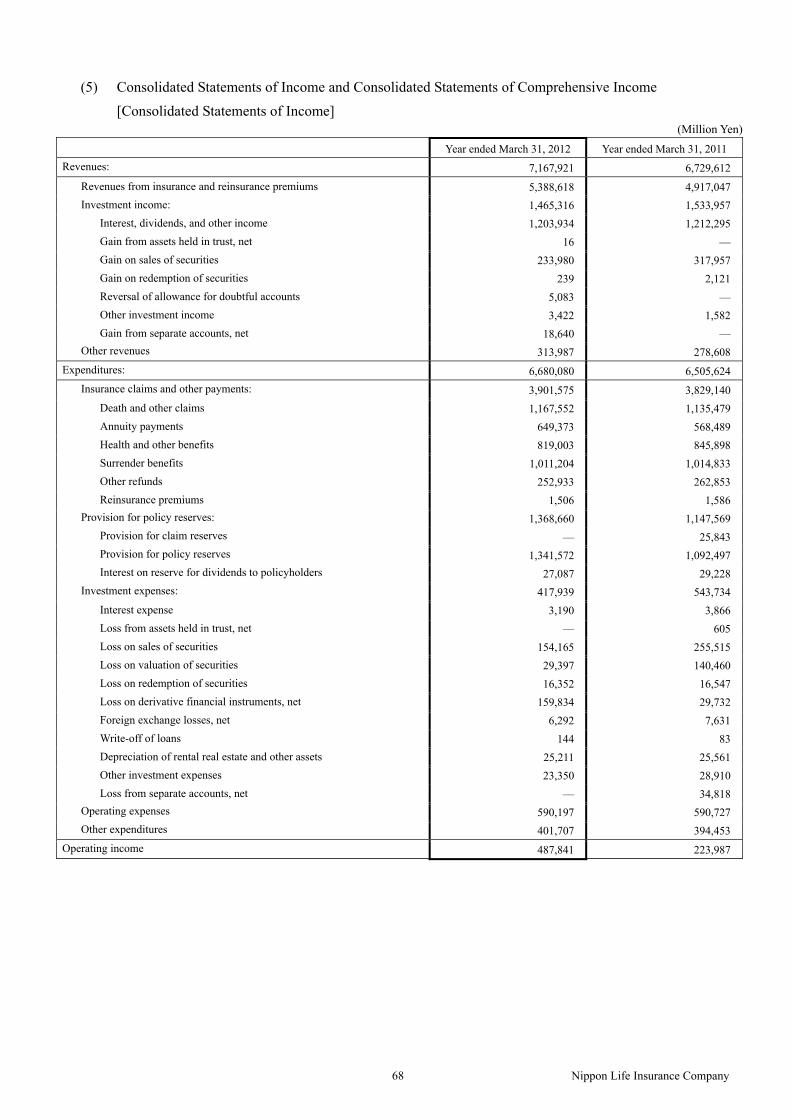
(5) Consolidated Statements of Income and Consolidated Statements of Comprehensive Income
[Consolidated Statements of Income] (Million Yen)
Year ended March 31, 2012 Year ended March 31, 2011
Revenues: 7,167,921 6,729,612
Revenues from insurance and reinsurance premiums 5,388,618 4,917,047
Investment income: 1,465,316 1,533,957
Interest, dividends, and other income 1,203,934 1,212,295
Gain from assets held in trust, net 16 ––
Gain on sales of securities 233,980 317,957
Gain on redemption of securities 239 2,121
Reversal of allowance for doubtful accounts 5,083 ––
Other investment income 3,422 1,582
Gain from separate accounts, net 18,640 ––
Other revenues 313,987 278,608
Expenditures: 6,680,080 6,505,624
Insurance claims and other payments: 3,901,575 3,829,140
Death and other claims 1,167,552 1,135,479
Annuity payments 649,373 568,489
Health and other benefits 819,003 845,898
Surrender benefits 1,011,204 1,014,833
Other refunds 252,933 262,853
Reinsurance premiums 1,506 1,586
Provision for policy reserves: 1,368,660 1,147,569
Provision for claim reserves –– 25,843
Provision for policy reserves 1,341,572 1,092,497
Interest on reserve for dividends to policyholders 27,087 29,228
Investment expenses: 417,939 543,734
Interest expense 3,190 3,866
Loss from assets held in trust, net –– 605
Loss on sales of securities 154,165 255,515
Loss on valuation of securities 29,397 140,460
Loss on redemption of securities 16,352 16,547
Loss on derivative financial instruments, net 159,834 29,732
Foreign exchange losses, net 6,292 7,631
Write-off of loans 144 83
Depreciation of rental real estate and other assets 25,211 25,561
Other investment expenses 23,350 28,910
Loss from separate accounts, net –– 34,818
Operating expenses 590,197 590,727
Other expenditures 401,707 394,453
Operating income 487,841 223,987
68 Nippon Life Insurance Company
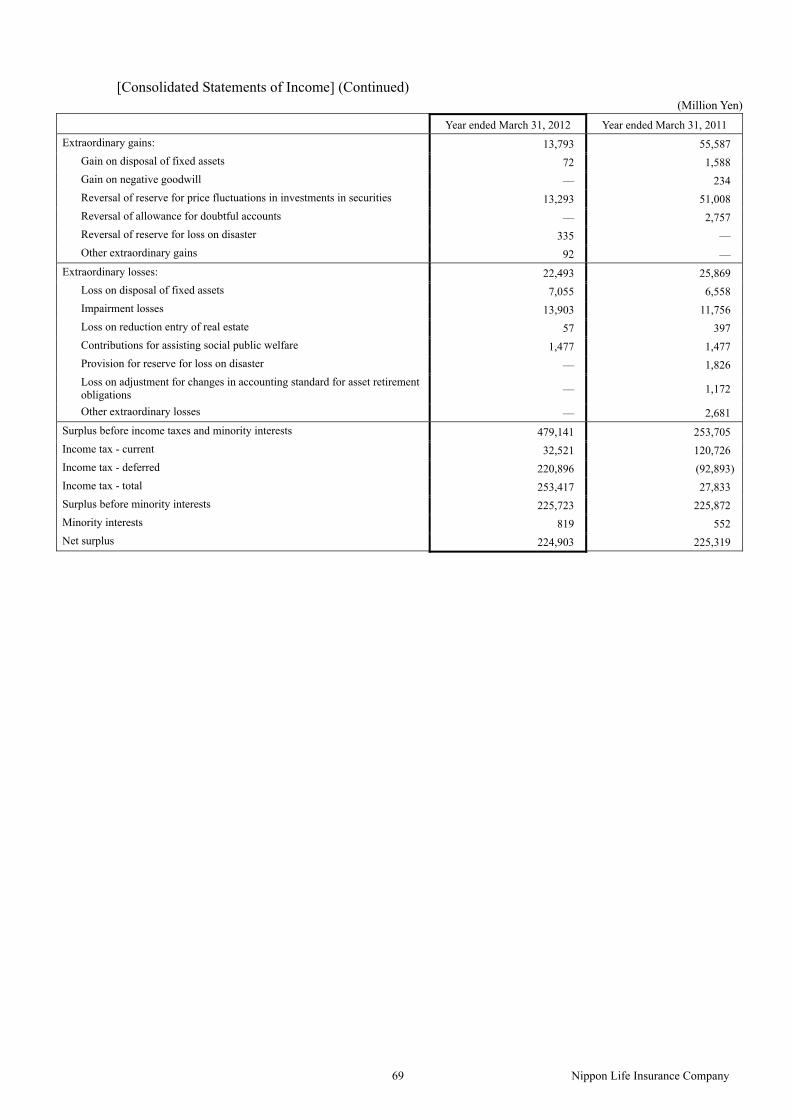
[Consolidated Statements of Income] (Continued) (Million Yen)
Year ended March 31, 2012 Year ended March 31, 2011
Extraordinary gains: 13,793 55,587
Gain on disposal of fixed assets 72 1,588
Gain on negative goodwill –– 234
Reversal of reserve for price fluctuations in investments in securities 13,293 51,008
Reversal of allowance for doubtful accounts –– 2,757
Reversal of reserve for loss on disaster 335 ––
Other extraordinary gains 92 ––
Extraordinary losses: 22,493 25,869
Loss on disposal of fixed assets 7,055 6,558
Impairment losses 13,903 11,756
Loss on reduction entry of real estate 57 397
Contributions for assisting social public welfare 1,477 1,477
Provision for reserve for loss on disaster –– 1,826
Loss on adjustment for changes in accounting standard for asset retirement obligations –– 1,172
Other extraordinary losses –– 2,681
Surplus before income taxes and minority interests 479,141 253,705
Income tax - current 32,521 120,726
Income tax - deferred 220,896 (92,893)
Income tax - total 253,417 27,833
Surplus before minority interests 225,723 225,872
Minority interests 819 552
Net surplus 224,903 225,319
69 Nippon Life Insurance Company
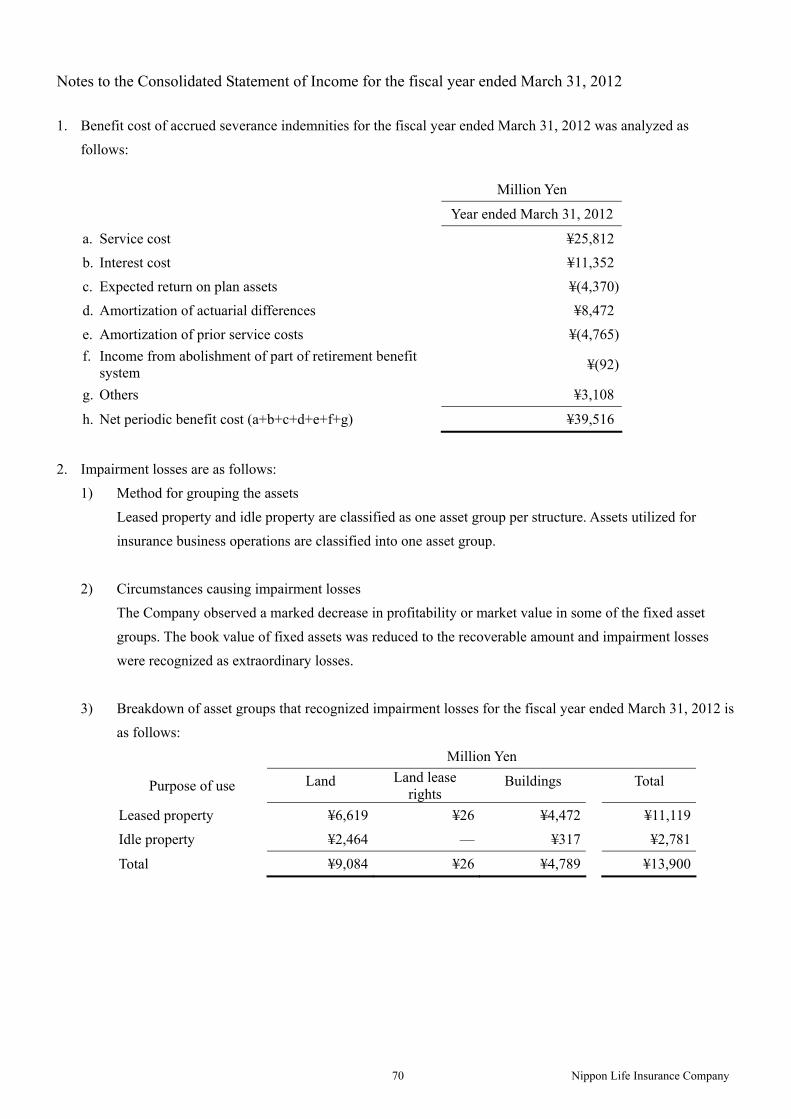
Notes to the Consolidated Statement of Income for the fiscal year ended March 31, 2012
1. Benefit cost of accrued severance indemnities for the fiscal year ended March 31, 2012 was analyzed as
follows:
Million Yen
Year ended March 31, 2012
a. Service cost ¥25,812
b. Interest cost ¥11,352
c. Expected return on plan assets ¥(4,370)
d. Amortization of actuarial differences ¥8,472
e. Amortization of prior service costs ¥(4,765)
f. Income from abolishment of part of retirement benefit system
¥(92)
g. Others ¥3,108
h. Net periodic benefit cost (a+b+c+d+e+f+g) ¥39,516
2. Impairment losses are as follows:
1) Method for grouping the assets
Leased property and idle property are classified as one asset group per structure. Assets utilized for
insurance business operations are classified into one asset group.
2) Circumstances causing impairment losses
The Company observed a marked decrease in profitability or market value in some of the fixed asset
groups. The book value of fixed assets was reduced to the recoverable amount and impairment losses
were recognized as extraordinary losses.
3) Breakdown of asset groups that recognized impairment losses for the fiscal year ended March 31, 2012 is
as follows:
Million Yen
Purpose of use Land Land lease rights
Buildings Total
Leased property ¥6,619 ¥26 ¥4,472 ¥11,119
Idle property ¥2,464 –– ¥317 ¥2,781
Total ¥9,084 ¥26 ¥4,789 ¥13,900
70 Nippon Life Insurance Company
4) Calculation method of recoverable amount
The recoverable amount used for the measurement of impairment losses is based on the net realizable
value upon sales of the assets or the discounted future cash flows.
The discount rate used in the calculation of future cash flows is in principle 4.0%. Net realizable values
are determined based on appraisals performed in accordance with the Real Estate Appraisal Standards or
posted land prices.
71 Nippon Life Insurance Company
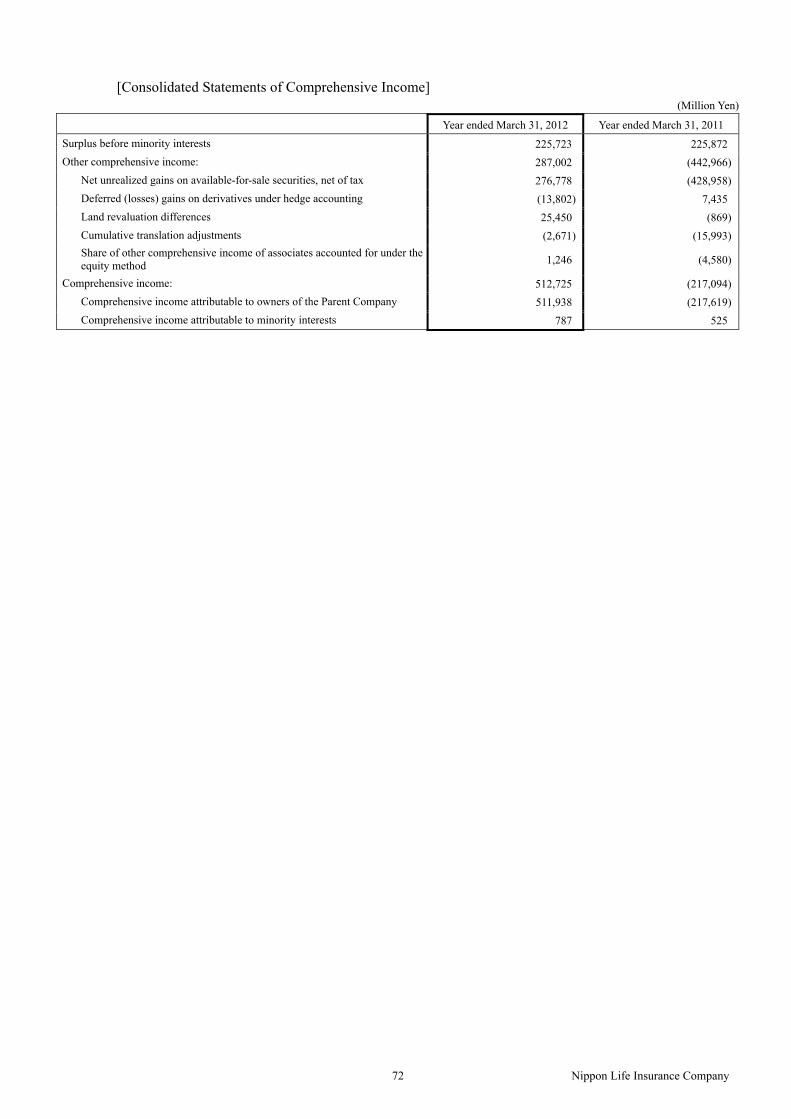
[Consolidated Statements of Comprehensive Income] (Million Yen)
Year ended March 31, 2012 Year ended March 31, 2011
Surplus before minority interests 225,723 225,872
Other comprehensive income: 287,002 (442,966)
Net unrealized gains on available-for-sale securities, net of tax 276,778 (428,958)
Deferred (losses) gains on derivatives under hedge accounting (13,802) 7,435
Land revaluation differences 25,450 (869)
Cumulative translation adjustments (2,671) (15,993)
Share of other comprehensive income of associates accounted for under the equity method 1,246 (4,580)
Comprehensive income: 512,725 (217,094)
Comprehensive income attributable to owners of the Parent Company 511,938 (217,619)
Comprehensive income attributable to minority interests 787 525
72 Nippon Life Insurance Company
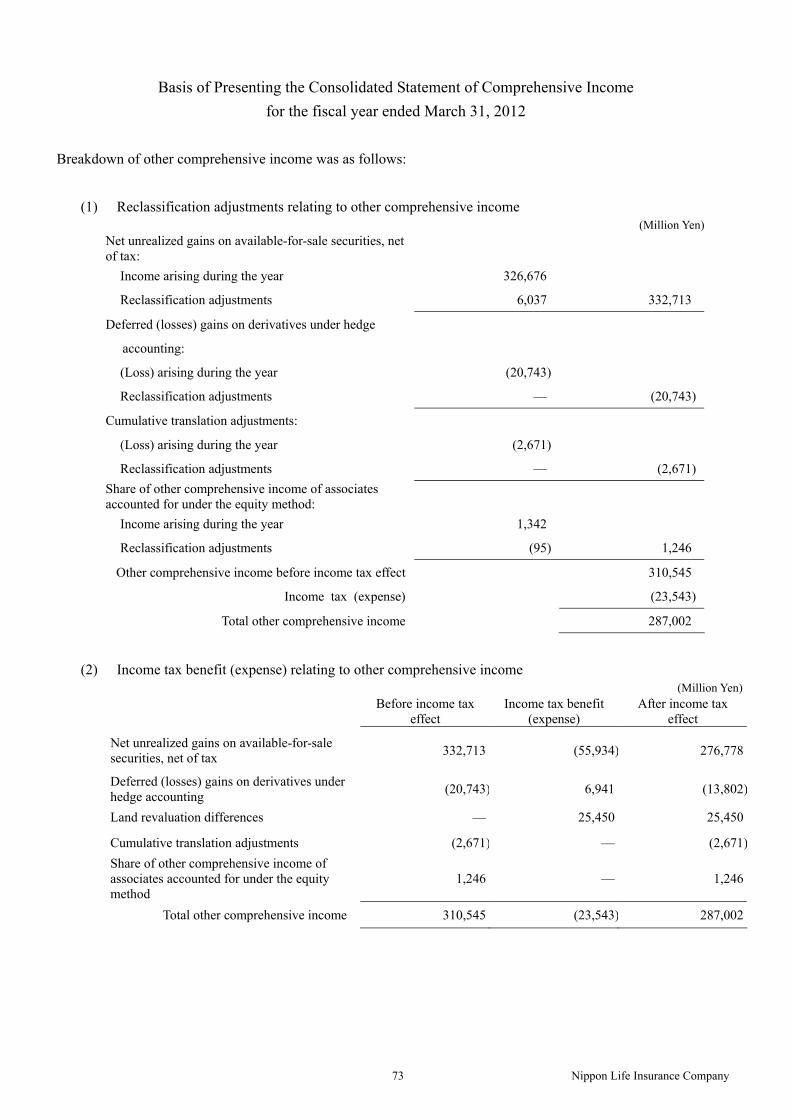
Basis of Presenting the Consolidated Statement of Comprehensive Income
for the fiscal year ended March 31, 2012
Breakdown of other comprehensive income was as follows:
(1) Reclassification adjustments relating to other comprehensive income (Million Yen)
Net unrealized gains on available-for-sale securities, net of tax:
Income arising during the year 326,676
Reclassification adjustments 6,037 332,713
Deferred (losses) gains on derivatives under hedge
accounting:
(Loss) arising during the year (20,743)
Reclassification adjustments –– (20,743)
Cumulative translation adjustments:
(Loss) arising during the year (2,671)
Reclassification adjustments –– (2,671)
Share of other comprehensive income of associates accounted for under the equity method:
Income arising during the year 1,342
Reclassification adjustments (95) 1,246
Other comprehensive income before income tax effect 310,545
Income tax (expense) (23,543)
Total other comprehensive income 287,002
(2) Income tax benefit (expense) relating to other comprehensive income (Million Yen)
Before income tax
effect Income tax benefit
(expense) After income tax
effect
Net unrealized gains on available-for-sale securities, net of tax
332,713 (55,934) 276,778
Deferred (losses) gains on derivatives under hedge accounting
(20,743) 6,941 (13,802)
Land revaluation differences –– 25,450 25,450
Cumulative translation adjustments (2,671) –– (2,671)
Share of other comprehensive income of associates accounted for under the equity method
1,246 –– 1,246
Total other comprehensive income 310,545 (23,543) 287,002
73 Nippon Life Insurance Company
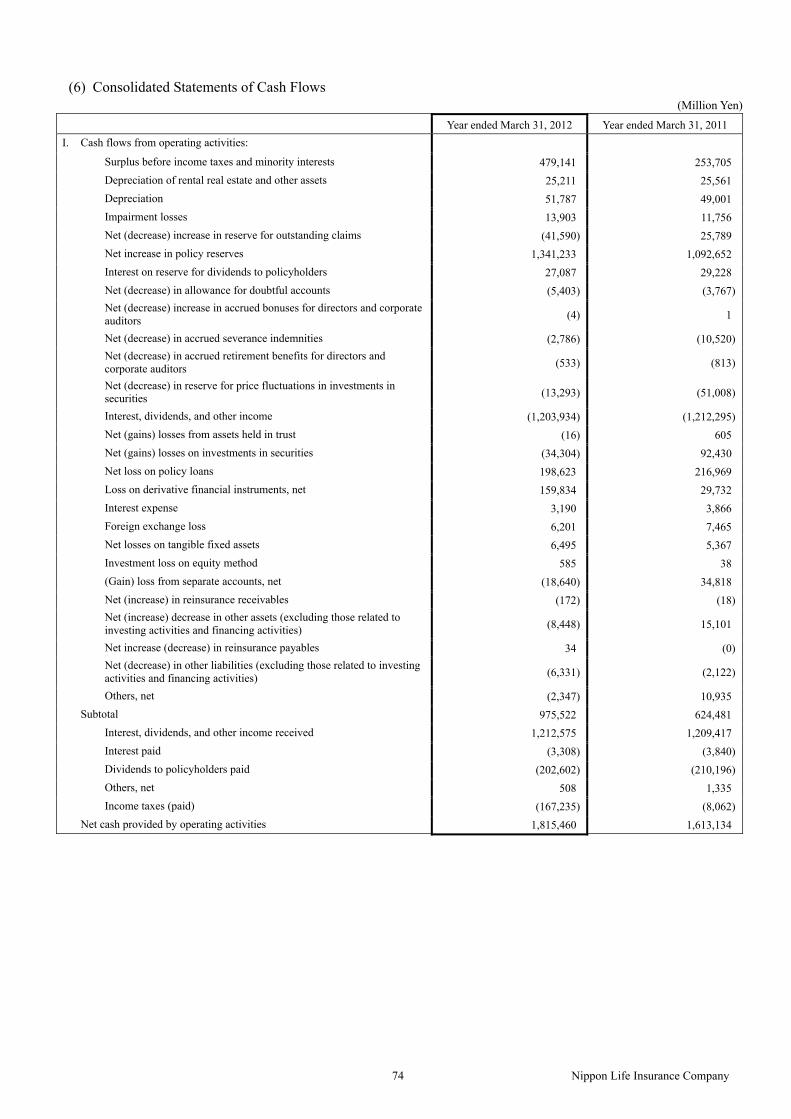
(6) Consolidated Statements of Cash Flows (Million Yen)
Year ended March 31, 2012 Year ended March 31, 2011
I. Cash flows from operating activities:
Surplus before income taxes and minority interests 479,141 253,705
Depreciation of rental real estate and other assets 25,211 25,561
Depreciation 51,787 49,001
Impairment losses 13,903 11,756
Net (decrease) increase in reserve for outstanding claims (41,590) 25,789
Net increase in policy reserves 1,341,233 1,092,652
Interest on reserve for dividends to policyholders 27,087 29,228
Net (decrease) in allowance for doubtful accounts (5,403) (3,767)
Net (decrease) increase in accrued bonuses for directors and corporate auditors (4) 1
Net (decrease) in accrued severance indemnities (2,786) (10,520)
Net (decrease) in accrued retirement benefits for directors and corporate auditors (533) (813)
Net (decrease) in reserve for price fluctuations in investments in securities (13,293) (51,008)
Interest, dividends, and other income (1,203,934) (1,212,295)
Net (gains) losses from assets held in trust (16) 605
Net (gains) losses on investments in securities (34,304) 92,430
Net loss on policy loans 198,623 216,969
Loss on derivative financial instruments, net 159,834 29,732
Interest expense 3,190 3,866
Foreign exchange loss 6,201 7,465
Net losses on tangible fixed assets 6,495 5,367
Investment loss on equity method 585 38
(Gain) loss from separate accounts, net (18,640) 34,818
Net (increase) in reinsurance receivables (172) (18)
Net (increase) decrease in other assets (excluding those related to investing activities and financing activities) (8,448) 15,101
Net increase (decrease) in reinsurance payables 34 (0)
Net (decrease) in other liabilities (excluding those related to investing activities and financing activities) (6,331) (2,122)
Others, net (2,347) 10,935
Subtotal 975,522 624,481
Interest, dividends, and other income received 1,212,575 1,209,417
Interest paid (3,308) (3,840)
Dividends to policyholders paid (202,602) (210,196)
Others, net 508 1,335
Income taxes (paid) (167,235) (8,062)
Net cash provided by operating activities 1,815,460 1,613,134
74 Nippon Life Insurance Company

(6) Consolidated Statements of Cash Flows (Continued) (Million Yen)
Year ended March 31, 2012 Year ended March 31, 2011
II. Cash flows from investing activities:
Net (increase) in deposits (2,100) (200)
Net decrease (increase) in receivables under securities borrowing transactions 180,597 (240,836)
Purchases of monetary receivables purchased (8,000) (34,623)
Proceeds from sales and redemption of monetary receivables purchased 84,009 89,481
Proceeds from decrease in assets held in trust –– 10,043
Purchases of securities (12,567,926) (19,093,872)
Proceeds from sales and redemption of securities 11,019,846 16,774,520
Investments in loans (1,515,105) (1,500,532)
Collections of loans 1,351,797 1,331,800
Net income from the settlement of financial derivative instruments 11,103 328,511
Net (decrease) increase in cash received as collateral under securities lending contracts (361,667) 272,194
Others, net (23,286) 25,049
Investment management activities total (1,830,732) (2,038,462)
[Operating activities and investment management activities total] [(15,271)] [(425,327)]
Purchases of tangible fixed assets (55,966) (43,899)
Proceeds from sales of tangible fixed assets 3,075 7,707
Others, net (30,711) (38,649)
Net cash (used in) investing activities (1,914,335) (2,113,303)
III. Cash flows from financing activities:
Proceeds from debt issuance 219,500 192,300
Repayments of debt (212,112) (204,508)
Proceeds from issuance of foundation funds 100,000 50,000
Redemption of foundation funds (50,000) (50,000)
Interest on foundation funds (3,508) (3,650)
Others, net 19,573 4,616
Net cash provided by (used in) financing activities 73,452 (11,242)
IV. Effect of exchange rate changes on cash and cash equivalents (4,085) (2,035)
V. Net (decrease) in cash and cash equivalents (29,507) (513,447)
VI. Cash and cash equivalents at the beginning of the year 736,931 1,250,378
VII. Cash and cash equivalents at the end of the year 707,424 736,931
75 Nippon Life Insurance Company

Basis of Presenting the Consolidated Statement of Cash Flows for the fiscal year ended March 31, 2012
Cash and cash equivalents
Cash and cash equivalents, for the purpose of reporting consolidated cash flows, are composed of cash in hand,
deposits held at call with banks and all highly liquid short-term investments with a maturity of three months or less
when purchased, which are readily convertible into cash and present insignificant risk of change in value.
76 Nippon Life Insurance Company
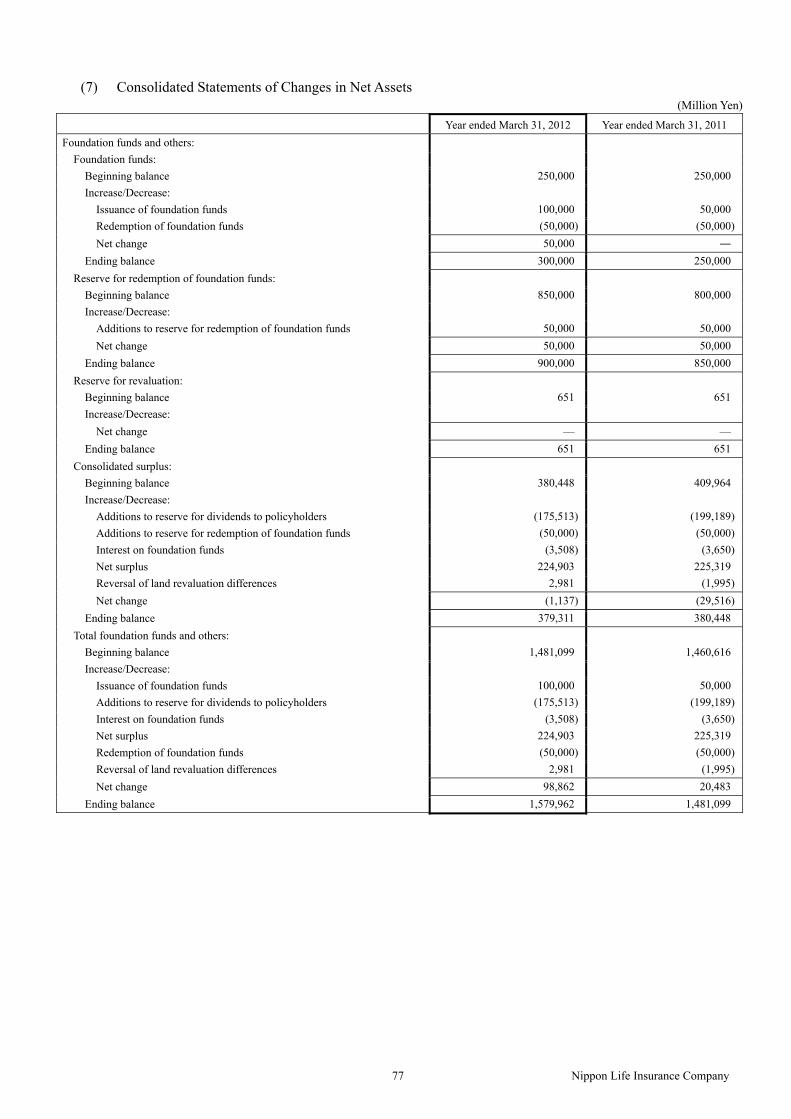
(7) Consolidated Statements of Changes in Net Assets (Million Yen)
Year ended March 31, 2012 Year ended March 31, 2011
Foundation funds and others:
Foundation funds:
Beginning balance 250,000 250,000
Increase/Decrease:
Issuance of foundation funds 100,000 50,000
Redemption of foundation funds (50,000) (50,000)
Net change 50,000 ―
Ending balance 300,000 250,000
Reserve for redemption of foundation funds:
Beginning balance 850,000 800,000
Increase/Decrease:
Additions to reserve for redemption of foundation funds 50,000 50,000
Net change 50,000 50,000
Ending balance 900,000 850,000
Reserve for revaluation:
Beginning balance 651 651
Increase/Decrease:
Net change –– ––
Ending balance 651 651
Consolidated surplus:
Beginning balance 380,448 409,964
Increase/Decrease:
Additions to reserve for dividends to policyholders (175,513) (199,189)
Additions to reserve for redemption of foundation funds (50,000) (50,000)
Interest on foundation funds (3,508) (3,650)
Net surplus 224,903 225,319
Reversal of land revaluation differences 2,981 (1,995)
Net change (1,137) (29,516)
Ending balance 379,311 380,448
Total foundation funds and others:
Beginning balance 1,481,099 1,460,616
Increase/Decrease:
Issuance of foundation funds 100,000 50,000
Additions to reserve for dividends to policyholders (175,513) (199,189)
Interest on foundation funds (3,508) (3,650)
Net surplus 224,903 225,319
Redemption of foundation funds (50,000) (50,000)
Reversal of land revaluation differences 2,981 (1,995)
Net change 98,862 20,483
Ending balance 1,579,962 1,481,099
77 Nippon Life Insurance Company
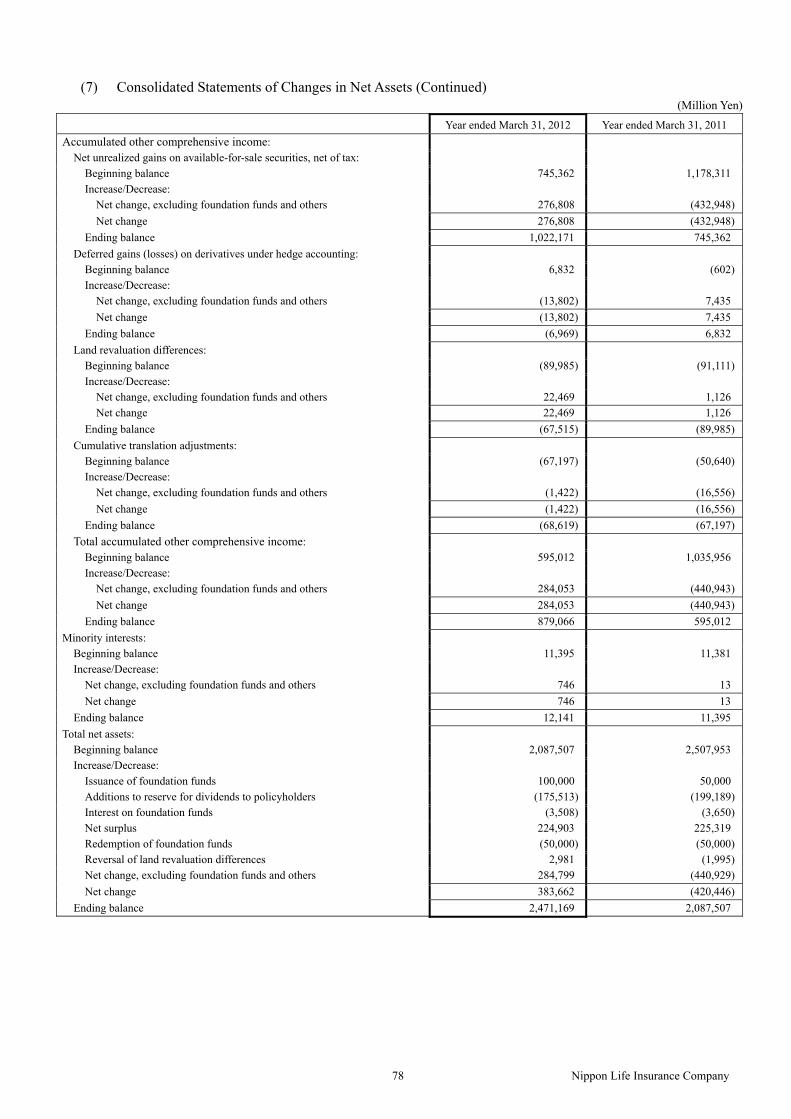
(7) Consolidated Statements of Changes in Net Assets (Continued) (Million Yen)
Year ended March 31, 2012 Year ended March 31, 2011
Accumulated other comprehensive income: Net unrealized gains on available-for-sale securities, net of tax:
Beginning balance 745,362 1,178,311
Increase/Decrease: Net change, excluding foundation funds and others 276,808 (432,948)
Net change 276,808 (432,948)
Ending balance 1,022,171 745,362
Deferred gains (losses) on derivatives under hedge accounting: Beginning balance 6,832 (602)
Increase/Decrease: Net change, excluding foundation funds and others (13,802) 7,435
Net change (13,802) 7,435
Ending balance (6,969) 6,832
Land revaluation differences: Beginning balance (89,985) (91,111)
Increase/Decrease: Net change, excluding foundation funds and others 22,469 1,126
Net change 22,469 1,126
Ending balance (67,515) (89,985)
Cumulative translation adjustments: Beginning balance (67,197) (50,640)Increase/Decrease:
Net change, excluding foundation funds and others (1,422) (16,556)
Net change (1,422) (16,556)
Ending balance (68,619) (67,197)
Total accumulated other comprehensive income: Beginning balance 595,012 1,035,956 Increase/Decrease:
Net change, excluding foundation funds and others 284,053 (440,943)
Net change 284,053 (440,943)
Ending balance 879,066 595,012
Minority interests: Beginning balance 11,395 11,381 Increase/Decrease:
Net change, excluding foundation funds and others 746 13
Net change 746 13
Ending balance 12,141 11,395
Total net assets: Beginning balance 2,087,507 2,507,953 Increase/Decrease:
Issuance of foundation funds 100,000 50,000
Additions to reserve for dividends to policyholders (175,513) (199,189)Interest on foundation funds (3,508) (3,650)
Net surplus 224,903 225,319
Redemption of foundation funds (50,000) (50,000)Reversal of land revaluation differences 2,981 (1,995)
Net change, excluding foundation funds and others 284,799 (440,929)
Net change 383,662 (420,446)
Ending balance 2,471,169 2,087,507
78 Nippon Life Insurance Company
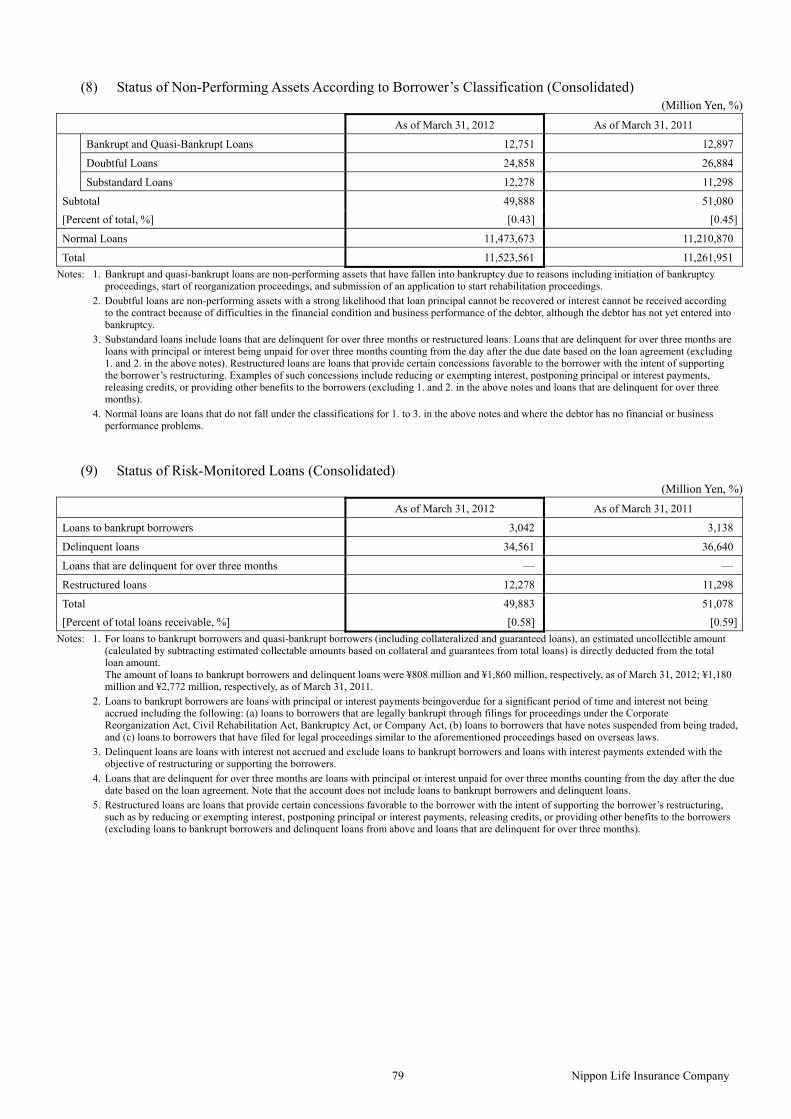
(8) Status of Non-Performing Assets According to Borrower’s Classification (Consolidated) (Million Yen, %)
As of March 31, 2012 As of March 31, 2011
Bankrupt and Quasi-Bankrupt Loans 12,751 12,897
Doubtful Loans 24,858 26,884
Substandard Loans 12,278 11,298
Subtotal 49,888 51,080
[Percent of total, %] [0.43] [0.45]
Normal Loans 11,473,673 11,210,870
Total 11,523,561 11,261,951
Notes: 1. Bankrupt and quasi-bankrupt loans are non-performing assets that have fallen into bankruptcy due to reasons including initiation of bankruptcy proceedings, start of reorganization proceedings, and submission of an application to start rehabilitation proceedings.
2. Doubtful loans are non-performing assets with a strong likelihood that loan principal cannot be recovered or interest cannot be received according to the contract because of difficulties in the financial condition and business performance of the debtor, although the debtor has not yet entered into bankruptcy.
3. Substandard loans include loans that are delinquent for over three months or restructured loans. Loans that are delinquent for over three months are loans with principal or interest being unpaid for over three months counting from the day after the due date based on the loan agreement (excluding 1. and 2. in the above notes). Restructured loans are loans that provide certain concessions favorable to the borrower with the intent of supporting the borrower’s restructuring. Examples of such concessions include reducing or exempting interest, postponing principal or interest payments, releasing credits, or providing other benefits to the borrowers (excluding 1. and 2. in the above notes and loans that are delinquent for over three months).
4. Normal loans are loans that do not fall under the classifications for 1. to 3. in the above notes and where the debtor has no financial or business performance problems.
(9) Status of Risk-Monitored Loans (Consolidated) (Million Yen, %)
As of March 31, 2012 As of March 31, 2011
Loans to bankrupt borrowers 3,042 3,138
Delinquent loans 34,561 36,640
Loans that are delinquent for over three months –– ––
Restructured loans 12,278 11,298
Total 49,883 51,078
[Percent of total loans receivable, %] [0.58] [0.59]
Notes: 1. For loans to bankrupt borrowers and quasi-bankrupt borrowers (including collateralized and guaranteed loans), an estimated uncollectible amount (calculated by subtracting estimated collectable amounts based on collateral and guarantees from total loans) is directly deducted from the total loan amount. The amount of loans to bankrupt borrowers and delinquent loans were ¥808 million and ¥1,860 million, respectively, as of March 31, 2012; ¥1,180 million and ¥2,772 million, respectively, as of March 31, 2011.
2. Loans to bankrupt borrowers are loans with principal or interest payments beingoverdue for a significant period of time and interest not being accrued including the following: (a) loans to borrowers that are legally bankrupt through filings for proceedings under the Corporate Reorganization Act, Civil Rehabilitation Act, Bankruptcy Act, or Company Act, (b) loans to borrowers that have notes suspended from being traded, and (c) loans to borrowers that have filed for legal proceedings similar to the aforementioned proceedings based on overseas laws.
3. Delinquent loans are loans with interest not accrued and exclude loans to bankrupt borrowers and loans with interest payments extended with the objective of restructuring or supporting the borrowers.
4. Loans that are delinquent for over three months are loans with principal or interest unpaid for over three months counting from the day after the due date based on the loan agreement. Note that the account does not include loans to bankrupt borrowers and delinquent loans.
5. Restructured loans are loans that provide certain concessions favorable to the borrower with the intent of supporting the borrower’s restructuring, such as by reducing or exempting interest, postponing principal or interest payments, releasing credits, or providing other benefits to the borrowers (excluding loans to bankrupt borrowers and delinquent loans from above and loans that are delinquent for over three months).
79 Nippon Life Insurance Company
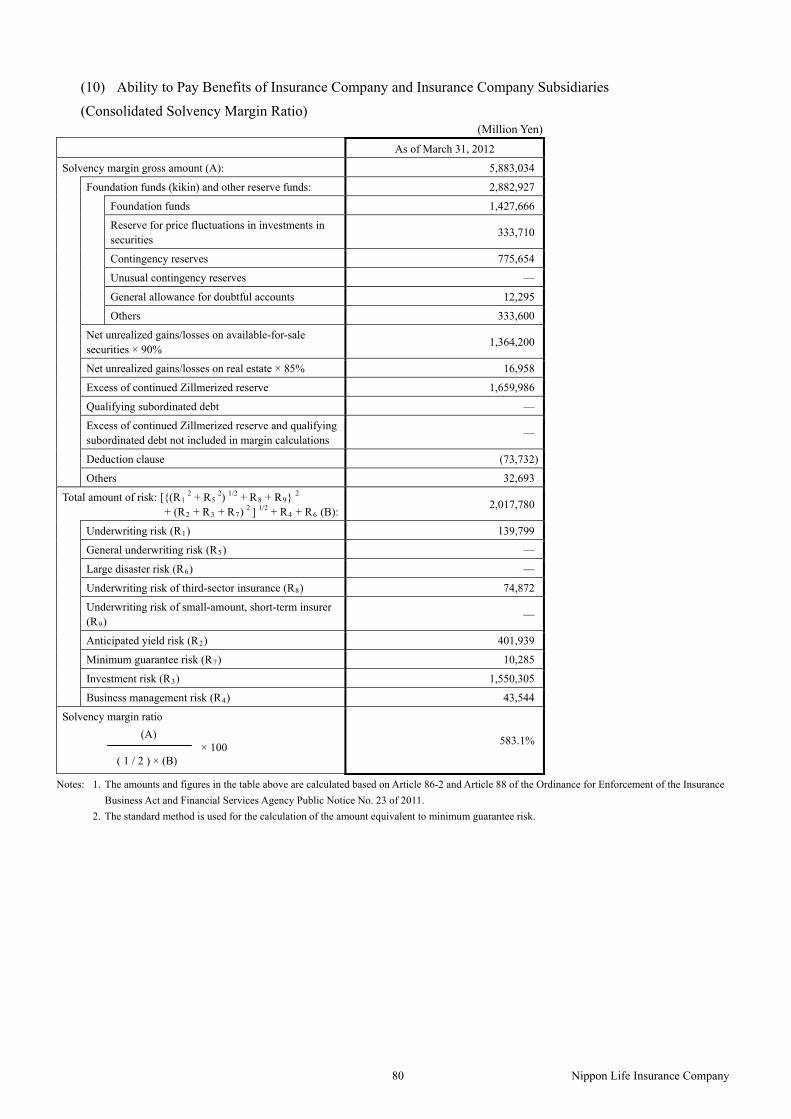
(10) Ability to Pay Benefits of Insurance Company and Insurance Company Subsidiaries
(Consolidated Solvency Margin Ratio) (Million Yen)
As of March 31, 2012
Solvency margin gross amount (A): 5,883,034
Foundation funds (kikin) and other reserve funds: 2,882,927
Foundation funds 1,427,666
Reserve for price fluctuations in investments in securities 333,710
Contingency reserves 775,654
Unusual contingency reserves ––
General allowance for doubtful accounts 12,295
Others 333,600
Net unrealized gains/losses on available-for-sale securities × 90% 1,364,200
Net unrealized gains/losses on real estate × 85% 16,958
Excess of continued Zillmerized reserve 1,659,986
Qualifying subordinated debt ––
Excess of continued Zillmerized reserve and qualifying subordinated debt not included in margin calculations
––
Deduction clause (73,732)
Others 32,693
Total amount of risk: [{(R1 2 + R5
2) 1/2 + R8 + R9} 2 + (R2 + R3 + R7) 2 ] 1/2 + R4 + R6 (B):
2,017,780
Underwriting risk (R1) 139,799
General underwriting risk (R5) ––
Large disaster risk (R6) ––
Underwriting risk of third-sector insurance (R8) 74,872
Underwriting risk of small-amount, short-term insurer (R9)
––
Anticipated yield risk (R2) 401,939
Minimum guarantee risk (R7) 10,285
Investment risk (R3) 1,550,305
Business management risk (R4) 43,544
Solvency margin ratio
(A) × 100
( 1 / 2 ) × (B)
583.1%
Notes: 1. The amounts and figures in the table above are calculated based on Article 86-2 and Article 88 of the Ordinance for Enforcement of the Insurance
Business Act and Financial Services Agency Public Notice No. 23 of 2011.
2. The standard method is used for the calculation of the amount equivalent to minimum guarantee risk.
80 Nippon Life Insurance Company
81 Nippon Life Insurance Company
(11) Segment Information
For the fiscal year ended March 31, 2012 and the fiscal year ended March 31, 2011, the Company and
the Company’s consolidated subsidiaries engaged in insurance and insurance-related businesses
(including asset management-related business and general administration-related business) in Japan and
overseas. Segment information and its related information are omitted because there are no other
significant segments to report.


![Consolidated Financial Results for the Fiscal Year Ended ...Note: Comprehensive income Fiscal year ended March 31, 2019: ¥1,761 million [24.3%] Fiscal year ended March 31, 2018: ¥1,417](https://img.pdfslide.us/doc/110x75/5fe4d06806b4775830253106/consolidated-financial-results-for-the-fiscal-year-ended-note-comprehensive.jpg)