Embed Size (px)
Citation preview
Financial Results for the Fiscal Year Ended February 28, 2014
Announcement of the Three-Year Medium-Term Management Plan
©2014 Aeon Delight All Rights Reserved
Ippei Nakayama, President and CEO
April 9, 2014
1 ©2014 Aeon Delight All Rights Reserved
Contents
1 Financial Report for the Fiscal Year Ended February 28, 2014
2 Medium-Term Management Plan (FY2/15 – FY2/17)
3 Initiatives for the Fiscal Year Ended February 28, 2015
4 Reference Materials
2 ©2014 Aeon Delight All Rights Reserved
Contents
1 Financial Report for the Fiscal Year Ended February 28, 2014
2 Medium-Term Management Plan (FY2/15 – FY2/17)
3 Initiatives for the Fiscal Year Ended February 28, 2015
4 Reference Materials
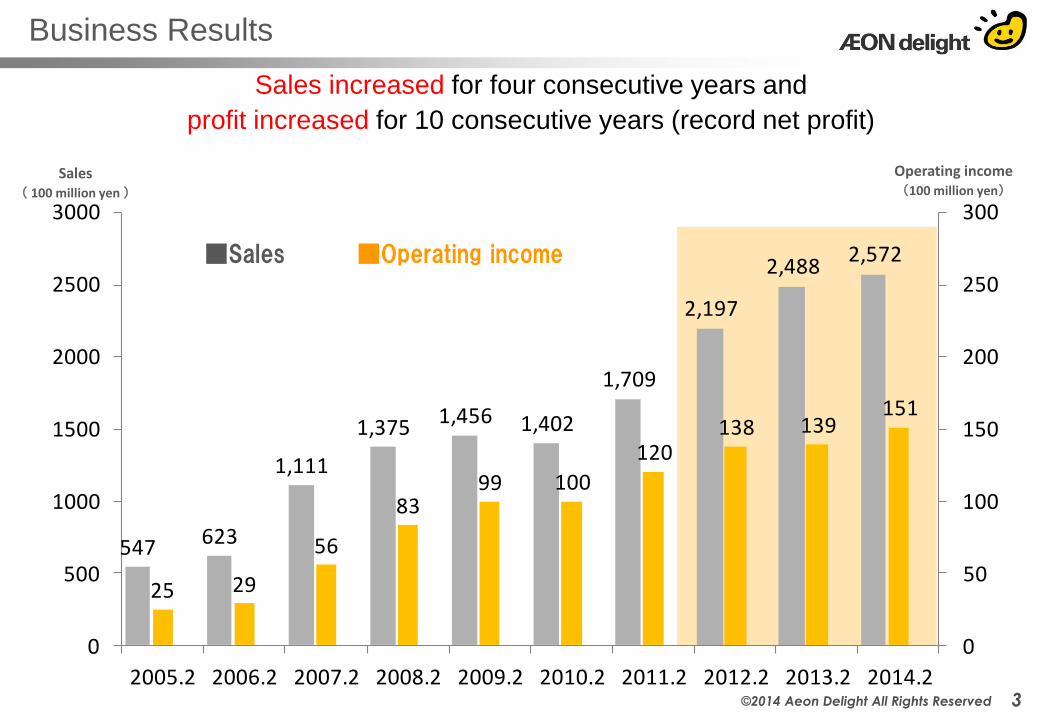
547 623
1,111
1,3751,456 1,402
1,709
2,197
2,4882,572
25 29
56
8399 100
120138 139
151
0
50
100
150
200
250
300
0
500
1000
1500
2000
2500
3000
2005.2 2006.2 2007.2 2008.2 2009.2 2010.2 2011.2 2012.2 2013.2 2014.2
Sales ( 100 million yen )
■Sales ■Operating income
Operating income (100 million yen)
Sales increased for four consecutive years and
profit increased for 10 consecutive years (record net profit)
Business Results
3 ©2014 Aeon Delight All Rights Reserved
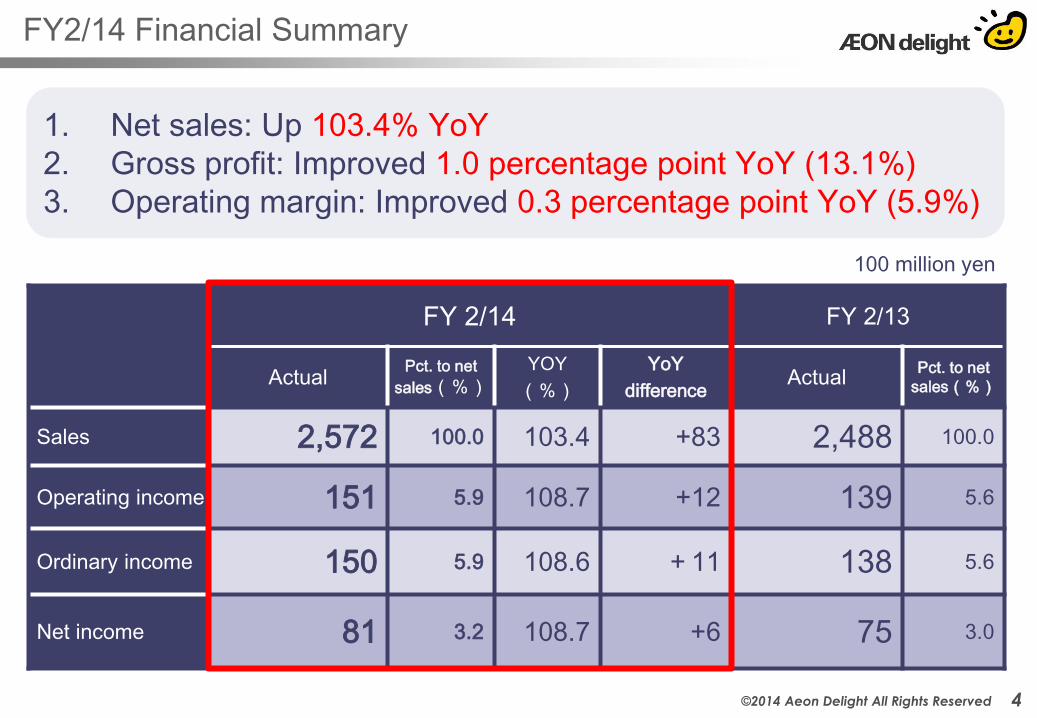
FY 2/14 FY 2/13
Actual Pct. to net
sales(%)
YOY
(%)
YoY
difference Actual
Pct. to net
sales(%)
Sales 2,572 100.0 103.4 +83 2,488 100.0
Operating income 151 5.9 108.7 +12 139 5.6
Ordinary income 150 5.9 108.6 +11 138 5.6
Net income 81 3.2 108.7 +6 75 3.0
100 million yen
FY2/14 Financial Summary
1. Net sales: Up 103.4% YoY
2. Gross profit: Improved 1.0 percentage point YoY (13.1%)
3. Operating margin: Improved 0.3 percentage point YoY (5.9%)
4 ©2014 Aeon Delight All Rights Reserved
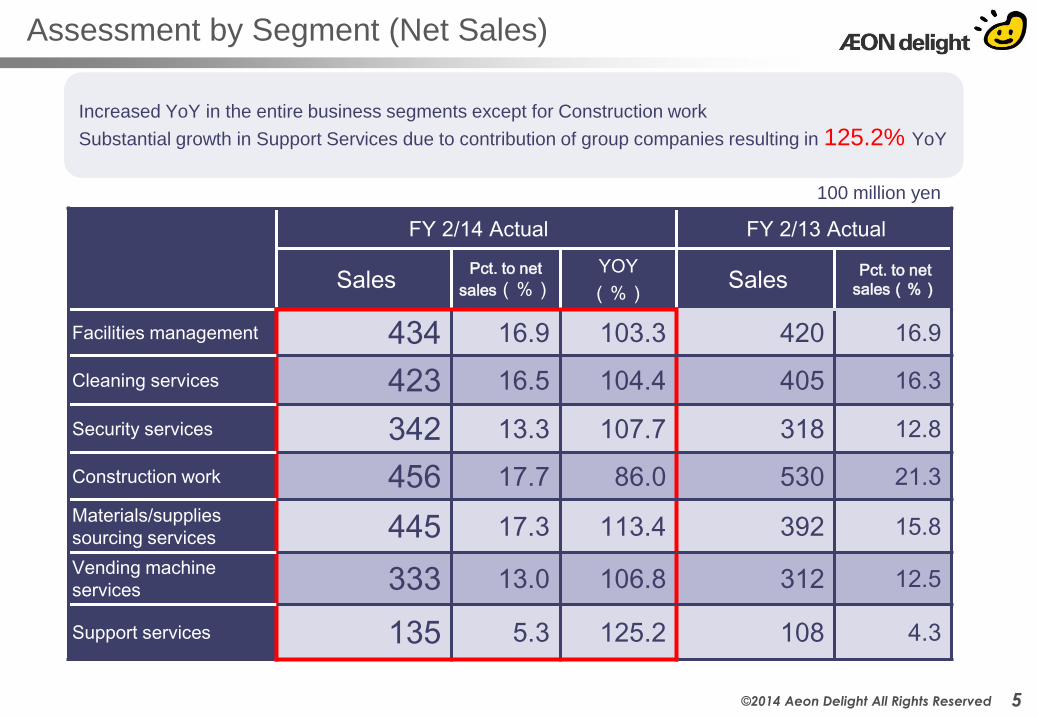
FY 2/14 Actual FY 2/13 Actual
Sales Pct. to net
sales(%)
YOY
(%) Sales
Pct. to net
sales(%)
Facilities management 434 16.9 103.3 420 16.9
Cleaning services 423 16.5 104.4 405 16.3
Security services 342 13.3 107.7 318 12.8
Construction work 456 17.7 86.0 530 21.3
Materials/supplies
sourcing services 445 17.3 113.4 392 15.8
Vending machine
services 333 13.0 106.8 312 12.5
Support services 135 5.3 125.2 108 4.3
Assessment by Segment (Net Sales)
100 million yen
Increased YoY in the entire business segments except for Construction work
Substantial growth in Support Services due to contribution of group companies resulting in 125.2% YoY
5 ©2014 Aeon Delight All Rights Reserved
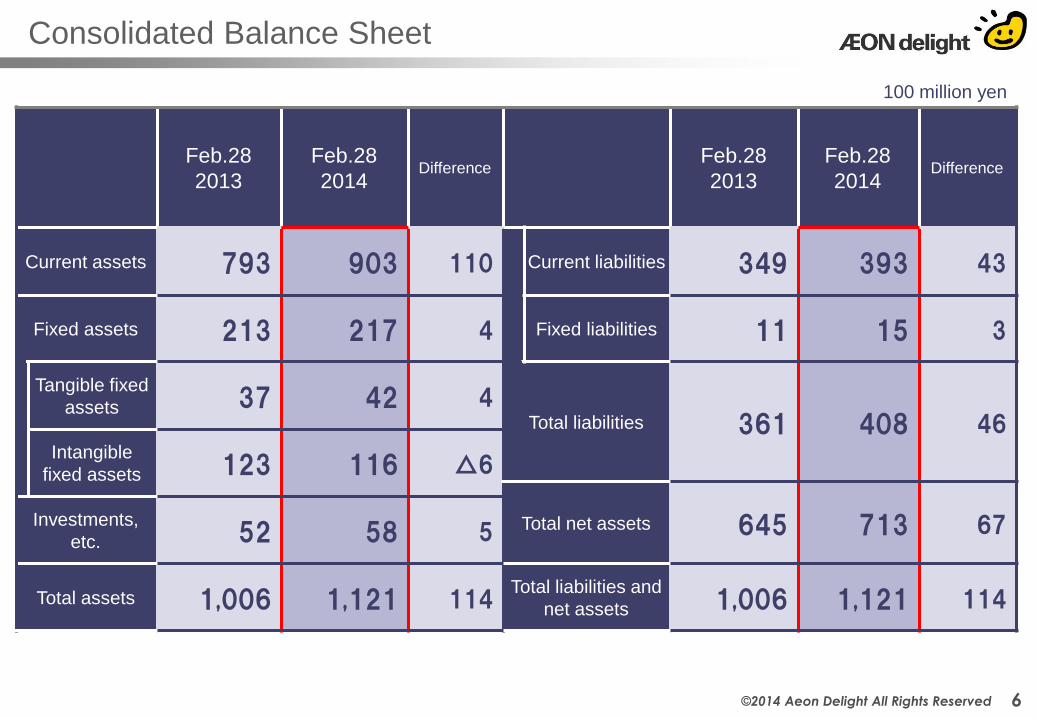
Feb.28
2013
Feb.28
2014
Difference
Feb.28
2013
Feb.28
2014
Difference
Current assets 793 903 110 Current liabilities 349 393 43
Fixed assets 213 217 4 Fixed liabilities 11 15 3
Tangible fixed
assets 37 42 4
Total liabilities 361 408 46 Intangible
fixed assets 123 116 △6
Total net assets 645 713 67 Investments,
etc. 52 58 5
Total assets 1,006 1,121 114 Total liabilities and
net assets 1,006 1,121 114
Consolidated Balance Sheet
6 ©2014 Aeon Delight All Rights Reserved
100 million yen
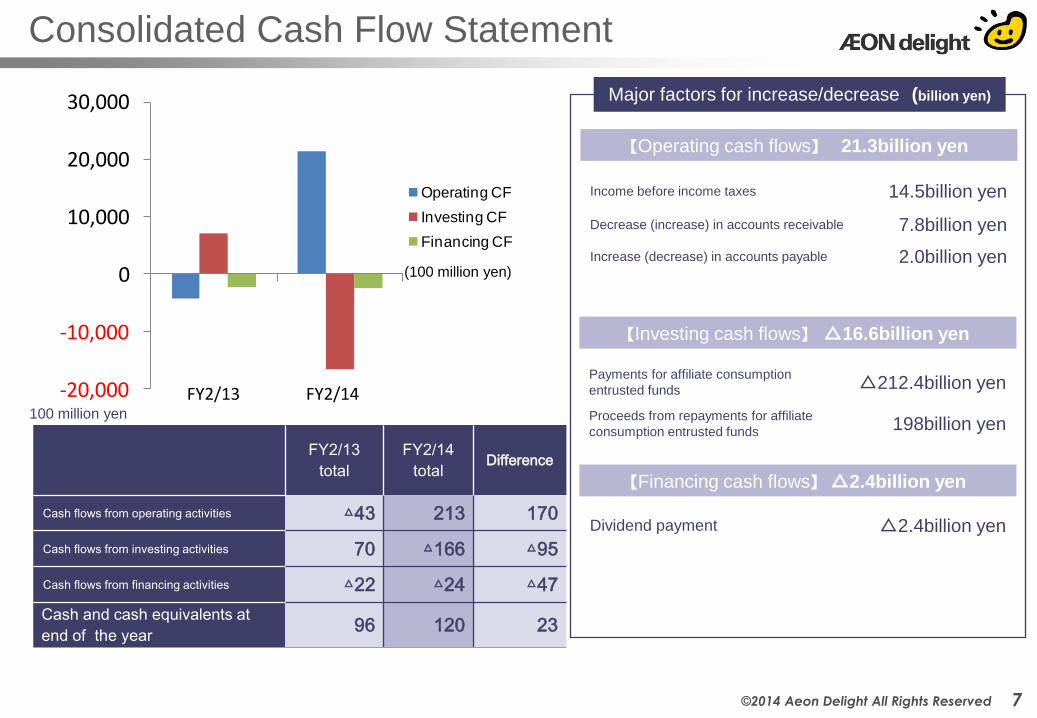
Consolidated Cash Flow Statement
FY2/13
total
FY2/14
total Difference
Cash flows from operating activities △43 213 170
Cash flows from investing activities 70 △166 △95
Cash flows from financing activities △22 △24 △47
Cash and cash equivalents at
end of the year 96 120 23
Major factors for increase/decrease (billion yen)
【Operating cash flows】 21.3billion yen
Income before income taxes 14.5billion yen
Decrease (increase) in accounts receivable 7.8billion yen
Increase (decrease) in accounts payable 2.0billion yen
【Investing cash flows】 △16.6billion yen
Payments for affiliate consumption
entrusted funds △212.4billion yen
Proceeds from repayments for affiliate
consumption entrusted funds 198billion yen
【Financing cash flows】 △2.4billion yen
Dividend payment △2.4billion yen
-20,000
-10,000
0
10,000
20,000
30,000
Operating CF
Investing CF
Financing CF
FY2/13 FY2/14
7 ©2014 Aeon Delight All Rights Reserved
100 million yen
(100 million yen)
8 ©2014 Aeon Delight All Rights Reserved
Overview of FY2/14
(1) Structural reforms created a stronger profit structure Enacted measures to generate earnings from group companies and improve profitability of existing businesses
(2) Increased the number of service locations in Japan and overseas (Japan) New outsourcing agreements with large stadiums, government agencies, hotels, hospitals and other facilities
Started providing services to large AEON Group facilities and new AEON Group companies
(China) Expanded services to 136 companies for Japanese and foreign-affiliated companies,
Chinese companies and others
(ASEAN)
Malaysia: Providing services to 45 Japanese and foreign-affiliated companies
Vietnam: Providing services to 23 Japanese and foreign-affiliated companies
(3) Improved bases in two major business domains for achieving the goals of the next three-year plan ・Sanitation and Cleaning Services field
More actions concerning the AEON model for the cleaning business
(uniform quality of services by using the optimal amount of labor)
Strengthened development strategy operations by developing an exclusive floor coating material (AD Coat),
and increasing sales of value-added products
・Facility Management + Energy
Increased activities aimed at conducting Facilities Management-integrated ESCO Business
To target opportunities in the renewable energy maintenance market, considering creating a recharging business
model by establishing a special-purpose company (SPC) with other companies
9 ©2014 Aeon Delight All Rights Reserved
Contents
1 Financial Report for the Fiscal Year Ended February 28, 2014
2 Medium-Term Management Plan (FY2/15 – FY2/17)
3 Initiatives for the Fiscal Year Ended February 28, 2015
4 Reference Materials
10 ©2014 Aeon Delight All Rights Reserved
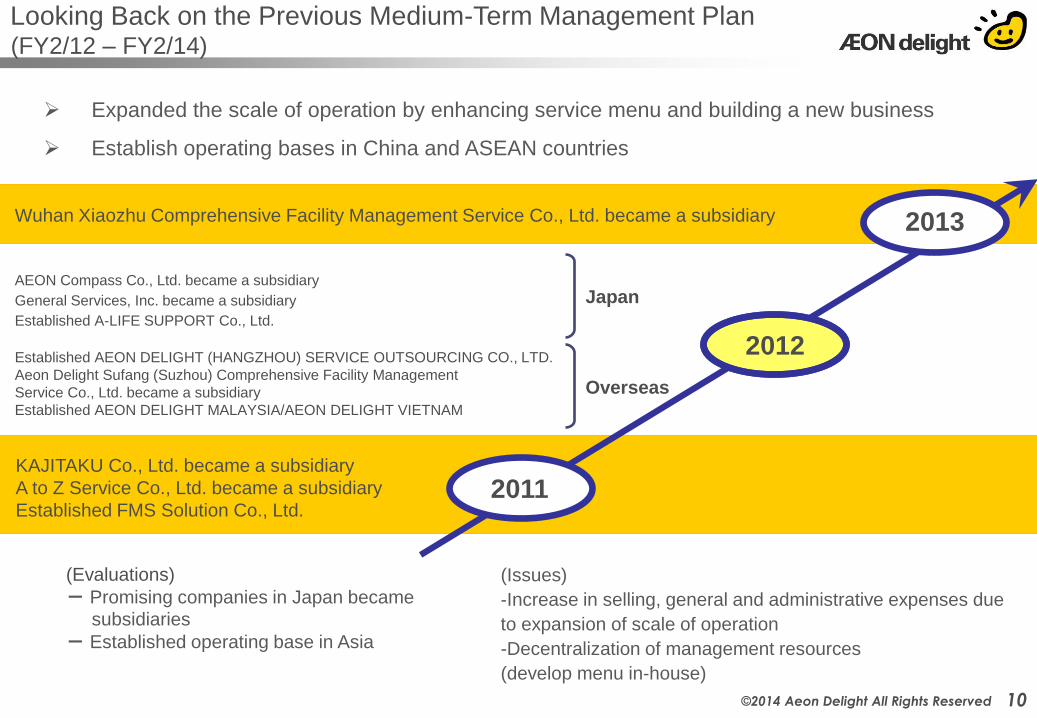
Looking Back on the Previous Medium-Term Management Plan (FY2/12 – FY2/14)
(Evaluations)
- Promising companies in Japan became
subsidiaries
- Established operating base in Asia
Expanded the scale of operation by enhancing service menu and building a new business
Establish operating bases in China and ASEAN countries
(Issues)
-Increase in selling, general and administrative expenses due
to expansion of scale of operation
-Decentralization of management resources
(develop menu in-house)
AEON Compass Co., Ltd. became a subsidiary
General Services, Inc. became a subsidiary
Established A-LIFE SUPPORT Co., Ltd.
Established AEON DELIGHT (HANGZHOU) SERVICE OUTSOURCING CO., LTD.
Aeon Delight Sufang (Suzhou) Comprehensive Facility Management
Service Co., Ltd. became a subsidiary
Established AEON DELIGHT MALAYSIA/AEON DELIGHT VIETNAM
KAJITAKU Co., Ltd. became a subsidiary
A to Z Service Co., Ltd. became a subsidiary
Established FMS Solution Co., Ltd.
Overseas
Japan
Wuhan Xiaozhu Comprehensive Facility Management Service Co., Ltd. became a subsidiary
2012
2011
2013
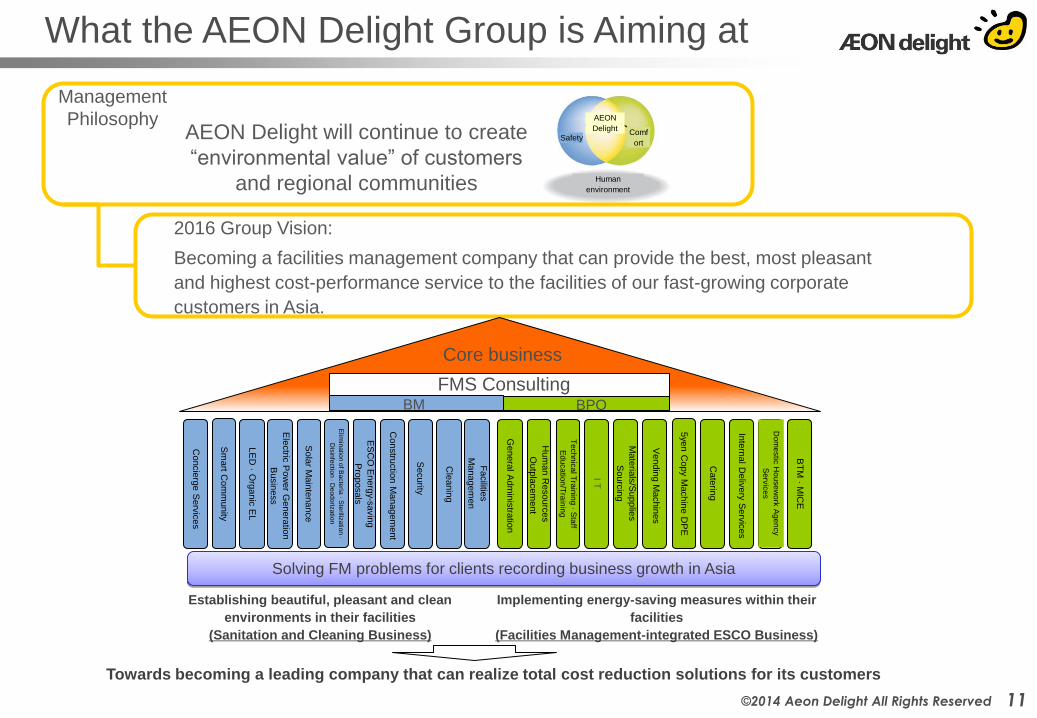
What the AEON Delight Group is Aiming at
11 ©2014 Aeon Delight All Rights Reserved
AEON Delight will continue to create
“environmental value” of customers
and regional communities
Management
Philosophy
2016 Group Vision:
Becoming a facilities management company that can provide the best, most pleasant
and highest cost-performance service to the facilities of our fast-growing corporate
customers in Asia.
Safety Comf
ort
Human
environment
Genera
l Adm
inis
tratio
n
Cate
ring
Facilitie
s
Managem
en
Cle
anin
g
Security
I T
Te
ch
nic
al T
rain
ing
· Sta
ff
Ed
uca
tion
/Tra
inin
g
ES
CO
Energ
y-s
avin
g
Pro
posals
Sola
r Main
tenance
Ele
ctric
Pow
er G
enera
tion
Busin
ess
Inte
rnal D
eliv
ery S
erv
ices
Mate
rials
/Supplie
s
Sourc
ing
Hum
an R
esourc
es
Outp
lacem
ent
Vendin
g M
achin
es
Dom
estic
Hou
se
wo
rk A
ge
ncy
Se
rvic
es
Constru
ctio
n M
anagem
ent
Concie
rge S
erv
ices
BT
M · M
ICE
5ye
n C
opy M
achin
e D
PE
LE
D · O
rganic
EL
Sm
art C
om
munity
Elim
inatio
n o
f Bacte
ria · S
teriliz
atio
n ·
Dis
infe
ctio
n · D
eodoriz
atio
n
Core business
BM BPO
FMS Consulting
Solving FM problems for clients recording business growth in Asia
Establishing beautiful, pleasant and clean
environments in their facilities
(Sanitation and Cleaning Business)
Implementing energy-saving measures within their
facilities
(Facilities Management-integrated ESCO Business)
Towards becoming a leading company that can realize total cost reduction solutions for its customers
AEON
Delight
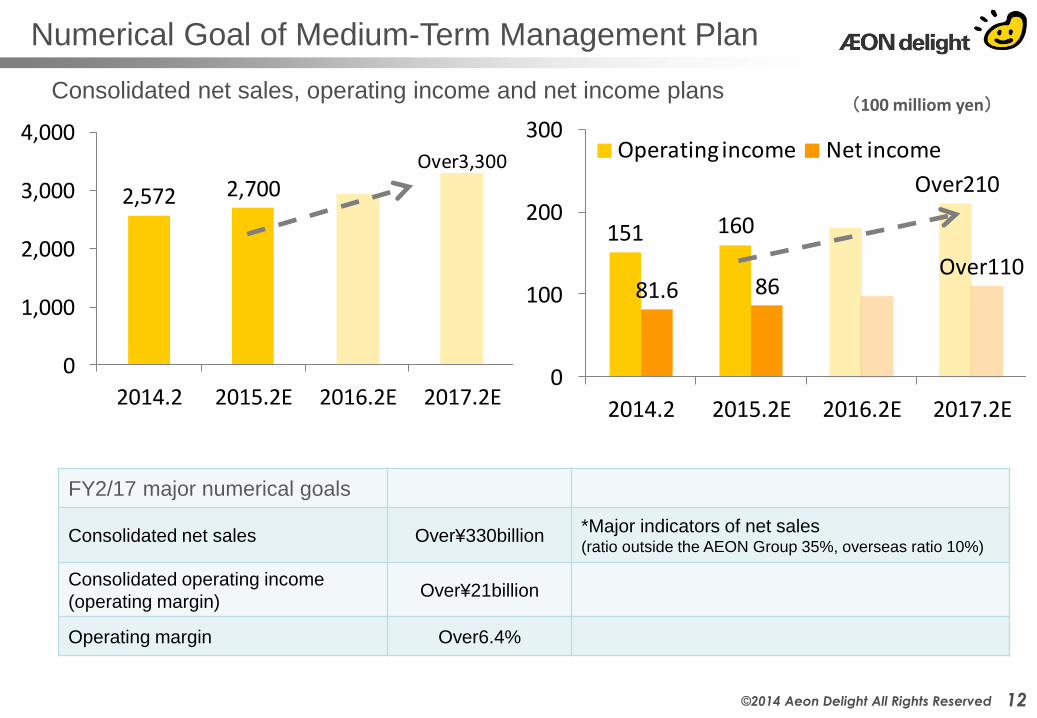
2,572 2,700 Over3,300
0
1,000
2,000
3,000
4,000
2014.2 2015.2E 2016.2E 2017.2E
12 ©2014 Aeon Delight All Rights Reserved
Numerical Goal of Medium-Term Management Plan
(100 milliom yen)
151 160
Over210
81.6 86Over110
0
100
200
300
2014.2 2015.2E 2016.2E 2017.2E
Operating income Net income
Consolidated net sales, operating income and net income plans
FY2/17 major numerical goals
Consolidated net sales Over¥330billion *Major indicators of net sales (ratio outside the AEON Group 35%, overseas ratio 10%)
Consolidated operating income
(operating margin) Over¥21billion
Operating margin Over6.4%
13 ©2014 Aeon Delight All Rights Reserved
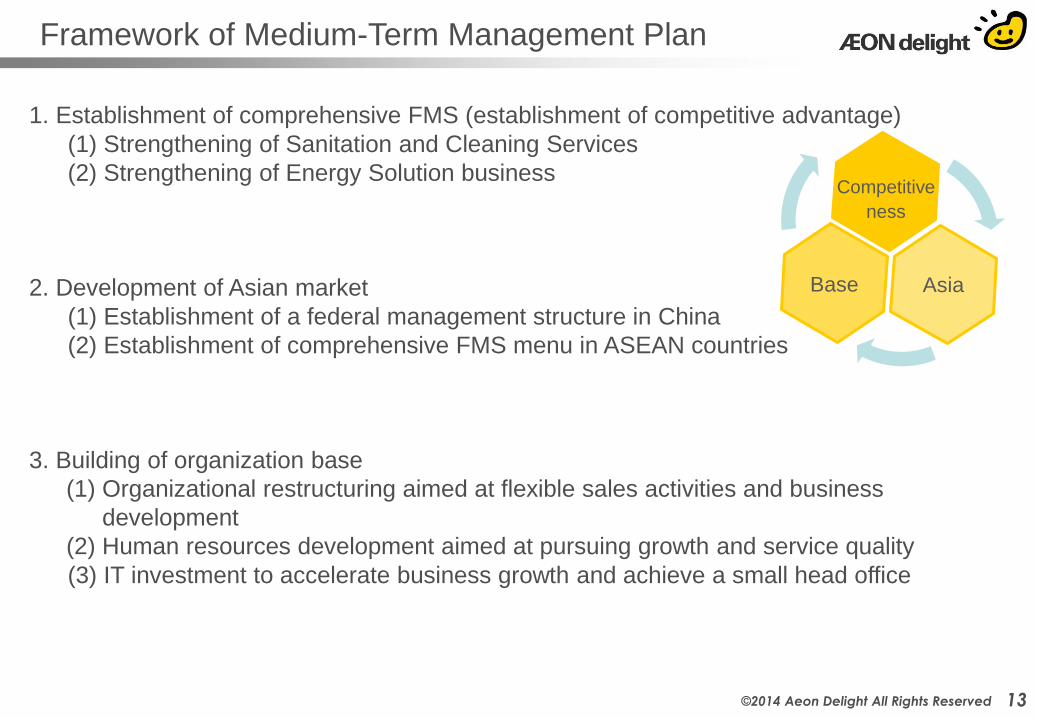
Framework of Medium-Term Management Plan
1. Establishment of comprehensive FMS (establishment of competitive advantage)
(1) Strengthening of Sanitation and Cleaning Services
(2) Strengthening of Energy Solution business
2. Development of Asian market
(1) Establishment of a federal management structure in China
(2) Establishment of comprehensive FMS menu in ASEAN countries
3. Building of organization base
(1) Organizational restructuring aimed at flexible sales activities and business
development
(2) Human resources development aimed at pursuing growth and service quality
(3) IT investment to accelerate business growth and achieve a small head office
Competitive
ness
Asia Base
14 ©2014 Aeon Delight All Rights Reserved
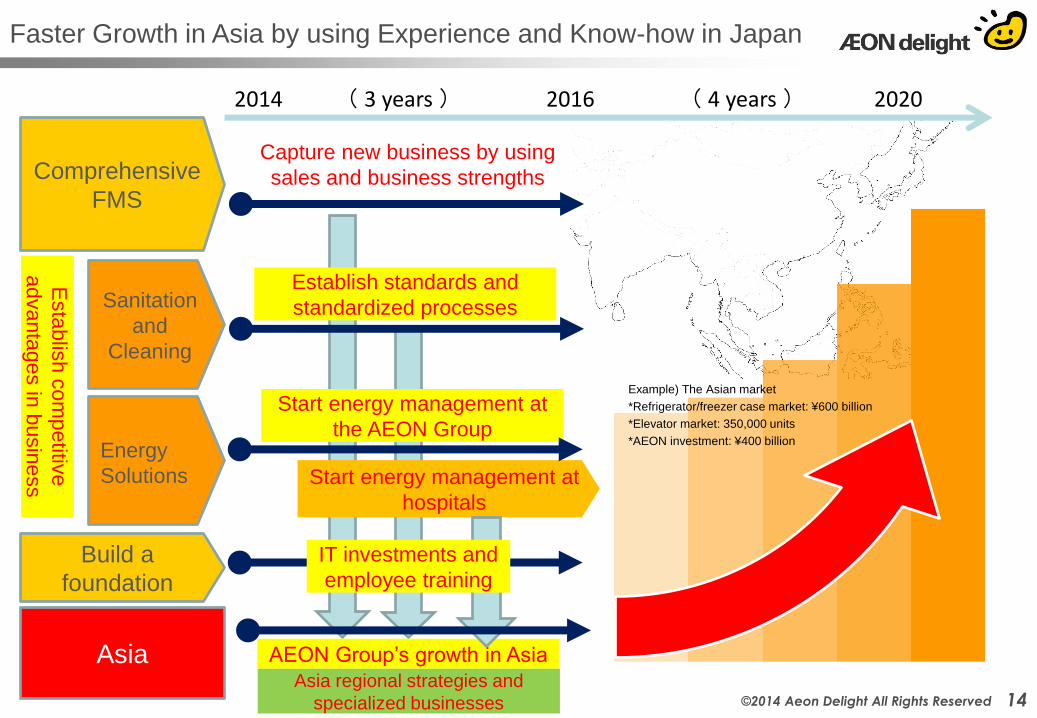
Faster Growth in Asia by using Experience and Know-how in Japan
Comprehensive
FMS
Asia
2014 ( 3 years ) 2016 ( 4 years ) 2020
Esta
blis
h c
om
petitiv
e
advanta
ges in
busin
ess
Start energy management at
hospitals
Start energy management at
the AEON Group
AEON Group’s growth in Asia
Asia regional strategies and
specialized businesses
Sanitation
and
Cleaning
Energy
Solutions
Capture new business by using
sales and business strengths
Establish standards and
standardized processes
Build a
foundation
IT investments and
employee training
Example) The Asian market
*Refrigerator/freezer case market: ¥600 billion
*Elevator market: 350,000 units
*AEON investment: ¥400 billion
0
500
1000
1500
2000
2013 2016 2020
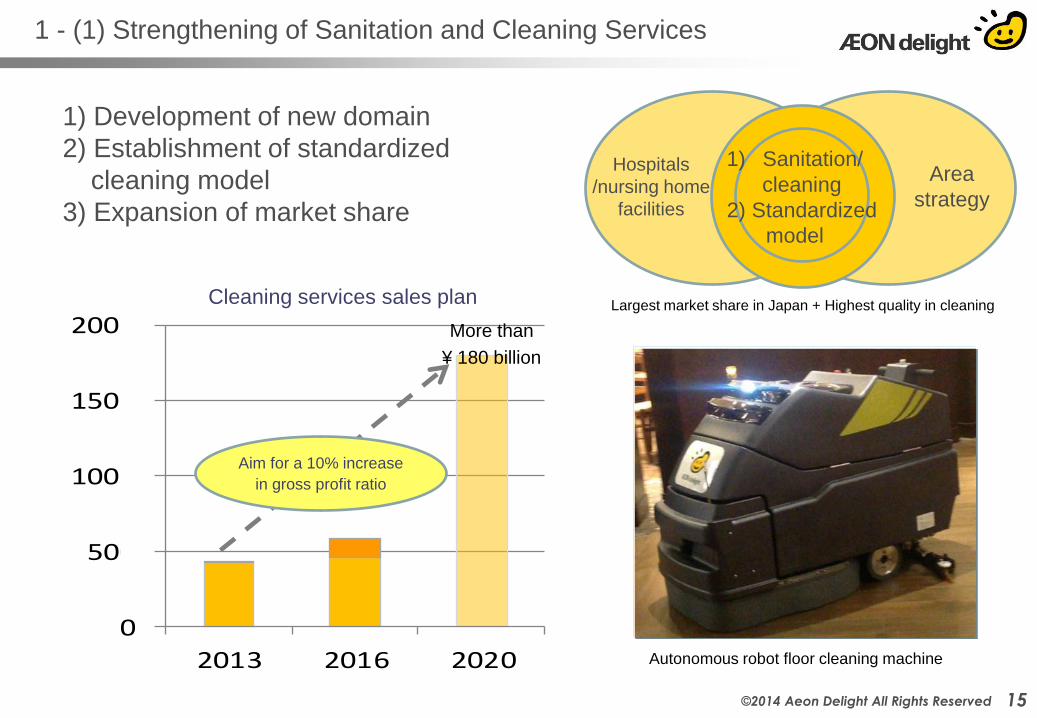
1 - (1) Strengthening of Sanitation and Cleaning Services
15 ©2014 Aeon Delight All Rights Reserved
1) Development of new domain
2) Establishment of standardized
cleaning model
3) Expansion of market share
Cleaning services sales plan
1) Sanitation/
cleaning
2) Standardized
model
Hospitals
/nursing home
facilities
Area
strategy
Largest market share in Japan + Highest quality in cleaning
More than
¥ 180 billion
Autonomous robot floor cleaning machine
Aim for a 10% increase
in gross profit ratio
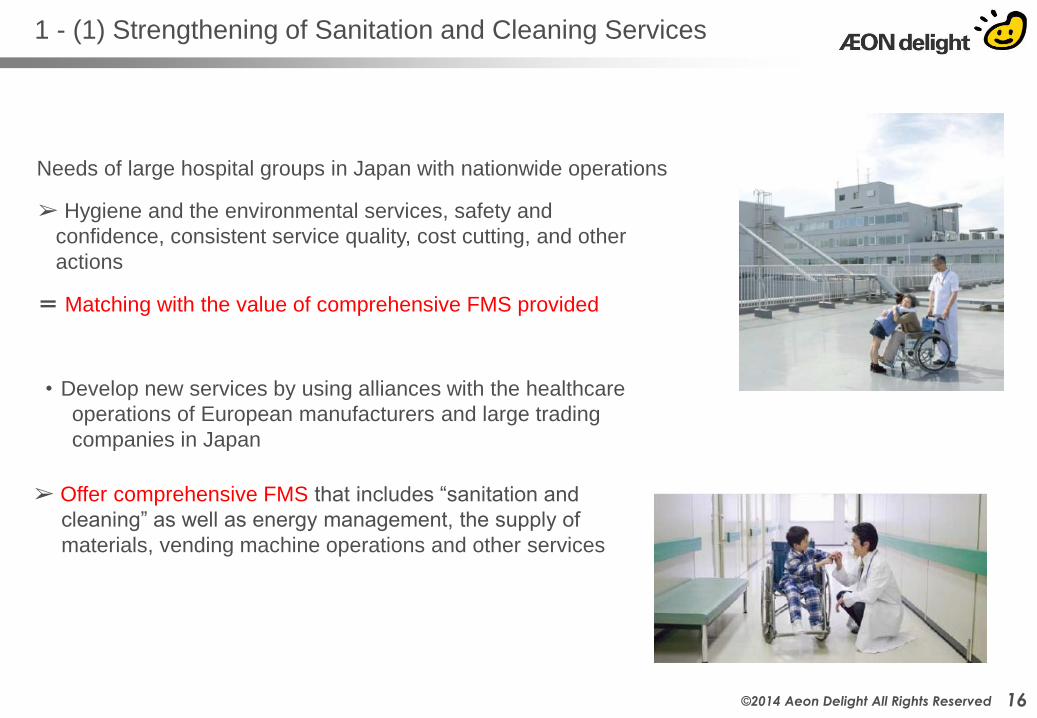
1 - (1) Strengthening of Sanitation and Cleaning Services
Needs of large hospital groups in Japan with nationwide operations
➢ Hygiene and the environmental services, safety and
confidence, consistent service quality, cost cutting, and other
actions
= Matching with the value of comprehensive FMS provided
・ Develop new services by using alliances with the healthcare
operations of European manufacturers and large trading
companies in Japan
➢ Offer comprehensive FMS that includes “sanitation and
cleaning” as well as energy management, the supply of
materials, vending machine operations and other services
16 ©2014 Aeon Delight All Rights Reserved
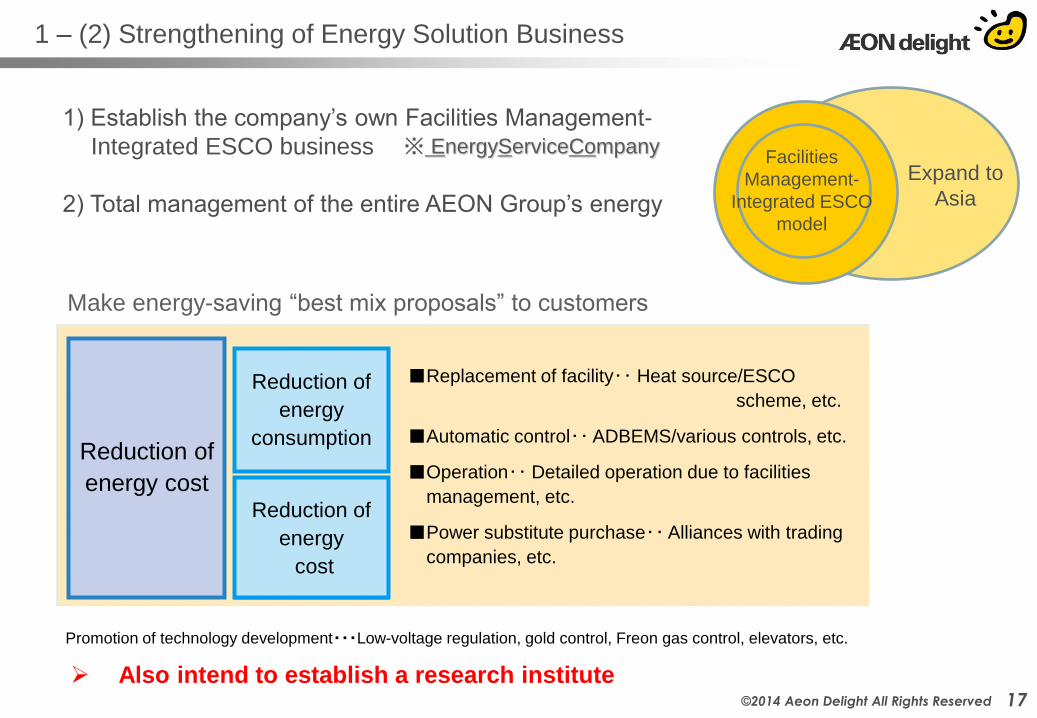
1 – (2) Strengthening of Energy Solution Business
17 ©2014 Aeon Delight All Rights Reserved
1) Establish the company’s own Facilities Management-
Integrated ESCO business
2) Total management of the entire AEON Group’s energy
Facilities
Management-
Integrated ESCO
model
Expand to
Asia
※ EnergyServiceCompany
Promotion of technology development・・・Low-voltage regulation, gold control, Freon gas control, elevators, etc.
Also intend to establish a research institute
Make energy-saving “best mix proposals” to customers
Reduction of
energy cost
Reduction of
energy
consumption
Reduction of
energy
cost
■Replacement of facility‥ Heat source/ESCO
scheme, etc.
■Automatic control‥ ADBEMS/various controls, etc.
■Operation‥ Detailed operation due to facilities
management, etc.
■Power substitute purchase‥ Alliances with trading
companies, etc.
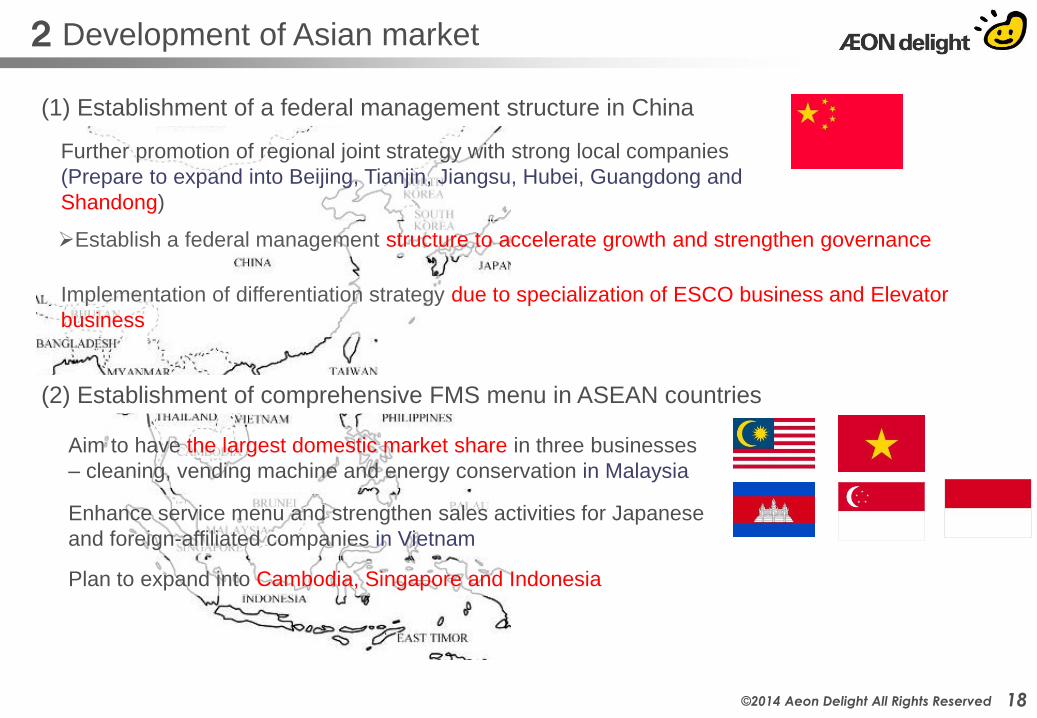
2 Development of Asian market
18 ©2014 Aeon Delight All Rights Reserved
(1) Establishment of a federal management structure in China
(2) Establishment of comprehensive FMS menu in ASEAN countries
Further promotion of regional joint strategy with strong local companies
(Prepare to expand into Beijing, Tianjin, Jiangsu, Hubei, Guangdong and
Shandong)
Establish a federal management structure to accelerate growth and strengthen governance
Implementation of differentiation strategy due to specialization of ESCO business and Elevator
business
Plan to expand into Cambodia, Singapore and Indonesia
Aim to have the largest domestic market share in three businesses
– cleaning, vending machine and energy conservation in Malaysia
Enhance service menu and strengthen sales activities for Japanese
and foreign-affiliated companies in Vietnam
3 Build a Sound Organizational Base
19 ©2014 Aeon Delight All Rights Reserved
1. Reorganize operations to enable speedy business operations and solution-based sales
activities
2. Actions to train employees in order to upgrade the quality of services
Consolidate and realign the organization to build “Sanitation and Cleaning
Services” and “Energy Solutions Business”
Build separate sales frameworks for each customer and business category
Reinforce corporate sales activities
3. IT investments to speed up growth and downsize the head office
Make IT investments of about ¥3 billion over three years to
➢ Establish a management structure that uses resources efficiently (a small head office)
Training for management of
Vietnam
Introduce the AEON Delight certification program
Train people in other Asian countries to become managers by using the
“AEON Delight Academy Nagahama”
➢ Develop and start using tools and systems that can accelerate growth that is
backed by “Sanitation and Cleaning” and “Energy Solution”
➢ Upgrade the education infrastructure with the goal of establishing schools
in many Asian countries.
20 ©2014 Aeon Delight All Rights Reserved
Contents
1 Financial Report for the Fiscal Year Ended February 28, 2014
2 Medium-Term Management Plan (FY2/15 – FY2/17)
3 Initiatives for the Fiscal Year Ended February 28, 2015
4 Reference Materials
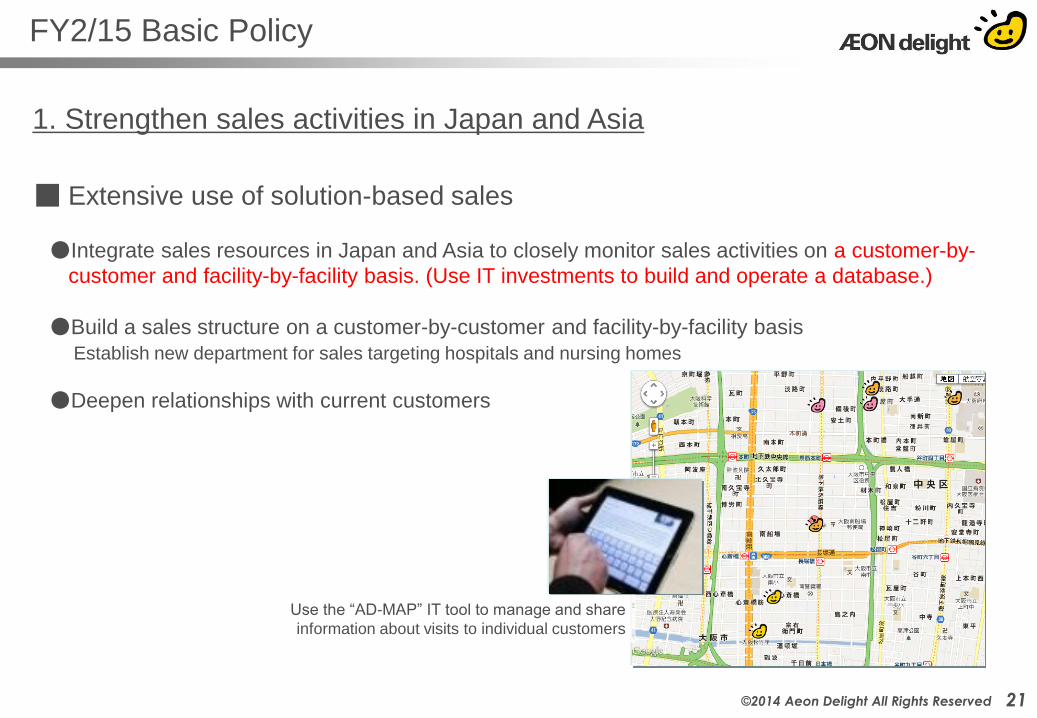
FY2/15 Basic Policy
21 ©2014 Aeon Delight All Rights Reserved
1. Strengthen sales activities in Japan and Asia
■ Extensive use of solution-based sales
●Integrate sales resources in Japan and Asia to closely monitor sales activities on a customer-by-
customer and facility-by-facility basis. (Use IT investments to build and operate a database.)
●Build a sales structure on a customer-by-customer and facility-by-facility basis
Establish new department for sales targeting hospitals and nursing homes
●Deepen relationships with current customers
Use the “AD-MAP” IT tool to manage and share
information about visits to individual customers
FY2/15 Basic Policy
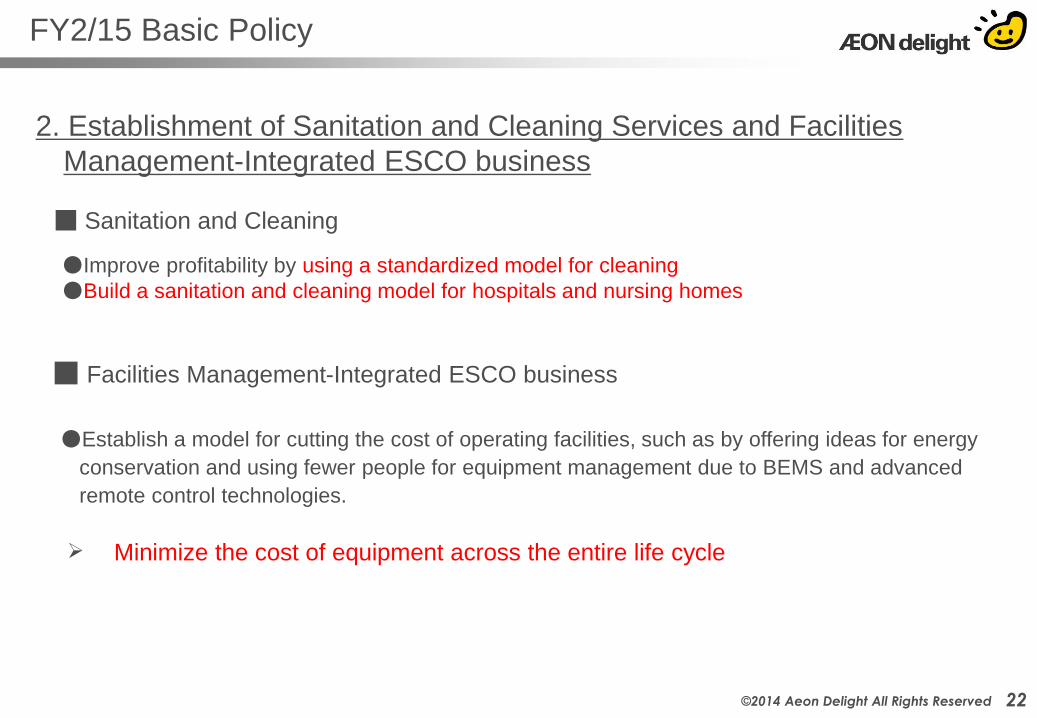
22 ©2014 Aeon Delight All Rights Reserved
2. Establishment of Sanitation and Cleaning Services and Facilities
Management-Integrated ESCO business
■ Sanitation and Cleaning
■ Facilities Management-Integrated ESCO business
●Establish a model for cutting the cost of operating facilities, such as by offering ideas for energy
conservation and using fewer people for equipment management due to BEMS and advanced
remote control technologies.
ア Minimize the cost of equipment across the entire life cycle
●Improve profitability by using a standardized model for cleaning
●Build a sanitation and cleaning model for hospitals and nursing homes
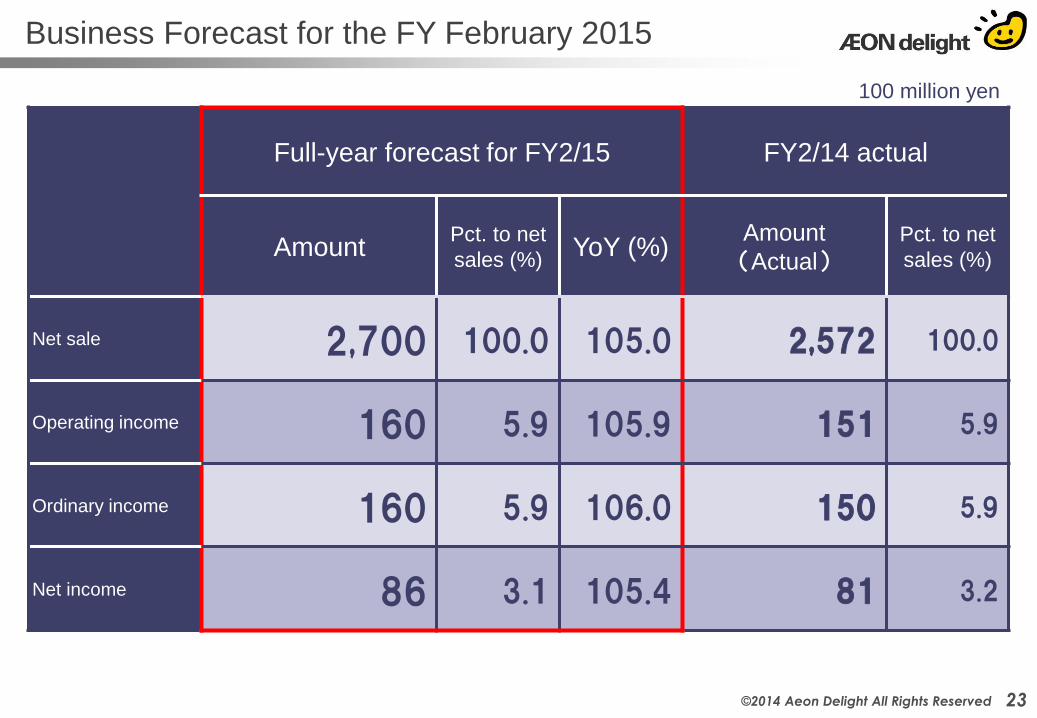
Business Forecast for the FY February 2015
Full-year forecast for FY2/15 FY2/14 actual
Amount Pct. to net
sales (%) YoY (%)
Amount
(Actual)
Pct. to net
sales (%)
Net sale 2,700 100.0 105.0 2,572 100.0
Operating income 160 5.9 105.9 151 5.9
Ordinary income 160 5.9 106.0 150 5.9
Net income 86 3.1 105.4 81 3.2
100 million yen
23 ©2014 Aeon Delight All Rights Reserved
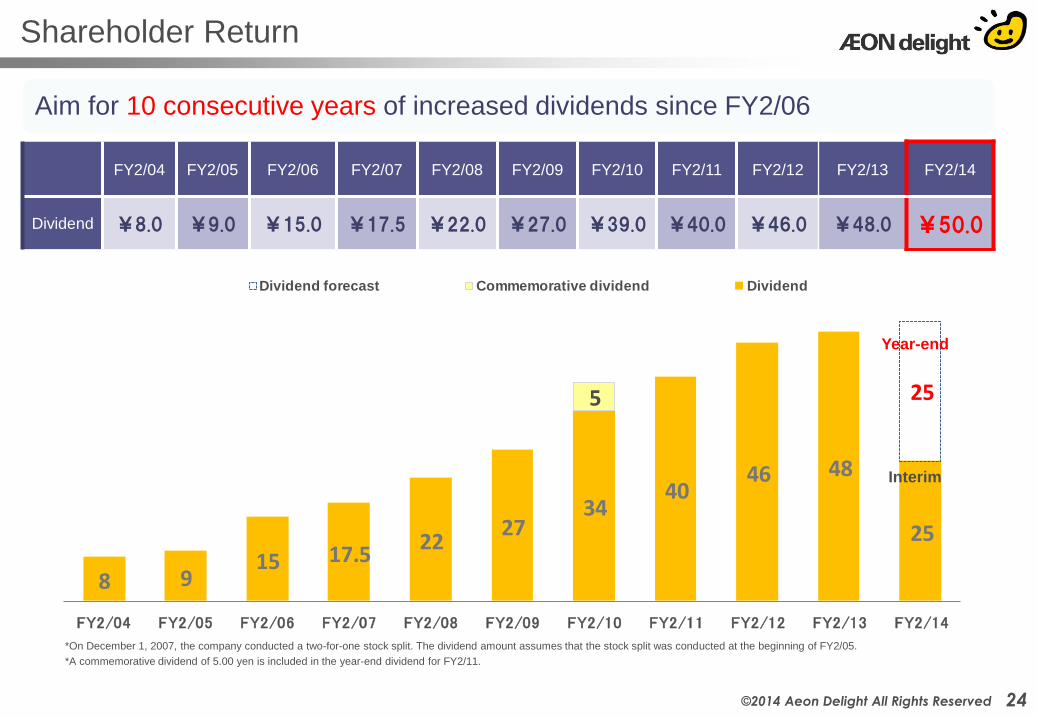
FY2/04 FY2/05 FY2/06 FY2/07 FY2/08 FY2/09 FY2/10 FY2/11 FY2/12 FY2/13 FY2/14
Dividend ¥8.0 ¥9.0 ¥15.0 ¥17.5 ¥22.0 ¥27.0 ¥39.0 ¥40.0 ¥46.0 ¥48.0 ¥50.0
*On December 1, 2007, the company conducted a two-for-one stock split. The dividend amount assumes that the stock split was conducted at the beginning of FY2/05.
*A commemorative dividend of 5.00 yen is included in the year-end dividend for FY2/11.
Aim for 10 consecutive years of increased dividends since FY2/06
8 915 17.5
2227
3440
46 48
25
5 25
FY2/04 FY2/05 FY2/06 FY2/07 FY2/08 FY2/09 FY2/10 FY2/11 FY2/12 FY2/13 FY2/14
Dividend forecast Commemorative dividend Dividend
Interim
Year-end
Shareholder Return
24 ©2014 Aeon Delight All Rights Reserved
Thank you very much for your attention.
If you have any questions or comments, please contact us below.
This presentation has been prepared based on the information available as of the date of the presentation (April 9, 2014). The business
forecasts may be revised due to various factors that may arise in the future.
IR Contact Corporate Communication Dept.
Susumu Takahashi Corporate Communication Dept.
TEL 06-6260-5632
FAX 06-6260-5653
Or visit our website at:
http://www.aeondelight.co.jp
AEON DELIGHT CO., LTD.
(Stock code: 9787)
■The information contained in these materials has been prepared by the following methods if not
specifically stated otherwise.
◇ All statements are based on consolidated results
◇ All figures of less than one million yen have been rounded down
◇ Percentages have been rounded off to one decimal place
25 ©2014 Aeon Delight All Rights Reserved
26 ©2014 Aeon Delight All Rights Reserved
Contents
1 Financial Report for the Fiscal Year Ended February 28, 2014
2 Medium-Term Management Plan (FY2/15 – FY2/17)
3 Initiatives for the Fiscal Year Ended February 28, 2015
4 Reference Materials
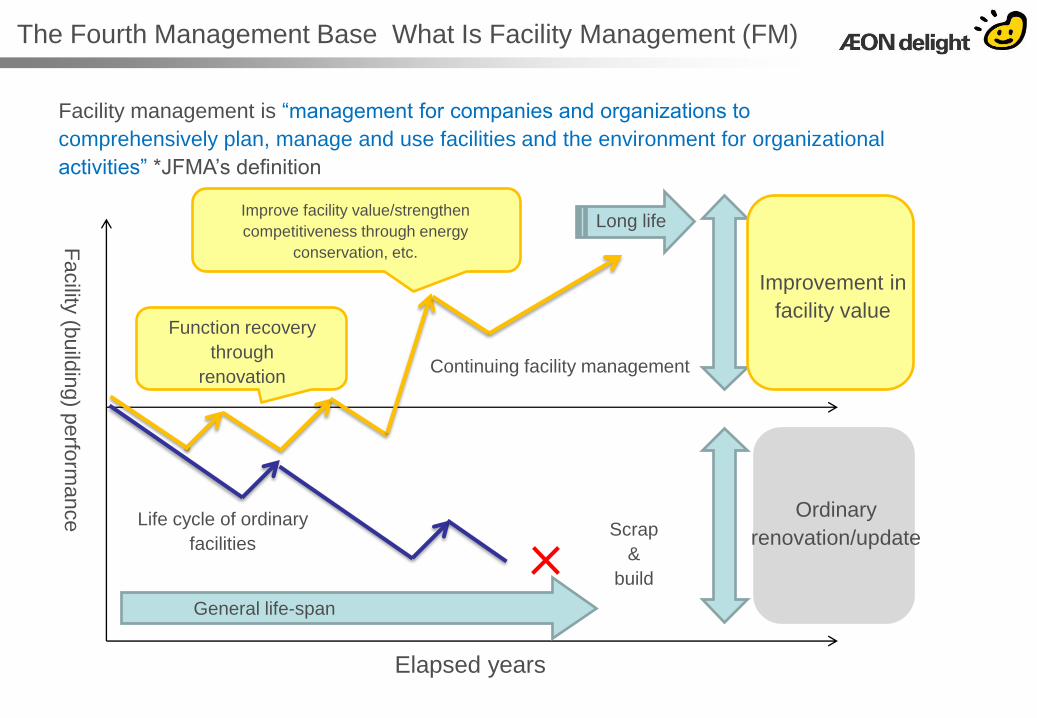
Facility management is “management for companies and organizations to
comprehensively plan, manage and use facilities and the environment for organizational
activities” *JFMA’s definition
Facility
(build
ing) p
erfo
rmance
Elapsed years
Improvement in
facility value
Ordinary
renovation/update
General life-span
Long life
Scrap
&
build
Life cycle of ordinary
facilities
Function recovery
through
renovation
Improve facility value/strengthen
competitiveness through energy
conservation, etc.
Continuing facility management
The Fourth Management Base What Is Facility Management (FM)
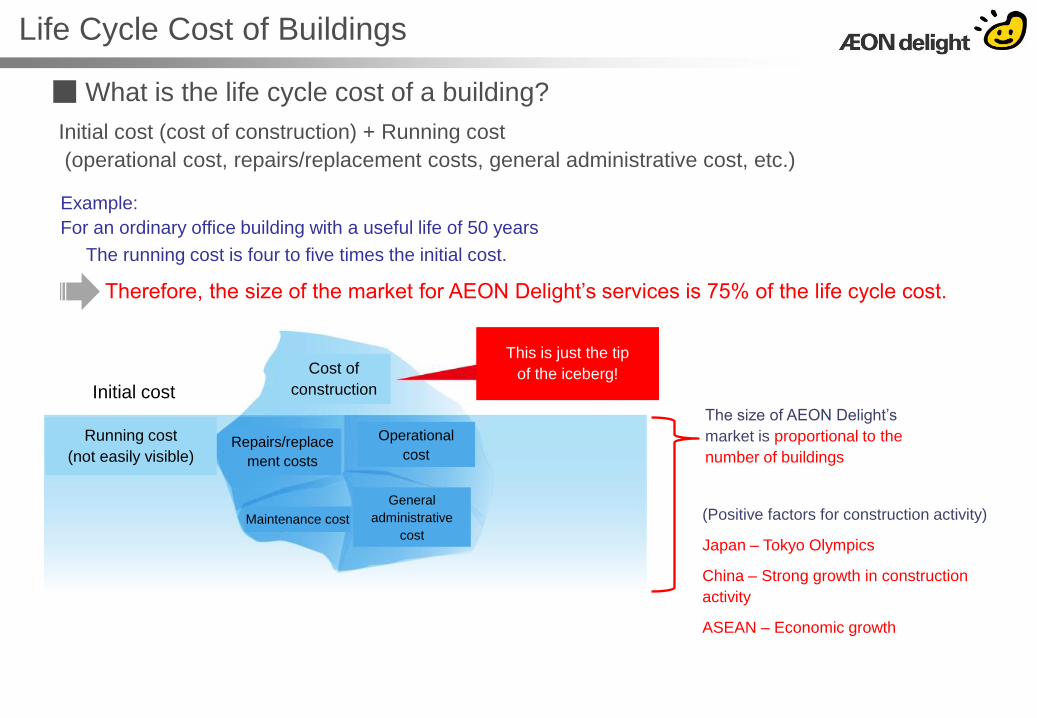
■ What is the life cycle cost of a building?
Example:
For an ordinary office building with a useful life of 50 years
The running cost is four to five times the initial cost.
Initial cost (cost of construction) + Running cost
(operational cost, repairs/replacement costs, general administrative cost, etc.)
Therefore, the size of the market for AEON Delight’s services is 75% of the life cycle cost.
The size of AEON Delight’s
market is proportional to the
number of buildings
(Positive factors for construction activity)
Japan – Tokyo Olympics
China – Strong growth in construction
activity
ASEAN – Economic growth
Life Cycle Cost of Buildings
Cost of
construction
Repairs/replace
ment costs
Operational
cost
General
administrative
cost
Maintenance cost
Initial cost
Running cost
(not easily visible)
This is just the tip
of the iceberg!
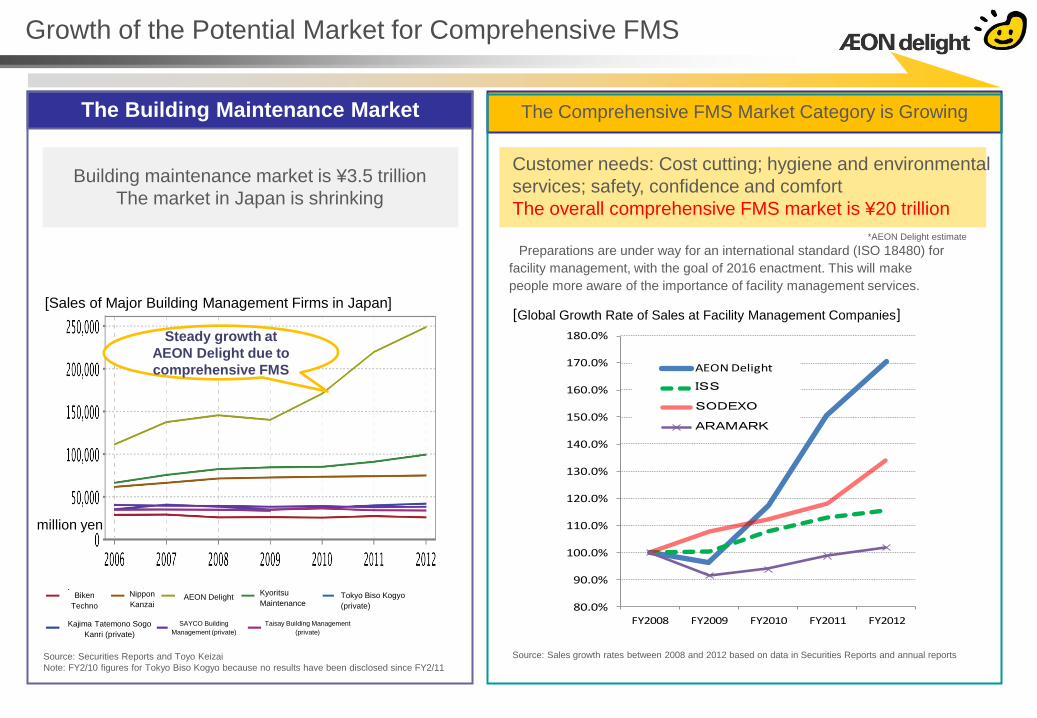
Growth of the Potential Market for Comprehensive FMS
The Building Maintenance Market The Comprehensive FMS Market Category is Growing
Building maintenance market is ¥3.5 trillion
The market in Japan is shrinking
Customer needs: Cost cutting; hygiene and environmental
services; safety, confidence and comfort
The overall comprehensive FMS market is ¥20 trillion
[Sales of Major Building Management Firms in Japan]
Source: Securities Reports and Toyo Keizai
Note: FY2/10 figures for Tokyo Biso Kogyo because no results have been disclosed since FY2/11
80.0%
90.0%
100.0%
110.0%
120.0%
130.0%
140.0%
150.0%
160.0%
170.0%
180.0%
FY2008 FY2009 FY2010 FY2011 FY2012
AEON Delight
ISS
SODEXO
ARAMARK
[Global Growth Rate of Sales at Facility Management Companies]
Steady growth at
AEON Delight due to
comprehensive FMS
*AEON Delight estimate
Source: Sales growth rates between 2008 and 2012 based on data in Securities Reports and annual reports
Preparations are under way for an international standard (ISO 18480) for
facility management, with the goal of 2016 enactment. This will make
people more aware of the importance of facility management services.
million yen
Biken
Techno
Nippon
Kanzai AEON Delight
Kajima Tatemono Sogo
Kanri (private)
Tokyo Biso Kogyo
(private)
SAYCO Building
Management (private)
Taisay Building Management
(private)
Kyoritsu
Maintenance
Million yen
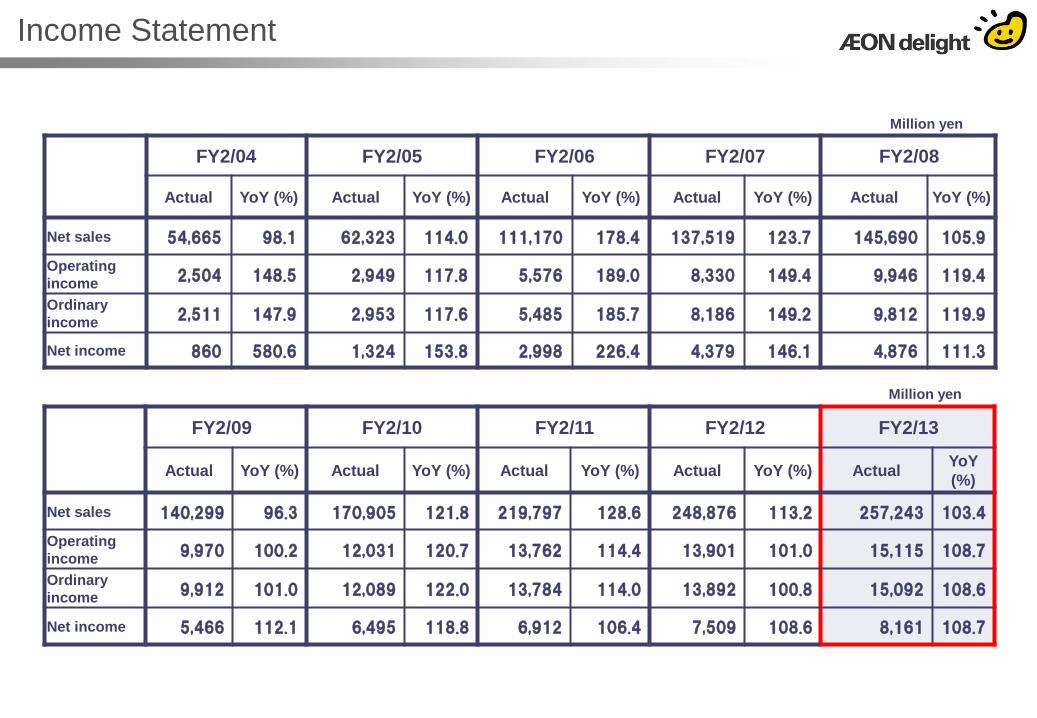
FY2/04 FY2/05 FY2/06 FY2/07 FY2/08
Actual YoY (%) Actual YoY (%) Actual YoY (%) Actual YoY (%) Actual YoY (%)
Net sales 54,665 98.1 62,323 114.0 111,170 178.4 137,519 123.7 145,690 105.9
Operating
income 2,504 148.5 2,949 117.8 5,576 189.0 8,330 149.4 9,946 119.4
Ordinary
income 2,511 147.9 2,953 117.6 5,485 185.7 8,186 149.2 9,812 119.9
Net income 860 580.6 1,324 153.8 2,998 226.4 4,379 146.1 4,876 111.3
FY2/09 FY2/10 FY2/11 FY2/12 FY2/13
Actual YoY (%) Actual YoY (%) Actual YoY (%) Actual YoY (%) Actual YoY
(%)
Net sales 140,299 96.3 170,905 121.8 219,797 128.6 248,876 113.2 257,243 103.4
Operating
income 9,970 100.2 12,031 120.7 13,762 114.4 13,901 101.0 15,115 108.7
Ordinary
income 9,912 101.0 12,089 122.0 13,784 114.0 13,892 100.8 15,092 108.6
Net income 5,466 112.1 6,495 118.8 6,912 106.4 7,509 108.6 8,161 108.7
Million yen
Income Statement
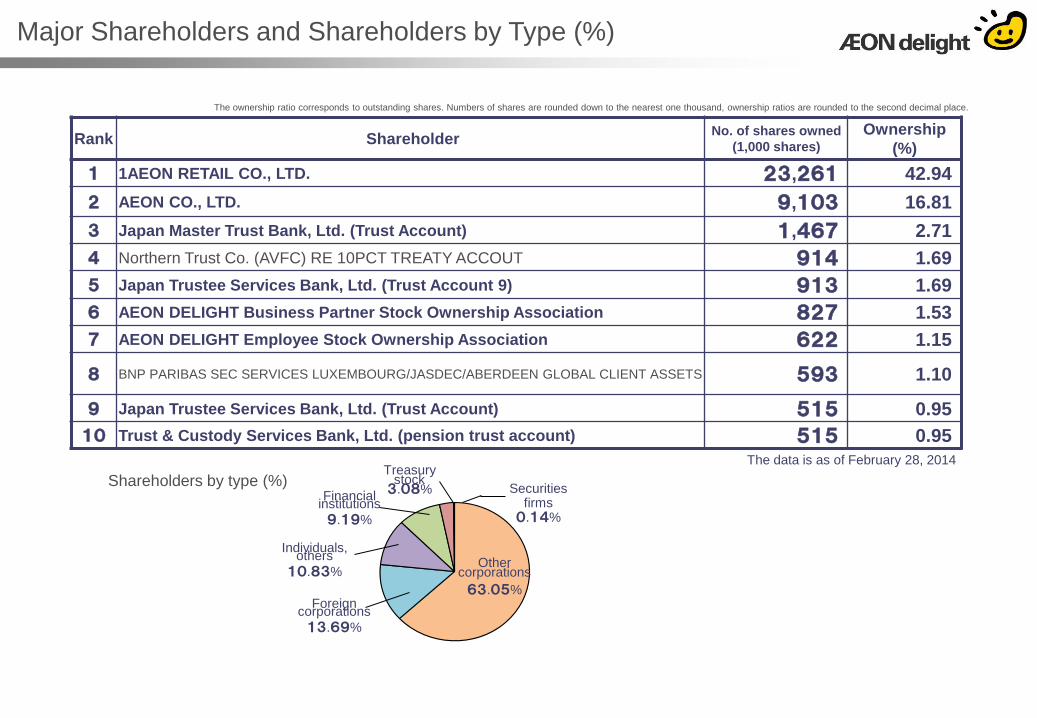
Shareholders by type (%)
Rank Shareholder No. of shares owned
(1,000 shares)
Ownership
(%)
1 1AEON RETAIL CO., LTD. 23,261 42.94
2 AEON CO., LTD. 9,103 16.81
3 Japan Master Trust Bank, Ltd. (Trust Account) 1,467 2.71
4 Northern Trust Co. (AVFC) RE 10PCT TREATY ACCOUT 914 1.69
5 Japan Trustee Services Bank, Ltd. (Trust Account 9) 913 1.69
6 AEON DELIGHT Business Partner Stock Ownership Association 827 1.53
7 AEON DELIGHT Employee Stock Ownership Association 622 1.15
8 BNP PARIBAS SEC SERVICES LUXEMBOURG/JASDEC/ABERDEEN GLOBAL CLIENT ASSETS 593 1.10
9 Japan Trustee Services Bank, Ltd. (Trust Account) 515 0.95
10 Trust & Custody Services Bank, Ltd. (pension trust account) 515 0.95
The data is as of February 28, 2014
Securities firms
0.14%
Treasury stock 3.08%
Financial institutions
9.19%
Individuals, others
10.83% Other
corporations
63.05% Foreign
corporations
13.69%
The ownership ratio corresponds to outstanding shares. Numbers of shares are rounded down to the nearest one thousand, ownership ratios are rounded to the second decimal place.
Major Shareholders and Shareholders by Type (%)
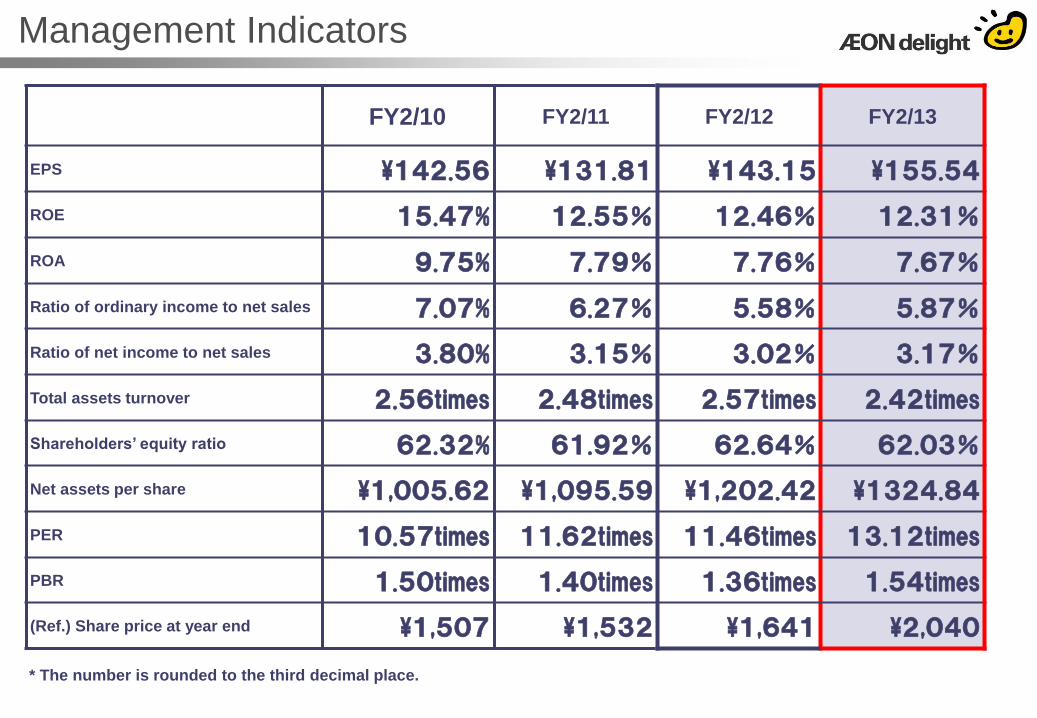
FY2/10 FY2/11 FY2/12 FY2/13
EPS ¥142.56 ¥131.81 ¥143.15 ¥155.54
ROE 15.47% 12.55% 12.46% 12.31%
ROA 9.75% 7.79% 7.76% 7.67%
Ratio of ordinary income to net sales 7.07% 6.27% 5.58% 5.87%
Ratio of net income to net sales 3.80% 3.15% 3.02% 3.17%
Total assets turnover 2.56times 2.48times 2.57times 2.42times
Shareholders’ equity ratio 62.32% 61.92% 62.64% 62.03%
Net assets per share ¥1,005.62 ¥1,095.59 ¥1,202.42 ¥1324.84
PER 10.57times 11.62times 11.46times 13.12times
PBR 1.50times 1.40times 1.36times 1.54times
(Ref.) Share price at year end ¥1,507 ¥1,532 ¥1,641 ¥2,040
* The number is rounded to the third decimal place.
Management Indicators