Embed Size (px)
Citation preview

Financial Results for Q2 2020
July 22, 2020

This presentation contains forward-looking statements regarding Teradyne’s future business prospects, the impact of the COVID-19 outbreak, results of operations, market conditions, earnings per share, the payment of a quarterly dividend, the repurchase of Teradyne common stock pursuant to a share repurchase program, and the impact of U.S. export and tariff laws. Such statements are based on the current assumptions and expectations of Teradyne’s management and are neither promises nor guarantees of future performance, events, earnings per share, use of cash, payment of dividends, repurchases of common stock, payment of the senior convertible notes, the impact of the COVID-19 outbreak, or the impact of U.S. export and tariff laws. There can be no assurance that management’s estimates of Teradyne’s future results or other forward-looking statements will be achieved. Additionally, the current dividend program may be modified, suspended or discontinued at any time. On May 16, 2019, Huawei and 68 of its affiliates, including HiSilicon, were added to the U.S. Department of Commerce Entity List under U.S. Export Administration Regulations (the “EAR”). This action by the U.S. Department of Commerce imposed new export licensing requirements on exports, re-exports, and in-country transfers of all U.S. - regulated products, software and technology to the designated Huawei entities. While most of Teradyne’s products are not subject to the EAR and therefore not affected by the Entity List restrictions, some of its products are currently manufactured in the U.S. and thus subject to the Entity List restrictions. Compliance with the current Entity List restrictions has not significantly impacted Teradyne’s sales. On May 15, 2020, the U.S. Department of Commerce published new regulations expanding the scope of the U.S. EAR to include additional products that would become subject to the Entity List restrictions relating to Huawei and the designated Huawei entities including HiSilicon. The comment period for the new regulations ended on July 14, 2020. These new regulations restrict the sale to Huawei and the designated Huawei entities of items, such as semiconductor devices, manufactured by Huawei’s contract manufacturers under specific, detailed conditions set forth in the new regulations. While the new regulations do not impose any new restrictions on Teradyne directly, the new regulations may impact Teradyne’s sales to third party contract manufacturers used by Huawei and HiSilicon to manufacture and test semiconductor and other electronic devices. Because the impact of these new regulations on Huawei’s business is both fluid and uncertain, at this time, Teradyne does not know the potential extent of the impact of the new regulations on its business with Huawei, HiSilicon and their contract manufacturers. However, it is possible that these new regulations and any other additional regulations that may be implemented by the U.S. Department of Commerce or other government agency could have a material impact on Teradyne’s business and financial results. On April 28, 2020, the Department of Commerce published new export control regulations for certain U.S. products and technology sold to military and civilian end users in China. The regulations went into effect on June 29, 2020. Teradyne does not expect that compliance with the new export controls will significantly impact its ability to sell products to its customers in China or to manufacture products in China. The new export controls, however, could disrupt the Company’s supply chain, increase compliance costs and impact the demand for the Company’s products in China and, thus, have a material adverse impact on Teradyne’s business, financial condition or results of operations. In addition, while the Company maintains an export compliance program, its compliance controls could be circumvented, exposing the Company to legal liabilities. Teradyne will continue to assess the potential impact of the new export controls on its business and operations and take appropriate actions, including filing for licenses with the Department of Commerce, to minimize any disruption. However, Teradyne cannot be certain that the actions it takes will mitigate all of the risks associated with the new export controls that may impact its business. The global outbreak of the recent novel strain of the coronavirus (COVID-19) has resulted in authorities implementing numerous measures to try to contain the virus, such as travel bans and restrictions, quarantines, shelter in place orders, and shutdowns. These measures have impacted and may further impact Teradyne’s workforce and operations, the operations of its customers, and those of its contract manufacturers and suppliers. The COVID-19 pandemic has adversely impacted the Company’s results of operations, including increased costs company-wide and decreased sales in its industrial automation businesses.
2
SAFE HARBOR, page 1 of 2

At this time, the Company cannot accurately estimate the amount of the impact for Teradyne’s 2020 financial results and to its future financial results. There is considerable uncertainty regarding the impact on Teradyne’s business from the measures in place and potential future measures, and restrictions on Teradyne’s access to its manufacturing facilities or on its support operations or workforce, or similar limitations for its contractor manufacturers and suppliers, and restrictions or disruptions of transportation, such as reduced availability of transportation and increased border controls or closures, could limit Teradyne’s capacity to meet customer demand and have a material adverse effect on its financial condition and results of operations. The COVID-19 outbreak has significantly increased economic and demand uncertainty in Teradyne’s markets. This uncertainty could result in a significant decrease in demand for Teradyne’s products for an uncertain period of time. The spread of COVID-19 has caused Teradyne to modify its business practices (including employee travel, employees working remotely, and cancellation of physical participation in meetings, events and conferences), and the Company may take further actions as may be required by government authorities or that it determines are in the best interests of its employees, customers, contract manufacturers and suppliers. There is uncertainty that such measures will be sufficient to mitigate the risks posed by the virus, and Teradyne’s ability to perform critical functions could be impacted. Due to the uncertainty regarding the length, severity and potential business impact of the COVID-19 pandemic, Teradyne has suspended its stock repurchase program announced in January 2020. At this time, Teradyne does not know whether or when it will continue its 2020 repurchase plan or authorize future stock repurchase programs. The degree to which COVID-19 impacts Teradyne’s results will depend on future developments, which are highly uncertain and cannot be predicted, including, but not limited to, the duration and continued spread of the outbreak, its severity, the actions to contain the virus or treat its impact, and how quickly and to what extent normal economic and operating conditions can resume. Important factors that could cause actual results, earnings per share, use of cash, dividend payments, repurchases of common stock, or payment of the senior convertible notes to differ materially from those presently expected include: conditions affecting the markets in which Teradyne operates; decreased or delayed product demand from one or more significant customers; development, delivery and acceptance of new products; the ability to grow the Industrial Automation business; increased research and development spending; deterioration of Teradyne’s financial condition; the impact of the COVID-19 outbreak and related government responses on the market and demand for Teradyne’s products, on its contract manufacturers and supply chain, and on its workforce; the consummation and success of any mergers or acquisitions; unexpected cash needs; insufficient cash flow to make required payments and pay the principal amount on the senior convertible notes; the business judgment of the board of directors that a declaration of a dividend or the repurchase of common stock is not in the company’s best interests; additional U.S. tax regulations or IRS guidance; the impact of any tariffs or export controls imposed in the U.S. or China; compliance with trade protection measures or export restrictions; the impact of U.S. Department of Commerce or other government agency regulations relating to Huawei and HiSilicon; and other events, factors and risks disclosed in filings with the SEC, including, but not limited to, the “Risk Factors” sections of Teradyne’s Annual Report on Form 10-K for the fiscal year ended December 31, 2019 and Quarterly Report on Form 10-Q for the fiscal quarter ended March 29, 2020. The forward-looking statements provided by Teradyne in this presentation represent management’s views as of the date of this presentation. Teradyne anticipates that subsequent events and developments may cause management’s views to change. However, while Teradyne may elect to update these forward-looking statements at some point in the future, Teradyne specifically disclaims any obligation to do so. These forward-looking statements should not be relied upon as representing Teradyne’s views as of any date subsequent to the date of this presentation.
3
SAFE HARBOR, page 2 of 2

Business Update and Outlook
4
Mark Jagiela, Teradyne President and CEO

$0.66$1.00
$1.33
$0.00
$0.20
$0.40
$0.60
$0.80
$1.00
$1.20
$1.40
Q2'19 Q1'20 Q2'20
Q2’20 Summary
5(1) See appendix for GAAP to Non-GAAP reconciliation
• Q2’20 sales of $839M, up 49% from Q2’19
• Mobility related System-on-a-Chip (SOC) and Wireless Test demand strong
• Memory test shipments for Flash and LPDDR-5 DRAM continued at a high level
• 1H‘20 sales up 46% from 1H’19 on strength in test businesses
• 1H‘20 non-GAAP EPS up 95% from 1H’19 on higher sales and constrained spending
Quarterly Sales 1st Half Sales and Non-GAAP EPS(1)
• Non-GAAP EPS of $1.33 up 102% from Q2’19
• Higher profit due to drop through on higher sales
• OPEX spending below guidance
49% Sales Growth and 102% Non-GAAP Earnings Per Share Growth vs Q2’19
$564M$704M
$839M
$M
$200M
$400M
$600M
$800M
$1,000M
Q2'19 Q1'20 Q2'20
49%
Non-GAAP EPS(1)
102%
$1.0B $1.1B
$1.5B
$1.04 $1.20
$2.34
$-
$0.50
$1.00
$1.50
$2.00
$2.50
$3.00
$3.50
$0.0B
$0.5B
$1.0B
$1.5B
$2.0B
1H18 1H19 1H20
Sales EPS

• Test demand remained strong in Q2 and first half 2020. Industrial Automation (IA) demand weak due to COVID-19 related shutdowns in North America and Europe.
• Growing test intensity and efficient operating model driving Teradyne’s performance.• Q2’20 Semiconductor Test sales up 76% from Q2’19 on strong SOC growth in
mobility and Flash/DRAM memory test demand.• Supply line management team and partners successfully overcame Covid related
issues to meet requests for accelerated deliveries resulting in revenue and EPS above guidance.
• New trade regulations did not adversely impact Q2’20 revenue. Potential impact in 2H’20 and beyond expected to be limited and is reflected in 2H’20 plans.
• Universal Robots slowed in Q2’20, MiR stronger on healthcare related demand. Expect IA sequential growth in Q3’20 on improving demand.
• UltraFLEX+ Design-win ramps, Magnum memory test, and strong SLT and HDD demand driving shipments in Q3
• SOC market expected to be $3.1-3.4B in ‘20, Memory test market expected to be $800- $850 million.
6
July 2020 Summary

Second Quarter 2020 Financial Results and Third Quarter 2020 Guidance
7
Sanjay Mehta, Teradyne Vice President and Chief Financial Officer

Balance Sheet & Capital Return
8
(1) Includes MiR and AutoGuide(2) Includes depreciation, stock based compensation, amortization of acquired intangible assets and amortization of the non-cash convertible debt discount(3) Teradyne calculates free cash flow as: GAAP Cash flow from operations, excluding discontinued operations, less property, plant and equipment additions; see GAAP to
non–GAAP reconciliations.
Q2’19Actual
Q1’20Actual
Q2’20Actual
Cash and Marketable Securities $994M $905M $1,065M
Inventory $164M $183M $206M
DSO 60 Days 62 Days 75 Days
Acquisition Earn-out Accruals(1) $27M $20M $50M
Capital Additions $33M $37M $47MDepreciation and Amortization(2) $38M $42M $44M
Free Cash Flow(3) $112M $6M $178M
Capital Return$91M $79M $9M$15M $17M $17M
BuybacksDividends

Sales up 19% vs Q2’19
WiFi 6 and 5G production demand
strong
WiFi 6e early buying, expect broad adoption in
2021
Sales down 2% vs Q2’19
Storage Test revenue contracted as expected. HDDs and System Level
Test demand expected to drive growth in Q3’20
Sales down 21% vs Q2’19
UR sales down 32% ,MiR sales up 7% vs Q2’19
Expect Q2’20 was revenue trough
Wireless TestSystem Test
Q2’20 Segment Summary
9
Sales up 76% vs Q2’19
Mobility test demand, including 5G handset
main driver
FLASH and DRAM test demand strong
$72M $49M2nd
Qua
rter
Sa
les
Key
Hig
hlig
hts
$59M$659M
Semiconductor Test
Industrial Automation
Semi Product $576M
Semi Service $83M
SemiTest Sales
2ndQ
uart
er S
ales
Det
ail Industrial Automation Revenue
26%
43%
29%
2%Asia
Europe
North America
Rest of world
Total Company Service: $104M

Q2’20 Non-GAAP Results
10
(1) See attached appendix for GAAP to non-GAAP reconciliations
$s in millions, except EPS Q2’19 Actual(1) Q1’20 Actual(1) Q2’20 Actual(1)
Sales $564M $704M $839M
Gross Margin 57.5% $324M 57.6% $406M 56.2% $472M
R&D 14.4% $81M 12.1% $85M 11.2% $94M
SG&A 19.3% $109M 15.8% $111M 13.5% $113M
OPEX 33.7% $190M 27.9% $197M 24.7% $207M
Operating Profit 23.8% $134M 29.7% $209M 31.5% $264MIncome Taxes (& effective tax rate)
16.2% $22M 15.0% $30M 14.1% $38M
EPS $0.66 $1.00 $1.33
Diluted Shares 172M 173M 173M
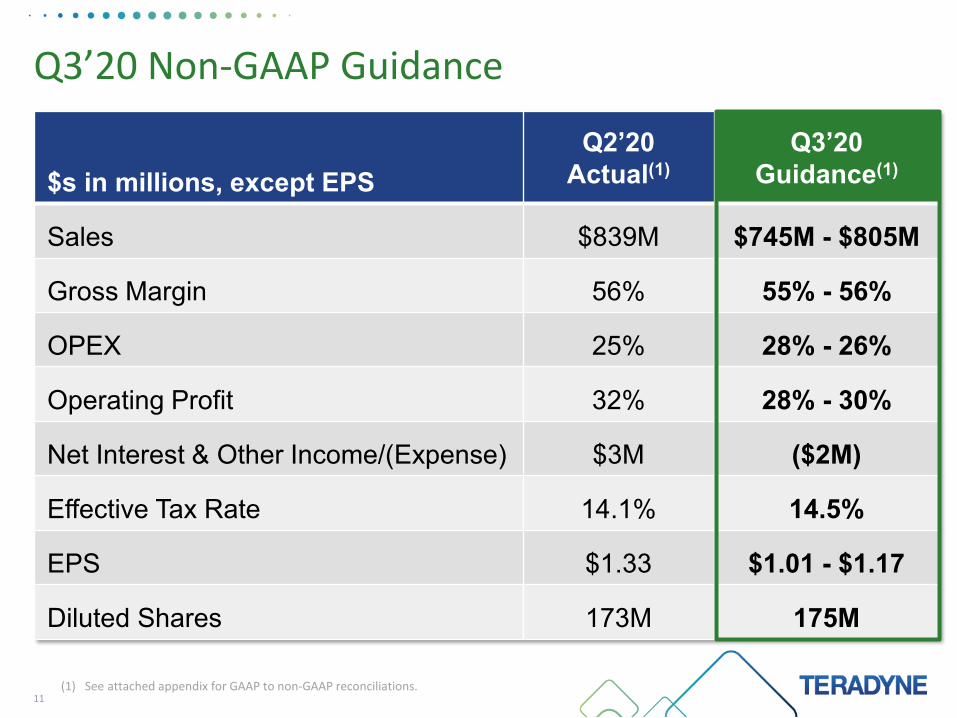
Q3’20 Non-GAAP Guidance
11(1) See attached appendix for GAAP to non-GAAP reconciliations.
$s in millions, except EPSQ2’20
Actual(1)Q3’20
Guidance(1)
Sales $839M $745M - $805M
Gross Margin 56% 55% - 56%
OPEX 25% 28% - 26%
Operating Profit 32% 28% - 30%
Net Interest & Other Income/(Expense) $3M ($2M)
Effective Tax Rate 14.1% 14.5%
EPS $1.33 $1.01 - $1.17
Diluted Shares 173M 175M
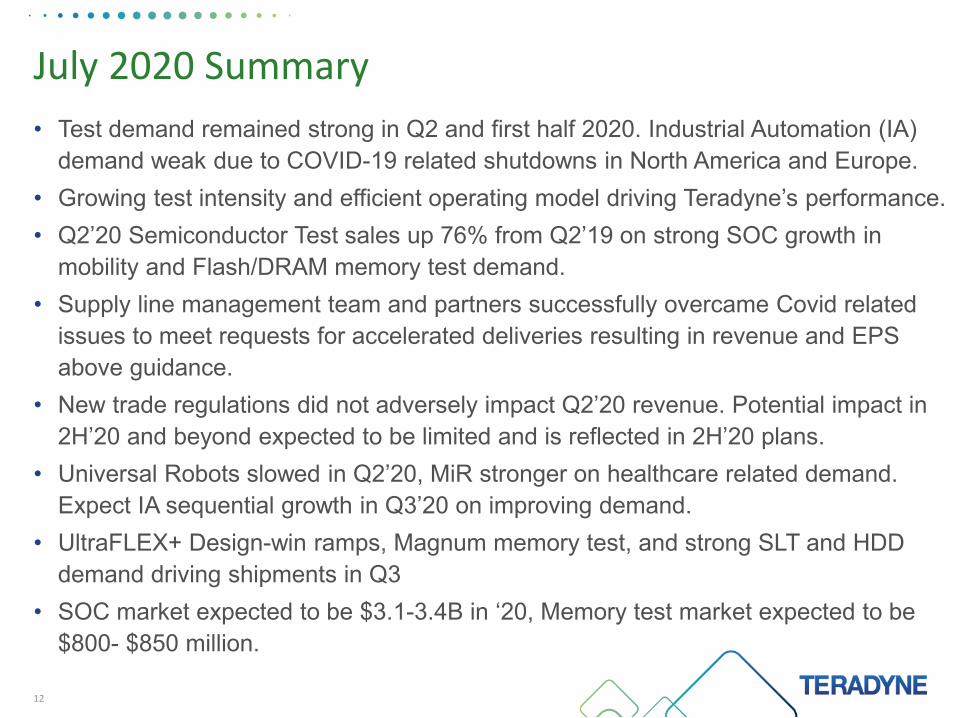
• Test demand remained strong in Q2 and first half 2020. Industrial Automation (IA) demand weak due to COVID-19 related shutdowns in North America and Europe.
• Growing test intensity and efficient operating model driving Teradyne’s performance.• Q2’20 Semiconductor Test sales up 76% from Q2’19 on strong SOC growth in
mobility and Flash/DRAM memory test demand.• Supply line management team and partners successfully overcame Covid related
issues to meet requests for accelerated deliveries resulting in revenue and EPS above guidance.
• New trade regulations did not adversely impact Q2’20 revenue. Potential impact in 2H’20 and beyond expected to be limited and is reflected in 2H’20 plans.
• Universal Robots slowed in Q2’20, MiR stronger on healthcare related demand. Expect IA sequential growth in Q3’20 on improving demand.
• UltraFLEX+ Design-win ramps, Magnum memory test, and strong SLT and HDD demand driving shipments in Q3
• SOC market expected to be $3.1-3.4B in ‘20, Memory test market expected to be $800- $850 million.
12
July 2020 Summary

Supplemental Information
13

In addition to disclosing results that are determined in accordance with GAAP, Teradyne also discloses in this presentation and on the earnings call non-GAAP results of operations that exclude certain income items and charges. These results are provided as a complement to results provided in accordance with GAAP. These non-GAAP performance measures are used to make operational decisions, to determine employee compensation, to forecast future operational results, and for comparison with the Company’s business plan, historical operating results and the operating results of the Company’s competitors. Management believes each of these non-GAAP performance measures provides useful supplemental information for investors, allowing greater transparency to the information used by management in its operational decision making and in the review of the Company’s financial and operational performance, as well as facilitating meaningful comparisons of the Company’s results in the current period compared with those in prior and future periods. A reconciliation of each available GAAP to non-GAAP financial measure discussed in this presentation is contained in the following slides and on the Teradyne website at www.teradyne.com by clicking on "Investors" and then selecting the "GAAP to Non-GAAP Reconciliation" link. The non-GAAP performance measures discussed in this presentation may not be comparable to similarly titled measures used by other companies. The presentation of non-GAAP measures is not meant to be considered in isolation, as a substitute for, or superior to, financial measures or information provided in accordance with GAAP.
14
Appendix | GAAP to Non-GAAP Reconciliation

Appendix | GAAP to Non-GAAP Reconciliation
15
GAAP to Non-GAAP Earnings Reconciliation
(In millions, except per share amounts)Quarter Ended
June 28,2020
% of Net Revenues
March 29,2020
% of Net Revenues
June 30,2019
% of Net Revenues
Net revenues 838.7$ 704.4$ 564.2$
Gross profit GAAP 471.5$ 56.2% 405.6$ 57.6% 323.9$ 57.4%Inventory step-up 0.1 0.0% 0.1 0.0% 0.4 0.1%
Gross profit non-GAAP 471.6$ 56.2% 405.7$ 57.6% 324.3$ 57.5%
Income from operations - GAAP 217.9$ 26.0% 206.7$ 29.3% 134.0$ 23.8%Acquired intangible assets amortization 8.9 1.1% 9.9 1.4% 10.1 1.8%
Restructuring and other (1) 37.2 4.4% (7.6) -1.1% (10.4) -1.8% Inventory step-up 0.1 0.0% 0.1 0.0% 0.4 0.1%Income from operations - non-GAAP 264.1$ 31.5% 209.1$ 29.7% 134.1$ 23.8%
June 28,2020
% of Net Revenues Basic Diluted
March 29,2020
% of Net Revenues Basic Diluted
June 30,2019
% of Net Revenues Basic Diluted
Net income - GAAP 188.9$ 22.5% 1.14$ 1.05$ 176.2$ 25.0% 1.06$ 0.97$ 97.4$ 17.3% 0.57$ 0.55$ Restructuring and other (1) 37.2 4.4% 0.22 0.21 (7.6) -1.1% (0.05) (0.04) (10.4) -1.8% (0.06) (0.06)
Acquired intangible assets amortization 8.9 1.1% 0.05 0.05 9.9 1.4% 0.06 0.05 10.1 1.8% 0.06 0.06 Interest and other (2) 3.6 0.4% 0.02 0.02 3.5 0.5% 0.02 0.02 3.4 0.6% 0.02 0.02 Pension mark-to-market adjustment (2) (0.1) 0.0% (0.00) (0.00) - - - - 0.4 0.1% 0.00 0.00 Inventory step-up 0.1 0.0% 0.00 0.00 0.1 0.00 0.00 0.00 0.4 0.1% 0.00 0.00
Exclude discrete tax adjustments (3) (1.1) -0.1% (0.01) (0.01) (7.7) -1.1% (0.05) (0.04) 13.9 2.5% 0.08 0.08 Non-GAAP tax adjustments (8.3) -1.0% (0.05) (0.05) (1.9) -0.3% (0.01) (0.01) (2.0) -0.4% (0.01) (0.01)
Convertible share adjustment (4) - - - 0.06 - - - 0.04 - - - 0.02
Net income - non-GAAP 229.2$ 27.3% 1.38$ 1.33$ 172.5$ 24.5% 1.04$ 1.00$ 113.2$ 20.1% 0.66$ 0.66$
165.8 166.6 171.2 180.3 180.7 178.6
Exclude dilutive shares related to convertible note transaction (7.6) (7.3) (6.2) 172.7 173.4 172.4 Non-GAAP weighted average common shares - diluted
Net Incomeper Common Share
Net Income per Common Share
Net Incomeper Common Share
GAAP weighted average common shares - dilutedGAAP and non-GAAP weighted average common shares - basic

Appendix | GAAP to Non-GAAP Reconciliation
16
(1) Restructuring and other consists of:Quarter Ended
June 28,2020
March 29,2020
June 30,2019
Contingent consideration fair value adjustment 29.3$ (10.0)$ (11.7)$ Contract termination settlement fee 4.0 - - Acquisition related expenses and compensation 3.1 1.4 0.5 Employee severance - 0.7 0.8 Other 0.8 0.3 -
37.2$ (7.6)$ (10.4)$
(2)
(3)
(4)
For the quarters ended June 28, 2020, March 29, 2020, and June 30, 2019, adjustment to exclude non-cash convertible debt interest expense. For the quarters ended June 28, 2020 and June 30, 2019, adjustment to exclude actuarial (gain) loss recognized under GAAP in accordance with Teradyne's mark-to-market pension accounting.
For the quarters ended June 28, 2020, March 29, 2020, and June 30, 2019, adjustment to exclude discrete income tax items. For the quarter ended June 30, 2019, income tax (benefit) provision includes a $15 million tax provision related to the finalization of our toll tax charge.
For the quarters ended June 28, 2020 and March 29, 2020, the non-GAAP diluted EPS calculation adds back $1.3 million of convertible debt interest expense to non-GAAP net income and non-GAAP weighted average diluted common shares include 5.8 million and 5.5 million shares, respectively, related to the convertible debt hedge transaction.

17
Appendix | GAAP to Non-GAAP Reconciliation
Six Months Ended
June 28,2020
% of Net Revenues
June 30,2019
% of Net Revenues
Net Revenues 1,543.0$ 1,058.3$
Gross profit GAAP 877.0$ 56.8% 611.6$ 57.8%Inventory step-up 0.2 0.0% 0.4 0.0%
Gross profit non-GAAP 877.2$ 56.9% 612.0$ 57.8%
Income from operations - GAAP 424.7$ 27.5% 227.1$ 21.5%Acquired intangible assets amortization 18.8 1.2% 20.7 2.0%
Restructuring and other (1) 29.6 1.9% (5.3) -0.5%Inventory step-up 0.2 0.0% 0.4 0.0%
Income from operations - non-GAAP 473.3$ 30.7% 242.9$ 23.0%
June 28,2020
% of Net Revenues Basic Diluted
June 30,2019
% of Net Revenues Basic Diluted
Net income - GAAP 365.1$ 23.7% 2.20$ 2.02$ 206.5$ 19.5% 1.20$ 1.16$ Acquired intangible assets amortization 18.8 1.2% 0.11 0.10 20.7 2.0% 0.12 0.12 Interest and other (2) 7.1 0.5% 0.04 0.04 6.8 0.6% 0.04 0.04 Restructuring and other (1) 29.6 1.9% 0.18 0.16 (5.3) -0.5% (0.03) (0.03) Inventory step-up 0.2 0.0% 0.00 0.00 0.4 0.0% 0.00 0.00 Pension mark-to-market adjustment (2) (0.1) 0.0% (0.00) (0.00) 0.4 0.0% 0.00 0.00 Exclude discrete tax adjustments (3) (8.7) -0.6% (0.05) (0.05) (16.2) -1.5% (0.09) (0.09)
Non-GAAP tax adjustments (10.1) -0.7% (0.06) (0.06) (5.5) -0.5% (0.03) (0.03) Convertible share adjustment - - - 0.10 - - - 0.02
Net income - non-GAAP 401.9$ 26.0% 2.42$ 2.34$ 207.8$ 19.6% 1.21$ 1.20$
166.2 172.4 180.5 177.8
Exclude dilutive shares from convertible note (7.5) (4.2) 173.0 173.6
Net Incomeper Common Share
Net Incomeper Common Share
GAAP and non-GAAP weighted average common shares - basicGAAP weighted average common shares - diluted
Non-GAAP weighted average common shares - diluted
18
Appendix | GAAP to Non-GAAP Reconciliation
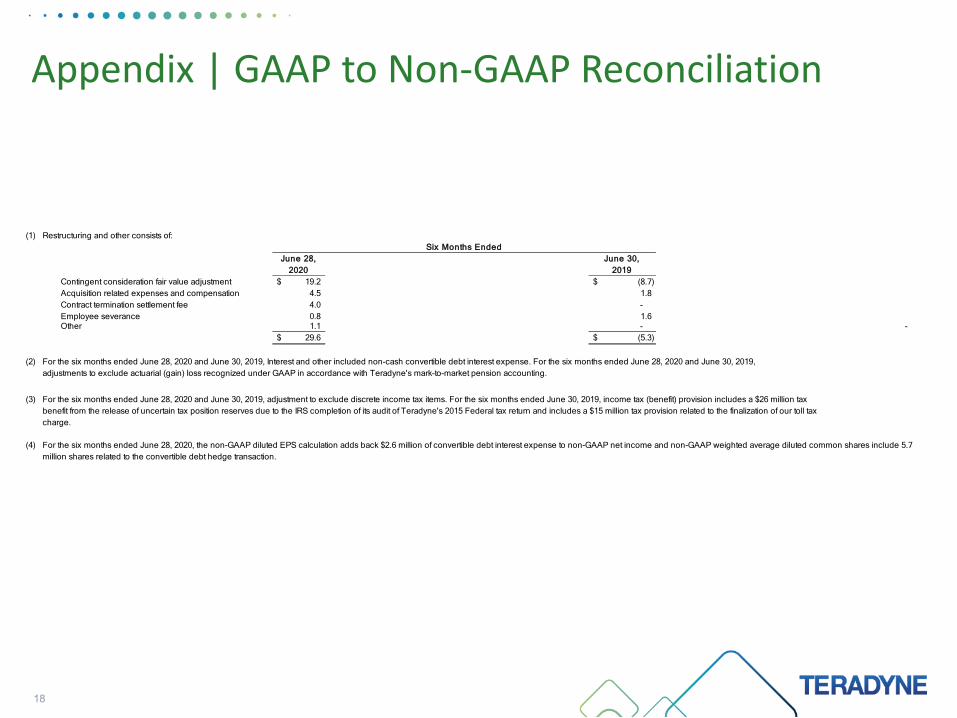
(1) Restructuring and other consists of:Six Months Ended
June 28,2020
June 30,2019
Contingent consideration fair value adjustment 19.2$ (8.7)$ Acquisition related expenses and compensation 4.5 1.8 Contract termination settlement fee 4.0 - Employee severance 0.8 1.6 Other 1.1 - -
29.6$ (5.3)$
(2)
(3)
(4)
For the six months ended June 28, 2020 and June 30, 2019, Interest and other included non-cash convertible debt interest expense. For the six months ended June 28, 2020 and June 30, 2019, adjustments to exclude actuarial (gain) loss recognized under GAAP in accordance with Teradyne's mark-to-market pension accounting.
For the six months ended June 28, 2020 and June 30, 2019, adjustment to exclude discrete income tax items. For the six months ended June 30, 2019, income tax (benefit) provision includes a $26 million tax benefit from the release of uncertain tax position reserves due to the IRS completion of its audit of Teradyne's 2015 Federal tax return and includes a $15 million tax provision related to the finalization of our toll tax charge.
For the six months ended June 28, 2020, the non-GAAP diluted EPS calculation adds back $2.6 million of convertible debt interest expense to non-GAAP net income and non-GAAP weighted average diluted common shares include 5.7 million shares related to the convertible debt hedge transaction.

19
Appendix | GAAP to Non-GAAP ReconciliationSix Months Ended
June 30,2019
% of Net Revenues
July 1,2018
% of Net Revenues
Net Revenues 1,058.3$ 1,014.4$
Gross profit GAAP 611.6$ 57.8% 577.2$ 56.9%Inventory step-up 0.4 0.0% 0.4 0.0%
Gross profit non-GAAP 612.0$ 57.8% 577.6$ 56.9%
Income from operations - GAAP 227.1$ 21.5% 217.9$ 21.5%Acquired intangible assets amortization 20.7 2.0% 17.5 1.7%
Restructuring and other (1) (5.3) -0.5% 2.1 0.2%Inventory step-up 0.4 0.0% 0.4 0.0%
Income from operations - non-GAAP 242.9$ 23.0% 237.9$ 23.5%
June 30,2019
% of Net Revenues Basic Diluted
July 1,2018
% of Net Revenues Basic Diluted
Net income - GAAP 206.5$ 19.5% 1.20$ 1.16$ 188.0$ 18.5% 0.97$ 0.94$ Acquired intangible assets amortization 20.7 2.0% 0.12 0.12 17.5 1.7% 0.09 0.09 Interest and other (2) 6.8 0.6% 0.04 0.04 6.5 0.6% 0.03 0.03 Restructuring and other (1) (5.3) -0.5% (0.03) (0.03) 2.1 0.2% 0.01 0.01 Inventory step-up 0.4 0.0% 0.00 0.00 0.4 0.0% 0.00 0.00 Pension mark-to-market adjustment (2) 0.4 0.0% 0.00 0.00 (0.1) 0.0% (0.00) (0.00) Exclude discrete tax adjustments (3) (16.2) -1.5% (0.09) (0.09) (6.8) -0.7% (0.04) (0.03)
Non-GAAP tax adjustments (5.5) -0.5% (0.03) (0.03) (5.3) -0.5% (0.03) (0.03) Convertible share adjustment - - - 0.03 - - - 0.02
Net income - non-GAAP 207.8$ 19.6% 1.21$ 1.20$ 202.3$ 19.9% 1.05$ 1.04$
172.4 193.0 177.8 199.2
Exclude dilutive shares from convertible note (4.2) (4.4) 173.6 194.8
Net Incomeper Common Share
Net Incomeper Common Share
GAAP and non-GAAP weighted average common shares - basicGAAP weighted average common shares - diluted
Non-GAAP weighted average common shares - diluted

20
Appendix | GAAP to Non-GAAP Reconciliation
(1) Restructuring and other consists of:Six Months Ended
June 30,2019
July 1,2018
Contingent consideration fair value adjustment (8.7)$ (8.5)$ Acquisition related expenses and compensation 1.8 3.3 Employee severance 1.6 6.3 Other - 0.9
(5.3)$ 2.1$
(2)
(3)
For the six months ended June 30, 2019 and July 1, 2018, Interest and other included non-cash convertible debt interest expense. For the six months ended June 30, 2019 and July 1, 2018, adjustments to exclude actuarial loss/gain recognized under GAAP in accordance with Teradyne's mark-to-market pension accounting.
For the six months ended June 30, 2019 and July 1, 2018, adjustment to exclude discrete income tax items. For the six months ended June 30, 2019, income tax (benefit) provision includes a $26 million tax benefit from the release of uncertain tax position reserves due to the IRS completion of its audit of Teradyne's 2015 Federal tax return and includes a $15 million tax provision related to the finalization of our toll tax charge.
21
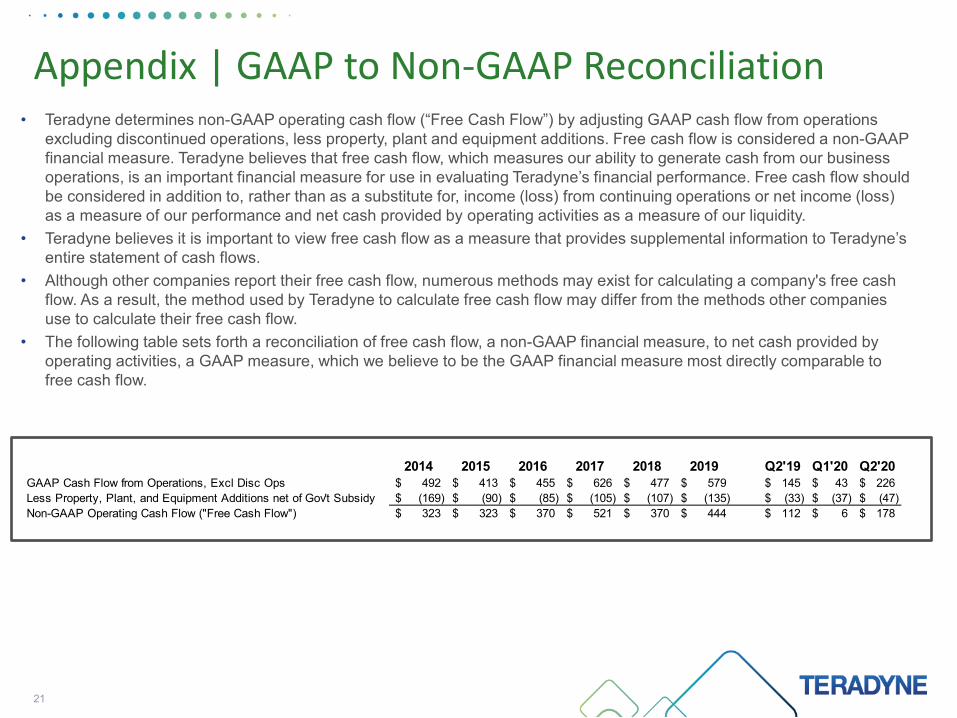
Appendix | GAAP to Non-GAAP Reconciliation• Teradyne determines non-GAAP operating cash flow (“Free Cash Flow”) by adjusting GAAP cash flow from operations
excluding discontinued operations, less property, plant and equipment additions. Free cash flow is considered a non-GAAP financial measure. Teradyne believes that free cash flow, which measures our ability to generate cash from our business operations, is an important financial measure for use in evaluating Teradyne’s financial performance. Free cash flow should be considered in addition to, rather than as a substitute for, income (loss) from continuing operations or net income (loss) as a measure of our performance and net cash provided by operating activities as a measure of our liquidity.
• Teradyne believes it is important to view free cash flow as a measure that provides supplemental information to Teradyne’s entire statement of cash flows.
• Although other companies report their free cash flow, numerous methods may exist for calculating a company's free cash flow. As a result, the method used by Teradyne to calculate free cash flow may differ from the methods other companies use to calculate their free cash flow.
• The following table sets forth a reconciliation of free cash flow, a non-GAAP financial measure, to net cash provided by operating activities, a GAAP measure, which we believe to be the GAAP financial measure most directly comparable to free cash flow.
2014 2015 2016 2017 2018 2019 Q2'19 Q1'20 Q2'20GAAP Cash Flow from Operations, Excl Disc Ops 492$ 413$ 455$ 626$ 477$ 579$ 145$ 43$ 226$ Less Property, Plant, and Equipment Additions net of Gov't Subsidy (169)$ (90)$ (85)$ (105)$ (107)$ (135)$ (33)$ (37)$ (47)$ Non-GAAP Operating Cash Flow ("Free Cash Flow") 323$ 323$ 370$ 521$ 370$ 444$ 112$ 6$ 178$

22
Appendix | GAAP to Non-GAAP Reconciliation$'s % of sales $'s % of sales $'s % of sales $'s % of sales $'s % of sales
GAAP Operating Expenses $190 34% $199 28% $254 30% $215 29% $218 27%Intangible Asset Amortization -$10 -2% -$10 -1% -$9 -1% -$6 -1% -$6 -1%Restructuring and Other $10 2% $8 1% -$37 -4%
Non GAAP Operating Expenses $190 34% $197 28% $207 25% $209 28% $212 26%
Q2'19 Q1'20 Q2'20 Q2'20 Low Guidance Q2'20 High Guidance
Q2'20:GAAP net interest and other income -$0.6Exclude non cash convertible debt interest $3.5Non-GAAP net interest and other income $2.9
Q3'20 GuidanceGAAP net interest and other income -$5.5Exclude non cash convertible debt interest $3.5Non-GAAP net interest and other income -$2.0
Q3'20 Guidance: Low End High EndGAAP Operating Profit as % of Sales 27% 29% Acquired intangible asset amortization 1% 1%Non-GAAP Operating Profit as % of Sales 28% 30%
Q3'20 GAAP Guidance Diluted Shares 184Exclude dilutive shares from convertible note -9Q3'20 Non-GAAP Guidance Diluted Shares 175
GAAP to Non-GAAP Reconciliation of Third Quarter 2020 guidance:
GAAP and non-GAAP third quarter revenue guidance: $745 million to $805 millionGAAP net income per diluted share 0.91$ 1.06$
Exclude acquired intangible assets amortization 0.03 0.03 0.02 0.02
Tax effect of non-GAAP adjustments 0.01 0.01 Convertible share adjustment 0.04 0.04
1.01$ 1.17$ Non-GAAP net income per diluted share
Exclude non-cash convertible debt interest
$'s % $'s % $'s %GAAP Income Tax $34 25% $21 11% $28 13%
Exclude discrete tax adjustments -$14 -10% $8 4% $1 1%Tax effect of non-GAAP adjustments $2 1% $2 1% $8 4%Effect of Higher Non-GAAP PBT 0% 0% -3%
Non GAAP Income Tax $22 16% $30 15% $38 14%
Q2'19 Q1'20 Q2'20
FY 2020 GAAP estimated tax rate 14.0%Adjustment for Non GAAP items 0.5%FY 2020 Non GAAP estimated tax rate 14.5%