Embed Size (px)
Citation preview
Provisional translation of the original Japanese version
November 25th, 2009
Financial Results for 1st Half, FY3/2010& Management Policies and Strategies

1
Agenda2. Management Policy in 2nd Half, FY3/2010
and Fortification of Growth Business Areas2-1. Earnings Forecast for FY3/2010 P.172-2. Growth Opportunities through
Nikko Cordial Securities 182-3. Solution Providing for Corporations /
Investment Banking Business 192-4. Financial Consulting for Individuals 202-5. Payment & Settlement Services, Consumer Finance
(1) Settlement Businesses and Stable Deposit Base 21(2) Credit Card Business 22(3) Consumer Finance 23
2-6. Overseas Strategy(1) Growth Opportunities through Alliances 24(2) Fortifying Settlement Businesses and
Deposit Base 25
3. Realizing a Solid Financial Base as a Global Player
3-1. Capital Policy in 1st Half, FY3/2010 273-2. Current Business Environment and
Tightening Capital Adequacy Requirements 28
In Closing 29(Reference) SMFG’s Group Structure 30
1. FY3/2010 Management Policy and Business Performance of 1st Half
1-1. SMFG’s Approach to Current BusinessEnvironment P.3
1-2. Overview of 1st Half, FY3/2010 and Progress of Strategic Initiatives 4
1-3. Summary of 1st Half, FY3/2010 51-4. Top-Line Profit
(1) Gross Banking Profit 6(2) Net Interest Income: Loan Balance 7(3) Net Interest Income: Loan to Deposit Spread 8
1-5. Performance by Business Unit 91-6. Expenses 101-7. Total Credit Cost 111-8. Enhancement of Risk Management 121-9. Stocks & Bonds 131-10.Contribution of Affiliates to Consolidated Profit 141-11.Capital 15
1. FY3/2010 Management Policy and Business Performance of 1st Half
3
Fortifying targeted growth business areas
Managing credit costs, risk-adjusted assets and expenses
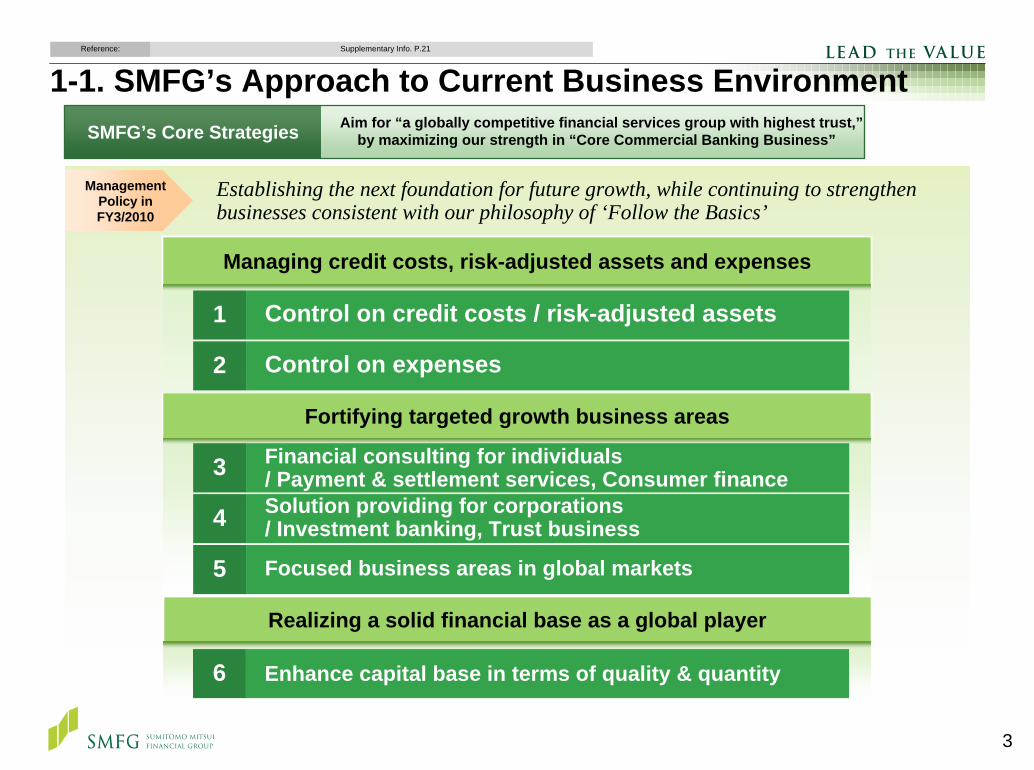
Establishing the next foundation for future growth, while continuing to strengthen businesses consistent with our philosophy of ‘Follow the Basics’
Control on credit costs / risk-adjusted assets1
Control on expenses2
Financial consulting for individuals / Payment & settlement services, Consumer finance Solution providing for corporations/ Investment banking, Trust business
3
4
5 Focused business areas in global markets
1-1. SMFG’s Approach to Current Business Environment
Realizing a solid financial base as a global player
Enhance capital base in terms of quality & quantity6
SMFG’s Core Strategies Aim for “a globally competitive financial services group with highest trust,”by maximizing our strength in “Core Commercial Banking Business”
Management Policy in FY3/2010
Reference: Supplementary Info. P.21
4
1-2. Overview of 1H,FY3/2010 and Progress of Strategic Initiatives
Managing credit costs, risk-adjusted assets and expenses Realizing a solid financial base as a global player
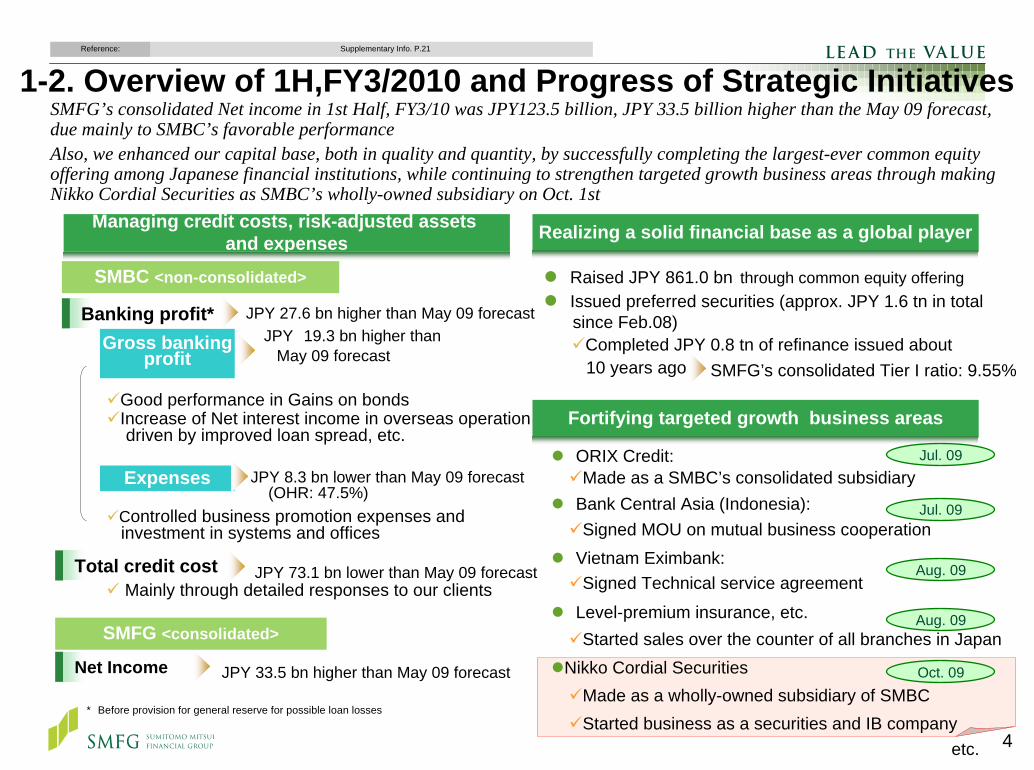
SMFG’s consolidated Net income in 1st Half, FY3/10 was JPY123.5 billion, JPY 33.5 billion higher than the May 09 forecast, due mainly to SMBC’s favorable performanceAlso, we enhanced our capital base, both in quality and quantity, by successfully completing the largest-ever common equity offering among Japanese financial institutions, while continuing to strengthen targeted growth business areas through making Nikko Cordial Securities as SMBC’s wholly-owned subsidiary on Oct. 1st
JPY 27.6 bn higher than May 09 forecastJPY 19.3 bn higher than
May 09 forecast
Good performance in Gains on bondsIncrease of Net interest income in overseas operation driven by improved loan spread, etc.
JPY 8.3 bn lower than May 09 forecast(OHR: 47.5%)
Controlled business promotion expenses and investment in systems and offices
JPY 73.1 bn lower than May 09 forecastMainly through detailed responses to our clients
SMBC <non-consolidated>
Net Income JPY 33.5 bn higher than May 09 forecast
SMFG <consolidated>
Banking profit*
Raised JPY 861.0 bn through common equity offeringIssued preferred securities (approx. JPY 1.6 tn in total since Feb.08)
Completed JPY 0.8 tn of refinance issued about 10 years ago
Fortifying targeted growth business areas
ORIX Credit:
Bank Central Asia (Indonesia):
Vietnam Eximbank:
Level-premium insurance, etc.
Nikko Cordial Securities
Jul. 09
Jul. 09
Aug. 09
Aug. 09
Oct. 09
Gross bankingprofit
Expenses
etc.
* Before provision for general reserve for possible loan losses
Reference: Supplementary Info. P.21
SMFG’s consolidated Tier I ratio: 9.55%
Total credit cost
Made as a SMBC’s consolidated subsidiary
Signed MOU on mutual business cooperation
Signed Technical service agreement
Started sales over the counter of all branches in Japan
Made as a wholly-owned subsidiary of SMBCStarted business as a securities and IB company

5
1-3. Summary of 1st Half, FY3/2010SMBC’s non-consolidated Banking profit exceeded May 09 forecast by JPY 27.6 billion, led by an increase in Gross banking profit and more stringent control on Expenses. Meanwhile, SMBC’s non-consolidated Net income exceeded May 09 forecast by JPY 42.6 billion, due mainly to a decrease in Total credit cost which was JPY 73.1 billion less than May 09 forecast.As a result, SMFG’s consolidated Net income exceeded May 09 forecast by JPY 33.5 billion, which was JPY 40.3 billion increase year over year
Data book P.1, 2Reference: Financial Results P.4, 8 Supplementary info. P.1, 2, 21
Ordinary profit 222.2 +31.3 +22.2
Net income 123.5 +40.3 +33.5
(JPY bn)
1st Half,FY3/10
YOY Change
Change from
May 09 forecast
Gross banking profit 719.3 (15.8)
+14.9
(0.9)
(19.6)
+67.2
(21.6)
+25.0
+32.2
Expenses (341.7)
+19.3
+8.3
+27.6
+73.1
+37.1
Banking profit*1 377.6
Gains (losses) on stocks (36.8)
Total credit cost*2 (156.9)
Other non-recurringgains (losses) (36.7)
+42.6
Ordinary profit 147.1
Net income 112.6
*1 Before provision for general reserve for possible loan losses*2 Including portion recorded in Extraordinary gains (losses)
SMFG’s consolidated Net income:1H FY3/09:83.2 1H FY3/10:123.5
Expenses Total creditcost
Income tax etc.
[YOY change +40.3]
SMBC non-consolidated Consolidation Related
Increasedprofits of group companies etc.
Losses on stocks
Gross banking profit
+8.1+7.1
+67.2
+14.9
(19.6)(21.6)(15.8)
Other non-recurring
gains (losses)
(JPY bn)
SMB
C<n
on-c
onso
lidat
ed>
SMFG
<con
solid
ated
>
Mai
n fa
ctor
s of
cha
nge
from
M
ay 0
9 fo
reca
st
SMFG’s consolidated Net income:May 09 forecast: 90.0 1H FY3/10: 123.5
[change from May 09 forecast +33.5]
Expenses Total creditcost
Income tax etc.
SMBC non-consolidated Consolidation Related
Decreased profits of group companies etc.
Losseson stocks
Gross banking profit
+19.3 Approx.+2.0
+73.1
+8.3
(9.1)Approx.(60.0)
(JPY bn)
Mai
n fa
ctor
s of
YO
Y ch
ange
6
131296
185
31
1,018
518
19%
9%
18%
(200)
200
600
1,000
1,400
1,800
3/00 3/01 3/02 3/03 3/04 3/05 3/06 3/07 3/08 3/09 3/10
Gains (losses) on bondsNet interest incomeOther income *2Net fees and commissions + Trust fees
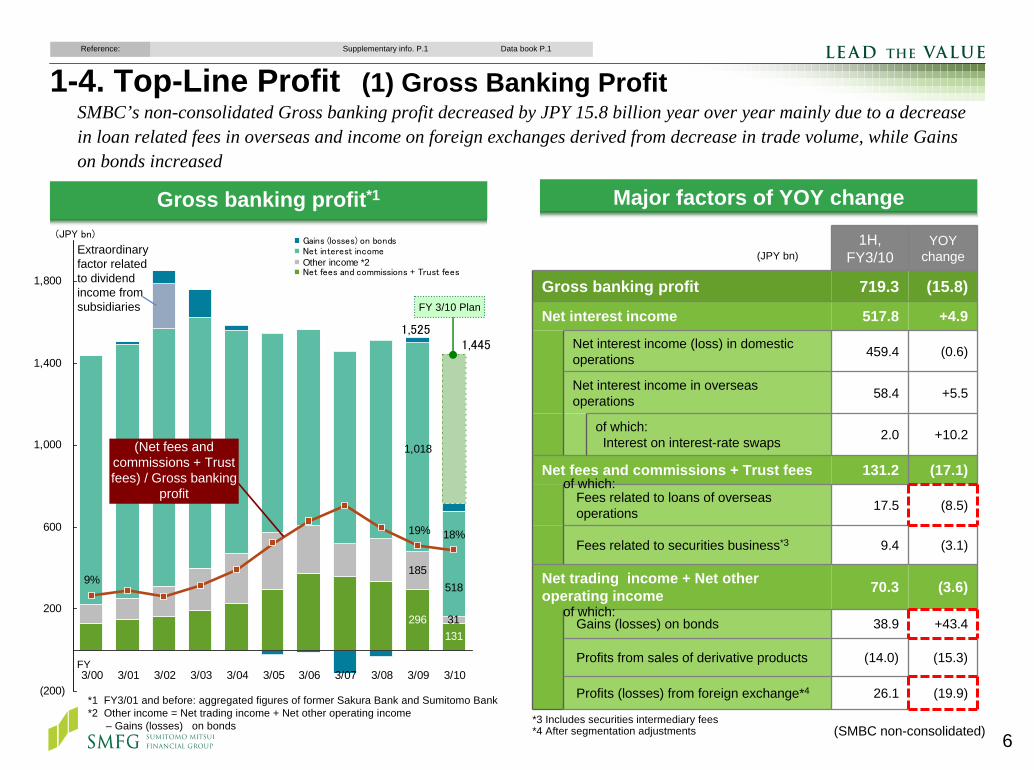
1-4. Top-Line Profit (1) Gross Banking ProfitData book P.1Reference: Supplementary info. P.1
SMBC’s non-consolidated Gross banking profit decreased by JPY 15.8 billion year over year mainly due to a decrease in loan related fees in overseas and income on foreign exchanges derived from decrease in trade volume, while Gains on bonds increased
(JPY bn)
*1 FY3/01 and before: aggregated figures of former Sakura Bank and Sumitomo Bank*2 Other income = Net trading income + Net other operating income
– Gains (losses) on bonds (SMBC non-consolidated)
FY
1H,FY3/10
YOY change
Gross banking profit 719.3 (15.8)
Net interest income 517.8 +4.9
Net interest income (loss) in domestic operations 459.4 (0.6)
Net interest income in overseas operations 58.4 +5.5
of which: Interest on interest-rate swaps 2.0 +10.2
Fees related to loans of overseas operations 17.5 (8.5)
Fees related to securities business*3 9.4 (3.1)
Net fees and commissions + Trust fees 131.2 (17.1)
Net trading income + Net other operating income 70.3 (3.6)
Gains (losses) on bonds 38.9 +43.4
Profits from sales of derivative products (14.0) (15.3)
Profits (losses) from foreign exchange*4 26.1 (19.9)
Gross banking profit*1 Major factors of YOY change
1,5251,445
Extraordinary factor related to dividend income from subsidiaries FY 3/10 Plan
*3 Includes securities intermediary fees*4 After segmentation adjustments
(JPY bn)
(Net fees and commissions + Trust fees) / Gross banking
profitof which:
of which:
7
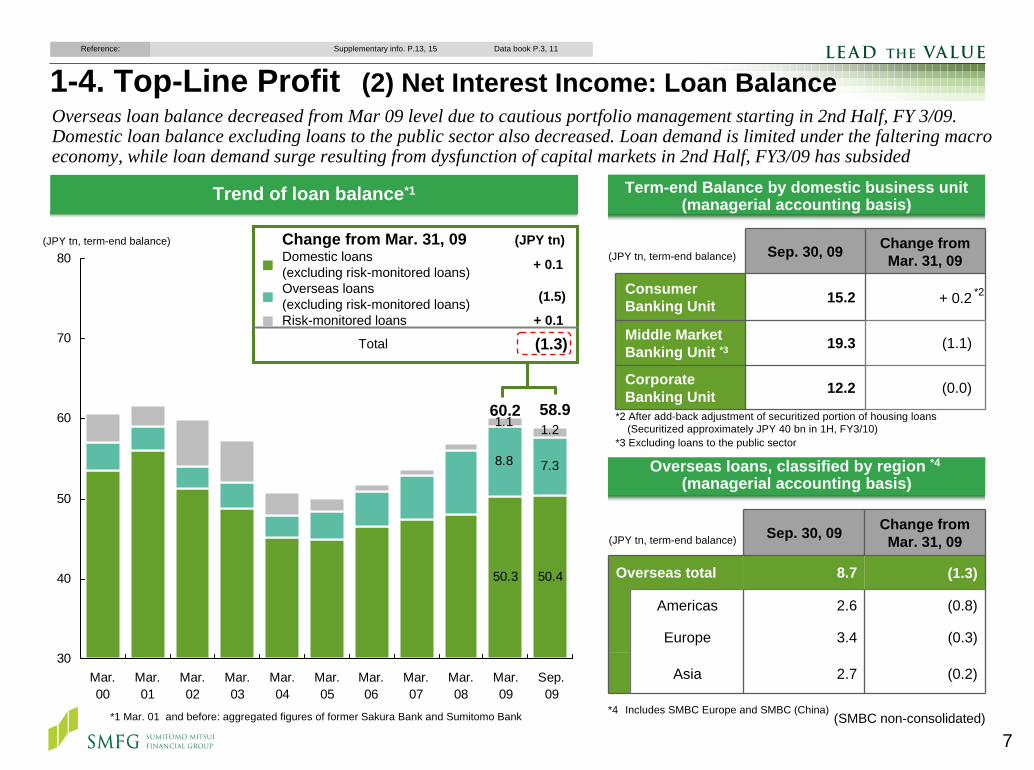
1-4. Top-Line Profit (2) Net Interest Income: Loan BalanceData book P.3, 11Reference: Supplementary info. P.13, 15
Overseas loan balance decreased from Mar 09 level due to cautious portfolio management starting in 2nd Half, FY 3/09.Domestic loan balance excluding loans to the public sector also decreased. Loan demand is limited under the faltering macro economy, while loan demand surge resulting from dysfunction of capital markets in 2nd Half, FY3/09 has subsided
50.450.3
7.38.8
1.1 1.2
30
40
50
60
70
80
Mar.00
Mar.01
Mar.02
Mar.03
Mar.04
Mar.05
Mar.06
Mar.07
Mar.08
Mar.09
Sep.09
*1 Mar. 01 and before: aggregated figures of former Sakura Bank and Sumitomo Bank
60.2 58.9
Sep. 30, 09 Change from Mar. 31, 09
Consumer Banking Unit 15.2 + 0.2
Middle Market Banking Unit *3 19.3 (1.1)
Corporate Banking Unit 12.2 (0.0)
(JPY tn, term-end balance)
Term-end Balance by domestic business unit(managerial accounting basis)
(JPY tn, term-end balance)
(SMBC non-consolidated)
*2
Overseas loans, classified by region *4
(managerial accounting basis)
*4 Includes SMBC Europe and SMBC (China)
Sep. 30, 09 Change from Mar. 31, 09
Overseas total 8.7 (1.3)
Americas 2.6 (0.8)
Asia 2.7 (0.2)
Europe 3.4 (0.3)
(JPY tn, term-end balance)
*2 After add-back adjustment of securitized portion of housing loans (Securitized approximately JPY 40 bn in 1H, FY3/10)
*3 Excluding loans to the public sector
Trend of loan balance*1
(1.3)Total
+ 0.1Risk-monitored loans■
(1.5)Overseas loans (excluding risk-monitored loans)■
+ 0.1Domestic loans(excluding risk-monitored loans)■
Change from Mar. 31, 09 (JPY tn)

8
1-4. Top-Line Profit (3) Net Interest Income:Loan to Deposit SpreadData book P.3, 4Reference: Supplementary info. P.3
Tightening of domestic loan to deposit spread is due mainly to BOJ’s policy interest rate cuts in Oct. and Dec. 08
Loan to deposit spread (financial accounting basis)
(JPY tn, %)
(SMBC non-consolidated)
1H, FY3/10YOY change
<Domestic>Average balance Yield Average
balance Yield
Loans* (a) 48.2 1.77 +2.2 (0.24)
Deposits, etc. (b) 67.2 0.15 +7.1 (0.11)
Loan to deposit spread (a) - (b) 1.62 (0.13)
<Overseas>
Loans (a) 9.5 2.21 (0.6) (1.80)
Deposits, etc. (b) 10.3 0.54 +0.3 (1.77)
Loan to deposit spread (a) - (b) 1.67 (0.03)
* Excludes loans to financial institutions
Yield of domestic loans and deposits(managerial accounting basis)
FY3/07 FY3/08 FY3/09 1H, FY3/10
0.00%
0.10%
0.20%
0.30%
0.40%
0.50%
06/4 7 10 07/1 4 7 10 08/1 4 7 10 09/1 4 71.55%
1.65%
1.75%
1.85%
1.95%
2.05%
Yield to Loans (right scale)Yield to deposits (left scale)
Short term prime rate: 1.375%→ 1.625%( + 0.250%, 2006/8/21 - ) → 1.875%( + 0.250%, 2007/3/26 - ) → 1.675%( -0.200%, 2008/11/17 - ) → 1.475%( -0.200%, 2009/1/13 - )Yield on ordinary deposit: 0.001%→ 0.100%( + 0.099%, 2006/7/18 - ) → 0.200%( + 0.100%, 2007/2/26 - ) → 0.120%( -0.080%, 2008/11/4 - ) → 0.040%( -0.080%, 2008/12/22 - ) Yield on 1 year time deposit : 0.150%→ 0.300%( + 0.150%, 2006/7/18 - ) → 0.400%( + 0.100%, 2007/2/26 - ) → 0.300%( -0.100%, 2008/11/12 - ) → 0.250%( -0.050%, 2009/5/1 - )(over-the-counter) → 0.200%( -0.030%, 2009/7/13 - ) → 0.170%( -0.030%, 2009/9/7 - ) → 0.140%( -0.030%, 2009/11/9 - )
BOJ’s policy interest rate change +0.25%
BOJ’s policy interest rate change +0.25%
BOJ’s policy interest rate change (0.2)%
BOJ’s policy interest rate change (0.2)%
9
Average balance Average spread1H,
FY3/10YOY
change1H,
FY3/10YOY
changeDomestic Loans 51.1 +2.6 1.04 (0.04)
Consumer Banking Unit 15.1 +0.4 1.49 (0.04)Middle Market Banking Unit 19.5 (1.0) 1.19 (0.02)Corporate Banking Unit 12.1 +1.8 0.65 +0.09
(億円)
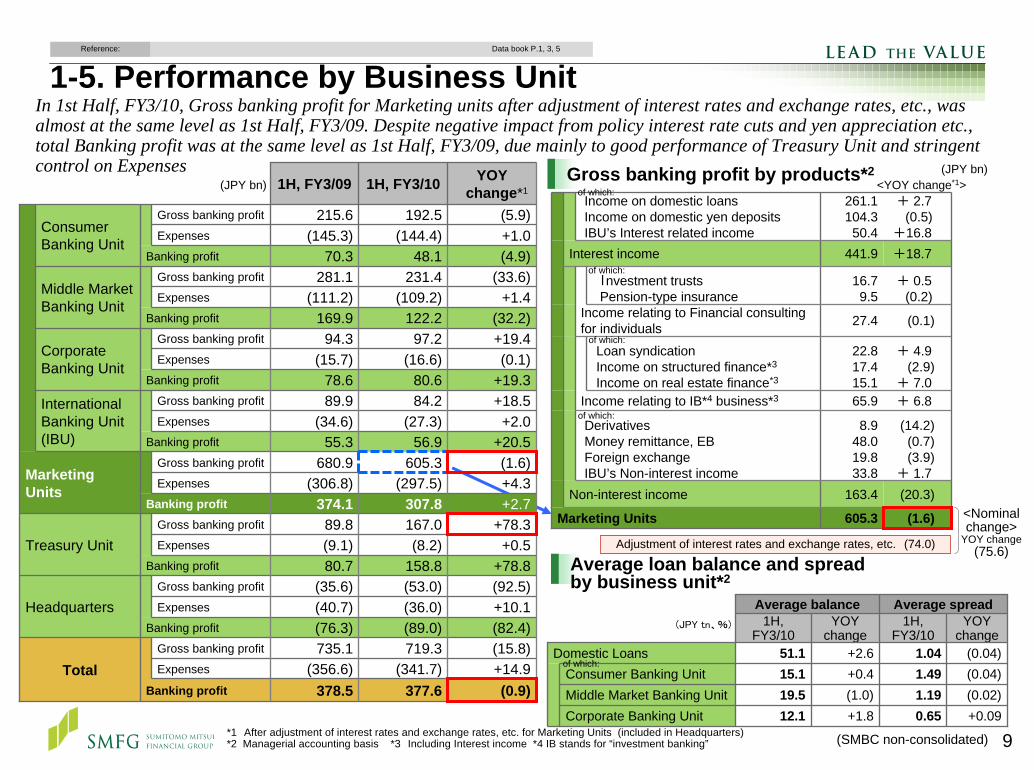
In 1st Half, FY3/10, Gross banking profit for Marketing units after adjustment of interest rates and exchange rates, etc., was almost at the same level as 1st Half, FY3/09. Despite negative impact from policy interest rate cuts and yen appreciation etc., total Banking profit was at the same level as 1st Half, FY3/09, due mainly to good performance of Treasury Unit and stringent control on Expenses
(JPY tn、%)
(20.3)163.4Non-interest income
+18.7441.9Interest income
+ 0.5(0.2)
16.79.5
Investment trustsPension-type insurance
(0.1)27.4Income relating to Financial consulting for individuals
+ 4.9(2.9)
+ 7.0
22.817.415.1
Loan syndicationIncome on structured finance*3
Income on real estate finance*3
+ 6.865.9Income relating to IB*4 business*3
(14.2)(0.7)(3.9)
+ 1.7
8.948.019.833.8
DerivativesMoney remittance, EBForeign exchangeIBU’s Non-interest income
605.3
261.1104.350.4
Marketing Units (1.6)
+ 2.7(0.5)
+16.8
Income on domestic loansIncome on domestic yen depositsIBU’s Interest related income
1-5. Performance by Business Unit
377.6(341.7)
719.3(89.0)(36.0)(53.0)158.8(8.2)
167.0307.8
(297.5)605.3
56.9(27.3)
84.280.6
(16.6)97.2
122.2(109.2)
231.448.1
(144.4)192.5
1H, FY3/10
(15.8)735.1Gross banking profit
(92.5)(35.6)Gross banking profit
+78.389.8Gross banking profit
(1.6)680.9Gross banking profit
+18.589.9Gross banking profit
+19.494.3Gross banking profit
(5.9)215.6Gross banking profit
(33.6)281.1Gross banking profit
YOYchange*1
Expenses
Expenses
Expenses
+2.7374.1Banking profit
+0.5(9.1)Treasury Unit+78.880.7Banking profit
+10.1(40.7)Headquarters(82.4)(76.3)Banking profit
+14.9(356.6)Total(0.9)378.5Banking profit
+4.3
+20.5+2.0
+19.3(0.1)
(32.2)+1.4
(4.9)+1.0
1H, FY3/09
55.3Banking profit
78.6Banking profit
169.9Banking profit
70.3Banking profit
(15.7)ExpensesCorporate Banking Unit
(34.6)ExpensesInternational Banking Unit(IBU)
(306.8)ExpensesMarketing Units
(111.2)ExpensesMiddle Market Banking Unit
(145.3)ExpensesConsumer Banking Unit
*1 After adjustment of interest rates and exchange rates, etc. for Marketing Units (included in Headquarters)*2 Managerial accounting basis *3 Including Interest income *4 IB stands for “investment banking”
Gross banking profit by products*2 (JPY bn)
Average loan balance and spreadby business unit*2
Adjustment of interest rates and exchange rates, etc. (74.0)
<Nominal change>
YOY change(75.6)
(JPY bn)
Data book P.1, 3, 5Reference:
(SMBC non-consolidated)
<YOY change*1>of which:
of which:
of which:
of which:
of which:
10
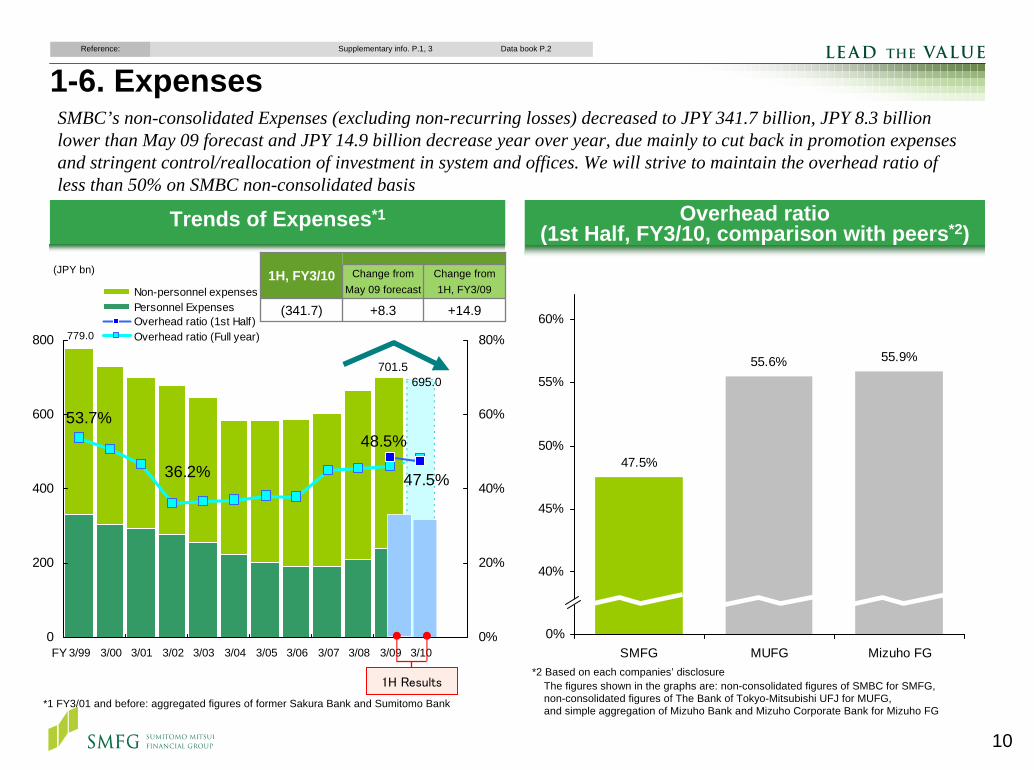
SMBC’s non-consolidated Expenses (excluding non-recurring losses) decreased to JPY 341.7 billion, JPY 8.3 billion lower than May 09 forecast and JPY 14.9 billion decrease year over year, due mainly to cut back in promotion expenses and stringent control/reallocation of investment in system and offices. We will strive to maintain the overhead ratio of less than 50% on SMBC non-consolidated basis
1-6. ExpensesData book P.2Reference: Supplementary info. P.1, 3
47.5%
55.9%55.6%
35%
40%
45%
50%
55%
60%
SMFG MUFG Mizuho FG
53.7%
36.2% 47.5%
48.5%
0
200
400
600
800
3/99 3/00 3/01 3/02 3/03 3/04 3/05 3/06 3/07 3/08 3/09 3/100%
20%
40%
60%
80%
Non-personnel expensesPersonnel ExpensesOverhead ratio (1st Half)Overhead ratio (Full year)
*1 FY3/01 and before: aggregated figures of former Sakura Bank and Sumitomo Bank
(JPY bn)
779.0
Trends of Expenses*1 Overhead ratio(1st Half, FY3/10, comparison with peers*2)
0%
701.5
FY
695.0
1H Results
Change from May 09 forecast
Change from 1H, FY3/09
(341.7) +8.3 +14.9
1H, FY3/10
*2 Based on each companies’ disclosureThe figures shown in the graphs are: non-consolidated figures of SMBC for SMFG, non-consolidated figures of The Bank of Tokyo-Mitsubishi UFJ for MUFG, and simple aggregation of Mizuho Bank and Mizuho Corporate Bank for Mizuho FG
11
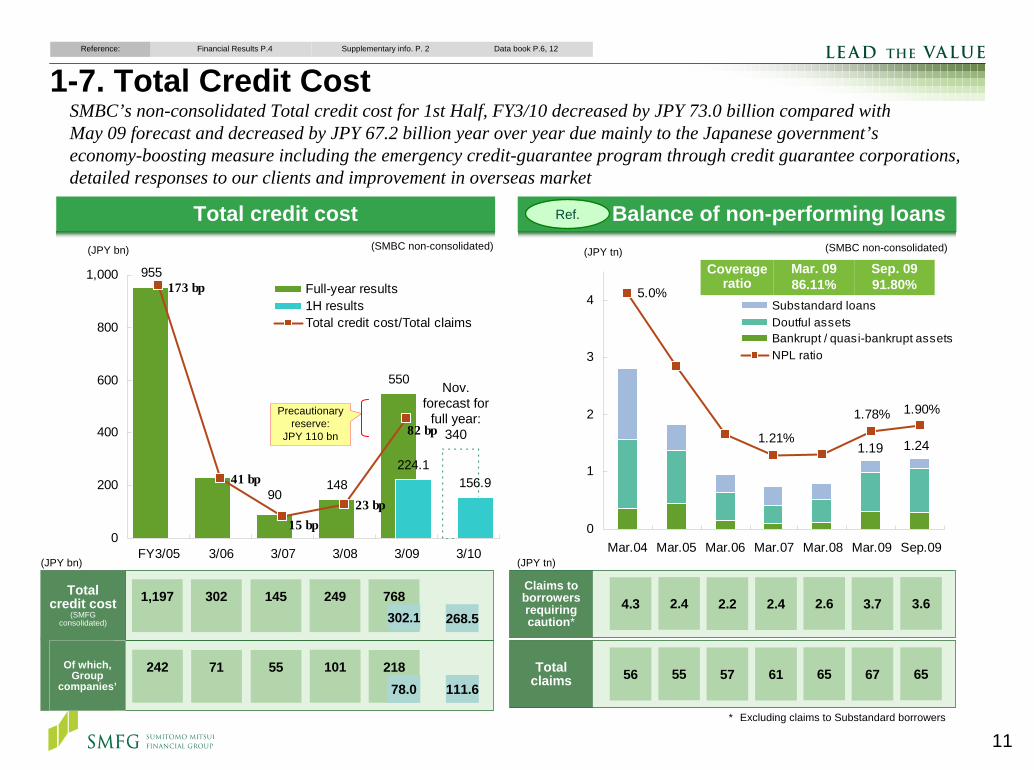
SMBC’s non-consolidated Total credit cost for 1st Half, FY3/10 decreased by JPY 73.0 billion compared with May 09 forecast and decreased by JPY 67.2 billion year over year due mainly to the Japanese government’s economy-boosting measure including the emergency credit-guarantee program through credit guarantee corporations, detailed responses to our clients and improvement in overseas market
Data book P.6, 12Reference: Financial Results P.4 Supplementary info. P. 2
1-7. Total Credit Cost
1.90%1.78%
5.0%
1.21%
0
1
2
3
4
Mar.04 Mar.05 Mar.06 Mar.07 Mar.08 Mar.09 Sep.09
Substandard loansDoutful assetsBankrupt / quasi-bankrupt assetsNPL ratio
Total credit cost(10億円)
* 除く要管理先債権
Total credit cost
(SMFG consolidated)
1,197 302 145 249 768268.5
242 71 55 101 218111.6
(JPY bn)
(SMBC non-consolidated)
78.0
Of which, Group
companies’
302.1
Balance of non-performing loans
Coverage ratio
Mar. 0986.11%
Sep. 0991.80%
1.241.19
Claims to borrowers requiring caution*
4.3 2.4 2.2 2.4 2.6 3.7 3.6
* Excluding claims to Substandard borrowers
(JPY tn)
(JPY tn)
(SMBC non-consolidated)
Ref.
Total claims 56 55 57 61 65 67 65
(JPY bn)
955
148
550
156.990
224.1
82 bp
173 bp
41 bp
15 bp23 bp
0
200
400
600
800
1,000
FY3/05 3/06 3/07 3/08 3/09 3/10
Full-year results 1H resultsTotal credit cost/Total claims
Nov.forecast for
full year: 340
Precautionary reserve:
JPY 110 bn

12
Establishment of estimationmethodology for LGD
Enhancement of internal rating system
Establishment of Credit Risk Committee
Integrated Risk Management
FY3/04 FY3/05 FY3/06 FY3/07 FY3/08 FY3/09 FY3/10
Quantitative riskmanagement
Basel IIAMA
AIRBFIRB
More specializedfinancial products*
Credit Risk Management
Concentration risk
Comprehensive risk management
As risks increase in diversity and complexity, we are continuously reinforcing comprehensive risk management framework and risk quantification system pursuant to Basel II capital requirements
Credit risk
Operational risk
1-8. Enhancement of Risk Management
*Non-Recourse Loan, Equity, Securitization etc.
Portfolio management
Promotion of the group-wide risk managementReinforcement of risk management forsecuritization and equity investment
Establishment of Risk ManagementDept., Europe and Americas Division
Establishment of global portfolio management system
Quantification of operational risk
Enhancement of the function of APM
Establishment of specialized department
Risk mitigation through credit derivative and guarantee
Enhancement of credit managementfor non-Japanese borrowers
Verification and documentationof risk quantification processes
Implementation of economic capitalmanagement framework at SMBCE
Promotion of ActivePortfolio Management (APM)
Enhancement of management of underlying assets
Implementation of credit amount Limit
Establishment of Equity Investment Review Committee
Enhancement of stress testing
13
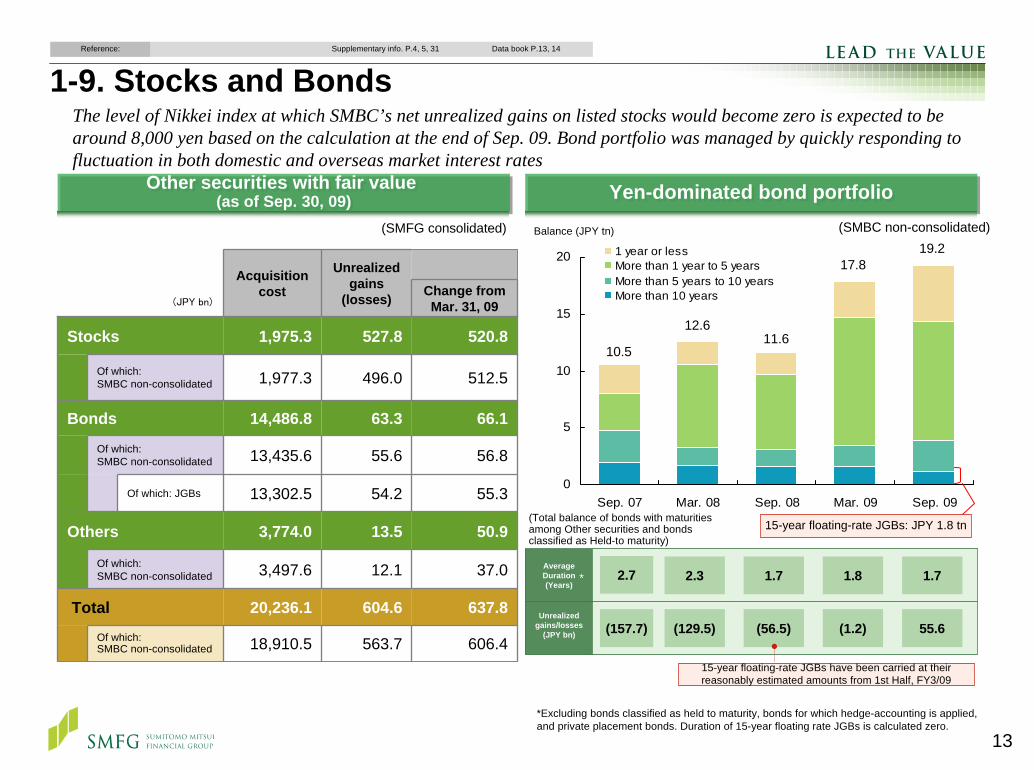
The level of Nikkei index at which SMBC’s net unrealized gains on listed stocks would become zero is expected to be around 8,000 yen based on the calculation at the end of Sep. 09. Bond portfolio was managed by quickly responding to fluctuation in both domestic and overseas market interest rates
Data book P.13, 14Reference: Supplementary info. P.4, 5, 31
1-9. Stocks and Bonds
Yen-dominated bond portfolioYen-dominated bond portfolio(SMBC non-consolidated)
Unrealized gains/losses
(JPY bn)
Average Duration (Years)
0
5
10
15
20
Sep. 07 Mar. 08 Sep. 08 Mar. 09 Sep. 09
1 year or lessMore than 1 year to 5 yearsMore than 5 years to 10 yearsMore than 10 years
17.8
10.5
2.7 2.3 1.7 1.8
(157.7) (129.5) (56.5) (1.2)
1.7
55.6
12.6
Balance (JPY tn)
*
11.6
15-year floating-rate JGBs have been carried at their reasonably estimated amounts from 1st Half, FY3/09
*Excluding bonds classified as held to maturity, bonds for which hedge-accounting is applied, and private placement bonds. Duration of 15-year floating rate JGBs is calculated zero.
19.2
Other securities with fair value (as of Sep. 30, 09)
Other securities with fair value (as of Sep. 30, 09)
Acquisition cost
Unrealized gains
(losses) Change from Mar. 31, 09
Stocks 1,975.3 527.8 520.8
Of which: SMBC non-consolidated 496.0
63.3
55.6
54.2
13.5
12.1
604.6
Bonds 14,486.8
563.7
512.5
66.1
56.8
55.3
50.9
37.0
637.8
Of which:SMBC non-consolidated 13,435.6
606.4
Of which: JGBs 13,302.5
3,497.6
Total 20,236.1
Of which:SMBC non-consolidated
Of which:SMBC non-consolidated
Others 3,774.0
18,910.5
1,977.3
(JPY bn)
15-year floating-rate JGBs: JPY 1.8 tn
(SMFG consolidated)
(Total balance of bonds with maturities among Other securities and bonds classified as Held-to maturity)
14
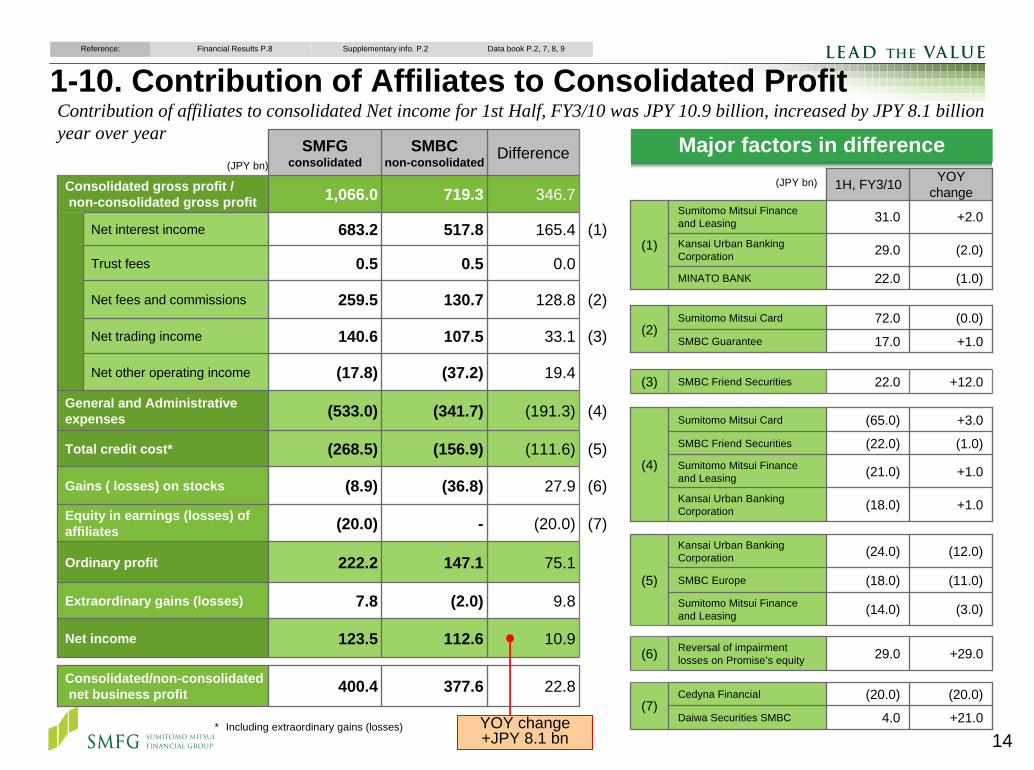
1-10. Contribution of Affiliates to Consolidated ProfitData book P.2, 7, 8, 9Reference: Financial Results P.8 Supplementary info. P.2
Contribution of affiliates to consolidated Net income for 1st Half, FY3/10 was JPY 10.9 billion, increased by JPY 8.1 billion year over year
(JPY bn)Difference
346.7
165.4
0.0
128.8
33.1
19.4
(191.3)
(111.6)
27.9
(20.0)
75.1
9.8
10.9
22.8
(1)
(2)
(3)
(4)
(5)
Gains ( losses) on stocks (8.9) (36.8) (6)
(7)
Ordinary profit 222.2 147.1
Net income 123.5 112.6
Consolidated/non-consolidatednet business profit 400.4 377.6
Extraordinary gains (losses) 7.8 (2.0)
SMFGconsolidated
SMBCnon-consolidated
719.3
517.8
0.5
130.7
107.5
(37.2)
(341.7)
(156.9)
-
Trust fees 0.5
Total credit cost* (268.5)
Equity in earnings (losses) of affiliates (20.0)
Net fees and commissions 259.5
Consolidated gross profit /non-consolidated gross profit 1,066.0
Net interest income 683.2
Net trading income 140.6
Net other operating income (17.8)
General and Administrative expenses (533.0)
Major factors in difference
* Including extraordinary gains (losses)+21.04.0Daiwa Securities SMBC
+12.022.0SMBC Friend Securities(3)
(20.0)(20.0)Cedyna Financial(7)
(5)
+29.029.0Reversal of impairment losses on Promise’s equity
+1.0(18.0)Kansai Urban Banking Corporation
+1.0(21.0)Sumitomo Mitsui Finance and Leasing
+1.017.0SMBC Guarantee
(0.0)72.0Sumitomo Mitsui Card(2)
(1.0)22.0MINATO BANK
(2.0)29.0Kansai Urban Banking Corporation
+2.031.0Sumitomo Mitsui Finance and Leasing
(1)
(1.0)(22.0)SMBC Friend Securities
(11.0)(18.0)SMBC Europe
(12.0)(24.0)Kansai Urban Banking Corporation
(6)
+3.0(65.0)Sumitomo Mitsui Card
(4)
(3.0)(14.0)Sumitomo Mitsui Finance and Leasing
YOY change1H, FY3/10(JPY bn)
YOY change+JPY 8.1 bn
15
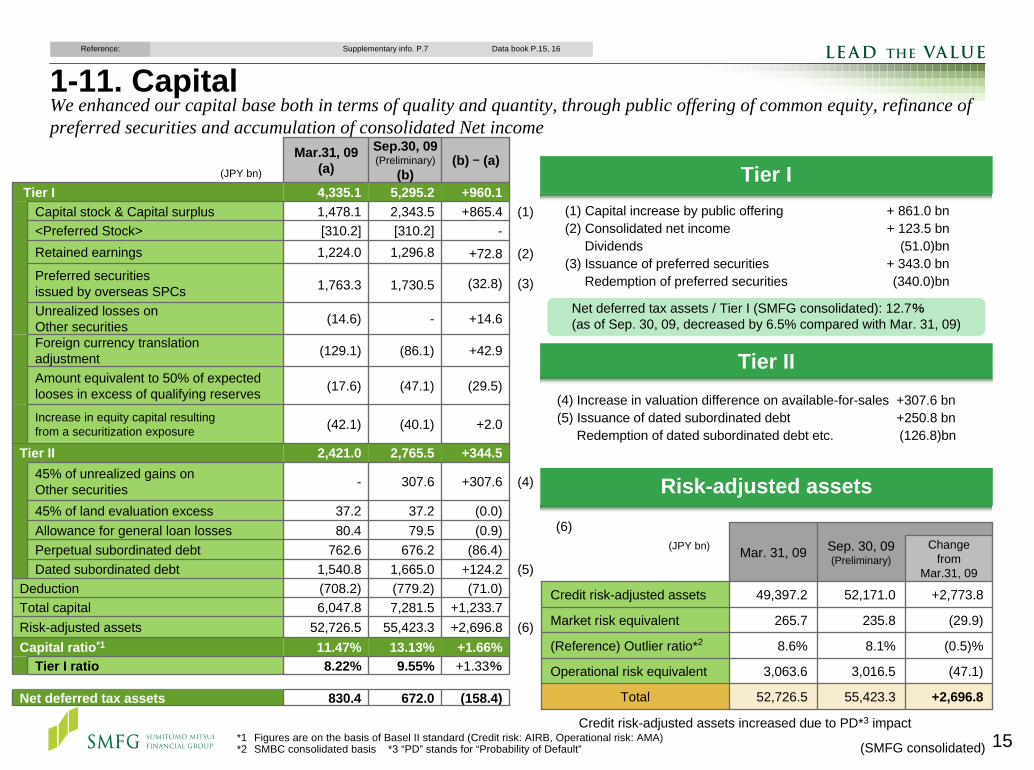
1-11. CapitalData book P.15, 16Reference: Supplementary info. P.7
We enhanced our capital base both in terms of quality and quantity, through public offering of common equity, refinance of preferred securities and accumulation of consolidated Net income
Credit risk-adjusted assets increased due to PD*3 impact*1 Figures are on the basis of Basel II standard (Credit risk: AIRB, Operational risk: AMA) *2 SMBC consolidated basis *3 “PD” stands for “Probability of Default”
(1) Capital increase by public offering + 861.0 bn(2) Consolidated net income + 123.5 bn
Dividends (51.0)bn(3) Issuance of preferred securities + 343.0 bn
Redemption of preferred securities (340.0)bn
Mar. 31, 09 Sep. 30, 09(Preliminary)
Change from
Mar.31, 09
Credit risk-adjusted assets 49,397.2 52,171.0 +2,773.8
Market risk equivalent 265.7 235.8 (29.9)
(Reference) Outlier ratio*2 8.6% 8.1% (0.5)%
Total 52,726.5 55,423.3 +2,696.8
Operational risk equivalent 3,063.6 3,016.5 (47.1)
Tier I
Net deferred tax assets / Tier I (SMFG consolidated): 12.7%(as of Sep. 30, 09, decreased by 6.5% compared with Mar. 31, 09)
Tier II(4) Increase in valuation difference on available-for-sales +307.6 bn(5) Issuance of dated subordinated debt +250.8 bn
Redemption of dated subordinated debt etc. (126.8)bn
(6)
(SMFG consolidated)
Mar.31, 09(a)
Sep.30, 09(Preliminary)
(b)(b) – (a)
Tier I 4,335.1 5,295.2 +960.1(1)
(2)
(3)
Unrealized losses on Other securities (14.6) - +14.6
Amount equivalent to 50% of expected looses in excess of qualifying reserves (17.6) (47.1) (29.5)
Tier I ratio 8.22% 9.55% +1.33%
(4)
(5)
(6)
Capital stock & Capital surplus 1,478.1 2,343.5 +865.4<Preferred Stock> [310.2] [310.2] -Retained earnings 1,224.0 1,296.8 +72.8Preferred securities issued by overseas SPCs 1,763.3 1,730.5 (32.8)
Foreign currency translationadjustment (129.1) (86.1) +42.9
Increase in equity capital resultingfrom a securitization exposure (42.1) (40.1) +2.0
Tier II 2,421.0 2,765.5 +344.545% of unrealized gains on Other securities - 307.6 +307.6
45% of land evaluation excess 37.2 37.2 (0.0)Allowance for general loan losses 80.4 79.5 (0.9)Perpetual subordinated debt 762.6 676.2 (86.4)Dated subordinated debt 1,540.8 1,665.0 +124.2
Deduction (708.2) (779.2) (71.0)Total capital 6,047.8 7,281.5 +1,233.7Risk-adjusted assets 52,726.5 55,423.3 +2,696.8Capital ratio*1 11.47% 13.13% +1.66%
Net deferred tax assets 830.4 672.0 (158.4)
(JPY bn)
Risk-adjusted assets
(JPY bn)

2. Management Policy in 2nd Half, FY3/2010 and Fortification of Growth Business Areas
17
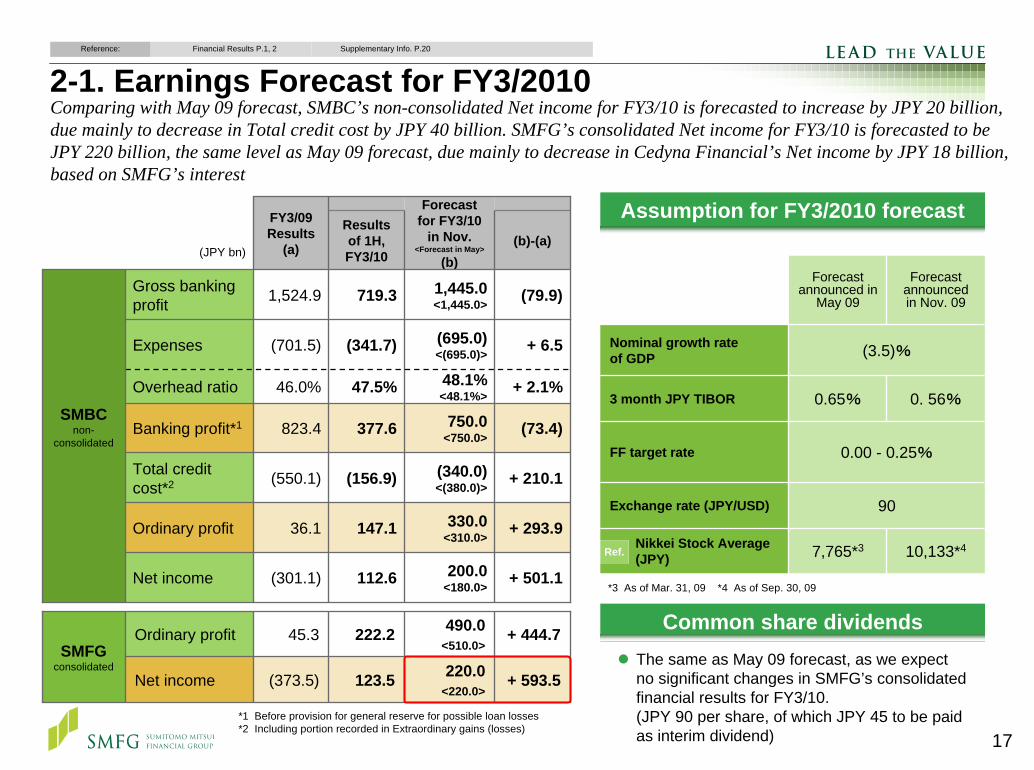
2-1. Earnings Forecast for FY3/2010
Ordinary profit 45.3 222.2 490.0<510.0>
+ 444.7SMFG
consolidated123.5 + 593.5Net income (373.5) 220.0
<220.0>
(JPY bn)
Results of 1H, FY3/10
(b)-(a)
Gross banking profit 1,524.9 719.3 1,445.0
<1,445.0> (79.9)
Overhead ratio 46.0% 47.5% 48.1%<48.1%> + 2.1%
Expenses (701.5) (341.7) (695.0)<(695.0)> + 6.5
SMBCnon-
consolidatedBanking profit*1 823.4 377.6 750.0
<750.0> (73.4)
Total credit cost*2 (550.1) (156.9) (340.0)
<(380.0)> + 210.1
Ordinary profit 36.1 147.1 330.0<310.0> + 293.9
Net income (301.1) 112.6 200.0<180.0>
FY3/09 Results
(a)
Forecast for FY3/10
in Nov.<Forecast in May>
(b)
+ 501.1
*1 Before provision for general reserve for possible loan losses*2 Including portion recorded in Extraordinary gains (losses)
Assumption for FY3/2010 forecast
7,765*3
90
0.00 - 0.25%
0.65%
(3.5)%
Forecast announced in
May 09
10,133*4
0. 56%
Forecast announced in Nov. 09
Nikkei Stock Average(JPY)
Exchange rate (JPY/USD)
FF target rate
3 month JPY TIBOR
Nominal growth rateof GDP
Common share dividends
Reference: Financial Results P.1, 2 Supplementary Info. P.20
Comparing with May 09 forecast, SMBC’s non-consolidated Net income for FY3/10 is forecasted to increase by JPY 20 billion, due mainly to decrease in Total credit cost by JPY 40 billion. SMFG’s consolidated Net income for FY3/10 is forecasted to be JPY 220 billion, the same level as May 09 forecast, due mainly to decrease in Cedyna Financial’s Net income by JPY 18 billion, based on SMFG’s interest
The same as May 09 forecast, as we expect no significant changes in SMFG’s consolidated financial results for FY3/10. (JPY 90 per share, of which JPY 45 to be paid as interim dividend)
*3 As of Mar. 31, 09 *4 As of Sep. 30, 09
Ref.
18
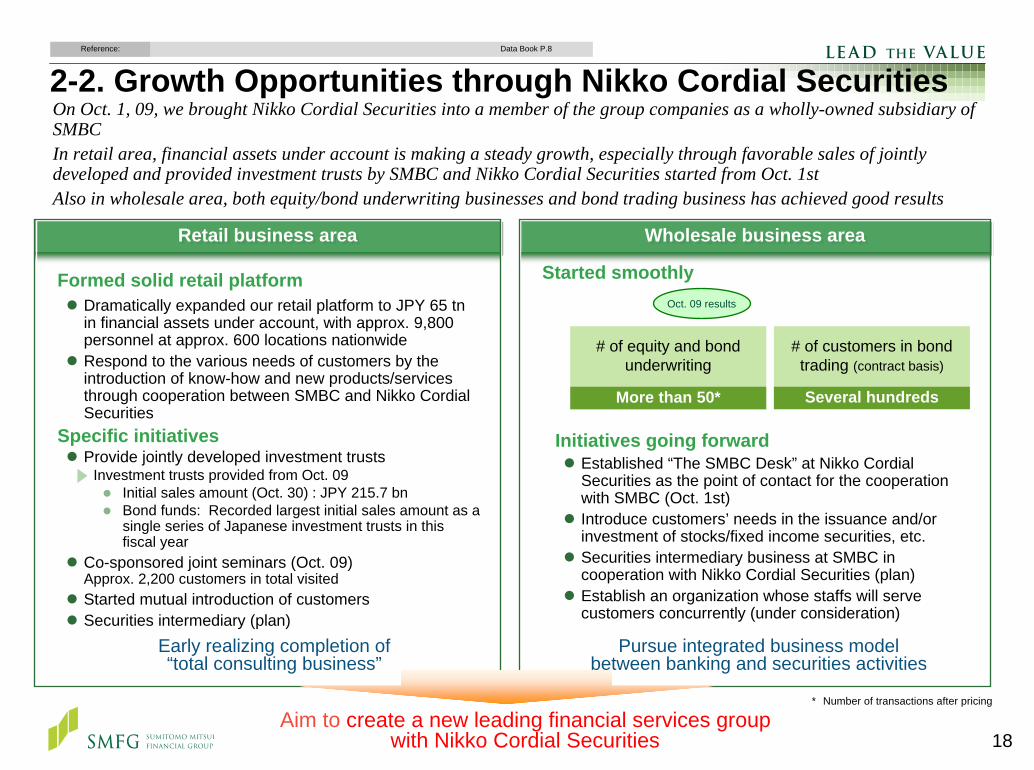
2-2. Growth Opportunities through Nikko Cordial SecuritiesOn Oct. 1, 09, we brought Nikko Cordial Securities into a member of the group companies as a wholly-owned subsidiary of SMBCIn retail area, financial assets under account is making a steady growth, especially through favorable sales of jointly developed and provided investment trusts by SMBC and Nikko Cordial Securities started from Oct. 1stAlso in wholesale area, both equity/bond underwriting businesses and bond trading business has achieved good results
Started smoothly
Initiatives going forwardEstablished “The SMBC Desk” at Nikko Cordial Securities as the point of contact for the cooperation with SMBC (Oct. 1st)Introduce customers’ needs in the issuance and/or investment of stocks/fixed income securities, etc.Securities intermediary business at SMBC in cooperation with Nikko Cordial Securities (plan)Establish an organization whose staffs will serve customers concurrently (under consideration)
# of equity and bond underwriting
More than 50*
# of customers in bond trading (contract basis)
Several hundreds
Pursue integrated business modelbetween banking and securities activities
Early realizing completion of“total consulting business”
Formed solid retail platformDramatically expanded our retail platform to JPY 65 tn in financial assets under account, with approx. 9,800 personnel at approx. 600 locations nationwideRespond to the various needs of customers by the introduction of know-how and new products/services through cooperation between SMBC and Nikko Cordial Securities
Specific initiativesProvide jointly developed investment trusts
Investment trusts provided from Oct. 09Initial sales amount (Oct. 30) : JPY 215.7 bnBond funds: Recorded largest initial sales amount as a single series of Japanese investment trusts in this fiscal year
Co-sponsored joint seminars (Oct. 09)Approx. 2,200 customers in total visitedStarted mutual introduction of customersSecurities intermediary (plan)
Wholesale business areaWholesale business areaRetail business areaRetail business area
Oct. 09 results
Aim to create a new leading financial services groupwith Nikko Cordial Securities
* Number of transactions after pricing
Data Book P.8Reference:
19
Organizational structure to provide solutions for corporations (SMBC)
Organizational structure to provide solutions for corporations (SMBC)
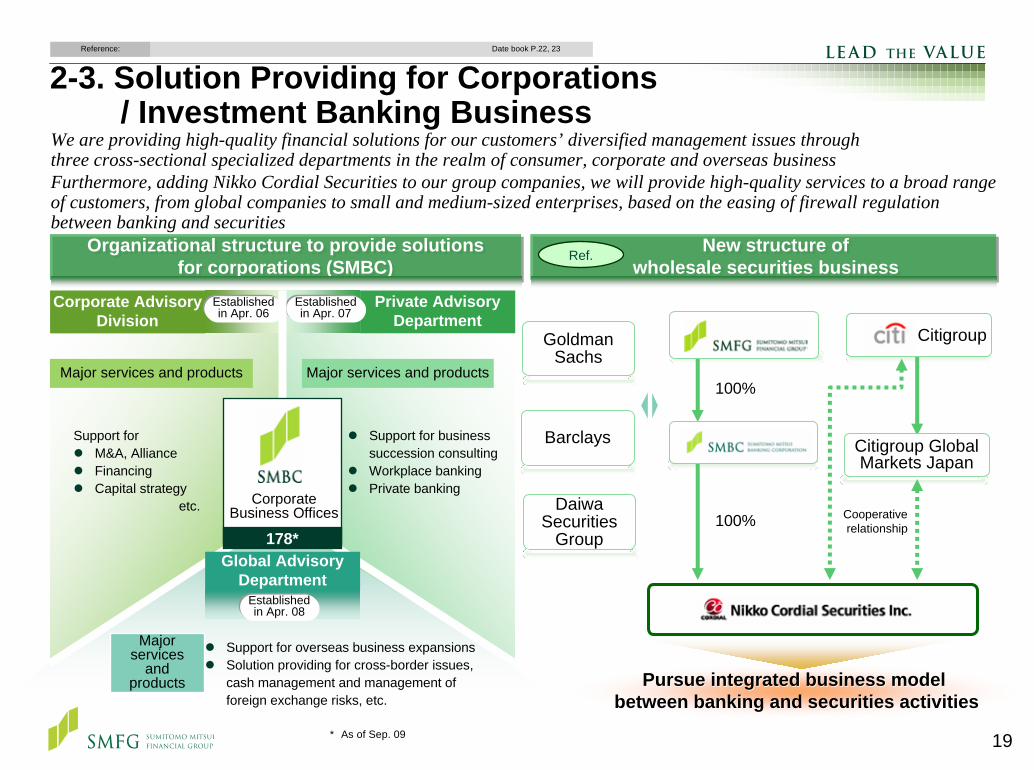
2-3. Solution Providing for Corporations / Investment Banking Business
We are providing high-quality financial solutions for our customers’ diversified management issues through three cross-sectional specialized departments in the realm of consumer, corporate and overseas business Furthermore, adding Nikko Cordial Securities to our group companies, we will provide high-quality services to a broad range of customers, from global companies to small and medium-sized enterprises, based on the easing of firewall regulation between banking and securities
New structure of wholesale securities business
New structure of wholesale securities business
Ref.
Pursue integrated business model Pursue integrated business model between banking and securities activitiesbetween banking and securities activities
Support forM&A, AllianceFinancingCapital strategy
etc.
Support for business succession consultingWorkplace bankingPrivate banking
Major services and products Major services and products
Support for overseas business expansionsSolution providing for cross-border issues,cash management and management of foreign exchange risks, etc.
Major services
and products
Corporate AdvisoryDivision
Private AdvisoryDepartment
Established in Apr. 06
Established in Apr. 07
Global AdvisoryDepartment
Established in Apr. 08
Corporate Business Offices
178*Cooperative relationship
100%
100%
Citigroup Global Markets Japan
Goldman Sachs
Barclays
Citigroup
Daiwa Securities
Group
* As of Sep. 09
Date book P.22, 23Reference:
20
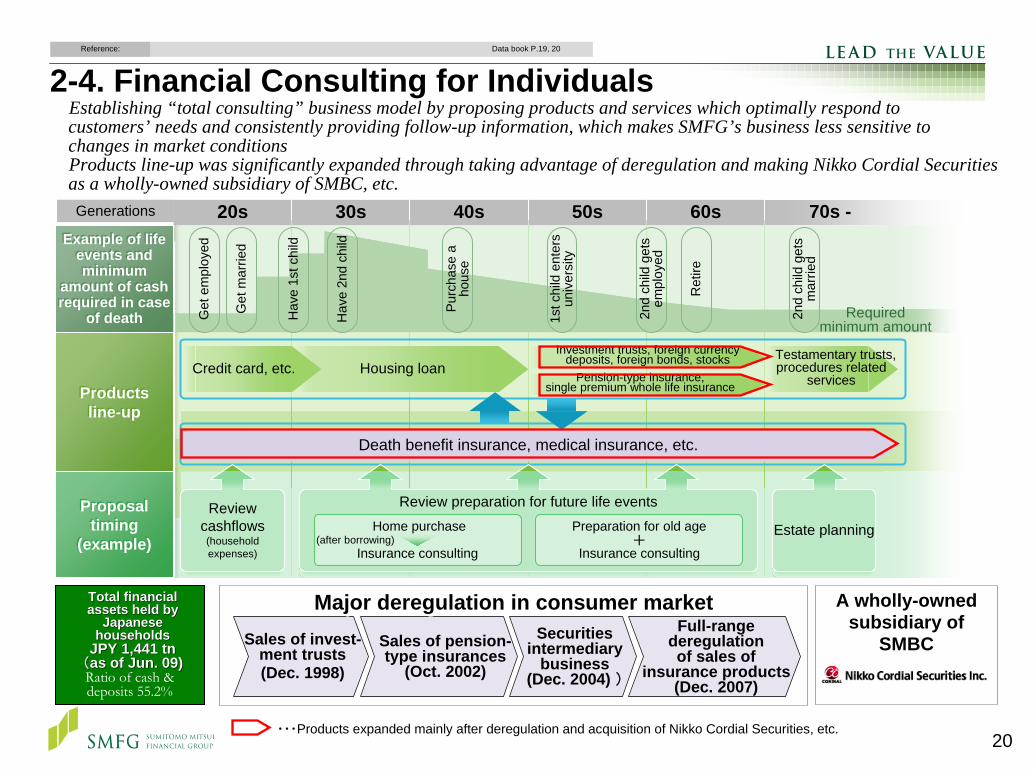
Establishing “total consulting” business model by proposing products and services which optimally respond to customers’ needs and consistently providing follow-up information, which makes SMFG’s business less sensitive to changes in market conditionsProducts line-up was significantly expanded through taking advantage of deregulation and making Nikko Cordial Securities as a wholly-owned subsidiary of SMBC, etc.
2-4. Financial Consulting for IndividualsData book P.19, 20Reference:
70s -
Testamentary trusts, procedures related
services
20s 30s 40s 50s 60sG
et e
mpl
oyed
Get
mar
ried
Hav
e 1s
t chi
ld
Hav
e 2n
d ch
ild
Purc
hase
a
hous
e
1st c
hild
ent
ers
univ
ersi
ty
2nd
child
get
s em
ploy
ed
Ret
ire
2nd
child
get
s m
arrie
d
Required minimum amount
Housing loanInvestment trusts, foreign currency
deposits, foreign bonds, stocksPension-type insurance,
single premium whole life insuranceCredit card, etc.
Generations
Death benefit insurance, medical insurance, etc.
Review cashflows(household expenses)
Estate planning
Review preparation for future life eventsHome purchase
Insurance consulting
Preparation for old age
Insurance consulting(after borrowing) +
Example of life events and minimum
amount of cash required in case
of death
Example of life events and minimum
amount of cash required in case
of death
Productsline-up
Productsline-up
Proposal timing
(example)
Proposal timing
(example)
Sales of invest-ment trusts(Dec. 1998)
Sales of pension-type insurances
(Oct. 2002)
Securitiesintermediary
business(Dec. 2004) )
Full-rangederegulationof sales of
insurance products(Dec. 2007)
Total financial Total financial assets held by assets held by
Japanese Japanese householdshouseholds
JPY 1,441 tnJPY 1,441 tn((as of Jun. 0as of Jun. 099))Ratio of cash & deposits 55.2%
・・・Products expanded mainly after deregulation and acquisition of Nikko Cordial Securities, etc.
Major deregulation in consumer marketMajor deregulation in consumer market A wholly-owned subsidiary of
SMBC
A wholly-owned subsidiary of
SMBC
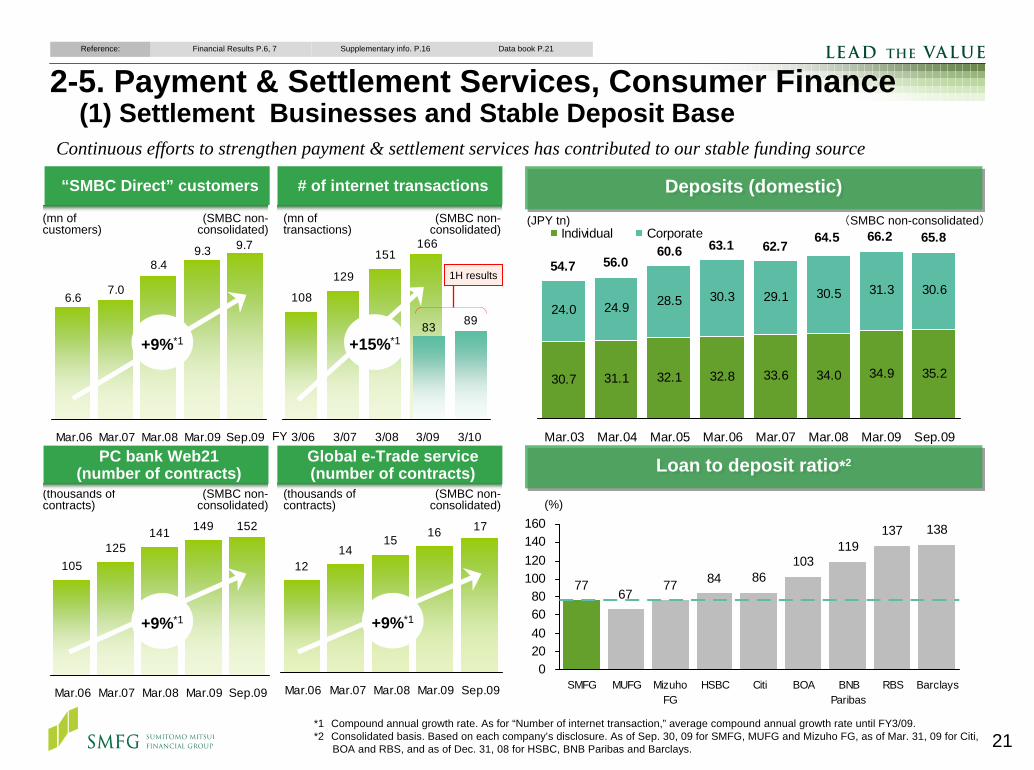
21*1 Compound annual growth rate. As for “Number of internet transaction,” average compound annual growth rate until FY3/09.*2 Consolidated basis. Based on each company’s disclosure. As of Sep. 30, 09 for SMFG, MUFG and Mizuho FG, as of Mar. 31, 09 for Citi,
BOA and RBS, and as of Dec. 31, 08 for HSBC, BNB Paribas and Barclays.
2-5. Payment & Settlement Services, Consumer Finance(1) Settlement Businesses and Stable Deposit Base
108
129
151166
83 89
3/06 3/07 3/08 3/09 3/10
6.67.0
8.49.3 9.7
Mar.06 Mar.07 Mar.08 Mar.09 Sep.09
# of internet transactions
(mn of transactions)
(mn of customers)
+15%*1+9%*1
PC bank Web21(number of contracts)
105125
141 149 152
Mar.06 Mar.07 Mar.08 Mar.09 Sep.09
(thousands of contracts)
+9%*1
Global e-Trade service(number of contracts)
1214
1516 17
Mar.06 Mar.07 Mar.08 Mar.09 Sep.09
+9%*1
Loan to deposit ratio*2Loan to deposit ratio*2
Deposits (domestic)Deposits (domestic)
30.7 31.1 32.1 32.8 34.0 34.9 35.2
24.0 24.9 28.5 30.3 30.5 31.3 30.6
33.6
29.1
65.866.264.563.160.656.054.7
62.7
Mar.03 Mar.04 Mar.05 Mar.06 Mar.07 Mar.08 Mar.09 Sep.09
Individual Corporate(JPY tn)
1H results
7767
77 84 86103
119137 138
020406080
100120140160
SMFG MUFG MizuhoFG
HSBC Citi BOA BNBParibas
RBS Barclays
(%)
(SMBC non-consolidated)
Data book P.21Reference: Financial Results P.6, 7 Supplementary info. P.16
Continuous efforts to strengthen payment & settlement services has contributed to our stable funding source
“SMBC Direct” customers
(SMBC non-consolidated)
(SMBC non-consolidated)
(SMBC non-consolidated)
FY
(thousands of contracts)
(SMBC non-consolidated)
22
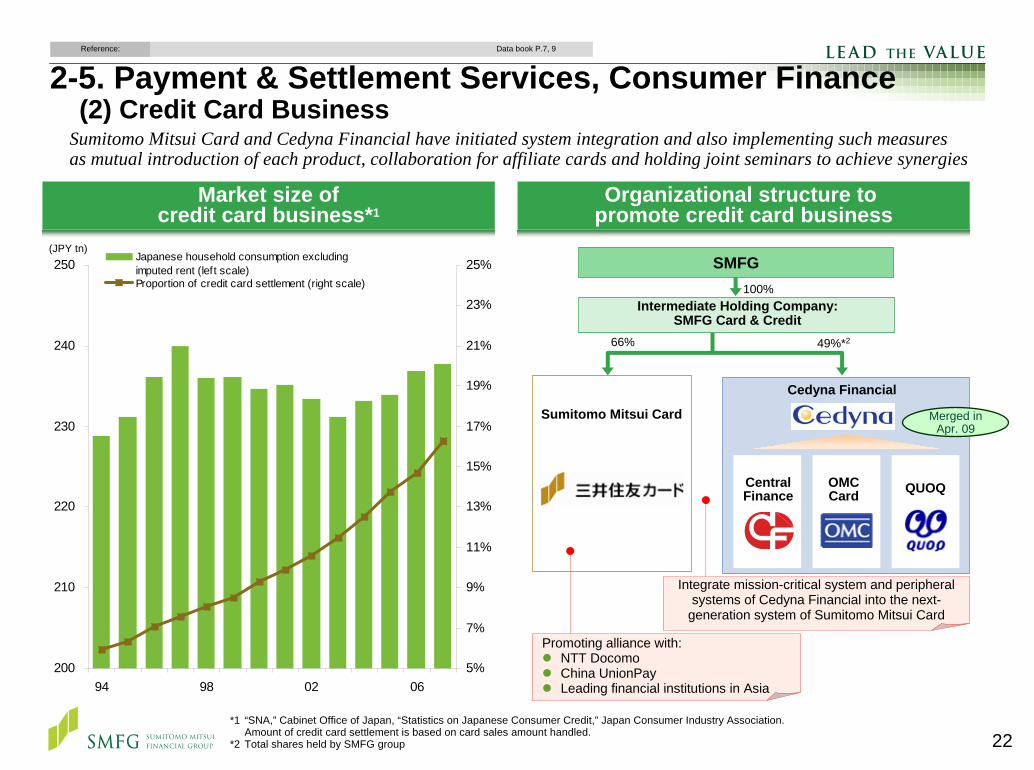
100%
Organizational structure to promote credit card business
66% 49%*2
Sumitomo Mitsui Card
Central Finance
OMCCard QUOQ
Sumitomo Mitsui Card and Cedyna Financial have initiated system integration and also implementing such measuresas mutual introduction of each product, collaboration for affiliate cards and holding joint seminars to achieve synergies
SMFG
Merged in Apr. 09
200
210
220
230
240
250
94 98 02 065%
7%
9%
11%
13%
15%
17%
19%
21%
23%
25%Japanese household consumption excludingimputed rent (left scale)Proportion of credit card settlement (right scale)
(JPY tn)
Market size ofcredit card business*1
Integrate mission-critical system and peripheral systems of Cedyna Financial into the next-
generation system of Sumitomo Mitsui Card
Promoting alliance with:NTT DocomoChina UnionPayLeading financial institutions in Asia
Cedyna Financial
2-5. Payment & Settlement Services, Consumer Finance(2) Credit Card Business
Data book P.7, 9Reference:
Intermediate Holding Company:SMFG Card & Credit
*1 “SNA,” Cabinet Office of Japan, “Statistics on Japanese Consumer Credit,” Japan Consumer Industry Association. Amount of credit card settlement is based on card sales amount handled.
*2 Total shares held by SMFG group
23
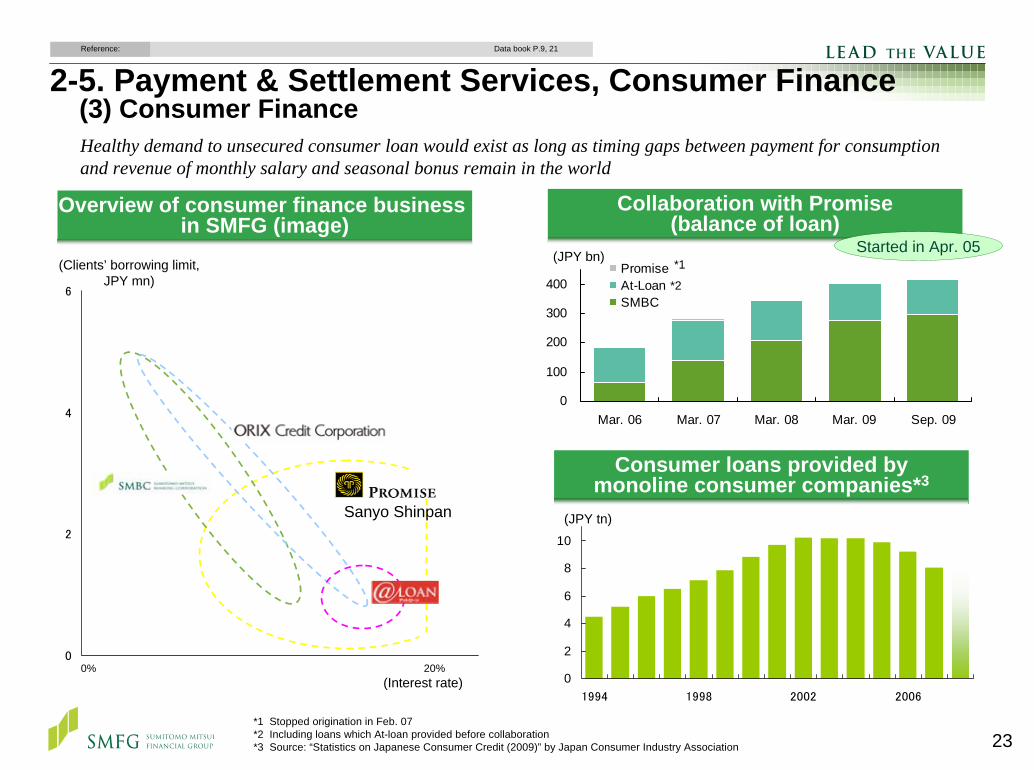
0
2
4
6
Collaboration with Promise(balance of loan)
Started in Apr. 05
2-5. Payment & Settlement Services, Consumer Finance(3) Consumer FinanceHealthy demand to unsecured consumer loan would exist as long as timing gaps between payment for consumption and revenue of monthly salary and seasonal bonus remain in the world
0
2
4
6
8
10
1994 1998 2002 2006
Consumer loans provided bymonoline consumer companies*3
(JPY tn)
0
100
200
300
400
Mar. 06 Mar. 07 Mar. 08 Mar. 09 Sep. 09
PromiseAt-LoanSMBC
*2
(JPY bn) *1
Overview of consumer finance business in SMFG (image)
0% 20%(Interest rate)
(Clients’ borrowing limit, JPY mn)
Data book P.9, 21Reference:
*1 Stopped origination in Feb. 07 *2 Including loans which At-loan provided before collaboration*3 Source: “Statistics on Japanese Consumer Credit (2009)” by Japan Consumer Industry Association
Sanyo Shinpan
24
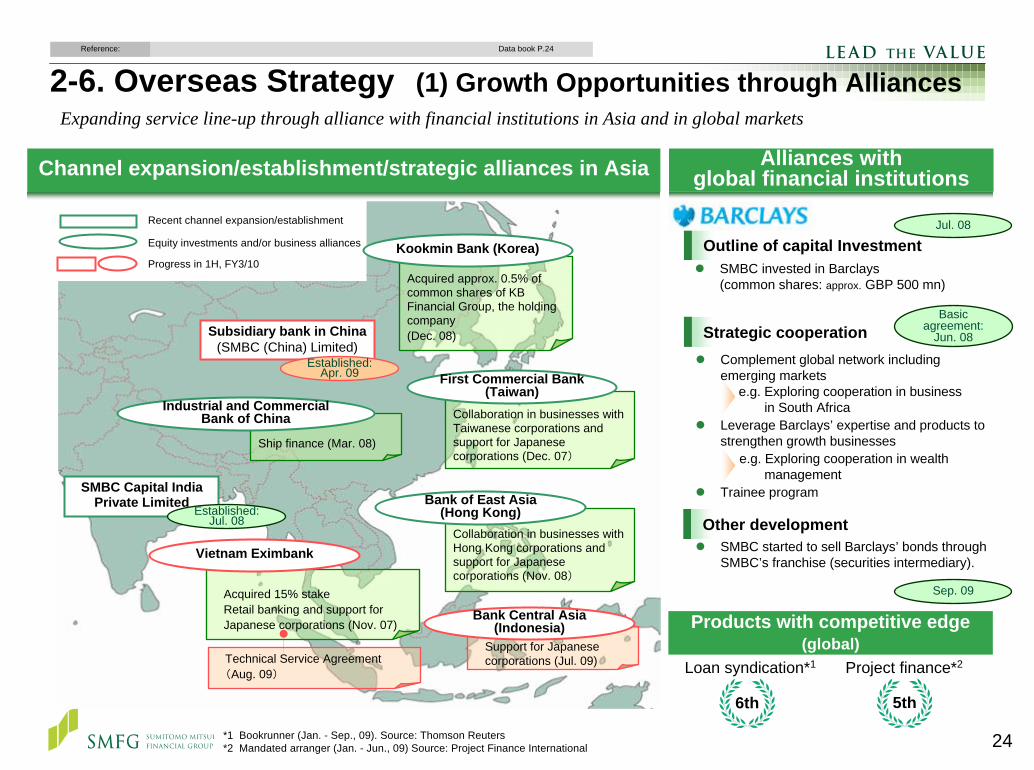
Channel expansion/establishment/strategic alliances in Asia
2-6. Overseas Strategy (1) Growth Opportunities through Alliances
Collaboration in businesses with Taiwanese corporations and support for Japanese corporations (Dec. 07)
Ship finance (Mar. 08)
Acquired approx. 0.5% of common shares of KB Financial Group, the holding company (Dec. 08)
Recent channel expansion/establishment
Equity investments and/or business alliances
Collaboration in businesses with Hong Kong corporations and support for Japanese corporations (Nov. 08)
Acquired 15% stakeRetail banking and support for Japanese corporations (Nov. 07)
SMBC Capital IndiaPrivate Limited
Established: Jul. 08
Support for Japanese corporations (Jul. 09)
Bank Central Asia (Indonesia)
Subsidiary bank in China(SMBC (China) Limited)
Established: Apr. 09
Kookmin Bank (Korea)
Bank of East Asia(Hong Kong)
Industrial and Commercial Bank of China
Vietnam Eximbank
First Commercial Bank (Taiwan)
Outline of capital Investment
Strategic cooperation
Other development
Jul. 08
Sep. 09
Basic agreement:
Jun. 08
Products with competitive edge(global)
Technical Service Agreement(Aug. 09)
Progress in 1H, FY3/10
Data book P.24Reference:
Expanding service line-up through alliance with financial institutions in Asia and in global markets
Complement global network including emerging markets
e.g. Exploring cooperation in business in South Africa
Leverage Barclays’ expertise and products to strengthen growth businesses
e.g. Exploring cooperation in wealth management
Trainee program
SMBC started to sell Barclays’ bonds through SMBC’s franchise (securities intermediary).
6th
Loan syndication*1
5th
Project finance*2
*1 Bookrunner (Jan. - Sep., 09). Source: Thomson Reuters *2 Mandated arranger (Jan. - Jun., 09) Source: Project Finance International
SMBC invested in Barclays (common shares: approx. GBP 500 mn)
Alliances withglobal financial institutions
25
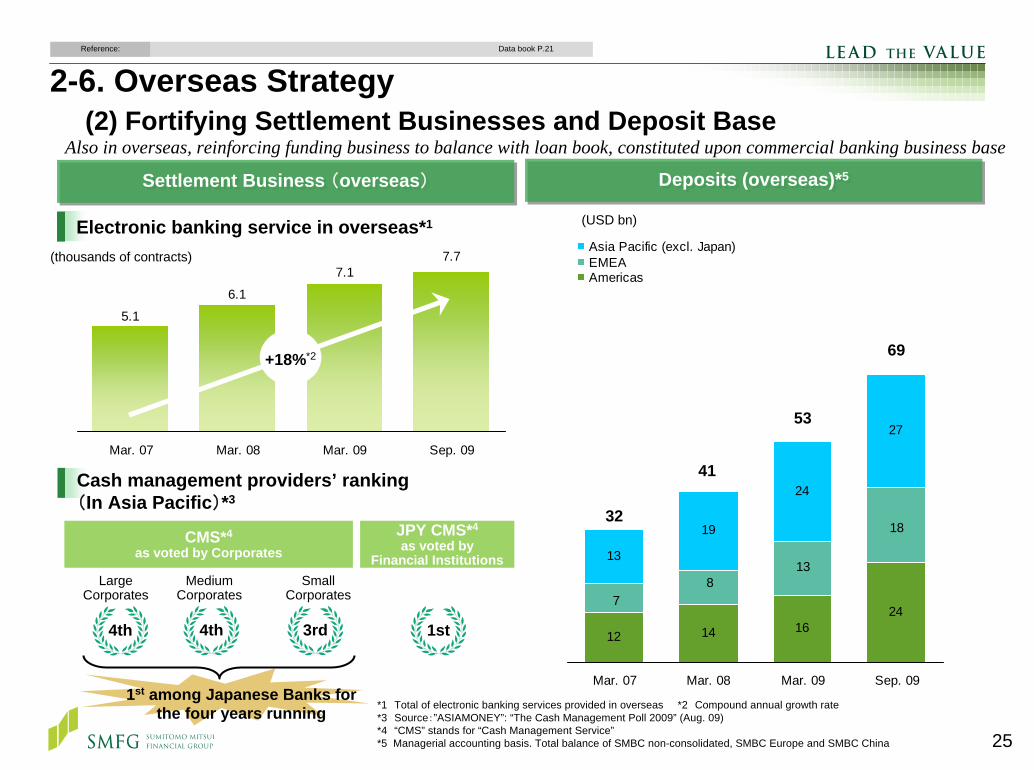
*1 Total of electronic banking services provided in overseas *2 Compound annual growth rate*3 Source:”ASIAMONEY”: “The Cash Management Poll 2009” (Aug. 09)*4 “CMS” stands for “Cash Management Service”*5 Managerial accounting basis. Total balance of SMBC non-consolidated, SMBC Europe and SMBC China
Deposits (overseas)*5Deposits (overseas)*5Settlement Business (overseas)Settlement Business (overseas)
2-6. Overseas Strategy (2) Fortifying Settlement Businesses and Deposit Base
12 14 1624
13
19
27
813
18
7
24
Mar. 07 Mar. 08 Mar. 09 Sep. 09
Asia Pacific (excl. Japan)EMEAAmericas
(USD bn)
5.1
6.1
7.17.7
Mar. 07 Mar. 08 Mar. 09 Sep. 09
Electronic banking service in overseas*1
Cash management providers’ ranking(In Asia Pacific)*3
4th
Large Corporates
4th 3rd
+18%*2
1st among Japanese Banks for the four years running
1st
CMS*4
as voted by CorporatesJPY CMS*4
as voted byFinancial Institutions
(thousands of contracts)
32
41
53
69
Also in overseas, reinforcing funding business to balance with loan book, constituted upon commercial banking business base
Data book P.21Reference:
Medium Corporates
Small Corporates
3. Realizing a Solid Financial Base as a Global Player

27
+approx. JPY 7 tn
Domestic Marketing
International BankingOthers
2.82.3
3.3
1.21.8
1.70.4 0.3
0.3
0
2
4
6
Mar. 08 Mar. 09 Sep. 09
Preferred stocksPreferred securitiesOther Tier I capital
Enhanced capital base both in terms of quality and quantity, through JPY 861.0 billion common equity offering and completed refinance of JPY 0.8 trillion of preferred securities issued about ten years ago
Tier I Capital/ Tier I ratio*1
Factors of increase in Risk-adjusted assets(original plan for FY3/10)
(JPY tn)
Tier I capital raising and redemption since 08
3-1. Capital Policy in 1st Half, FY3/2010
4.3
5.3
4.4
“Core Tier I*2 ratio”
Tier I ratio 6.94% 8.22% 9.55%
4.4% 4.3% 5.9%
Risk-adjusted assets
(JPY tn)63 53 55
Ref.
Data book P.15, 16Reference: Supplementary info. P.7
Ref.
*4 Expected increase in risk-adjusted assets due to changes in probability of default and loss given default. PD: Probability of Default, LGD: Loss Given Default
(SMFG consolidated)
Consolidation of Nikko Cordial Securities
*1 Based on Basel II standard (Credit risk: FIRB for Mar. 08, AIRB from Mar. 09, Operational risk: AMA)
*2 While “Core Tier I” is not defined in international agreements, we estimated “Core Tier I capital = Tier I capital – Preferred stocks – Preferred securities”
PD/LGD Impact*4
Feb. 08 JPY 135.0 bn Preferred securities(Non step-up) Domestic market
May 08 USD 1,800 mn Preferred securities(Non step-up)
Overseas market(Asian retail)
Dec. 08 –Jan. 09 JPY 698.9 bn Preferred securities
(Step-up/Non step-up) Domestic market
Jun. 09Jun. 09 JPY (340.0) bnJPY (340.0) bn Preferred securitiesPreferred securities(Non step(Non step--up)up)
Redemption of SBESRedemption of SBES(SB Equity Securities (Cayman), Limited)
Aug. -Sep. 09 JPY 388.0 bn*3 Preferred securities Domestic market
Jun. 08Jun. 08
Jul. 08
Jan. 09Jan. 09
Jun. –Jul. 09
USD 1,350 mn/ GBP 250 mn
Preferred securities(Step-up) Overseas market
JPY (283.8) bnJPY (283.8) bnPreferred securitiesPreferred securities(Non step(Non step--up)up)
Redemption of SPCLRedemption of SPCL(Sakura Preferred Capital (Cayman) Limited)
USD (1,800) mnUSD (1,800) mn Preferred securitiesPreferred securities(Step(Step--up)up)
Redemption of Redemption of ““OPCOOPCO””(SB Treasury Company LLC)
JPY 861.0bn Common stocks Domestic and overseas market
*3 Including JPY 45.0 bn paid in on Oct.15th, 09
refinanced
refinancedrefinanced

28
3-2. Current Business Environment and Tightening Capital Adequacy Requirements
As a global financial services group, SMFG will respond to the new regulatory framework in an appropriate mannerto remain competitive and achieve sustainable growth
* Source: “Declaration of the Summit on Financial Markets and the World Economy,” Nov. 15, 08, G20
Agreement of the oversight body of Basel Committee Sep. 09Root causes of current crisis* Leaders’ Statement
The Pittsburgh Summit Sep. 09
Agreed:
Developing by end-2010 internationally agreed rules
These rules will be phased in as financial conditions improve and economic recovery is assured, with the aim of implementation by end-2012
After 20102008 - 2009
LehmanLehmanBrothersBrothers’’
bankruptcybankruptcy
20072007
SubSub--primeprimeCrisisCrisis
Adjustment of Asset Prices / De-leveraging
Further Deterioration of Macro Economy
Governmental Support to Economy
Initiatives to Tighten Capital Adequacy Requirements
Initiatives for Convergence in Accounting Standard
“New Financial Regime”
Lack of adequate appreciation of risks
Vulnerabilities in the system
Weak underwriting standards
Unsound risk management
Increasingly complex and opaque financial products
Excessive leverageetc.
Agreed:
The predominant form of the Tier I capital must be common shares and retained earnings
Introduction of a leverage ratio as a supplementary measure
Introduction of a framework for countercyclical capital buffer
etc.
29
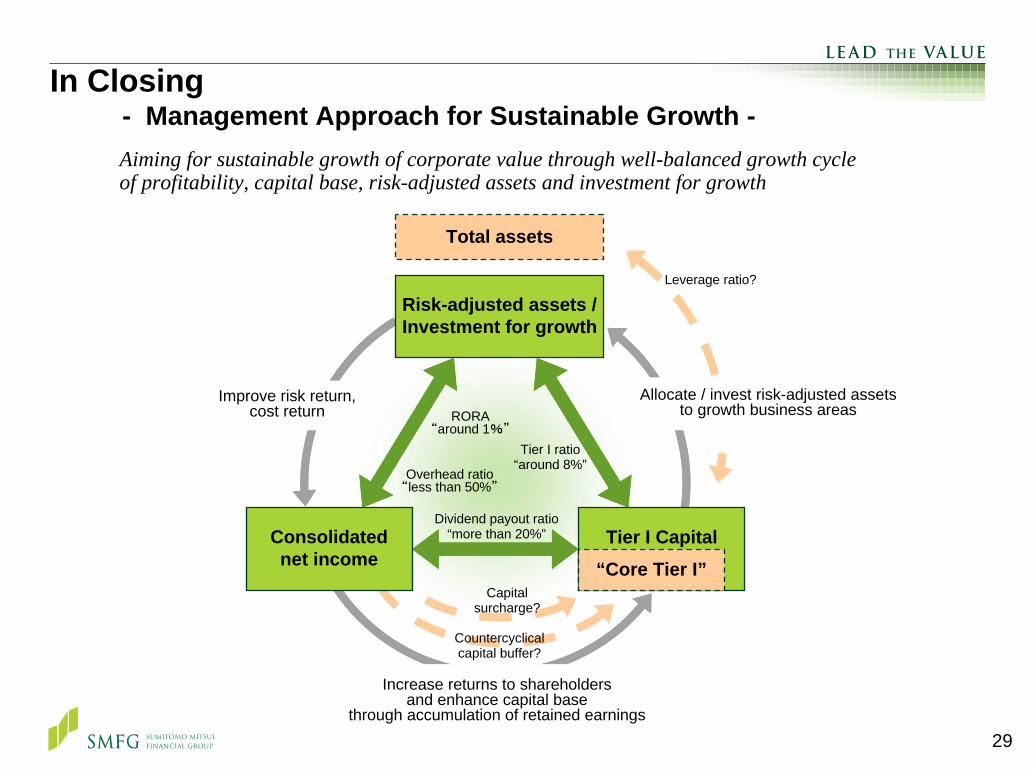
Tier I ratio“around 8%”
Overhead ratio“less than 50%”
RORA“around 1%”
Dividend payout ratio“more than 20%”
In Closing- Management Approach for Sustainable Growth -Aiming for sustainable growth of corporate value through well-balanced growth cycle of profitability, capital base, risk-adjusted assets and investment for growth
Total assets
Capital surcharge?
Risk-adjusted assets /Investment for growth
Improve risk return, cost return
Consolidatednet income
Allocate / invest risk-adjusted assets to growth business areas
Leverage ratio?
Increase returns to shareholders and enhance capital base
through accumulation of retained earnings
Countercyclical capital buffer?
Tier I Capital
“Core Tier I”
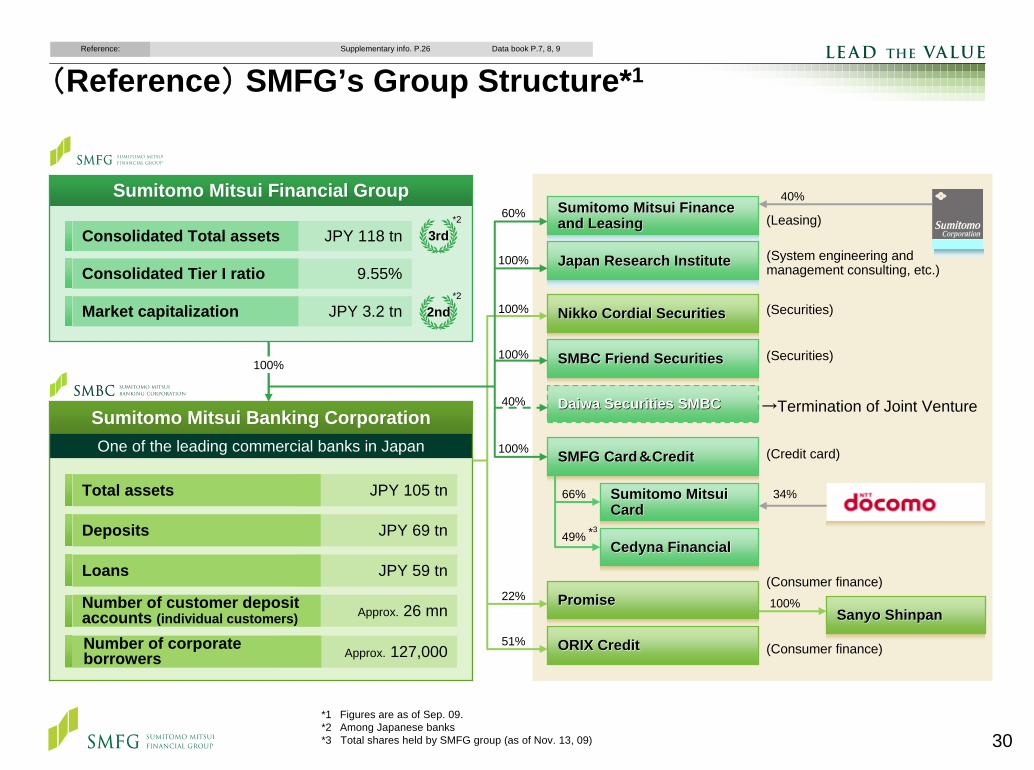
30*1 Figures are as of Sep. 09.*2 Among Japanese banks*3 Total shares held by SMFG group (as of Nov. 13, 09)
Consolidated Total assets JPY 118 tn
Consolidated Tier I ratio 9.55%
Market capitalization JPY 3.2 tn
*2
3rd
*2
2nd
Sumitomo Mitsui Financial GroupSumitomo Mitsui Financial Group
JPY 105 tn
JPY 69 tn
JPY 59 tn
One of the leading commercial banks in Japan
Approx. 26 mn
40%Sumitomo Mitsui Finance Sumitomo Mitsui Finance and Leasingand Leasing
Japan Research InstituteJapan Research Institute
Daiwa Securities SDaiwa Securities SMBCMBC
Nikko Cordial SecuritiesNikko Cordial Securities
SMBC Friend SecuritiesSMBC Friend Securities
SMFG CardSMFG Card&&CreditCredit
Sumitomo Mitsui Sumitomo Mitsui CardCard
Cedyna FinancialCedyna Financial
PromisePromise
ORIX CreditORIX Credit
66%
49%
34%
Sanyo ShinpanSanyo Shinpan100%22%
51%
100%
60%
100%
40%
100%
100%
100% (Credit card)
(Consumer finance)
→Termination of Joint Venture
(Securities)
(Securities)
(Leasing)
(System engineering and management consulting, etc.)
Approx. 127,000Number of corporate borrowers
Sumitomo Mitsui Banking CorporationSumitomo Mitsui Banking Corporation
(Consumer finance)
*3
(Reference) SMFG’s Group Structure*1Data book P.7, 8, 9Reference: Supplementary info. P.26
Total assets
Deposits
Loans
Number of customer deposit accounts (individual customers)
31
This material contains certain forward-looking statements. Such forward-looking statements are not guarantees of future performance and involve risks and uncertainties, and actual results may materially differ from those contained in the forward-looking statements as a result of various factors. The following items are among the factors that could cause actual results to differ materially from the forward-looking statements in this material: business conditions in the banking industry, the regulatory environment, new legislation, competition with other financial services companies, changing technology and evolving banking industry standards and similar matters.