Embed Size (px)
Citation preview
AVATION PLC
(“Avation” or “the Company”)
FINANCIAL RESULTS AND INTERIM MANAGEMENT STATEMENT FOR THE SIX MONTHS ENDED 31 DECEMBER 2017
Avation PLC (LSE: AVAP), the commercial passenger aircraft leasing company, announces reviewed financial results for the six months ending 31 December 2017.
Key Financial Metrics
Fleet assets increased by 35% to $1.008 billion since 30 June 2017;
Revenue increased by 16% year on year to $52.4 million;
Weighted average cost of total debt declined to 4.8%;
Total profit after tax decreased by 8% year on year to $6.7 million; and
Earnings per share (“EPS”) decreased 15% year on year to 10.9 cents.
Operational Highlights
Record growth with over $286 million in aircraft acquired in December 2017;
First twin-aisle aircraft delivered into the fleet;
First Boeing aircraft delivered into the fleet;
Airbus A320 transitioned from Air Berlin to easyJet; and
Four new customers added taking total airline customers to twelve.
Executive Chairman, Jeff Chatfield, said:
“During the six months ended 31 December 2017 Avation focused on re-deploying net proceeds generated by the sale of six ATR aircraft in June 2017, adding new customers to further diversify our revenue base and concluding our first investments in twin-aisle aircraft. “Avation is pleased to report record growth in the value of its fleet assets. The Company took delivery of its first twin-aisle aircraft in December, completing the transformation into a diversified full service aircraft leasing platform. We also welcome four new airline customers.
“Lease revenue and total profit for the financial period were slightly reduced year on year. This was due to starting the period with a reduced fleet following the sale of six ATR 72 aircraft in June 2017. The sale of these aircraft de-risked the portfolio by lowering airline concentration and released equity which facilitated the acquisition of four new aircraft in December 2017.
“Avation ends the financial period with a larger, more diversified fleet and an increased revenue base that will deliver long-term shareholder returns.”
Financial Highlights
6 months ended 31 December 2017
US$ 000’s
6 months ended 31 December 2016
US$ 000’s
Change
Revenue 52,385 45,108 16%
Lease revenue 41,707 45,108 (8%)
Operating profit (EBIT) 25,117 27,628 (9%)
Operating profit margin 60% 61% (1%)
Administrative expense 4,914 3,943 25%
Administrative expense/ Revenue 9% 9% -
Profit before tax 7,273 8,388 (13%)
Total profit after tax 6,739 7,357 (8%)
EPS 10.9 cents 12.9 cents (15%)
Operating cash flows 64,264 31,116 107%
As at 31 December 2017
US$ 000’s
As at 30 June 2017
US$ 000’s
Fleet assets(1) 1,008,459 744,731 35%
Total assets 1,119,970 895,927 25%
Cash and cash equivalents 82,810 87,692 (6%)
Book Value per Share (US$)(2) $3.32 $3.21 4%
1. Fleet assets equal property, plant and equipment plus assets held for sale
2. Book Value per Share is the total equity divided by the total number of shares on issue at period end.
Aircraft Fleet
Aircraft Type 31 December 2017
Boeing 777-300ER 1
Airbus A330-300 1
Airbus A321-200 8
Airbus A320-200 3
Fokker 100 5
ATR 72-600 13
ATR 72-500 6
Total 37
As at 31 December 2017 Avation’s fleet comprised 37 aircraft including five aircraft on finance lease. The weighted average age of the fleet (excluding finance leases) has reduced to 2.9 years (30 June 2017: 3.3 years) and the weighted average remaining lease term has increased to 7.9 years (30 June 2017: 7.5 years). As at 31 December 2017, all aircraft owned by the Company were fully utilised. Avation has three ATR 72 turboprop aircraft on order for placement during calendar year 2018 and three aircraft in calendar year 2019.
Fleet assets increased 35% to $1,008.5 million (30 June 2017: $744.7 million). Four aircraft were added to the fleet in the period including a Boeing 777-300ER delivered to Philippine Airlines, an Airbus A330-300 on lease to EVA Air and two ATR72-600 aircraft delivered to Mandarin Airlines.
During the period an Airbus A320 on lease to Air Berlin was transitioned to easyJet. This resulted in the release of maintenance reserves of $10.5 million into revenue and a corresponding impairment charge on the aircraft of $8.0 million.
Two older narrowbody aircraft with total book value of $38.4 million were re-classified as assets held for sale. Finance lease receivables totalled $10.3 million (30 June 2017: $45.4 million).
Debt summary
31 December 2017 US$000’s
30 June 2017 US$000’s
Loans and borrowings 862,411 643,605
Cash & cash equivalents 82,810 87,692
Net indebtedness 779,601 555,913
Total loan to value ratio (LTV) (1) 77% 72%
Weighted average cost of secured debt(2) 4.3% 4.5%
Weighted average cost of total debt(3) 4.8% 5.1%
1. Total Loan to Value Ratio is the total loans and borrowing divided by the total assets.
2. Weighted Average Cost of Secured Debt is the weighted average of the interest rate for the secured loans and
borrowings as at the period end.
3. Weighted Average Cost of Total Debt is the weighted average of the interest rate for the total loans and borrowings
as at the period end.
The weighted average cost of total debt decreased to 4.8% as at 31 December 2017 (30 June 2017: 5.1%). The weighted average cost of secured debt decreased to 4.3% at 31 December 2017 (30 June 2017: 4.5%).
At the end of the financial period, Avation’s overall loan to value ratio was 77% (30 June 2017: 72%). At 31 December 2017, 95% of total debt was at fixed or hedged interest rates (30 June 2017: 95%).
Avation issued an additional $30.0 million Senior 7.5% Unsecured Guaranteed Notes due 2020 under its Global Medium Term Note programme at a premium to par value in November 2017.
Avation will continue to source competing forms of secured and unsecured debt finance to fund growth with the overriding objective of achieving the lowest cost of finance.
Credit Rating
The Company’s current credit ratings are as follows:
Rating Agency Corporate Credit Rating Unsecured Notes Rating
Standard and Poor’s B+ outlook stable B
Fitch Ratings B+ outlook stable B+
Egan Jones Ratings Company BB NR
Japan Credit Ratings Company BB outlook stable NR
Dividend Policy
The Company confirms its aim to maintain a progressive dividend policy.
Recognising that the Company’s functional currency is US Dollars (USD) and to reduce exchange rate risk, shareholders are reminded that dividend payments are declared in USD. Shareholders who prefer to receive dividends in British Pounds (GBP) can elect to receive GBP by completing a form that can be downloaded at www.avation.net/dividends.html
Market Positioning
Avation’s strategy is to target growth and diversification by adding new airline customers, while maintaining strong average aircraft age and lease term metrics. Avation focuses on new and

relatively new commercial passenger aircraft on long-term leases. Avation is able to supply regional, narrowbody and twin-aisle aircraft to the airline industry.
The Company’s business model involves rigorous investment criteria and has a history of delivering consistent profitability while seeking to mitigate the risks associated with the aircraft leasing sector. Avation will typically sell mid-life and older aircraft and redeploy capital to newer assets. This approach is intended to mitigate technology change risk, operational and financial risk, support sustained growth and deliver long-term shareholder value.
Avation is an active trader of aircraft and from time to time will consider the acquisition or sale of individual or smaller portfolios of aircraft, based on prevailing market opportunities and considerations of risk and revenue concentrations.
Outlook and Interim Management Statement
The outlook for the second half of the 2018 financial year is for materially increased lease revenue due to increased fleet size.
Management believes that the risks associated with its portfolio of assets have been reduced through the repositioning of the fleet, growth and diversification that has been achieved during the financial period. Avation has demonstrated that it has the capability to acquire, finance and deliver a number of aircraft in a short period of time when the opportunity presents itself and has a platform which supports future growth.
Management believes that it can attract airline customers, acquire aircraft and obtain the required funding for growth. In addition to operational cash flows, funding is traditionally sourced from capital markets, asset backed bank lending and disposal of selected aircraft. Access to acceptably priced funding is a risk, which is common to all capital-intensive businesses. Specific risks which are inherent to the aircraft leasing industry include, but are not limited to, the creditworthiness of customer airlines, over-production of new aircraft and market saturation, technology change, residual value risks, competition from other lessors and the risk of impairment of aircraft assets.
Avation’s Board of Directors is pleased to deliver satisfactory financial results from its aircraft leasing business through this period of fleet repositioning, diversification and growth.
Results Conference Call
Avation’s senior management team will host a conference call on 26 February 2018, at 1pm GMT (UK) / 8am EST (US) / 9pm SGT (Singapore), to discuss the Company’s financial results. Participants should dial: United Kingdom 020 3936 2999; United States +1 845 709 8568; Singapore 31 634 602; other locations +44 20 3936 2999 and enter 609760 when prompted. The conference call will also be webcast live through the following link:
http://avation.emincote.com/results/2018firsthalf
To view the webcast investors will be invited to register their name and email address, participants can do this in advance or on the day. A replay of the webcast will be available on the Investor Relations page of the Avation website and a presentation, to support the conference call, will be available on the Avation website prior to the conference call.
Forward Looking Statements
This release contains certain “forward looking statements”. Forward looking statements may be identified by words such as “expects,” “intends,” “anticipates,” “plans,” “believes,” “seeks,” “estimates,” “will,” or words of similar meaning and include, but are not limited to, statements regarding the outlook for Avation’s future business and financial performance. Forward looking statements are based on management’s current expectations and assumptions, which are subject to inherent uncertainties, risks and changes in circumstances that are difficult to predict.
Actual outcomes and results may differ materially due to global political, economic, business, competitive, market, regulatory and other factors and risks. Further information on the factors and risks that may affect Avation’s business is included in Avation’s regulatory announcements from time to time, including its Annual Report, Full Year Financial Results and Half Year Results announcements. Avation expressly disclaims any obligation to update or revise any of these forward looking statements, whether because of future events, new information, a change in its views or expectations, or otherwise.
- ENDS-
More information on Avation PLC can be found at: www.avation.net
Enquiries:
Avation PLC Jeff Chatfield, Executive Chairman
T: +65 6252 2077

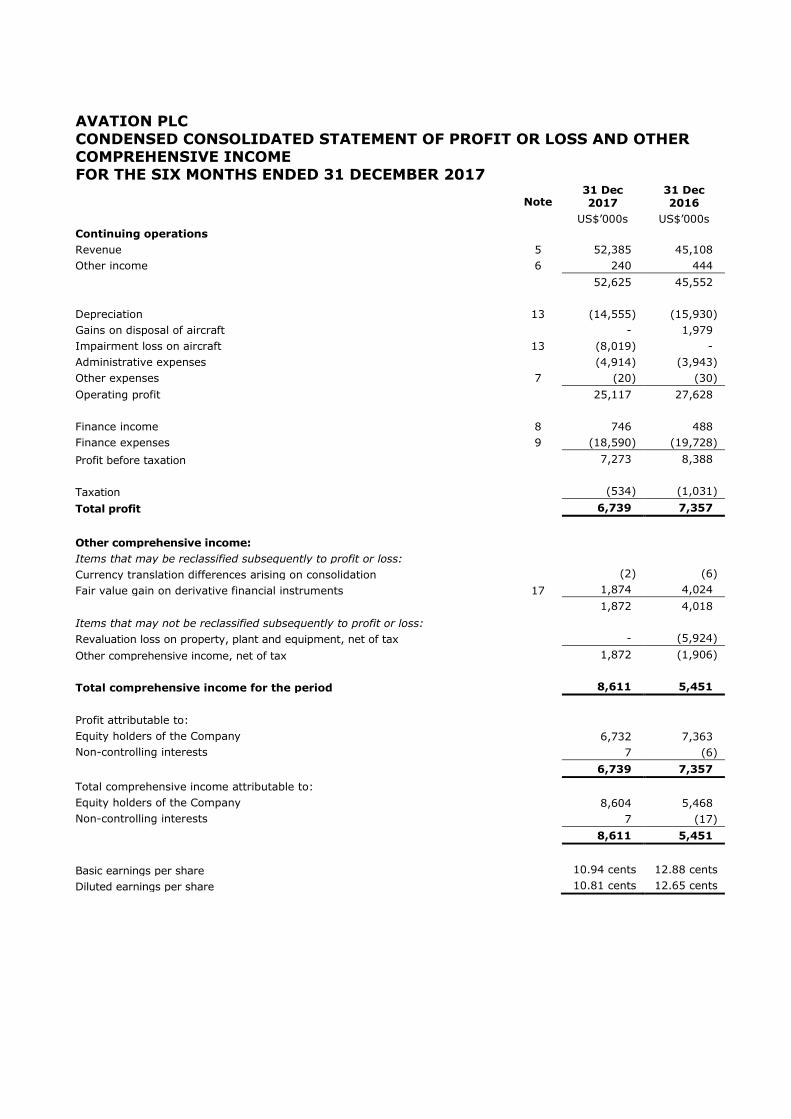
AVATION PLC
CONDENSED CONSOLIDATED STATEMENT OF PROFIT OR LOSS AND OTHER COMPREHENSIVE INCOME FOR THE SIX MONTHS ENDED 31 DECEMBER 2017
Note 31 Dec 2017
31 Dec 2016
US$’000s US$’000s
Continuing operations
Revenue 5 52,385 45,108
Other income 6 240 444
52,625 45,552
Depreciation 13 (14,555) (15,930)
Gains on disposal of aircraft - 1,979
Impairment loss on aircraft 13 (8,019) -
Administrative expenses (4,914) (3,943)
Other expenses 7 (20) (30)
Operating profit 25,117 27,628
Finance income 8 746 488
Finance expenses 9 (18,590) (19,728)
Profit before taxation 7,273 8,388
Taxation (534) (1,031)
Total profit 6,739 7,357
Other comprehensive income:
Items that may be reclassified subsequently to profit or loss:
Currency translation differences arising on consolidation (2) (6)
Fair value gain on derivative financial instruments 17 1,874 4,024
1,872 4,018
Items that may not be reclassified subsequently to profit or loss:
Revaluation loss on property, plant and equipment, net of tax - (5,924)
Other comprehensive income, net of tax 1,872 (1,906)
Total comprehensive income for the period 8,611 5,451
Profit attributable to:
Equity holders of the Company 6,732 7,363
Non-controlling interests 7 (6)
6,739 7,357
Total comprehensive income attributable to:
Equity holders of the Company 8,604 5,468
Non-controlling interests 7 (17)
8,611 5,451
Basic earnings per share 10.94 cents 12.88 cents
Diluted earnings per share 10.81 cents 12.65 cents
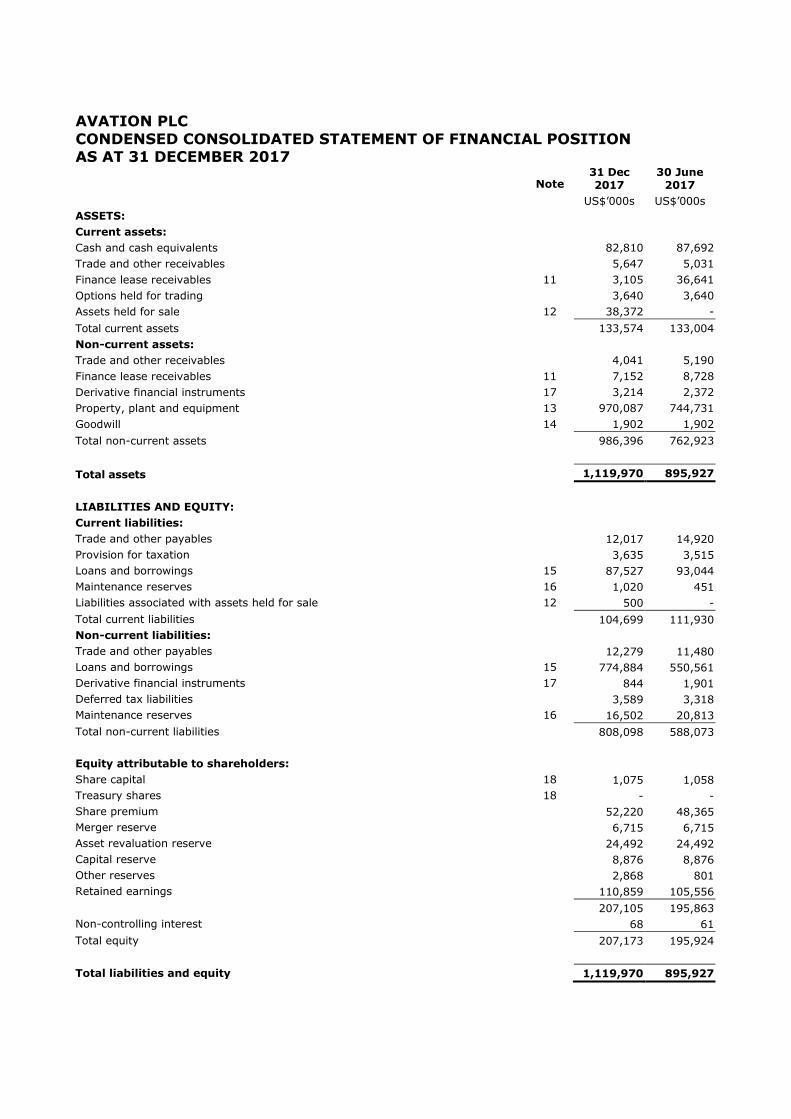
AVATION PLC
CONDENSED CONSOLIDATED STATEMENT OF FINANCIAL POSITION AS AT 31 DECEMBER 2017
Note 31 Dec 2017
30 June 2017
US$’000s US$’000s
ASSETS:
Current assets:
Cash and cash equivalents 82,810 87,692
Trade and other receivables 5,647 5,031
Finance lease receivables 11 3,105 36,641
Options held for trading 3,640 3,640
Assets held for sale 12 38,372 -
Total current assets 133,574 133,004
Non-current assets:
Trade and other receivables 4,041 5,190
Finance lease receivables 11 7,152 8,728
Derivative financial instruments 17 3,214 2,372
Property, plant and equipment 13 970,087 744,731
Goodwill 14 1,902 1,902
Total non-current assets 986,396 762,923
Total assets 1,119,970 895,927
LIABILITIES AND EQUITY:
Current liabilities:
Trade and other payables 12,017 14,920
Provision for taxation 3,635 3,515
Loans and borrowings 15 87,527 93,044
Maintenance reserves 16 1,020 451
Liabilities associated with assets held for sale 12 500 -
Total current liabilities 104,699 111,930
Non-current liabilities:
Trade and other payables 12,279 11,480
Loans and borrowings 15 774,884 550,561
Derivative financial instruments 17 844 1,901
Deferred tax liabilities 3,589 3,318
Maintenance reserves 16 16,502 20,813
Total non-current liabilities 808,098 588,073
Equity attributable to shareholders:
Share capital 18 1,075 1,058
Treasury shares 18 - -
Share premium 52,220 48,365
Merger reserve 6,715 6,715
Asset revaluation reserve 24,492 24,492
Capital reserve 8,876 8,876
Other reserves 2,868 801
Retained earnings 110,859 105,556
207,105 195,863
Non-controlling interest 68 61
Total equity 207,173 195,924
Total liabilities and equity 1,119,970 895,927

AVATION PLC CONDENSED CONSOLIDATED STATEMENT OF CHANGES IN EQUITY
FOR THE SIX MONTHS ENDED 31 DECEMBER 2017
Other reserves consist of capital redemption reserve, warrant reserve, fair value reserve and foreign currency translation reserve.
Attributable to shareholders of the parent
Note Share
capital
Treasury
shares
Share
premium
Merger
reserve
Asset
revaluation
reserve
Capital
reserve
Other
reserves
Retained
earnings
Total Non-
controlling
interest
Total
equity
US$’000s US$’000s US$’000s US$’000s US$’000s US$’000s US$’000s US$’000s US$’000s US$’000s US$’000s
Balance at 1 July 2017 1,058 - 48,365 6,715 24,492 8,876 801 105,556 195,863 61 195,924
Profit for the period - - - - - - - 6,732 6,732 7 6,739
Other comprehensive income - - - - - - 1,872 - 1,872 - 1,872
Total comprehensive income - - - - - - 1,872 6,732 8,604 7 8,611
Increase in issued share capital 18 17 - 2,756 - - - (219) - 2,554 - 2,554
Warrants expired - - - - - - (18) 18 - - -
Warrants expense - - 1,099 - - - 432 (1,447) 84 - 84
Total transactions with owners,
recognised directly in equity
17
-
3,855
-
-
-
195
(1,429)
2,638
-
2,638
Balance at 31 December 2017 1,075 - 52,220 6,715 24,492 8,876 2,868 110,859 207,105 68 207,173

AVATION PLC CONDENSED CONSOLIDATED STATEMENT OF CHANGES IN EQUITY
FOR THE SIX MONTHS ENDED 31 DECEMBER 2016
Attributable to shareholders of the parent
Note Share
capital
Treasury
shares
Share
premium
Merger
reserve
Asset
revaluation
reserve
Capital
reserve
Other
reserves
Retained
earnings
Total Non-
controlling
interest
Total
equity
US$’000s US$’000s US$’000s US$’000s US$’000s US$’000s US$’000s US$’000s US$’000s US$’000s US$’000s
Balance at 1 July 2016 993 (1) 38,925 6,715 41,142 8,876 (1,814) 78,679 173,515 93 173,608
Profit for the period - - - - - - - 7,363 7,363 (6) 7,357
Other comprehensive income - - - - (5,913) - 4,018 - (1,895) (11) (1,906)
Total comprehensive income - - - - (5,913) - 4,018 7,363 5,468 (17) 5,451
Dividend paid 22 - - - - - - - (1,820) (1,820) - (1,820)
Increase in issued share capital 18 38 - 5,864 - - - (43) - 5,859 - 5,859
Fund raising expenses - - (284) - - - (284) (284)
Dividend paid to non-controlling
interest of a subsidiary
- - - - - - - - - (16) (16)
Transfer of asset revaluation
surplus
- - - - (4,053) - - 4,053
- - -
Warrants expense - - - - - - 100 - 100 - 100
Total transactions with owners,
recognised directly in equity
38
-
5,580
-
(4,053)
-
57
2,233
3,855
(16)
3,839
Balance at 31 December 2016 1,031 (1) 44,505 6,715 31,176 8,876 2,261 88,275 182,838 60 182,898

AVATION PLC
CONDENSED CONSOLIDATED STATEMENT OF CASH FLOWS FOR THE SIX MONTHS ENDED 31 DECEMBER 2017
Note 31 Dec 2017
31 Dec 2016
US$’000s US$’000s
Cash flows from operating activities:
Profit before taxation 7,273 8,388
Adjustments for:
Depreciation expense 13 14,555 15,930
Warrants expense 84 100
Impairment loss on non-trade receivables 7 - 30
Impairment loss on aircraft 13 8,019 -
Amortisation of loan insurance premium 9 539 539
Amortisation of interest expense on non-current deposits 9 191 217
Gain on disposal of aircraft - (1,979)
Fair value gain on derivatives 6 (25) -
Finance income from discounting non-current deposits to fair value 8 (196) (227)
Interest income 8 (550) (261)
Maintenance reserves released 5 (10,491) -
Interest expense 9 17,734 18,010
Operating cash flows before working capital changes 37,133 40,747
Movement in working capital:
Trade and other receivables and finance lease receivables 35,629 1,899
Trade and other payables 1,838 1,888
Maintenance reserves 6,749 3,682
Cash from operations 81,349 48,216
Interest received 566 261
Interest paid (17,507) (17,232)
Income tax paid (143) (129)
Net cash from operating activities 64,265 31,116
Cash flows from investing activities:
Purchase of property, plant and equipment (286,302) (256,786)
Proceeds from disposal of aircraft - 100,140
Net cash used in investing activities (286,302) (156,646)
Cash flows from financing activities:
Net proceeds from issuance of ordinary shares 2,554 5,575
Dividends paid to shareholders 22 (3,664) (1,820)
Dividend paid to non-controlling interest of a subsidiary - (16)
Proceeds from loans and borrowings, net of transactions costs 277,393 216,332
Repayment of loans and borrowings (59,126) (94,872)
Net cash from financing activities 217,157 125,199
Effects of exchange rates on cash and cash equivalents (2) (5)
Net decrease in cash and cash equivalents (4,882) (336)
Cash and cash equivalents at beginning of financial period 87,692 48,267
Cash and cash equivalents at end of financial period 82,810 47,931

AVATION PLC
NOTES TO THE CONDENSED CONSOLIDATED FINANCIAL STATEMENTS
FOR THE SIX MONTHS ENDED 31 DECEMBER 2017 This interim condensed consolidated financial statements for Avation PLC for the six months ended 31 December 2017 were authorised for issue in accordance with a resolution of the Directors on 26 February 2018.
1 CORPORATE INFORMATION Avation PLC is a public limited company incorporated in England and Wales under the Companies Act 2006 (Registration Number 05872328) and is listed on the London Stock Exchange in the Standard Segment (LSE:AVAP).
The Group’s principal activity is aircraft leasing.
2 BASIS OF PREPARATION AND ACCOUNTING POLICIES
This interim condensed consolidated financial statements have been prepared in accordance with the Disclosure and Transparency Rules (DTR) of the Financial Conduct Authority and in accordance with International Accounting Standard (IAS) 34 ‘Interim Reporting’. The interim condensed consolidated financial statements do not include all the notes of the type normally included within the annual report and therefore cannot be expected to provide as
full an understanding of the financial performance, financial position and financial and investing activities of the consolidated entity as the full financial report. It is recommended that the interim condensed consolidated financial statements be read in conjunction with the annual report for the year ended 30 June 2017 and considered together with any public announcements made by Avation PLC during the six months ended 31 December 2017.
The accounting policies and methods of computation are the same as those adopted in the annual report for the year ended 30 June 2017 except for the new category of revenue recognition policy as follows: Maintenance reserve released - The maintenance reserves revenue is recognised in the profit or loss upon the recovery of maintenance reserve from an insolvent airline customer that defaulted
on its lease agreements. The preparation of the interim condensed consolidated financial statements require management to make estimates and assumptions that affect the reported income and expenses, assets and liabilities and disclosure of contingencies at the date of the Interim Report, actual results may differ from these estimates.
The statutory financial statements of Avation PLC for the year ended 30 June 2017, which carried an unqualified audit report, have been delivered to the Registrar of Companies and did not contain any statements under section 498 of the Companies Act 2006.
The interim condensed consolidated financial statements are unaudited and reviewed by the auditors.
The interim condensed consolidated financial statements do not constitute statutory financial statements within the meaning of section 434 of the Companies Act 2006.
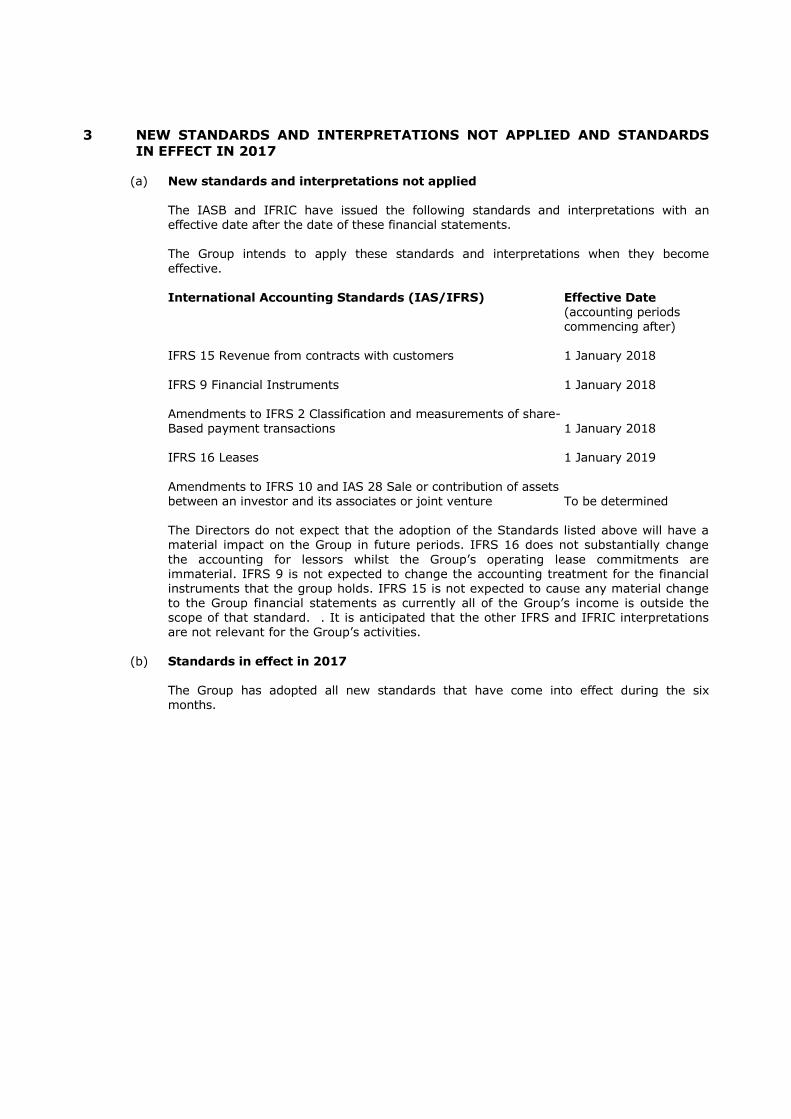
3 NEW STANDARDS AND INTERPRETATIONS NOT APPLIED AND STANDARDS
IN EFFECT IN 2017
(a) New standards and interpretations not applied
The IASB and IFRIC have issued the following standards and interpretations with an effective date after the date of these financial statements. The Group intends to apply these standards and interpretations when they become
effective.
International Accounting Standards (IAS/IFRS) Effective Date (accounting periods
commencing after)
IFRS 15 Revenue from contracts with customers 1 January 2018
IFRS 9 Financial Instruments 1 January 2018 Amendments to IFRS 2 Classification and measurements of share- Based payment transactions 1 January 2018
IFRS 16 Leases 1 January 2019
Amendments to IFRS 10 and IAS 28 Sale or contribution of assets between an investor and its associates or joint venture To be determined The Directors do not expect that the adoption of the Standards listed above will have a material impact on the Group in future periods. IFRS 16 does not substantially change
the accounting for lessors whilst the Group’s operating lease commitments are immaterial. IFRS 9 is not expected to change the accounting treatment for the financial instruments that the group holds. IFRS 15 is not expected to cause any material change to the Group financial statements as currently all of the Group’s income is outside the
scope of that standard. . It is anticipated that the other IFRS and IFRIC interpretations are not relevant for the Group’s activities.
(b) Standards in effect in 2017
The Group has adopted all new standards that have come into effect during the six months.
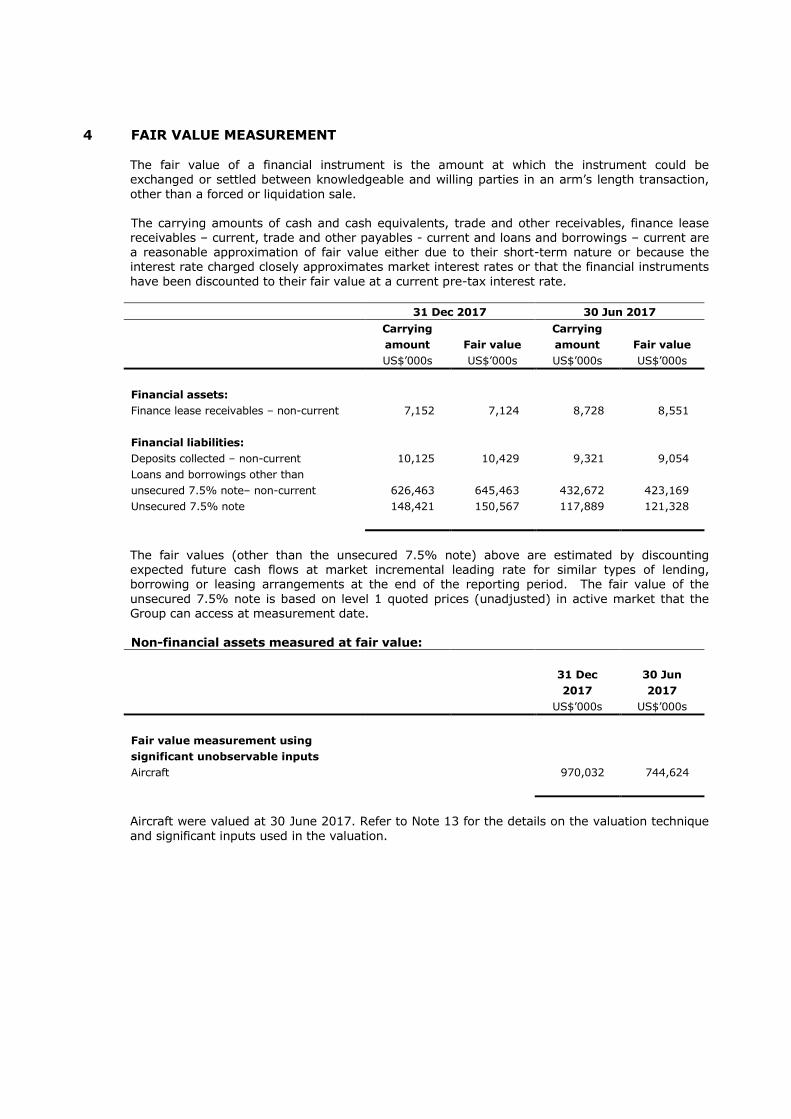
4 FAIR VALUE MEASUREMENT
The fair value of a financial instrument is the amount at which the instrument could be exchanged or settled between knowledgeable and willing parties in an arm’s length transaction,
other than a forced or liquidation sale. The carrying amounts of cash and cash equivalents, trade and other receivables, finance lease receivables – current, trade and other payables - current and loans and borrowings – current are a reasonable approximation of fair value either due to their short-term nature or because the interest rate charged closely approximates market interest rates or that the financial instruments
have been discounted to their fair value at a current pre-tax interest rate.
31 Dec 2017 30 Jun 2017
Carrying
amount Fair value
Carrying
amount Fair value
US$’000s US$’000s US$’000s US$’000s
Financial assets:
Finance lease receivables – non-current 7,152 7,124 8,728 8,551
Financial liabilities:
Deposits collected – non-current 10,125 10,429 9,321 9,054
Loans and borrowings other than
unsecured 7.5% note– non-current 626,463 645,463 432,672 423,169
Unsecured 7.5% note 148,421 150,567 117,889 121,328
The fair values (other than the unsecured 7.5% note) above are estimated by discounting expected future cash flows at market incremental leading rate for similar types of lending, borrowing or leasing arrangements at the end of the reporting period. The fair value of the
unsecured 7.5% note is based on level 1 quoted prices (unadjusted) in active market that the
Group can access at measurement date. Non-financial assets measured at fair value:
31 Dec
2017
30 Jun
2017
US$’000s US$’000s
Fair value measurement using
significant unobservable inputs
Aircraft 970,032 744,624
Aircraft were valued at 30 June 2017. Refer to Note 13 for the details on the valuation technique
and significant inputs used in the valuation.

4 FAIR VALUE MEASUREMENT (continued)
Classification of financial instruments: A comparison by category of carrying amounts of all the Group’s financial instruments that are
carried in the financial statements which are considered to equate to fair value is set out below.
31 Dec
2017
30 Jun
2017
US$’000s US$’000s
Loans and receivables:
Cash and cash equivalents 82,810 87,692
Trade and other receivables 8,041 9,261
Finance lease receivables 10,257 45,369
101,108 142,322
Financial liabilities measured at
amortised cost:
Trade and other payables 15,021 17,938
Loans and borrowings 862,411 643,605
Maintenance reserves 17,522 21,264
894,954 682,807
Derivative used for hedging:
Derivative financial instruments- asset 3,214 2,372
Derivative financial instruments- (liability) (844) (1,901)
Fair value through profit or loss:
Options held for trading 3,640 3,640
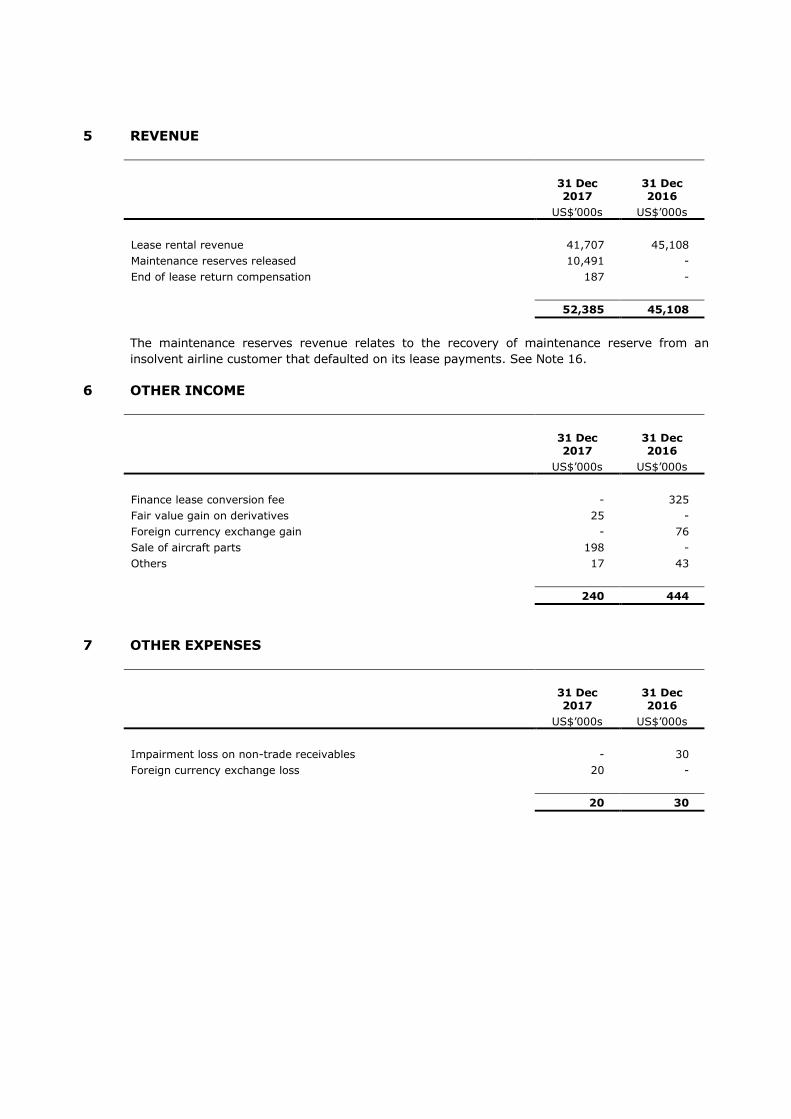
5 REVENUE
31 Dec 2017
31 Dec 2016
US$’000s US$’000s
Lease rental revenue 41,707 45,108
Maintenance reserves released 10,491 -
End of lease return compensation 187 -
52,385 45,108
The maintenance reserves revenue relates to the recovery of maintenance reserve from an
insolvent airline customer that defaulted on its lease payments. See Note 16.
6 OTHER INCOME
31 Dec 2017
31 Dec 2016
US$’000s US$’000s
Finance lease conversion fee - 325
Fair value gain on derivatives 25 -
Foreign currency exchange gain - 76
Sale of aircraft parts 198 -
Others 17 43
240 444
7 OTHER EXPENSES
31 Dec 2017
31 Dec 2016
US$’000s US$’000s
Impairment loss on non-trade receivables - 30
Foreign currency exchange loss 20 -
20 30

8 FINANCE INCOME
31 Dec 2017
31 Dec 2016
US$’000s US$’000s
Interest income 550 261
Finance income from discounting non-current deposits to fair value 196 227
746 488
9 FINANCE EXPENSES
31 Dec 2017
31 Dec 2016
US$’000s US$’000s
Interest expense on borrowings 12,644 13,882
Interest expense on unsecured 7.5% notes 5,090 4,128
Amortisation of loan insurance premium 539 539
Amortisation of interest expense on non-current deposits 191 217
Finance charges on early full repayment on borrowings - 740
Others 126 222
18,590 19,728
10 RELATED PARTY TRANSACTIONS
Significant related party transactions:
31 Dec 2017
31 Dec 2016
US$’000s US$’000s
Entities controlled by key management personnel
(including directors):
Rental expenses paid (98) (119)
Consulting fee paid (166) (81)
Interest expense - (15)
Interest expense on unsecured 7.5% notes (204) (204)
Director
Interest expense - (29)
Interest expense on unsecured 7.5% notes (7) (7)

11 FINANCE LEASE RECEIVABLES
Future minimum lease payments receivable under finance are as follows:
31 Dec 2017 30 Jun 2017
Minimum
lease
payments
Present
value of
payments
Minimum
lease
payments
Present
value of
payments
US$’000s US$’000s US$’000s US$’000s
Within one year 3,636 3,105 37,386 36,641
Later than one year but not more than five
years 7,525 7,152 9,344 8,728
Total minimum lease payments 11,161 10,257 46,730 45,369
Less: amounts representing interest
income (904) - (1,361) -
Present value of minimum lease
payments 10,257 10,257 45,369 45,369
12 ASSETS HELD FOR SALE AND LIABILITIES ASSOCIATED WITH ASSETS HELD
FOR SALE
As at 31 December 2017, the Group’s aircraft which met the criteria to be classified as assets held for sale and the associated liabilities were as follows:
31 Dec
2017
30 Jun
2017
US$’000s US$’000s
Assets held for sale:
Property, plant and equipment - aircraft
At 1 July 2017/ 1 July 2016 - -
Additions 38,372 -
At 31 Dec/30 June 38,372 -
Liabilities associated with assets held
for sale:
Deposits collected 500 -

13 PROPERTY, PLANT AND EQUIPMENT
Furniture
and
equipment
Jet
aircraft
Turbo-prop
aircraft Total
US$’000s US$’000s US$’000s US$’000s
31 December 2017:
Cost or valuation:
At 1 July 2017 432 476,170 336,594 813,196
Additions 7 247,498 38,797 286,302
Reclassified as assets held for sale - (53,379) - (53,379)
At 31 December 2017 439 670,289 375,391 1,046,119
Representing:
At cost 439 - - 439
At valuation - 670,289 375,391 1,045,680
439 670,289 375,391 1,046,119
Accumulated depreciation:
At 1 July 2017 325 25,088 43,052 68,465
Depreciation expense 59 8,813 5,683 14,555
Impairment loss - 8,019 - 8,019
Reclassified as assets held for sale - (15,007) - (15,007)
At 31 December 2017 384 26,913 48,735 76,032
Net book value:
At 1 July 2017 107 451,082 293,542 744,731
At 31 December 2017 55 643,376 326,656 970,087

13 PROPERTY, PLANT AND EQUIPMENT (continued)
Furniture
and
equipment
Jet
aircraft
Turbo-prop
aircraft Total
US$’000s US$’000s US$’000s US$’000s
30 June 2017:
Cost or valuation:
At 1 July 2016 388 382,565 435,215 818,168
Additions 47 256,791 18,827 275,665
Disposals/written-off (3) (126,916) (117,448) (244,367)
Reclassified as held under finance lease - (32,383) - (32,383)
Impairment recognised in equity - (3,887) - (3,887)
At 30 June 2017 432 476,170 336,594 813,196
Representing:
At cost 432 - - 432
At valuation - 476,170 336,594 812,764
432 476,170 336,594 813,196
Accumulated depreciation and impairment:
At 1 July 2016 206 55,845 37,135 93,186
Depreciation expense 122 17,008 15,170 32,300
Disposals/written-off (3) (27,609) (9,253) (36,865)
Reclassified as held under finance lease - (20,156) - (20,156)
At 30 June 2017 325 25,088 43,052 68,465
Net book value:
At 1 July 2016 182 326,720 398,080 724,982
At 30 June 2017 107 451,082 293,542 744,731
Additions and Disposals During the six months ended 31 December 2017, the Group acquired 2 Jet aircraft and 2 Turbo-prop aircraft. Aircraft with a net book value of US$38.37 million were reclassified to assets held for sale.
Valuation The Group’s aircraft were valued in June 2017 by independent valuers on lease-encumbered
basis (“LEV’). LEV takes into account the current lease arrangements for the aircraft and estimated residual values at the end of the lease. These amounts have been discounted to present value using discount rates of 6.5% per annum for Jet aircraft and 8.1% per annum for Turbo-prop aircraft. Different discount rates are considered appropriate for different aircraft
based on their respective risk profiles.
During the six months ended 31 December 2017, an impairment loss of US$8.0 million was recognised to write down the book value of an aircraft. The aircraft was repossessed from an insolvent airline and leased to a new customer under a new lease with different terms and duration.
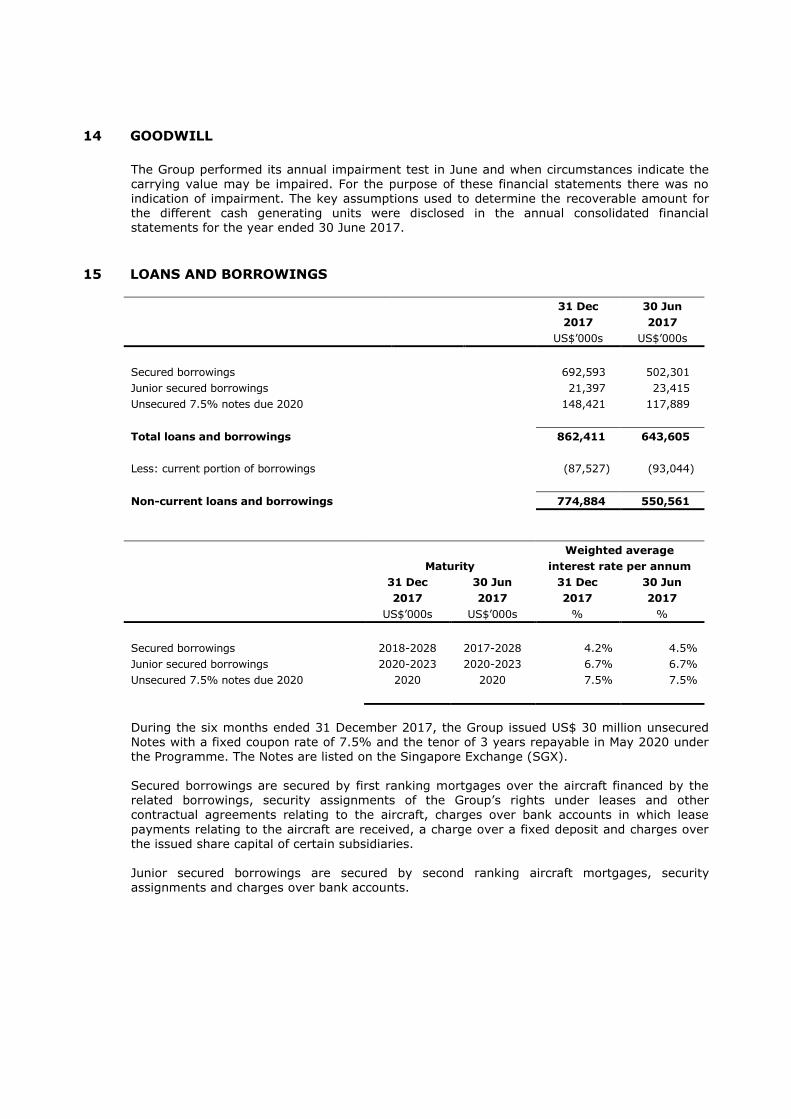
14 GOODWILL
The Group performed its annual impairment test in June and when circumstances indicate the carrying value may be impaired. For the purpose of these financial statements there was no indication of impairment. The key assumptions used to determine the recoverable amount for the different cash generating units were disclosed in the annual consolidated financial statements for the year ended 30 June 2017.
15 LOANS AND BORROWINGS
31 Dec
2017
30 Jun
2017
US$’000s US$’000s
Secured borrowings 692,593 502,301
Junior secured borrowings 21,397 23,415
Unsecured 7.5% notes due 2020 148,421 117,889
Total loans and borrowings 862,411 643,605
Less: current portion of borrowings (87,527) (93,044)
Non-current loans and borrowings 774,884 550,561
Maturity
Weighted average
interest rate per annum
31 Dec
2017
30 Jun
2017
31 Dec
2017
30 Jun
2017
US$’000s US$’000s % %
Secured borrowings 2018-2028 2017-2028 4.2% 4.5%
Junior secured borrowings 2020-2023 2020-2023 6.7% 6.7%
Unsecured 7.5% notes due 2020 2020 2020 7.5% 7.5%
During the six months ended 31 December 2017, the Group issued US$ 30 million unsecured Notes with a fixed coupon rate of 7.5% and the tenor of 3 years repayable in May 2020 under the Programme. The Notes are listed on the Singapore Exchange (SGX). Secured borrowings are secured by first ranking mortgages over the aircraft financed by the related borrowings, security assignments of the Group’s rights under leases and other contractual agreements relating to the aircraft, charges over bank accounts in which lease
payments relating to the aircraft are received, a charge over a fixed deposit and charges over the issued share capital of certain subsidiaries.
Junior secured borrowings are secured by second ranking aircraft mortgages, security assignments and charges over bank accounts.
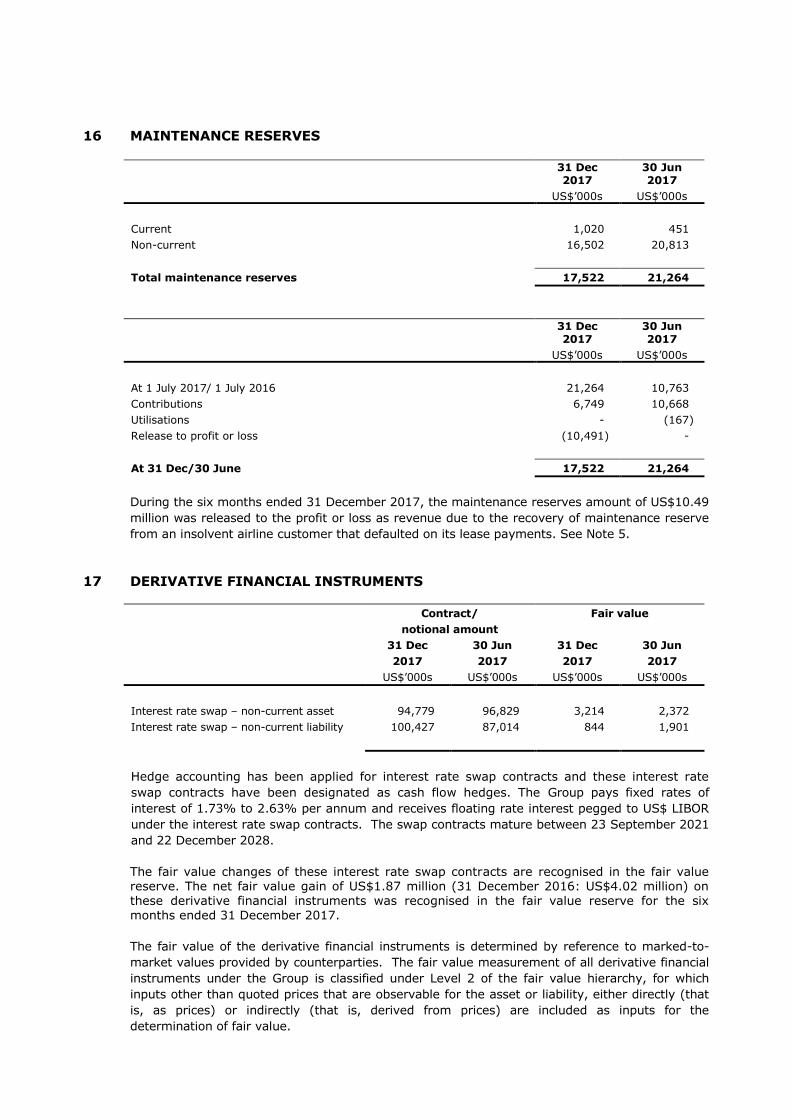
16 MAINTENANCE RESERVES
31 Dec 2017
30 Jun 2017
US$’000s US$’000s
Current 1,020 451
Non-current 16,502 20,813
Total maintenance reserves 17,522 21,264
31 Dec 2017
30 Jun 2017
US$’000s US$’000s
At 1 July 2017/ 1 July 2016 21,264 10,763
Contributions 6,749 10,668
Utilisations - (167)
Release to profit or loss (10,491) -
At 31 Dec/30 June 17,522 21,264
During the six months ended 31 December 2017, the maintenance reserves amount of US$10.49
million was released to the profit or loss as revenue due to the recovery of maintenance reserve
from an insolvent airline customer that defaulted on its lease payments. See Note 5.
17 DERIVATIVE FINANCIAL INSTRUMENTS
Contract/
notional amount
Fair value
31 Dec
2017
30 Jun
2017
31 Dec
2017
30 Jun
2017
US$’000s US$’000s US$’000s US$’000s
Interest rate swap – non-current asset 94,779 96,829 3,214 2,372
Interest rate swap – non-current liability 100,427 87,014 844 1,901
Hedge accounting has been applied for interest rate swap contracts and these interest rate
swap contracts have been designated as cash flow hedges. The Group pays fixed rates of
interest of 1.73% to 2.63% per annum and receives floating rate interest pegged to US$ LIBOR
under the interest rate swap contracts. The swap contracts mature between 23 September 2021
and 22 December 2028.
The fair value changes of these interest rate swap contracts are recognised in the fair value reserve. The net fair value gain of US$1.87 million (31 December 2016: US$4.02 million) on these derivative financial instruments was recognised in the fair value reserve for the six months ended 31 December 2017.
The fair value of the derivative financial instruments is determined by reference to marked-to-
market values provided by counterparties. The fair value measurement of all derivative financial
instruments under the Group is classified under Level 2 of the fair value hierarchy, for which
inputs other than quoted prices that are observable for the asset or liability, either directly (that
is, as prices) or indirectly (that is, derived from prices) are included as inputs for the
determination of fair value.

18 SHARE CAPITAL AND TREASURY SHARES
(a) Share capital
31 Dec 2017 30 Jun 2017
No of shares US$’000s No of shares US$’000s
Allotted, called up and fully paid
Ordinary shares of 1 penny each:
At 1 July 2017/ 1 July 2016 61,071,246 1,058 55,785,227 993
Issue of shares 1,306,000 17 5,286,019 65
At 31 Dec/30 June 62,377,246 1,075 61,071,246 1,058
During the six months period ended 31 December 2017, the Company issued 1,306,000
ordinary shares of 1 penny each at prices ranging from 130p to 153p following the exercise of warrants by warrant holders raising total gross proceeds of US$2.55m.
The holders of ordinary shares (except for treasury shares) are entitled to receive dividends as and when declared by the Company. All ordinary shares carry one vote per share without restrictions.
(b) Treasury shares
31 Dec 2017 30 Jun 2017
No of
treasury
shares US$’000s
No of
treasury
shares US$’000s
At 1 July 2017/1 July 2016 - - 600 1
Re-issued during the financial
period - - (600) (1)
At 31 Dec/30 June - - - -
19 CAPITAL COMMITMENTS Capital expenditure contracted for at the reporting date but not recognised in the financial
statements is as follows:
31 Dec
2017
30 Jun
2017
US$’000s US$’000s
Property, plant and equipment 115,013 147,890
Capital commitments represent amounts due under contracts entered into by the group to purchase aircraft. The company has paid deposits towards the cost of these aircraft which are included in trade and other receivables.
As at 31 December 2017, the Group has commitments to purchase six ATR 72-600 aircraft from the manufacturer with expected delivery dates over a 1.5 year period ending in June 2019.

20 SEGMENT INFORMATION (continued)
Management has determined the operating segments based on reports reviewed by the Executive Chairman (“Chief Operating Decision Maker” or “CODM”) that are used to make
strategic decisions. The CODM considers the business from a business segment perspective. Management manages and monitors the business in 2 primary business areas: aircraft leasing and aircraft parts procurement.
(a) Segment reporting policy
A segment is a distinguishable component of the Group within a particular economic environment (geographical segment) and to a particular industry (business segment) which is subject to risks and rewards that are different from those of other segments.
Business segments are based on the Group’s management and internal reporting
structure. In presenting information on the basis of business segments, segment revenue and segment assets are based on the nature of the products or services provided by the Group while information for geographical segments is based on the geographical areas where customers are located. Inter-segment pricing is determined on an arm’s length basis. Segment results, assets and liabilities include items directly attributable to a segment as well as those that can be
allocated on a reasonable basis. Unallocated items are mostly comprised of corporate assets and liabilities or profit or losses items that are not directly attributable to a segment or those that cannot be allocated on a reasonable basis. Common expenses were allocated based on revenue. Segment capital expenditure is the total cost incurred during the period to acquire segment
assets that are expected to be used for more than one year.
(b) Business segments
During the six months ended 31 December 2017, the Group was organised into two main business segments which are aircraft leasing and aircraft parts procurement. Other Group operations mainly comprise investment holding which does not constitute a
separate reportable segment. There are no inter-segment transactions recorded during the financial period. The aircraft parts procurement segment does not meet the quantitative thresholds and is not separately disclosed. Consequently, the aircraft leasing segment is not disclosed as the financial statements substantially represent the results of this segment.
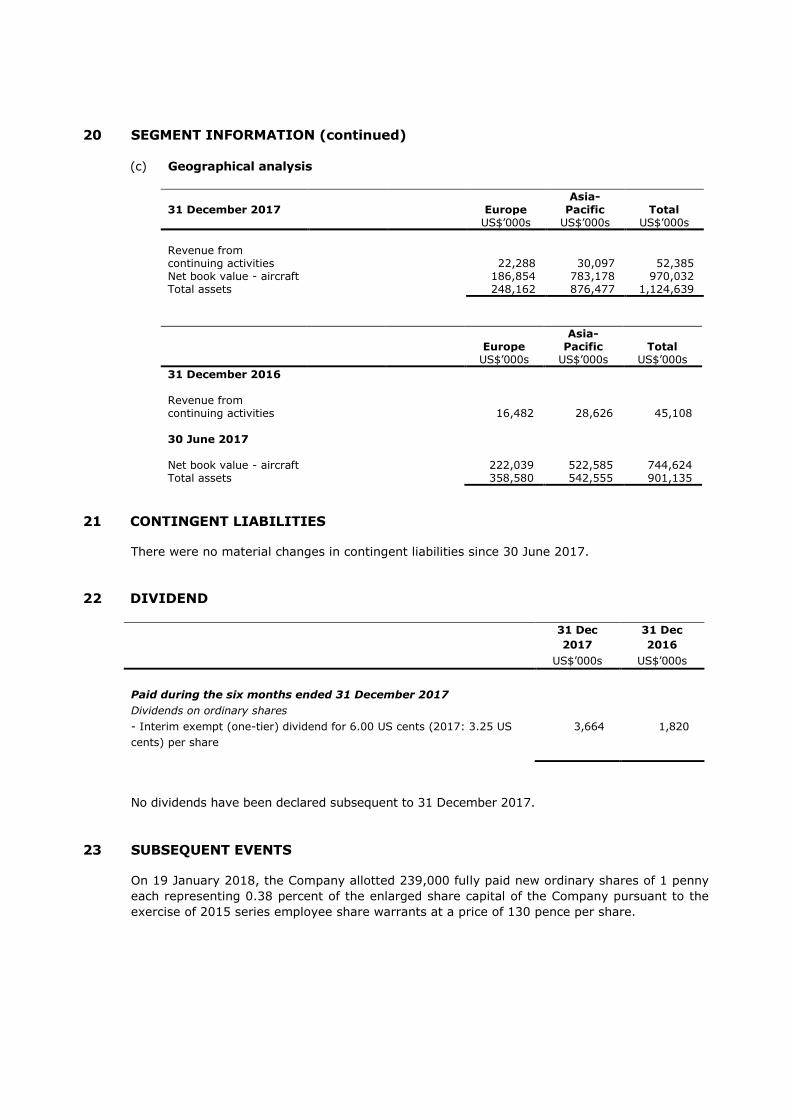
20 SEGMENT INFORMATION (continued)
(c) Geographical analysis
31 December 2017 Europe
Asia-
Pacific Total US$’000s US$’000s US$’000s
Revenue from continuing activities 22,288 30,097 52,385 Net book value - aircraft 186,854 783,178 970,032 Total assets 248,162 876,477 1,124,639
Europe Asia-
Pacific Total US$’000s US$’000s US$’000s
31 December 2016 Revenue from continuing activities 16,482 28,626 45,108
30 June 2017 Net book value - aircraft 222,039 522,585 744,624 Total assets 358,580 542,555 901,135
21 CONTINGENT LIABILITIES There were no material changes in contingent liabilities since 30 June 2017.
22 DIVIDEND
31 Dec
2017
31 Dec
2016
US$’000s US$’000s
Paid during the six months ended 31 December 2017
Dividends on ordinary shares
- Interim exempt (one-tier) dividend for 6.00 US cents (2017: 3.25 US
cents) per share
3,664 1,820
No dividends have been declared subsequent to 31 December 2017.
23 SUBSEQUENT EVENTS
On 19 January 2018, the Company allotted 239,000 fully paid new ordinary shares of 1 penny
each representing 0.38 percent of the enlarged share capital of the Company pursuant to the
exercise of 2015 series employee share warrants at a price of 130 pence per share.
PRINCIPAL RISKS
The Group’s risk management processes bring greater judgement to decision making as they allow management to make better, more informed and more consistent decisions based on a clear understanding of risk involved. We regularly review the risk assessment and monitoring process as part of our commitment to continually improve the quality of decision-making across the Group. The principal risks and uncertainties which may affect the Group in the second half of the financial year will include the typical risks associated with the aviation business, including but not limited to any
downturn in the global aviation industry, fuel costs, finance costs, war and terrorism and the like which may affect our airline customers’ ability to fulfil their lease obligations. The business also relies on its ability to source finance on favourable terms. Should this supply of finance contract, it would limit our fleet expansion and therefore growth.
GOING CONCERN After making enquiries, the directors have a reasonable expectation that the Group has adequate resources to continue in operational existence for the foreseeable future. For this reason they continue to adopt the going concern basis in preparing the financial statements. The financial risk management
objectives and policies of the Group and the exposure of the Group to credit risk and liquidity risk are discussed in the annual report for the Group for the year ended 30 June 2017.
DIRECTORS
The directors of Avation PLC are listed in its Annual Report for the year ended 30 June 2017. A list of the current directors is maintained on the Avation PLC website: www.avation.net
STATEMENT OF DIRECTORS' RESPONSIBILITIES
The Directors confirm that, to the best of their knowledge, this condensed consolidated interim financial information have been prepared in accordance with IAS 34 as adopted by the European Union and that the interim management report herein includes a fair review of the information required by DTR 4.2.7 and DTR 4.2.8 namely an indication of important events that have occurred during the first six months and their
impact on the Interim Report, and a description required by the principal risks and uncertainties for the remaining six months of the financial year; and
material related party transactions in the first six months and any material changes in the
related party transactions described in the last annual report.
By order of the Board
Jeff Chatfield Executive Chairman Singapore, 26 February 2018