Embed Size (px)
Citation preview

FY2019 1st Half
Financial Results
(2018/4-9)

Powerpoint presentation briefing / J© DENSO COPORATION All Rights Reserved.

Powerpoint presentation briefing / J© DENSO COPORATION All Rights Reserved.
Overview of FY2019 1st Half Financial Results
1. Despite natural disasters, revenue increased due to the increase
in global car production and the subsidiaries DENSO TEN
which was consolidated on the last November.
Operating profit decreased due to transient profit in the last fiscal
year, variance of periods in collecting expenses and increase
in investment for future growth.
2. Upward revision to full-year forecast considering the first-half financial results and the latest movement in the foreign exchange markets.
3. Annual dividend payment will be 140 yen, a 5 yen increase from the previous forecast on each of interim and fiscal year-end payment.

Powerpoint presentation briefing / J© DENSO COPORATION All Rights Reserved.
※1 Finance income,Finance costs, Foreign exchange gains/loss, Share of the profit of
associates accounted for using the equity method
※2 Profit attributable to owners of the parent company
FY2019 1st Half Financial Results(2018/4-9)
(Ratio to Revenue) (Unit:Billions of Yen, %)
2,625.0 2,363.5 +261.5 +11.1%
(5.8%) 152.4 (8.7%) 204.4 -52.1 -25.5%
17.8 22.3 -4.5
(6.5%) 170.2 (9.6%) 226.8 -56.6 -24.9%
(4.3%) 114.1 (6.5%) 154.2 -40.1 -26.0%
(Unit:Millions of Units)
Foreign Exchange
RateJPY 110/$ JPY 111/$ -1 JPY
JPY 130/Euro JPY 126/Euro +4 JPY
Domestic Car
Production4.47 4.54 -0.07 -1.5%
Overseas Car Production
of Japanese
Manufacturers
10.23 9.89 +0.35 +3.5%
(North America) (2.90) (3.01) (-0.11) (-3.7%)
FY19 2Q FY18 2Q Change
RevenueOperating Profit
Finance income/
costs & others(*1)
Profit before
Income Taxes
Profit (*2)
Pre
cond
ition
2017/4-9 2018/4-9

Powerpoint presentation briefing / J© DENSO COPORATION All Rights Reserved.
DENSO TEN : 166.6 (113.0 for Toyota included)
(-5.4%)
Hyundai・Kia
Ford
FCA
GM
Honda
Mazda
Suzuki
Nissan SUBARU
VW・AUDI
(+10.9%)
(+23.5%)
(+10.8%)
(-4.0%)
(+5.0%)
(+11.7%)
(+7.3%)
(+6.6%)
(+0.8%)
(+11.2%)
[+10.4%]
[+7.9%]
[+11.4%] [+7.0%]
[+7.5%]
[+6.2%]
[-5.6%]
[-5.0%]
[+24.0%]
[+2.6%]
[+11.5%]
(+8.3%) [+8.3%]
( ):Change from 17/4-9 [ ]:Change from 17/4-9 excludes FX difference (Unit: Billions of Yen)
OEM Revenue for others
(+17.2%) (+11.6%) Isuzu
Volvo [+14.3%]
[+10.2%]
Others
*exlcudes DENSO TEN
*exlcudes DENSO TEN [+5.0%] (+4.4%)
[+3.0%] (+2.6%)
FY2019 1st Half Consolidated Revenue ( By Customer)
17/4-9 18/4-9

Powerpoint presentation briefing / J© DENSO COPORATION All Rights Reserved.
DENSO TEN : 166.6(Mobility Systems 123.6, Others, etc. 43.0)
Powertrain Systems
[+4.7%] (+5.0%)
Thermal Systems [+0.7%] (-0.2%)
Electrification Systems
[+3.0%] (+3.1%)
Mobility Systems
[+49.6%] (+50.1%)
( ):Change from 17/4-9 [ ]:Change from 17/4-9 excludes FX difference
[+11.3%] (+11.1%)
Electronic Systems [+10.4%] (+9.9%)
(Unit: Billions of Yen)
[+72.0%] Other Automotive (+67.9%)
[+59.1%] (+58.0%)
Non-Automotive Business (FA and agriculture,etc.)
*exlcudes DENSO TEN [+4.3%] (+4.8%)
*exlcudes DENSO TEN [+4.6%] (+4.0%)
*exlcudes DENSO TEN [+1.4%] (-2.7%)
*exlcudes DENSO TEN and TDM [+12.1%] (+11. 4%)
FY2019 1st Half Consolidated Revenue ( By Product)
17/4-9 18/4-9

Powerpoint presentation briefing / J© DENSO COPORATION All Rights Reserved.
Opera
ting p
rofit
Oth
er in
com
e
/expense
s
18/4-9 17/4-9
(Unit: Billion of Yen)
204.4 -12.0
-8.0
-33.5
+27.0 -15.1
+17.0 +0.5
152.4 -9.0
Change in FY2019 1st Half Operating Profit
-19.0
Depre
cia
tion
Expense
Labor c
ost
Raw
mate
rial c
ost
Oth
ers
(Pro
duct M
ix e
tc.)
Pro
ductio
n v
olu
me
incre
ase
Varia
ble
cost re
ductio
n
Curre
ncy e
xchange g
ain
Opera
ting p
rofit
※1 -13.0 in Others is from the variance of periods in recording expense/profit and will decrease by the end of this fiscal year. -12.0 is from the transient profit in the last fiscal year.
※2 -12.0 in Other income/expense is from the gain on revaluation of TD mobile securities which was consolidated in the last fiscal year.
※1
※2

Powerpoint presentation briefing / J© DENSO COPORATION All Rights Reserved.
Revenue Operating Profit
(Unit: Billions of Yen)
[ ]: Ratio to Revenue
1st Half Geographical Segments by Company Location (Local Currency Base)
17/4-9
18/4-9
17/4-9
18/4-9

Powerpoint presentation briefing / J© DENSO COPORATION All Rights Reserved.
(Unit:Billions of Yen, %) (Ratio to Revenue) (Unit:Billions of Yen, %)
Amount Ratio Amount Ratio
(7.2%) 390.0 (7.3%) 393.0 +3.0 +0.8% (8.1%) 412.7 -19.7 -4.8%
37.0 37.0 0.0 37.2 -0.2
(5.6%) 303.0 (5.6%) 305.0 +2.0 +0.7% (6.3%) 320.6 -15.6 -4.9%
(Unit:Millions of Units)
JPY 106/$ JPY 110/$ +4 JPY JPY 111/$ -1 JPY
JPY 130/Euro JPY 130/Euro - JPY 130/Euro +0 JPY
Domestic Car Production 9.58 9.57 -0.01 -0.1% 9.37 +0.20 +2.1%Overseas Car Production of
Japanese Manufacturers 20.95 20.69 -0.26 -1.2% 20.15 +0.54 +2.7%
(North America) (5.94) (5.92) (-0.02) (-0.3%) (6.03) (-0.11) (-1.8%)
Change from March 2018
+291.7 +5.7%
-19.9 -4.4%
- 5,108.35,400.0 5,400.0 -
(7.9%) 427.0 (8.0%) 430.0 +3.0 +0.7% (8.8%) 449.9
Profit
Pre
cond
ition
Foreign Exchange
Rate
Profit before
Income Taxes
Operating Profit
Finance income/
costs & others(※1)
Revenue
June 2018
As of Change from June 2018 FY18 ActualFY19 Revised
FY2019 Financial Forecast
※1 Finance income,Finance costs, Foreign exchange gains/loss,
Share of the profit of associates accounted for using the equity method ※2 Profit attributable to owners of the parent company
18/3 Actual 19/3 Revised
(※2)

Powerpoint presentation briefing / J© DENSO COPORATION All Rights Reserved.
412.7
353.0
Opera
ting p
rofit
Oth
er
incom
e/e
xpense
s
+0.8
18/4-19/3 17/4-18/3
(Unit: Billion of Yen)
-29.0
-15.0 -18.0
+41.0 -2.5
+40.0
-11.0
-26.0
Change in FY2019 Operating Profit
326.4
Depre
cia
tion
Expense
Labor c
ost
Raw
mate
rial c
ost
Oth
ers
(Pro
duct M
ix e
tc.)
Pro
ductio
n v
olu
me
incre
ase
Varia
ble
cost re
ductio
n
Curre
ncy e
xchange lo
ss
393.0
Opera
ting p
rofit

Powerpoint presentation briefing / J© DENSO COPORATION All Rights Reserved.
■Policy of shareholders return DENSO intends to allocate retained earnings not only to the capital investment, R&D
investment and M&A required to maintain Long-term business development but also to,
1.We will continue to pay dividends sustainably with taking into
accounts our consolidated results, consolidated dividend payout
ratio, and dividend amount.
2.We continue to repurchase our own shares adapting flexibly to
environmental changes and considering finance status.
A resolution was adopted at the board of directors meeting held today, October 31st
to acquire own shares.
・Purpose of the stock purchase:
To increase returns to shareholders and improve capital efficiency.
・Total number of shares to be purchased:
Up to 6 million shares or 30 billion yen
・Resolution was adopted to cancel 6.12 million of its own shares.
Return to Shareholders

Powerpoint presentation briefing / J© DENSO COPORATION All Rights Reserved.
Return to Shareholders
FY19 Annual Dividend per Share: 140 yen
60 60 65 70
120 120
130 140
39.1% 36.8%
31.7% 35.8%
0%
20%
40%
60%
0
50
100
150
95.3 94.6 101.5
109.3
27.7 30.0 26.5
30.0
50.4% 48.4%
39.9% 45.7%
0%
20%
40%
60%
80%
100%
0.0
30.0
60.0
90.0
120.0
150.0
Cash Dividends per Share and Dividend Payout Ratio
Total Dividend Amount and Total Return Ratio
(%) (yen) (Billions of yen)
Amount of Treasury Stock Acquired
Total Dividend Amount Total Return Ratio full year first-half
Dividend Payout Ratio
(%)

Powerpoint presentation briefing / J© DENSO COPORATION All Rights Reserved.

Powerpoint presentation briefing / J© DENSO COPORATION All Rights Reserved.

Powerpoint presentation briefing / J© DENSO COPORATION All Rights Reserved.

Powerpoint presentation briefing / J© DENSO COPORATION All Rights Reserved.

Powerpoint presentation briefing / J© DENSO COPORATION All Rights Reserved.

Powerpoint presentation briefing / J© DENSO COPORATION All Rights Reserved.

Powerpoint presentation briefing / J© DENSO COPORATION All Rights Reserved.
Powerpoint presentation briefing / J© DENSO COPORATION All Rights Reserved.

Powerpoint presentation briefing / J© DENSO COPORATION All Rights Reserved.
Powerpoint presentation briefing / J© DENSO COPORATION All Rights Reserved.

Powerpoint presentation briefing / J© DENSO COPORATION All Rights Reserved.

Powerpoint presentation briefing / J© DENSO COPORATION All Rights Reserved. ::

Powerpoint presentation briefing / J© DENSO COPORATION All Rights Reserved.

Powerpoint presentation briefing / J© DENSO COPORATION All Rights Reserved.

Powerpoint presentation briefing / J© DENSO COPORATION All Rights Reserved.

Powerpoint presentation briefing / J© DENSO COPORATION All Rights Reserved.
開発棟テスト路

Powerpoint presentation briefing / J© DENSO COPORATION All Rights Reserved.
••
••
•••
••
•
••••
••
•

Powerpoint presentation briefing / J© DENSO COPORATION All Rights Reserved.
Appendix
・ Pre-Conditions (Foreign Exchange Rate/Car Production)
・ Consolidated Revenue by Customer
・ Consolidated Revenue by Product
・ 1st Half Geographical Segments by Company Location
・ Trend of Capital Expenditures, Depreciation and R&D
Expenditures
・ Capital Expenditures, Depreciation, and R&D Expenditures
Powerpoint presentation briefing / J© DENSO COPORATION All Rights Reserved.
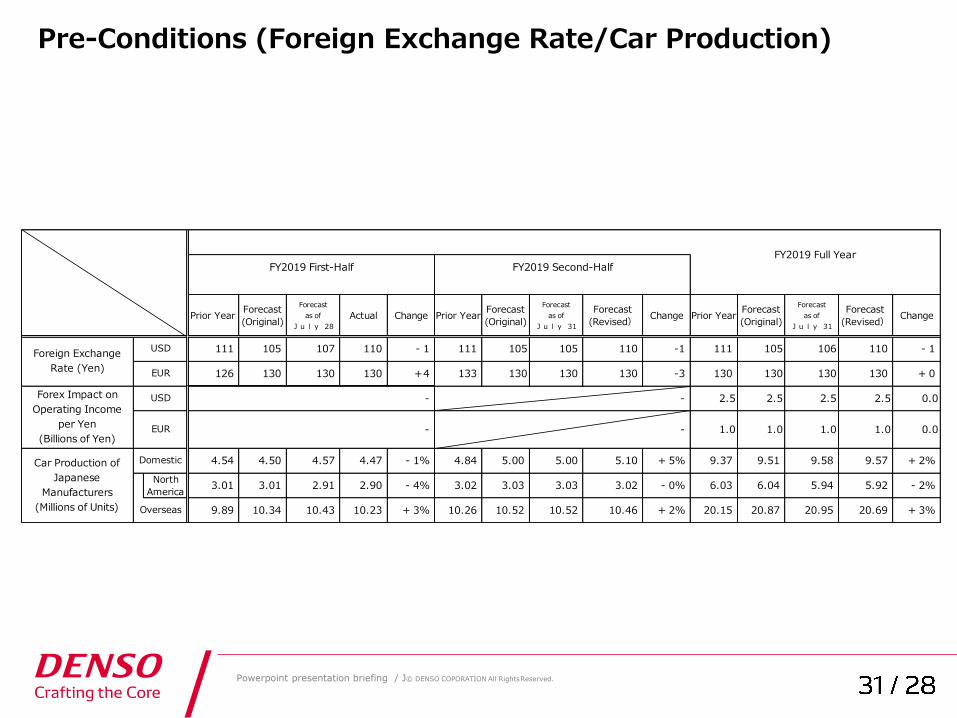
Pre-Conditions (Foreign Exchange Rate/Car Production)
Prior YearForecast
(Original)
Forecast
as of
July 28
Actual Change Prior YearForecast
(Original)
Forecast
as of
July 31
Forecast
(Revised)Change Prior Year
Forecast
(Original)
Forecast
as of
July 31
Forecast
(Revised)Change
111 105 107 110 - 1 111 105 105 110 -1 111 105 106 110 - 1
126 130 130 130 +4 133 130 130 130 -3 130 130 130 130 + 0
2.5 2.5 2.5 2.5 0.0
1.0 1.0 1.0 1.0 0.0
4.54 4.50 4.57 4.47 - 1% 4.84 5.00 5.00 5.10 + 5% 9.37 9.51 9.58 9.57 + 2%
North
America3.01 3.01 2.91 2.90 - 4% 3.02 3.03 3.03 3.02 - 0% 6.03 6.04 5.94 5.92 - 2%
9.89 10.34 10.43 10.23 + 3% 10.26 10.52 10.52 10.46 + 2% 20.15 20.87 20.95 20.69 + 3%
FY2019 Second-HalfFY2019 First-HalfFY2019 Full Year
Foreign Exchange
Rate (Yen)
USD
EUR
Forex Impact on
Operating Income
per Yen
(Billions of Yen)
USD
EUR
-
-
-
-
Car Production of
Japanese
Manufacturers
(Millions of Units)
Domestic
Overseas

Powerpoint presentation briefing / J© DENSO COPORATION All Rights Reserved.
Consolidated Revenue (By Customer) (Unit: Billions of Yen)
Amount % to Total Amount % to Total Amount % %
Toyota 1,103.6 42.0 967.3 40.9 136.3 14.1 14.6
Daihatsu 59.3 2.3 53.0 2.2 6.3 11.9 13.7
Hino 32.3 1.2 28.1 1.2 4.2 15.0 15.0
Toyota Group 1,195.2 45.5 1,048.4 44.3 146.7 14.0 14.5
Honda 199.2 7.7 179.6 7.6 19.5 10.9 11.5
FCA 114.7 4.4 113.8 4.8 0.9 0.8 2.6
GM 109.3 4.2 88.5 3.8 20.8 23.5 24.0
Ford 69.4 2.6 73.4 3.1 -3.9 -5.4 -5.0
Hyundai/Kia 64.4 2.5 67.1 2.8 -2.7 -4.0 -5.6
Mazda 59.0 2.2 55.4 2.4 3.6 6.6 6.2
Suzuki 58.5 2.2 55.8 2.4 2.8 5.0 7.5
SUBARU 52.8 2.0 47.5 2.0 5.3 11.2 11.4
Nissan 50.2 1.9 46.8 2.0 3.4 7.3 7.0
VW/AUDI 42.5 1.6 38.4 1.6 4.1 10.8 7.9
Mitsubishi 30.6 1.2 24.2 1.0 6.4 26.7 25.8
Isuzu 30.0 1.1 26.9 1.1 3.1 11.6 10.2
BMW 21.9 0.8 20.5 0.9 1.3 6.4 4.0
Volvo 20.7 0.8 17.7 0.8 3.0 17.2 14.3
PSA 16.3 0.6 14.4 0.6 1.9 13.2 9.7
Benz 15.6 0.6 17.5 0.7 -1.9 -10.7 -12.9
OE Sales for others 175.6 6.7 156.3 6.6 19.3 12.4 11.6
OEM Total 2,325.8 88.6 2,092.0 88.5 233.9 11.2 11.4
After-market,
Non-Automotive
Business(*)
299.1 11.4 271.5 11.5 27.6 10.2 10.9
Total 2,625.0 100.0 2,363.5 100.0 261.5 11.1 11.3
* Sales of industrial systems and consumer products, Sales for After Market, and Sales of property/equipment are included.
FY18 2Q
Change
excludes
FX
difference
ChangeFY19 2Q18/4-9 17/4-9

Powerpoint presentation briefing / J© DENSO COPORATION All Rights Reserved.
Consolidated Revenue (By Product)
(Unit: Billions of Yen,%)
Amount % to Total Amount % to Total Amount % %
Thermal Systems 709.8 27.0 711.1 30.1 -1.3 -0.2 0.7
Powertrain Systems 634.7 24.2 604.3 25.5 30.5 5.0 4.7
Electrification Systems 401.7 15.3 389.7 16.5 12.0 3.1 3.0Mobility Systems 409.6 15.6 273.0 11.5 136.7 50.1 49.6
Electronic Systems 326.2 12.5 296.9 12.6 29.3 9.9 10.4Others(*) 50.5 1.9 30.1 1.3 20.4 67.9 72.0
Automotive Total 2,532.5 96.5 2,305.0 97.5 227.6 9.9 10.1
Non-Automotive
Business(FA and
agriculture, etc.)
Total
92.4 3.5 58.5 2.5 34.0 58.0 59.1
Total 2,625.0 100.0 2,363.5 100.0 261.5 11.1 11.3
* Revenue of equipment,Repair parts, original brand products of subsidiaries
Change
excludes
FX
difference
ChangeFY19 2Q FY18 2Q18/4-9 17/4-9

Powerpoint presentation briefing / J© DENSO COPORATION All Rights Reserved.
Revenue Operating Profit
(Unit: Billions of Yen)
[ ]: Ratio to Revenue
1st Half Geographical Segments by Company Location
17/4-9
18/4-9
17/4-9
18/4-9

Powerpoint presentation briefing / J© DENSO COPORATION All Rights Reserved.
Trend of Capital Expenditures, Depreciation and R&D Expenditures
CAPEX Depreciation R&D
168.1 163.6 166.5 158.4 193.3
105.7 117.4 116.4 130.3 141.9 194.0 200.1 199.4 201.4
245.1
354.2 334.1
337.4
347.2 400.0
220.1 236.8 241.1
268.6 295.0
396.4 399.3
409.2 447.4
500.0
0
100
200
300
400
500
(8.8%) (8.8%) (9.2%) (9.3%)
<48.3%>
<48.1%>
<49.0%>
(9.0%)
↓18/4-9
↑18/10-19/3
15/3 16/3 17/3 18/3 19/3F 15/3 16/3 17/3 18/3 19/3F 15/3 16/3 17/3 18/3 19/3F
[Bil.Yen] ( )Ratio to Revenue
< >Ratio to 19/3F

Powerpoint presentation briefing / J© DENSO COPORATION All Rights Reserved.
Capital Expenditures, Depreciation and R&D Expenditures
(Unit: Billions of Yen)
2Q 2Q
Japan 106.3 217.7 116.9 240.0 10.0% 48.7%
North America 16.2 43.8 32.0 62.5 97.5% 51.2%
Europe 13.8 30.8 11.4 32.0 -17.4% 35.6%
Asia 21.3 52.7 31.7 63.0 48.8% 50.3%
Others 0.8 2.2 1.3 2.5 62.5% 52.0%
Capital Exp. 158.4 347.2 193.3 400.0 22.0% 48.3%
Japan 75.2 154.7 82.6 172.5 9.8% 47.9%
North America 15.9 32.4 18.1 35.5 13.8% 51.0%
Europe 10.4 22.2 11.8 26.0 13.5% 45.4%
Asia 27.4 56.4 28.3 58.5 3.3% 48.4%
Others 1.5 2.8 1.0 2.5 -33.3% 40.0%
Depreciation 130.3 268.6 141.9 295.0 8.9% 48.1%
201.4 447.4 245.1 500.0
(8.5%) (8.8%) (9.3%) (9.3%)
FY19
Forecast
R&D Expenditure
(Ratio to Revenue)21.7%
Progress
to FY19
Forecast
49.0%
FY18
2Q YTD
Change
from PY17/918/3
18/919/3F Change(%)
Progress
to 19/3
Forecast