Embed Size (px)
Citation preview
Financial Reports
thru the Month of January Fiscal Year 2019
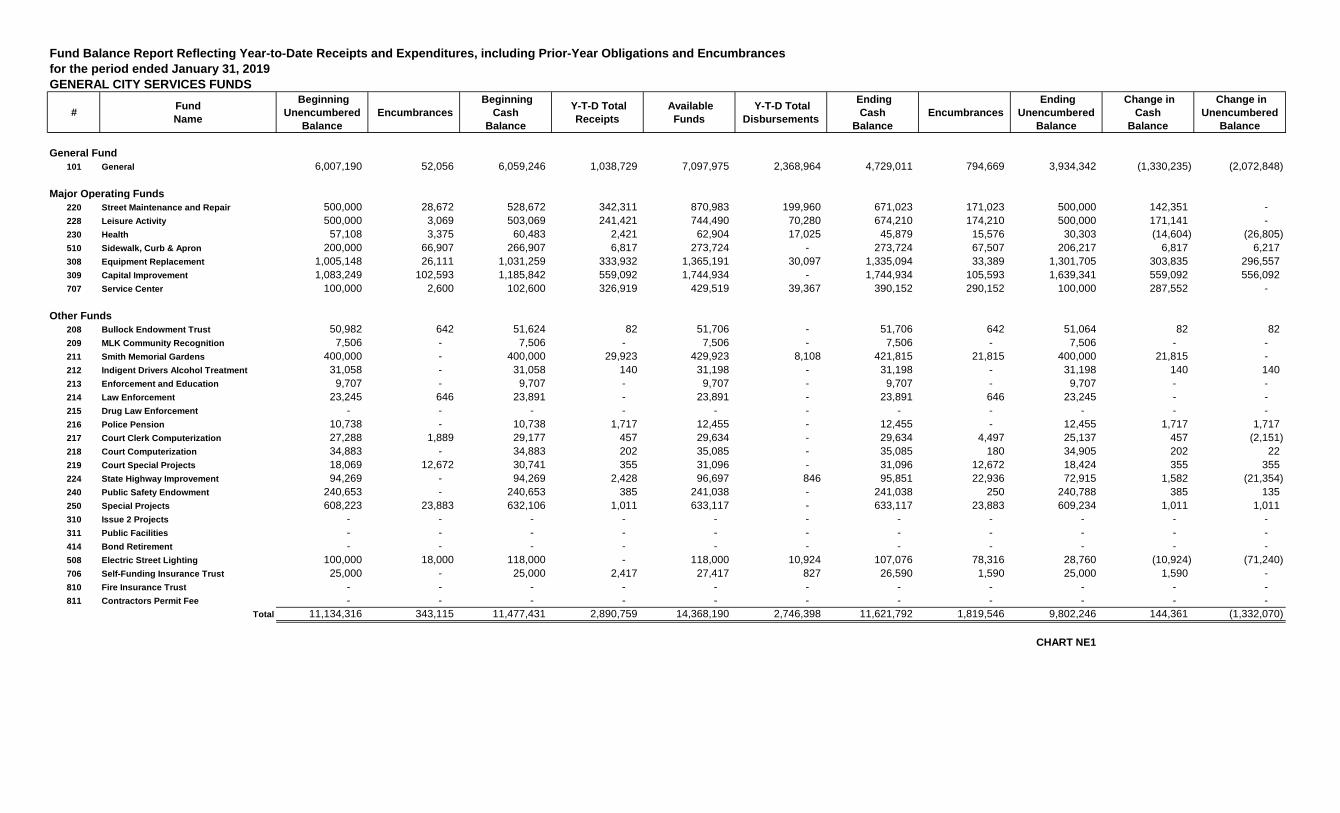
Fund Balance Report Reflecting Year-to-Date Receipts and Expenditures, including Prior-Year Obligations and Encumbrancesfor the period ended January 31, 2019GENERAL CITY SERVICES FUNDS
# FundName
Beginning Unencumbered
Balance Encumbrances
BeginningCash
Balance
Y-T-D TotalReceipts
AvailableFunds
Y-T-D TotalDisbursements
EndingCash
Balance Encumbrances
EndingUnencumbered
Balance
Change inCash
Balance
Change inUnencumbered
Balance
General Fund101 General 6,007,190 52,056 6,059,246 1,038,729 7,097,975 2,368,964 4,729,011 794,669 3,934,342 (1,330,235) (2,072,848)
Major Operating Funds220 Street Maintenance and Repair 500,000 28,672 528,672 342,311 870,983 199,960 671,023 171,023 500,000 142,351 - 228 Leisure Activity 500,000 3,069 503,069 241,421 744,490 70,280 674,210 174,210 500,000 171,141 - 230 Health 57,108 3,375 60,483 2,421 62,904 17,025 45,879 15,576 30,303 (14,604) (26,805) 510 Sidewalk, Curb & Apron 200,000 66,907 266,907 6,817 273,724 - 273,724 67,507 206,217 6,817 6,217 308 Equipment Replacement 1,005,148 26,111 1,031,259 333,932 1,365,191 30,097 1,335,094 33,389 1,301,705 303,835 296,557 309 Capital Improvement 1,083,249 102,593 1,185,842 559,092 1,744,934 - 1,744,934 105,593 1,639,341 559,092 556,092 707 Service Center 100,000 2,600 102,600 326,919 429,519 39,367 390,152 290,152 100,000 287,552 -
Other Funds208 Bullock Endowment Trust 50,982 642 51,624 82 51,706 - 51,706 642 51,064 82 82 209 MLK Community Recognition 7,506 - 7,506 - 7,506 - 7,506 - 7,506 - - 211 Smith Memorial Gardens 400,000 - 400,000 29,923 429,923 8,108 421,815 21,815 400,000 21,815 - 212 Indigent Drivers Alcohol Treatment 31,058 - 31,058 140 31,198 - 31,198 - 31,198 140 140 213 Enforcement and Education 9,707 - 9,707 - 9,707 - 9,707 - 9,707 - - 214 Law Enforcement 23,245 646 23,891 - 23,891 - 23,891 646 23,245 - - 215 Drug Law Enforcement - - - - - - - - - - - 216 Police Pension 10,738 - 10,738 1,717 12,455 - 12,455 - 12,455 1,717 1,717 217 Court Clerk Computerization 27,288 1,889 29,177 457 29,634 - 29,634 4,497 25,137 457 (2,151) 218 Court Computerization 34,883 - 34,883 202 35,085 - 35,085 180 34,905 202 22 219 Court Special Projects 18,069 12,672 30,741 355 31,096 - 31,096 12,672 18,424 355 355 224 State Highway Improvement 94,269 - 94,269 2,428 96,697 846 95,851 22,936 72,915 1,582 (21,354) 240 Public Safety Endowment 240,653 - 240,653 385 241,038 - 241,038 250 240,788 385 135 250 Special Projects 608,223 23,883 632,106 1,011 633,117 - 633,117 23,883 609,234 1,011 1,011 310 Issue 2 Projects - - - - - - - - - - - 311 Public Facilities - - - - - - - - - - - 414 Bond Retirement - - - - - - - - - - - 508 Electric Street Lighting 100,000 18,000 118,000 - 118,000 10,924 107,076 78,316 28,760 (10,924) (71,240) 706 Self-Funding Insurance Trust 25,000 - 25,000 2,417 27,417 827 26,590 1,590 25,000 1,590 - 810 Fire Insurance Trust - - - - - - - - - - - 811 Contractors Permit Fee - - - - - - - - - - -
Total 11,134,316 343,115 11,477,431 2,890,759 14,368,190 2,746,398 11,621,792 1,819,546 9,802,246 144,361 (1,332,070)
CHART NE1
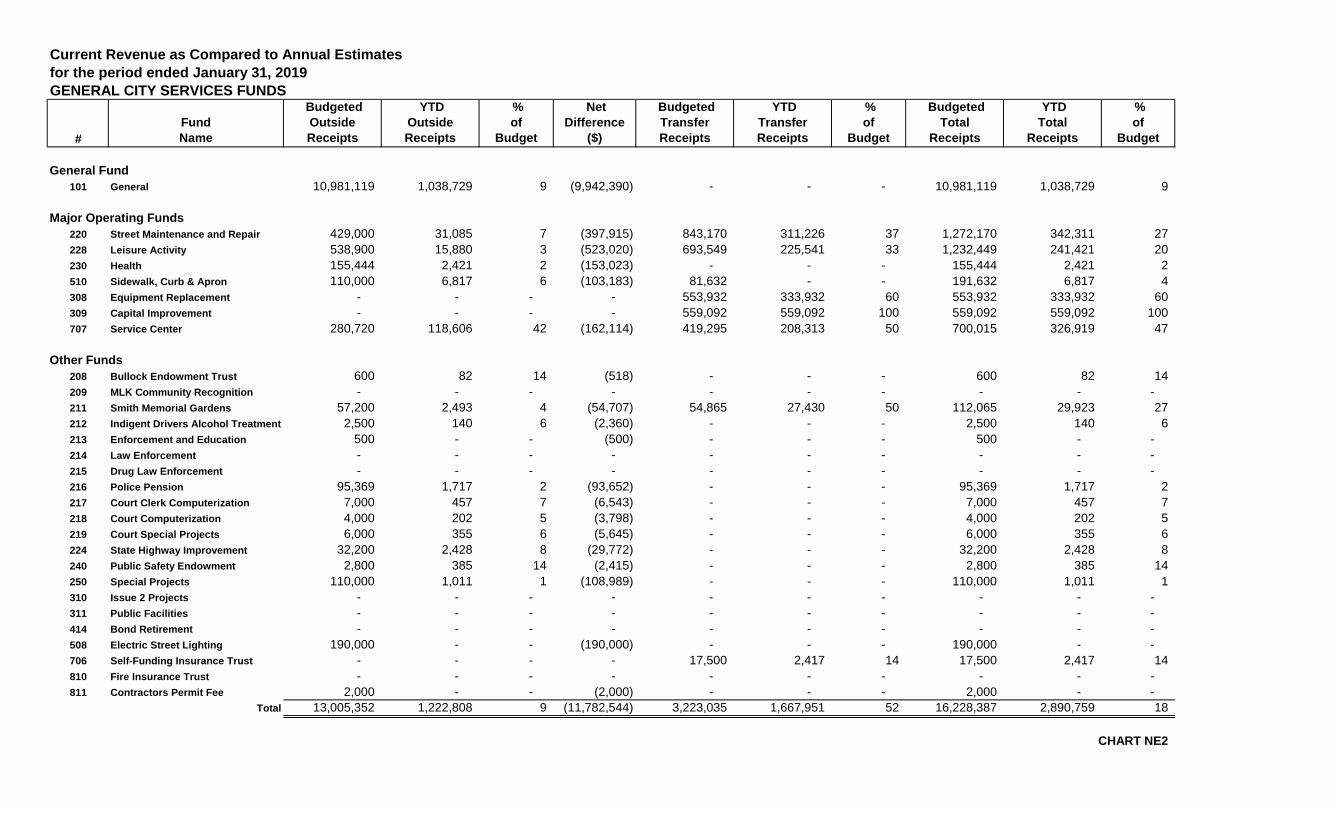
Current Revenue as Compared to Annual Estimatesfor the period ended January 31, 2019GENERAL CITY SERVICES FUNDS
#FundName
BudgetedOutsideReceipts
YTDOutsideReceipts
%of
Budget
NetDifference
($)
BudgetedTransferReceipts
YTDTransferReceipts
%of
Budget
BudgetedTotal
Receipts
YTDTotal
Receipts
%of
Budget
General Fund101 General 10,981,119 1,038,729 9 (9,942,390) - - - 10,981,119 1,038,729 9
Major Operating Funds220 Street Maintenance and Repair 429,000 31,085 7 (397,915) 843,170 311,226 37 1,272,170 342,311 27 228 Leisure Activity 538,900 15,880 3 (523,020) 693,549 225,541 33 1,232,449 241,421 20 230 Health 155,444 2,421 2 (153,023) - - - 155,444 2,421 2 510 Sidewalk, Curb & Apron 110,000 6,817 6 (103,183) 81,632 - - 191,632 6,817 4 308 Equipment Replacement - - - - 553,932 333,932 60 553,932 333,932 60 309 Capital Improvement - - - - 559,092 559,092 100 559,092 559,092 100 707 Service Center 280,720 118,606 42 (162,114) 419,295 208,313 50 700,015 326,919 47
Other Funds208 Bullock Endowment Trust 600 82 14 (518) - - - 600 82 14 209 MLK Community Recognition - - - - - - - - - - 211 Smith Memorial Gardens 57,200 2,493 4 (54,707) 54,865 27,430 50 112,065 29,923 27 212 Indigent Drivers Alcohol Treatment 2,500 140 6 (2,360) - - - 2,500 140 6 213 Enforcement and Education 500 - - (500) - - - 500 - - 214 Law Enforcement - - - - - - - - - - 215 Drug Law Enforcement - - - - - - - - - - 216 Police Pension 95,369 1,717 2 (93,652) - - - 95,369 1,717 2 217 Court Clerk Computerization 7,000 457 7 (6,543) - - - 7,000 457 7 218 Court Computerization 4,000 202 5 (3,798) - - - 4,000 202 5 219 Court Special Projects 6,000 355 6 (5,645) - - - 6,000 355 6 224 State Highway Improvement 32,200 2,428 8 (29,772) - - - 32,200 2,428 8 240 Public Safety Endowment 2,800 385 14 (2,415) - - - 2,800 385 14 250 Special Projects 110,000 1,011 1 (108,989) - - - 110,000 1,011 1 310 Issue 2 Projects - - - - - - - - - - 311 Public Facilities - - - - - - - - - - 414 Bond Retirement - - - - - - - - - - 508 Electric Street Lighting 190,000 - - (190,000) - - - 190,000 - - 706 Self-Funding Insurance Trust - - - - 17,500 2,417 14 17,500 2,417 14 810 Fire Insurance Trust - - - - - - - - - - 811 Contractors Permit Fee 2,000 - - (2,000) - - - 2,000 - -
Total 13,005,352 1,222,808 9 (11,782,544) 3,223,035 1,667,951 52 16,228,387 2,890,759 18
CHART NE2
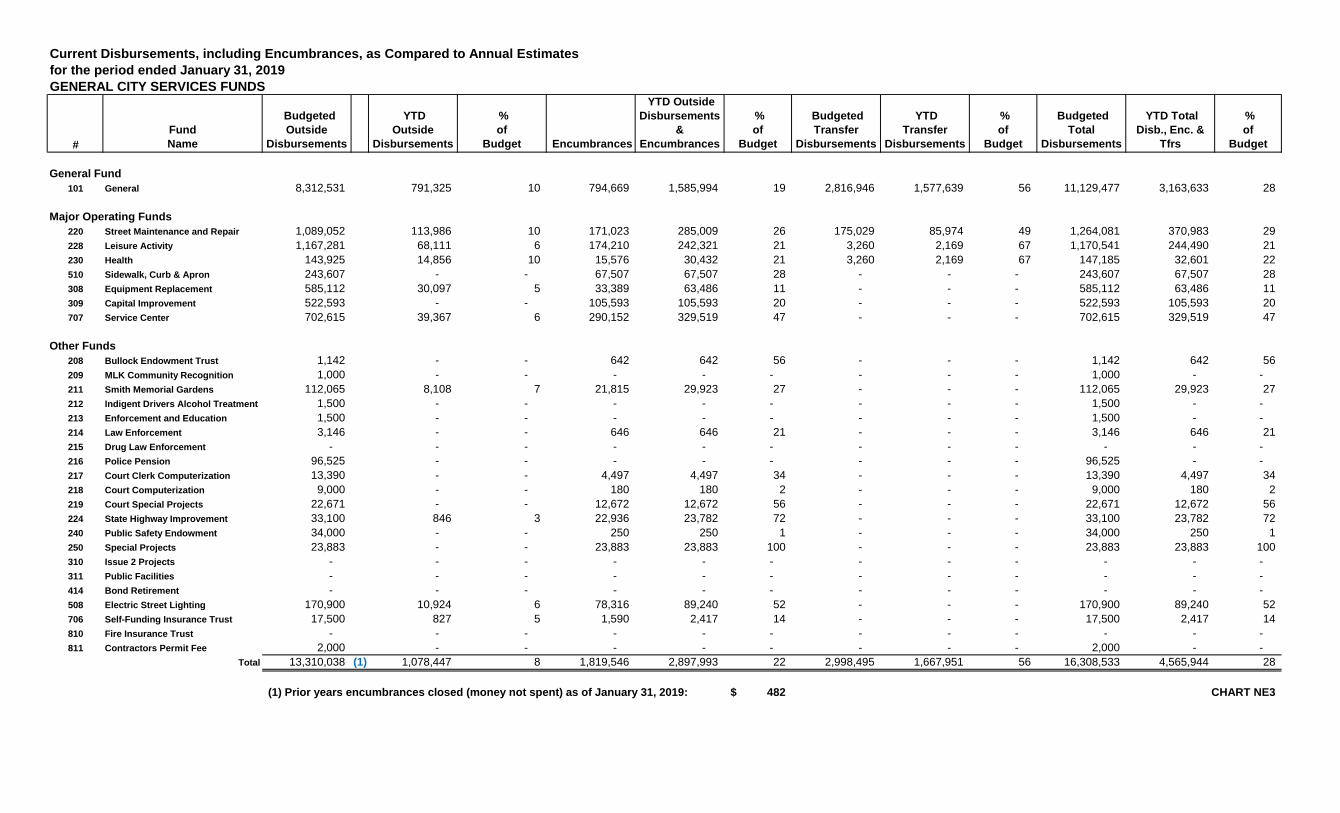
Current Disbursements, including Encumbrances, as Compared to Annual Estimatesfor the period ended January 31, 2019GENERAL CITY SERVICES FUNDS
#FundName
BudgetedOutside
Disbursements
YTDOutside
Disbursements
%of
Budget Encumbrances
YTD OutsideDisbursements
&Encumbrances
%of
Budget
BudgetedTransfer
Disbursements
YTDTransfer
Disbursements
%of
Budget
BudgetedTotal
Disbursements
YTD TotalDisb., Enc. &
Tfrs
%of
Budget
General Fund101 General 8,312,531 791,325 10 794,669 1,585,994 19 2,816,946 1,577,639 56 11,129,477 3,163,633 28
Major Operating Funds220 Street Maintenance and Repair 1,089,052 113,986 10 171,023 285,009 26 175,029 85,974 49 1,264,081 370,983 29 228 Leisure Activity 1,167,281 68,111 6 174,210 242,321 21 3,260 2,169 67 1,170,541 244,490 21 230 Health 143,925 14,856 10 15,576 30,432 21 3,260 2,169 67 147,185 32,601 22 510 Sidewalk, Curb & Apron 243,607 - - 67,507 67,507 28 - - - 243,607 67,507 28 308 Equipment Replacement 585,112 30,097 5 33,389 63,486 11 - - - 585,112 63,486 11 309 Capital Improvement 522,593 - - 105,593 105,593 20 - - - 522,593 105,593 20 707 Service Center 702,615 39,367 6 290,152 329,519 47 - - - 702,615 329,519 47
Other Funds208 Bullock Endowment Trust 1,142 - - 642 642 56 - - - 1,142 642 56 209 MLK Community Recognition 1,000 - - - - - - - - 1,000 - - 211 Smith Memorial Gardens 112,065 8,108 7 21,815 29,923 27 - - - 112,065 29,923 27 212 Indigent Drivers Alcohol Treatment 1,500 - - - - - - - - 1,500 - - 213 Enforcement and Education 1,500 - - - - - - - - 1,500 - - 214 Law Enforcement 3,146 - - 646 646 21 - - - 3,146 646 21 215 Drug Law Enforcement - - - - - - - - - - - - 216 Police Pension 96,525 - - - - - - - - 96,525 - - 217 Court Clerk Computerization 13,390 - - 4,497 4,497 34 - - - 13,390 4,497 34 218 Court Computerization 9,000 - - 180 180 2 - - - 9,000 180 2 219 Court Special Projects 22,671 - - 12,672 12,672 56 - - - 22,671 12,672 56 224 State Highway Improvement 33,100 846 3 22,936 23,782 72 - - - 33,100 23,782 72 240 Public Safety Endowment 34,000 - - 250 250 1 - - - 34,000 250 1 250 Special Projects 23,883 - - 23,883 23,883 100 - - - 23,883 23,883 100 310 Issue 2 Projects - - - - - - - - - - - - 311 Public Facilities - - - - - - - - - - - - 414 Bond Retirement - - - - - - - - - - - - 508 Electric Street Lighting 170,900 10,924 6 78,316 89,240 52 - - - 170,900 89,240 52 706 Self-Funding Insurance Trust 17,500 827 5 1,590 2,417 14 - - - 17,500 2,417 14 810 Fire Insurance Trust - - - - - - - - - - - - 811 Contractors Permit Fee 2,000 - - - - - - - - 2,000 - -
Total 13,310,038 (1) 1,078,447 8 1,819,546 2,897,993 22 2,998,495 1,667,951 56 16,308,533 4,565,944 28
(1) Prior years encumbrances closed (money not spent) as of January 31, 2019: 482$ CHART NE3
487
,189
63,
107
5,6
63
39,
856
642
,250
34,
728
223
34,
373
758
,204
24,
121
2,7
95
45,
299
729
,035
251
,090
14,
922
43,
845
933
,860
46,
716
17,
124
41,
029
$0
$100,000
$200,000
$300,000
$400,000
$500,000
$600,000
$700,000
$800,000
$900,000
$1,000,000
Income Tax, Real Estate Tax Net Investment Revenue Other
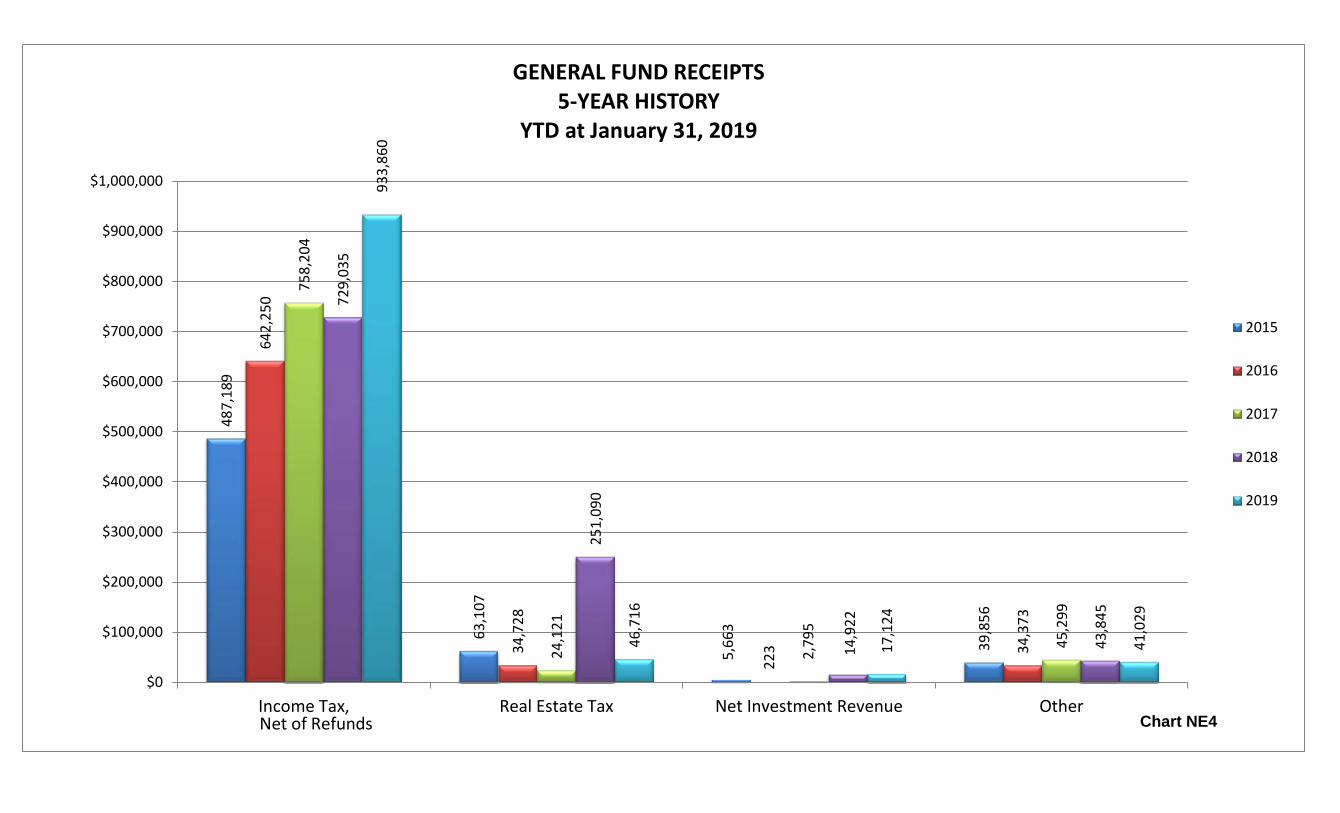
GENERAL FUND RECEIPTS 5-YEAR HISTORY
YTD at January 31, 2019
2015
2016
2017
2018
2019
Chart NE4 Net of Refunds
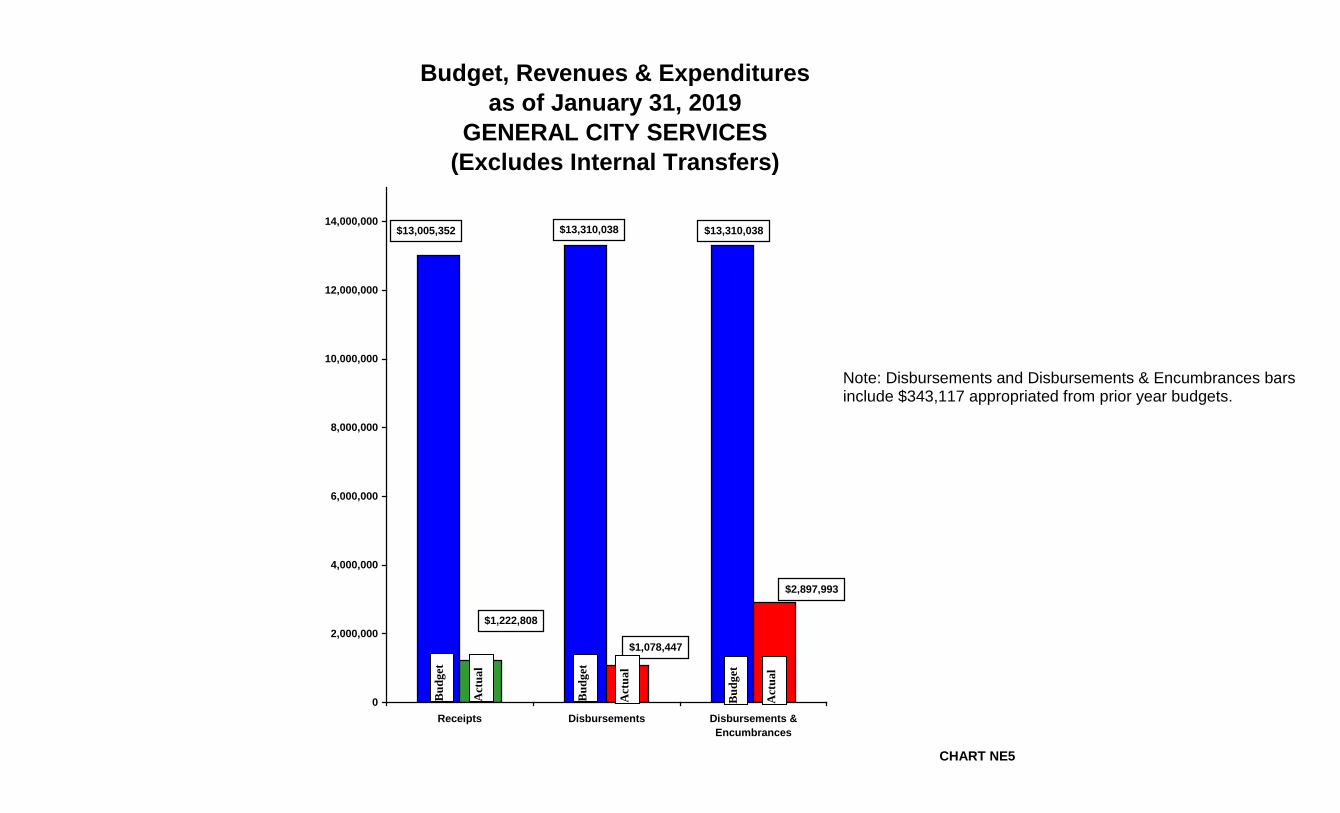
Budget, Revenues & Expendituresas of January 31, 2019
GENERAL CITY SERVICES(Excludes Internal Transfers)
$13,310,038$13,310,038$13,005,352
$2,897,993
$1,078,447
$1,222,808
0
2,000,000
4,000,000
6,000,000
8,000,000
10,000,000
12,000,000
14,000,000
Receipts Disbursements Disbursements &Encumbrances
CHART NE5 A
ctua
l
Bud
get
Bud
get
Act
ual
Act
ual
Bud
get
Note: Disbursements and Disbursements & Encumbrances bars include $343,117 appropriated from prior year budgets.
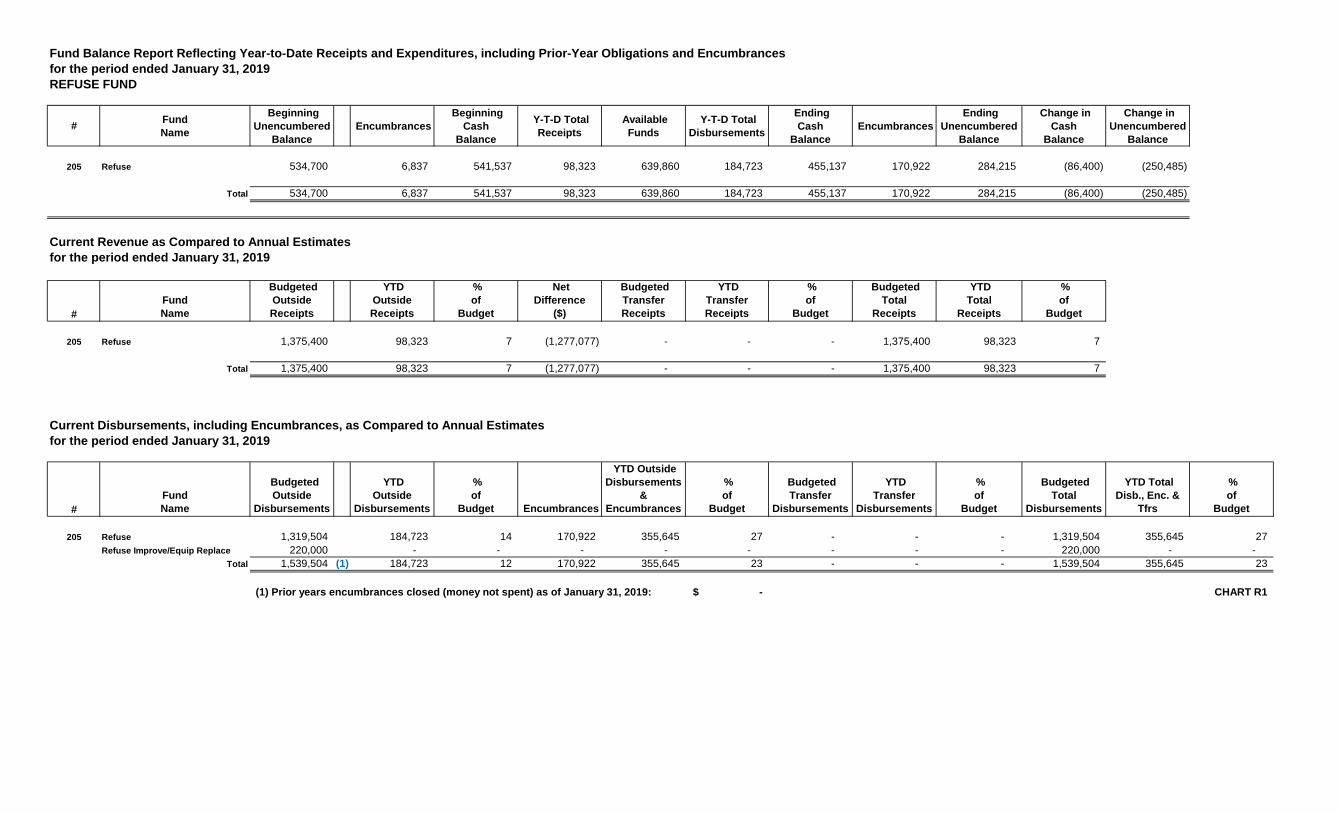
Fund Balance Report Reflecting Year-to-Date Receipts and Expenditures, including Prior-Year Obligations and Encumbrancesfor the period ended January 31, 2019REFUSE FUND
# FundName
Beginning Unencumbered
Balance Encumbrances
BeginningCash
Balance
Y-T-D TotalReceipts
AvailableFunds
Y-T-D TotalDisbursements
EndingCash
Balance Encumbrances
EndingUnencumbered
Balance
Change inCash
Balance
Change inUnencumbered
Balance
205 Refuse 534,700 6,837 541,537 98,323 639,860 184,723 455,137 170,922 284,215 (86,400) (250,485)
Total 534,700 6,837 541,537 98,323 639,860 184,723 455,137 170,922 284,215 (86,400) (250,485)
Current Revenue as Compared to Annual Estimatesfor the period ended January 31, 2019
#FundName
BudgetedOutsideReceipts
YTDOutsideReceipts
%of
Budget
NetDifference
($)
BudgetedTransferReceipts
YTDTransferReceipts
%of
Budget
BudgetedTotal
Receipts
YTDTotal
Receipts
%of
Budget
205 Refuse 1,375,400 98,323 7 (1,277,077) - - - 1,375,400 98,323 7
Total 1,375,400 98,323 7 (1,277,077) - - - 1,375,400 98,323 7
Current Disbursements, including Encumbrances, as Compared to Annual Estimatesfor the period ended January 31, 2019
#FundName
BudgetedOutside
Disbursements
YTDOutside
Disbursements
%of
Budget Encumbrances
YTD OutsideDisbursements
&Encumbrances
%of
Budget
BudgetedTransfer
Disbursements
YTDTransfer
Disbursements
%of
Budget
BudgetedTotal
Disbursements
YTD TotalDisb., Enc. &
Tfrs
%of
Budget
205 Refuse 1,319,504 184,723 14 170,922 355,645 27 - - - 1,319,504 355,645 27 Refuse Improve/Equip Replace 220,000 - - - - - - - - 220,000 - -
Total 1,539,504 (1) 184,723 12 170,922 355,645 23 - - - 1,539,504 355,645 23
(1) Prior years encumbrances closed (money not spent) as of January 31, 2019: -$ CHART R1
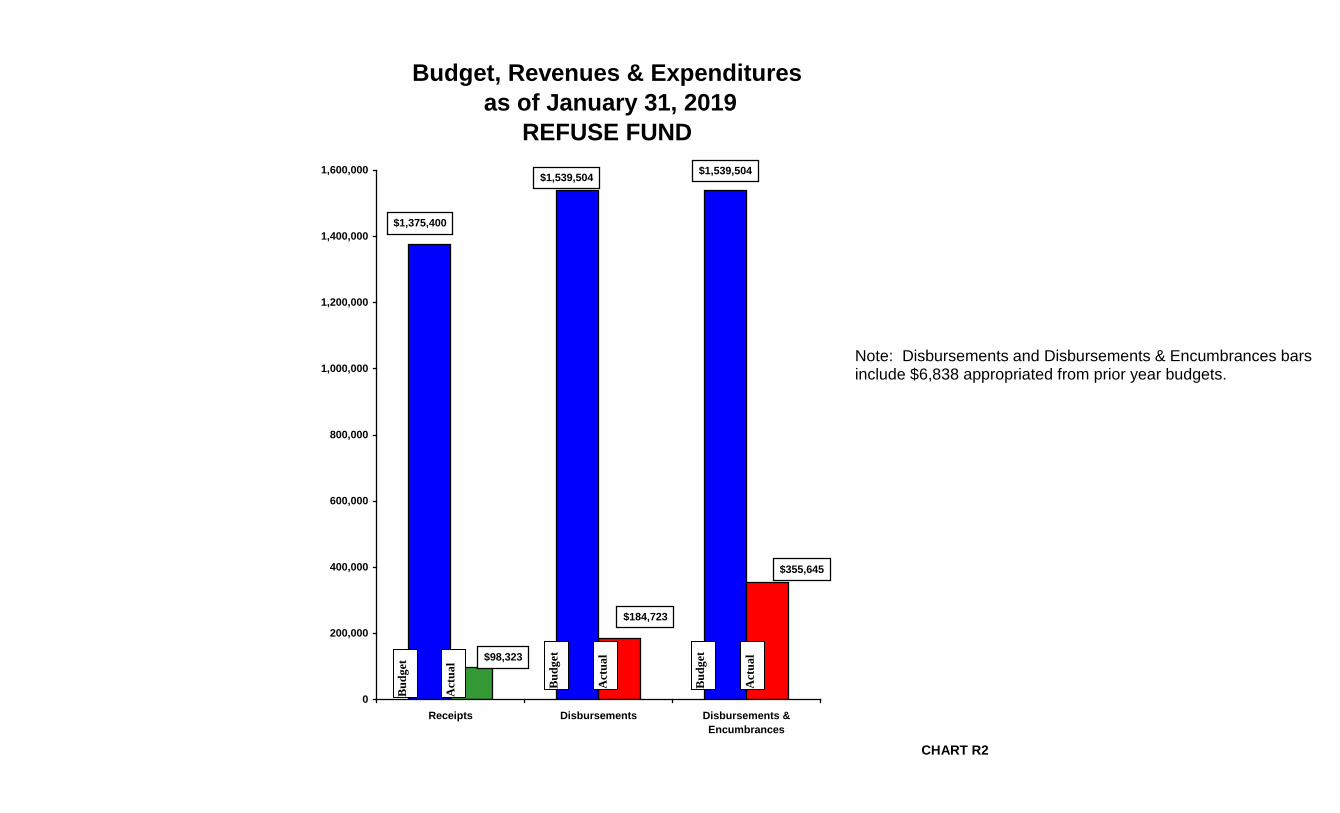
Budget, Revenues & Expenditures as of January 31, 2019
REFUSE FUND$1,539,504$1,539,504
$1,375,400
$355,645
$184,723
$98,323
0
200,000
400,000
600,000
800,000
1,000,000
1,200,000
1,400,000
1,600,000
Receipts Disbursements Disbursements &Encumbrances
CHART R2 A
ctua
l
Act
ual
Bud
get
Bud
get
Act
ual
Bud
get
Note: Disbursements and Disbursements & Encumbrances bars include $6,838 appropriated from prior year budgets.
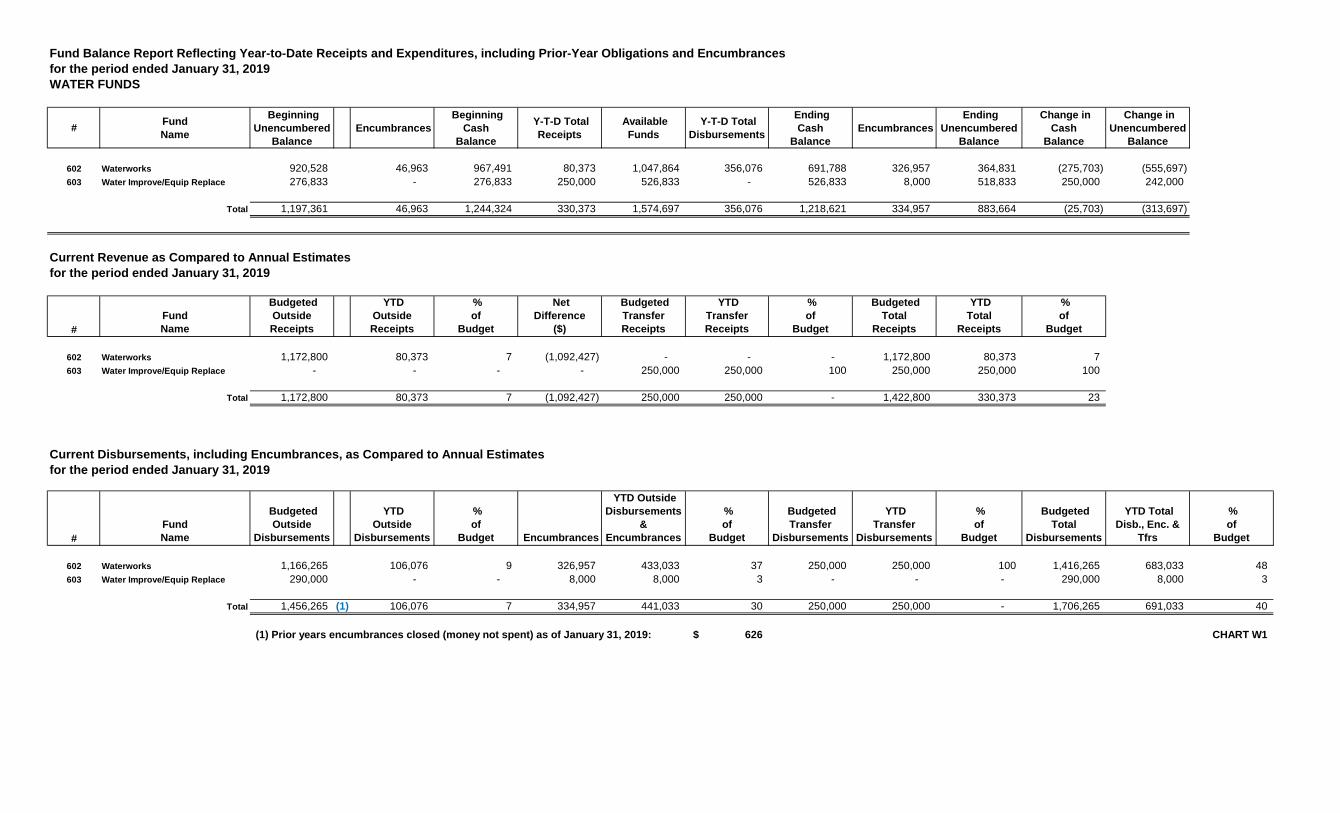
Fund Balance Report Reflecting Year-to-Date Receipts and Expenditures, including Prior-Year Obligations and Encumbrancesfor the period ended January 31, 2019WATER FUNDS
# FundName
Beginning Unencumbered
Balance Encumbrances
BeginningCash
Balance
Y-T-D TotalReceipts
AvailableFunds
Y-T-D TotalDisbursements
EndingCash
Balance Encumbrances
EndingUnencumbered
Balance
Change inCash
Balance
Change inUnencumbered
Balance
602 Waterworks 920,528 46,963 967,491 80,373 1,047,864 356,076 691,788 326,957 364,831 (275,703) (555,697) 603 Water Improve/Equip Replace 276,833 - 276,833 250,000 526,833 - 526,833 8,000 518,833 250,000 242,000
Total 1,197,361 46,963 1,244,324 330,373 1,574,697 356,076 1,218,621 334,957 883,664 (25,703) (313,697)
Current Revenue as Compared to Annual Estimatesfor the period ended January 31, 2019
#FundName
BudgetedOutsideReceipts
YTDOutsideReceipts
%of
Budget
NetDifference
($)
BudgetedTransferReceipts
YTDTransferReceipts
%of
Budget
BudgetedTotal
Receipts
YTDTotal
Receipts
%of
Budget
602 Waterworks 1,172,800 80,373 7 (1,092,427) - - - 1,172,800 80,373 7 603 Water Improve/Equip Replace - - - - 250,000 250,000 100 250,000 250,000 100
Total 1,172,800 80,373 7 (1,092,427) 250,000 250,000 - 1,422,800 330,373 23
Current Disbursements, including Encumbrances, as Compared to Annual Estimatesfor the period ended January 31, 2019
#FundName
BudgetedOutside
Disbursements
YTDOutside
Disbursements
%of
Budget Encumbrances
YTD OutsideDisbursements
&Encumbrances
%of
Budget
BudgetedTransfer
Disbursements
YTDTransfer
Disbursements
%of
Budget
BudgetedTotal
Disbursements
YTD TotalDisb., Enc. &
Tfrs
%of
Budget
602 Waterworks 1,166,265 106,076 9 326,957 433,033 37 250,000 250,000 100 1,416,265 683,033 48 603 Water Improve/Equip Replace 290,000 - - 8,000 8,000 3 - - - 290,000 8,000 3
Total 1,456,265 (1) 106,076 7 334,957 441,033 30 250,000 250,000 - 1,706,265 691,033 40
(1) Prior years encumbrances closed (money not spent) as of January 31, 2019: 626$ CHART W1
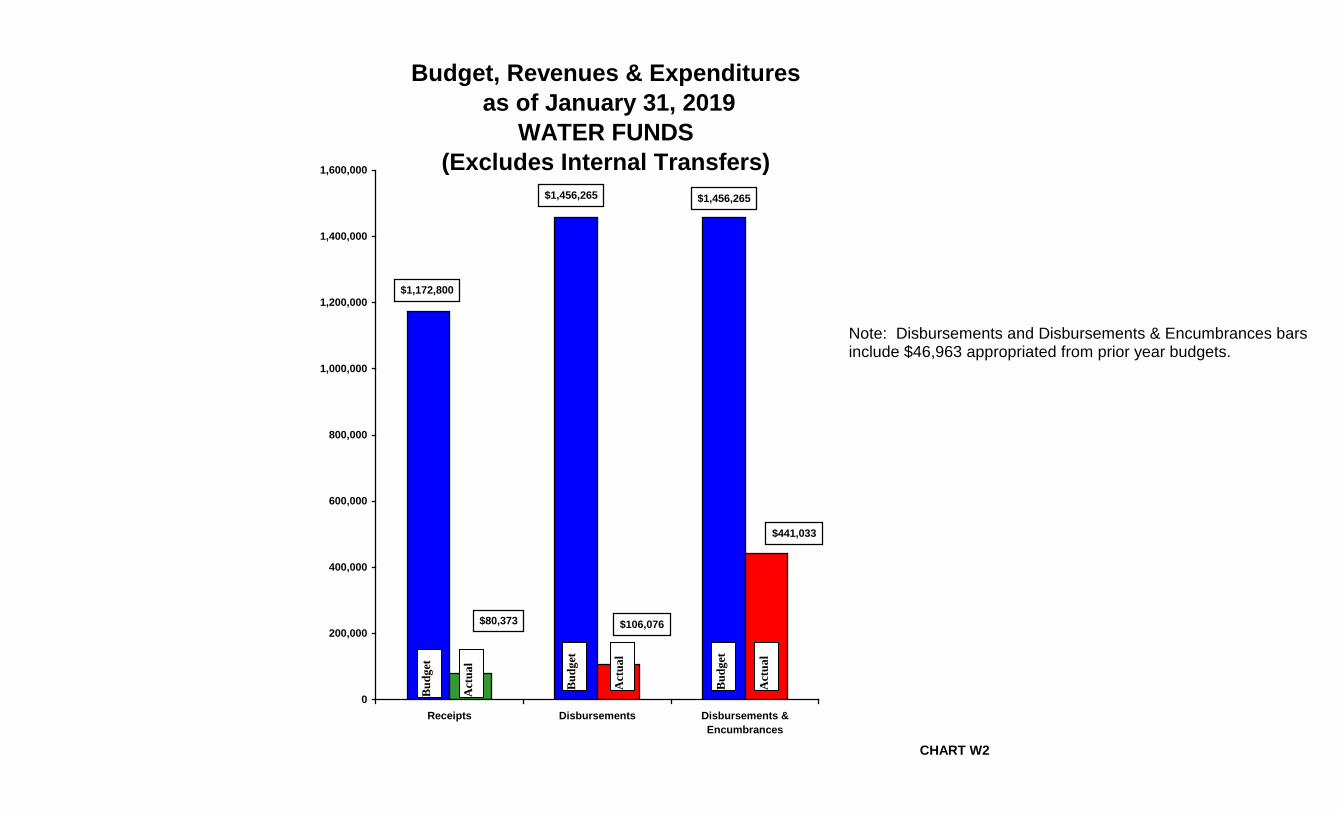
Budget, Revenues & Expenditures as of January 31, 2019
WATER FUNDS(Excludes Internal Transfers)
$1,456,265$1,456,265
$1,172,800
$441,033
$106,076$80,373
0
200,000
400,000
600,000
800,000
1,000,000
1,200,000
1,400,000
1,600,000
Receipts Disbursements Disbursements &Encumbrances
CHART W2 A
ctua
l
Act
ual
Bud
get
Bud
get
Act
ual
Bud
get
Note: Disbursements and Disbursements & Encumbrances bars include $46,963 appropriated from prior year budgets.
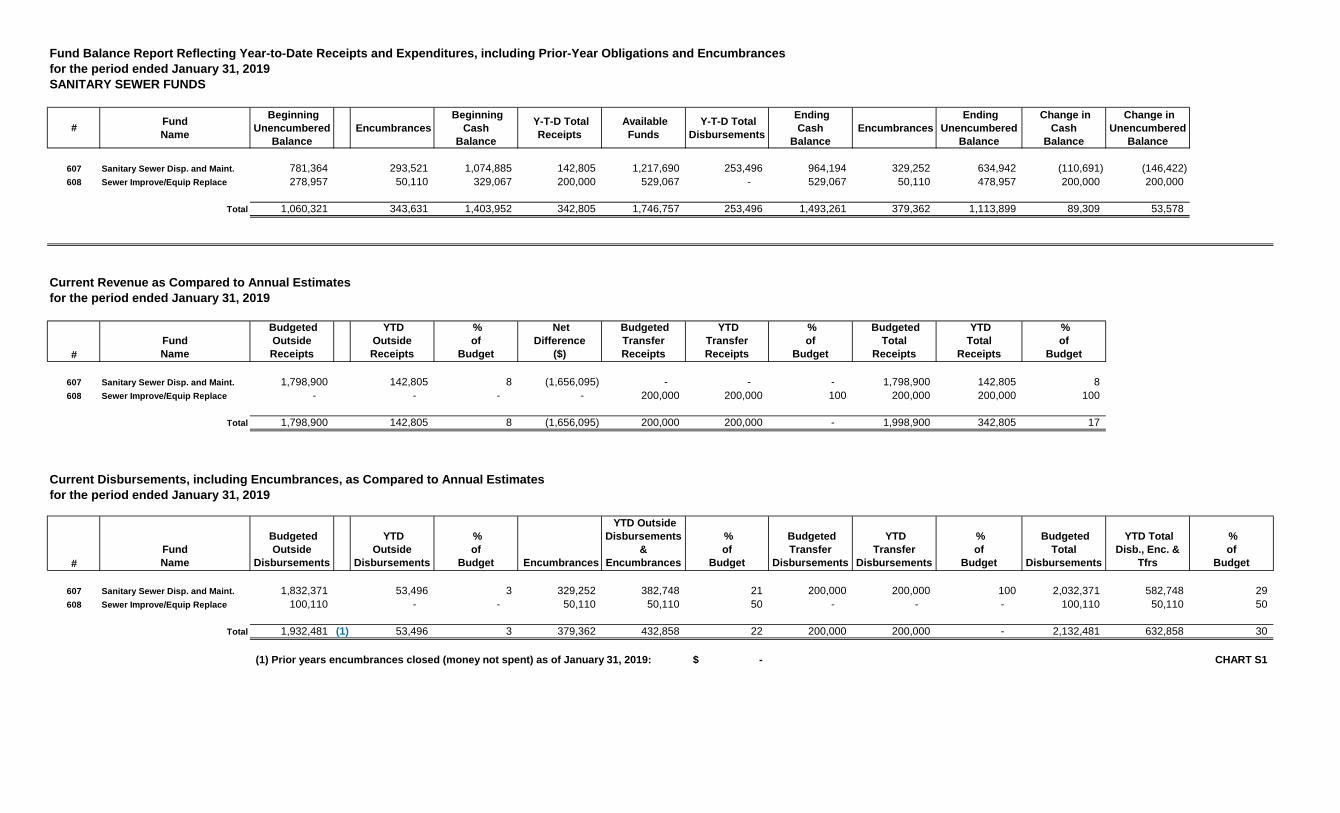
Fund Balance Report Reflecting Year-to-Date Receipts and Expenditures, including Prior-Year Obligations and Encumbrancesfor the period ended January 31, 2019SANITARY SEWER FUNDS
# FundName
Beginning Unencumbered
Balance Encumbrances
BeginningCash
Balance
Y-T-D TotalReceipts
AvailableFunds
Y-T-D TotalDisbursements
EndingCash
Balance Encumbrances
EndingUnencumbered
Balance
Change inCash
Balance
Change inUnencumbered
Balance
607 Sanitary Sewer Disp. and Maint. 781,364 293,521 1,074,885 142,805 1,217,690 253,496 964,194 329,252 634,942 (110,691) (146,422) 608 Sewer Improve/Equip Replace 278,957 50,110 329,067 200,000 529,067 - 529,067 50,110 478,957 200,000 200,000
Total 1,060,321 343,631 1,403,952 342,805 1,746,757 253,496 1,493,261 379,362 1,113,899 89,309 53,578
Current Revenue as Compared to Annual Estimatesfor the period ended January 31, 2019
#FundName
BudgetedOutsideReceipts
YTDOutsideReceipts
%of
Budget
NetDifference
($)
BudgetedTransferReceipts
YTDTransferReceipts
%of
Budget
BudgetedTotal
Receipts
YTDTotal
Receipts
%of
Budget
607 Sanitary Sewer Disp. and Maint. 1,798,900 142,805 8 (1,656,095) - - - 1,798,900 142,805 8 608 Sewer Improve/Equip Replace - - - - 200,000 200,000 100 200,000 200,000 100
Total 1,798,900 142,805 8 (1,656,095) 200,000 200,000 - 1,998,900 342,805 17
Current Disbursements, including Encumbrances, as Compared to Annual Estimatesfor the period ended January 31, 2019
#FundName
BudgetedOutside
Disbursements
YTDOutside
Disbursements
%of
Budget Encumbrances
YTD OutsideDisbursements
&Encumbrances
%of
Budget
BudgetedTransfer
Disbursements
YTDTransfer
Disbursements
%of
Budget
BudgetedTotal
Disbursements
YTD TotalDisb., Enc. &
Tfrs
%of
Budget
607 Sanitary Sewer Disp. and Maint. 1,832,371 53,496 3 329,252 382,748 21 200,000 200,000 100 2,032,371 582,748 29 608 Sewer Improve/Equip Replace 100,110 - - 50,110 50,110 50 - - - 100,110 50,110 50
Total 1,932,481 (1) 53,496 3 379,362 432,858 22 200,000 200,000 - 2,132,481 632,858 30
(1) Prior years encumbrances closed (money not spent) as of January 31, 2019: -$ CHART S1
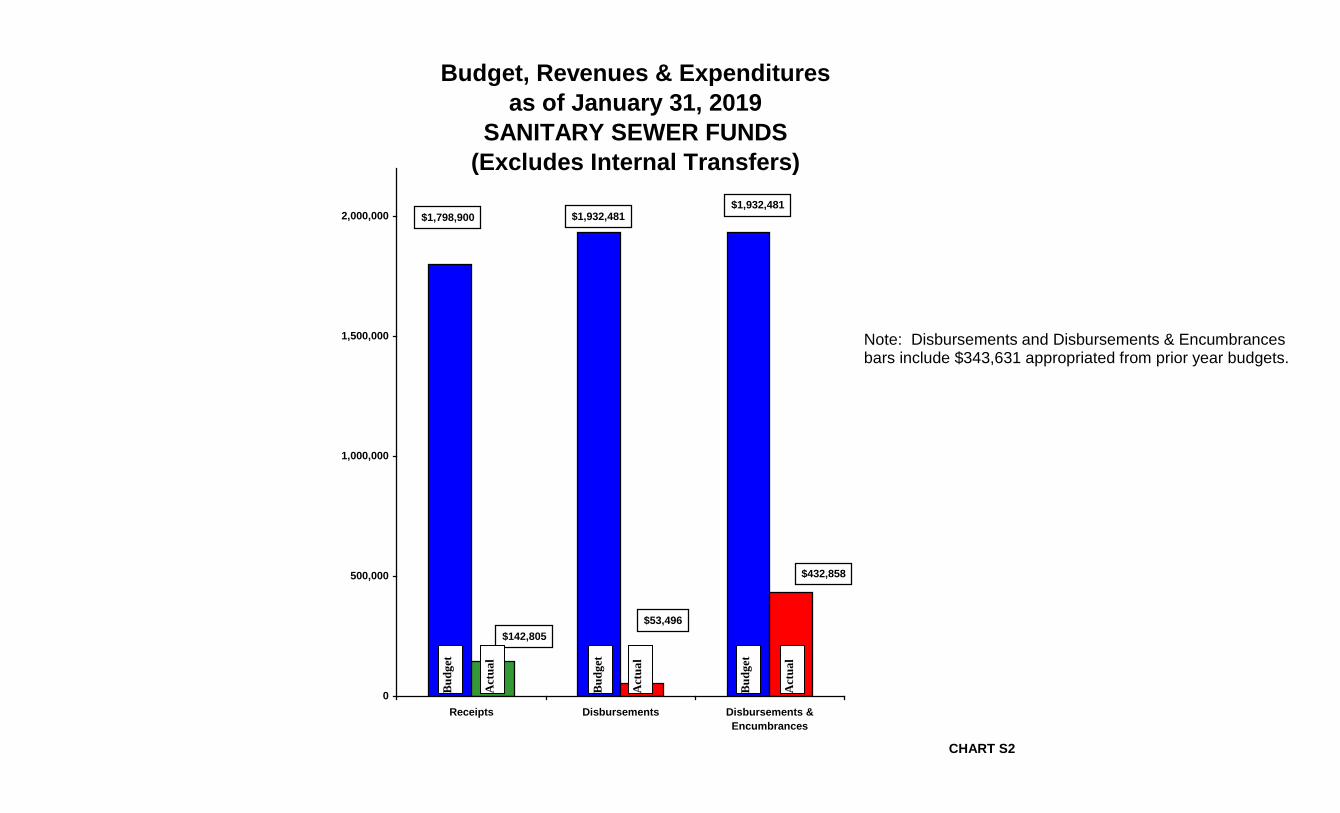
Budget, Revenues & Expendituresas of January 31, 2019
SANITARY SEWER FUNDS(Excludes Internal Transfers)
$1,798,900 $1,932,481$1,932,481
$142,805$53,496
$432,858
0
500,000
1,000,000
1,500,000
2,000,000
Receipts Disbursements Disbursements &Encumbrances
CHART S2
Act
ual
Bud
get
Act
ual
Bud
get
Act
ual
Bud
get
Note: Disbursements and Disbursements & Encumbrances bars include $343,631 appropriated from prior year budgets.
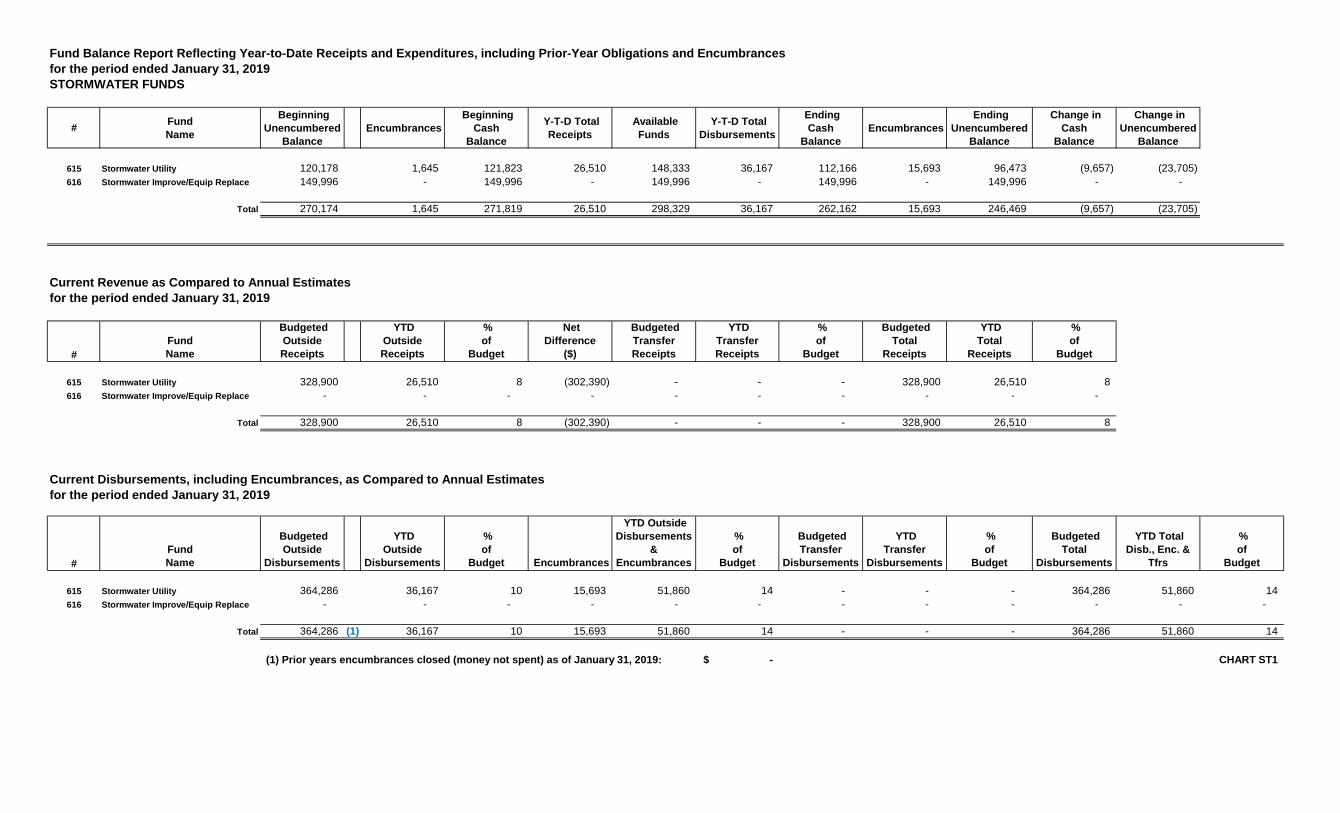
Fund Balance Report Reflecting Year-to-Date Receipts and Expenditures, including Prior-Year Obligations and Encumbrancesfor the period ended January 31, 2019STORMWATER FUNDS
# FundName
Beginning Unencumbered
Balance Encumbrances
BeginningCash
Balance
Y-T-D TotalReceipts
AvailableFunds
Y-T-D TotalDisbursements
EndingCash
Balance Encumbrances
EndingUnencumbered
Balance
Change inCash
Balance
Change inUnencumbered
Balance
615 Stormwater Utility 120,178 1,645 121,823 26,510 148,333 36,167 112,166 15,693 96,473 (9,657) (23,705) 616 Stormwater Improve/Equip Replace 149,996 - 149,996 - 149,996 - 149,996 - 149,996 - -
Total 270,174 1,645 271,819 26,510 298,329 36,167 262,162 15,693 246,469 (9,657) (23,705)
Current Revenue as Compared to Annual Estimatesfor the period ended January 31, 2019
#FundName
BudgetedOutsideReceipts
YTDOutsideReceipts
%of
Budget
NetDifference
($)
BudgetedTransferReceipts
YTDTransferReceipts
%of
Budget
BudgetedTotal
Receipts
YTDTotal
Receipts
%of
Budget
615 Stormwater Utility 328,900 26,510 8 (302,390) - - - 328,900 26,510 8 616 Stormwater Improve/Equip Replace - - - - - - - - - -
Total 328,900 26,510 8 (302,390) - - - 328,900 26,510 8
Current Disbursements, including Encumbrances, as Compared to Annual Estimatesfor the period ended January 31, 2019
#FundName
BudgetedOutside
Disbursements
YTDOutside
Disbursements
%of
Budget Encumbrances
YTD OutsideDisbursements
&Encumbrances
%of
Budget
BudgetedTransfer
Disbursements
YTDTransfer
Disbursements
%of
Budget
BudgetedTotal
Disbursements
YTD TotalDisb., Enc. &
Tfrs
%of
Budget
615 Stormwater Utility 364,286 36,167 10 15,693 51,860 14 - - - 364,286 51,860 14 616 Stormwater Improve/Equip Replace - - - - - - - - - - - -
Total 364,286 (1) 36,167 10 15,693 51,860 14 - - - 364,286 51,860 14
(1) Prior years encumbrances closed (money not spent) as of January 31, 2019: -$ CHART ST1
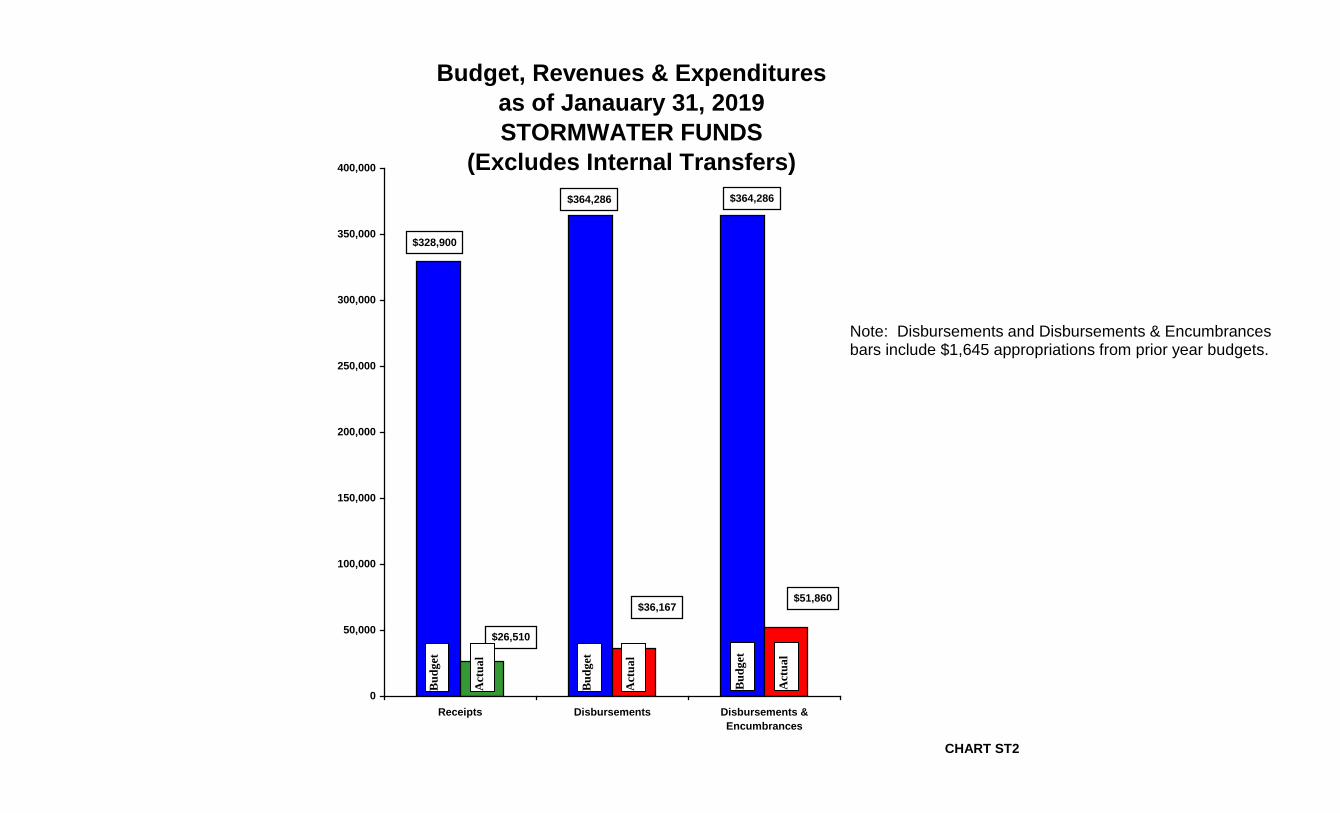
Budget, Revenues & Expendituresas of Janauary 31, 2019STORMWATER FUNDS
(Excludes Internal Transfers)
$328,900
$364,286 $364,286
$26,510
$36,167$51,860
0
50,000
100,000
150,000
200,000
250,000
300,000
350,000
400,000
Receipts Disbursements Disbursements &Encumbrances
CHART ST2
Act
ual
Bud
get
Act
ual
Bud
get
Act
ual
Bud
get
Note: Disbursements and Disbursements & Encumbrances bars include $1,645 appropriations from prior year budgets.
City of Oakwood Cindy Stafford ________________________________________________________________
Page 1 of 1
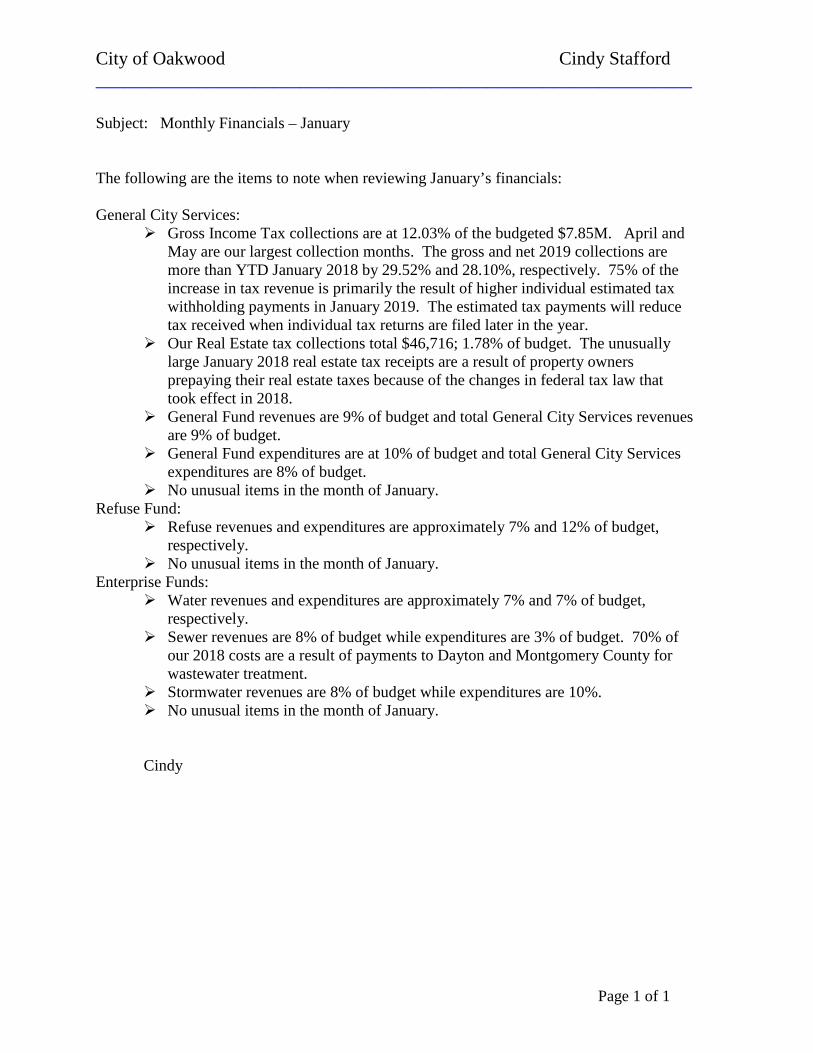
Subject: Monthly Financials – January The following are the items to note when reviewing January’s financials: General City Services:
Gross Income Tax collections are at 12.03% of the budgeted $7.85M. April and May are our largest collection months. The gross and net 2019 collections are more than YTD January 2018 by 29.52% and 28.10%, respectively. 75% of the increase in tax revenue is primarily the result of higher individual estimated tax withholding payments in January 2019. The estimated tax payments will reduce tax received when individual tax returns are filed later in the year.
Our Real Estate tax collections total $46,716; 1.78% of budget. The unusually large January 2018 real estate tax receipts are a result of property owners prepaying their real estate taxes because of the changes in federal tax law that took effect in 2018.
General Fund revenues are 9% of budget and total General City Services revenues are 9% of budget.
General Fund expenditures are at 10% of budget and total General City Services expenditures are 8% of budget.
No unusual items in the month of January. Refuse Fund:
Refuse revenues and expenditures are approximately 7% and 12% of budget, respectively.
No unusual items in the month of January. Enterprise Funds:
Water revenues and expenditures are approximately 7% and 7% of budget, respectively.
Sewer revenues are 8% of budget while expenditures are 3% of budget. 70% of our 2018 costs are a result of payments to Dayton and Montgomery County for wastewater treatment.
Stormwater revenues are 8% of budget while expenditures are 10%. No unusual items in the month of January. Cindy

![[ENTITY NAME] - Web view(Delete the word “unencumbered”, if there were no encumbrances outstanding at year end.) Estimated Resources.](https://img.pdfslide.us/doc/110x75/5a93dd447f8b9adb5c8bd602/entity-name-web-viewdelete-the-word-unencumbered-if-there-were-no.jpg)
![2013 Year end presentation.ppt [Read-Only] · Claims) being processed for FY 2013, use the current date up ... commitment, and what encumbrances will drop off before fiscal year close](https://img.pdfslide.us/doc/110x75/5aff336c7f8b9a8b4d90086a/2013-year-end-read-only-being-processed-for-fy-2013-use-the-current-date-up-.jpg)


![[ENTITY NAME] - Web viewNote: This shell : is: ... [Delete the word “unencumbered”, if there were no encumbrances outstanding at year-end.] Estimated Resources](https://img.pdfslide.us/doc/110x75/5a93a2e77f8b9aba4a8ba9bd/entity-name-web-viewnote-this-shell-is-delete-the-word-unencumbered.jpg)
![[ENTITY NAME] - Ohio Auditor of State Web view(Delete the word “unencumbered”, if there were no encumbrances outstanding at year end.) Estimated Resources](https://img.pdfslide.us/doc/110x75/5aab2b887f8b9aa9488ba6f0/entity-name-ohio-auditor-of-state-web-viewdelete-the-word-unencumbered.jpg)