Embed Size (px)
Citation preview

Financial Reporting Regulation and Financing Decisions
Patricia Naranjo [email protected]
Jesse H. Jones Graduate School of Business, Rice University
Daniel Saavedra [email protected]
UCLA Anderson School of Management
Rodrigo S. Verdi* [email protected]
Sloan School of Management, MIT
Abstract
We study the influence of a major reform in financial reporting regulation on financing decisions. Across a battery of tests, we document an increase in the issuance of external financing around the new regulation. Further, firms make different financing decisions around the new regulation depending on their ex-ante debt capacity, allowing them to adjust their capital structure. Our results are accentuated across firms facing higher adverse selection costs and are consistent with the new regulation reducing underinvestment among constrained firms. Our findings highlight the importance of financial reporting regulation in explaining financing as well as investment policies and provide insights into which firms are more likely to benefit from it.
Current draft: March 2017 _______________ * Corresponding author contact information: 100 Main Street, Cambridge, MA 02142; Phone: (617) 253-2956; E-mail: [email protected]. We thank Manuel Adelino, Joshua Anderson, Mark Bradshaw, John Core, Xavier Giroud, João Granja, Nick Guest, Michelle Hanlon, Amy Hutton, Christian Leuz, Gustavo Manso, Stewart Myers, Jeff Ng, Scott Richardson, Michael Roberts, Antoinette Schoar, Nemit Shroff, Eric So, Jerry Zimmerman, and workshop participants at Boston College, the University of British Columbia, Catholic-Lisbon University, INSEAD, LBS, MIT, Penn State, Rice University, the University of Sao Paulo, and conference participants at the AAA, EAA and IAS for helpful comments. Rodrigo Verdi gratefully acknowledges financial support from the MIT Sloan School of Management, the Sarofim Family, and the CAPES Foundation. Patricia Naranjo gratefully acknowledges financial support from the MIT Sloan School of Management and Rice University. Patricia Naranjo and Daniel Saavedra are also grateful for financial support from the Deloitte Foundation.

1
1. Introduction
We study the influence of a major reform in financial reporting regulation on financing
decisions around the world. Specifically, we use the adoption of the International Financial
Reporting Standards (IFRS) as a setting in which a new regulation substantially alters the
information environment of the adopting firms (hereafter the ‘new regulation’).1 We refer to the
new regulation broadly, which includes the new set of standards, as well as supporting
infrastructure such as enforcement efforts by regulators to increase compliance with the new
standards.2 We then frame our predictions based on the pecking order theory developed by Myers
and Majluf (1984).
Our motivation is twofold: First, despite decades of research on capital structure,
academics have not come to an agreement about the extent to which the pecking order theory, and
information frictions in particular, affect financing decisions (we review this literature in Section
2). Part of the challenge is that it is difficult to obtain exogenous variation in information
asymmetry to isolate its effect on financing decisions. In this context, Garmaise and Natividad
(2010; p. 1) note that “Credible exogenous information proxies are hard to find, and there are
relatively few natural experiments that result in significant shifts in the information environment.”
We contribute to this literature by using a financing reporting reform as a regulatory change aimed
at reducing information asymmetry.3 Because the reform we study is determined at the country
1 Throughout the paper, we use the terms new “regulation”, “reform”, “mandate” interchangeably. 2 The literature has recently focused on the specific drivers of the economic consequences around the adoption and implementation of IFRS (see, e.g., Christensen et al., (2013) and Barth and Israeli (2013)). While this is unquestionably an important debate, our focus is on whether a financial reporting regulation, broadly defined, can influence a firm’s financing decisions by changing the information environment of reporting firms. 3 While a country’s decision to adopt IFRS is certainly endogenous (see, e.g., Hope et al. (2006) and Ramanna and Sletten (2014)), our hypotheses rely on a less stringent assumption that the country adoption is (arguably) exogenous to idiosyncratic financing preferences of a given firm.

2
level it is less likely to reflect the endogenous preferences of a single firm. Further, we are also not
aware of empirical evidence suggesting that IFRS systematically affects other determinants of
capital structure decisions such as tax rates and/or financial distress. As a result, our setting allows
us to frame our hypotheses based on predictions from the pecking order theory.4
Second, there is little evidence on the extent to which financial reporting regulation affects
financing decisions around the world (Myers (2003), for example, calls for more research in this
area). To date, the international literature that studies the implications of regulatory reforms on
financing decisions has mostly centered around creditor control rights (e.g., La Porta et al. (1997,
1998), Vig (2013)) or market liberalization (see Bekaert and Harvey (2000), Henry (2000)). In
contrast, our paper exploits a major reform in financial reporting to study the extent to which
reporting regulation influences financing choices.5
A key prediction from the pecking order theory is that information asymmetry is an
important determinant of financing decisions. In particular, information asymmetry between
managers and (new) investors increases adverse selection costs, and, as a result, the cost of raising
external capital. The key intuition is that managers have an information advantage over outside
investors and, as a result, are more inclined to raise external financing when they believe outside
investors are overvaluing the company’s stock. Investors, however, anticipate this behavior and
respond to an equity issuance by discounting the stock price. Therefore, information asymmetry
leads to adverse selection costs that make external financing less attractive and, in equilibrium,
firms end up passing profitable investment opportunities. To the extent that the new financial
4 In Section 2, we discuss in more detail alternative capital structure theories and how they relate to our results. 5 We focus on financing decisions such as the likelihood of engaging in external financing (debt or equity), as well as its investment and leverage implications. Our approach contrasts with prior studies, which focus on the cost of financing using measures of adverse selection costs as proxied by bid-ask spreads (e.g., Leuz and Verrecchia (2000)).

3
reporting regulation reduces information asymmetry between managers and investors among
adopting firms6, then it would reduce adverse selection. As a result, in the context of Myers and
Majluf’s (1984) model, firms adopting the new regulation should be more inclined to seek external
financing and fund investment opportunities. We test this hypothesis (and additional predictions
described below).
Notwithstanding our prediction, there are several arguments in support for a null result.
First, as discussed above, although the pecking order theory has existed for over three decades,
researchers are still debating whether and to what extent this theory explains financing decisions
(Shyam-Sunder and Myers (1999), Fama and French (2002, 2005), Bharath et al. (2009), Leary
and Roberts (2010), among many others). Second, setting the finance debate aside, the change in
information asymmetry around the new regime might be immaterial to influence financing
decisions (see, e.g., evidence in Christensen et al. (2013)). Last, as with any accounting standard,
IFRS allows for substantial managerial discretion in its implementation and compliance, which
raises the possibility that firms might adopt the new standards without a material effect on their
reporting practices (Daske et al. (2013)). Thus, whether the new regulation alters financing
decisions is an empirical issue that we investigate in this paper.
We test our hypotheses using a sample that consists of 76,661 firm-year observations from
34 countries that adopted the new regulation between 2003 and 2012 and from seven countries
that did not adopt it. To implement a difference-in-difference research design (DID henceforth),
we require firms to have non-missing data for the year before and at least one year after the
adoption date as well as a propensity-matched control firm. We limit the pre- and post-adoption
periods to a maximum of four years and exclude the adoption year to avoid confounding effects
6 See Section 2 in our paper, Leuz and Wysocki (2015) and De George, Li, and Shivakumar (2015) for a review of this literature.

4
around the adoption transition period (Loyeung et al. (2016)). Our sample consists of countries
that adopted the new standard in 2005 (such as the E.U.) as well as 12 countries that adopted it
afterwards (e.g., Brazil, Canada, China, Russian Federation, and South Korea, among others). The
staggered adoption helps us mitigate the effects of concurrent changes, unrelated to the reform,
around the adoption period (Leuz and Wysocki (2015)).
Using a DID research design, we find that firms that adopted the new regulation are 3-3.8%
more likely (relative to the benchmark samples) to raise external capital in a given year, a change
of 10-13% relative to pre-adoption financing levels. These findings are robust to controlling for a
large set of control variables related to other determinants of financing decisions (e.g., distress
risk, investment opportunities, and market timing) as well as year and firm fixed effects. We
supplement these results with two tests to mitigate the concern that confounding factors, unrelated
to the financial reporting reform, could drive our findings. First, we follow Bertrand and
Mullainathan (2003) and allow for a non-linear (yearly) effect around the mandate. The idea is
that, if our results reflect a time trend (e.g., a gradual change towards market integration), we
would expect the increase in external financing to reflect a gradual change, as opposed to a
discontinuity around the new regulation. In contrast, we find no changes in financing decisions in
the years before the mandate. Rather, the effect becomes relevant after the adoption and peaks 2-
3 years subsequent to the new regime. Second, we exploit the fact that 2005 adopters with a
December fiscal year end were required to adopt the regulation in 2005, whereas the remaining
firms adopted in 2006. Consistent with this staggered implementation of the reform, we find that

5
2005 adopters increased their external financing starting in 2005 (peaking in 2007-2008), whereas
2006 adopters increased their external financing starting in 2007 (peaking in 2008).7
Our second hypothesis exploits cross-sectional predictions in Myers (1984). A central
friction in Myers and Majluf (1984) is the existence of information asymmetry between insiders
and outsiders (new investors) about growth opportunities and assets in place. Thus, to the extent
that information frictions drive financing choices, the effect should be more accentuated for firms
with higher ex-ante levels of financial constraints, which tend to suffer more from information
asymmetry (Fazzari et al. (1988)). In addition, because the new regulation can have heterogeneous
effects on information asymmetry across firms, only firms experiencing a reduction in information
asymmetry would actually benefit from lower adverse selection costs and change their financing
choices. Using a within-country DID research design that controls for country-specific effects
around the adoption date (e.g., variations in enforcement across countries), we find results
supporting these predictions. These findings are consistent with information asymmetry and
financing constraints being an important mechanism behind the changes in financing we
document.
Our third hypothesis focuses on whether firms would issue debt or equity depending on their
financing capacity. The idea is that firms will first raise external financing in the form of debt
capital and then, as the costs of raising additional debt increase (i.e., when debt capacity has been
reached), firms will raise equity capital (Myers (1984) terms this the “modified pecking order”;
see also Lemmon and Zender (2010) for a recent test of this theory). We test this hypothesis by
conditioning our sample on pre-adoption leverage and distress risk as proxies for a firm’s existing
7 To mitigate confounding effects, for this test we use a subsample of firms whose adoption dates are at least six months apart. We are able to do that because fiscal year ends (and consequently the adoption date) range from December 2005 to November 2006.

6
debt capacity at the time of the adoption of the new regulation. We find that, relative to the control
sample of matched firms, adopting firms with debt capacity increased leverage (i.e., issued more
debt) whereas firms without debt capacity maintained their leverage (i.e., issued both debt and
equity). This result suggests that firms make different external financing choices around the new
regulation depending on their ex-ante debt capacity, which results in changes in their capital
structure.
Last we provide two sensitivity analyses. First, we test the prediction that the decrease in
external financing costs allows financially constrained firms to increase investment. Consistent
with this prediction, we find that in the post-regulation period investment increases, but that this
effect is concentrated among financially constrained firms. Second, we examine whether our
results are robust across different subsamples. Specifically, we separate our treatment firms into
(i) EU firms that increased enforcement vs. others (Christensen et al. (2013)), (ii) EU vs. non-EU
firms (Daske et al. (2008)), and (iii) 2005 vs. non-2005 adopters to exploit the staggered adoption
of the new regime. Consistent with prior research, we find that our results are stronger among EU
countries, in particular the ones experiencing increases in enforcement. Most importantly, we find
that our main inferences remain for both E.U. and non-E.U. countries and, to a lesser extent, for
2005 and non-2005 adopters. Overall, these findings mitigate the concern that an omitted factor
around the adoption of the new regime by E.U. countries or during 2005 could be driving our
results.
Our study provides three main contributions. First, our study contributes to the
international literature that studies the role of regulation on financing decisions. In contrast to prior
research that focuses on market liberalization, control rights, etc., there is little evidence on the
role of financial reporting reforms on financing decisions. An exception is Petacchi (2015), who

7
uses the Regulation Fair Disclosure (Reg-FD) as a setting with asymmetric changes in information
asymmetry in equity and debt markets to study its effect on the capital structure of U.S. firms. Our
paper, in contrast, focuses on whether the adoption of IFRS worldwide facilitated external
financing, in particular among financially constrained firms. Our findings suggest that financial
reporting reforms can have an important influence on financing decisions, which reduced
underinvestment among financially constrained firms.
Second, we contribute to the literature on the economic consequences around IFRS.
Despite a large literature on this topic, it is only recently that studies have focused on the
implications of financing decisions. Our results are most closely related to Florou and Kosi (2015)
who study the choice of issuing public vs. private debt after the adoption of IFRS.8 Our findings
are distinct from and complement theirs in that we analyze all financing choices available to firms
(i.e., internal capital, debt, and equity) based on the pecking-order theory, as well as its investment
and capital structure implications.
Last, we contribute to the debate about the relevance of the pecking order theory. The
finance literature has long argued about the importance of this theory, with mixed conclusions
(Shyam-Sunder and Myers (1999), Fama and French (2002, 2005), Bharath et al. (2009), Leary
and Roberts (2010), among many others). An important challenge for empirical tests of the pecking
order is to obtain exogenous variation in information asymmetry, which allows its effect on
financing decisions to be isolated (Garmaise and Natividad (2010)). We use the new financial
reporting regulation as a setting with a regulatory change in the information environment of
affected firms and show that the changes in financing patterns for these firms are consistent with
predictions from the pecking order theory.
8 See also Chen et al., (2013) and Ball, Li and Shivakumar (2015), who study features of private debt contracting such as loan spreads and the use of covenants without modelling firms’ financing choices.

8
The remainder of the paper is organized as follows: Section 2 provides background on the
related literature and presents our hypotheses. Section 3 presents the research design. Section 4
presents the results and Section 5 concludes.
2. Motivation and Hypothesis Development
2.1. THE PECKING ORDER THEORY
The pecking order theory, developed by Myers and Majluf (1984), argues that firms follow
a financing pattern that allows them to minimize the information costs associated with raising
external financing. The basic argument is that managers have an information advantage over
outside investors and that such information asymmetry leads to adverse selection costs being borne
by current shareholders, which make equity issuances less attractive. As a result, to avoid incurring
adverse selection costs, managers prefer to use internally generated funds over raising external
capital and can even pass up profitable investment opportunities that require external financing.
Myers and Majluf (1984) then show that debt issuances can mitigate, but not eliminate, this
effect. This occurs because debt is less sensitive to information asymmetry than equity; debt has
the prior claim on assets, whereas equity is the residual claim. Thus, debt investors are less exposed
to errors in valuing the firm. As a result, lenders price protect to a lower extent than equity holders
in order to compensate for their own informational disadvantage. In response, Myers and Majluf
predict that managers attempting to minimize information costs will follow a financing pecking
order in which internally generated funds are preferred, and if the manager decides to raise external
capital, debt is preferred over equity.
Pecking order predictions have been empirically tested in numerous studies, with mixed
evidence. Initial studies focus on the consequences around equity issuances. For example, Asquith
and Mullins (1986) provide evidence that the announcement of a stock issuance immediately

9
drives down the stock price. Further, the price drop at the announcement is greater when the
information asymmetry is larger (Dierkens (1991)), and among firms followed by fewer security
analysts and with a greater dispersion of analysts’ earnings forecasts (D’Mello and Ferris (2000)).
More recently, researchers focus on the implications of the Myers and Majluf model on
capital structure decisions. Shyam-Sunder and Myers (1999) find that pecking order explains a
significant portion of capital structure decisions. However, Frank and Goyal (2003) argue that
pecking order has little predictive power and that prior results are mainly driven by large firms,
whereas Fama and French (2005) find evidence consistent with pecking order among small firms
only. In support of pecking order, Lemmon and Zender (2010) find that pecking order is a good
descriptor of financing behavior after taking financial distress into account (i.e., the debt capacity
of the firm) and Bharath, Pasquariello, and Wu (2009) find that firms facing low information
asymmetry account for the bulk of pecking order’s failings. Nonetheless, researchers again
disputed these claims. Specifically, Leary and Roberts (2010) suggest that firms do not follow
financing decisions consistent with pecking order behavior; they question whether information
asymmetry is a key driver of capital structure. In a recent study, Graham, Leary, and Roberts
(2015) find no evidence that information asymmetry has played a material role in explaining the
changes in capital structure over the last century. In sum, while the literature has existed for over
three decades, researchers are still debating whether and to what extent the pecking order theory
explains financing decisions.
An important challenge for empirical tests of pecking order lies in the difficulty of
obtaining exogenous variation in information asymmetry, which permits isolation of the effect of
information asymmetry on capital structure (Garmaise and Natividad (2010)). Bharath,
Pasquariello, and Wu (2009) attempt to address this issue by computing information asymmetry

10
measures derived from the market microstructure literature (e.g., the adverse selection component
of bid-ask spreads). While Bharath et al. make an important contribution, they are not able to
account for the fact that firms can endogenously choose (e.g., through disclosures) the degree of
information asymmetry between managers and investors. The purpose of our paper is to take
advantage of the introduction of a new financial reporting regulation that substantially altered the
information environment of firms affected by the new regime to revisit predictions from the
pecking order theory. In the next section, we discuss the new regulation and its appropriateness as
a setting for testing the pecking order theory, then we formulate our hypotheses.
2.2. ALTERNATIVE CAPITAL STRUCTURE THEORIES
Besides the pecking order theory, the finance literature offers other models of financing
decisions. Of these the most important one is the trade-off model (see e.g., Fama and French,
2002). In this model, firms identify their optimal leverage by weighing the costs and benefits of
an additional dollar of debt. The benefits of debt include, for example, the tax deductibility of
interest and the reduction of free cash flow problems. The costs of debt include potential
bankruptcy costs and agency conflicts between stockholders and bondholders. At the leverage
optimum, the benefit of the last dollar of debt just offsets the cost.
More recent theories include predictions about market timing and capital structure (Baker
and Wurgler, 2002). These theories suggest that firms are more likely to issue equity when their
market values are high, relative to book and past market values, and to repurchase equity when
their market values are low. As a consequence, current capital structure is strongly related to
historical market values. In a more recent development, Leary and Roberts (2005) suggest that
firms engage in a dynamic rebalancing of their capital structures while allowing for costly

11
adjustment. The argument is that the presence of adjustment costs has significant implications for
corporate financial policy and that firms actively rebalance their leverage within an optimal range.
While we cannot completely rule out that these alternative theories affect our results, we are
not aware of empirical evidence suggesting that the new regulation that we study (i.e., IFRS)
systematically affects determinants related to other theories (i.e., tax rates and/or financial distress
or market timing). Moreover, as we discuss in the research design section, we include controls for
variables related to the other theories and perform additional tests to closely link our results to
variation in information asymmetry.
2.3. THE ADOPTION OF FINANCIAL REPORTING REGULATION AS A SETTING FOR STUDYING PECKING ORDER
We use the adoption of IFRS as a regulatory financial reporting change aimed at improving
the information environment of the adopting firms. The introduction of IFRS for listed companies
around the world is one of the most significant regulatory changes in financial reporting in
accounting history. Since its establishment in 2001, over 100 countries have switched to IFRS
reporting.9
An emerging literature has studied the economic consequences around the adoption of
IFRS. As discussed in Leuz and Wysocki (2015) and De George, Li, and Shivakumar (2015), there
are arguments for and against IFRS, particularly with regard to whether IFRS would translate into
9 IFRS (formerly known as International Accounting Standards (IAS)) began as an attempt to harmonize accounting standards in the early 1970s. However, it wasn’t until 2001 that the International Accounting Standards Board (IASB) was established to develop International Financial Reporting Standards (IFRS). For a list of adopting countries, see http://www.iasplus.com/en/jurisdictions. Conceptually, IFRS involves replacing national accounting standards with a single set of rules that firms have to follow when preparing financial reports. Compared to previous national accounting standards in certain countries, IFRS adoption can lead to substantial increases in accounting disclosures (Bae et al. (2008)). For instance, under IFRS, firms operating in Greece were required to report related party transactions, discontinued operations, segment reporting, and cash flows statements (GAAP, 2001). This information can be valuable to external investors, both national and foreign, who are considering an investment in a Greek company.

12
material changes in financial reporting behavior and a reduction in information asymmetry.
Nonetheless, several authors investigated and documented capital market benefits around the
adoption of IFRS. Important to our hypotheses are studies that look at proxies for information
asymmetry. For example, Daske et al. (2008) find that IFRS is associated with higher stock market
liquidity (e.g., lower bid-ask spreads and trading costs) among investors. Brochet et al. (2012)
show that abnormal returns to insider purchases (a measure of information advantage by the
insider) decreased around the introduction of IFRS in the U.K. Tan et al. (2011) find that analysts’
forecast accuracy (an inverse measure of information uncertainty among market participants)
increased post IFRS. Hong et al. (2014) document a decrease in IPO underpricing and a relative
increase in IPO capital raised in foreign markets (vis-à-vis domestic markets) after IFRS adoption.
It is important to note that these findings do not imply that the changes in information
asymmetry are driven by IFRS per se. In particular, Christensen et al. (2013) show that the impact
of IFRS on information asymmetry depends on whether adopting countries also implemented
contemporaneous changes in enforcement around the new regime. While understanding the key
sources driving the changes in information asymmetry around IFRS is an important question in
the literature, we note that this distinction is not necessary to the development of our predictions.
Rather, the two key necessary features are that (i) information asymmetry influences financing
decisions, as laid out by the pecking order theory and (ii) that the new regulation changes the
information environment of the adopting firms. As a result, while we use IFRS as a proxy for the
new regulation, we refer to it broadly as encompassing the new set of standards and the supporting
infrastructure such as enforcement efforts to increase compliance with the new standards.
Finally before we proceed, we discuss two related literatures. First, while we focus on the
pecking order theory, we note that other theories also determine financing decisions. However,

13
there is no evidence that the new regulation systematically affects other traditional determinants
of capital structure decisions such as tax rates and/or financial distress. As a result, when using the
difference-in-difference research design described below, the implicit assumption is that these
other forces were not systematically affected by the new regulation (though we introduce a large
set of control variables and year fixed effects to further deal with time-varying forces). As a result,
our setting and research design mitigate the potential that confounding factors explain our results.
Second, our paper is broadly related to a literature that studies the financing consequences
of reforms. For instance, La Porta et al. (1998) and the subsequent research link creditor rights to
financial development by documenting a positive correlation between an index of creditor rights
and the size of credit markets.10 These findings support the view that ownership protection,
particularly in credit markets, fosters financial development by lowering the cost of credit. More
closely related to our paper, prior studies analyze the effects of reforms enhancing a country’s
financial integration on its firms’ capital budgeting and financing choices. For instance, Bekaert
and Harvey (2000), Henry (2000), and Kim and Singal (2000) show that market liberalization
reforms facilitate international capital flows into a country. Our study adds to this literature by
exploiting a reform in financial reporting regulation, an issue of frequent debate among regulators
but with limited empirical evidence on financing decisions.
2.4. HYPOTHESIS DEVELOPMENT
As detailed in Section 2.1, the key prediction of the pecking order theory is that information
asymmetry leads to adverse selection costs such that managers avoid raising external capital. To
the extent that financial reporting regulation can reduce information asymmetry between managers
10 See, e.g., Levine (1998, 1999), Beck, Demirguc-Kunt, and Levine (2004), Djankov, McLiesh, and Shleifer (2007), Visaria (2009), Haselmann, Pistor, and Vig (2010).

14
and investors, adverse selection costs will be reduced and we would expect that firms adopting the
new regulation will be more likely to raise external capital.
As discussed in the prior section, there are a few reasons why a reporting regulation, and
IFRS in particular, could reduce information asymmetry in the context of the pecking order theory.
First, compared to previous national accounting standards in certain countries, IFRS leads to
substantial increases in accounting disclosures (Bae, Tan, and Welker (2008)). Second, by
increasing mandated reporting, the new regulation can also alter voluntary disclosure choices made
by adopting firms. For instance, Li and Wang (2015) show that firms increased the issuance of
forward-looking disclosures such as management earnings forecasts around the adoption of the
new regime. Last, together with the adoption of IFRS, several countries increased the enforcement
of financial reporting rules to increase compliance with the new standards (Christensen et al.
(2013)).
To the extent that (i) the mandatorily reported additional information, (ii) the voluntarily
disclosed information, and/or (iii) the enhanced enforcement efforts improved the information set
produced by adopting firms, we would expect the new regulation to reduce information asymmetry
between the firm and investors; the predictions of the pecking order theory would then apply. Thus,
our main prediction is that the new regulation allows firms to increase their use of external
financing. Our first hypothesis is:
H1: Firms will rely more on external financing after the adoption of the new financial reporting regulation.
While we state Hypothesis 1 in alternate form, there are several reasons why the null
hypothesis might be descriptive. First, as discussed in Section 2.1, a large number of finance
studies challenge the importance of information asymmetry in explaining financing decisions.
Second, holding the finance debate aside, the cross-sectional variation in the economic

15
consequences around the adoption pose an empirical challenge since, for several countries, the
change in information asymmetry around the new regulation might be immaterial to financing
decisions. Last, as with any accounting standard, the new regime allows for substantial managerial
discretion in its implementation, which allows for the possibility that firms might adopt the new
standards without a material effect on its reporting practices (Daske et al. (2013)).
2.4.1. Cross-Sectional Predictions
Our second hypothesis exploits cross-sectional variation in information asymmetry. Key
to Myers and Majluf’s (1984) prediction is the existence of information asymmetry between
insiders and outsiders about growth opportunities and assets in place. As a result, we would expect
that the new regulation should benefit more financially constrained firms which usually have high
levels of information asymmetry ex ante (Fazzari et al. (1988); Myers (1984)). In addition, because
the new regulation can have heterogeneous effects on information asymmetry across firms (Daske
et al. (2013)), only firms experiencing a reduction in information asymmetry would actually
benefit from lower adverse selection costs. We formalize these predictions as follows:
H2: Firms with higher ex-ante levels of financial constraints and/or ex-post changes in information asymmetry will rely more on external financing after the adoption of the new financial reporting regulation.
We next exploit cross-sectional predictions that evolved from the original Myers and Maluf
(1984) framework. Specifically, our third hypothesis studies capital structure conditional on debt
capacity. Myers (1984) labels this conditional prediction as the ‘modified pecking order’ theory,
which has been recently studied in Lemmon and Zender (2010). The key idea is that when firms
approach their debt capacity, they no longer follow a strict pecking order. This occurs because
issuing more debt leads to disproportionately higher financing costs due to greater financial
distress. As a result, these firms might follow a ‘modified pecking order’ in which they do not

16
clearly prefer debt over equity when relying on external capital. This choice allows them to either
maintain their capital structure (by issuing both debt and equity) or move it towards healthier levels
of financial distress (by preferring equity over debt). On the other hand, firms with a high debt
capacity are those that can raise debt as their primary external financing choice and increase their
leverage.
In our setting, the modified pecking order theory predicts that the effect on leverage around
the new regulation depends on the firms’ ex-ante debt capacity. We formalize this prediction as
follows:
H3: Firms with a high ex-ante debt capacity will increase their leverage more than firms with a low ex-ante debt capacity after the adoption of the new financial reporting regulation.
3. Research Design
3.1. MAIN REGRESSION SPECIFICATION – HYPOTHESIS 1
To test Hypothesis 1, we model the change in the probability of a firm raising external
financing around the adoption of the new regulation. Specifically, we estimate the following linear
probability model with a DID specification:11
, (1)
where Ext_Fin equals one if a firm issues external financing (debt or equity) above 5% of the
beginning period assets in a given year, and zero otherwise.12 is one of two alternative sets of
11 Consistent with the suggestion by Angrist and Pischke (2009), throughout the paper we use a linear probability model, as opposed to a non-linear limited dependent variable model. This allows for the use of a larger set of fixed effects as well as an easier interpretation of the coefficients. We obtain similar results when using a Probit model. 12 The 5% cutoff follows Leary and Roberts (2010) and is intended to reduce measurement error from confounding transactions (e.g., stock option exercises). In untabulated analyses, we use a 2% cutoff and find similar inferences.

17
fixed effects. The first set of fixed effects includes country, industry, and year fixed effects.
However, to mitigate concerns about firm-specific time-invariant omitted variables, we also
estimate a more stringent specification that includes firm and year fixed effects. Adopter is an
indicator variable equal to one if the firm belongs to a country that adopted the new regulation.
Due to the inclusion of fixed effects (i.e., either country or firm fixed effects), the main effect for
Adopter is subsumed from the model. Post is an indicator variable for the years following the
adoption of the new regime. Despite the year fixed effects, we still include the main effect for Post
because our treatment sample consists of different adoption dates. For example, in 2005 Post=1
for December adopters in Germany, whereas Post=0 for non-December adopters in Germany or
later adopters (e.g., Turkey). Controlm is a set of control variables (we describe all these variables
below and in the appendix).
In Eq. 1, 1 is the DID estimator that compares the change in external financing for
treatment firms vis-à-vis benchmark firms after the adoption of the new regulation. In other words,
the interaction terms Post x Adopter (i.e., 1) allow us to identify the effect of mandatorily adopting
the new regulation relative to a propensity-matched control firm (described below). We cluster our
standard errors at the country level because our identification strategy relies on country-level
adoptions of the new regime.13
We conduct our tests using a sample of treatment firms from countries that adopted the
new regulation between 2003 and 2012 with non-missing data for the year before and at least one
year after the adoption and a propensity-matched control sample.14 The benefit to using a
13 We do not cluster at the year level because for countries that adopted IFRS in later years we have a short time-series (Petersen (2009), Gow et al. (2010)). 14 This sample selection is important for the DID research design and for us to test the cross-sectional predictions in Hypotheses 2 and 3. To enable comparison with previous IFRS studies (e.g., Daske et al. (2008)) and address concerns related to sample attrition, we also present results for an Extended sample in Section 4.5. Our findings are similar for

18
propensity-matched sample is that it allows us to compare the change in financing behavior for the
treatment firms vis-à-vis the change for the control firms around the new regime.15 Moreover,
given that our sample consists of firms with different adoption dates, we can better control for
concurrent changes around a particular adoption period (Leuz and Wysocki (2015)).
Our propensity-matched control sample is based on a matching procedure discussed in
Rosenbaum and Rubin (1983). This methodology allows us to mitigate potential concerns related
to endogeneity and non-linear relationships in our data (Roberts and Whited (2011)). In particular,
we construct a propensity-matched control sample that has the closest probability of raising
external capital to each treatment firm in the pre-adoption year. Specifically, we use a 1-to-1
nearest neighborhood matching procedure without replacement to identify a control firm that has
the closest probability of issuing external financing in the year prior to the adoption of the new
regulation based on the following variables: Zscore, Tangibility, Q, Profitability, Log(Sales),
Cash, Returns, and Deficit (we define these variables in Section 3.3 and in the appendix).
3.2. CROSS-SECTIONAL TESTS
3.2.1. Partitioning on Information Asymmetry – Hypothesis 2
Hypothesis 2 predicts that firms with higher ex-ante levels of financial constraints and/or ex-
post changes in information asymmetry will rely more on external financing in the post adoption
period. To test this prediction we exploit within-country variation in financial constraints and
information asymmetry within our treatment sample. In particular, we include only the treatment
sample and estimate a within-sample DID specification that explicitly controls for country-effects
this larger sample (Section 4.5) as well as a smaller sample with constant firms throughout the period (untabulated), suggesting that changes in sample composition are not driving our results. 15 Note that doing so means that if a treatment firm adopts IFRS in (say) 2008, we assign Post=1 starting in 2008 for both the treatment firm as well as its respective propensity-matched control firm.

19
by comparing firms with high vs. low financial constraints and information asymmetry within each
treatment country. Specifically we estimate the following models:
, (2a)
, (2b)
where Partition is one of our partitioning variables based on ex-ante levels of financial constraints
and information asymmetry (described below) and the other variables are the same as in model
(1). and are firm and year fixed effects. We estimate our specification using two slightly
different models. In our first model (i.e., 2a), we include a dummy for years after the adoption (i.e.,
); in the second (i.e., 2b), we drop this dummy and include an interaction between Post and
the country fixed effect . . , . An important feature of the second model is that it
allows us to estimate within-country differences in our firm-level partitions, while the first model
allows for an easier comparison of the effects across Partition groups (e.g., firms with high vs. low
financial constraints and information asymmetry).
We exploit two cross-sectional partitions. We first partition our sample on the ex-ante level
of financial constraints. As discussed in Myers (1984), the pecking order theory’s predictions
depend on the level of information asymmetry about growth opportunities and assets in place. To
proxy for ex-ante information asymmetry, we calculate the firm’s ex-ante level of financial
constraints. The idea being that financially constrained firms are more likely to suffer from
information problems (Fazzari et al. (1988)). To measure financial constraints we use the Hadlock
20
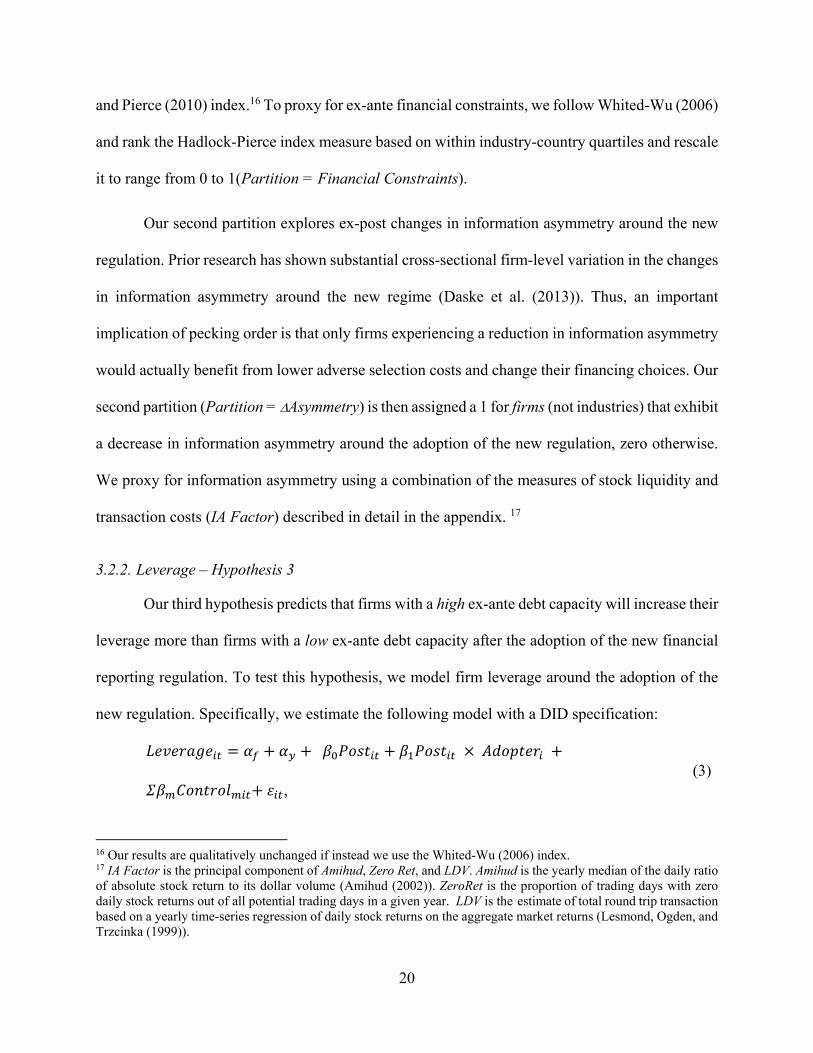
and Pierce (2010) index.16 To proxy for ex-ante financial constraints, we follow Whited-Wu (2006)
and rank the Hadlock-Pierce index measure based on within industry-country quartiles and rescale
it to range from 0 to 1(Partition = Financial Constraints).
Our second partition explores ex-post changes in information asymmetry around the new
regulation. Prior research has shown substantial cross-sectional firm-level variation in the changes
in information asymmetry around the new regime (Daske et al. (2013)). Thus, an important
implication of pecking order is that only firms experiencing a reduction in information asymmetry
would actually benefit from lower adverse selection costs and change their financing choices. Our
second partition (Partition = Asymmetry) is then assigned a 1 for firms (not industries) that exhibit
a decrease in information asymmetry around the adoption of the new regulation, zero otherwise.
We proxy for information asymmetry using a combination of the measures of stock liquidity and
transaction costs (IA Factor) described in detail in the appendix. 17
3.2.2. Leverage – Hypothesis 3
Our third hypothesis predicts that firms with a high ex-ante debt capacity will increase their
leverage more than firms with a low ex-ante debt capacity after the adoption of the new financial
reporting regulation. To test this hypothesis, we model firm leverage around the adoption of the
new regulation. Specifically, we estimate the following model with a DID specification:
, (3)
16 Our results are qualitatively unchanged if instead we use the Whited-Wu (2006) index. 17 IA Factor is the principal component of Amihud, Zero Ret, and LDV. Amihud is the yearly median of the daily ratio of absolute stock return to its dollar volume (Amihud (2002)). ZeroRet is the proportion of trading days with zero daily stock returns out of all potential trading days in a given year. LDV is the estimate of total round trip transaction based on a yearly time-series regression of daily stock returns on the aggregate market returns (Lesmond, Ogden, and Trzcinka (1999)).

21
where Leverage equals total debt divided by the market value of assets.18 and are firm and
year fixed effects. As before, Adopter is an indicator variable equal to one if the firm belongs to a
country that adopted the new regulation. Due to the inclusion of firm fixed effects, the main effect
for Adopter is subsumed from the model. Post is an indicator variable for the years following the
adoption of the new regime. Despite the year fixed effects, we still include the main effect for Post
because, as explained in section 3.1., our treatment sample consists of different adoption dates.
Controlm is a set of control variables (we describe all these variables below and in the appendix).
Similar to equation (1), we estimate equation (3) using a DID methodology where we benchmark
our treatment sample with the propensity-score-matched sample (described above – Section 3.1.).
We then condition our sample on two proxies for a firm’s existing debt capacity at the time of the
adoption of the new regulation. First, we use book leverage, defined as the ratio of total debt to
total assets. Second, we use Zscore as defined below and in the appendix. In each case, we sort
firms into four groups within each country-industry based on their leverage ratios and Zscore in
the year before the adoption of the new regime, respectively.19 The intuition behind both proxies
is that when firms have high leverage or low Zscore (relative to firms in the same industry-
country), they can no longer issue “safe” debt without a substantial increase in default risk.
Hypothesis 3 predicts that that firms with a high ex-ante debt capacity will increase their leverage
more than firms with a low ex-ante debt capacity after the adoption of the new financial reporting
regulation.
18 Our results are similar when using book leverage as our dependent variable. 19 In robustness tests, we also use firms’ BSM score (i.e., Black, Scholes, Merton probabilities of default; see Hillegeist et al., 2004) as the partitioning variable. Our results are unchanged. However, our sample is smaller because not all firms have sufficient data to calculate their BSM score.

22
3.3. VARIABLE DEFINITIONS
3.3.1. External Financing
Our main dependent variable, Ext_Fin, equals one if a firm issues debt or equity above 5%
of the beginning period assets in a given year, and zero otherwise. We measure debt issuances
(Debt) as the change in long-term debt normalized by lagged total assets. By focusing on long-
term debt, we avoid including other liabilities (e.g., pensions) that could be directly affected by
the adoption of IFRS.20,21
As for equity issuances, we follow Leary and Roberts (2010) and measure equity issuances
(Equity) from changes in the market value of equity. This approach avoids using balance sheet
data, which could be mechanically affected by changes in accounting methods (e.g., due to a higher
use of fair value estimates) following IFRS.22 To obtain equity issuances, we first calculate the
daily changes in equity as follows:
∆ 1 , (4)
where Equity Dailyt is the daily change in equity for day t, MVt is the market value of equity at
day t and rett is the daily split adjusted price return at day t, unadjusted for dividends.23 We then
20 A concern with using long-term debt is that it also captures private debt, which is arguably less sensitive to information frictions. Because we cannot observe public debt issuances for most of our sample, as discussed in footnote 6, in untabulated analysis we find that our results are bigger among firms without collateralizable assets, which rely more on public financing. 21 We compute debt issuances using changes in long-term debt. We do not include the current portion of long-term debt because it is missing for a large fraction of firms. However, in untabulated robustness tests, we find that our results are similar if we include the current portion of long-term debt in our measure if available (and assign it equal to zero otherwise). 22 Leary and Roberts (2010) estimate equity issuances either via changes in market capitalization or directly from statements of cash flow. We use the first method because we are not able to compute equity issuances from cash flow statements, as this information is not widely available internationally, especially in the pre-Adoption period. However, our results are similar if we measure the change in equity from changes in the balance sheet. 23 Adjusting for dividends could mask an equity issuance if both a dividend payment and an equity issuance happen on the same day. For example, suppose a firm has 10 shares outstanding at a price of $100 (MVt-1 = $1,000). The firm pays $10 of dividend per share (for simplicity assume the price decreases to $90) and immediately issues $90 of equity (i.e., it issues one more share). Then, by using the return without the dividend, we have MVt-1=1,000, MVt=990,

23
obtain equity issuances by adding the daily changes in equity for the fiscal year normalized by
lagged total assets.
3.3.2. Control Variables
We include a number of controls from the previous literature (Rajan and Zingales (1995),
Bharath et al. (2009), Leary and Roberts (2010)). Zscore proxies for the cost of financial distress
and is based on the measure proposed by Altman (1969). Firms with a lower Zscore are more
likely to be distressed.24 Tangibility corresponds to property, plant, and equipment (PP&E)
normalized by total assets. Q corresponds to the ratio of the market value of assets to total assets.
The market value of assets is defined as the book value of total assets plus market equity minus
common equity. Market equity is defined as shares outstanding times the fiscal year closing price.
Q is a proxy for firms’ investment opportunities. Profitability corresponds to operating income
normalized by total assets. Log(Sales) corresponds to the logarithm of total sales.
We also control for the amount of financing needed by the firm. Deficit is defined as the
sum of dividends, capital expenditures, and changes in working capital minus operating cash flow,
deflated by lagged total assets. Because Deficit focuses on cash flow measures (as opposed to the
stock of cash), we also control for the amount of cash available at the beginning of the year (Cash)
defined as cash over total assets. To control for the possibility that firms may time the market when
issuing external financing (Baker and Wurgler (2002)), we control for stock market returns.
Returns is defined as the one year buy-and-hold return for the corresponding fiscal year. All the
(1+rett)=0.9 resulting in a ∆Equity Dailyt =990-$1,000x0.9=$90. Instead, if we use the return adjusted for the dividend, we would obtain ∆Equity Dailyt =990-$1,000x1=-$10 and would have treated this firm as not issuing equity. That said, in untabulated tests, we find that our result are robust to adjusting for dividends. 24 We use a modified measure of Zscore due to data availability, which excludes retained earnings. Our results are robust when using the subsample of firms for which we have retained earnings available. For this sample the mean Zscore is 3.73.

24
variables (except financing deficit and returns, which are concurrent) are measured at the
beginning of the fiscal year.25
In addition, we control for a set of macroeconomic variables capturing macroeconomic
changes in the supply of capital such as bilateral trade and interest rates. This is important because
our hypothesis attempts to isolate the effect of financial reporting regulation, not changes in the
supply of capital affecting financing decisions. Trade is defined as the ratio of the sum of exports
and imports to a country’s GDP. Bekaert and Harvey (2000) show that market liberalization has
substantially altered the supply of cross-border capital. We also control for interest rates (Tbill)
and GDP growth (GDP). Tbill is a country’s three month Treasury bill rate. GDP is the
percentage change of real gross domestic product.26
4. Results
4.1. SAMPLE AND DESCRIPTIVE STATISTICS
Our sample consists of firms from countries that adopted IFRS between 2003 and 2012
and a propensity-matched control sample. We exclude firms that voluntarily adopted the new
regulation before the mandate and that are cross-listed so we can focus on first-time mandatory
adopters of the new regulation. A country is included if it has an average of at least 10 observations
per year. We exclude financial firms and utilities (ICB codes 7000 and 8000). To mitigate the
influence of small firms, we exclude firms with a market value of less than US$1 million and with
negative equity. We winsorize all continuous variables at the 1% and 99% levels to limit the
25 Financing deficit and returns are measured concurrently to capture firms’ current capital needs and market timing opportunities, respectively. 26 To address concerns that the IFRS adoption affected the measurement of the variables used in the study, we also conducted the following (untabulated) analyses. First, we include an interaction term between the Post indicator and each control variable in the model. Second, we use the firm’s assets in the pre-Adoption period to scale our external financing variable. Our inferences are unchanged from the ones presented in the paper.
25
influence of outliers. Each firm is required to have available price data from Datastream and the
necessary financial accounting data from Worldscope. Following Daske et al. (2008), we assign
firms from countries that adopted IFRS in 2005 but that have a non-December fiscal year end as
adopting IFRS in 2006.27 Finally, we exclude the specific year of adoption to avoid the influence
of transitional errors (Loyeung et al. (2011)), and limit the pre- and post-adoption period to a
maximum of four years to avoid confounding effects.
Table 1, Panel A presents descriptive statistics for the countries in our treatment sample.
For each country, the table includes the number of firms, the number of firm-years; the number of
firm-years pre and post adoption; IFRS adoption dates; and information about institutional features
such as whether the country belongs to one of the high enforcement countries, following
Christensen et al. (2013). The total sample consists of a set of 76,661 firm-year observations from
41 countries, with 38,486 firm-year observations from 34 adopting countries (Panel A) and a
matched sample of 38,175 firm-year observations from 7 countries that did not adopt the new
regime (Panel B). The treatment sample includes developed economies (e.g., Australia, France,
Germany, the U.K., and Singapore) as well as growing economies (e.g., Brazil, China, and Hong
Kong). As for adoption dates, the treatment sample consists of firms from Singapore that adopted
the new regulation in 2003, from 21 countries that adopted in 2005, and from 12 countries that
adopted the new regime after 2005 (e.g., Brazil, Canada, China, Russian Federation, and South
Korea, among others). The control sample is composed of developed economies (e.g., the United
States and Japan) as well as developing economies (e.g., India, Malaysia, and Vietnam).
27 For example, a firm with a June fiscal year end in Germany did not have to comply with the new rule in June 2005 because the rule was applicable to fiscal years starting after January 1 2005. Thus, the first set of financial statements required to follow IFRS is the one ending in June 2006. We exploit this staggered adoption in Section 4.2.2.

26
Table 2 provides descriptive statistics. Panel A displays the characteristics of firms in our
sample. On average, 27% of firms raise external financing each year. This number is broadly
consistent with Leary and Roberts (2010), who find that 32.5% of firms raise external capital.28
Firms’ mean leverage ratio is 22.22%. Moreover, around 30% of their assets are tangible, a value
very similar to what Leary and Roberts (2010) report. However, the cash holdings amount to 16%
of total assets is higher than what Leary and Roberts (2010) obtain.29 Finally, the mean Zscore is
1.30 and the mean financing deficit equals 4% of assets.
Panel B presents descriptive statistics for the treatment and control firms in the matching
year (i.e., the year before the adoption of the new regime for each respective treatment firm). 30%
of treatment firms raised external capital in the matching year, compared to 27% for the control
firms. Next, we find that treatment firms have slightly lower leverage ratios than control firms
(21.42% vs. 22.53%). However, these differences are not statistically significant. Further, the
treatment and control samples are similar along all other dimensions. For example, they have
similar mean values for Zscore, Tangibility, and Deficit. Overall, Panel B suggests that the
treatment and control firms are similar along the firms characteristics associated with external
financing.
4.2. MAIN RESULTS – HYPOTHESIS 1
Table 3 reports the results for Hypothesis 1. Columns one and two present the results with
and without firm fixed effects, respectively. The coefficient of interest is Post x Adopter, which is
statistically significant in both specifications. In economic terms, the estimated coefficient of 0.038
28 More specifically, Leary and Roberts (2010) use a large sample of Compustat firms during the period 1980-2005. They find the following decomposition of financing decisions: 67.5% internal, 22.6% debt, 7.1% equity, and 2.8% dual issuances (i.e., debt and equity). Our sample has the following decomposition of financing decisions: 73.3%, internal, 13.2% debt, 10.3% equity, and 3.2% dual issuance. 29 Leary and Roberts (2010) report averages for different sample partitions. Their tangible assets range between 0.27 and 0.31, whereas cash holdings range between 0.04 and 0.07 relative to book assets.

27
on Post x Adopter in model 2 implies that the probability of issuing external financing increases
by 3.8% for the mandatory adopters relative to the benchmark sample after the new regime. This
increase represents a relative increase of 12.6% when compared to the 30% probability of raising
external financing, as shown in Table 2, Panel B.30
Overall, the results in Table 3 are consistent with Hypothesis 1. Before we proceed to
Hypotheses 2 and 3, we present two additional tests to mitigate a concern that confounding factors,
unrelated to financial reporting reforms, could drive the findings in our main hypothesis.
4.2.1. Time Trend Driven by a Confounding Factor
A potential concern is that our findings in Table 3 could capture an omitted correlated factor
(e.g., a gradual change towards market integration) instead of the adoption of the new accounting
regime. We follow Bertrand and Mullainathan (2003) and allow for the adoption of the regulation
having a non-linear (yearly) effect around the mandate. The idea is that, if our results reflect a
gradual change towards market integration, we would expect external financing to similarly reflect
a gradual change, as opposed to a discontinuity around adoption.
To conduct this test, we align the data in event time and replace the Adopter dummy variable
with separate interaction variables by year. In particular, we include six interactions (Post (-2) x
Adopter, Post (-1) x Adopter, Post (+1) x Adopter, Post (+2) x Adopter, Post (+3) xAdopter, and
Post (+4) x Adopter), thereby isolating the effect of the two years before and the four years after
the mandate (note that years -4 and -3 serve as the benchmark).
Table 4, Column 1 presents these results. We find little evidence of changes in external
financing decisions in the years prior to the new regulation. Rather, we observe that the probability
30 When we exclude year fixed effects from our analysis (untabulated) the Post coefficient is -0.009 (vs. -0.008 when including firm fixed effects).
28
of raising external financing increases and becomes significant up to three years after the new
regime.31,32
4.2.2. Staggered Adoption
Our second test follows Daske et al. (2008) and Christensen et al. (2013) and takes advantage
of the new regime’s staggered adoption. For most of the countries in our sample, IFRS applies to
fiscal years starting after January 1, 2005. Thus, firms with a fiscal year ending on December 31,
2005 (i.e., starting on January 1 and ending on December 31) were required to adopt the regulation
in 2005; the remaining firms adopted in 2006. This staggered adoption mitigates endogeneity
concerns to the extent that the specific cut-off date (i.e., December 2005) is decided at the country
level and firms’ fiscal year ends are largely pre-determined. Further, this staggered adoption driven
by different fiscal year end periods helps mitigate the confounding effects of concurrent changes
that are unrelated to financial reporting, such as the Market Abuse Directive (MAD) studied in
Christensen et al. (2015).
To conduct this test, we focus on countries that adopted the new regulation in 2005 to better
align the observations in calendar time. To mitigate confounding effects, for this test we use a
subsample of firms whose adoption dates are at least six months apart (i.e., we compare December
2005 adopters to firms that adopted the new regime during June to November of 2006). We are
able to do that because fiscal year ends (and consequently the adoption date) range from December
2005 to November 2006. We include the corresponding year zero (i.e., 2005 for firms with a
December fiscal year end, 2006 otherwise) and require firms to have available observations from
31 We still find a 3.8% increase in the probability of raising external financing in year +4, which is the same as the average effect documented in Table 3. However, as shown in Table 4, this effect is statistically insignificant. 32 One alternative explanation for our results is that information asymmetry rises due to the uncertainty surrounding how IFRS will affect the financial statements. However, our evidence of insignificant abnormal financing activity in the couple of years leading up to IFRS adoption, and then of a relatively sustained increase after IFRS adoption, mitigates this concern.

29
2002 to 2008. We replace the Adopter dummy variable with six separate dummy variables
(Year03, Year04, Year05, Year06, Year07, and Year08 – we do not include a dummy for year 2002
because we use it as the benchmark) and then re-estimate the regressions in Table 3 using this non-
linear specification separately for 2005 and 2006 adopters. Our results suggest that external
financing only increased after the adoption of the new standard.
Table 4, Column 2 presents the results for 2005 adopters, whereas Column 3 presents the
model for 2006 adopters; Column 4 tests the difference between these two groups. Consistent
with the staggered effect of the reform, we find that 2005 adopters increased their external
financing starting in 2005 (peaking in 2007-2008), whereas 2006 adopters increased their external
financing starting in 2007 (peaking in 2008).33 In other words, we show that 2005 and 2006
adopters have similar financing patterns during most of the sample period, except during the
transition period of 2006 and 2007.34
Overall, the results in Table 4 mitigate the concern that an omitted correlated variable
unrelated to financial reporting regulation drives our findings.
4.3. CROSS-SECTIONAL TESTS – HYPOTHESES 2 AND 3
4.3.1. Partitions by Information Asymmetry – Hypothesis 2
In this section, we exploit within-country variation for the treatment firms with respect to
ex-ante levels financial constraints and ex-post changes in information asymmetry. Table 5
33 Our finding that 2005 adopters had already increased their external financing in 2005 is arguably puzzling, given the adjustment costs to financing (Leary and Roberts (2005)). We note, however, that this evidence is consistent with the findings in Daske et al. (2008), who document a decrease in firms’ cost of capital and an increase in equity valuations prior to the official adoption date. In other words, the findings in Daske et al. (2008) allow for the possibility that firms can tap into external financing at higher valuations even before the new regime. 34 In additional analyses, we pool 2005 and 2006 adopters into a single model and include indicator variables for Post x Country fixed effect. Doing so permits the specification to capture the yearly within-country difference between 2005 and 2006 adopters. We find the same inferences as in Table 4. Specifically, there is no statistical difference between 2005 and 2006 adopters in all years, except for 2006 and 2007 (t-statistics of 2.01 and 3.33 for these years, respectively).

30
presents our results. Column 1 shows results for our treatment sample with a simple indicator
variable for the Post period. We find that the coefficient on Post is statistically significant
suggesting that on average adopters of the new regulation increase access to external financing by
2.8% after the adoption. Columns 2 and 3 present the results for ex-ante levels of financial
constraints (i.e., Financial Constraints). In Column 2, we find that the coefficient on Post is
statistically insignificant, whereas the coefficient on Post x Ind Asymmetry equals 0.044 and is
statistically significant. This finding suggests that our results are driven by firms with high ex-ante
levels of financial constraints, and that unconstrained firms did not alter their external financing
decisions around the new regime. Column 3 presents similar results for the specification that
includes an interaction between Post and the country fixed effects . . , . This result
suggests that our findings are not confounded by cross-country variation, and rather driven by
within-country variation in information asymmetry.
Columns 4 and 5 present the results for ex-post changes in information asymmetry. The
results are similar to the results in Columns 1 and 2. Specifically, in Column 4 we find that the
coefficient on Post is statistically insignificant, whereas the coefficient on Post x Asymmetry
equals 0.05. These findings suggest that our results are driven by firms with decreases in
information asymmetry. Finally, Column 5 presents similar results for the specification that
includes an interaction between Post and the country fixed effect . . , .
Overall, the results in Table 5 suggest that firms with high ex-ante levels of financial
constraints (information asymmetry) and ex-post decreases in information asymmetry were the
ones whose financing decisions were most affected by the adoption of the new regime. These
findings are consistent with arguments in Myers (1984) about the types of firms that are more
likely to benefit from a reduction in adverse selection costs.

31
4.3.2. Leverage – Hypothesis 3
Table 6 presents our results for Hypothesis 3. We measure leverage as the percentage of
total debt to the market value of assets and use it as our dependent variable.35 Model (1) presents
the leverage results for the full sample. We find that the average adopter increases leverage post
adoption of the new regime. However, this result is not statistically significant. Next, we estimate
separate leverage regressions for firms in the high and low debt capacity groups. The high (low)
debt capacity firms are those that are in the bottom (top) quartile of book leverage pre-adoption of
the new regime. Model (2) presents results for firms with a high debt capacity. We find that
adopters with a high debt capacity increase leverage by 3.3%, which represents a 15.4% increase
in leverage as compared to the mean value for treatment firms before the adoption of 21.4%. Model
(3) presents the results for firms with a low debt capacity. We find that these firms decrease their
leverage, although the coefficient is not statistically significant. However, we find that the
difference between the coefficients of models (2) and (3) is significant at the 1% level.
Models (4) and (5) present our second set of findings. Here we classify firms that have high
(low) debt capacity as those that are in the top (bottom) quartile of Zscore pre-adoption of the new
regime. Consistent with our previous results, we find that firms with ex-ante high debt capacity
significantly increase their leverage. In particular, the coefficient on Post x Adopter of 2.258
suggests that adopters with high debt capacity increase their leverage by 2.3 percentage points
around the new regime (vis-à-vis the control sample). For firms with a low debt capacity, we find
no statistically significant result. Finally, we find that the difference in coefficients between the
high and low debt capacity groups is significant at the 10% level.
35 We use market leverage as our dependent variable to mitigate measurement errors due to the adoption of IFRS on the measurement of assets. The results are robust to using book leverage as an alternative dependent variable.

32
Overall, Table 6 presents results in support of Hypothesis 3. Specifically, we find that
adopters with available debt capacity increase leverage around the adoption, whereas adopters with
a low debt capacity maintain their leverage. This result suggests that firms make different external
financing choices around the new regulation depending on their ex-ante debt capacity.
4.4. SENSITIVITY ANALYSES
4.4.1. INVESTMENT
In this section, we test the implication of our prior results for investment policies. A central
argument in the pecking order theory is that information asymmetry leads firms to pass up on
profitable investment opportunities. Out findings above show that the new regulation increased
external financing among treatment firms, in particular, financially constrained firms and firms
that experienced a reduction in information asymmetry after the new regime. We then predict that
these firms should be able to use additional funds to increase investment after the new regulation.
Following prior research (e.g., Almeida and Campello (2007)), we proxy for investment using
capital expenditures deflated by beginning period PPE. We then estimate the following models:
, (5a)
, (5b)
where Partition is either Financial Constraints or Asymmetry as described in Section 3.2.1.
Moreover, consistent with prior investment research (e.g., Fazzari et al. (1988), Almeida and
Campello (2007)) we include controls for investment opportunities (Q) and cash flows (Cash
Flow). and are firm and year fixed effects.

33
As in the models 2a and 2b discussed before, we estimate our specification using two
different models. In our first model (i.e., 5a), we include a dummy for years after the adoption (i.e.,
); in the second (i.e., 5b), we drop this dummy and include an interaction between Post and
the country fixed effect . . , . An important feature of the second model is that it
allows us to estimate within-country differences in our firm-level partitions, while the first model
allows for an easier comparison of the effects across Partition groups (e.g., firms with high vs. low
information asymmetry).
Table 7 presents our results. Column 1 shows results without including the interaction
terms. We find that the coefficient on Post is statistically significant. Adopters of the new
regulation increase capital expenditures by 10% after the adoption.36 Columns 2 and 3 present the
results for ex-ante levels of financial constraints (i.e., Financial Constraints). In Column 2, we
find that the coefficient on Post equals 0.10 whereas the coefficient on Post x Financial
Constraints equals 0.396 (both statistically significant). This finding suggests that the increase in
investment is four times stronger for firms with high ex-ante levels of financial constraints.
Column 3 presents similar results for the specification that includes an interaction between Post
and the country fixed effect . . , . This result suggests that our findings are not
confounded by cross-country variation, and rather driven by within-country variation in financial
constraints. Columns 4 and 5 present the results for ex-post changes in information asymmetry.
The results are similar to the results in Columns 1 and 2. Specifically, in Column 4 we find that
the coefficient on Post equals 0.165, whereas the coefficient on Post x Asymmetry equals 0.201.
These findings suggest that our results are stronger for firms with decreases in information
36 The coefficient on PostxAdopter is positive but not statistically significant when we perform a DID specification.

34
asymmetry. Finally, Column 5 presents similar results for the specification that includes an
interaction between Post and the country fixed effect . . , .
4.4.2. SUB-SAMPLE ANALYSES
In our main tests, we focus on the new financial reporting regulation as a whole without
attempting to isolate its different aspects. In this section, we exploit a number of sub-sample
analyses to assess the robustness of our results. First, we focus on (i) the change in enforcement
concurrent with IFRS adoption as suggested by Christensen et al. (2013). These authors find that
mandatory IFRS reporting had a larger impact on liquidity in five E.U. countries that concurrently
made substantive changes in reporting enforcement (Finland, Germany, Netherlands, Norway, and
the U.K.).37 Second, we partition the sample on (ii) whether a firm is an E.U. vs. non-E.U. adopter,
and (iii) whether the firm is a 2005 vs. non-2005 adopter to assess confounding effects specific to
the EU or around 2005.
To test our cross-country partitions, we expand our main specification to allow for
differential effects across samples. We estimate the following model:
, (5)
Table 8, Column 1 presents our results for the enforcement partition. We find that firms in
both subsamples show an increase in external financing after the new regulation. Consistent with
Christensen et al. (2013) we find that firms in countries with high enforcement (CHL) have larger
coefficients, consistent with firms from countries with stronger institutional features experiencing
bigger changes in the likelihood of issuing external financing. However, the coefficient for the
37 Our sample includes countries that adopted IFRS post 2005 and not included in Christensen et al. (2013). The results are robust when we perform this test including only the countries included in their sample (untabulated).

35
OTHER partition of 3% is also statistically significant and of similar magnitude than our main
results in Table 3. Columns 2 and 3 present our results for the next two partitions. First, we find
that both EU and Non-EU firms experience increases in external financing. The magnitude of the
coefficients is similar across partitions. Second, we find that both 2005 adopters and Non-2005
adopters experience increases in external financing, although this results is only significant for the
2005 adopters. However, the economic magnitude of the coefficients is similar and the difference
between both groups is not statistically significant. Overall, these findings mitigate a concern that
an omitted confounding factor around the adoption of the new regulation by E.U. countries could
be driving our results.
5. Conclusion
We study the influence of a major reform in financial reporting regulation – the adoption
of the International Financial Reporting Standards (IFRS) – on financing decisions. Across a
battery of tests, we document an increase in the issuance of external financing around the adoption
of the new regulation. Further, firms make different leverage choices (i.e., debt vs. equity) around
the new regime depending on their ex-ante debt capacity, and use their access to external financing
to rebalance their capital structure. Our results are accentuated across firms facing higher adverse
selection costs and in countries with stronger institutions. Finally, we find evidence consistent with
firms using the access to external financing to increase investment. Our findings not only highlight
the importance of financial reporting regulation in explaining financing and investing policies, but
also provide insights into which firms are more likely to benefit from such regulation.
Our study complements the findings in three important literatures. First, our study
contributes to the international literature that studies the role of regulation on financing and capital
structure decisions. Our results inform academics and regulators interested in the impact of

36
regulatory reforms on financing decisions around the world. Second, we contribute to the literature
on the economic consequences around IFRS. Our study helps our understanding of the potential
impact of financial reporting reforms on the spectrum of financing and investing choices. Last,
we contribute to the debate about the relevance of the pecking order theory developed by Myers
and Majluf (1984). We use the new financial reporting regulation as a setting with a regulatory
change in the information environment of complying firms and show that the changes in financing
patterns for these firms are consistent with predictions from the pecking order theory.

37
References
Almeida, H., and M. Campello. 2007. Financial Constraints, Asset Tangibility, and Corporate Investment. Review of Financial Studies 20, 1429–60.
Amihud, Y. 2002. Illiquidity and stock returns: cross-section and time-series effects. Journal of Financial Markets 5 (1): 31–56.
Angrist, J. D., and J.-S. Pischke. 2009. Mostly Harmless Econometrics: An Empiricist’s Companion. Princeton University Press.
Asquith, P., and D. W. Mullins Jr. 1986. Equity issues and offering dilution. Journal of Financial Economics 15 (1–2): 61–89.
Bae, K., H. Tan, and M. Welker. 2008. International GAAP Differences: The Impact on Foreign Analysts. The Accounting Review 83 (3): 593–628.
Baker, M., and J. Wurgler. 2002. Market Timing and Capital Structure. The Journal of Finance 57 (1): 1–32.
Ball, R., X. Li, and L. Shivakumar. 2015. Contractibility and Transparency of Financial Statement Information Prepared Under IFRS: Evidence from Debt Contracts Around IFRS Adoption. Journal of Accounting Research 53 (5): 915–963.
Barth, M. E., and D. Israeli. 2013. Disentangling mandatory IFRS reporting and changes in enforcement. Journal of Accounting and Economics 56 (2–3, Supplement 1). Conference Issue on Accounting Research on Classic and Contemporary IssuesUniversity of Rochester, Simon Business School: 178–188.
Beck, T., A. Demirguc-Kunt, and V. Maksimovic. 2004. Bank Competition and Access to Finance: International Evidence. Journal of Money, Credit, and Banking 36 (3): 627–648.
Bekaert, G., and C. R. Harvey. 2000. Foreign Speculators and Emerging Equity Markets. The Journal of Finance 55 (2): 565–613.
Benmelech, E., and N. K. Bergman. 2009. Collateral pricing. Journal of Financial Economics 91 (3): 339–360.
Bertrand, M., and S. Mullainathan. 2003. Enjoying the Quiet Life? Corporate Governance and Managerial Preferences. Journal of Political Economy 111 (5): 1043–1075.
Bharath, S. T., P. Pasquariello, and G. Wu. 2009. Does Asymmetric Information Drive Capital Structure Decisions? Review of Financial Studies 22 (8): 3211–3243.
Brochet, F., A. D. Jagolinzer, and E. J. Riedl. 2013. Mandatory IFRS Adoption and Financial Statement Comparability. Contemporary Accounting Research 30 (4): 1373–1400.

38
Byard, D., Y. Li, and Y. Yu. 2011. The Effect of Mandatory IFRS Adoption on Financial Analysts’ Information Environment. Journal of Accounting Research 49 (1): 69–96.
Chen, T.-Y., C. Chin, S. Wang, and C. Yao. 2013. The Effect of Mandatory IFRS Adoption on Bank Loan Contracting. Unpublished paper.
Christensen, H. B., L. Hail, and C. Leuz. 2013. Mandatory IFRS reporting and changes in enforcement. Journal of Accounting and Economics 56 (2–3, Supplement 1). Conference Issue on Accounting Research on Classic and Contemporary IssuesUniversity of Rochester, Simon Business School: 147–177.
Christensen, H. B., L. Hail, and C. Leuz. 2015. Capital-Market Effects of Securities Regulation: Prior Conditions, Implementation, and Enforcement. Unpublished paper.
D’Mello, R., and S. P. Ferris. 2000. The Information Effects of Analyst Activity at the Announcement of New Equity Issues. Financial Management 29 (1): 78–95.
Daske, H., L. Hail, C. Leuz, and R. Verdi. 2008. Mandatory IFRS Reporting around the World: Early Evidence on the Economic Consequences. Journal of Accounting Research 46 (5): 1085–1142.
———. 2013. Adopting a Label: Heterogeneity in the Economic Consequences Around IAS/IFRS Adoptions. Journal of Accounting Research 51 (3): 495–547.
DeFond, M., X. Hu, M. Hung, and S. Li. 2011. The impact of mandatory IFRS adoption on foreign mutual fund ownership: The role of comparability. Journal of Accounting and Economics 51 (3): 240–258.
De George, E. T, X. Li, and L. Shivakumar. 2015. A Review of the IFRS-Adoption Literature. Unpublished paper.
Dierkens, N. 1991. Information Asymmetry and Equity Issues. Journal of Financial and Quantitative Analysis 26 (02): 181–199.
Djankov, S., C. McLiesh, and A. Shleifer. 2007. Private credit in 129 countries. Journal of Financial Economics 84 (2): 299–329.
Fama, E. F., and K. R. French. 2002. Testing Trade-Off and Pecking Order Predictions About Dividends and Debt. Review of Financial Studies 15 (1): 1–33.
———. 2005. Financing decisions: who issues stock? Journal of Financial Economics 76 (3): 549–582.
Fazzari, Steve, R. Glenn Hubbard, and Bruce Peterson. 1988. Financing constraints and corporate investment, Brookings Papers on Economic Activity, 141-195.
Florou, A., and U. Kosi. 2015. Does mandatory IFRS adoption facilitate debt financing? Review of Accounting Studies 20 (4): 1407–1456.

39
Frank, M. Z., and V. K. Goyal. 2003. Testing the pecking order theory of capital structure. Journal of Financial Economics 67 (2): 217–248.
GAAP. 2001. A Survey of National Accounting Rules Benchmarked Against International Accounting Standards. Eds.: Anderson, BDO, Deloitte Touche Tohmatsu, Ernst & Young, Grant Thornton, KPMG, PricehouseWaterhouseCoopers, Christopher W. Nobes.
Garmaise, M. J., and G. Natividad. 2010. Information, the Cost of Credit, and Operational E�ciency: An Empirical Study of Microfinance. Review of Financial Studies 23 (6): 2560–2590.
Gow, I. D., G. Ormazabal, and D. J. Taylor. 2010. Correcting for Cross‐Sectional and Time‐Series Dependence in Accounting Research. The Accounting Review 85 (2): 483–512.
Graham, J. R., M. T. Leary, and M. R. Roberts. 2015. A century of capital structure: The leveraging of corporate America. Journal of Financial Economics 118 (3). NBER Symposium on New perspectives on corporate capital structures: 658–683.
Hadlock, C., and Pierce, J. 2010. New evidence on measuring financial constraints: Moving beyond the KZ Index. Review of Financial Studies, 23, 1909–1940.
Hail, L., A. Tahoun, and C. Wang. 2014. Dividend Payouts and Information Shocks. Journal of
Accounting Research 52 (2): 403–456.
Haselmann, R., K. Pistor, and V. Vig. 2010. How Law Affects Lending. Review of Financial Studies 23 (2): 549–580.
Henry, P. B. 2000. Do stock market liberalizations cause investment booms? Journal of Financial Economics 58 (1–2). Special Issue on International Corporate Governance: 301–334.
Hillegeist, S. A., E. Keating, D. P. Cram, and K. G. Lunstedt. 2004. Assessing the probability of bankruptcy. Review of Accounting Studies 9, 5-34.
Hong, H. A., M. Hung, and G. J. Lobo. 2014. The Impact of Mandatory IFRS Adoption on IPOs in Global Capital Markets. The Accounting Review 89 (4): 1365–1397.
Hope, O.-K., Jin, J., Kang. T., 2006. Empirical evidence on jurisdictions that adopt IFRS. Journal of International Accounting Research Vol. 5, No. 2, pp. 1–20.
Kim, H. E., and V. Singal. 2000. The fear of globalizing capital markets. Emerging Markets Review 1 (3): 183–198.
Lancaster, T. 2000. The incidental parameter problem since 1948. Journal of Econometrics 95 (2): 391–413.
La Porta, R., J. Lakonishok, A. Shleifer, and R. Vishny. 1997. Good News for Value Stocks: Further Evidence on Market Efficiency. The Journal of Finance 52 (2): 859–874.

40
La Porta, R., F. López de Silanes, A. Shleifer, and R. Vishny. 1998. Law and Finance. Journal of Political Economy 106.
Leary, M. T., and M. R. Roberts. 2005. Do Firms Rebalance Their Capital Structures? The Journal of Finance 60 (6): 2575–2619.
———. 2010. The pecking order, debt capacity, and information asymmetry. Journal of Financial Economics 95 (3): 332–355.
Lemmon, M. L., and J. F. Zender. 2010. Debt Capacity and Tests of Capital Structure Theories. Journal of Financial and Quantitative Analysis 45 (5): 1161–1187.
Lesmond, D. A., J. P. Ogden, and C. A. Trzcinka. 1999. A New Estimate of Transaction Costs. Review of Financial Studies 12 (5): 1113–1141.
Leuz, C., and R. E. Verrecchia. 2000. The Economic Consequences of Increased Disclosure. Journal of Accounting Research 38: 91–124.
Leuz, C., and P. D. Wysocki. 2015. Economic Consequences of Financial Reporting and Disclosure Regulation: A Review and Suggestions for Future Research. Unpublished paper.
Levine, R. 1998. The Legal Environment, Banks, and Long-Run Economic Growth. Journal of Money, Credit and Banking 30 (3): 596–613.
———. 1999. Law, Finance, and Economic Growth. Journal of Financial Intermediation 8 (1–2): 8–35.
Li, X., and H. Yang. 2015. Mandatory Financial Reporting and Voluntary Disclosure: The Effect of Mandatory IFRS Adoption on Management Forecasts. Unpublished paper.
Loyeung, A., Z. P. Matolcsy, J. Weber, and P. A. Wells. 2016. Accounting for business combinations and takeover premiums: Pre-and post-IFRS. Australian Journal of Management 41 (4), 611-632.
Myers, S. C. 1984. The Capital Structure Puzzle. The Journal of Finance 39 (3): 574–592.
———. 2003. Chapter 4 - Financing of Corporations. In Handbook of the Economics of Finance, edited by M. H. and R. M. S. George M. Constantinides, 1, Part A:215–253. Corporate Finance. Elsevier.
Myers, S. C., and N. S. Majluf. 1984. Corporate financing and investment decisions when firms have information that investors do not have. Journal of Financial Economics 13 (2): 187–221.
Petacchi, R. 2015. Information asymmetry and capital structure: Evidence from regulation FD. Journal of Accounting and Economics 59 (2): 143–162.

41
Petersen, M. A. 2009. Estimating Standard Errors in Finance Panel Data Sets: Comparing Approaches. Review of Financial Studies 22 (1): 435–480.
Rajan, R. G., and L. Zingales. 1995. What Do We Know about Capital Structure? Some Evidence from International Data. The Journal of Finance 50 (5): 1421–1460.
Ramanna, K., and E. Sletten. 2014. Network Effects in Countries’ Adoption of IFRS. The Accounting Review 89 (4): 1517–1543.
Roberts, M. R., and T. M. Whited. 2013. Chapter 7 - Endogeneity in Empirical Corporate Finance1. In Handbook of the Economics of Finance, edited by M. H. and R. M. S. George M. Constantinides, 2, Part A:493–572. Elsevier.
Rosenbaum, P. R., and D. B. Rubin. 1983. The central role of the propensity score in observational studies for causal effects. Biometrika 70 (1): 41–55.
Shyam-Sunder, L., and S. C. Myers. 1999. Testing static tradeoff against pecking order models of capital structure1. Journal of Financial Economics 51 (2): 219–244.
Tan, H., S. Wang, and M. Welker. 2011. Analyst Following and Forecast Accuracy After Mandated IFRS Adoptions. Journal of Accounting Research 49 (5): 1307–1357.
Vig, V. 2013. Access to Collateral and Corporate Debt Structure: Evidence from a Natural Experiment. The Journal of Finance 68 (3): 881–928.
Visaria, S. 2009. Legal Reform and Loan Repayment: The Microeconomic Impact of Debt Recovery Tribunals in India. American Economic Journal: Applied Economics 1 (3): 59–81.
Whited, T., and G., Wu. 2006. Financial Constraints Risk. Review of Financial Studies, 19, 531–559.

42
Appendix: Variable Definitions
Financing and Investment Variables
Ext_Fin: Indicator variable that equals one if a firm issues debt or equity above 5% of the beginning period assets in a given year, and zero otherwise.
Leverage: Total debt divided by the market value of assets.
Investment: Capital expenditures deflated by beginning period PP&E.
Indicator Variables
Post: Indicator variable that equals one if the firm or country has adopted IFRS in that year, zero otherwise. IFRS adoption dates by country are obtained from Ramanna and Sletten (2014). For the control sample, the adoption date is assumed to be fiscal year 2005.
Adopter: Indicator variable that equals one if the firm mandatorily adopts IFRS, zero otherwise.
Control Variables
Zscore: Modified Altman’s (1968) Z-score = (1.2*working capital+ 0.6* Market Value of Equity + 3.3*EBIT + 0.999*sales)/total assets.
Tangibility: Property, plant, and equipment (PP&E) normalized by total assets.
Q: Ratio of the market value of assets to total assets. The market value of assets is defined as the book value of total assets plus market equity minus common equity. Market equity is defined as shares outstanding times the fiscal year closing price.
Cash Flow: Operating cash flow normalized by lag total assets.
Profitability: Operating income normalized by total assets.
Log(Sales): Logarithm of total sales.
Cash: Cash normalized by total assets.
Returns: One year buy-and-hold returns for the corresponding fiscal year.
Deficit: (dividend payments + capital expenditures + net change in working capital - operating cash flow after interest and taxes)/lag total assets.
Trade: Ratio of the sum of exports and imports to a country’s GDP.
Tbill: Country’s three month Treasury bill rate.
GDP: Percentage change of real gross domestic product.

43
Information Asymmetry Variables
Amihud: The yearly median of the daily ratio of absolute stock return to its dollar volume (Amihud (2002)).
ZeroRet: The proportion of trading days with zero daily stock returns out of all potential trading days in a given year.
LDV: Estimate of total round trip transaction based on a yearly time-series regression of daily stock returns on the aggregate market returns (Lesmond, Ogden, and Trzcinka (1999)).
IA Factor: Principal component of Amihud, Zero Ret, and LDV.
Partitioning Variables
F. Constraint: Within country-industry quartile of the Hadlock-Pierce index. The variable is rescaled to range from 0 to 1. The index is calculated as (−0.737* Size) + (0.043* Size2) − (0.040*Age), where Size is the log of total assets, and Age is the number of years the firm has been on the database.
Asymmetry: Indicator variable that equals one if the change in the IA Factor after the adoption of IFRS is negative, zero otherwise.
Leverage: Total debt divided by the market value of assets.
Zscore: Modified Altman’s (1968) Z-score = (1.2*working capital+ 0.6* Market Value of Equity + 3.3*EBIT + 0.999*sales)/total assets.
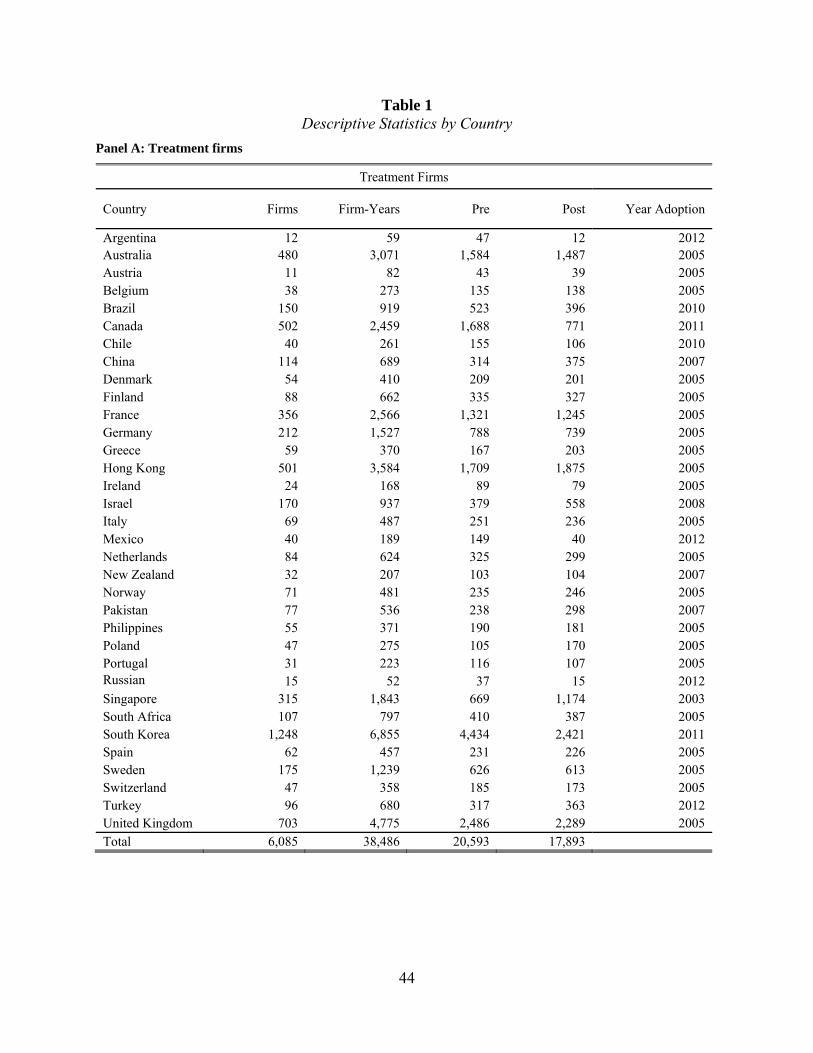
44
Table 1 Descriptive Statistics by Country
Panel A: Treatment firms
Treatment Firms
Country Firms Firm-Years Pre Post Year Adoption
Argentina 12 59 47 12 2012 Australia 480 3,071 1,584 1,487 2005 Austria 11 82 43 39 2005 Belgium 38 273 135 138 2005 Brazil 150 919 523 396 2010 Canada 502 2,459 1,688 771 2011 Chile 40 261 155 106 2010 China 114 689 314 375 2007 Denmark 54 410 209 201 2005 Finland 88 662 335 327 2005 France 356 2,566 1,321 1,245 2005 Germany 212 1,527 788 739 2005 Greece 59 370 167 203 2005 Hong Kong 501 3,584 1,709 1,875 2005 Ireland 24 168 89 79 2005 Israel 170 937 379 558 2008 Italy 69 487 251 236 2005 Mexico 40 189 149 40 2012 Netherlands 84 624 325 299 2005 New Zealand 32 207 103 104 2007 Norway 71 481 235 246 2005 Pakistan 77 536 238 298 2007 Philippines 55 371 190 181 2005 Poland 47 275 105 170 2005 Portugal 31 223 116 107 2005 Russian 15 52 37 15 2012 Singapore 315 1,843 669 1,174 2003 South Africa 107 797 410 387 2005 South Korea 1,248 6,855 4,434 2,421 2011 Spain 62 457 231 226 2005 Sweden 175 1,239 626 613 2005 Switzerland 47 358 185 173 2005 Turkey 96 680 317 363 2012 United Kingdom 703 4,775 2,486 2,289 2005 Total 6,085 38,486 20,593 17,893
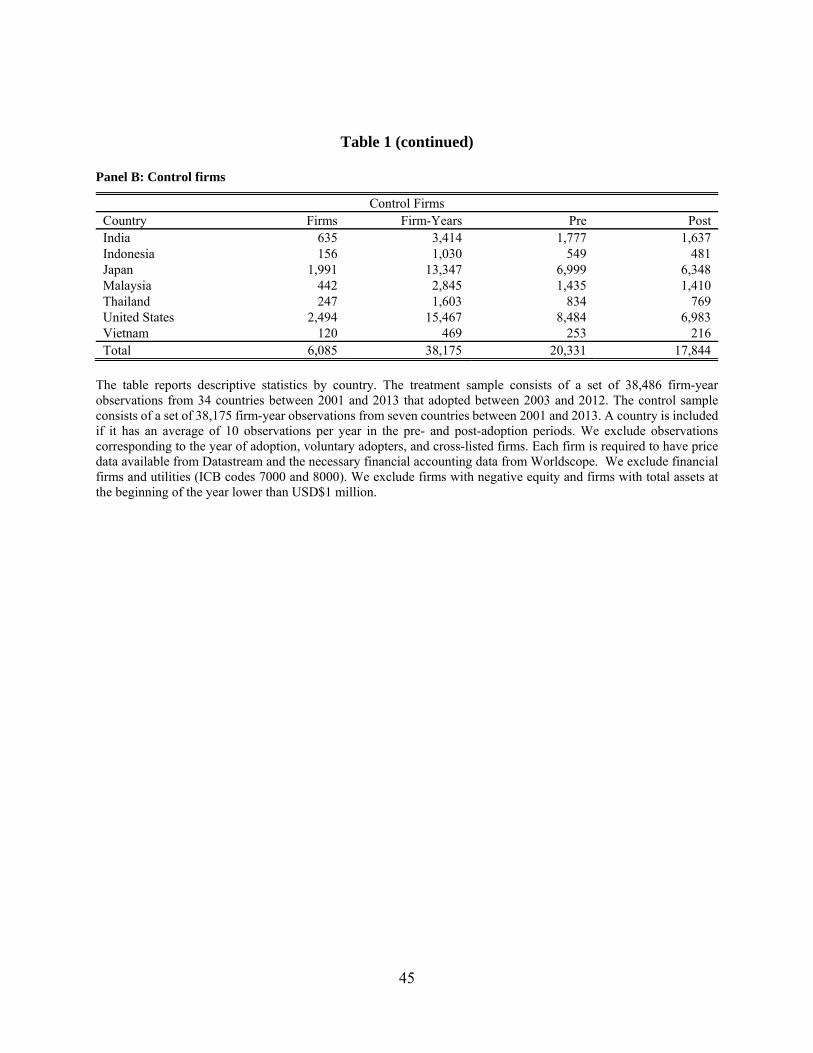
45
Table 1 (continued)
Panel B: Control firms
Control Firms Country Firms Firm-Years Pre Post India 635 3,414 1,777 1,637 Indonesia 156 1,030 549 481 Japan 1,991 13,347 6,999 6,348 Malaysia 442 2,845 1,435 1,410 Thailand 247 1,603 834 769 United States 2,494 15,467 8,484 6,983 Vietnam 120 469 253 216 Total 6,085 38,175 20,331 17,844
The table reports descriptive statistics by country. The treatment sample consists of a set of 38,486 firm-year observations from 34 countries between 2001 and 2013 that adopted between 2003 and 2012. The control sample consists of a set of 38,175 firm-year observations from seven countries between 2001 and 2013. A country is included if it has an average of 10 observations per year in the pre- and post-adoption periods. We exclude observations corresponding to the year of adoption, voluntary adopters, and cross-listed firms. Each firm is required to have price data available from Datastream and the necessary financial accounting data from Worldscope. We exclude financial firms and utilities (ICB codes 7000 and 8000). We exclude firms with negative equity and firms with total assets at the beginning of the year lower than USD$1 million.
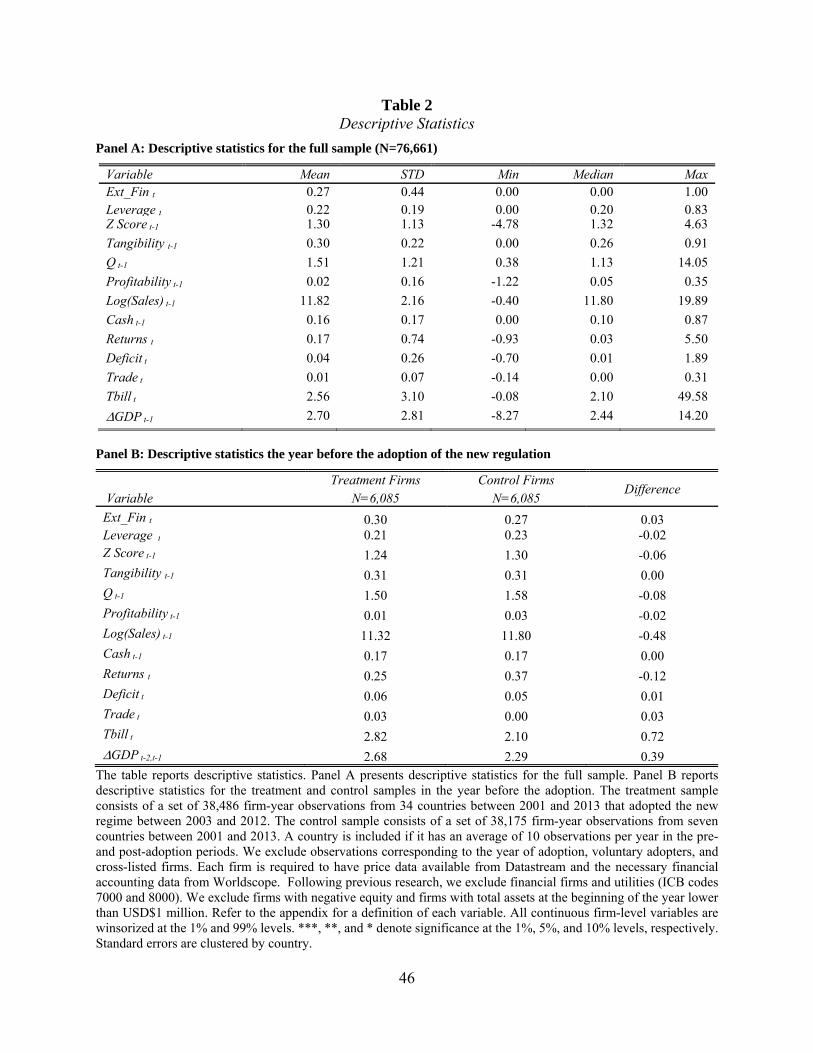
46
Table 2 Descriptive Statistics
Panel A: Descriptive statistics for the full sample (N=76,661)
Variable Mean STD Min Median Max Ext_Fin t 0.27 0.44 0.00 0.00 1.00 Leverage t 0.22 0.19 0.00 0.20 0.83 Z Score t-1 1.30 1.13 -4.78 1.32 4.63
Tangibility t-1 0.30 0.22 0.00 0.26 0.91
Q t-1 1.51 1.21 0.38 1.13 14.05
Profitability t-1 0.02 0.16 -1.22 0.05 0.35
Log(Sales) t-1 11.82 2.16 -0.40 11.80 19.89
Cash t-1 0.16 0.17 0.00 0.10 0.87
Returns t 0.17 0.74 -0.93 0.03 5.50
Deficit t 0.04 0.26 -0.70 0.01 1.89
Trade t 0.01 0.07 -0.14 0.00 0.31
Tbill t 2.56 3.10 -0.08 2.10 49.58
GDP t-1 2.70 2.81 -8.27 2.44 14.20
Panel B: Descriptive statistics the year before the adoption of the new regulation
Treatment Firms Control Firms Difference
Variable N=6,085 N=6,085
Ext_Fin t 0.30 0.27 0.03 Leverage t 0.21 0.23 -0.02 Z Score t-1 1.24 1.30 -0.06 Tangibility t-1 0.31 0.31 0.00 Q t-1 1.50 1.58 -0.08 Profitability t-1 0.01 0.03 -0.02 Log(Sales) t-1 11.32 11.80 -0.48 Cash t-1 0.17 0.17 0.00 Returns t 0.25 0.37 -0.12 Deficit t 0.06 0.05 0.01 Trade t 0.03 0.00 0.03 Tbill t 2.82 2.10 0.72 GDP t-2,t-1 2.68 2.29 0.39
The table reports descriptive statistics. Panel A presents descriptive statistics for the full sample. Panel B reports descriptive statistics for the treatment and control samples in the year before the adoption. The treatment sample consists of a set of 38,486 firm-year observations from 34 countries between 2001 and 2013 that adopted the new regime between 2003 and 2012. The control sample consists of a set of 38,175 firm-year observations from seven countries between 2001 and 2013. A country is included if it has an average of 10 observations per year in the pre- and post-adoption periods. We exclude observations corresponding to the year of adoption, voluntary adopters, and cross-listed firms. Each firm is required to have price data available from Datastream and the necessary financial accounting data from Worldscope. Following previous research, we exclude financial firms and utilities (ICB codes 7000 and 8000). We exclude firms with negative equity and firms with total assets at the beginning of the year lower than USD$1 million. Refer to the appendix for a definition of each variable. All continuous firm-level variables are winsorized at the 1% and 99% levels. ***, **, and * denote significance at the 1%, 5%, and 10% levels, respectively. Standard errors are clustered by country.
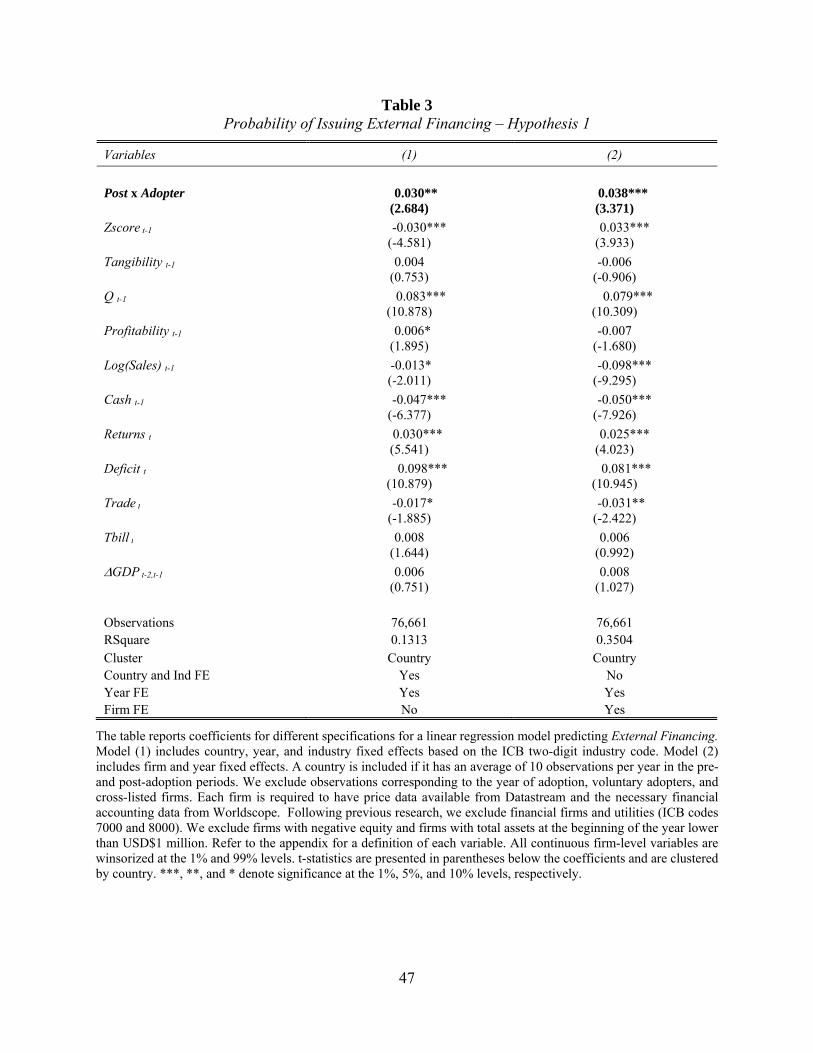
47
Table 3 Probability of Issuing External Financing – Hypothesis 1
Variables (1) (2)
Post x Adopter 0.030** 0.038*** (2.684) (3.371)
Zscore t-1 -0.030*** 0.033*** (-4.581) (3.933)
Tangibility t-1 0.004 -0.006 (0.753) (-0.906)
Q t-1 0.083*** 0.079*** (10.878) (10.309)
Profitability t-1 0.006* -0.007 (1.895) (-1.680)
Log(Sales) t-1 -0.013* -0.098*** (-2.011) (-9.295)
Cash t-1 -0.047*** -0.050*** (-6.377) (-7.926)
Returns t 0.030*** 0.025*** (5.541) (4.023)
Deficit t 0.098*** 0.081*** (10.879) (10.945)
Trade t -0.017* -0.031** (-1.885) (-2.422)
Tbill t 0.008 0.006 (1.644) (0.992)
GDP t-2,t-1 0.006 0.008 (0.751) (1.027)
Observations 76,661 76,661 RSquare 0.1313 0.3504 Cluster Country Country Country and Ind FE Yes No Year FE Yes Yes Firm FE No Yes
The table reports coefficients for different specifications for a linear regression model predicting External Financing. Model (1) includes country, year, and industry fixed effects based on the ICB two-digit industry code. Model (2) includes firm and year fixed effects. A country is included if it has an average of 10 observations per year in the pre- and post-adoption periods. We exclude observations corresponding to the year of adoption, voluntary adopters, and cross-listed firms. Each firm is required to have price data available from Datastream and the necessary financial accounting data from Worldscope. Following previous research, we exclude financial firms and utilities (ICB codes 7000 and 8000). We exclude firms with negative equity and firms with total assets at the beginning of the year lower than USD$1 million. Refer to the appendix for a definition of each variable. All continuous firm-level variables are winsorized at the 1% and 99% levels. t-statistics are presented in parentheses below the coefficients and are clustered by country. ***, **, and * denote significance at the 1%, 5%, and 10% levels, respectively.

48
Table 4 Additional Identification tests
Variables
(1) (2) (3) (4)
Yearly Effects Full Sample
2005 Adopters
2006 Adopters
t-statistics for 2005 vs 2006
Post (-2)x Adopter -0.004 (-0.191)
Post (-1)x Adopter 0.010 (0.744)
Post (+1)x Adopter 0.028* (1.683)
Post (+2)x Adopter 0.049*** (3.009)
Post (+3)x Adopter 0.054** (2.088)
Post (+4)x Adopter 0.038 (1.015)
Year 03 -0.029 0.004 -1.019 (-1.383) (0.129)
Year04 -0.016 -0.015 -0.039 (-0.748) (-0.622)
Year05 0.058* 0.043 0.310 (2.012) (1.140)
Year06 0.048* -0.012 1.741* (1.767) (-0.353)
Year07 0.093*** 0.041** 1.744* (3.356) (2.190)
Year08 0.093*** 0.068*** 1.112 (3.933) (2.943)
Observations 76,661 9,395 3,596 RSquare 0.3502 0.2724 0.3654 Controls Included Included Included Cluster Country Country Country Year FE Yes No No Firm FE Yes Yes Yes
The table reports coefficients for different samples and specifications for a linear regression model predicting External Financing for countries adopting in 2005. Model (1) shows yearly effects for our sample. Model (2) presents yearly coefficients for December fiscal year end firms in the treatment sample. Model (3) presents yearly coefficients for non-December fiscal year end firms. Model (4) presents the difference in coefficients between models (2) and (3). The model includes firm fixed effects. A country is included if it has an average of 10 observations per year in the pre- and post-adoption periods. We exclude observations corresponding to the year of adoption, voluntary adopters, and cross-listed firms. Each firm is required to have price data available from Datastream and the necessary financial accounting data from Worldscope. Following previous research, we exclude financial firms and utilities (ICB codes 7000 and 8000). We exclude firms with negative equity and firms with total assets at the beginning of the year lower than USD$1 million. Refer to the appendix for a definition of each variable. All continuous firm-level variables are winsorized at the 1% and 99% levels. t-statistics are presented in parentheses below the coefficients and are clustered by country. ***, **, and * denote significance at the 1%, 5%, and 10% levels, respectively.

49
Table 5 Cross-Sectional Partitions – Hypothesis 2
Variables
Treatment Financial Constraint t-1 Asymmetry t-1, t+1
(1) (2) (3) (4) (5)Post 0.028** 0.006 -0.006
(2.711) (0.523) (-0.310)
Post x F. Constrain t-1 0.044** 0.046** (2.255) (2.486)
Post x Asymmetry t-1, 0.053** 0.046** (2.686) (2.494)
Zscore t-1 0.022** 0.021** 0.022** 0.023** 0.024** (2.383) (2.361) (2.428) (2.655) (2.643)
Tangibility t-1 -0.005 -0.006 -0.003 -0.004 -0.000 (-0.557) (-0.646) (-0.267) (-0.375) (-0.025)
Q t-1 0.080*** 0.080*** 0.075*** 0.077*** 0.073*** (9.261) (9.215) (8.969) (9.347) (9.073)
Profitability t-1 -0.007 -0.007 -0.009** -0.009* -0.010** (-1.476) (-1.647) (-2.035) (-1.943) (-2.093)
Log(Sales) t-1 -0.087*** -0.086*** -0.090*** -0.094*** -0.096*** (-7.367) (-7.509) (-7.529) (-8.432) (-8.360)
Cash t-1 -0.051*** -0.050*** -0.050*** -0.051*** -0.051*** (-12.829) (-12.667) (-13.366) (-13.007) (-13.541)
Returns t 0.024** 0.024** 0.028*** 0.023** 0.028*** (2.621) (2.639) (3.220) (2.603) (3.221)
Deficit t 0.078*** 0.078*** 0.077*** 0.078*** 0.077*** (10.989) (10.947) (10.795) (10.831) (10.699)
Trade t -0.015 -0.015 -0.008 -0.013 -0.009 (-1.136) (-1.157) (-0.539) (-1.014) (-0.599)
Tbill t 0.012 0.011 0.010** 0.012 0.010** (1.431) (1.404) (2.706) (1.486) (2.698)
GDP t-2,t-1 0.010*** 0.010*** 0.015 0.010*** 0.014 (3.571) (3.632) (1.655) (3.687) (1.652)
Observations 38,486 38,486 38,486 38,486 38,486 RSquare 0.3246 0.3249 0.3295 0.3253 0.3297 Cluster Country Country Country Country Country Firm FE Yes Yes Yes Yes Yes Year FE Yes No Yes Yes Yes PostxCountry FE No No Yes No Yes
The table reports the coefficients for a linear regression model when estimating the probability of issuing external financing for the treatment sample using different partitions. We exclude observations corresponding to the year of adoption. A country is included if it has an average of 10 observations per year in the pre- and post-adoption periods. We exclude observations corresponding to the year of adoption, voluntary adopters, and cross-listed firms. Each firm is required to have price data available from Datastream and the necessary financial accounting data from Worldscope. Following previous research, we exclude financial firms and utilities (ICB codes 7000 and 8000). We exclude firms with negative equity and firms with total assets at the beginning of the year lower than USD$1 million. Refer to the appendix for a definition of each variable. All continuous firm-level variables are winsorized at the 1% and 99% levels. t-statistics are presented in parentheses below the coefficients and are clustered by country. ***, **, and * denote significance at the 1%, 5%, and 10% levels, respectively.
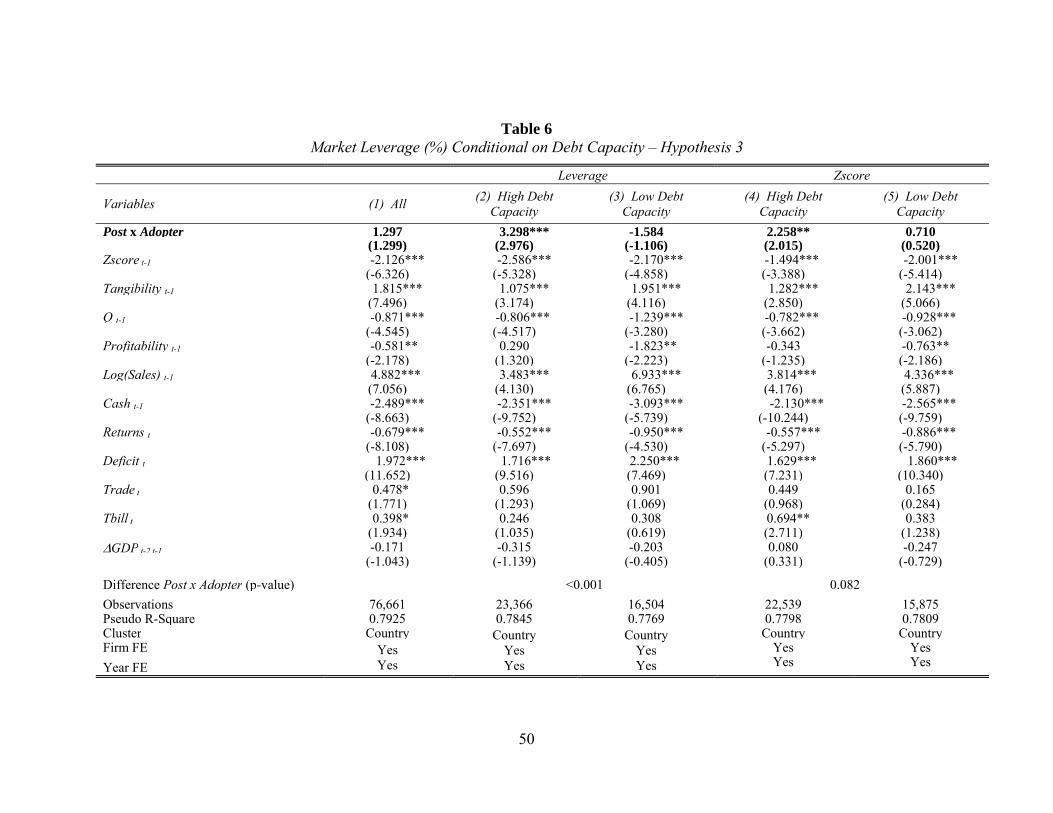
50
Table 6
Market Leverage (%) Conditional on Debt Capacity – Hypothesis 3
Leverage Zscore
Variables (1) All (2) High Debt
Capacity (3) Low Debt
Capacity (4) High Debt
Capacity (5) Low Debt
Capacity
Post x Adopter 1.297 3.298*** -1.584 2.258** 0.710 (1.299) (2.976) (-1.106) (2.015) (0.520)
Zscore t-1 -2.126*** -2.586*** -2.170*** -1.494*** -2.001*** (-6.326) (-5.328) (-4.858) (-3.388) (-5.414)
Tangibility t-1 1.815*** 1.075*** 1.951*** 1.282*** 2.143*** (7.496) (3.174) (4.116) (2.850) (5.066)
Q t-1 -0.871*** -0.806*** -1.239*** -0.782*** -0.928*** (-4.545) (-4.517) (-3.280) (-3.662) (-3.062)
Profitability t-1 -0.581** 0.290 -1.823** -0.343 -0.763** (-2.178) (1.320) (-2.223) (-1.235) (-2.186)
Log(Sales) t-1 4.882*** 3.483*** 6.933*** 3.814*** 4.336*** (7.056) (4.130) (6.765) (4.176) (5.887)
Cash t-1 -2.489*** -2.351*** -3.093*** -2.130*** -2.565*** (-8.663) (-9.752) (-5.739) (-10.244) (-9.759)
Returns t -0.679*** -0.552*** -0.950*** -0.557*** -0.886*** (-8.108) (-7.697) (-4.530) (-5.297) (-5.790)
Deficit t 1.972*** 1.716*** 2.250*** 1.629*** 1.860*** (11.652) (9.516) (7.469) (7.231) (10.340)
Trade t 0.478* 0.596 0.901 0.449 0.165 (1.771) (1.293) (1.069) (0.968) (0.284)
Tbill t 0.398* 0.246 0.308 0.694** 0.383 (1.934) (1.035) (0.619) (2.711) (1.238)
GDP t-2,t-1 -0.171 -0.315 -0.203 0.080 -0.247 (-1.043) (-1.139) (-0.405) (0.331) (-0.729)
Difference Post x Adopter (p-value) <0.001 0.082
Observations 76,661 23,366 16,504 22,539 15,875 Pseudo R-Square 0.7925 0.7845 0.7769 0.7798 0.7809 Cluster Country Country
Yes Yes
Country Yes Yes
Country Country Firm FE Yes
Yes Yes Yes
Year FE Yes Yes

51
Table 6 (continued)
The table reports the coefficients for a linear regression model when estimating Market Leverage (%) for different levels of debt capacity. Model (1) presents the results for the entire sample. Models (2) and (3) present results for the first partition, which is based on quartiles within industry-country Leverage. Models (4) and (5) present results for the second partition, which is based on quartiles within industry-country Zscore. A country is included if it has an average of 10 observations per year in the pre- and post-adoption periods. We exclude observations corresponding to the year of adoption, voluntary adopters, and cross-listed firms. Each firm is required to have price data available from Datastream and the necessary financial accounting data from Worldscope. Following previous research, we exclude financial firms and utilities (ICB codes 7000 and 8000). We exclude firms with negative equity and firms with total assets at the beginning of the year lower than USD$1 million. Refer to the appendix for a definition of each variable. All continuous firm-level variables are winsorized at the 1% and 99% levels. t-statistics are presented in parentheses below the coefficients and are clustered by country. ***, **, and * denote significance at the 1%, 5%, and 10% levels, respectively.

52
Table 7 Investment
Treatment Financial Constraint t-1 Asymmetry t-1, t+1
Variables (1) (2) (3) (4) (5)Post 0.101** 0.103*** 0.165***
(2.064) (4.297) (3.664)
Post x F. Constrain t-1 0.396*** 0.392*** (4.390) (4.626)
Post x Asymmetry t-1, t+1 0.201*** 0.197*** (3.985) (3.173)
Q t-1 0.092*** 0.104*** 0.086*** 0.098*** 0.082*** (3.396) (3.362) (3.473) (3.193) (3.276)
Cash Flow t 0.098*** 0.092*** 0.092*** 0.095*** 0.096*** (4.226) (4.096) (4.147) (4.203) (4.315)
Observations 37,749 37,749 37,749 37,749 37,749
RSquare 0.4878 0.4853 0.4970 0.4829 0.4945
Cluster Country Country Country Country Country Firm FE Yes Yes Yes Yes Yes Year FE Yes No Yes No Yes PostxCountry FE No No Yes No Yes
The table reports the coefficients for OLS models of investment on its determinants. Investment is defined as capital expenditures deflated by beginning period PP&E. We exclude observations corresponding to the year of adoption. A country is included if it has an average of 10 observations per year in the pre- and post-adoption periods. We exclude observations corresponding to the year of adoption, voluntary adopters, and cross-listed firms. Each firm is required to have price data available from Datastream and the necessary financial accounting data from Worldscope. Following previous research, we exclude financial firms and utilities (ICB codes 7000 and 8000). We exclude firms with negative equity and firms with total assets at the beginning of the year lower than USD$1 million. Refer to the appendix for a definition of each variable. All continuous firm-level variables are winsorized at the 1% and 99% levels. t-statistics are presented in parentheses below the coefficients and are clustered by country. ***, **, and * denote significance at the 1%, 5%, and 10% levels, respectively.

53
Table 8 Cross-Country Partitions
(1) (1) (2)
Variables Enforcement EU vs.
Non-EU 2005 vs. non-2005 Adopters
Post x Adopter CHL 0.070*** (6.383) Post x Adopter OTHER 0.030** (2.238) Post x Adopter EU 0.047***
(3.512)
Post x Adopter Non-EU 0.033** (2.095)
Post x Adopter 2005 adopters 0.042*** (3.430)
Post x Adopter Non-2005 adopters 0.032 (1.374)
Observations 76,661 76,661 76,661 RSquare 0.3505 0.3504 0.3504 Controls Included Included Included Cluster Country Country Country Firm, Year FE Yes Yes Yes
The table presents results for a linear regression model estimating the probability of issuing external financing for different partitions. Model (1) presents a partition based on the levels of enforcement according to Christensen, Hail, and Leuz (2013) (Enforcement). Model (2) presents results based on whether or not a country belongs to the European Union (EU). Model (3) presents a partition based on whether or not a country adopted the regulation in 2005. A country is included if it has an average of 10 observations per year in the pre- and post-adoption periods. We exclude observations corresponding to the year of adoption, voluntary adopters, and cross-listed firms. Each firm is required to have price data available from Datastream and the necessary financial accounting data from Worldscope. Following previous research, we exclude financial firms and utilities (ICB codes 7000 and 8000). We exclude firms with negative equity and firms with total assets at the beginning of the year lower than USD$1 million. Refer to the appendix for a definition of each variable. All continuous firm-level variables are winsorized at the 1% and 99% levels. t-statistics are presented in parentheses below the coefficients and are clustered by country. ***, **, and * denote significance at the 1%, 5%, and 10% levels, respectively.