Embed Size (px)
Citation preview
Q4 2017 Financial report
NGT
___________________________________________________________________________________________________ NextGenTel Holding ASA Q4 2017 Financial Report
6 March 2018
NextGenTel Holding ASA – 4th
quarter 2017
Key figures
(Figures in NOK million)Q4
2017
Q4
2016
Revenues 316.2 330.0
Gross profit 131.7 154.4
Gross margin 41.6% 46.8%
EBITDA 34.4 53.9
Group financials Q4 2017 (2016 figures in
brackets)
Revenues in Q4 were NOK 316.2 million (330.0),
compared to NOK 317.4 million in Q3. Gross
profit was NOK 131.7 million – 41.6% (154.4 –
46.8%), compared to NOK 131.5 million in Q3.
EBITDA adjusted for non-recurring items was
NOK 34.4 million – 10.9 % (53.9 – 16.3%),
compared to NOK 35.9 million in Q3.
Q4 had an operating loss of NOK 15.4 million
(profit 10.0), compared to NOK 7.8 million in Q3.
Lower revenues and reduced gross margin affects
gross profit negatively compared to Q4 2016. Opex
is reduced by NOK 3.2 million from Q4 2016.
Q4 shows stable development for revenues and
gross margin from Q3. Revenue growth on fiber
based broadband compensates for the decline in
xDSL revenues in Q4. Price increases are giving
positive effects on ARPU in consumer broadband
and TV.
The Q4 2017 financial results include NOK 12.1
million in amortization cost related to business
combinations. The Q4 2017 financial results also
include an accrual for the NOK 30.6 million tax
claim from Norwegian tax authorities (see next
page for details).
The regulatory issue related to the VULA product
from Telenor has been only partly resolved.
Furthermore, the ministry has announced a new
regulation which implies a further reduction in
Telenor’s wholesale prices.
EPS was NOK 1.97 negative in Q4 2017 and
equity ratio was 14.38% at 31 December.
Cash and cash equivalents were NOK 11.5 million
at 31 December 2017 (excluding available
overdraft facility of NOK 38.6 million).
*) Customer base = revenue generating units (RGUs)
Capital expenditures
Capital expenditures in Q4 2017 were NOK 21.9
million (34.0). Capex/sales ratio was 6.9% in Q4
(10.3%) and capex reduction is ahead of the ambition
to reach 8% capex/sales for 2017. Capex/sales for
2017 was 7.1% (excluding the acquisition of
Bayonette customer base). For details, see notes 6 and
7 to the financial statements.
Financial debt
Total interest-bearing debt was NOK 235.5 million
(315.0) where NOK 175 million is bank loan and
NOK 60.5 is financial lease. Net interest-bearing debt
was NOK 224.0 million as of 31 December 2017
(248.4). After the quarter, NOK 68 million of the
received payment for the consumer mobile customer
portfolio has been used to reduce the bank loan to
NOK 107 million. See note 9 to the financial
statements.
Related party transactions
There have been no transactions by related parties that have had a material effect on the Group’s financial
position or results in the period.
Customer base development
The total customer base*)
in Norway was 241,500 at the end of Q4 2017, a decrease from 252,000 at the
end of Q3. The consumer segment had a decrease of
9,200 and the business segment a decrease of 1,200.
The company has continued its activities towards the
housing cooperatives segment focusing on reducing
the backlog of installations during Q4. In Q4, 1 new
cooperative signed an agreement with NextGenTel
representing 76 households (total number of units is
122 and 6,105 households of which 4,894 are installed
at the end of December).
The total number of subscribers on high-speed
Internet access is 44,300.
The consumer mobile subscriber base counted 36,500
subscribers and the corporate mobile subscriber base
counted 16,000 subscribers at the end of December.
The customer base in the international markets
declined by 5,900 customers in Q4, mainly driven by
reduction of white label customers in the Netherlands.
The total number of customers in the international
markets was 74,300 at the end of December.
1
___________________________________________________________________________________________________ NextGenTel Holding ASA Q4 2017 Financial Report
6 March 2018
Shareholder information
The total number of registered shares outstanding
at the end of Q4 2017 was 23,283,180 out of which
274,201 shares were owned by NextGenTel
Holding ASA.
The total number of shareholders was 624 and
22.5% of the shares were registered abroad. For
information about the top 20 shareholders, please
refer to http://nextgentelholding.com/Investor-
relations/Share-information/Top-20-shareholders
Total outstanding options at the end of Q4 2017
were 561,000 of which 259,000 have a dilutive
effect with a weighted average strike price of NOK
6.00.
Tax update
Reference is made to previous announcements
related to the tax issue regarding the taxation of
dividends from Switzerland (stock exchange notice
and Q1 2017 report). The company has received a
final report from the tax authorities implying a
total tax claim of NOK 30.6 million incl interest
and the company has accounted for an accrual for
this tax claim in the financial accounts for Q4. It is
still the company’s view that no additional tax
should be imposed and the company has filed a
complaint with the tax appeal board
(“Skatteklagenemnda”) as well as an application
for postponement with paying the tax awaiting a
ruling by the tax appeal board.
Sale of consumer mobile customer portfolio
On 4 December 2017, the company announced an
agreement to sell its consumer mobile customer
portfolio to Telia Norge AS. In reassessing the
company's strategy, the board of NextGenTel Holding
ASA has concluded that the consumer mobile
customers are of less strategic importance for the
future of the NextGenTel Group. Therefore, the
company initiated a sale of this customer portfolio
which counted approximately 36,500 subscriptions as
of 31 December 2017. The purchase price is minimum
NOK 75 million and maximum NOK 95 million
depending on the number of customers actually being
migrated. The Norwegian competition authorities had
no objections to the transaction and the first payment
of NOK 75 million was received in January. Customer
migration has started and the finalized transaction is
expected to close during June 2018.
Cost reductions
The previously announced cost reduction plan (NOK
40 million annually) is on track.
Demerger completed
Demerger of NextGenTel AS from 1 November 2017
to establish Proximo Norge AS as a separate legal
entity to focus on end-user corporate segment.
2
___________________________________________________________________________________________________ NextGenTel Holding ASA Q4 2017 Financial Report
6 March 2018
Oslo, 5 March 2018
Board of Directors
NextGenTel Holding ASA
Ellen Hanetho Lars B. Thoresen Espen Fjogstad
(sign.) Chairman of the Board (sign.)
(sign.)
Kari Mette Toverud Vidar Skogedal Linn Anette Husøy
(sign.) Employee repr. Employee repr.
(sign.) (sign.)
Eirik Lunde
CEO
(sign.)
3
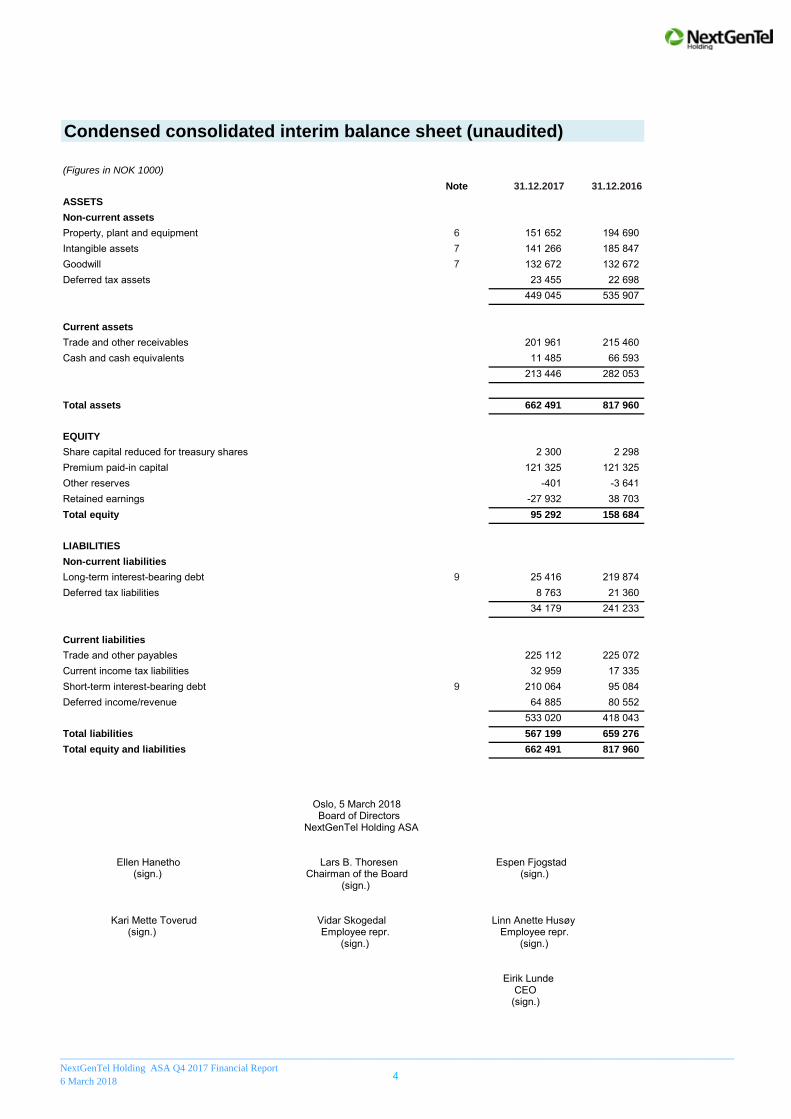
Condensed consolidated interim balance sheet (unaudited)
(Figures in NOK 1000)
Note 31.12.2017 31.12.2016
ASSETS
Non-current assets
Property, plant and equipment 6 151 652 194 690 Intangible assets 7 141 266 185 847 Goodwill 7 132 672 132 672 Deferred tax assets 23 455 22 698
449 045 535 907
Current assets
Trade and other receivables 201 961 215 460 Cash and cash equivalents 11 485 66 593
213 446 282 053
Total assets 662 491 817 960
EQUITY
Share capital reduced for treasury shares 2 300 2 298 Premium paid-in capital 121 325 121 325 Other reserves -401 -3 641 Retained earnings -27 932 38 703 Total equity 95 292 158 684
LIABILITIES
Non-current liabilities
Long-term interest-bearing debt 9 25 416 219 874 Deferred tax liabilities 8 763 21 360
34 179 241 233
Current liabilities
Trade and other payables 225 112 225 072 Current income tax liabilities 32 959 17 335 Short-term interest-bearing debt 9 210 064 95 084 Deferred income/revenue 64 885 80 552
533 020 418 043 Total liabilities 567 199 659 276
Total equity and liabilities 662 491 817 960
Oslo, 5 March 2018 Board of Directors NextGenTel Holding ASA Ellen Hanetho Lars B. Thoresen Espen Fjogstad (sign.) Chairman of the Board (sign.) (sign.) Kari Mette Toverud Vidar Skogedal Linn Anette Husøy (sign.) Employee repr. Employee repr. (sign.) (sign.) Eirik Lunde CEO (sign.)
____________________________________________________________________________________________________________________________________
NextGenTel Holding ASA Q4 2017 Financial Report
6 March 20184
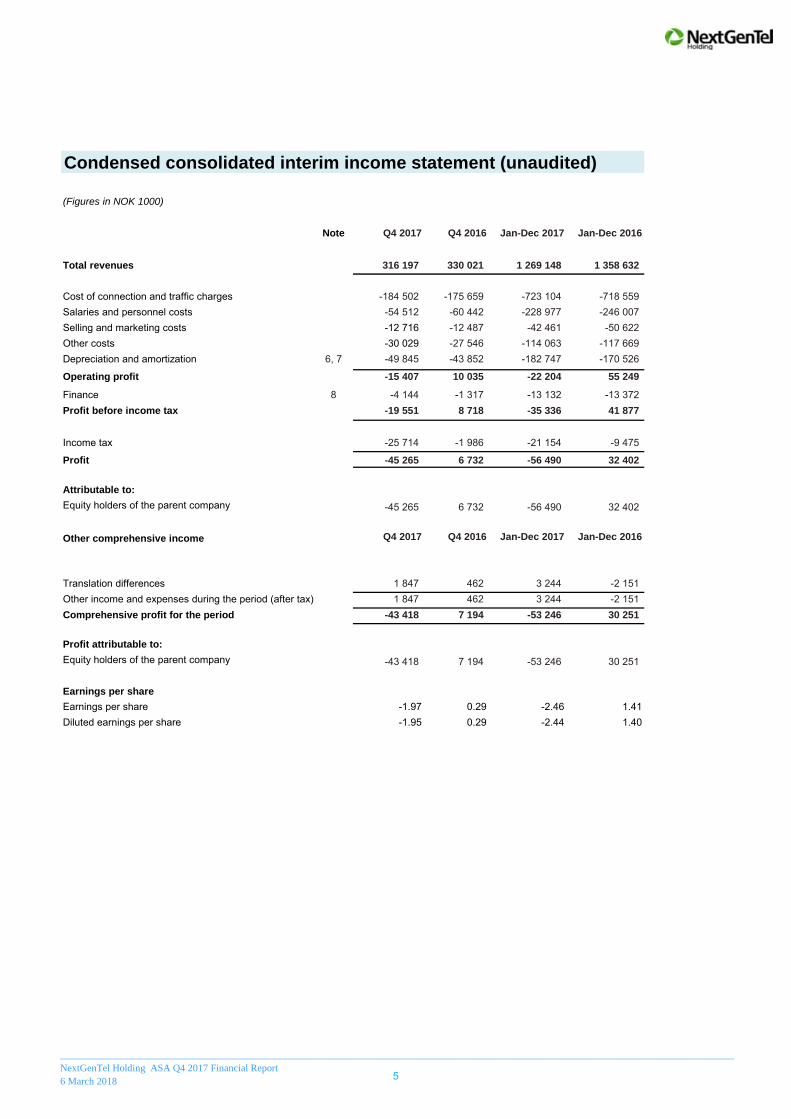
Condensed consolidated interim income statement (unaudited)
(Figures in NOK 1000)
Note Q4 2017 Q4 2016 Jan-Dec 2017 Jan-Dec 2016
Total revenues 316 197 330 021 1 269 148 1 358 632
Cost of connection and traffic charges -184 502 -175 659 -723 104 -718 559 Salaries and personnel costs -54 512 -60 442 -228 977 -246 007 Selling and marketing costs -12 716 -12 487 -42 461 -50 622 Other costs -30 029 -27 546 -114 063 -117 669 Depreciation and amortization 6, 7 -49 845 -43 852 -182 747 -170 526
Operating profit -15 407 10 035 -22 204 55 249
Finance 8 -4 144 -1 317 -13 132 -13 372 Profit before income tax -19 551 8 718 -35 336 41 877
Income tax -25 714 -1 986 -21 154 -9 475
Profit -45 265 6 732 -56 490 32 402
Attributable to:
Equity holders of the parent company -45 265 6 732 -56 490 32 402
Other comprehensive income Q4 2017 Q4 2016 Jan-Dec 2017 Jan-Dec 2016
Translation differences 1 847 462 3 244 -2 151 Other income and expenses during the period (after tax) 1 847 462 3 244 -2 151 Comprehensive profit for the period -43 418 7 194 -53 246 30 251
Profit attributable to:
Equity holders of the parent company -43 418 7 194 -53 246 30 251
Earnings per share
Earnings per share -1.97 0.29 -2.46 1.41Diluted earnings per share -1.95 0.29 -2.44 1.40
____________________________________________________________________________________________________________________________________
NextGenTel Holding ASA Q4 2017 Financial Report
6 March 20185
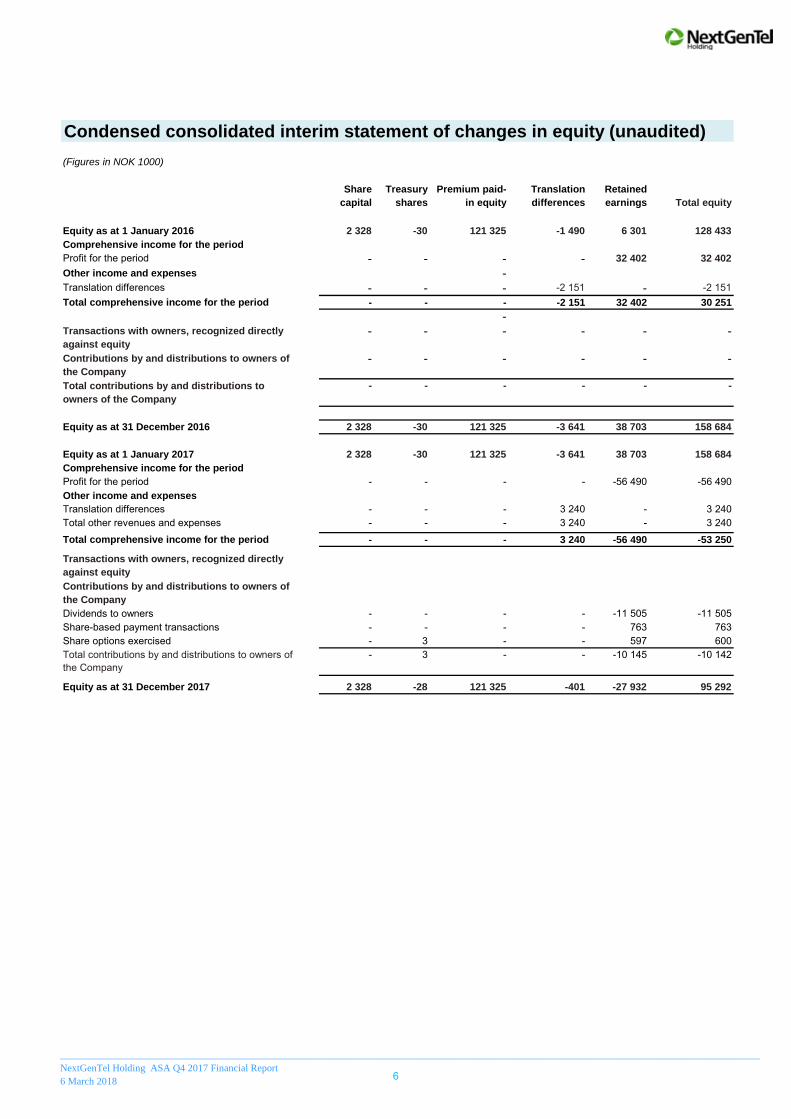
Condensed consolidated interim statement of changes in equity (unaudited)
(Figures in NOK 1000)
Share
capital
Treasury
shares
Premium paid-
in equity
Translation
differences
Retained
earnings
Total equity
Equity as at 1 January 2016 2 328 -30 121 325 -1 490 6 301 128 433
Comprehensive income for the period
Profit for the period - - - - 32 402 32 402
Other income and expenses - Translation differences - - - -2 151 - -2 151Total comprehensive income for the period - - - -2 151 32 402 30 251
- Transactions with owners, recognized directly
against equity
- - - - - -
Contributions by and distributions to owners of
the Company
- - - - - -
Total contributions by and distributions to
owners of the Company
- - - - - -
Equity as at 31 December 2016 2 328 -30 121 325 -3 641 38 703 158 684
Equity as at 1 January 2017 2 328 -30 121 325 -3 641 38 703 158 684
Comprehensive income for the period
Profit for the period - - - - -56 490 -56 490 Other income and expenses
Translation differences - - - 3 240 - 3 240 Total other revenues and expenses - - - 3 240 - 3 240
Total comprehensive income for the period - - - 3 240 -56 490 -53 250
Transactions with owners, recognized directly
against equity
Contributions by and distributions to owners of
the Company
Dividends to owners - - - - -11 505 -11 505 Share-based payment transactions - - - - 763 763 Share options exercised - 3 - - 597 600 Total contributions by and distributions to owners of the Company
- 3 - - -10 145 -10 142
Equity as at 31 December 2017 2 328 -28 121 325 -401 -27 932 95 292
_________________________________________________________________________________________________________________________________________
NextGenTel Holding ASA Q4 2017 Financial Report
6 March 20186
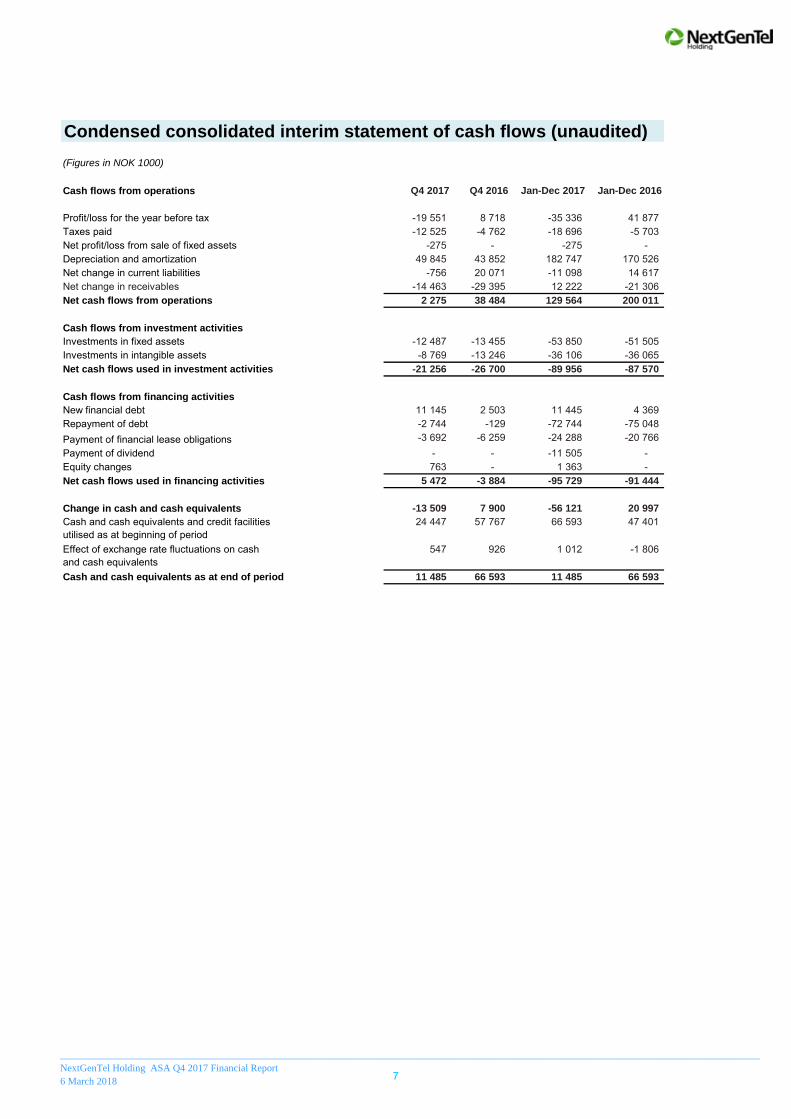
Condensed consolidated interim statement of cash flows (unaudited)
(Figures in NOK 1000)
Cash flows from operations Q4 2017 Q4 2016 Jan-Dec 2017 Jan-Dec 2016
Profit/loss for the year before tax -19 551 8 718 -35 336 41 877 Taxes paid -12 525 -4 762 -18 696 -5 703 Net profit/loss from sale of fixed assets -275 - -275 - Depreciation and amortization 49 845 43 852 182 747 170 526 Net change in current liabilities -756 20 071 -11 098 14 617 Net change in receivables -14 463 -29 395 12 222 -21 306 Net cash flows from operations 2 275 38 484 129 564 200 011
Cash flows from investment activities
Investments in fixed assets -12 487 -13 455 -53 850 -51 505 Investments in intangible assets -8 769 -13 246 -36 106 -36 065 Net cash flows used in investment activities -21 256 -26 700 -89 956 -87 570
Cash flows from financing activities
New financial debt 11 145 2 503 11 445 4 369 Repayment of debt -2 744 -129 -72 744 -75 048
-3 692 -6 259 -24 288 -20 766 Payment of dividend - - -11 505 - Equity changes 763 - 1 363 - Net cash flows used in financing activities 5 472 -3 884 -95 729 -91 444
Change in cash and cash equivalents -13 509 7 900 -56 121 20 997
24 447 57 767 66 593 47 401
Effect of exchange rate fluctuations on cash and cash equivalents
547 926 1 012 -1 806
Cash and cash equivalents as at end of period 11 485 66 593 11 485 66 593
Cash and cash equivalents and credit facilities utilised as at beginning of period
Payment of financial lease obligations
_________________________________________________________________________________________________________________________________________
NextGenTel Holding ASA Q4 2017 Financial Report
6 March 20187
NextGenTel Holding ASA Notes to the condensed consolidated interim financial statements (unaudited)
_________________________________________________________________________________________________ NextGenTel Holding ASA Q4 2017 Financial Report 6 March 2018
Note 1: Reporting entity
NextGenTel Holding ASA (the “Company”) is a company domiciled in Oslo, Norway. These December 2017 condensed
consolidated interim financial statements of NextGenTel Holding ASA and its subsidiaries (together “the Group”) are
for the twelve months ended 31 December 2017.
The consolidated financial statements of the Group as at and for the year ended 31 December 2016 are available at
www.nextgentelholding.com/investor_relations.
Note 2: Statement of compliance
These condensed consolidated interim financial statements of NextGenTel Holding ASA Group have been prepared in
accordance with rules and regulations from Oslo Stock Exchange and International Financial Reporting Standard (IFRS)
IAS 34, Interim Financial Reporting. They do not include all of the information required for full annual financial
statements, and should be read in conjunction with the consolidated financial statements of the Group as at and for
the year ended 31 December 2016.
These condensed consolidated interim financial statements were approved by the Board of Directors on 5 March
2018.
Note 3: Significant accounting policies
These condensed consolidated interim financial statements have been prepared under the historical cost convention.
They have been prepared under the same accounting principles as those set out in the consolidated financial
statements of the Group as at and for the year ended 31 December 2016.
Note 4: Estimates
The preparation of interim financial statements requires management to make judgments, estimates and assumptions
that affect the application of accounting policies and the reported amounts of assets and liabilities, income and
expense. Actual results may differ from these estimates.
In preparing these condensed consolidated interim financial statements, the significant judgments made by
management in applying the Group’s accounting policies and the key sources of estimation uncertainty were the same
as those that applied to the consolidated financial statements as at and for the year ended 31 December 2016.
8
Geographical segments
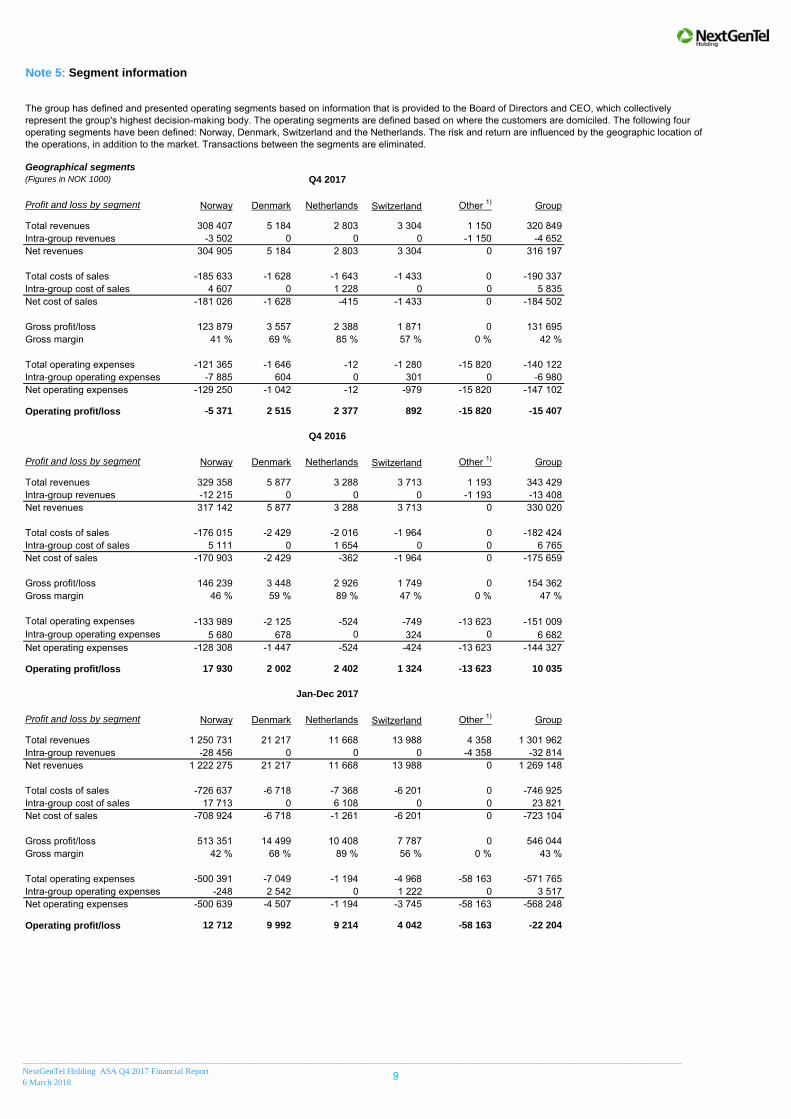
(Figures in NOK 1000) Q4 2017
Profit and loss by segment Norway Denmark Netherlands Switzerland Other 1) Group
Total revenues 308 407 5 184 2 803 3 304 1 150 320 849Intra-group revenues -3 502 0 0 0 -1 150 -4 652Net revenues 304 905 5 184 2 803 3 304 0 316 197
Total costs of sales -185 633 -1 628 -1 643 -1 433 0 -190 337Intra-group cost of sales 4 607 0 1 228 0 0 5 835Net cost of sales -181 026 -1 628 -415 -1 433 0 -184 502
Gross profit/loss 123 879 3 557 2 388 1 871 0 131 695Gross margin 41 % 69 % 85 % 57 % 0 % 42 %
Total operating expenses -121 365 -1 646 -12 -1 280 -15 820 -140 122Intra-group operating expenses -7 885 604 0 301 0 -6 980Net operating expenses -129 250 -1 042 -12 -979 -15 820 -147 102
Operating profit/loss -5 371 2 515 2 377 892 -15 820 -15 407
Q4 2016
Profit and loss by segment Norway Denmark Netherlands Switzerland Other 1) Group
Total revenues 329 358 5 877 3 288 3 713 1 193 343 429Intra-group revenues -12 215 0 0 0 -1 193 -13 408Net revenues 317 142 5 877 3 288 3 713 0 330 020
Total costs of sales -176 015 -2 429 -2 016 -1 964 0 -182 424Intra-group cost of sales 5 111 0 1 654 0 0 6 765Net cost of sales -170 903 -2 429 -362 -1 964 0 -175 659
Gross profit/loss 146 239 3 448 2 926 1 749 0 154 362Gross margin 46 % 59 % 89 % 47 % 0 % 47 %
Total operating expenses -133 989 -2 125 -524 -749 -13 623 -151 009Intra-group operating expenses 5 680 678 0 324 0 6 682Net operating expenses -128 308 -1 447 -524 -424 -13 623 -144 327
Operating profit/loss 17 930 2 002 2 402 1 324 -13 623 10 035
Jan-Dec 2017
Profit and loss by segment Norway Denmark Netherlands Switzerland Other 1) Group
Total revenues 1 250 731 21 217 11 668 13 988 4 358 1 301 962Intra-group revenues -28 456 0 0 0 -4 358 -32 814Net revenues 1 222 275 21 217 11 668 13 988 0 1 269 148
Total costs of sales -726 637 -6 718 -7 368 -6 201 0 -746 925Intra-group cost of sales 17 713 0 6 108 0 0 23 821Net cost of sales -708 924 -6 718 -1 261 -6 201 0 -723 104
Gross profit/loss 513 351 14 499 10 408 7 787 0 546 044Gross margin 42 % 68 % 89 % 56 % 0 % 43 %
Total operating expenses -500 391 -7 049 -1 194 -4 968 -58 163 -571 765Intra-group operating expenses -248 2 542 0 1 222 0 3 517Net operating expenses -500 639 -4 507 -1 194 -3 745 -58 163 -568 248
Operating profit/loss 12 712 9 992 9 214 4 042 -58 163 -22 204
Note 5: Segment information
The group has defined and presented operating segments based on information that is provided to the Board of Directors and CEO, which collectively represent the group's highest decision-making body. The operating segments are defined based on where the customers are domiciled. The following four operating segments have been defined: Norway, Denmark, Switzerland and the Netherlands. The risk and return are influenced by the geographic location of the operations, in addition to the market. Transactions between the segments are eliminated.
_________________________________________________________________________________________________________________________________________________________
NextGenTel Holding ASA Q4 2017 Financial Report
6 March 20189
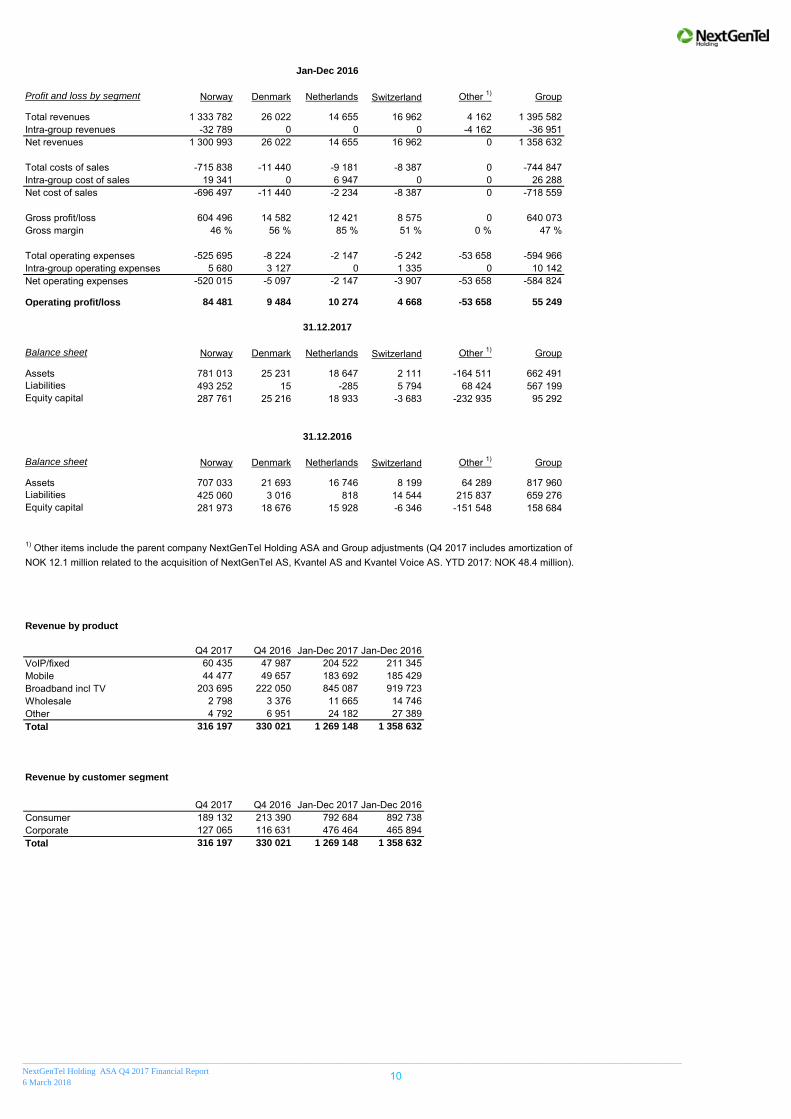
Jan-Dec 2016
Profit and loss by segment Norway Denmark Netherlands Switzerland Other 1) Group
Total revenues 1 333 782 26 022 14 655 16 962 4 162 1 395 582Intra-group revenues -32 789 0 0 0 -4 162 -36 951Net revenues 1 300 993 26 022 14 655 16 962 0 1 358 632
Total costs of sales -715 838 -11 440 -9 181 -8 387 0 -744 847Intra-group cost of sales 19 341 0 6 947 0 0 26 288Net cost of sales -696 497 -11 440 -2 234 -8 387 0 -718 559
Gross profit/loss 604 496 14 582 12 421 8 575 0 640 073Gross margin 46 % 56 % 85 % 51 % 0 % 47 %
Total operating expenses -525 695 -8 224 -2 147 -5 242 -53 658 -594 966Intra-group operating expenses 5 680 3 127 0 1 335 0 10 142Net operating expenses -520 015 -5 097 -2 147 -3 907 -53 658 -584 824
Operating profit/loss 84 481 9 484 10 274 4 668 -53 658 55 249
31.12.2017
Balance sheet Norway Denmark Netherlands Switzerland Other 1) Group
Assets 781 013 25 231 18 647 2 111 -164 511 662 491Liabilities 493 252 15 -285 5 794 68 424 567 199Equity capital 287 761 25 216 18 933 -3 683 -232 935 95 292
31.12.2016
Balance sheet Norway Denmark Netherlands Switzerland Other 1) Group
Assets 707 033 21 693 16 746 8 199 64 289 817 960Liabilities 425 060 3 016 818 14 544 215 837 659 276Equity capital 281 973 18 676 15 928 -6 346 -151 548 158 684
1) Other items include the parent company NextGenTel Holding ASA and Group adjustments (Q4 2017 includes amortization of NOK 12.1 million related to the acquisition of NextGenTel AS, Kvantel AS and Kvantel Voice AS. YTD 2017: NOK 48.4 million).
Revenue by product
Q4 2017 Q4 2016 Jan-Dec 2017 Jan-Dec 2016VoIP/fixed 60 435 47 987 204 522 211 345Mobile 44 477 49 657 183 692 185 429Broadband incl TV 203 695 222 050 845 087 919 723Wholesale 2 798 3 376 11 665 14 746Other 4 792 6 951 24 182 27 389Total 316 197 330 021 1 269 148 1 358 632
Revenue by customer segment
Q4 2017 Q4 2016 Jan-Dec 2017 Jan-Dec 2016Consumer 189 132 213 390 792 684 892 738Corporate 127 065 116 631 476 464 465 894Total 316 197 330 021 1 269 148 1 358 632
_________________________________________________________________________________________________________________________________________________________
NextGenTel Holding ASA Q4 2017 Financial Report
6 March 201810
(Figures in NOK 1000)
Q4 2017 Q4 2016 Jan-Dec 2017 Jan-Dec 2016
Equipment
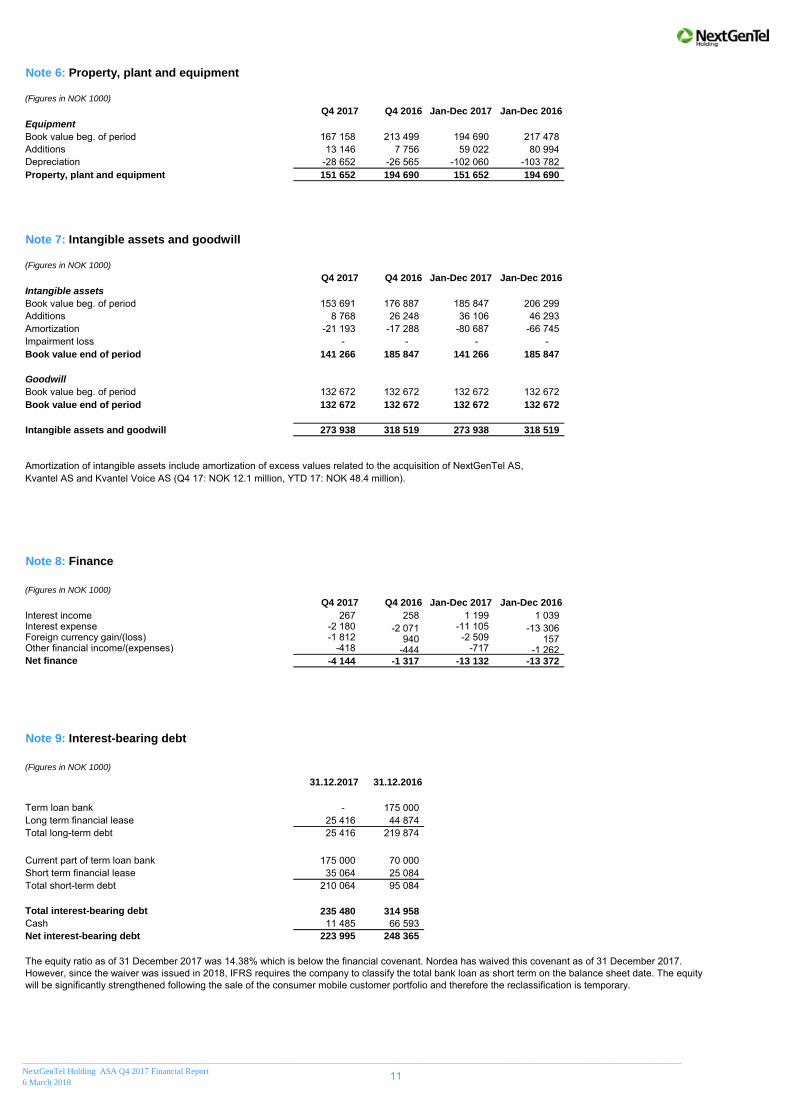
Book value beg. of period 167 158 213 499 194 690 217 478 Additions 13 146 7 756 59 022 80 994 Depreciation -28 652 -26 565 -102 060 -103 782 Property, plant and equipment 151 652 194 690 151 652 194 690
(Figures in NOK 1000)
Q4 2017 Q4 2016 Jan-Dec 2017 Jan-Dec 2016
Intangible assets
Book value beg. of period 153 691 176 887 185 847 206 299 Additions 8 768 26 248 36 106 46 293 Amortization -21 193 -17 288 -80 687 -66 745 Impairment loss - - - - Book value end of period 141 266 185 847 141 266 185 847
Goodwill
Book value beg. of period 132 672 132 672 132 672 132 672 Book value end of period 132 672 132 672 132 672 132 672
Intangible assets and goodwill 273 938 318 519 273 938 318 519
Amortization of intangible assets include amortization of excess values related to the acquisition of NextGenTel AS, Kvantel AS and Kvantel Voice AS (Q4 17: NOK 12.1 million, YTD 17: NOK 48.4 million).
(Figures in NOK 1000)
Q4 2017 Q4 2016 Jan-Dec 2017 Jan-Dec 2016
Interest income 267 258 1 199 1 039 Interest expense -2 180 -2 071 -11 105 -13 306 Foreign currency gain/(loss) -1 812 940 -2 509 157 Other financial income/(expenses) -418 -444 -717 -1 262 Net finance -4 144 -1 317 -13 132 -13 372
(Figures in NOK 1000)
31.12.2017 31.12.2016
Term loan bank - 175 000 Long term financial lease 25 416 44 874 Total long-term debt 25 416 219 874
Current part of term loan bank 175 000 70 000 Short term financial lease 35 064 25 084 Total short-term debt 210 064 95 084
Total interest-bearing debt 235 480 314 958
Cash 11 485 66 593 Net interest-bearing debt 223 995 248 365
Note 6: Property, plant and equipment
Note 7: Intangible assets and goodwill
Note 8: Finance
Note 9: Interest-bearing debt
The equity ratio as of 31 December 2017 was 14.38% which is below the financial covenant. Nordea has waived this covenant as of 31 December 2017. However, since the waiver was issued in 2018, IFRS requires the company to classify the total bank loan as short term on the balance sheet date. The equity will be significantly strengthened following the sale of the consumer mobile customer portfolio and therefore the reclassification is temporary.
_________________________________________________________________________________________________________________________________________________________
NextGenTel Holding ASA Q4 2017 Financial Report
6 March 201811
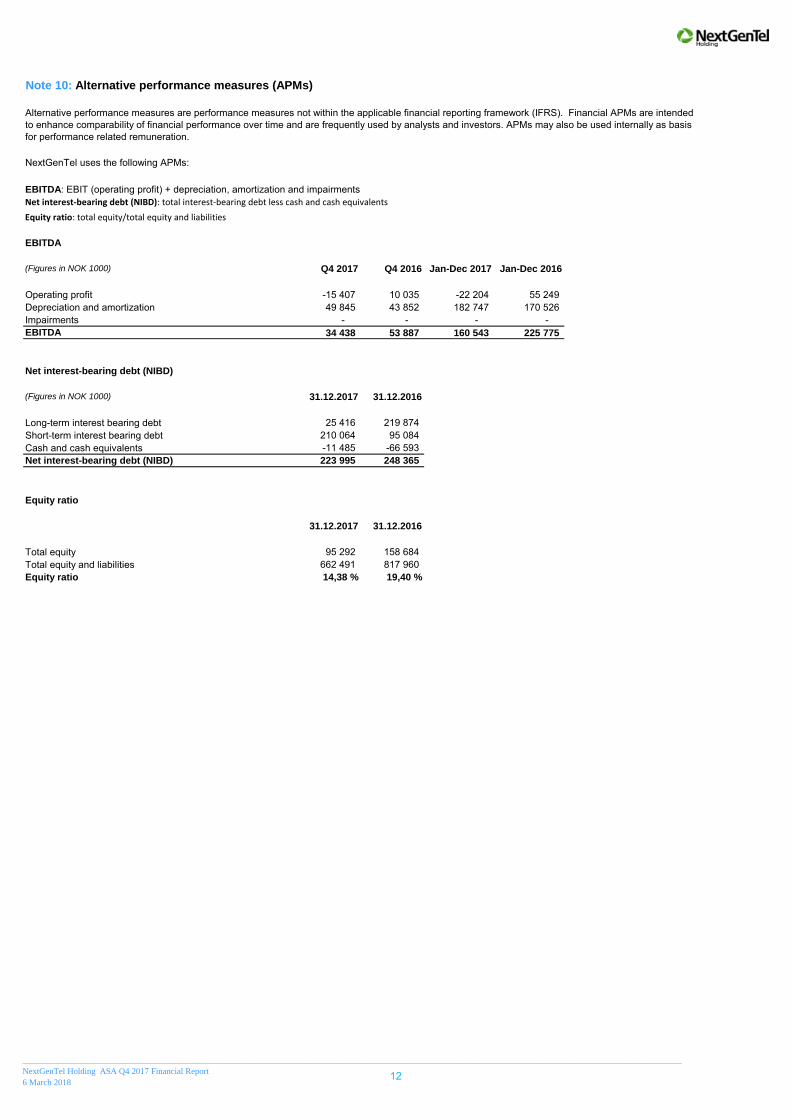
Net interest-bearing debt (NIBD): total interest-bearing debt less cash and cash equivalents
Equity ratio: total equity/total equity and liabilities
EBITDA
(Figures in NOK 1000) Q4 2017 Q4 2016 Jan-Dec 2017 Jan-Dec 2016
Operating profit -15 407 10 035 -22 204 55 249 Depreciation and amortization 49 845 43 852 182 747 170 526 Impairments - - - - EBITDA 34 438 53 887 160 543 225 775
Net interest-bearing debt (NIBD)
(Figures in NOK 1000) 31.12.2017 31.12.2016
Long-term interest bearing debt 25 416 219 874 Short-term interest bearing debt 210 064 95 084 Cash and cash equivalents -11 485 -66 593 Net interest-bearing debt (NIBD) 223 995 248 365
Equity ratio
31.12.2017 31.12.2016
Total equity 95 292 158 684 Total equity and liabilities 662 491 817 960 Equity ratio 14,38 % 19,40 %
Note 10: Alternative performance measures (APMs)
Alternative performance measures are performance measures not within the applicable financial reporting framework (IFRS). Financial APMs are intended to enhance comparability of financial performance over time and are frequently used by analysts and investors. APMs may also be used internally as basis for performance related remuneration.
NextGenTel uses the following APMs:
EBITDA: EBIT (operating profit) + depreciation, amortization and impairments
_________________________________________________________________________________________________________________________________________________________
NextGenTel Holding ASA Q4 2017 Financial Report
6 March 201812
____________________________________________________________________________________________________________
NextGenTel Holding ASA Q4 2017 Financial Report
6 March 2018
Company Facts
NextGenTel Holding ASA
Harbitzalleen 2A
P.O. Box 54 Skøyen
0212 Oslo
Telephone: +47 2167 3500
Homepage: www.nextgentelholding.com
Company reg. number: 985 968 098
Founded: 12 August 2003
Board of Directors
Lars B. Thoresen (Chairman)
Ellen Hanetho
Kari Mette Toverud
Espen Fjogstad
Vidar Skogedal (employee repr.)
Linn Anette Husøy (employee repr.)
Group Management
Eirik Lunde, Chief Executive Officer
Gaute Wigenstad Krekling, Chief Financial Officer
Roy Børsheim, Director Consumer
Ole Jacob Moldestad, Director Corporate
Investor Relations
Gaute Wigenstad Krekling, Chief Financial Officer
Telephone: +47 986 86 973
Email address: [email protected]
Web: http://www.nextgentelholding.com
Financial Calendar
4th
quarter 2017: 6 March at 9:00
1st quarter 2018: 26 April at 09:00
2nd
quarter 2018: 16 August at 09:00
3rd
quarter 2018: 25 October at 09:00
Annual general meeting: 24 April at 15:00
Equity Research Coverage
Company Contact Phone
Indep Research LTD Toni Yordanov +44 (0)776 139 1953
13