Embed Size (px)
Citation preview
Comprehensive Annual
Financial Report
Katy Independent School District
6301 South Stadium Lane
EO. Box 159
Katy, Texas 77492-0159

KATY INDEPENDENT
SCHOOL DISTRICT
COMPREHENSIVE ANNUAL
FINANCIAL REPORT
FOR THE YEAR ENDED AUGUST 31, 2013
PREPARED BY
THE FINANCE DEPARTMENT
William L. Moore
Chief Financial Officer
Christopher J. Smith
Business Manager
Elizabeth A. Haven
Accounting Supervisor
Anne M. Faichtinger
Finance Officer
6301 S. Stadium Lane
P.O. Box 159
Katy, Texas 77492-0159
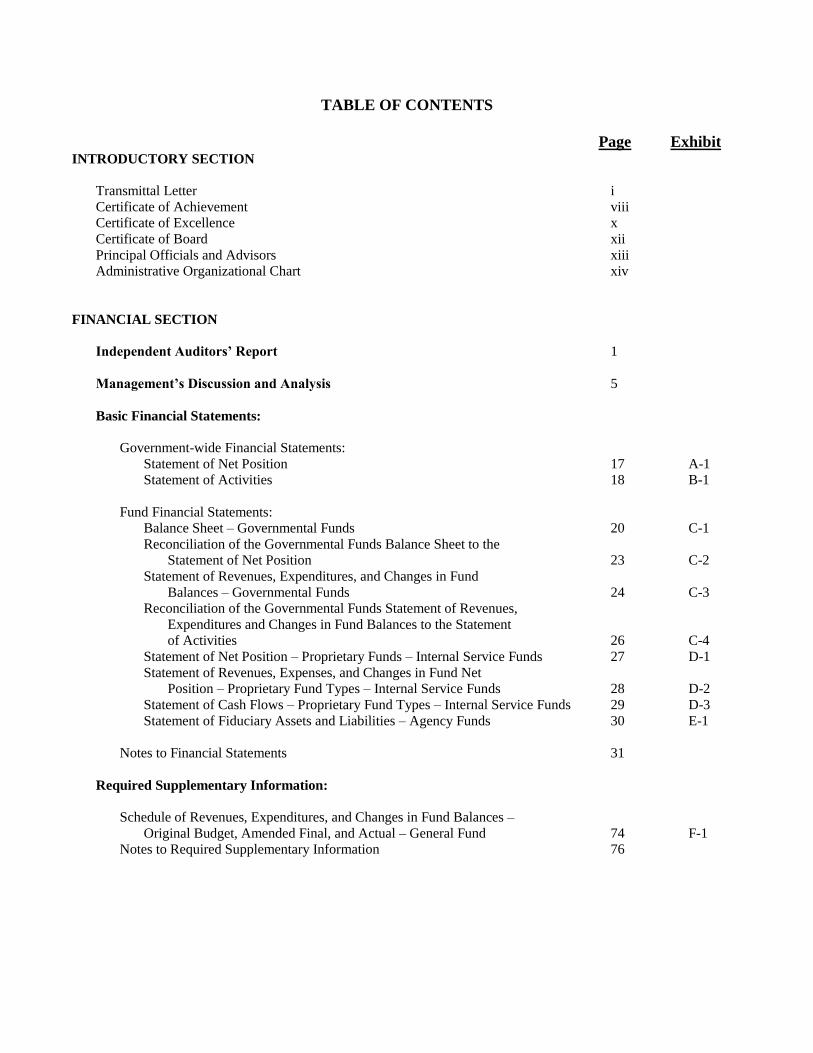
TABLE OF CONTENTS
Page Exhibit INTRODUCTORY SECTION
Transmittal Letter i
Certificate of Achievement viii
Certificate of Excellence x
Certificate of Board xii
Principal Officials and Advisors xiii
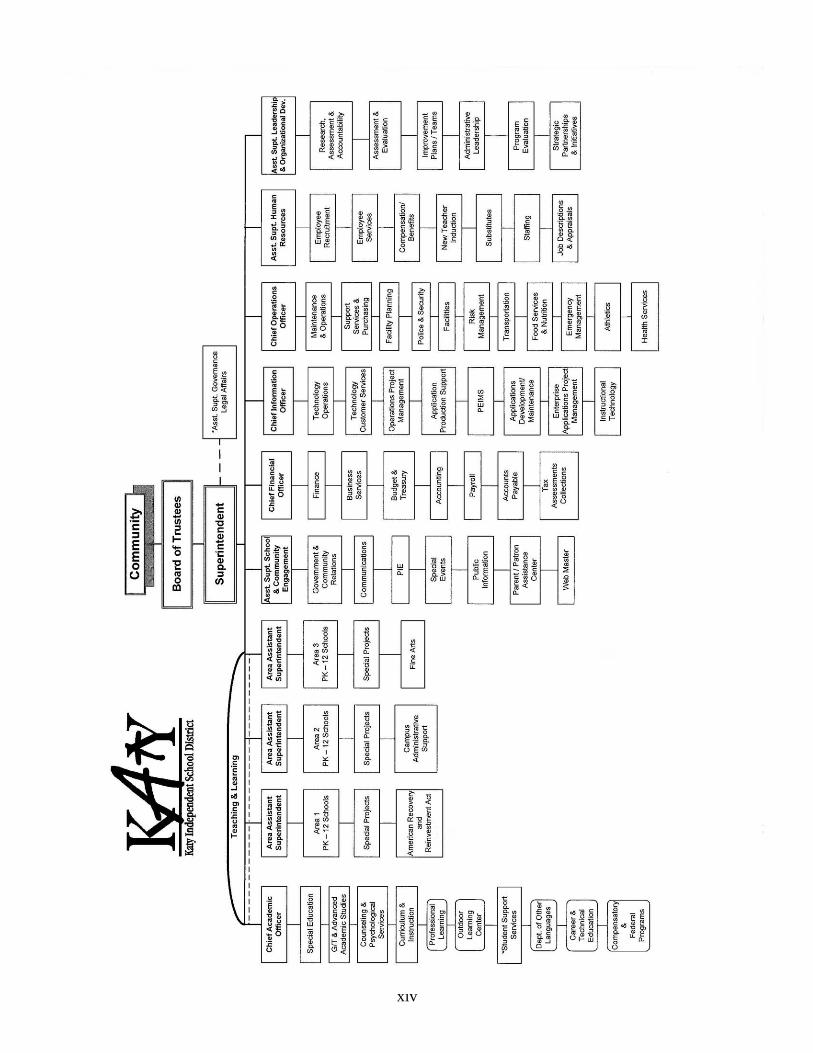
Administrative Organizational Chart xiv
FINANCIAL SECTION
Independent Auditors’ Report 1
Management’s Discussion and Analysis 5
Basic Financial Statements:
Government-wide Financial Statements:
Statement of Net Position 17 A-1
Statement of Activities 18 B-1
Fund Financial Statements:
Balance Sheet – Governmental Funds 20 C-1
Reconciliation of the Governmental Funds Balance Sheet to the
Statement of Net Position 23 C-2
Statement of Revenues, Expenditures, and Changes in Fund
Balances – Governmental Funds 24 C-3
Reconciliation of the Governmental Funds Statement of Revenues,
Expenditures and Changes in Fund Balances to the Statement
of Activities 26 C-4
Statement of Net Position – Proprietary Funds – Internal Service Funds 27 D-1
Statement of Revenues, Expenses, and Changes in Fund Net
Position – Proprietary Fund Types – Internal Service Funds 28 D-2
Statement of Cash Flows – Proprietary Fund Types – Internal Service Funds 29 D-3
Statement of Fiduciary Assets and Liabilities – Agency Funds 30 E-1
Notes to Financial Statements 31
Required Supplementary Information:
Schedule of Revenues, Expenditures, and Changes in Fund Balances –
Original Budget, Amended Final, and Actual – General Fund 74 F-1
Notes to Required Supplementary Information 76
TABLE OF CONTENTS
Page Exhibit FINANCIAL SECTION (continued)
Other Supplementary Information:
Comparative Statements, Combining Statements, and Budget Comparisons:
General Fund: Comparative Balance Sheet – General Fund 80 G-1
Schedule of Revenues – Budget and Actual – General Fund 81 G-2
Schedule of Expenditures – Budget and Actual – General Fund 82 G-3
Debt Service Fund: Comparative Balance Sheet – Debt Service Fund 89 H-1
Schedule of Revenues, Expenditures, and Changes in Fund Balance –
Original Budget, Amended Final, and Actual – Debt Service Fund 90 H-2
Capital Projects Fund: Comparative Balance Sheet – Capital Projects Fund 94 I-1
Schedule of Revenues, Expenditures, and Changes in Fund Balance –
Capital Projects Fund 96 I-2
Nonmajor Governmental Funds: Combining Balance Sheet – Nonmajor Governmental Funds 102 J-1
Combining Statement of Revenues, Expenditures, and Changes
in Fund Balances – Nonmajor Governmental Funds 110 J-2
Schedule of Revenues, Expenditures, and Changes in Fund Balances
Original Budget, Amended Final, and Actual – Nutrition and Food Service 118 J-3
Internal Service Funds: Combining Statement of Net Position – Internal Service Funds 122 K-1
Combining Statement of Revenues, Expenses, and Changes in Fund Net Position –
Internal Service Funds 123 K-2
Combining Statement of Cash Flows – Internal Service Funds 124 K-3
Fiduciary Funds: Statement of Changes in Fiduciary Assets and Liabilities – Agency Funds 126 L-1
Schedule of Changes in Due to Student Groups – Agency Funds 127 L-2
Capital Assets Used in the Operations of Governmental Funds: Comparative Schedule by Source 130 M-1
Schedule by Function and Activity 131 M-2
Schedule of Changes by Function and Activity 134 M-3
General Long-Term Debt on Governmental Funds: Bond Schedule 138 N-1
Compliance Schedules: Schedule of Delinquent Taxes Receivable 144 O-1
Schedule of Expenditures for Computation of Indirect Costs for 2014-2015 146 O-2
Schedule of Required Responses to Selected School FIRST Indicators 147 O-3
TABLE OF CONTENTS
Page Exhibit STATISTICAL SECTION (Unaudited)
Financial Trends Information: Net Position by Component – Last Ten Fiscal Years 152 I
Changes in Net Position – Last Ten Fiscal Years 154 II
Fund Balances of Governmental Funds – Last Ten Fiscal Years 156 III
Changes in Fund Balances – Last Ten Fiscal Years 158 IV
Revenue Capacity Information: Assessed Value and Actual Value of Taxable Property – Last Ten Fiscal Years 162 V
Property Tax Rates – Direct and Overlapping Governments –
Last Ten Fiscal Years 164 VI
Principal Taxpayers – Current Year and Nine Years Ago 168 VII
Property Tax Levies and Collections – Last Ten Fiscal Years 169 VIII
Debt Capacity Information: Ratios of Outstanding Debt by Type – Last Ten Fiscal Years 172 IX
Ratios of Net General Obligation Bonded Debt Outstanding –
Last Ten Fiscal Years 173 X
Direct and Overlapping Governmental Activities Debt 174 XI
Demographic and Economic Information: Demographic and Economic Statistics – Last Ten Fiscal Years 178 XII
Principal Employers – Current Year and Nine Years Ago 179 XIII
Operating Information:
Full-Time Equivalent District Employees by Position – Last Ten Fiscal Years 182 XIV
Operating Statistics – Last Ten Fiscal Years 184 XV
Teacher Base Salaries – Last Ten Fiscal Years 186 XVI
School Building Information – Last Ten Fiscal Years 188 XVII
Katy ISD Map and Facility Locations 200

INTRODUCTORY SECTION

THIS PAGE INTENTIONALLY LEFT BLANK
Katy Independent School District
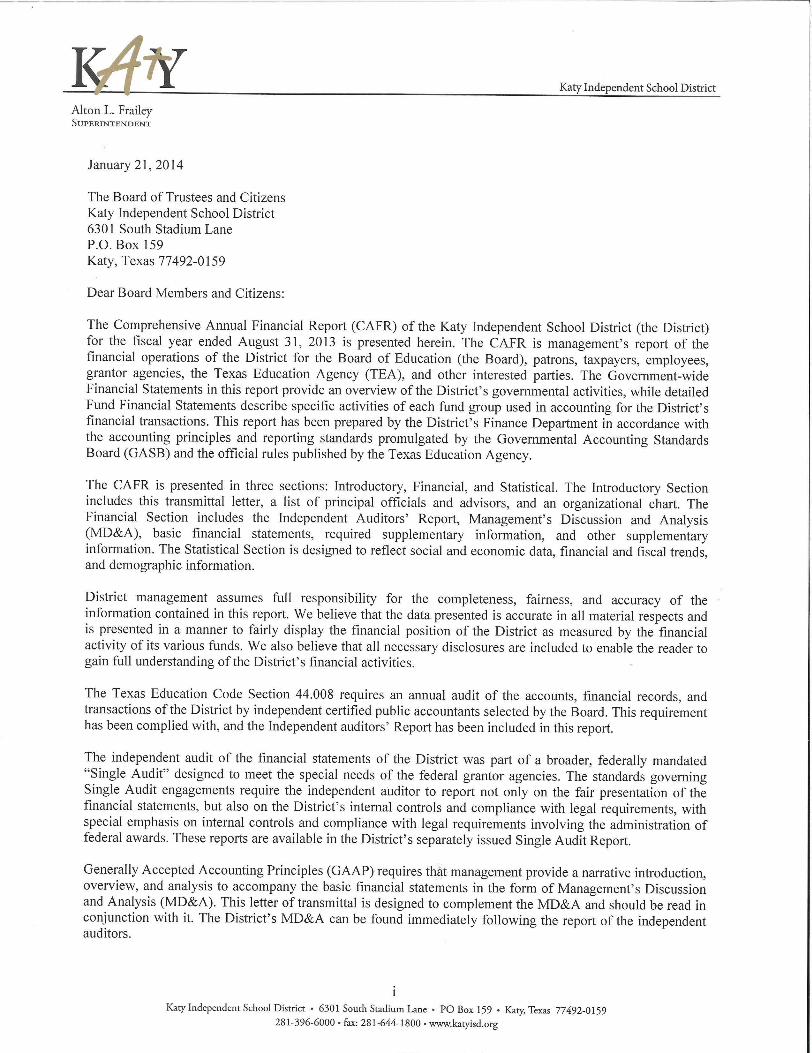
Alton L. FraileySUPERINTENDENT
January21,2014
The Board of Trustees and Citizens
Katy Independent School District
6301 South Stadium Lane
P.O. Box 159
Katy, Texas 77492-0159
Dear Board Members and Citizens:
The Comprehensive Annual Financial Report (CAFR) of the Katy Independent School District (the District)
for the fiscal year ended August 31, 2013 is presented herein. The CAFR is management's report of the
financial operations of the District for the Board of Education (the Board), patrons, taxpayers, employees,
grantor agencies, the Texas Education Agency (TEA), and other interested parties. The Government-wide
Financial Statements in this report provide an overview of the District's governmental activities, while detailed
Fund Financial Statements describe specific activities of each fund group used in accounting for the District's
financial transactions. This report has been prepared by the District's Finance Department in accordance with
the accounting principles and reporting standards promulgated by the Governmental Accounting Standards
Board (GASB) and the official rules published by the Texas Education Agency.
The CAFR is presented in three sections: Introductory, Financial, and Statistical. The Introductory Section
includes this transmittal letter, a list of principal officials and advisors, and an organizational chart. The
Financial Section includes the Independent Auditors' Report, Management's Discussion and Analysis
(MD&A), basic financial statements, required supplementary information, and other supplementary
information. The Statistical Section is designed to reflect social and economic data, financial and fiscal trends,
and demographic information.
District management assumes full responsibility for the completeness, fairness, and accuracy of the
information contained in this report. We believe that the data presented is accurate in all material respects and
is presented in a manner to fairly display the financial position of the District as measured by the financial
activity of its various funds. We also believe that all necessary disclosures are included to enable the reader to
gain full understanding of the District's financial activities.
The Texas Education Code Section 44.008 requires an annual audit of the accounts, financial records, and
transactions of the District by independent certified public accountants selected by the Board. This requirement
has been complied with, and the Independent auditors' Report has been included in this report.
The independent audit of the financial statements of the District was part of a broader, federally mandated
"Single Audit" designed to meet the special needs of the federal grantor agencies. The standards governing
Single Audit engagements require the independent auditor to report not only on the fair presentation of the
financial statements, but also on the District's internal controls and compliance with legal requirements, with
special emphasis on internal controls and compliance with legal requirements involving the administration of
federal awards. These reports are available in the District's separately issued Single Audit Report.
Generally Accepted Accounting Principles (GAAP) requires that management provide a narrative introduction,
overview, and analysis to accompany the basic financial statements in the form of Management's Discussion
and Analysis (MD&A). This letter of transmittal is designed to complement the MD&A and should be read in
conjunction with it. The District's MD&A can be found immediately following the report of the independentauditors.
iKaty Independent School District • 6301 South Stadium Lane • PO Box 159 . Katy, Texas 77492-0159
281-396-6000 • fax: 281-644-1800 • www.katyisd.org
ii
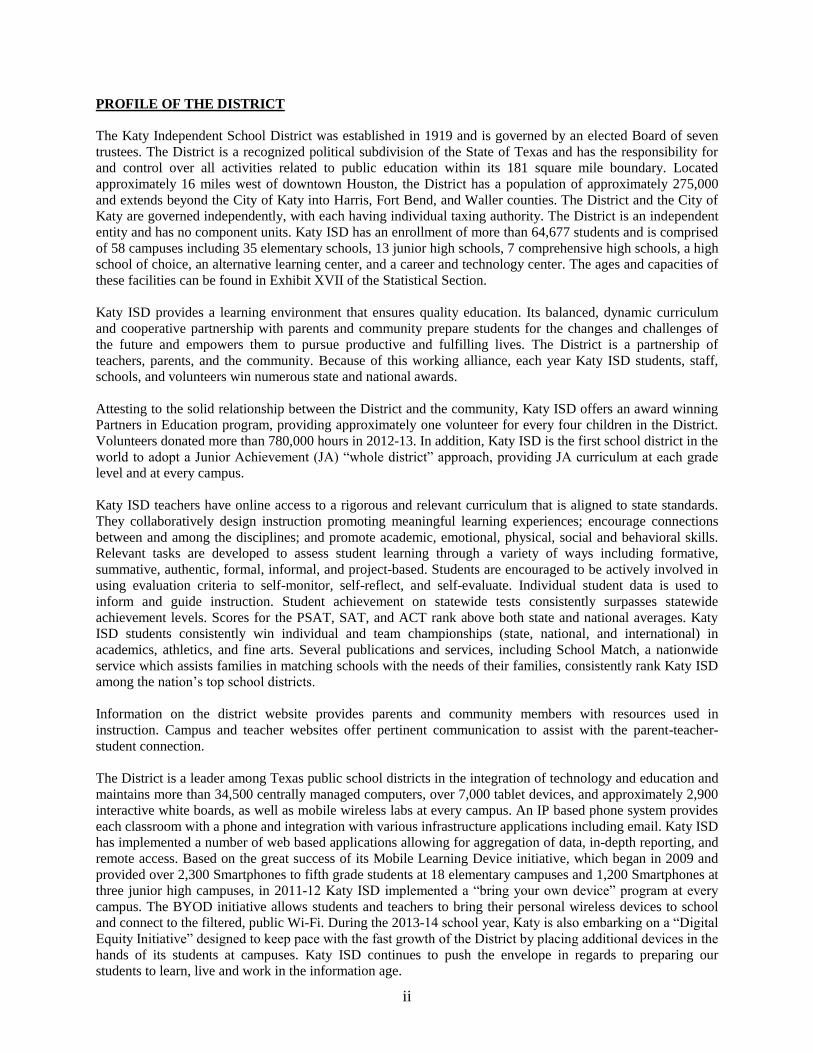
PROFILE OF THE DISTRICT
The Katy Independent School District was established in 1919 and is governed by an elected Board of seven
trustees. The District is a recognized political subdivision of the State of Texas and has the responsibility for
and control over all activities related to public education within its 181 square mile boundary. Located
approximately 16 miles west of downtown Houston, the District has a population of approximately 275,000
and extends beyond the City of Katy into Harris, Fort Bend, and Waller counties. The District and the City of
Katy are governed independently, with each having individual taxing authority. The District is an independent
entity and has no component units. Katy ISD has an enrollment of more than 64,677 students and is comprised
of 58 campuses including 35 elementary schools, 13 junior high schools, 7 comprehensive high schools, a high
school of choice, an alternative learning center, and a career and technology center. The ages and capacities of
these facilities can be found in Exhibit XVII of the Statistical Section.
Katy ISD provides a learning environment that ensures quality education. Its balanced, dynamic curriculum
and cooperative partnership with parents and community prepare students for the changes and challenges of
the future and empowers them to pursue productive and fulfilling lives. The District is a partnership of
teachers, parents, and the community. Because of this working alliance, each year Katy ISD students, staff,
schools, and volunteers win numerous state and national awards.
Attesting to the solid relationship between the District and the community, Katy ISD offers an award winning
Partners in Education program, providing approximately one volunteer for every four children in the District.
Volunteers donated more than 780,000 hours in 2012-13. In addition, Katy ISD is the first school district in the
world to adopt a Junior Achievement (JA) “whole district” approach, providing JA curriculum at each grade
level and at every campus.
Katy ISD teachers have online access to a rigorous and relevant curriculum that is aligned to state standards.
They collaboratively design instruction promoting meaningful learning experiences; encourage connections
between and among the disciplines; and promote academic, emotional, physical, social and behavioral skills.
Relevant tasks are developed to assess student learning through a variety of ways including formative,
summative, authentic, formal, informal, and project-based. Students are encouraged to be actively involved in
using evaluation criteria to self-monitor, self-reflect, and self-evaluate. Individual student data is used to
inform and guide instruction. Student achievement on statewide tests consistently surpasses statewide
achievement levels. Scores for the PSAT, SAT, and ACT rank above both state and national averages. Katy
ISD students consistently win individual and team championships (state, national, and international) in
academics, athletics, and fine arts. Several publications and services, including School Match, a nationwide
service which assists families in matching schools with the needs of their families, consistently rank Katy ISD
among the nation’s top school districts.
Information on the district website provides parents and community members with resources used in
instruction. Campus and teacher websites offer pertinent communication to assist with the parent-teacher-
student connection.
The District is a leader among Texas public school districts in the integration of technology and education and
maintains more than 34,500 centrally managed computers, over 7,000 tablet devices, and approximately 2,900
interactive white boards, as well as mobile wireless labs at every campus. An IP based phone system provides
each classroom with a phone and integration with various infrastructure applications including email. Katy ISD
has implemented a number of web based applications allowing for aggregation of data, in-depth reporting, and
remote access. Based on the great success of its Mobile Learning Device initiative, which began in 2009 and
provided over 2,300 Smartphones to fifth grade students at 18 elementary campuses and 1,200 Smartphones at
three junior high campuses, in 2011-12 Katy ISD implemented a “bring your own device” program at every
campus. The BYOD initiative allows students and teachers to bring their personal wireless devices to school and connect to the filtered, public Wi-Fi. During the 2013-14 school year, Katy is also embarking on a “Digital
Equity Initiative” designed to keep pace with the fast growth of the District by placing additional devices in the
hands of its students at campuses. Katy ISD continues to push the envelope in regards to preparing our
students to learn, live and work in the information age.
iii
Katy ISD is comprised of dedicated and aspiring professionals with a common goal “to do whatever it takes”
for student success. The emphasis is on meeting the needs of students through engaging instruction, a
supportive classroom environment, and a wide variety of extracurricular activities.
ECONOMIC CONDITION AND OUTLOOK
Local Economy
The area’s economy is diverse with concentrations in healthcare, real estate, oil and gas, commercial building,
retail trade, and service producing industries. Many employers recruit their professional workers from the west
Houston area; therefore, local educational institutions are a key component to producing employees with high
educational backgrounds. The greatest strength of the area’s economy is its human capital. Maintaining the
competitive advantage of having well-educated and highly compensated workers requires a number of
educational initiatives, including the public support of local schools as they enroll larger and more diverse
student bodies and the access to higher education for residents by public schools and businesses working with
local universities.
When one factors in the reputation of Katy ISD’s educational programs as reflected by its academic
achievements, the school district is expected to continue its strong growth and development. Amenities such as
the school system, proximity to employment and activity centers, and an effective transportation system
combine to attract new residents. Fueled by Houston’s robust energy and oil and gas sectors, several large
projects are occurring, including the ongoing construction of several master planned residential developments,
and the opening of facilities by Texas Medical Center staples like Texas Children’s, Methodist and Memorial
Herman Hospitals. In addition, residents will have more mobility options with access to I-10 and the continued
expansion of the Grand Parkway which will stretch across the northwest part of the district from I-10 to
Highway 290. These projects continue to stimulate residential and commercial growth with hotels, restaurants
and shopping centers leading the way.
Growth
According to American Schools and Universities Magazine, Katy ISD is the 64th
largest school district in the
nation and is the fourth fastest growing school district over the past 25 years of the 100 largest districts. With
2012-13 enrollments of 64,677 the District’s growth is showing no signs of stopping. The District’s latest
demographic report predicts that with moderate growth projections, over 86,000 students will attend Katy ISD
schools by the year 2020. There are many reasons for the District’s growth but a community survey revealed
that the primary reason new residents move to the Katy area is because of its schools.
It appears that the population of the District continues to grow and all indicators point to continued growth
over the next decade. This growth makes it imperative for the District to continue to plan wisely for the future.
A need for additional facilities continues to be a financial focal point of the District. A successful Bond
election was held in the fall of 2010 providing $459 million for the construction, renovation and equipping of
facilities and the purchase of land and buses. In August 2013, a new high school was completed along with
two comprehensive high school renovations to support the rapid enrollment growth and facility renewal and
improvement needs. Two new elementary schools are currently under construction and are scheduled to be
complete in the fall of 2014 as well.
The District is an active member of a coalition of fast-growing school districts that work with legislators to
address problems, needs, and challenges specific to districts in a fast-growth environment. Facility funding,
operating costs associated with additional facilities, tax rate limitations, and other problem areas experienced
by growing districts are the focus of the coalition.
iv
FINANCIAL INFORMATION
Accounting Systems
The Board of Trustees maintains a system of accounting controls designed to assist the administration in
meeting its responsibility for accurately reporting the financial condition of the District. The system is
designed to provide reasonable assurance that assets are safeguarded against loss, theft, or misuse so activities
can be recorded and transacted by the administration for the preparation of the District’s financial statements in
conformity with GAAP. Because the cost of internal controls should not outweigh their benefits, the District’s
comprehensive framework of internal controls has been designed to provide reasonable, rather than an
absolute, assurance that the financial statements will be free from material misstatement.
The cost of operating the District’s schools and the revenues to cover these costs are accounted for through the
General Fund. Food service operations and special programs funded by local, state and federal government
grants designed to accomplish a particular objective are accounted for in Special Revenue Funds.
The District accounts for school construction financed by bond sales through a Capital Projects Fund. A
specific portion of the tax rate is dedicated to payment of bond principal and interest. These transactions are
recorded in the Debt Service Fund.
The District has established Internal Service Funds to account for the transactions of its print shop operations,
self-insured workers’ compensation, and health insurance plans. Income for these funds is derived primarily
from charges to governmental funds based on usage.
Agency Funds are included in the CAFR in financial schedules of student activity funds. Accounting for these
funds is managed centrally by the Finance Department, using the same uniform accounting procedures and
guidelines as the General Fund.
The District’s accounting records are maintained on a modified accrual basis for governmental fund types and
a full accrual basis for the proprietary fund types as prescribed by Texas Education Agency Financial
Accountability System Resource Guide (Resource Guide). Additionally, the District has prepared the
Government-wide Financial Statements on the full accrual basis as required by Governmental Accounting
Standards Board Statement No. 34.
Financial data is submitted by the District to the Texas Education Agency through the Public Education
Information Management System (PEIMS). The data is then analyzed, reviewed and presented to the State
Board of Education.
Budgetary Process
State law requires that every local education agency in Texas prepare and file an annual budget of anticipated
revenues and expenditures with the Texas Education Agency. The budget itself is prepared utilizing a detailed
line item approach for governmental fund types and is prepared in accordance with the budgeting requirements
as outlined in the State Resource Guide. It is the intent of the District that the budgetary process results in the
most effective mix of the educational and financial resources available while attaining the goals and objectives
of the District. This includes the identification and prioritization of as many separate educational and education
support components as reasonably possible. These components are initially identified and prioritized by the
organizational manager most directly responsible and are later reviewed by principals, department heads,
central administrators, a budget committee, and finally the Board of Trustees.
This priority budgeting approach allows the District to establish layers of expenditures that can be matched to the anticipated revenues and desired levels of fund balances. The ultimate decision of the level of funding and
components to be funded is the responsibility of the Board.
v
The budget may be amended during the year to address unanticipated or changing needs of the District.
Changes to functional expenditure categories, revenue objects, or other sources and uses accounts require
Board approval.
Significant Financial Activities
Because of an expected shortfall, the Special Session of the 82nd
Texas Legislature cut public education
revenue by $5.4 billion. As it turns out the State’s biennial revenue exceeded the Comptroller’s projection by
at least $9 billion. The 83rd
Texas Legislature restored much, but not all of the lost funding. The public
education budget saw an increase of $6.2 billion over the last biennium, which included statewide student
growth. SB1 and HB 1025 contain the majority of changes to the state’s funding elements for the upcoming
biennium. The increase was made up of $3.4 billion for the Foundation School Program, $2.2 billion for
enrollment growth, $0.3 billion in various grants, and $0.3 billion for Teachers Retirement.
The District’s total tax base grew over $1.3 billion in 2012-13, an increase of 6.5%. The major growth
continued to be residential with single-family residential values increasing 2.7%. Residential properties,
including multi-family residences, comprised 65.2% of the total tax base, commercial property 29.2%, vacant
land 5.4%, and minerals less than 1%. Property located in Katy ISD is appraised by three County Appraisal
Districts (CAD’s).
The District has an inter-local agreement with the City of Katy to participate in a Tax Increment Reinvestment
Zone (TIRZ). Maintenance and Operation (M&O) taxes collected on real property located within the
reinvestment zone are contributed to the TIRZ and used to service bonded debt on a multipurpose facility
located within the zone. Tax contributions exceeding the annual debt requirements and related expenses are
returned to the District to be used within the TIRZ at the discretion of the District.
Technology is a high priority with expenditures focused on equipping new schools, the replacement of
equipment in existing schools, and providing new and updated software. The technology strategic plan and
long-range facility plan continue to be reviewed and modified as necessary to ensure continued support and
integration of technology both at the campus and support facilities.
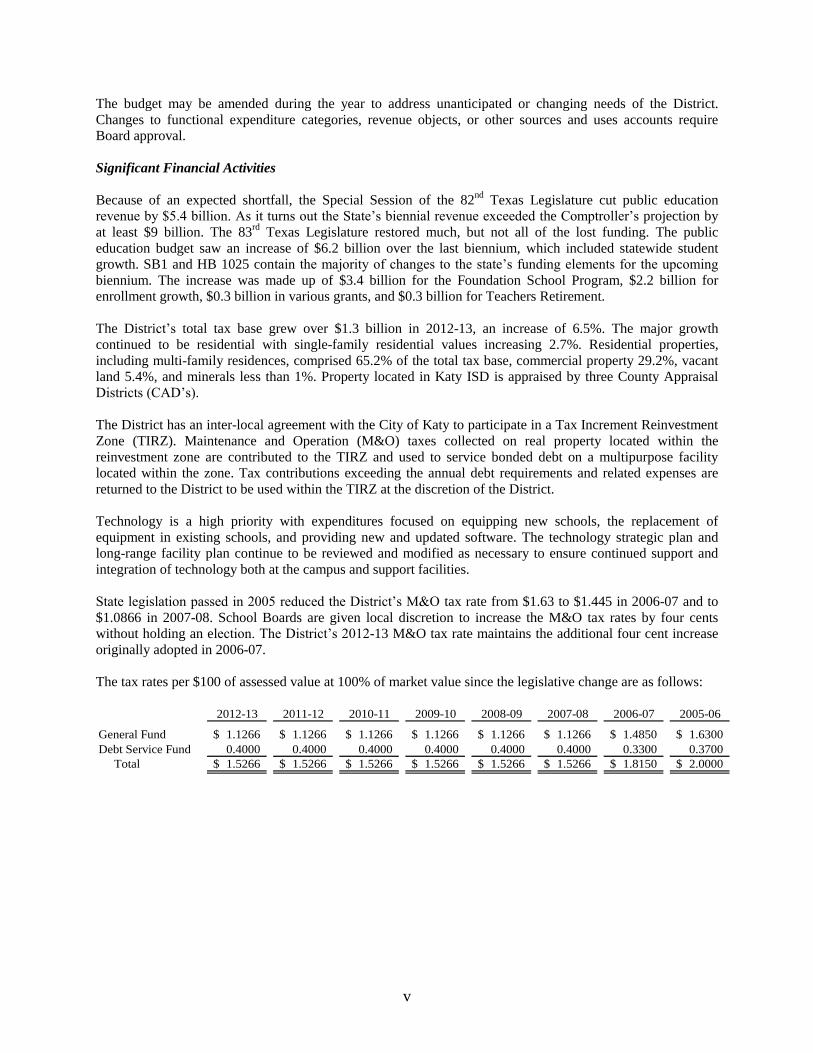
State legislation passed in 2005 reduced the District’s M&O tax rate from $1.63 to $1.445 in 2006-07 and to
$1.0866 in 2007-08. School Boards are given local discretion to increase the M&O tax rates by four cents
without holding an election. The District’s 2012-13 M&O tax rate maintains the additional four cent increase
originally adopted in 2006-07.
The tax rates per $100 of assessed value at 100% of market value since the legislative change are as follows:
2012-13 2011-12 2010-11 2009-10 2008-09 2007-08 2006-07 2005-06
General Fund 1.1266$ 1.1266$ 1.1266$ 1.1266$ 1.1266$ 1.1266$ 1.4850$ 1.6300$
Debt Service Fund 0.4000 0.4000 0.4000 0.4000 0.4000 0.4000 0.3300 0.3700
Total 1.5266$ 1.5266$ 1.5266$ 1.5266$ 1.5266$ 1.5266$ 1.8150$ 2.0000$
vi
CASH MANAGEMENT POLICIES AND PRACTICES
It is the practice of the District to pursue an active cash management program which stresses safety of principal
and interest while generating favorable rates of return. This program is maintained in such a fashion so as to
provide a sufficient level of liquidity to support anticipated expenditures without subjecting the District to
material, unfavorable fluctuations of market and interest rate risk. Direct purchases of U.S. Treasury or Agency
securities are competitively bid and invested in accordance with statutory guidelines and local District policy.
The District’s investments also include participation in local government investment pools. This provides
liquidity and additional diversification of the investment portfolio.
Furthermore, the District expedites the receipt of revenues via electronic transfer and defers expenditures,
when appropriate, to maintain maximum use of funds. The total amount of investment income earned by the
District for the fiscal year ended August 31, 2013 was $1.1 million.
RISK MANAGEMENT
The objectives of the risk management program are to safeguard the assets of the District, minimize the
financial effect of potential losses, and to provide a reasonable level of employee benefits at an affordable
funding level. Through these processes, Risk Management will strive to provide a safe and orderly learning
environment for students, employees and patrons.
The District’s property and casualty insurance is provided by national commercial carriers. In addition,
Workers’ Compensation risks are self-funding and include the purchase of an excess Workers’ Compensation
policy for coverage related to excessive Workers’ Compensation claims.
Various types of insurance coverages are made available to the employees. Similar to Workers’ Compensation,
the District’s medical insurance program is partially self-funded and includes the purchase of stop loss
insurance for excessive claims. Portions of the coverages available, such as medical and life insurance are
partially paid by the District. Other available benefits offered to employees on a voluntary basis include dental,
vision, supplemental cancer, disability insurance, personal legal, Section 125 flexible spending accounts for
qualified medical and dependent care expenses, and group term life as well as dependent and supplemental life
policies.
AWARDS AND ACKNOWLEDGEMENTS
Financial Reporting Awards
Katy ISD was awarded the Texas Comptroller of Public Account’s Gold Leadership Award that spotlights
local government financial transparency. The award recognizes districts that keep their books open to the
public; provide clear, consistent pictures of spending; and shares information in a user-friendly format that lets
taxpayers easily access additional information.
For the eleventh consecutive year, the District scored the highest possible rating of “Superior Achievement”
for the Schools FIRST (Financial Integrity Rating System of Texas), a financial accountability system for
Texas School Districts developed by the Texas Education Agency in response to Senate Bill 875 of the 76th
Texas Legislature in 1999. The primary goal of Schools FIRST is to ensure quality performance in the
management of school districts’ financial resources, a goal made more significant due to the complexity of
accounting associated with the Texas school finance system.
The Government Finance Officers Association of the United States and Canada (GFOA) awarded a Certificate
of Achievement for Excellence in Financial Reporting to the District for its CAFR for the fiscal year ended August 31, 2012 the thirtieth consecutive year that the District has achieved this prestigious award. In order to
be awarded a Certificate of Achievement, a governmental unit must publish an easily readable and efficiently
organized Comprehensive Annual Financial Report. The report must satisfy both accounting principles
generally accepted in the United States of America and applicable legal requirements.
vii
A Certificate of Achievement is valid for a period of one year only. We believe our current Comprehensive
Annual Financial Report continues to meet the requirements of the Certificate of Achievement program and
are submitting it to the GFOA to determine its eligibility for certification.
Additionally, the District was awarded the Certificate of Excellence in Financial Reporting by the Association
of School Business Officials International (ASBO) for its Comprehensive Annual Financial Report for the year
ended August 31, 2012. This award has also been received for thirty consecutive years. We believe the
Comprehensive Annual Financial Report for the year ended August 31, 2013 continues to conform to the
standards for which this award was granted.
Acknowledgements
We appreciate the support of the Board, the residents of the District, and the business community, all of whom
work cooperatively to ensure the best education for its students and the prudent development of the District.
This cooperation is indicative of the strong support for the attainment of excellence in the District’s education
programs.
Also, we would like to express an appreciation to all employees in the District for their interest and support in
planning and conducting the financial affairs of the District in a responsible and progressive manner.
Finally, a special thanks to the Finance Department for its diligence and dedicated service in helping prepare
this report on a timely basis.
viii
KATY INDEPENDENT SCHOOL DISTRICT
CERTIFICATE OF ACHIEVEMENT FOR EXCELLENCE IN
FINANCIAL REPORTING
The Government Finance Officers Associate of the United States and Canada (GFOA) awarded a Certificate of
Achievement for Excellence in Financial Reporting to Katy Independent School District, Texas for its
Comprehensive Annual Financial Report for the fiscal year ended August 31, 2012.
In order to be awarded a Certificate of Achievement, a governmental unit must publish an easily readable and
efficiently organized Comprehensive Annual Financial Report, whose contents conform to program standards.
Such reports must satisfy both accounting principles generally accepted in the United States of America and
applicable legal requirements.
Receiving the award is recognition that a school system has met the highest standards of excellence in
government accounting and financial reporting.
ix
x
KATY INDEPENDENT SCHOOL DISTRICT
CERTIFICATE OF EXCELLENCE IN
FINANCIAL REPORTING
The Association of School Business Officials International (ASBO) awarded a Certificate of Excellence in
Financial Reporting to Katy Independent School District for its Comprehensive Annual Financial Report for
the fiscal year ended August 31, 2012.
The Certificate of Excellence in Financial Reporting is an award of recognition granted by ASBO. The award
certifies that the recipient school system has presented its Comprehensive Annual Financial Report to the
ASBO Panel of Review for critical review and evaluation and that the report was judged to have complied with
the principles and practices of financial reporting recognized by ASBO.
Receiving the award is recognition that a school system has met the highest standards of excellence in school
financial reporting.
xi
Association of School Business Officials
International
The Certificate of Excellence in Financial Reporting Award
is presented to
Katy Independent School District For Its Comprehensive Annual Financial Report (CAFR)
For the Fiscal Year Ended August 31, 2012
The CAFR has been reviewed and met or exceeded
ASBO International’s Certificate of Excellence standards
Ron McCulley, CPPB, RSBO John D. Musso, CAE, RSBA
President Executive Director
xii
Katy Independent School District Harris 101-914
Name of School District County County District
No.
We, the undersigned, certify that the attached annual financial reports of the above named school
district were reviewed and approved for the year ended August 31, 2013 at a meeting of the Board
of Trustees of such school district on the 21st day of January 2014.
Certificate of Board
xiii
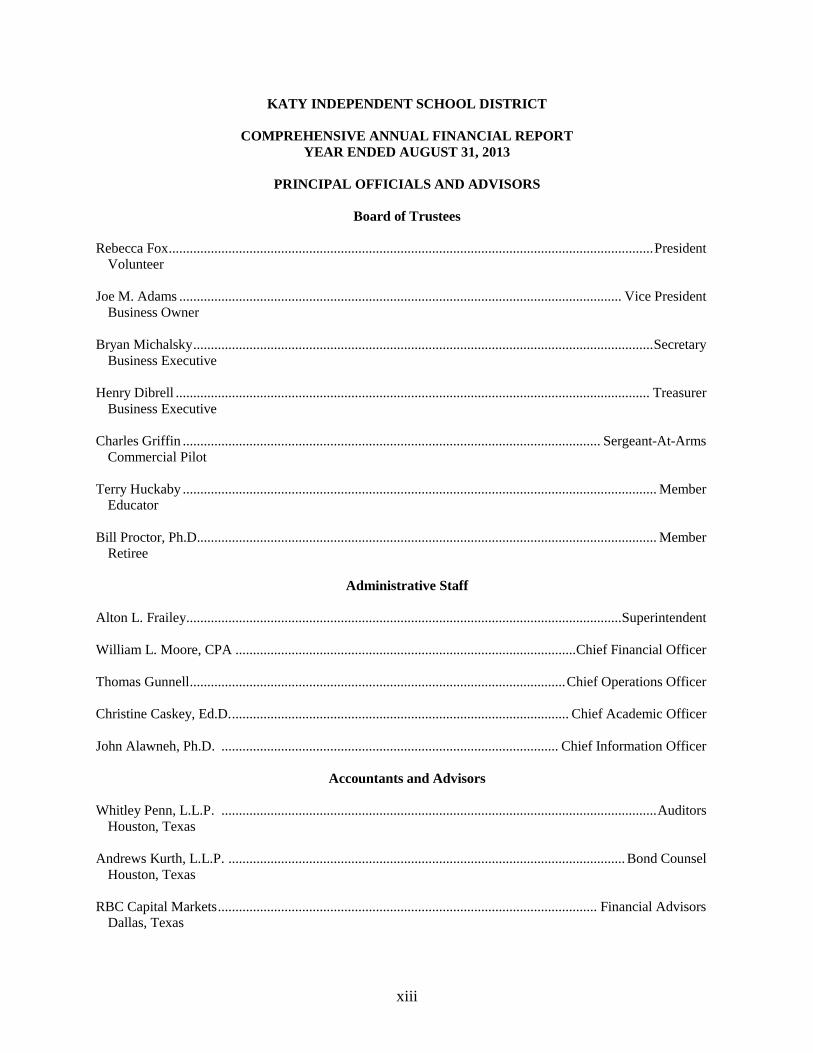
KATY INDEPENDENT SCHOOL DISTRICT
COMPREHENSIVE ANNUAL FINANCIAL REPORT
YEAR ENDED AUGUST 31, 2013
PRINCIPAL OFFICIALS AND ADVISORS
Board of Trustees
Rebecca Fox .......................................................................................................................................... President
Volunteer
Joe M. Adams .............................................................................................................................. Vice President
Business Owner
Bryan Michalsky ................................................................................................................................... Secretary
Business Executive
Henry Dibrell ....................................................................................................................................... Treasurer
Business Executive
Charles Griffin ....................................................................................................................... Sergeant-At-Arms
Commercial Pilot
Terry Huckaby ....................................................................................................................................... Member
Educator
Bill Proctor, Ph.D................................................................................................................................... Member
Retiree
Administrative Staff
Alton L. Frailey............................................................................................................................ Superintendent
William L. Moore, CPA ................................................................................................. Chief Financial Officer
Thomas Gunnell ........................................................................................................... Chief Operations Officer
Christine Caskey, Ed.D. ................................................................................................ Chief Academic Officer
John Alawneh, Ph.D. ................................................................................................ Chief Information Officer
Accountants and Advisors
Whitley Penn, L.L.P. ............................................................................................................................ Auditors
Houston, Texas
Andrews Kurth, L.L.P. ................................................................................................................. Bond Counsel
Houston, Texas
RBC Capital Markets ............................................................................................................ Financial Advisors Dallas, Texas
xiv

FINANCIAL SECTION

THIS PAGE INTENTIONALLY LEFT BLANK
Houston Offi ce 3411 Richmond AvenueSuite 500Houston, Texas 77046713.621.1515 Main
whitleypenn.com
An IndependentMember of
Dallas Fort Worth Houston
1
INDEPENDENT AUDITORS REPORT To the Board of Trustees Katy Independent School District Katy, Texas Report on the Financial Statements We have audited the accompanying financial statements of the governmental activities, each major fund and the aggregate remaining fund information of Katy Independent School District (the “District”), as of and for the year ended August 31, 2013, and the related notes to the financial statements, which collectively comprise the District’s basic financial statements as listed in the table of contents. Management’s Responsibility for the Financial Statements Management is responsible for the preparation and fair presentation of these financial statements in accordance with accounting principles generally accepted in the United States of America; this includes the design, implementation, and maintenance of internal control relevant to the preparation and fair presentation of financial statements that are free from material misstatement, whether due to fraud or error. Auditor’s Responsibility Our responsibility is to express opinions on these financial statements based on our audit. We conducted our audit in accordance with auditing standards generally accepted in the United States of America and the standards applicable to financial audits contained in Government Auditing Standards, issued by the Comptroller General of the United States. Those standards require that we plan and perform the audit to obtain reasonable assurance about whether the financial statements are free of material misstatement. An audit involves performing procedures to obtain audit evidence about the amounts and disclosures in the financial statements. The procedures selected depend on the auditor’s judgment, including the assessment of the risks of material misstatement of the financial statements, whether due to fraud or error. In making those risk assessments, the auditor considers internal control relevant to the entity’s preparation and fair presentation of the financial statements in order to design audit procedures that are appropriate in the circumstances, but not for the purpose of expressing an opinion on the effectiveness of the entity’s internal control. Accordingly, we express no such opinion. An audit also includes evaluating the appropriateness of accounting policies used and the reasonableness of significant accounting estimates made by management, as well as evaluating the overall presentation of the financial statements. We believe that the audit evidence we have obtained is sufficient and appropriate to provide a basis for our audit opinions.
To the Board of Trustees
Katy Independent School District
2
Opinions
In our opinion, the financial statements referred to above present fairly, in all material respects, the
respective financial position of the governmental activities, each major fund, and the aggregate remaining
fund information of the District as of August 31, 2013, and the respective changes in financial position
and, where applicable, cash flows thereof for the year then ended in accordance with accounting
principles generally accepted in the United States of America.
Emphasis of Matter
As discussed in Note 22 to the financial statements, the District adopted the provisions of GASB
Statement No. 65, Items Previously Reported as Assets and Liabilities, as of August 31, 2013. Our
opinion is not modified with respect to this matter.
Other Matters
Required Supplementary Information
Accounting principles generally accepted in the United States of America require that management’s
discussion and analysis on pages 5 through 15 and budgetary comparison information on pages 74
through 76 be presented to supplement the basic financial statements. Such information, although not a
part of the basic financial statements, is required by the Governmental Accounting Standards Board, who
considers it to be an essential part of the financial reporting for placing the basic financial statements in an
appropriate operational, economic, or historical context. We have applied certain limited procedures to
the required supplementary information in accordance with auditing standards generally accepted in the
United States of America, which consisted of inquiries of management about the methods of preparing the
information and comparing the information for consistency with management’s responses to our
inquiries, the basic financial statements, and other knowledge we obtained during our audit of the basic
financial statements. We do not express an opinion or provide any assurance on the information because
the limited procedures do not provide us with sufficient evidence to express an opinion or provide any
assurance.
Other Information
Our audit was conducted for the purpose of forming opinions on the financial statements that collectively
comprise the District’s basic financial statements. The accompanying supplementary information, such as
the comparative statements, combining statements and budgetary comparisons, capital assets used in the
operations of governmental funds, general long-term debt on governmental funds and Texas Education
Agency (TEA) compliance schedules and other information, such as the introductory and statistical
section, are presented for the purposes of additional analysis and are not a required part of the basic
financial statements.
To the Board of Trustees
Katy Independent School District
3
Other Matters (continued)
Other Information (continued)
The other supplementary information, which includes the comparative statements, combining statements
and budgetary comparisons, capital assets used in the operations of governmental funds, general long-
term debt on governmental funds and TEA compliance schedules are the responsibility of management
and were derived from and relate directly to the underlying accounting and other records used to prepare
the basic financial statements. Such information has been subjected to the auditing procedures applied in
the audit of the basic financial statements and certain additional procedures, including comparing and
reconciling such information directly to the underlying accounting and other records used to prepare the
basic financial statements or to the basic financial statements themselves, and other additional procedures
in accordance with auditing standards generally accepted in the United States of America. In our opinion,
the other supplementary information, which includes the comparative statements, combining statements
and budgetary comparisons, capital assets used in the operations of governmental funds, general long-
term debt on governmental funds and TEA compliance schedules are fairly stated in all material respects
in relation to the basic financial statements as a whole.
The introductory and statistical sections have not been subjected to the auditing procedures applied in the
audit of the basic financial statements and, accordingly, we do not express an opinion or provide any
assurance on them.
Other Reporting Required by Government Auditing Standards
In accordance with Government Auditing Standards, we have also issued our report dated January 21,
2014, on our consideration of the District’s internal control over financial reporting and our tests of its
compliance with certain provisions of laws, regulations, contracts, grant agreements and other matters.
The purpose of that report is to describe the scope of our testing of internal control over financial
reporting and compliance and the results of that testing, and not to provide an opinion on the internal
control over financial reporting or on compliance. That report is an integral part of an audit performed in
accordance with Government Auditing Standards in considering the District’s internal control over
financial reporting and compliance.
Houston, Texas
January 21, 2014

4
THIS PAGE INTENTIONALLY LEFT BLANK
5
MANAGEMENT’S DISCUSSION AND ANALYSIS
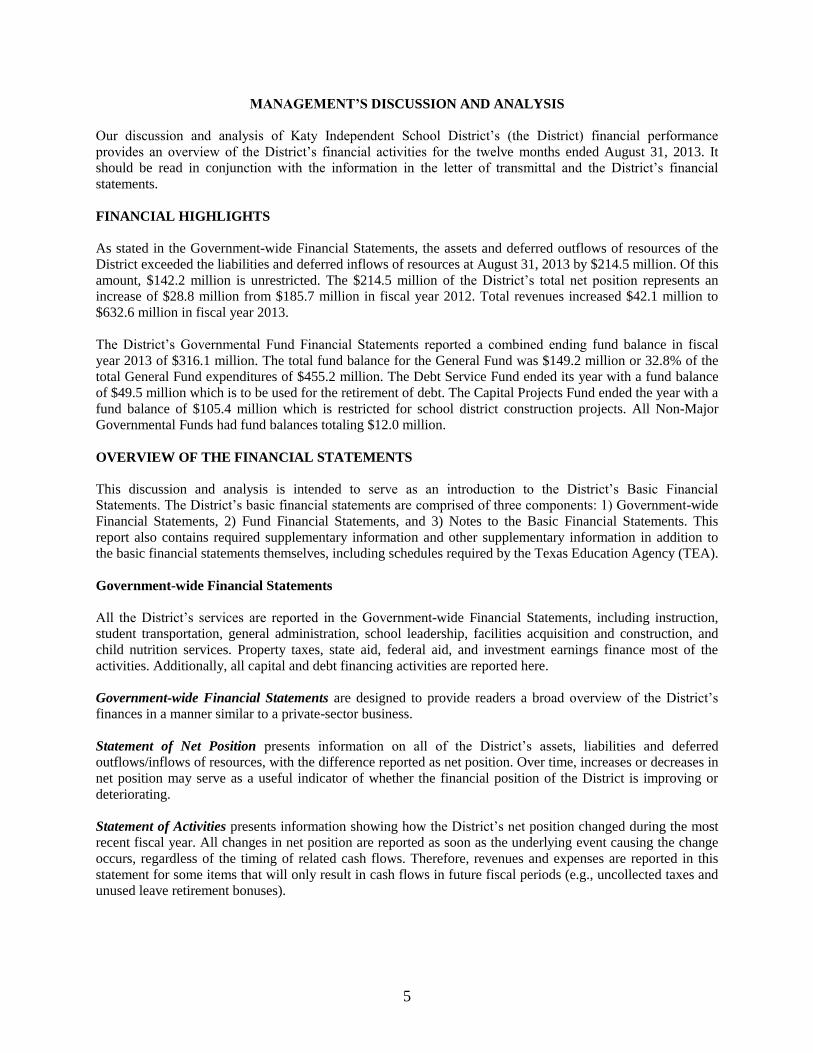
Our discussion and analysis of Katy Independent School District’s (the District) financial performance
provides an overview of the District’s financial activities for the twelve months ended August 31, 2013. It
should be read in conjunction with the information in the letter of transmittal and the District’s financial
statements.
FINANCIAL HIGHLIGHTS
As stated in the Government-wide Financial Statements, the assets and deferred outflows of resources of the
District exceeded the liabilities and deferred inflows of resources at August 31, 2013 by $214.5 million. Of this
amount, $142.2 million is unrestricted. The $214.5 million of the District’s total net position represents an
increase of $28.8 million from $185.7 million in fiscal year 2012. Total revenues increased $42.1 million to
$632.6 million in fiscal year 2013.
The District’s Governmental Fund Financial Statements reported a combined ending fund balance in fiscal
year 2013 of $316.1 million. The total fund balance for the General Fund was $149.2 million or 32.8% of the
total General Fund expenditures of $455.2 million. The Debt Service Fund ended its year with a fund balance
of $49.5 million which is to be used for the retirement of debt. The Capital Projects Fund ended the year with a
fund balance of $105.4 million which is restricted for school district construction projects. All Non-Major
Governmental Funds had fund balances totaling $12.0 million.
OVERVIEW OF THE FINANCIAL STATEMENTS
This discussion and analysis is intended to serve as an introduction to the District’s Basic Financial
Statements. The District’s basic financial statements are comprised of three components: 1) Government-wide
Financial Statements, 2) Fund Financial Statements, and 3) Notes to the Basic Financial Statements. This
report also contains required supplementary information and other supplementary information in addition to
the basic financial statements themselves, including schedules required by the Texas Education Agency (TEA).
Government-wide Financial Statements
All the District’s services are reported in the Government-wide Financial Statements, including instruction,
student transportation, general administration, school leadership, facilities acquisition and construction, and
child nutrition services. Property taxes, state aid, federal aid, and investment earnings finance most of the
activities. Additionally, all capital and debt financing activities are reported here.
Government-wide Financial Statements are designed to provide readers a broad overview of the District’s
finances in a manner similar to a private-sector business.
Statement of Net Position presents information on all of the District’s assets, liabilities and deferred
outflows/inflows of resources, with the difference reported as net position. Over time, increases or decreases in
net position may serve as a useful indicator of whether the financial position of the District is improving or
deteriorating.
Statement of Activities presents information showing how the District’s net position changed during the most
recent fiscal year. All changes in net position are reported as soon as the underlying event causing the change
occurs, regardless of the timing of related cash flows. Therefore, revenues and expenses are reported in this
statement for some items that will only result in cash flows in future fiscal periods (e.g., uncollected taxes and
unused leave retirement bonuses).
6
The Government-wide Financial Statements distinguish functions of the District that are principally supported
by taxes and revenues from other functions intended to recover all or a significant portion of their costs
through user fees and charges.
Government-wide Financial Statements can be found on pages 17-19.
Fund Financial Statements
The District uses fund accounting to track specific sources of funding and spending for particular purposes. A
fund is an accounting device used to maintain control over resources that have been segregated for specific
activities or objectives. The District, like other state and local governments, uses fund accounting to ensure and
demonstrate compliance with finance-related legal requirements. All the District’s funds can be divided into
three categories: Governmental Funds, Proprietary Funds, and Fiduciary Funds. The Fund Financial
Statements provide more detailed information about the District’s most significant funds, not the District as a
whole.
Governmental Funds are used to account for essentially the same functions reported as government activities
in the Government-wide Financial Statements. Most of the District’s activities are included in governmental
funds which focus on 1) how cash and other financial assets, that can readily be converted to cash, flow in and
out and 2) the balances that are available for spending at year-end. Consequently, the Governmental Fund
Statements provide a detailed short-term view that helps determine whether more or fewer financial resources
can be spent in the near future to finance the District’s programs. Because this information does not encompass
the additional long-term focus of the Government-wide Statements, additional information is provided in
Figure A-1 to explain the relationship between them.
The District maintains 30 governmental funds. Information is presented separately in the Governmental Fund
Balance Sheet and in the Governmental Fund Statement of Revenues, Expenditures, and Changes in Fund
Balances for the General Fund, Debt Service Fund, and Capital Projects Fund which are considered to be
major funds. Data from the other government funds are combined in a single, aggregated presentation.
Individual fund data for each of these non-major governmental funds is provided in the form of combining
statements elsewhere in the financial statements.
The District adopted an annual appropriated budget for the General Fund, Debt Service Fund and Food Service
Fund. A budgetary comparison schedule has been provided to demonstrate compliance with these budgets.
The basic Governmental Fund Financial Statements can be found on pages 20-26 of this report.
Proprietary Funds are used to account for operations that are financed similar to those found in the private
sector. These funds provide both short-term and long-term financial information. There are two types of
proprietary funds.
The first type is the Enterprise Fund, which is used to report the same functions presented as business
type activities in the Government-wide Financial Statements. In the Enterprise Fund, the District
charges outside customers a fee for services the District provides. The District has no business-type
activities or enterprise funds.
The second type is the Internal Service Fund, which is used to accumulate and allocate costs internally
among the various functions. Internal Service Funds are used to support governmental activities such
as the District’s Workers’ Compensation, Health Insurance, and Print Shop funds. These three funds
are combined into a single aggregated presentation in the Proprietary Fund Financial Statements found
on pages 27-29 of this report.
7
Fiduciary Funds are used to account for assets held by the District in a trustee capacity or as an agent for
individuals, private organizations, and other funds. The District is responsible for ensuring that the assets
reported in these funds are used for their intended purposes. All of the District’s fiduciary activities are
reported in a separate Statement of Fiduciary Assets and Liabilities and Statement of Changes in Fiduciary
Assets and Liabilities. The Fiduciary Funds are excluded from the activities in the District’s Government-wide
Financial Statements because the District cannot use these assets to finance its operations.
The basic Fiduciary Fund Financial Statements can be found on page 30 of this report.
Notes to the Financial Statements
The notes provide additional information essential to a complete understanding of the data provided in the
Government-wide and Fund Financial Statements. The notes can be found on pages 31-72 of this report.
Required Supplementary Information
In addition to the basic financial statements and accompanying notes, this report also presents certain required
supplementary information that further explains and supports the information in the financial statements. The
required supplementary information relates to comparison of the original adopted budget, the final amended
budget, and the actual expenditures for the fiscal year. This is required supplementary information for the
General Fund and any major special revenue funds. The District did not have any major special revenue funds;
therefore, only the General Fund is presented as required supplementary information. Required Supplementary
Information can be found on pages 74-76 of this report.
Other Supplementary Information
Other Supplementary Information provides additional analysis and is not a required part of the basic financial
statements. Other supplementary information includes comparative information on selected funds and
additional detail of the General Fund’s revenues and expenditures. It also contains the combining statements
referred to earlier in connection with non-major governmental funds and certain compliance schedules required
by state regulatory agencies. The Other Supplementary Information can be found on pages 80-147 of this
report.
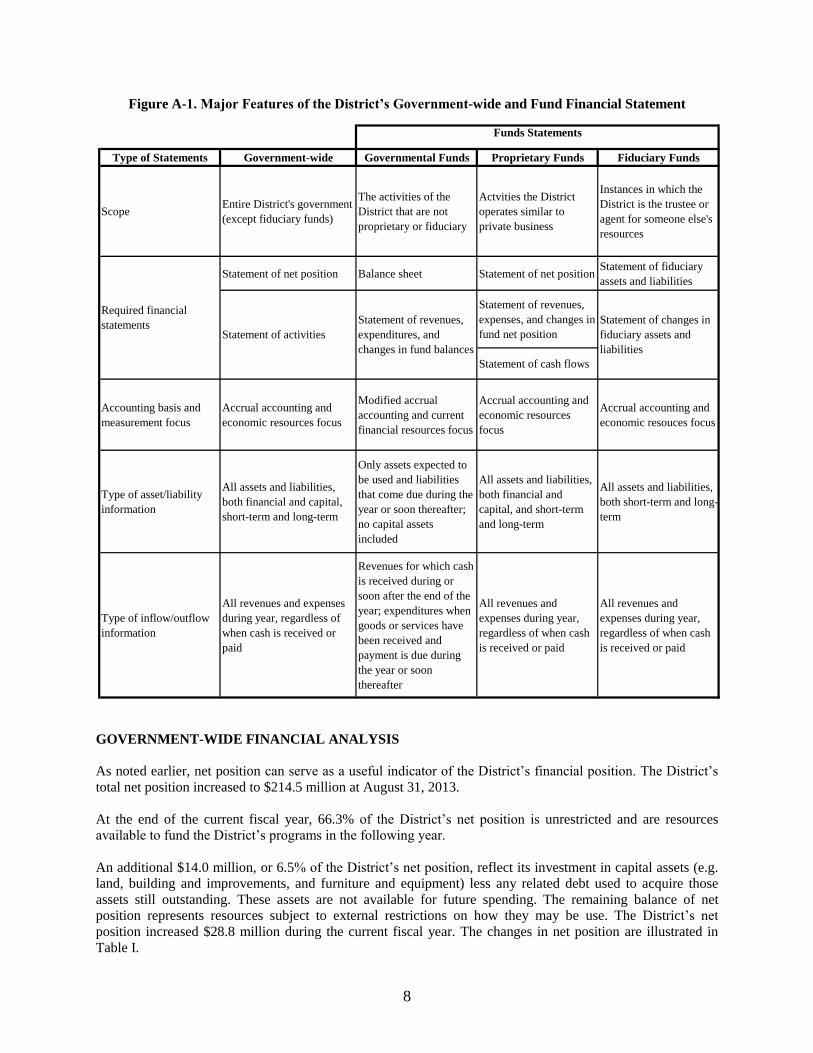
The remainder of this overview section of the Management’s Discussion and Analysis explains the structure
and contents of each of the statements. Figure A-1 summarizes the major features of the District’s financial
statements, including the portion of the District covered and the types of information contained.
8
Figure A-1. Major Features of the District’s Government-wide and Fund Financial Statement
Type of Statements Government-wide Governmental Funds Proprietary Funds Fiduciary Funds
ScopeEntire District's government
(except fiduciary funds)
The activities of the
District that are not
proprietary or fiduciary
Actvities the District
operates similar to
private business
Instances in which the
District is the trustee or
agent for someone else's
resources
Statement of net position Balance sheet Statement of net positionStatement of fiduciary
assets and liabilities
Statement of revenues,
expenses, and changes in
fund net position
Statement of cash flows
Accounting basis and
measurement focus
Accrual accounting and
economic resources focus
Modified accrual
accounting and current
financial resources focus
Accrual accounting and
economic resources
focus
Accrual accounting and
economic resouces focus
Type of asset/liability
information
All assets and liabilities,
both financial and capital,
short-term and long-term
Only assets expected to
be used and liabilities
that come due during the
year or soon thereafter;
no capital assets
included
All assets and liabilities,
both financial and
capital, and short-term
and long-term
All assets and liabilities,
both short-term and long-
term
Type of inflow/outflow
information
All revenues and expenses
during year, regardless of
when cash is received or
paid
Revenues for which cash
is received during or
soon after the end of the
year; expenditures when
goods or services have
been received and
payment is due during
the year or soon
thereafter
All revenues and
expenses during year,
regardless of when cash
is received or paid
All revenues and
expenses during year,
regardless of when cash
is received or paid
Funds Statements
Required financial
statementsStatement of activities
Statement of revenues,
expenditures, and
changes in fund balances
Statement of changes in
fiduciary assets and
liabilities
GOVERNMENT-WIDE FINANCIAL ANALYSIS
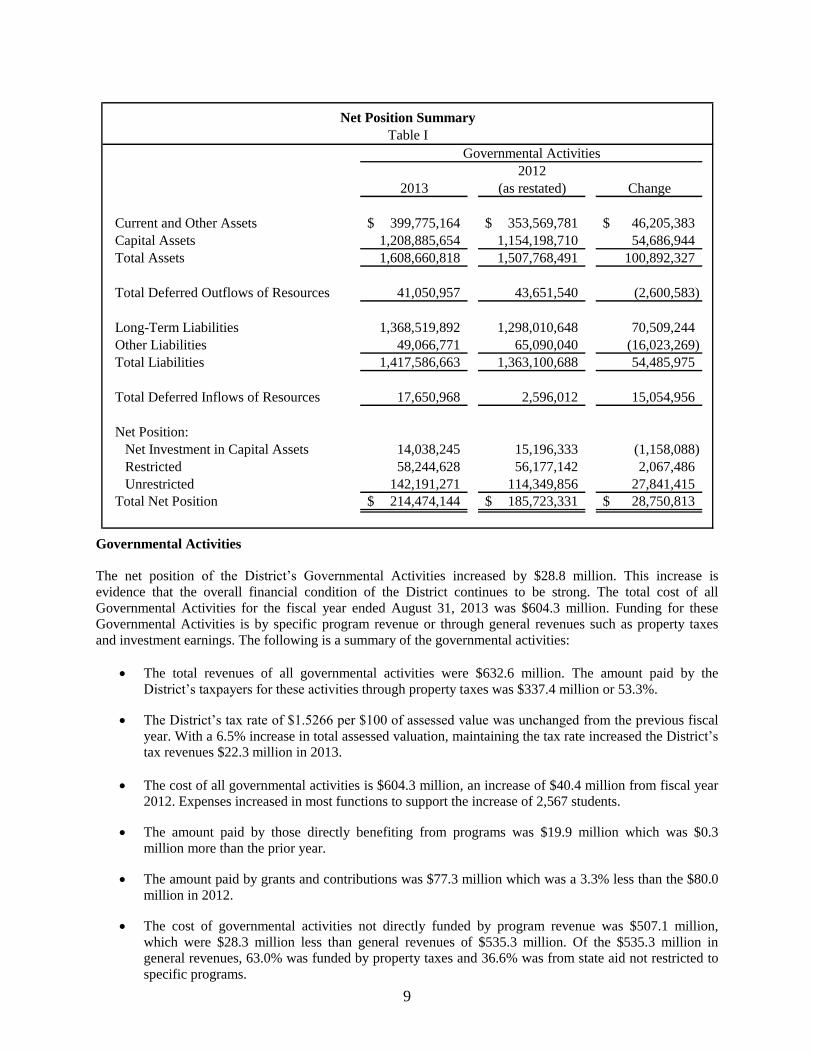
As noted earlier, net position can serve as a useful indicator of the District’s financial position. The District’s
total net position increased to $214.5 million at August 31, 2013.
At the end of the current fiscal year, 66.3% of the District’s net position is unrestricted and are resources
available to fund the District’s programs in the following year.
An additional $14.0 million, or 6.5% of the District’s net position, reflect its investment in capital assets (e.g.
land, building and improvements, and furniture and equipment) less any related debt used to acquire those
assets still outstanding. These assets are not available for future spending. The remaining balance of net
position represents resources subject to external restrictions on how they may be use. The District’s net
position increased $28.8 million during the current fiscal year. The changes in net position are illustrated in
Table I.
9
2012
2013 (as restated) Change
Current and Other Assets 399,775,164$ 353,569,781$ 46,205,383$
Capital Assets 1,208,885,654 1,154,198,710 54,686,944
Total Assets 1,608,660,818 1,507,768,491 100,892,327
Total Deferred Outflows of Resources 41,050,957 43,651,540 (2,600,583)
Long-Term Liabilities 1,368,519,892 1,298,010,648 70,509,244
Other Liabilities 49,066,771 65,090,040 (16,023,269)
Total Liabilities 1,417,586,663 1,363,100,688 54,485,975
Total Deferred Inflows of Resources 17,650,968 2,596,012 15,054,956
Net Position:
Net Investment in Capital Assets 14,038,245 15,196,333 (1,158,088)
Restricted 58,244,628 56,177,142 2,067,486
Unrestricted 142,191,271 114,349,856 27,841,415
Total Net Position 214,474,144$ 185,723,331$ 28,750,813$
Net Position Summary
Table I
Governmental Activities
Governmental Activities
The net position of the District’s Governmental Activities increased by $28.8 million. This increase is
evidence that the overall financial condition of the District continues to be strong. The total cost of all
Governmental Activities for the fiscal year ended August 31, 2013 was $604.3 million. Funding for these
Governmental Activities is by specific program revenue or through general revenues such as property taxes
and investment earnings. The following is a summary of the governmental activities:
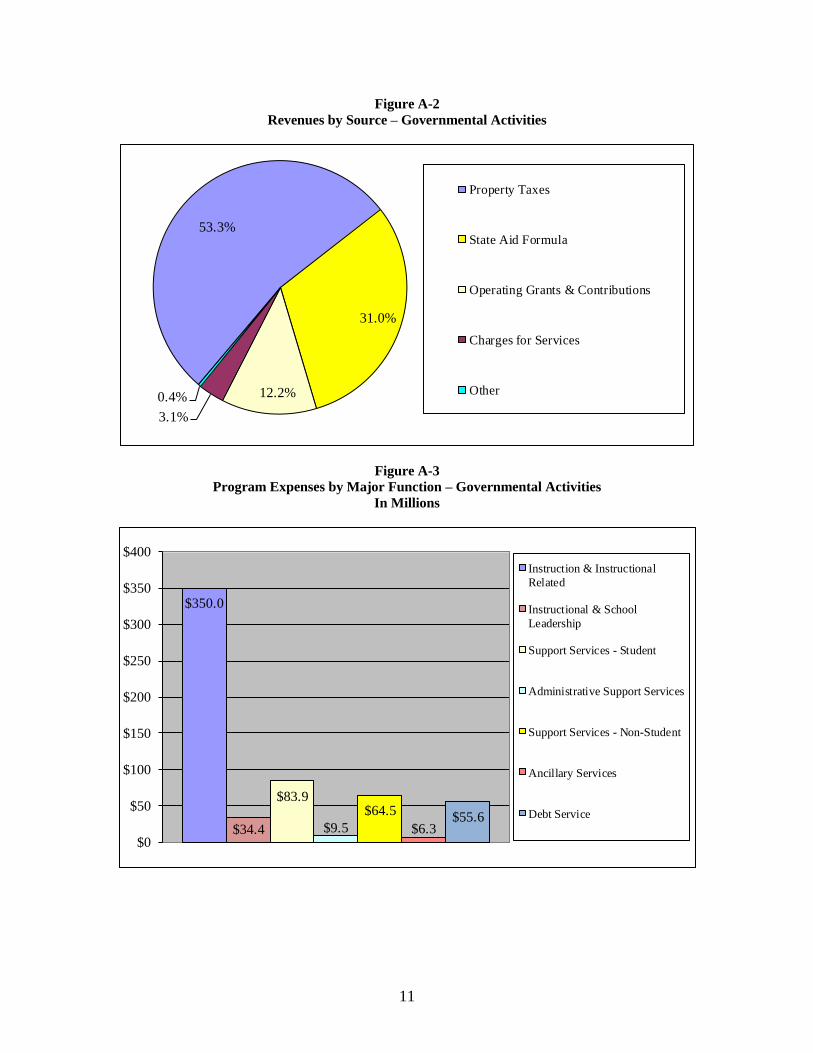
The total revenues of all governmental activities were $632.6 million. The amount paid by the
District’s taxpayers for these activities through property taxes was $337.4 million or 53.3%.
The District’s tax rate of $1.5266 per $100 of assessed value was unchanged from the previous fiscal
year. With a 6.5% increase in total assessed valuation, maintaining the tax rate increased the District’s
tax revenues $22.3 million in 2013.
The cost of all governmental activities is $604.3 million, an increase of $40.4 million from fiscal year
2012. Expenses increased in most functions to support the increase of 2,567 students.
The amount paid by those directly benefiting from programs was $19.9 million which was $0.3
million more than the prior year.
The amount paid by grants and contributions was $77.3 million which was a 3.3% less than the $80.0
million in 2012.
The cost of governmental activities not directly funded by program revenue was $507.1 million,
which were $28.3 million less than general revenues of $535.3 million. Of the $535.3 million in
general revenues, 63.0% was funded by property taxes and 36.6% was from state aid not restricted to
specific programs.
10
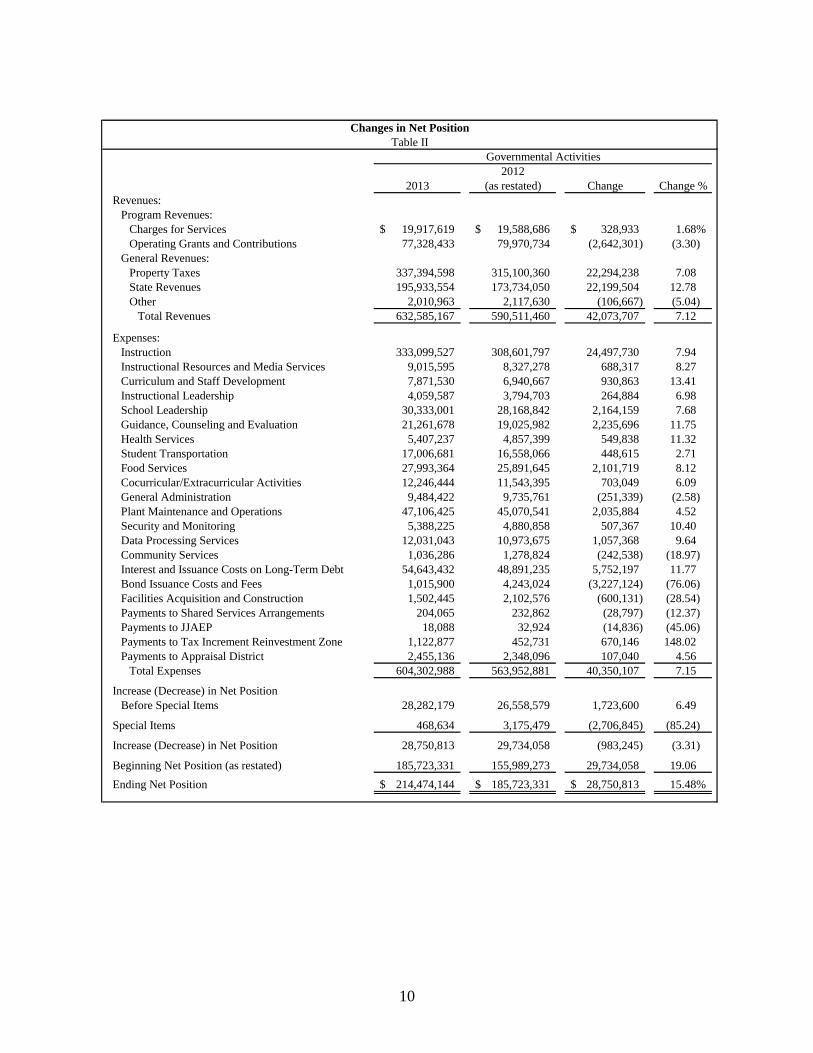
2012
2013 (as restated) Change Change %
Revenues:
Program Revenues:
Charges for Services 19,917,619$ 19,588,686$ 328,933$ 1.68%
Operating Grants and Contributions 77,328,433 79,970,734 (2,642,301) (3.30)
General Revenues:
Property Taxes 337,394,598 315,100,360 22,294,238 7.08
State Revenues 195,933,554 173,734,050 22,199,504 12.78
Other 2,010,963 2,117,630 (106,667) (5.04)
Total Revenues 632,585,167 590,511,460 42,073,707 7.12
Expenses:
Instruction 333,099,527 308,601,797 24,497,730 7.94
Instructional Resources and Media Services 9,015,595 8,327,278 688,317 8.27
Curriculum and Staff Development 7,871,530 6,940,667 930,863 13.41
Instructional Leadership 4,059,587 3,794,703 264,884 6.98
School Leadership 30,333,001 28,168,842 2,164,159 7.68
Guidance, Counseling and Evaluation 21,261,678 19,025,982 2,235,696 11.75
Health Services 5,407,237 4,857,399 549,838 11.32
Student Transportation 17,006,681 16,558,066 448,615 2.71
Food Services 27,993,364 25,891,645 2,101,719 8.12
Cocurricular/Extracurricular Activities 12,246,444 11,543,395 703,049 6.09
General Administration 9,484,422 9,735,761 (251,339) (2.58)
Plant Maintenance and Operations 47,106,425 45,070,541 2,035,884 4.52
Security and Monitoring 5,388,225 4,880,858 507,367 10.40
Data Processing Services 12,031,043 10,973,675 1,057,368 9.64
Community Services 1,036,286 1,278,824 (242,538) (18.97)
Interest and Issuance Costs on Long-Term Debt 54,643,432 48,891,235 5,752,197 11.77
Bond Issuance Costs and Fees 1,015,900 4,243,024 (3,227,124) (76.06)
Facilities Acquisition and Construction 1,502,445 2,102,576 (600,131) (28.54)
Payments to Shared Services Arrangements 204,065 232,862 (28,797) (12.37)
Payments to JJAEP 18,088 32,924 (14,836) (45.06)
Payments to Tax Increment Reinvestment Zone 1,122,877 452,731 670,146 148.02
Payments to Appraisal District 2,455,136 2,348,096 107,040 4.56
Total Expenses 604,302,988 563,952,881 40,350,107 7.15
Increase (Decrease) in Net Position
Before Special Items 28,282,179 26,558,579 1,723,600 6.49
Special Items 468,634 3,175,479 (2,706,845) (85.24)
Increase (Decrease) in Net Position 28,750,813 29,734,058 (983,245) (3.31)
Beginning Net Position (as restated) 185,723,331 155,989,273 29,734,058 19.06
Ending Net Position 214,474,144$ 185,723,331$ 28,750,813$ 15.48%
Changes in Net Position
Table II
Governmental Activities
11
Figure A-2
Revenues by Source – Governmental Activities
53.3%
31.0%
12.2%
3.1%
0.4%
Property Taxes
State Aid Formula
Operating Grants & Contributions
Charges for Services
Other
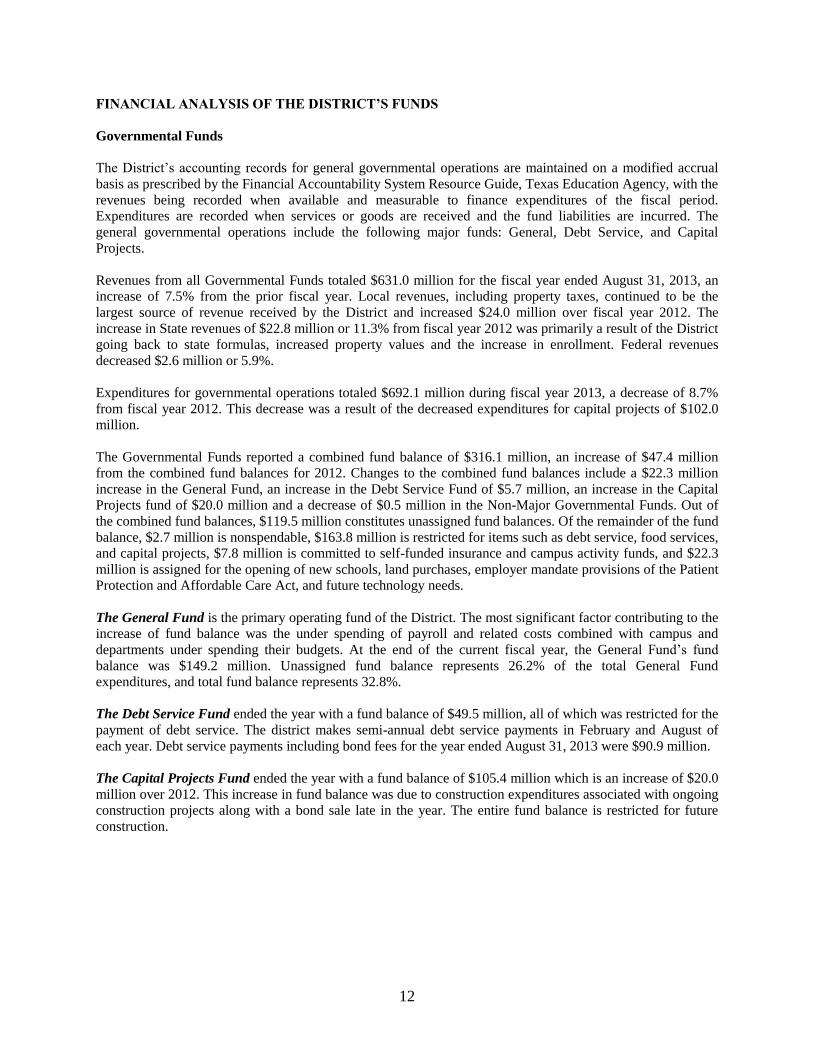
Figure A-3
Program Expenses by Major Function – Governmental Activities
In Millions
$350.0
$34.4
$83.9
$9.5
$64.5
$6.3$55.6
$0
$50
$100
$150
$200
$250
$300
$350
$400
Instruction & Instructional
Related
Instructional & School
Leadership
Support Services - Student
Administrative Support Services
Support Services - Non-Student
Ancillary Services
Debt Service
12
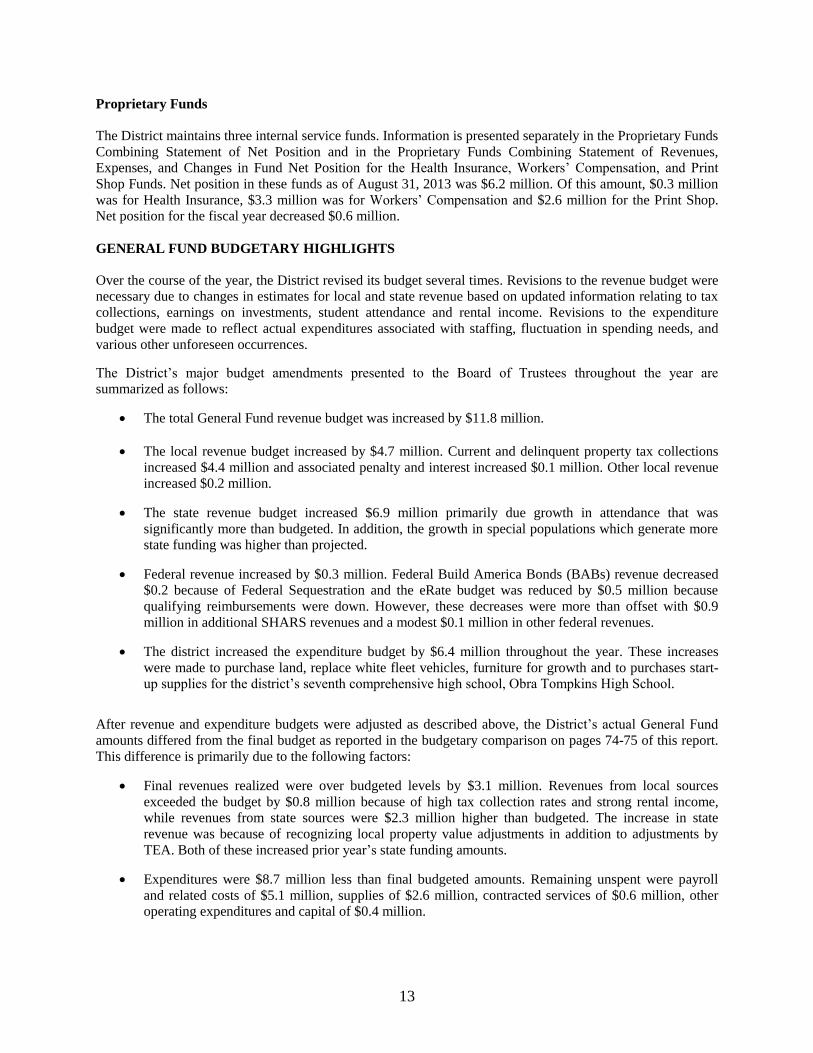
FINANCIAL ANALYSIS OF THE DISTRICT’S FUNDS
Governmental Funds
The District’s accounting records for general governmental operations are maintained on a modified accrual
basis as prescribed by the Financial Accountability System Resource Guide, Texas Education Agency, with the
revenues being recorded when available and measurable to finance expenditures of the fiscal period.
Expenditures are recorded when services or goods are received and the fund liabilities are incurred. The
general governmental operations include the following major funds: General, Debt Service, and Capital
Projects.
Revenues from all Governmental Funds totaled $631.0 million for the fiscal year ended August 31, 2013, an
increase of 7.5% from the prior fiscal year. Local revenues, including property taxes, continued to be the
largest source of revenue received by the District and increased $24.0 million over fiscal year 2012. The
increase in State revenues of $22.8 million or 11.3% from fiscal year 2012 was primarily a result of the District
going back to state formulas, increased property values and the increase in enrollment. Federal revenues
decreased $2.6 million or 5.9%.
Expenditures for governmental operations totaled $692.1 million during fiscal year 2013, a decrease of 8.7%
from fiscal year 2012. This decrease was a result of the decreased expenditures for capital projects of $102.0
million.
The Governmental Funds reported a combined fund balance of $316.1 million, an increase of $47.4 million
from the combined fund balances for 2012. Changes to the combined fund balances include a $22.3 million
increase in the General Fund, an increase in the Debt Service Fund of $5.7 million, an increase in the Capital
Projects fund of $20.0 million and a decrease of $0.5 million in the Non-Major Governmental Funds. Out of
the combined fund balances, $119.5 million constitutes unassigned fund balances. Of the remainder of the fund
balance, $2.7 million is nonspendable, $163.8 million is restricted for items such as debt service, food services,
and capital projects, $7.8 million is committed to self-funded insurance and campus activity funds, and $22.3
million is assigned for the opening of new schools, land purchases, employer mandate provisions of the Patient
Protection and Affordable Care Act, and future technology needs.
The General Fund is the primary operating fund of the District. The most significant factor contributing to the
increase of fund balance was the under spending of payroll and related costs combined with campus and
departments under spending their budgets. At the end of the current fiscal year, the General Fund’s fund
balance was $149.2 million. Unassigned fund balance represents 26.2% of the total General Fund
expenditures, and total fund balance represents 32.8%.
The Debt Service Fund ended the year with a fund balance of $49.5 million, all of which was restricted for the
payment of debt service. The district makes semi-annual debt service payments in February and August of
each year. Debt service payments including bond fees for the year ended August 31, 2013 were $90.9 million.
The Capital Projects Fund ended the year with a fund balance of $105.4 million which is an increase of $20.0
million over 2012. This increase in fund balance was due to construction expenditures associated with ongoing
construction projects along with a bond sale late in the year. The entire fund balance is restricted for future
construction.
13
Proprietary Funds
The District maintains three internal service funds. Information is presented separately in the Proprietary Funds
Combining Statement of Net Position and in the Proprietary Funds Combining Statement of Revenues,
Expenses, and Changes in Fund Net Position for the Health Insurance, Workers’ Compensation, and Print
Shop Funds. Net position in these funds as of August 31, 2013 was $6.2 million. Of this amount, $0.3 million
was for Health Insurance, $3.3 million was for Workers’ Compensation and $2.6 million for the Print Shop.
Net position for the fiscal year decreased $0.6 million.
GENERAL FUND BUDGETARY HIGHLIGHTS
Over the course of the year, the District revised its budget several times. Revisions to the revenue budget were
necessary due to changes in estimates for local and state revenue based on updated information relating to tax
collections, earnings on investments, student attendance and rental income. Revisions to the expenditure
budget were made to reflect actual expenditures associated with staffing, fluctuation in spending needs, and
various other unforeseen occurrences.
The District’s major budget amendments presented to the Board of Trustees throughout the year are
summarized as follows:
The total General Fund revenue budget was increased by $11.8 million.
The local revenue budget increased by $4.7 million. Current and delinquent property tax collections
increased $4.4 million and associated penalty and interest increased $0.1 million. Other local revenue
increased $0.2 million.
The state revenue budget increased $6.9 million primarily due growth in attendance that was
significantly more than budgeted. In addition, the growth in special populations which generate more
state funding was higher than projected.
Federal revenue increased by $0.3 million. Federal Build America Bonds (BABs) revenue decreased
$0.2 because of Federal Sequestration and the eRate budget was reduced by $0.5 million because
qualifying reimbursements were down. However, these decreases were more than offset with $0.9
million in additional SHARS revenues and a modest $0.1 million in other federal revenues.
The district increased the expenditure budget by $6.4 million throughout the year. These increases
were made to purchase land, replace white fleet vehicles, furniture for growth and to purchases start-
up supplies for the district’s seventh comprehensive high school, Obra Tompkins High School.
After revenue and expenditure budgets were adjusted as described above, the District’s actual General Fund
amounts differed from the final budget as reported in the budgetary comparison on pages 74-75 of this report.
This difference is primarily due to the following factors:
Final revenues realized were over budgeted levels by $3.1 million. Revenues from local sources
exceeded the budget by $0.8 million because of high tax collection rates and strong rental income,
while revenues from state sources were $2.3 million higher than budgeted. The increase in state
revenue was because of recognizing local property value adjustments in addition to adjustments by
TEA. Both of these increased prior year’s state funding amounts.
Expenditures were $8.7 million less than final budgeted amounts. Remaining unspent were payroll
and related costs of $5.1 million, supplies of $2.6 million, contracted services of $0.6 million, other
operating expenditures and capital of $0.4 million.
14
CAPITAL ASSETS AND DEBT ADMINISTRATION
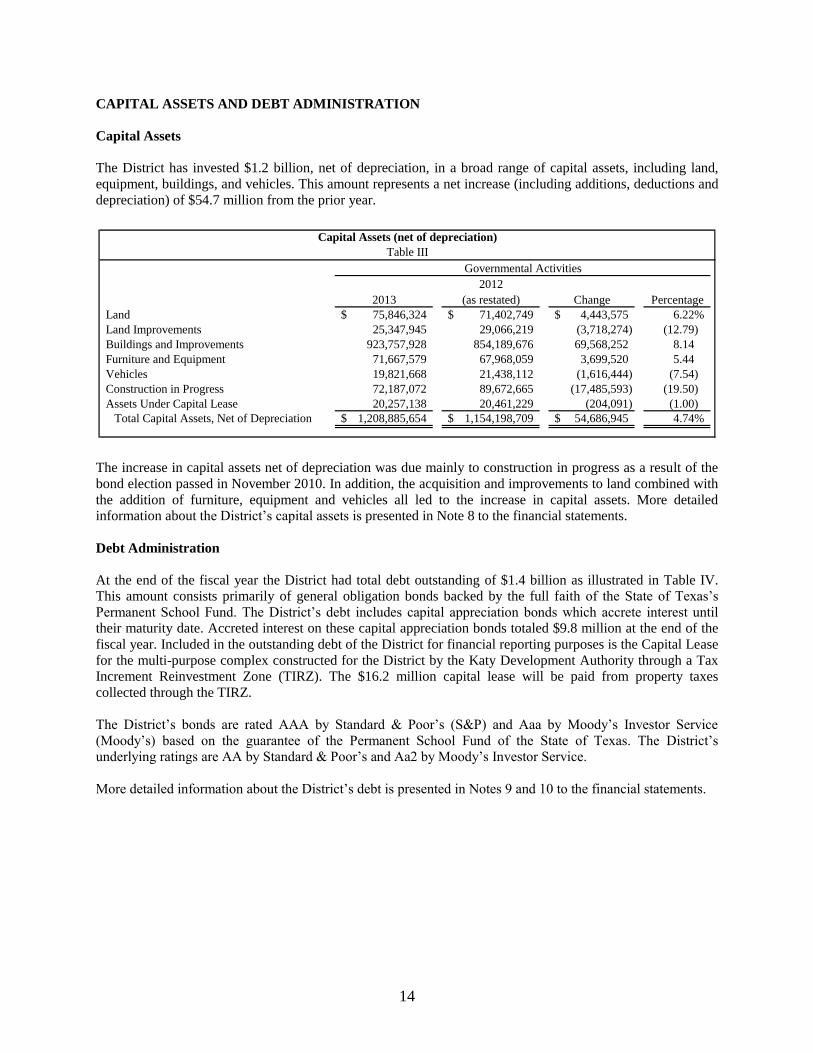
Capital Assets
The District has invested $1.2 billion, net of depreciation, in a broad range of capital assets, including land,
equipment, buildings, and vehicles. This amount represents a net increase (including additions, deductions and
depreciation) of $54.7 million from the prior year.
2012
2013 (as restated) Change Percentage
Land 75,846,324$ 71,402,749$ 4,443,575$ 6.22%
Land Improvements 25,347,945 29,066,219 (3,718,274) (12.79)
Buildings and Improvements 923,757,928 854,189,676 69,568,252 8.14
Furniture and Equipment 71,667,579 67,968,059 3,699,520 5.44
Vehicles 19,821,668 21,438,112 (1,616,444) (7.54)
Construction in Progress 72,187,072 89,672,665 (17,485,593) (19.50)
Assets Under Capital Lease 20,257,138 20,461,229 (204,091) (1.00)
Total Capital Assets, Net of Depreciation 1,208,885,654$ 1,154,198,709$ 54,686,945$ 4.74%
Capital Assets (net of depreciation)
Table III
Governmental Activities
The increase in capital assets net of depreciation was due mainly to construction in progress as a result of the
bond election passed in November 2010. In addition, the acquisition and improvements to land combined with
the addition of furniture, equipment and vehicles all led to the increase in capital assets. More detailed
information about the District’s capital assets is presented in Note 8 to the financial statements.
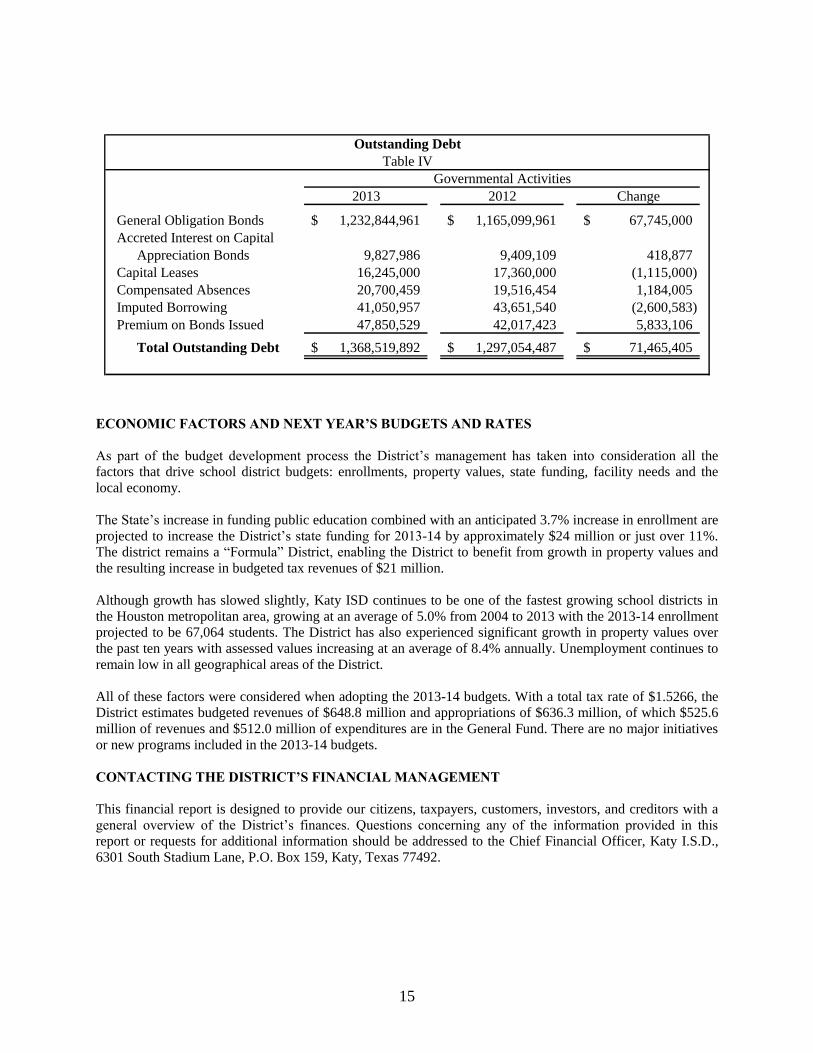
Debt Administration
At the end of the fiscal year the District had total debt outstanding of $1.4 billion as illustrated in Table IV.
This amount consists primarily of general obligation bonds backed by the full faith of the State of Texas’s
Permanent School Fund. The District’s debt includes capital appreciation bonds which accrete interest until
their maturity date. Accreted interest on these capital appreciation bonds totaled $9.8 million at the end of the
fiscal year. Included in the outstanding debt of the District for financial reporting purposes is the Capital Lease
for the multi-purpose complex constructed for the District by the Katy Development Authority through a Tax
Increment Reinvestment Zone (TIRZ). The $16.2 million capital lease will be paid from property taxes
collected through the TIRZ.
The District’s bonds are rated AAA by Standard & Poor’s (S&P) and Aaa by Moody’s Investor Service
(Moody’s) based on the guarantee of the Permanent School Fund of the State of Texas. The District’s
underlying ratings are AA by Standard & Poor’s and Aa2 by Moody’s Investor Service.
More detailed information about the District’s debt is presented in Notes 9 and 10 to the financial statements.
15
2013 2012 Change
General Obligation Bonds 1,232,844,961$ 1,165,099,961$ 67,745,000$
Accreted Interest on Capital
Appreciation Bonds 9,827,986 9,409,109 418,877
Capital Leases 16,245,000 17,360,000 (1,115,000)
Compensated Absences 20,700,459 19,516,454 1,184,005
Imputed Borrowing 41,050,957 43,651,540 (2,600,583)
Premium on Bonds Issued 47,850,529 42,017,423 5,833,106
Total Outstanding Debt 1,368,519,892$ 1,297,054,487$ 71,465,405$
Table IV
Outstanding Debt
Governmental Activities
ECONOMIC FACTORS AND NEXT YEAR’S BUDGETS AND RATES
As part of the budget development process the District’s management has taken into consideration all the
factors that drive school district budgets: enrollments, property values, state funding, facility needs and the
local economy.
The State’s increase in funding public education combined with an anticipated 3.7% increase in enrollment are
projected to increase the District’s state funding for 2013-14 by approximately $24 million or just over 11%.
The district remains a “Formula” District, enabling the District to benefit from growth in property values and
the resulting increase in budgeted tax revenues of $21 million.
Although growth has slowed slightly, Katy ISD continues to be one of the fastest growing school districts in
the Houston metropolitan area, growing at an average of 5.0% from 2004 to 2013 with the 2013-14 enrollment
projected to be 67,064 students. The District has also experienced significant growth in property values over
the past ten years with assessed values increasing at an average of 8.4% annually. Unemployment continues to
remain low in all geographical areas of the District.
All of these factors were considered when adopting the 2013-14 budgets. With a total tax rate of $1.5266, the
District estimates budgeted revenues of $648.8 million and appropriations of $636.3 million, of which $525.6
million of revenues and $512.0 million of expenditures are in the General Fund. There are no major initiatives
or new programs included in the 2013-14 budgets.
CONTACTING THE DISTRICT’S FINANCIAL MANAGEMENT
This financial report is designed to provide our citizens, taxpayers, customers, investors, and creditors with a
general overview of the District’s finances. Questions concerning any of the information provided in this
report or requests for additional information should be addressed to the Chief Financial Officer, Katy I.S.D.,
6301 South Stadium Lane, P.O. Box 159, Katy, Texas 77492.

16
THIS PAGE INTENTIONALLY LEFT BLANK

17
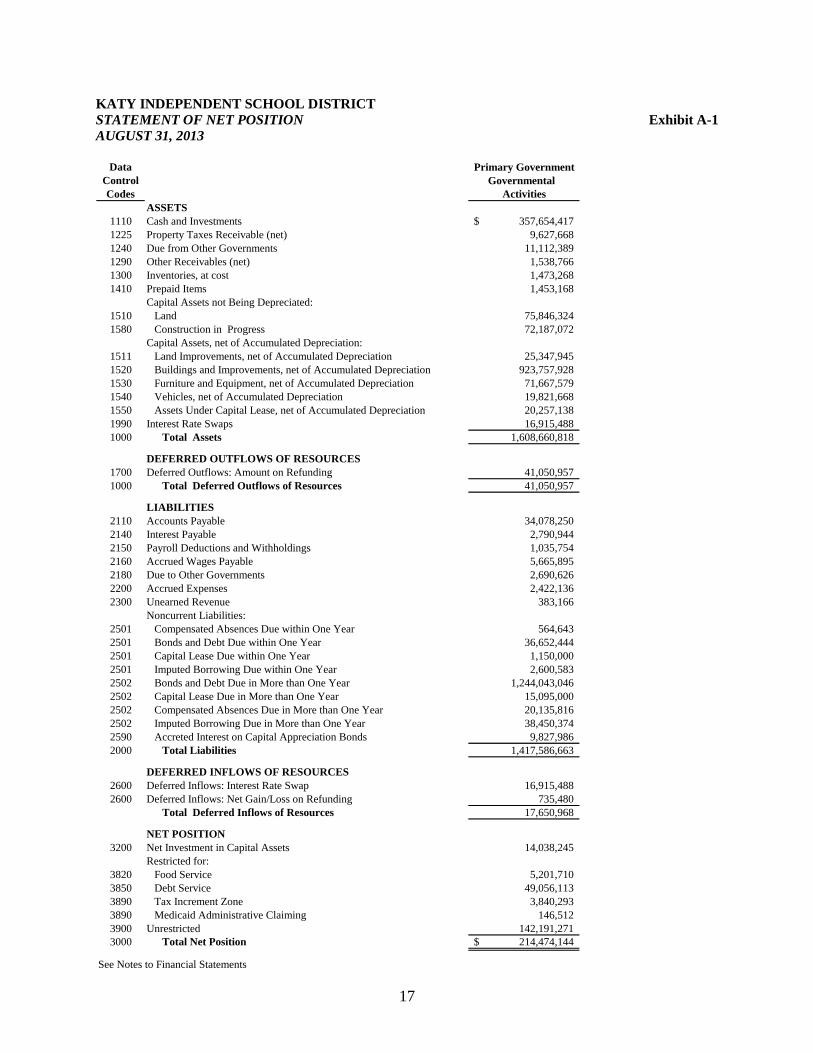
KATY INDEPENDENT SCHOOL DISTRICT
STATEMENT OF NET POSITION Exhibit A-1
AUGUST 31, 2013
Data Primary Government
Control Governmental
Codes Activities
ASSETS
1110 Cash and Investments 357,654,417$
1225 Property Taxes Receivable (net) 9,627,668
1240 Due from Other Governments 11,112,389
1290 Other Receivables (net) 1,538,766
1300 Inventories, at cost 1,473,268
1410 Prepaid Items 1,453,168
Capital Assets not Being Depreciated:
1510 Land 75,846,324
1580 Construction in Progress 72,187,072
Capital Assets, net of Accumulated Depreciation:
1511 Land Improvements, net of Accumulated Depreciation 25,347,945
1520 Buildings and Improvements, net of Accumulated Depreciation 923,757,928
1530 Furniture and Equipment, net of Accumulated Depreciation 71,667,579
1540 Vehicles, net of Accumulated Depreciation 19,821,668
1550 Assets Under Capital Lease, net of Accumulated Depreciation 20,257,138
1990 Interest Rate Swaps 16,915,488
1000 Total Assets 1,608,660,818
DEFERRED OUTFLOWS OF RESOURCES
1700 Deferred Outflows: Amount on Refunding 41,050,957
1000 Total Deferred Outflows of Resources 41,050,957
LIABILITIES
2110 Accounts Payable 34,078,250
2140 Interest Payable 2,790,944
2150 Payroll Deductions and Withholdings 1,035,754
2160 Accrued Wages Payable 5,665,895
2180 Due to Other Governments 2,690,626
2200 Accrued Expenses 2,422,136
2300 Unearned Revenue 383,166
Noncurrent Liabilities:
2501 Compensated Absences Due within One Year 564,643
2501 Bonds and Debt Due within One Year 36,652,444
2501 Capital Lease Due within One Year 1,150,000
2501 Imputed Borrowing Due within One Year 2,600,583
2502 Bonds and Debt Due in More than One Year 1,244,043,046
2502 Capital Lease Due in More than One Year 15,095,000
2502 Compensated Absences Due in More than One Year 20,135,816
2502 Imputed Borrowing Due in More than One Year 38,450,374
2590 Accreted Interest on Capital Appreciation Bonds 9,827,986
2000 Total Liabilities 1,417,586,663
DEFERRED INFLOWS OF RESOURCES
2600 Deferred Inflows: Interest Rate Swap 16,915,488
2600 Deferred Inflows: Net Gain/Loss on Refunding 735,480
Total Deferred Inflows of Resources 17,650,968
NET POSITION
3200 Net Investment in Capital Assets 14,038,245
Restricted for:
3820 Food Service 5,201,710
3850 Debt Service 49,056,113
3890 Tax Increment Zone 3,840,293
3890 Medicaid Administrative Claiming 146,512
3900 Unrestricted 142,191,271
3000 Total Net Position 214,474,144$
See Notes to Financial Statements
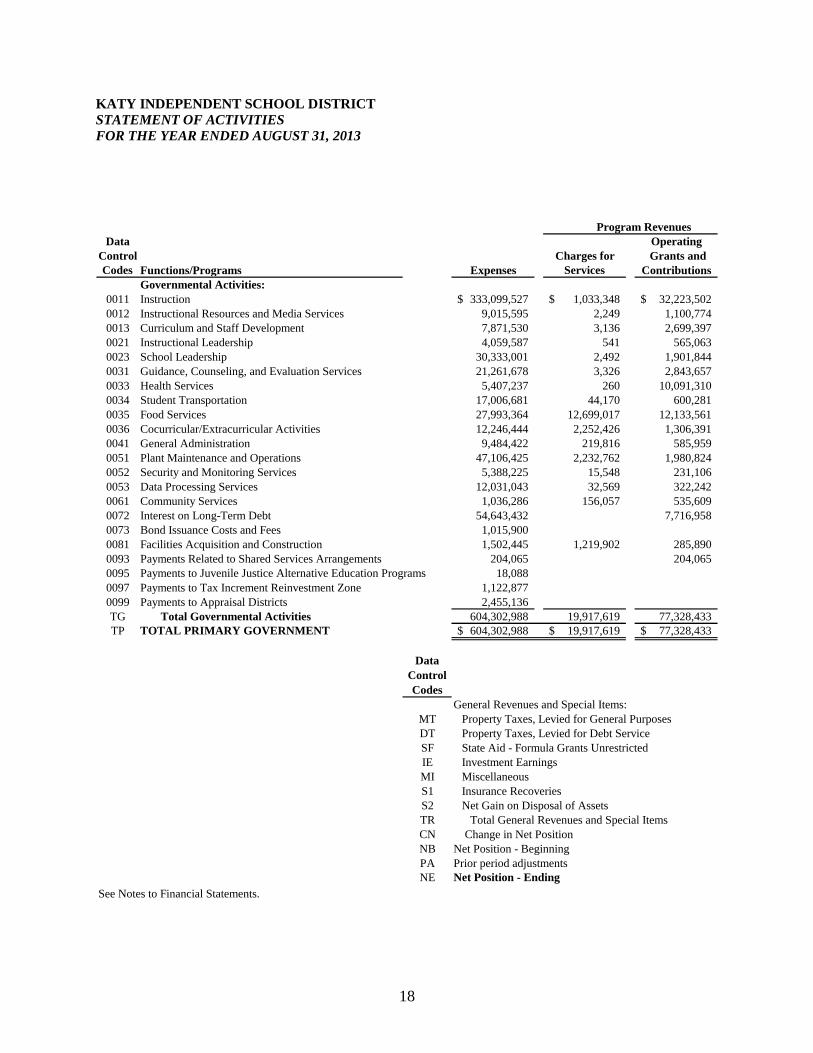
18
KATY INDEPENDENT SCHOOL DISTRICT
STATEMENT OF ACTIVITIES
FOR THE YEAR ENDED AUGUST 31, 2013
Program Revenues
Data Operating
Control Charges for Grants and
Codes Functions/Programs Expenses Services Contributions
Governmental Activities:
0011 Instruction 333,099,527$ 1,033,348$ 32,223,502$
0012 Instructional Resources and Media Services 9,015,595 2,249 1,100,774
0013 Curriculum and Staff Development 7,871,530 3,136 2,699,397
0021 Instructional Leadership 4,059,587 541 565,063
0023 School Leadership 30,333,001 2,492 1,901,844
0031 Guidance, Counseling, and Evaluation Services 21,261,678 3,326 2,843,657
0033 Health Services 5,407,237 260 10,091,310
0034 Student Transportation 17,006,681 44,170 600,281
0035 Food Services 27,993,364 12,699,017 12,133,561
0036 Cocurricular/Extracurricular Activities 12,246,444 2,252,426 1,306,391
0041 General Administration 9,484,422 219,816 585,959
0051 Plant Maintenance and Operations 47,106,425 2,232,762 1,980,824
0052 Security and Monitoring Services 5,388,225 15,548 231,106
0053 Data Processing Services 12,031,043 32,569 322,242
0061 Community Services 1,036,286 156,057 535,609
0072 Interest on Long-Term Debt 54,643,432 7,716,958
0073 Bond Issuance Costs and Fees 1,015,900
0081 Facilities Acquisition and Construction 1,502,445 1,219,902 285,890
0093 Payments Related to Shared Services Arrangements 204,065 204,065
0095 18,088
0097 Payments to Tax Increment Reinvestment Zone 1,122,877
0099 Payments to Appraisal Districts 2,455,136
TG Total Governmental Activities 604,302,988 19,917,619 77,328,433
TP TOTAL PRIMARY GOVERNMENT 604,302,988$ 19,917,619$ 77,328,433$
Data
Control
Codes
General Revenues and Special Items:
MT Property Taxes, Levied for General Purposes
DT Property Taxes, Levied for Debt Service
SF State Aid - Formula Grants Unrestricted
IE Investment Earnings
MI Miscellaneous
S1 Insurance Recoveries
S2 Net Gain on Disposal of Assets
TR Total General Revenues and Special Items
CN Change in Net Position
NB Net Position - Beginning
PA Prior period adjustments
NE Net Position - Ending
See Notes to Financial Statements.
Payments to Juvenile Justice Alternative Education Programs
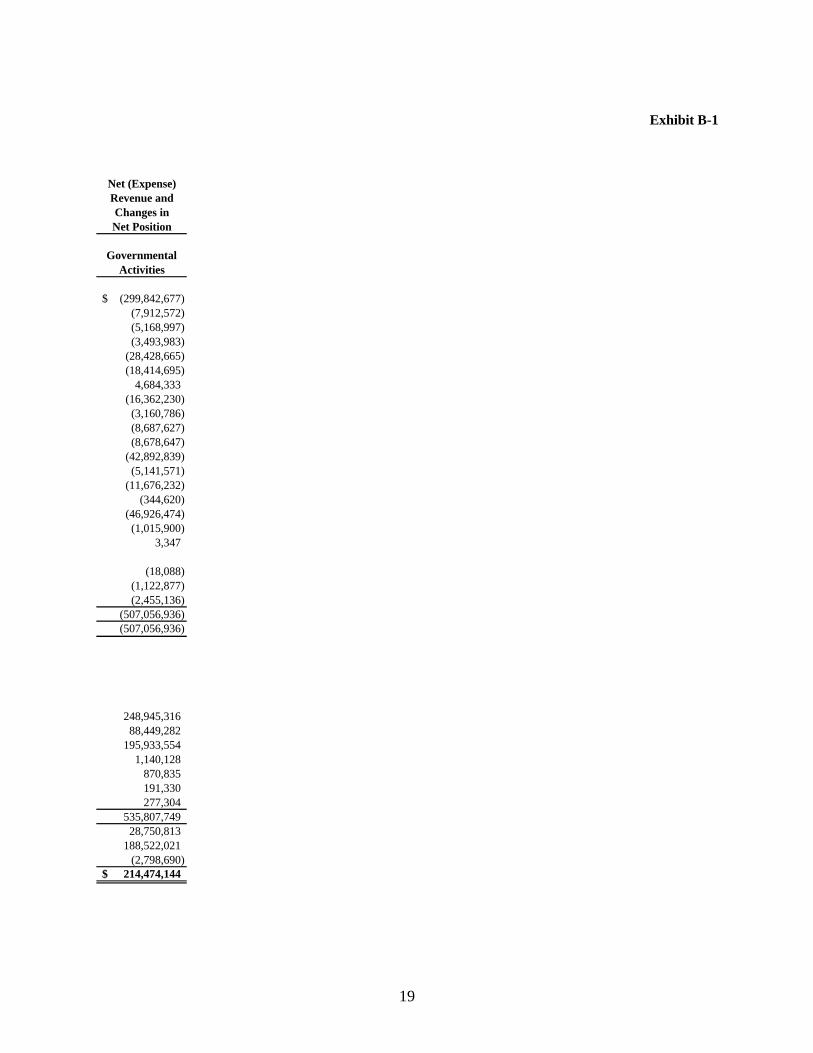
19
Exhibit B-1
Net (Expense)
Revenue and
Changes in
Net Position
Governmental
Activities
(299,842,677)$
(7,912,572)
(5,168,997)
(3,493,983)
(28,428,665)
(18,414,695)
4,684,333
(16,362,230)
(3,160,786)
(8,687,627)
(8,678,647)
(42,892,839)
(5,141,571)
(11,676,232)
(344,620)
(46,926,474)
(1,015,900)
3,347
(18,088)
(1,122,877)
(2,455,136)
(507,056,936)
(507,056,936)
248,945,316
88,449,282
195,933,554
1,140,128
870,835
191,330
277,304
535,807,749
28,750,813
188,522,021
(2,798,690)
214,474,144$
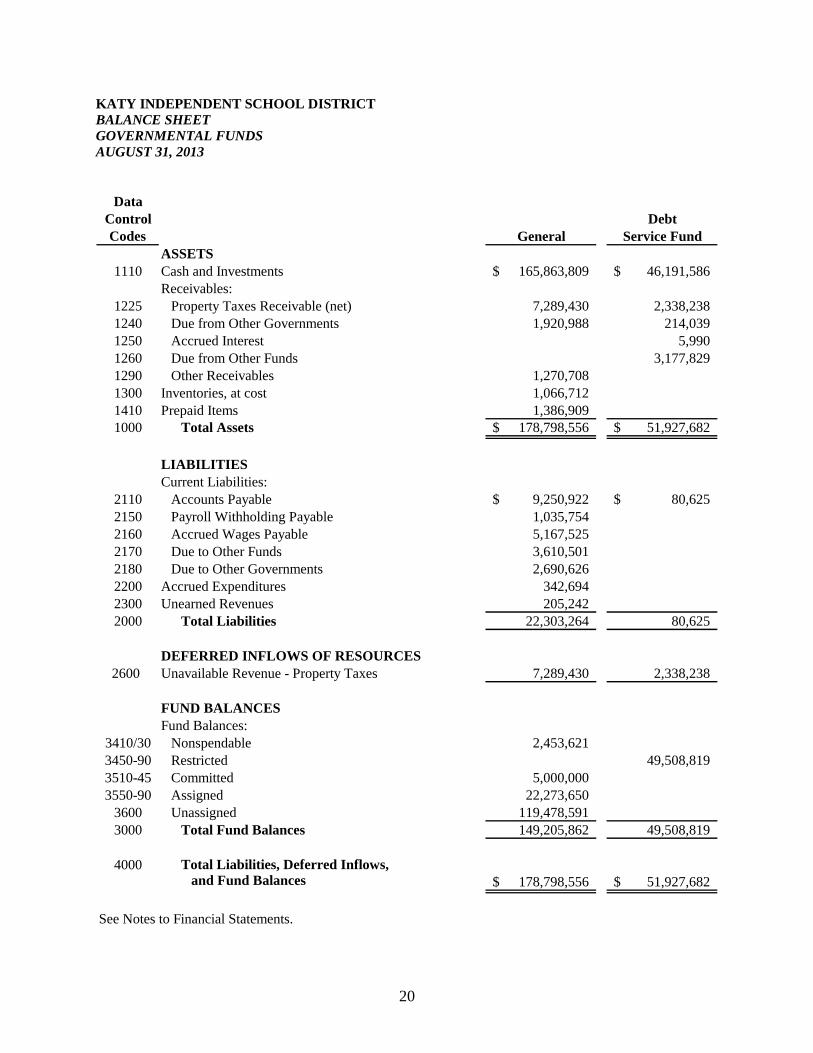
20
KATY INDEPENDENT SCHOOL DISTRICT
BALANCE SHEET
GOVERNMENTAL FUNDS
AUGUST 31, 2013
Data
Control Debt
Codes General Service Fund
ASSETS
1110 Cash and Investments 165,863,809$ 46,191,586$
Receivables:
1225 Property Taxes Receivable (net) 7,289,430 2,338,238
1240 Due from Other Governments 1,920,988 214,039
1250 Accrued Interest 5,990
1260 Due from Other Funds 3,177,829
1290 Other Receivables 1,270,708
1300 Inventories, at cost 1,066,712
1410 Prepaid Items 1,386,909
1000 Total Assets 178,798,556$ 51,927,682$
LIABILITIES
Current Liabilities:
2110 Accounts Payable 9,250,922$ 80,625$
2150 Payroll Withholding Payable 1,035,754
2160 Accrued Wages Payable 5,167,525
2170 Due to Other Funds 3,610,501
2180 Due to Other Governments 2,690,626
2200 Accrued Expenditures 342,694
2300 Unearned Revenues 205,242
2000 Total Liabilities 22,303,264 80,625
DEFERRED INFLOWS OF RESOURCES
2600 Unavailable Revenue - Property Taxes 7,289,430 2,338,238
FUND BALANCES
Fund Balances:
3410/30 Nonspendable 2,453,621
3450-90 Restricted 49,508,819
3510-45 Committed 5,000,000
3550-90 Assigned 22,273,650
3600 Unassigned 119,478,591
3000 Total Fund Balances 149,205,862 49,508,819
4000 Total Liabilities, Deferred Inflows,
and Fund Balances 178,798,556$ 51,927,682$
See Notes to Financial Statements.
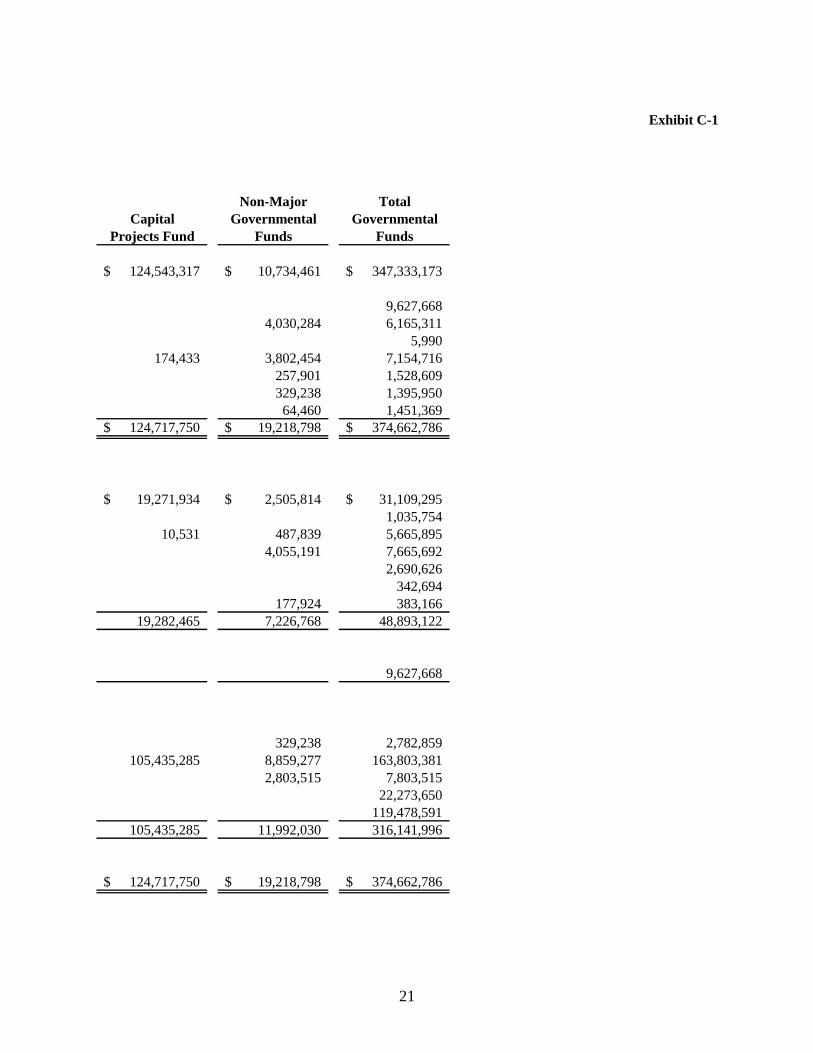
21
Exhibit C-1
Non-Major Total
Capital Governmental Governmental
Projects Fund Funds Funds
124,543,317$ 10,734,461$ 347,333,173$
9,627,668
4,030,284 6,165,311
5,990
174,433 3,802,454 7,154,716
257,901 1,528,609
329,238 1,395,950
64,460 1,451,369
124,717,750$ 19,218,798$ 374,662,786$
19,271,934$ 2,505,814$ 31,109,295$
1,035,754
10,531 487,839 5,665,895
4,055,191 7,665,692
2,690,626
342,694
177,924 383,166
19,282,465 7,226,768 48,893,122
9,627,668
329,238 2,782,859
105,435,285 8,859,277 163,803,381
2,803,515 7,803,515
22,273,650
119,478,591
105,435,285 11,992,030 316,141,996
124,717,750$ 19,218,798$ 374,662,786$

22
THIS PAGE INTENTIONALLY LEFT BLANK
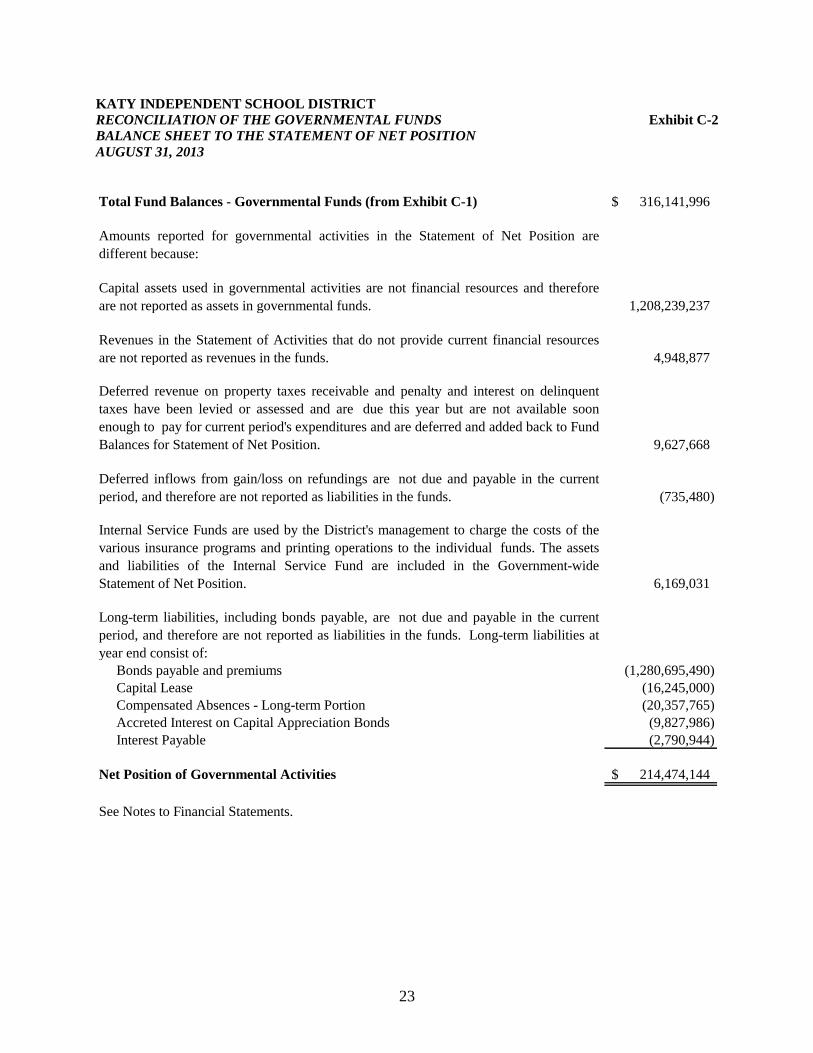
23
KATY INDEPENDENT SCHOOL DISTRICT
RECONCILIATION OF THE GOVERNMENTAL FUNDS Exhibit C-2
BALANCE SHEET TO THE STATEMENT OF NET POSITION
AUGUST 31, 2013
Total Fund Balances - Governmental Funds (from Exhibit C-1) 316,141,996$
Amounts reported for governmental activities in the Statement of Net Position are
different because:
Capital assets used in governmental activities are not financial resources and therefore
are not reported as assets in governmental funds. 1,208,239,237
Revenues in the Statement of Activities that do not provide current financial resources
are not reported as revenues in the funds. 4,948,877
Deferred revenue on property taxes receivable and penalty and interest on delinquent
taxes have been levied or assessed and are due this year but are not available soon
enough to pay for current period's expenditures and are deferred and added back to Fund
Balances for Statement of Net Position. 9,627,668
Deferred inflows from gain/loss on refundings are not due and payable in the current
period, and therefore are not reported as liabilities in the funds. (735,480)
Internal Service Funds are used by the District's management to charge the costs of the
various insurance programs and printing operations to the individual funds. The assets
and liabilities of the Internal Service Fund are included in the Government-wide
Statement of Net Position. 6,169,031
Long-term liabilities, including bonds payable, are not due and payable in the current
period, and therefore are not reported as liabilities in the funds. Long-term liabilities at
year end consist of:
Bonds payable and premiums (1,280,695,490)
Capital Lease (16,245,000)
Compensated Absences - Long-term Portion (20,357,765)
Accreted Interest on Capital Appreciation Bonds (9,827,986)
Interest Payable (2,790,944)
Net Position of Governmental Activities 214,474,144$
See Notes to Financial Statements.
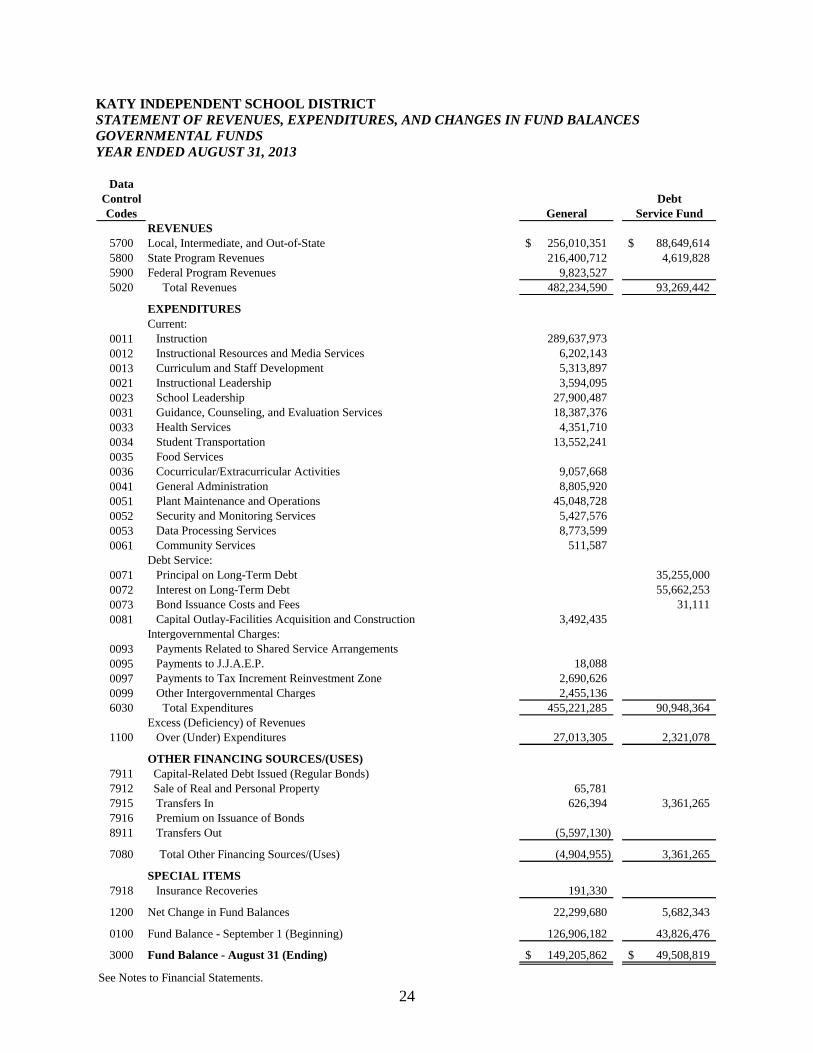
24
KATY INDEPENDENT SCHOOL DISTRICT
STATEMENT OF REVENUES, EXPENDITURES, AND CHANGES IN FUND BALANCES
GOVERNMENTAL FUNDS
YEAR ENDED AUGUST 31, 2013
Data
Control Debt
Codes General Service Fund
REVENUES
5700 Local, Intermediate, and Out-of-State 256,010,351$ 88,649,614$
5800 State Program Revenues 216,400,712 4,619,828
5900 Federal Program Revenues 9,823,527
5020 Total Revenues 482,234,590 93,269,442
EXPENDITURES
Current:
0011 Instruction 289,637,973
0012 Instructional Resources and Media Services 6,202,143
0013 Curriculum and Staff Development 5,313,897
0021 Instructional Leadership 3,594,095
0023 School Leadership 27,900,487
0031 Guidance, Counseling, and Evaluation Services 18,387,376
0033 Health Services 4,351,710
0034 Student Transportation 13,552,241
0035 Food Services
0036 Cocurricular/Extracurricular Activities 9,057,668
0041 General Administration 8,805,920
0051 Plant Maintenance and Operations 45,048,728
0052 Security and Monitoring Services 5,427,576
0053 Data Processing Services 8,773,599
0061 Community Services 511,587
Debt Service:
0071 Principal on Long-Term Debt 35,255,000
0072 Interest on Long-Term Debt 55,662,253
0073 Bond Issuance Costs and Fees 31,111
0081 Capital Outlay-Facilities Acquisition and Construction 3,492,435
Intergovernmental Charges:
0093 Payments Related to Shared Service Arrangements
0095 Payments to J.J.A.E.P. 18,088
0097 Payments to Tax Increment Reinvestment Zone 2,690,626
0099 Other Intergovernmental Charges 2,455,136
6030 Total Expenditures 455,221,285 90,948,364
Excess (Deficiency) of Revenues
1100 Over (Under) Expenditures 27,013,305 2,321,078
OTHER FINANCING SOURCES/(USES)
7911 Capital-Related Debt Issued (Regular Bonds)
7912 Sale of Real and Personal Property 65,781
7915 Transfers In 626,394 3,361,265
7916 Premium on Issuance of Bonds
8911 Transfers Out (5,597,130)
7080 Total Other Financing Sources/(Uses) (4,904,955) 3,361,265
SPECIAL ITEMS
7918 Insurance Recoveries 191,330
1200 Net Change in Fund Balances 22,299,680 5,682,343
0100 Fund Balance - September 1 (Beginning) 126,906,182 43,826,476
3000 Fund Balance - August 31 (Ending) 149,205,862$ 49,508,819$
See Notes to Financial Statements.
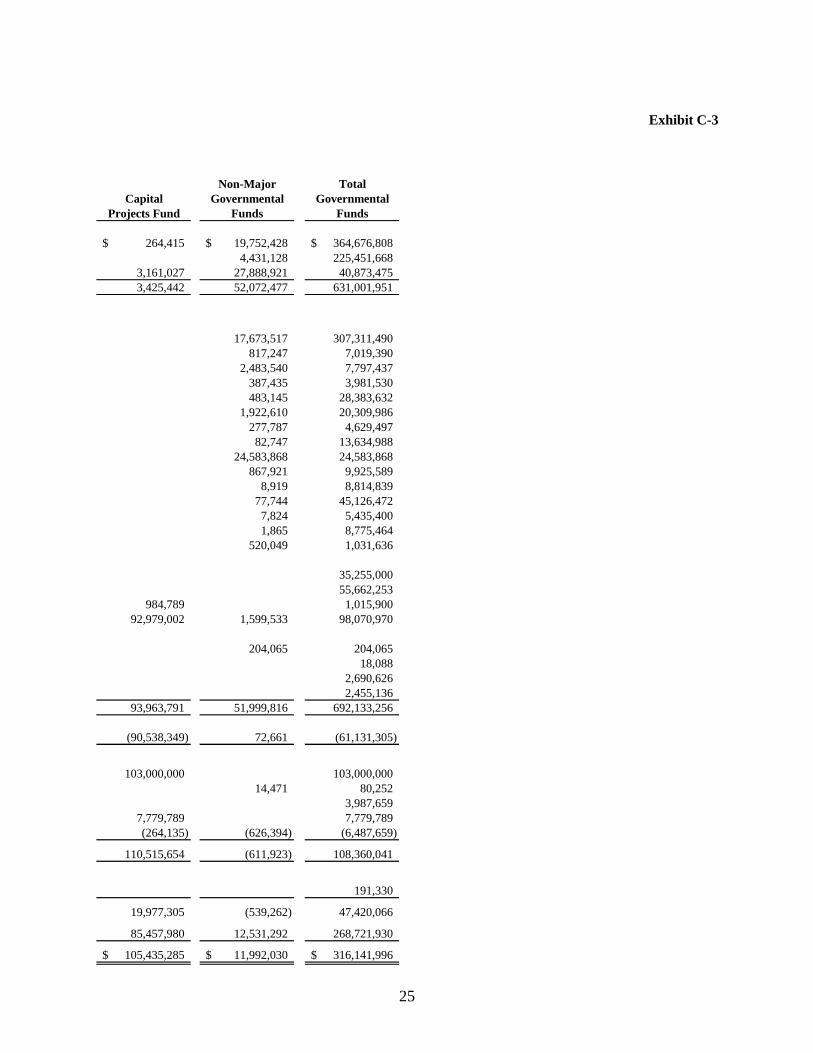
25
Exhibit C-3
Non-Major Total
Capital Governmental Governmental
Projects Fund Funds Funds
264,415$ 19,752,428$ 364,676,808$
4,431,128 225,451,668
3,161,027 27,888,921 40,873,475
3,425,442 52,072,477 631,001,951
17,673,517 307,311,490
817,247 7,019,390
2,483,540 7,797,437
387,435 3,981,530
483,145 28,383,632
1,922,610 20,309,986
277,787 4,629,497
82,747 13,634,988
24,583,868 24,583,868
867,921 9,925,589
8,919 8,814,839
77,744 45,126,472
7,824 5,435,400
1,865 8,775,464
520,049 1,031,636
35,255,000
55,662,253
984,789 1,015,900
92,979,002 1,599,533 98,070,970
204,065 204,065
18,088
2,690,626
2,455,136
93,963,791 51,999,816 692,133,256
(90,538,349) 72,661 (61,131,305)
103,000,000 103,000,000
14,471 80,252
3,987,659
7,779,789 7,779,789
(264,135) (626,394) (6,487,659)
110,515,654 (611,923) 108,360,041
191,330
19,977,305 (539,262) 47,420,066
85,457,980 12,531,292 268,721,930
105,435,285$ 11,992,030$ 316,141,996$
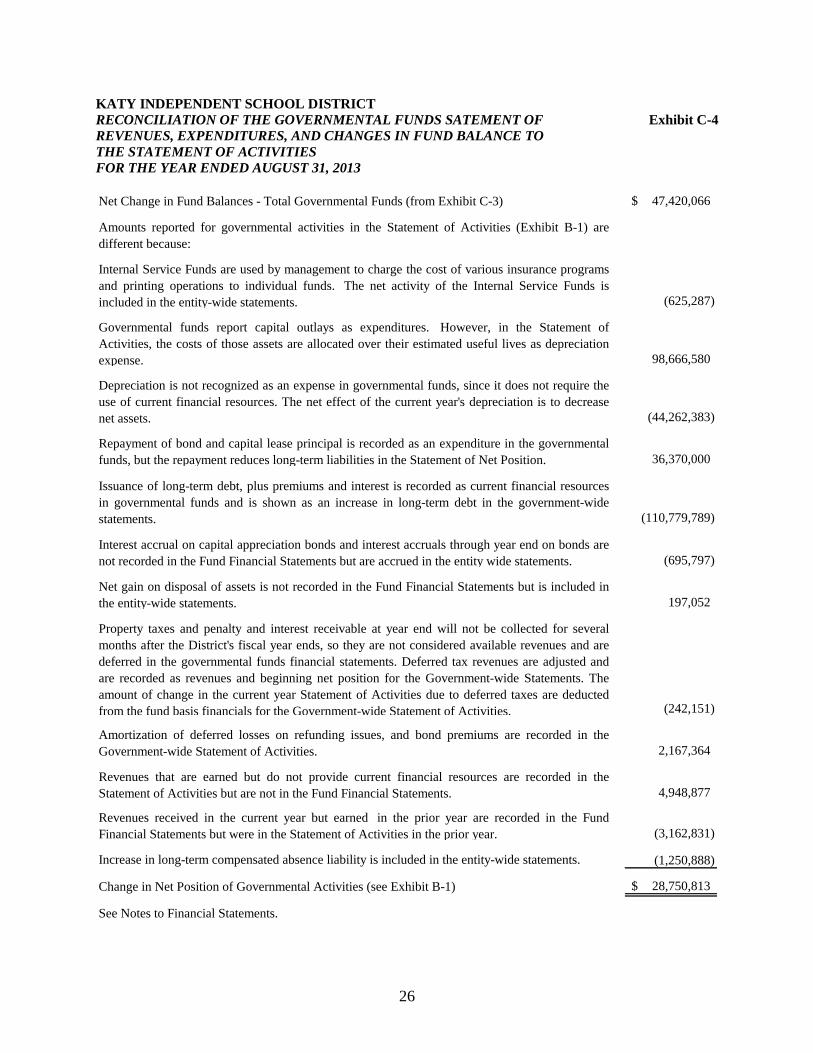
26
KATY INDEPENDENT SCHOOL DISTRICT
RECONCILIATION OF THE GOVERNMENTAL FUNDS SATEMENT OF Exhibit C-4
REVENUES, EXPENDITURES, AND CHANGES IN FUND BALANCE TO
THE STATEMENT OF ACTIVITIES
FOR THE YEAR ENDED AUGUST 31, 2013
Net Change in Fund Balances - Total Governmental Funds (from Exhibit C-3) 47,420,066$
Amounts reported for governmental activities in the Statement of Activities (Exhibit B-1) are
different because:
Internal Service Funds are used by management to charge the cost of various insurance programs
and printing operations to individual funds. The net activity of the Internal Service Funds is
included in the entity-wide statements. (625,287)
Governmental funds report capital outlays as expenditures. However, in the Statement of
Activities, the costs of those assets are allocated over their estimated useful lives as depreciation
expense. 98,666,580
Depreciation is not recognized as an expense in governmental funds, since it does not require the
use of current financial resources. The net effect of the current year's depreciation is to decrease
net assets. (44,262,383)
Repayment of bond and capital lease principal is recorded as an expenditure in the governmental
funds, but the repayment reduces long-term liabilities in the Statement of Net Position. 36,370,000
Issuance of long-term debt, plus premiums and interest is recorded as current financial resources
in governmental funds and is shown as an increase in long-term debt in the government-wide
statements. (110,779,789)
Interest accrual on capital appreciation bonds and interest accruals through year end on bonds are
not recorded in the Fund Financial Statements but are accrued in the entity wide statements. (695,797)
Net gain on disposal of assets is not recorded in the Fund Financial Statements but is included in
the entity-wide statements. 197,052
Property taxes and penalty and interest receivable at year end will not be collected for several
months after the District's fiscal year ends, so they are not considered available revenues and are
deferred in the governmental funds financial statements. Deferred tax revenues are adjusted and
are recorded as revenues and beginning net position for the Government-wide Statements. The
amount of change in the current year Statement of Activities due to deferred taxes are deducted
from the fund basis financials for the Government-wide Statement of Activities. (242,151)
Amortization of deferred losses on refunding issues, and bond premiums are recorded in the
Government-wide Statement of Activities. 2,167,364
Revenues that are earned but do not provide current financial resources are recorded in the
Statement of Activities but are not in the Fund Financial Statements. 4,948,877
Revenues received in the current year but earned in the prior year are recorded in the Fund
Financial Statements but were in the Statement of Activities in the prior year. (3,162,831)
Increase in long-term compensated absence liability is included in the entity-wide statements. (1,250,888)
Change in Net Position of Governmental Activities (see Exhibit B-1) 28,750,813$
See Notes to Financial Statements.
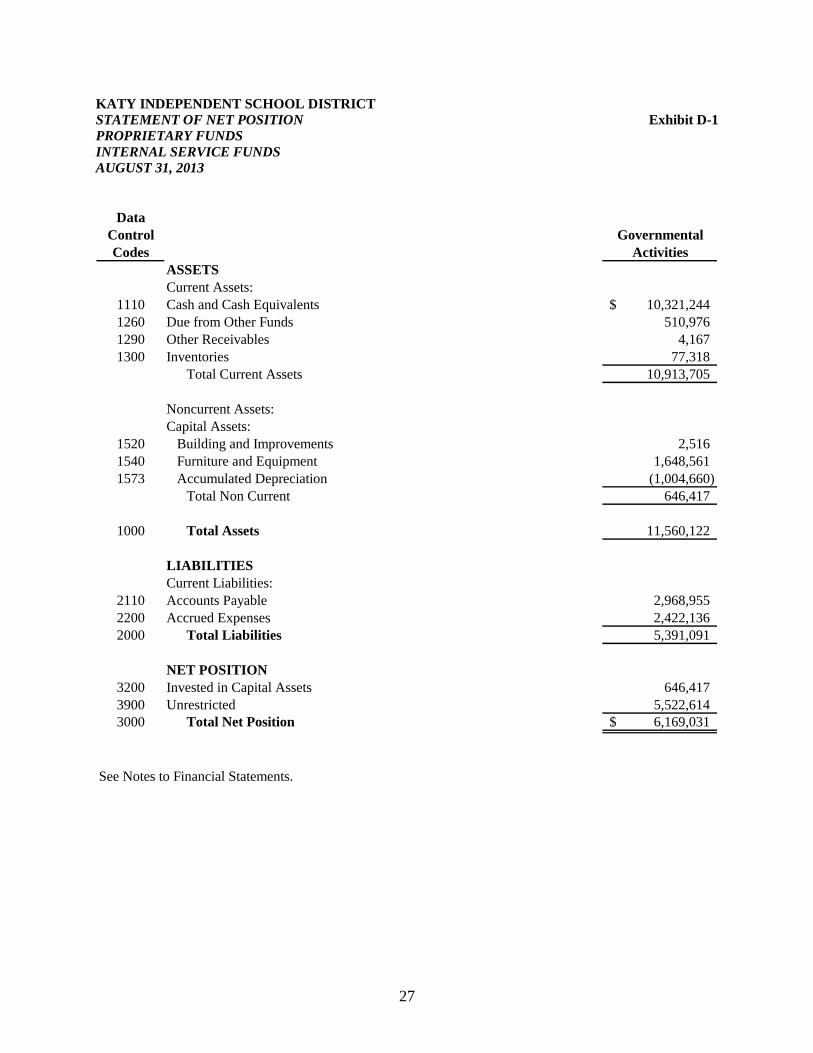
27
KATY INDEPENDENT SCHOOL DISTRICT
STATEMENT OF NET POSITION Exhibit D-1
PROPRIETARY FUNDS
INTERNAL SERVICE FUNDS
AUGUST 31, 2013
Data
Control Governmental
Codes Activities
ASSETS
Current Assets:
1110 Cash and Cash Equivalents 10,321,244$
1260 Due from Other Funds 510,976
1290 Other Receivables 4,167
1300 Inventories 77,318
Total Current Assets 10,913,705
Noncurrent Assets:
Capital Assets:
1520 Building and Improvements 2,516
1540 Furniture and Equipment 1,648,561
1573 Accumulated Depreciation (1,004,660)
Total Non Current 646,417
1000 Total Assets 11,560,122
LIABILITIES
Current Liabilities:
2110 Accounts Payable 2,968,955
2200 Accrued Expenses 2,422,136
2000 Total Liabilities 5,391,091
NET POSITION
3200 Invested in Capital Assets 646,417
3900 Unrestricted 5,522,614
3000 Total Net Position 6,169,031$
See Notes to Financial Statements.
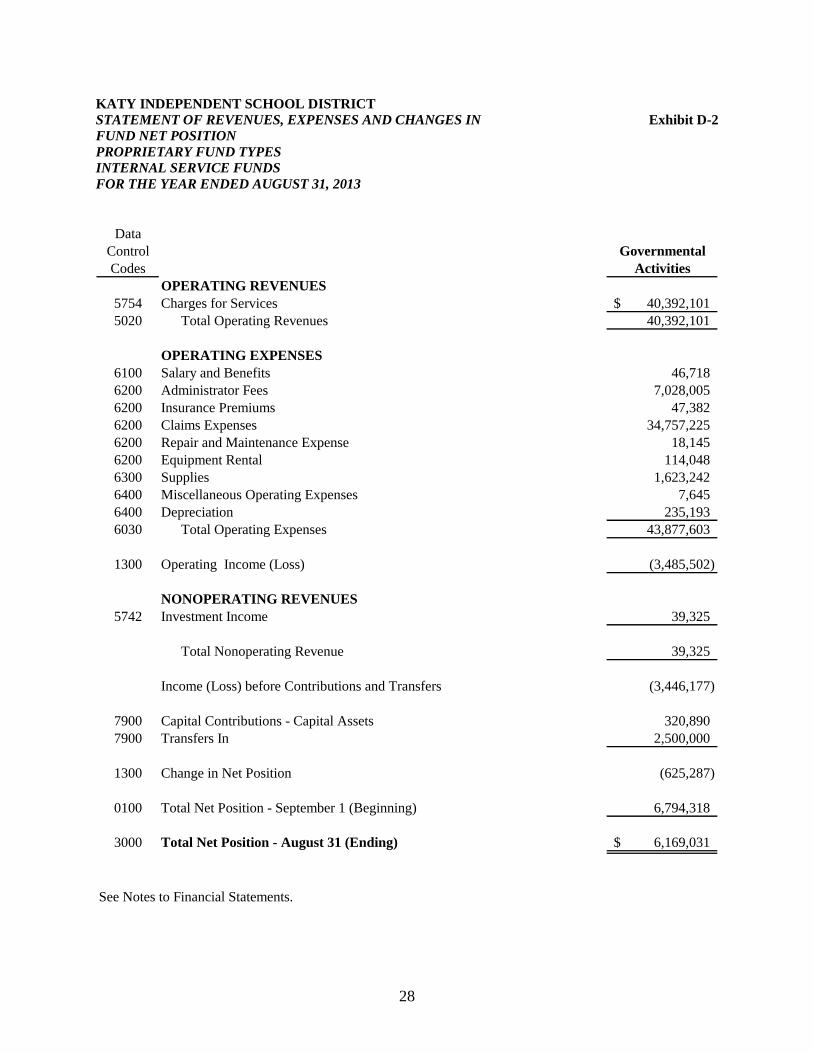
28
KATY INDEPENDENT SCHOOL DISTRICT
STATEMENT OF REVENUES, EXPENSES AND CHANGES IN Exhibit D-2
FUND NET POSITION
PROPRIETARY FUND TYPES
INTERNAL SERVICE FUNDS
FOR THE YEAR ENDED AUGUST 31, 2013
Data
Control Governmental
Codes Activities
OPERATING REVENUES
5754 Charges for Services 40,392,101$
5020 Total Operating Revenues 40,392,101
OPERATING EXPENSES
6100 Salary and Benefits 46,718
6200 Administrator Fees 7,028,005
6200 Insurance Premiums 47,382
6200 Claims Expenses 34,757,225
6200 Repair and Maintenance Expense 18,145
6200 Equipment Rental 114,048
6300 Supplies 1,623,242
6400 Miscellaneous Operating Expenses 7,645
6400 Depreciation 235,193
6030 Total Operating Expenses 43,877,603
1300 Operating Income (Loss) (3,485,502)
NONOPERATING REVENUES
5742 Investment Income 39,325
Total Nonoperating Revenue 39,325
Income (Loss) before Contributions and Transfers (3,446,177)
7900 Capital Contributions - Capital Assets 320,890
7900 Transfers In 2,500,000
1300 Change in Net Position (625,287)
0100 Total Net Position - September 1 (Beginning) 6,794,318
3000 Total Net Position - August 31 (Ending) 6,169,031$
See Notes to Financial Statements.
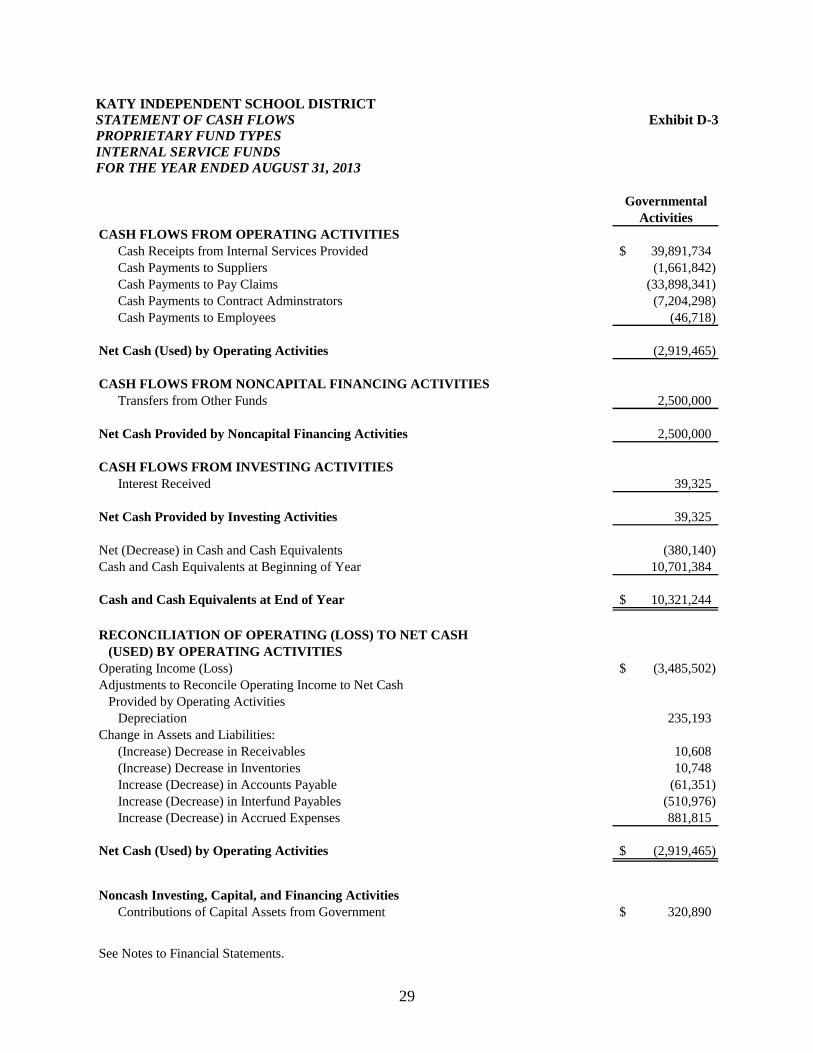
29
KATY INDEPENDENT SCHOOL DISTRICT
STATEMENT OF CASH FLOWS Exhibit D-3
PROPRIETARY FUND TYPES
INTERNAL SERVICE FUNDS
FOR THE YEAR ENDED AUGUST 31, 2013
Governmental
Activities
CASH FLOWS FROM OPERATING ACTIVITIES
Cash Receipts from Internal Services Provided 39,891,734$
Cash Payments to Suppliers (1,661,842)
Cash Payments to Pay Claims (33,898,341)
Cash Payments to Contract Adminstrators (7,204,298)
Cash Payments to Employees (46,718)
Net Cash (Used) by Operating Activities (2,919,465)
CASH FLOWS FROM NONCAPITAL FINANCING ACTIVITIES
Transfers from Other Funds 2,500,000
Net Cash Provided by Noncapital Financing Activities 2,500,000
CASH FLOWS FROM INVESTING ACTIVITIES
Interest Received 39,325
Net Cash Provided by Investing Activities 39,325
Net (Decrease) in Cash and Cash Equivalents (380,140)
Cash and Cash Equivalents at Beginning of Year 10,701,384
Cash and Cash Equivalents at End of Year 10,321,244$
RECONCILIATION OF OPERATING (LOSS) TO NET CASH
(USED) BY OPERATING ACTIVITIES
Operating Income (Loss) (3,485,502)$
Adjustments to Reconcile Operating Income to Net Cash
Provided by Operating Activities
Depreciation 235,193
Change in Assets and Liabilities:
(Increase) Decrease in Receivables 10,608
(Increase) Decrease in Inventories 10,748
Increase (Decrease) in Accounts Payable (61,351)
Increase (Decrease) in Interfund Payables (510,976)
Increase (Decrease) in Accrued Expenses 881,815
Net Cash (Used) by Operating Activities (2,919,465)$
Noncash Investing, Capital, and Financing Activities
Contributions of Capital Assets from Government 320,890$
See Notes to Financial Statements.
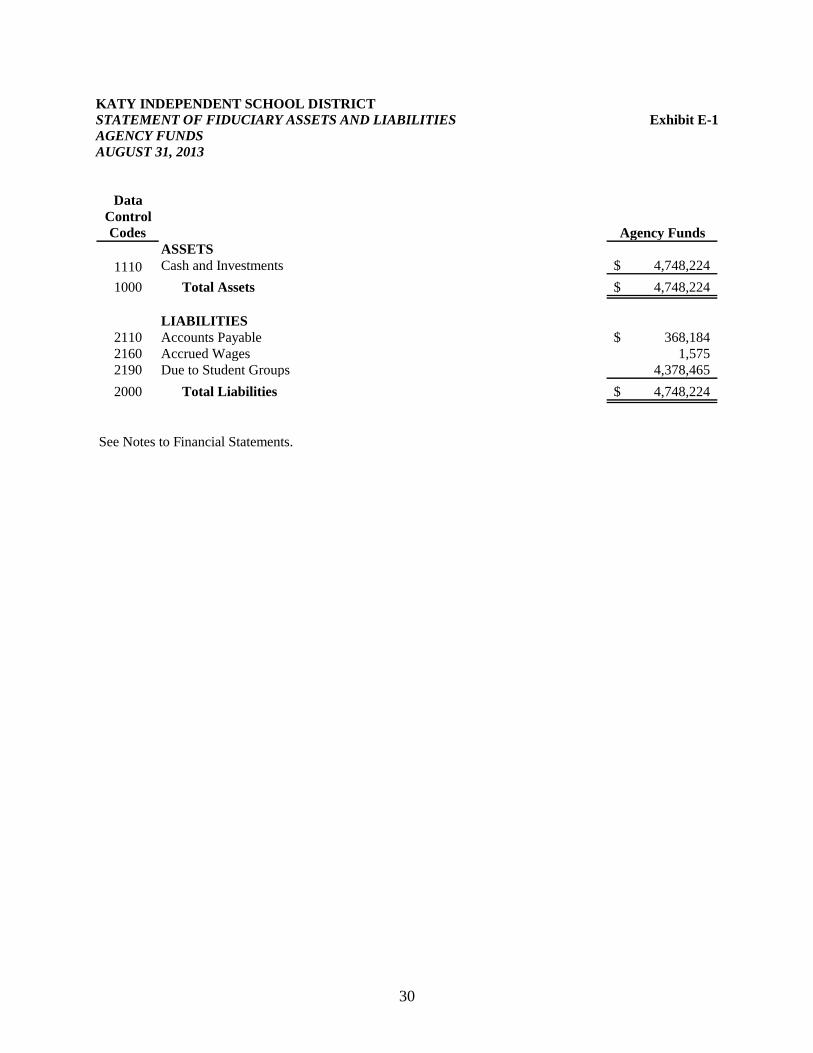
30
KATY INDEPENDENT SCHOOL DISTRICT
STATEMENT OF FIDUCIARY ASSETS AND LIABILITIES Exhibit E-1
AGENCY FUNDS
AUGUST 31, 2013
Data
Control
Codes Agency Funds
ASSETS
1110 Cash and Investments 4,748,224$
1000 Total Assets 4,748,224$
LIABILITIES
2110 Accounts Payable 368,184$
2160 Accrued Wages 1,575
2190 Due to Student Groups 4,378,465
2000 Total Liabilities 4,748,224$
See Notes to Financial Statements.
KATY INDEPENDENT SCHOOL DISTRICT
31
NOTE 1 – SUMMARY OF SIGNIFICANT ACCOUNTING POLICIES
The Katy Independent School District (the District) was formed in February 1919 by a special act of the
Texas State Legislature. The District is an independent public educational agency operating under applicable
laws and regulations of the State of Texas. A seven member Board of Trustees elected to staggered three-
year terms by the District’s residents autonomously governs the District. The District prepares its Basic
Financial Statements in conformity with Generally Accepted Accounting Principles (GAAP) promulgated by
the Governmental Accounting Standards Board (GASB) and other authoritative sources identified in
Statement on Auditing Standards No. 69 of the American Institute of Certified Public Accountants; and it
complies with the requirements of the appropriate version of the Texas Education Agency’s Financial Accountability System Resource Guide (the “Resource Guide” or “FASRG”) and the requirements of
contracts and grants of agencies from which it received funds.
The District prepared these financial statements in accordance with GASB Statement No. 34, “Basic
Financial Statements and Management’s Discussion and Analysis for State and Local Governments”, GASB
Statement No. 37, “Basic Financial Statements and Management’s Discussion and Analysis for State and
Local Governments: Omnibus” which provides additional guidance for the implementation of GASB
Statement No. 34, and GASB Statement No. 38 “Certain Financial Statement Disclosures” which changes
note disclosure requirements for governmental entities.
GASB Statement No. 34 established a financial reporting model for state and local governments that
included the addition of Management’s Discussion and Analysis, Government-wide Financial Statements,
Required Supplementary Information, and the elimination of the effects of internal service activities and the
use of account groups to the already required fund Financial Statements and notes.
The following is a summary of the most significant accounting policies:
A. Reporting Entity
The District is considered an independent entity for financial reporting purposes and is considered a
primary government. As required by Generally Accepted Accounting Principles, these basic financial
statements have been prepared based on considerations regarding the potential for inclusion of other
entities, organizations, or functions as part of the District’s financial reporting entity. Based on these
considerations, the District’s Basic Financial Statements do not include any other entities. Additionally,
as the District is considered a primary government for financial reporting purposes, its activities are not
considered a part of any other governmental or other type of reporting entity.
Considerations regarding the potential for inclusion of other entities, organizations, or functions in the
District’s financial reporting entity are based on criteria prescribed by Generally Accepted Accounting
Principles. These same criteria are evaluated in considering whether the District is a part of any other
governmental or other type of reporting entity. The overriding elements associated with prescribed
criteria considered in determining that the District’s financial reporting entity status is that of a primary
government are: that it has a separately elected governing body; it is legally separate; and it is fiscally
independent of other state and local governments.
Additionally prescribed criteria under Generally Accepted Accounting Principles include considerations
pertaining to organizations for which the primary government is financially accountable; and
considerations pertaining to other organizations for which the nature and significance of their
relationship with the primary government are such that exclusion would cause the reporting entity’s
financial statements to be misleading or incomplete.
KATY INDEPENDENT SCHOOL DISTRICT
32
NOTE 1 – SUMMARY OF SIGNIFICANT ACCOUNTING POLICIES (continued)
A. Reporting Entity (continued)
The Board of Trustees (the Board) is elected by the public and has the primary accountability for fiscal
matters. Therefore, the District is a financial reporting entity as defined by the Governmental
Accounting Standards Board (GASB) in its Statement No. 14, “The Financial Reporting Entity.” The
District has also implemented GASB Statement No. 39, “Determining Whether Certain Organizations
are Component Units”. The District receives support from various PTO, PTA, and Booster club
organizations. None of these organizations meet the criteria specified by GASB 39 to be included in the
District’s Financial Statements. Therefore, there are no component units included with the reporting
entity.
B. Government-wide and Fund Financial Statements
The Statement of Net Position and the Statement of Activities are Government-wide Financial
Statements. They report information on all of the Katy Independent School District operating activities
and activities other than the District’s fiduciary (agency type) activities. For the most part, the effect of
interfund activities has been removed from these statements. Governmental activities include programs
supported primarily by taxes, state foundation funds, grants and other intergovernmental revenues. The
District has no business-type activities that rely to a significant extent on fees and charges for support.
The Statement of Activities demonstrates how other people or entities that participate in programs the
District operates have shared in the payment of the direct costs. The “charges for services” column
includes payments made by parties that purchase, use, or directly benefit from goods or services
provided by a given function or segment of the District. Examples include school lunch charges,
community education tuition, summer school tuition, etc. The “grants and contributions” column
includes amounts paid by organizations outside the District to help meet the operational or capital
requirements of a given function. Examples include grants under the Elementary and Secondary
Education Act. If a revenue is not a program revenue, it is a general revenue used to support all of the
District’s functions. Property taxes are always general revenues.
Interfund activities between governmental funds and between governmental funds and proprietary funds
appear as due to/due from on the Governmental Fund Balance Sheet and Proprietary Fund Statement of
Net Position and as other resources and other uses on the Governmental Fund Statement of Revenues,
Expenditures and Changes in Fund Balance and on the Proprietary Fund Statement of Revenues,
Expenses and Changes in Fund Net Position. In the Government-wide statements, eliminations have
been made to minimize double-counting of internal activities. Interfund balances between governmental
funds and also between governmental funds and internal service funds are eliminated on the
Government-wide Statement of Net Position. Since the internal service funds support the District’s
activities, the financial activities of these funds are presented in the governmental activities column in
the Government-wide Statement of Activities as a direct expense in the proper functional category. In
the Government-wide Statement of Activities, the net activities of the Internal Service such as Health
Insurance, Workers’ Compensation, and Print Shop have been allocated to the appropriate functional
expense in order to present a more accurate and complete picture of the direct expenses of the functions.
The District has no interfund services provided and used between functions that would be program
revenue which would not be eliminated in the process of consolidation. Interfund activities between
governmental and fiduciary funds remain as due to/due from on the Government-wide Statement of
Activities.
KATY INDEPENDENT SCHOOL DISTRICT
33
NOTE 1 – SUMMARY OF SIGNIFICANT ACCOUNTING POLICIES (continued)
B. Government-wide and Fund Financial Statements (continued)
The Fund Financial Statements provide reports on the financial condition and results of operations for
three fund categories – governmental, proprietary, and fiduciary. Since the resources in the fiduciary
funds cannot be used for district operations, they are not included in the Government-wide Statements.
The District considers some governmental funds as major and reports their financial condition and
results of operations in a separate column.
Proprietary funds distinguish operating revenues and expenses from non-operating items. Operating
revenues and expenses result from providing services and producing and delivering goods in connection
with a proprietary fund’s principal ongoing operations. All other revenues and expenses are non-
operating.
C. Measurement Focus, Basis of Accounting, and Financial Statement Presentation
The Government-wide Financial Statements use the economic resources measurement focus and the
accrual basis of accounting, as do the Proprietary Fund and Fiduciary Fund financial statements.
Revenues are recorded when earned and expenses are recorded when a liability is incurred, regardless of
the timing of the related cash flows. Property taxes are recognized as revenues in the year for which they
are levied. Grants and similar items are recognized as revenue as soon as all eligibility requirements
imposed by the provider have been met.
Governmental Fund Financial Statements use the current financial resources measurement focus and the
modified accrual basis of accounting. With this measurement focus, only current assets, current
liabilities, deferred inflows of resources and fund balances are included on the balance sheet. Operating
statements of these funds present net increases and decreases in current assets (i.e., revenues and other
financing sources and expenditures and other financing uses).
The modified accrual basis of accounting recognizes revenues in the accounting period in which they
become both measurable and available and recognizes expenditures in the accounting period in which
the fund liability is incurred, if measurable, except for unmatured interest and principal on long-term
debt, which is recognized when due. The expenditures related to certain compensated absences and
claims and judgments are recognized when the obligations are expected to be liquidated with expendable
available financial resources. The District considers all revenues available if they are collectible within
60 days after year-end.
Revenues from local sources consist primarily of property taxes. Property tax revenues and revenues
received from the State are recognized under the susceptible-to-accrual concept. Miscellaneous revenues
are recorded as revenue when received in cash because they are generally not measurable until actually
received. Investment earnings are recorded as earned, since they are both measurable and available.
Grant funds are considered to be earned to the extent of expenditures made under the provisions of the
grant. Accordingly, when such funds are received, they are recorded as unearned revenues until related
and authorized expenditures have been made. If balances have not been expended by the end of the
project period, grantors may require the District to refund all or part of the unused amount.
KATY INDEPENDENT SCHOOL DISTRICT
34
NOTE 1 – SUMMARY OF SIGNIFICANT ACCOUNTING POLICIES (continued)
C. Measurement Focus, Basis of Accounting, and Financial Statement Presentation (continued)
The Proprietary Fund Types are accounted for on a flow of economic resources measurement focus and
utilize the accrual basis of accounting. This basis of accounting recognizes revenues in the accounting
period in which they are earned and become measurable and expenses in the accounting period in which
they are incurred and become measurable.
D. Fund Accounting
The accounts of the District are organized on the basis of funds in accordance with the provisions of the
Resource Guide. Each fund is considered to be a separate accounting entity. The operations of each fund
are accounted for by providing a separate set of self-balancing accounts, which comprise its assets,
liabilities, deferred inflows of resources, fund equity, revenues, and expenditures or expenses. For
financial statement presentation, the District’s Fund Financial Statements provide more detailed
information about the District’s most significant funds, not the District as a whole. The funds shown on
the Fund Financial Statements are considered major funds because of the size and activity of the funds
in relation to all of the funds.
The District reports the following major Governmental Funds:
1. General Fund
The General Fund is the government’s primary operating fund. It is used to account for all financial
transactions not properly included in other funds. The principal sources of revenues include local
property taxes, state funding under the Foundation School Program, interest earnings on fund
investments, federal source revenues for indirect costs reimbursed by the programs accounted for in
the Special Revenue Fund, and revenues received for School Health and Related Services.
Expenditures include all costs associated with the daily operations of the District except for food
service, debt service, capital projects, and specific programs funded by the federal or state
government.
2. Debt Service Fund
The Debt Service Fund is used to account for the payment of interest and principal on all bonds of
the District. The primary sources of revenue for debt service are local property taxes, state existing
debt and instructional facilities allotments, and interest earnings on investments.
3. Capital Projects Fund
The Capital Projects fund is used to account for the proceeds of the District’s bond sales and
revenues whose expenditures are restricted to the construction and acquisition of major capital
facilities.
KATY INDEPENDENT SCHOOL DISTRICT
35
NOTE 1 – SUMMARY OF SIGNIFICANT ACCOUNTING POLICIES (continued)
D. Fund Accounting (continued)
The District also reports the following Non-Major Governmental Fund:
4. Special Revenue Fund
The Special Revenue Fund is used to account for all financial resources restricted to, or designated
for, specific purposes by a grantor. Specifically, this type of fund is used to account for funds that
are used for the District’s food service program, including local and federal revenue sources, for
federally financed programs (grants) where unused balances are returned to the grantor at the close
of specified project periods and other revenue specific programs. Project accounting is employed to
maintain integrity for the various sources of funds. Resources accounted for in these funds are
awarded to the District for the purpose of accomplishing specific educational tasks as defined by
grantors in contracts or other agreements.
Additionally, the District reports the following Proprietary Fund:
5. Internal Service Fund
The Internal Service Fund is used to account for revenues and expenses related to services provided
to organizations inside the District on a cost reimbursement basis. The following Internal Service
Funds are used by the District:
The Workers’ Compensation Fund is used to account for the operations of the District’s workers’
compensation insurance plan, which is supported principally by employer contributions. Expenses
include plan benefit payments to insured employees for claims and premium charges. Estimated
amounts due for claims incurred but not reported at year-end are included as fund liabilities.
Similar to the Workers’ Compensation Fund, the Health Insurance Fund is used to account for the
District’s health insurance plan, which is supported by both district and employee contributions.
Expenses include plan benefit payments to health care providers for claims incurred. Estimated
amounts due for claims incurred but not reported at year-end are included as fund liabilities.
The Print Shop Fund is used to account for the District’s internal printing operations. All costs and
expenses of operating the print shop are accounted for in the fund. Users of the printing services are
charged fees based on amounts estimated to cover the cost of operations.
Additionally, the District reports the following Fiduciary Funds:
6. Agency Funds
The Agency Funds are used to account for activities of student groups. These funds have no equity;
assets are equal to liabilities and do not include revenues and expenditures for general operations of
the District. The Agency Fund accounts for resources held in a custodial capacity by the District,
and consist of funds that are property of students and others and cannot be used by the District in
operations.
KATY INDEPENDENT SCHOOL DISTRICT
36
NOTE 1 – SUMMARY OF SIGNIFICANT ACCOUNTING POLICIES (continued)
E. Other Accounting Policies – Assets, Liabilities, Deferred Outflows/Inflows of Resources, and Net
Position or Equity
1. Cash and Cash Equivalents
The District’s cash and cash equivalents are considered to be cash on hand, demand deposits,
certificates of deposit, balances in privately managed public funds investment pools (TexPool and
Lone Star), and short-term investments with original maturities of three months or less from the date
of acquisition. For the purpose of the statement of cash flows, the Proprietary Fund Types consider
temporary investments, with maturity of three months or less when purchased, to be cash
equivalents.
2. Investments
Investments consist of deposits with TexPool and Lone Star, local government investment pools.
The District’s investments are carried at fair value based on quoted market prices at August 31,
2013 in accordance with Generally Accepted Accounting Principles. Investments having a maturity
of three months or less when purchased are reported as cash and cash equivalents.
3. Short-Term Interfund Receivables/Payables
During the course of operations, transactions occur between individual funds for specified purposes.
These receivables and payables are classified as due from other funds or due to other funds on the
combined balance sheet.
4. Inventories and Prepaid Items
Inventories consisting of supplies and materials are stated at cost (average cost method) and include
consumable custodial, maintenance, transportation, instructional, food consumables and office
supplies. Inventories of governmental funds are recorded as expenditures when the supplies and
materials are used or consumed (consumption method) rather than when purchased. Inventories of
food commodities are recorded as revenues at fair market value supplied by the Texas Department
of Human Services on the date received, and are recorded as expenditures when the commodities
are consumed. A portion of fund balance is classified as non-spendable to reflect minimum
inventory quantities considered necessary for the District’s continuing operations.
Certain payments to vendors reflect costs application to future accounting periods and are recorded
as prepaid items in both government-wide and fund financial statements.
5. Capital Assets
Capital assets, which include land, buildings, furniture and equipment, are reported in the applicable
governmental column in the Government-wide Financial Statements. Primarily, capital assets are
defined by the District as assets with an initial cost of more than $5,000 and an estimated useful life
in excess of one year. Such assets are recorded at historical cost or estimated historical cost if
purchased or constructed. Costs of the facilities Acquisition and Construction Function that relate to
overall planning of District facilities, managing overall District assets and overall construction
projects are treated as period costs and are not capitalized unless related to specific assets. Donated
capital assets are recorded at estimated fair market value at the date of donation.
KATY INDEPENDENT SCHOOL DISTRICT
37
NOTE 1 – SUMMARY OF SIGNIFICANT ACCOUNTING POLICIES (continued)
E. Other Accounting Policies – Assets, Liabilities, Deferred Outflows/Inflows of Resources, and Net
Position or Equity (continued)
5. Capital Assets (continued)
The costs of normal maintenance and repairs that do not add to the value of the asset or materially
extend assets lives are not capitalized. Major outlays for capital assets and improvements are
capitalized as projects are constructed.
When assets are retired or otherwise disposed of, the related costs or other recorded amounts are
removed.
Buildings, furniture, and equipment of the District are depreciated using the straight line method
over the following estimated useful lives:
Assets Years
Building 50
Portable Buildings 25-50
Building Improvements 7-25
Furniture & Fixtures 20
Vehicles 15
Buses 15
Equipment 10-15
Office Equipment 10
Computer Equipment 6
Land and construction in progress are not depreciated
6. Deferred Outflows/Inflows of Resources
In addition to assets, the Statement of Net Position will sometimes report a separate section for
deferred outflows of resources. This separate financial statement element, Deferred Outflows of
Resources, represents a consumption of net position that applies to a future period(s) and so will not
be recognized as an outflow of resources (expense/expenditure) until then. The District has one item
that qualifies for reporting in this category. It is related to the hedging derivative instruments
associated with the Series 2012-C Bonds and the refunding of the Series 2004-C Bonds. The
deferred amount on refunding related to the Series 2004-C Bonds is reported in the Government-
wide Statement of Net Position in this category and will be amortized over the life of the debt.
In addition to liabilities, the Statement of Net Position will sometimes report a separate section for
deferred inflows of resources. This separate financial statement element, Deferred Inflows of
Resources, represents an acquisition of net position that applies to a future period(s) and so will not
be recognized as an inflow or resource (revenue) until that time. The District has two items that
qualifies for reporting in this category. The imputed at-the-market swaps associated with the Series
2012-C Bonds are reported as a deferred inflow of resources at market value. The net gain/loss on
refunding bonds is reported in the Government-wide Statement of Net Position in this category and will be amortized over the life of the debt.
KATY INDEPENDENT SCHOOL DISTRICT
38
NOTE 1 – SUMMARY OF SIGNIFICANT ACCOUNTING POLICIES (continued)
E. Other Accounting Policies – Assets, Liabilities, Deferred Outflows/Inflows of Resources, and Net
Position or Equity (continued)
6. Deferred Outflows/Inflows of Resources (continued)
In addition to liabilities, the Balance Sheet will sometimes report a separate section for deferred
inflows of resources. This separate financial statement element, Deferred Inflows of Resources,
represents unavailable revenues that applies to a future period(s) and so will not be recognized as an
inflow or resource (revenue) until that time. The District has one item that qualifies for reporting in
this category. The unavailable revenue – property taxes are reported as a deferred inflow of
resources and will be recognized as collected.
7. Long-Term Obligations
In the Government-wide Financial Statements and in the Proprietary Fund types in the Fund
Financial Statements, long-term debt and other long-term obligations are reported as liabilities in the
applicable governmental activities, or Proprietary Fund type Statement of Net Position. Bond
premiums and discounts are deferred and amortized over the life of the bonds using the effective
interest method. Bonds payable are reported net of the applicable bond premium or discount. Bond
issuance costs are expensed when incurred. Accretion of interest on the capital appreciation bonds is
recorded at the accreted value through the end of the fiscal year.
In the Fund Financial Statements, Governmental Fund types recognize bond premiums and
discounts, as well as bond issuance costs, during the current period. The face amount of debt issued
is reported as other financing sources. Premiums received on debt issuances are reported as other
financing sources while discounts on debt issuances are reported as other financing uses. Issuance
costs, whether or not withheld from the actual debt proceeds received, are reported as debt service
expenditures.
8. Transactions Between Funds
Transactions between funds that would be treated as revenues, expenditures or expenses if they
involved organizations external to the District are accounted for as revenues, expenditures or
expenses in the applicable funds.
Transactions which constitute reimbursements of a fund for expenditures or expenses initially made
from that fund, which are properly attributable to another fund, are recorded as expenditures or
expenses in the reimbursing fund and as reductions of the expenditures or expenses in the fund that
is reimbursed.
Other legally authorized transfers are included in the results of operations of the governmental
funds.
9. Compensated Absences – Accumulated Vacation Pay and Sick Leave
The District has a vacation pay policy for twelve-month employees whereby eligible employees
shall receive vacation of one to fifteen days dependent upon the number of years of service.
Employees become eligible for vacation days after six months of employment. All vacation days are
forfeited if not taken by December 31 of the calendar year; therefore, the liability for unused
vacation days at August 31, 2013 is not material to the financial statements.
KATY INDEPENDENT SCHOOL DISTRICT
39
NOTE 1 – SUMMARY OF SIGNIFICANT ACCOUNTING POLICIES (continued)
E. Other Accounting Policies – Assets, Liabilities, Deferred Outflows/Inflows of Resources, and Net
Position or Equity (continued)
9. Compensated Absences – Accumulated Vacation Pay and Sick Leave (continued)
The District pays a portion of accrued sick leave to employees who retire with five or more years of
continuous employment in the District and whose retirement can be verified by the Teachers
Retirement System. The compensated absences are normally paid through the General Fund when
the amounts are due. Payment is limited to the current salary rate for one-half of the locally
accumulated sick leave days up to a maximum of 90 accumulated days.
10. Fund Equity
Beginning with fiscal year 2011, the District implemented GASB Statement No. 54 “Fund Balance
Reporting and Governmental Fund Type Definitions”. This statement provides more clearly defined
fund balance categories to make the nature and extent of the constraints placed on a government’s
fund balance more transparent. The following classifications describe the relative strength of the
spending constraints:
a. Non-spendable Fund Balance
Non-spendable fund balance represents amounts that are not in spendable form or are required
to be maintained intact. As such, the inventory and prepaid items have been properly classified
in the Governmental Funds Balance Sheet (Exhibit C-1).
b. Restricted Fund Balance
Restricted fund balance consists of amounts that can be spent only for specific purposes because
of local, state or federal laws, or externally imposed conditions by grantors or creditors. The
Fund balance for the Child Nutrition Fund and other grant funds are classified as restricted.
c. Committed Fund Balance
Committed fund balances are amounts constrained to specific purposes by the District itself,
using its highest decision making authority (the Board of Trustees). To be reported as
committed, amounts cannot be used for any other purpose unless the District takes the same
highest level of action to remove or change the constraint. The General Fund has committed
$5,000,000 for self-insurance purposes. The District has committed the fund balance in the
Campus Activity Fund for uses benefitting the respective campuses where the funds were
raised.
d. Assigned Fund Balance
Assigned fund balance is the amount the District intends to use for a specific purpose The
Board of Trustees delegates the responsibility to assign fund balances to the Superintendent or
his designees. The District has assigned fund balances in the General Fund in the amount of
$22,324,758 and is detailed in Note 12.
KATY INDEPENDENT SCHOOL DISTRICT
40
NOTE 1 – SUMMARY OF SIGNIFICANT ACCOUNTING POLICIES (continued)
E. Other Accounting Policies – Assets, Liabilities, Deferred Outflows/Inflows of Resources, and Net
Position or Equity (continued)
10. Fund Equity (continued)
e. Unassigned Fund Balance
Amounts that are available for any purpose are considered unassigned fund balance. Positive
numbers can only be reported in the general fund.
The District establishes (and modifies or rescinds) fund balance commitments and assignments by
passage of resolution. Per the local policy, assigned fund balance amounts are established by the
Superintendent or his designee.
11. Use of Estimates
The presentation of financial statements, in conformity with Generally Accepted Accounting
Principles, requires management to make estimates and assumptions that affect the reported
amounts of assets and liabilities, disclosure of contingent assets and liabilities at the date of the
financial statements, and the reported amounts of revenues and expenditures during the reporting
period. Actual results could differ from those estimates.
12. Data Control Codes
The Data Control Codes refer to the account code structure prescribed by TEA in the Financial
Accountability System Resource Guide. The Texas Education Agency requires school districts to
display these codes in the financial statements filed with the Agency in order to insure accuracy in
building a statewide database for policy development and funding plans.
13. Use of Funds
When both restricted and unrestricted resources are available for use, it is the District’s policy to use
restricted resources first, then unrestricted as they are needed. Additionally, the District would first
use committed, then assigned, and lastly unassigned amounts of unrestricted fund balance when
expenditures are made. The District does not have a formal minimum fund balance policy.
NOTE 2 – RECONCILIATION OF GOVERNMENT-WIDE AND FUND FINANCIAL STATEMENTS
A. Explanation of Certain Differences between the Governmental Fund Balance Sheet and the
Government-wide Statement of Net Position
Exhibit C-2 provides the reconciliation between the fund balance for total governmental funds on the
governmental fund balance sheet and the net position for governmental activities as reported in the
Government-wide Statement of Net Position. Major elements of that reconciliation include capital assets
which are not financial resources and are therefore not reported in governmental funds, long-term
liabilities, including bonds payable, which are not due and payable in the current period and are not
reported as liabilities in the Fund Financial Statements, and property taxes receivable which are included
as unearned in the Fund Financial Statements are adjusted based on when the tax levy was made and for
uncollectible amounts.
KATY INDEPENDENT SCHOOL DISTRICT
41
NOTE 2 – RECONCILIATION OF GOVERNMENT-WIDE AND FUND FINANCIAL STATEMENTS
(continued)
B. Explanation of Certain Differences between the Governmental Fund Statement of Revenues,
Expenditures and Changes in Fund Balances and the Government-wide Statement of Activities
Exhibit C-4 provides a reconciliation between the net changes in fund balance as shown on the
governmental fund Statement of Revenues, Expenditures, and Changes in Fund Balances and the
changes in net position of governmental activities as reported on the Government-wide Statement of
Activities. One element of that reconciliation explains that current year capital outlays and debt principal
payments are expenditures in the Fund Financial Statements, but should be shown as increases in capital
assets and decreases in long-term debt in the Government-wide Statements. This adjustment affects both
the net position balance and the change in net position. The debt payments on retirement of debt are
recorded as expenditures for Fund Basis Financial Statements but are recorded as a reduction of debt in
the Government-wide Financial Statements. The capital asset additions are expenditures in the Fund
Basis Financial Statements but are capitalized in the Government-wide Financial Statements. The Fund
Basis Financial Statements do not include the current depreciation expense.
Another element of the reconciliation on Exhibit C-4 is described as various other reclassifications and
eliminations necessary to convert from the modified accrual basis of accounting to the accrual basis of
accounting. As indicated above, if new debt is issued, it is treated as a source of revenue on the Fund
Basis Financial Statements, while in the Government-wide Financial Statements; the amount is recorded
as a liability. Property taxes are adjusted for the accrual basis and the unearned revenues are adjusted
based on prior year levies and current year uncollectible amounts.
NOTE 3 – STEWARDSHIP, COMPLIANCE, AND ACCOUNTABILITY
A. Budgetary Data
The Board of Trustees adopts an appropriated budget for the General Fund, Debt Service Fund, and
Special Revenue Fund. The Food Service fund is included in the Special Revenue Fund. Budgets are
prepared using the same method of accounting as for financial reporting. The District is required to
present the adopted and final amended budgeted revenues and expenditures for the General Fund and
each major special revenue fund. The Food Service Fund is not a major fund. The General Fund budget
report appears in the required supplementary information section where the District compares the final
amended budget to actual revenues and expenditures. Per regulatory requirements, the Debt Service
Fund and the Food Service Fund are required to be reported with the original budget, amended budget
and actual. These statements are included in the Other Supplementary Information section of this report.
The Capital Projects Fund budget is prepared on a project basis based on the proceeds available from
bond issues and planned expenditures outlined in applicable bond ordinances. Capital Projects Fund
equity, which represents unexpended appropriations, is re-appropriated in the subsequent fiscal year’s
budget until available funds for acquisition and construction of facilities have been utilized. Each major
construction contract is approved based on the existing availability of bond proceeds and/or approved
but unissued bonds. The non-budgeted Special Revenue funds (primarily federal, state, and local grant
programs) utilize a managerial type financial plan approved at the fund level by the Board of Trustees
upon acceptance of the grants. These grants are subject to state imposed project length budgets and
monitored through submission of reimbursement reports to the state.
KATY INDEPENDENT SCHOOL DISTRICT
42
NOTE 3 – STEWARDSHIP, COMPLIANCE, AND ACCOUNTABILITY (continued)
A. Budgetary Data (continued)
The following procedures are followed in establishing the budgetary data reflected in the Fund Financial
Statements:
1. Prior to August 20, the District prepares a budget for the next succeeding fiscal year beginning
September 1. The operating budget includes proposed expenditures and the means of financing
them.
2. A meeting of the Board is then called for the purpose of adopting the proposed budget. At least ten
days public notice of the meeting must be given.
3. Prior to September 1, the budget is legally enacted through passage of a resolution by the Board.
Once a budget is approved, it can only be amended at the function and fund level by approval of a
majority of the members of the Board. Amendments are presented to the Board at its regular
meetings. Each amendment must have Board approval. As required by law, such amendments are
made before the fact, are reflected in the official minutes of the Board, and are not made after fiscal
year end. Because the District has a policy of careful budgetary control, several amendments were
necessary during the year.
4. Each budget is controlled by the budget coordinator at the revenue and expenditure function/object
level. Budgeted amounts are amended by the Board. All budget appropriations lapse at year end.
5. During the fiscal year ended August 31, 2013 the District did not have any expenditures over
appropriations in major funds.
6. A reconciliation of fund balances for both appropriated budget and non-appropriated budget Special
Revenue Funds is as follows:
All Special Unbudgeted Budgeted
Revenue Special Special
Funds Revenue Funds Revenue Funds
Revenues 52,072,477$ 26,923,502$ 25,148,975$
Expenditures 51,999,816 26,204,175 25,795,641
Revenues Over (Under) Expenditures 72,661 719,327 (646,666)
Other Sources (Uses) (611,923) (626,394) 14,471
Fund Balance Beginning 12,531,292 6,697,387 5,833,905
Fund Balance Ending 11,992,030$ 6,790,320$ 5,201,710$
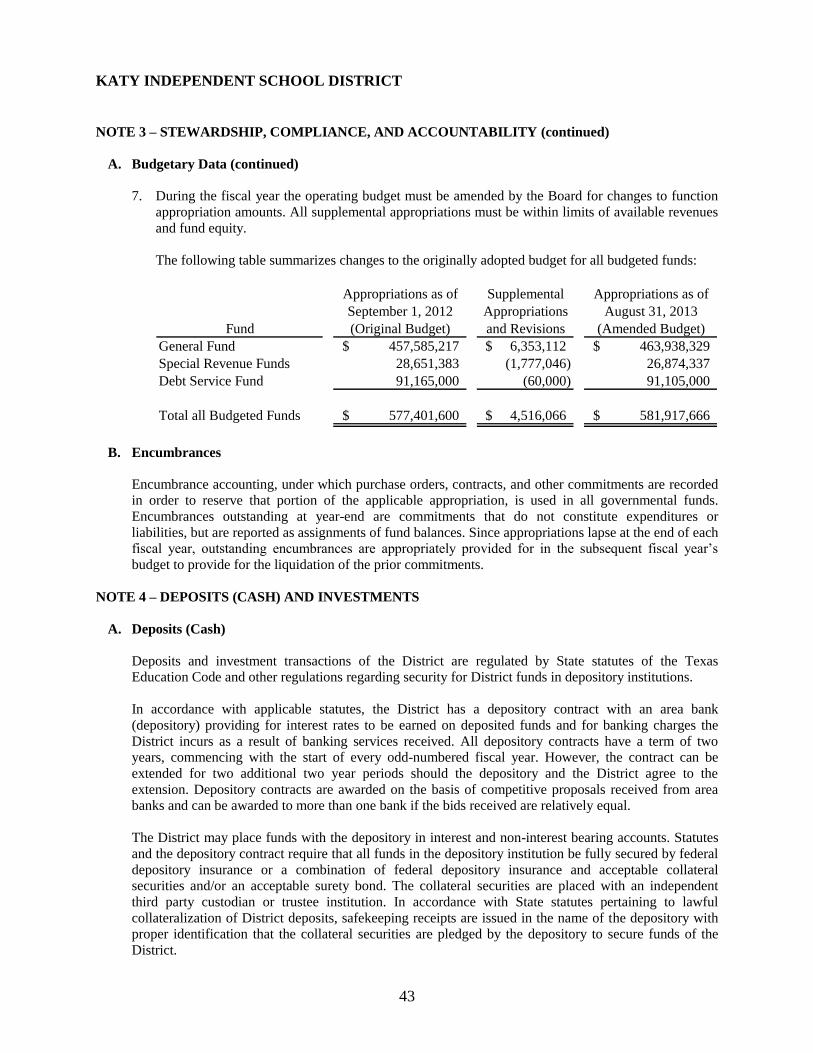
KATY INDEPENDENT SCHOOL DISTRICT
43
NOTE 3 – STEWARDSHIP, COMPLIANCE, AND ACCOUNTABILITY (continued)
A. Budgetary Data (continued)
7. During the fiscal year the operating budget must be amended by the Board for changes to function
appropriation amounts. All supplemental appropriations must be within limits of available revenues
and fund equity.
The following table summarizes changes to the originally adopted budget for all budgeted funds:
Appropriations as of Supplemental Appropriations as of
September 1, 2012 Appropriations August 31, 2013
Fund (Original Budget) and Revisions (Amended Budget)
General Fund 457,585,217$ 6,353,112$ 463,938,329$
Special Revenue Funds 28,651,383 (1,777,046) 26,874,337
Debt Service Fund 91,165,000 (60,000) 91,105,000
Total all Budgeted Funds 577,401,600$ 4,516,066$ 581,917,666$
B. Encumbrances
Encumbrance accounting, under which purchase orders, contracts, and other commitments are recorded
in order to reserve that portion of the applicable appropriation, is used in all governmental funds.
Encumbrances outstanding at year-end are commitments that do not constitute expenditures or
liabilities, but are reported as assignments of fund balances. Since appropriations lapse at the end of each
fiscal year, outstanding encumbrances are appropriately provided for in the subsequent fiscal year’s
budget to provide for the liquidation of the prior commitments.
NOTE 4 – DEPOSITS (CASH) AND INVESTMENTS
A. Deposits (Cash)
Deposits and investment transactions of the District are regulated by State statutes of the Texas
Education Code and other regulations regarding security for District funds in depository institutions.
In accordance with applicable statutes, the District has a depository contract with an area bank
(depository) providing for interest rates to be earned on deposited funds and for banking charges the
District incurs as a result of banking services received. All depository contracts have a term of two
years, commencing with the start of every odd-numbered fiscal year. However, the contract can be
extended for two additional two year periods should the depository and the District agree to the
extension. Depository contracts are awarded on the basis of competitive proposals received from area
banks and can be awarded to more than one bank if the bids received are relatively equal.
The District may place funds with the depository in interest and non-interest bearing accounts. Statutes
and the depository contract require that all funds in the depository institution be fully secured by federal
depository insurance or a combination of federal depository insurance and acceptable collateral
securities and/or an acceptable surety bond. The collateral securities are placed with an independent
third party custodian or trustee institution. In accordance with State statutes pertaining to lawful
collateralization of District deposits, safekeeping receipts are issued in the name of the depository with
proper identification that the collateral securities are pledged by the depository to secure funds of the
District.
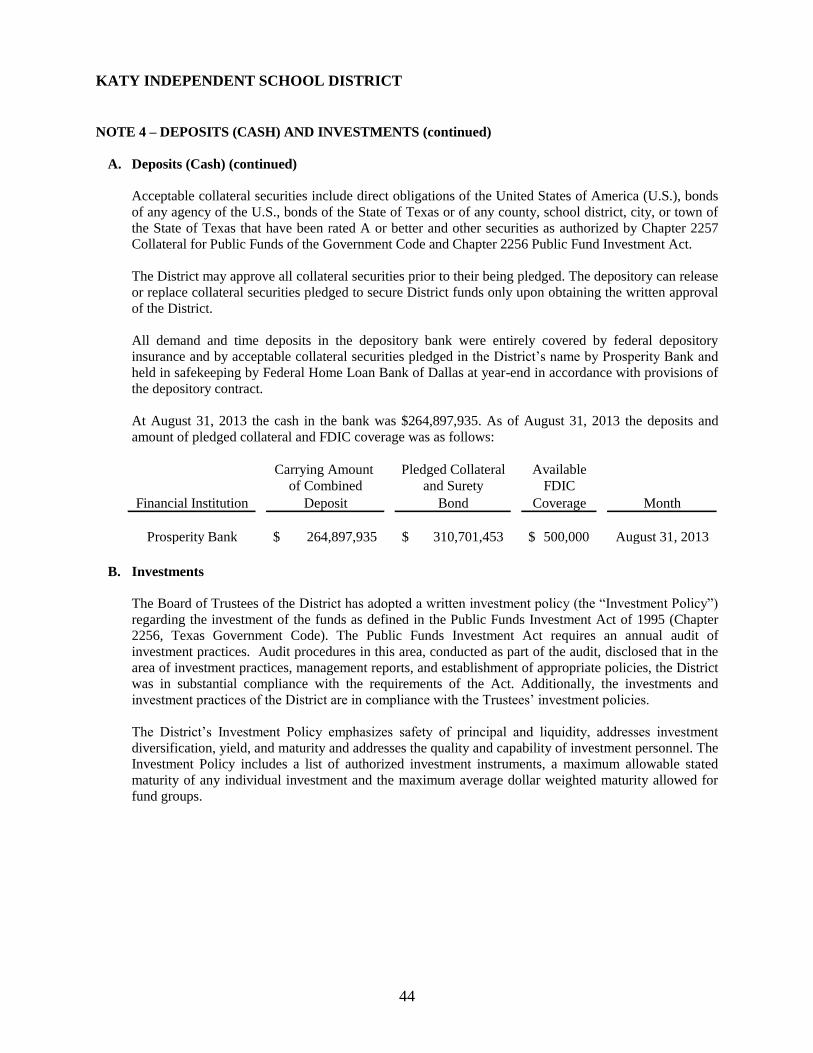
KATY INDEPENDENT SCHOOL DISTRICT
44
NOTE 4 – DEPOSITS (CASH) AND INVESTMENTS (continued)
A. Deposits (Cash) (continued)
Acceptable collateral securities include direct obligations of the United States of America (U.S.), bonds
of any agency of the U.S., bonds of the State of Texas or of any county, school district, city, or town of
the State of Texas that have been rated A or better and other securities as authorized by Chapter 2257
Collateral for Public Funds of the Government Code and Chapter 2256 Public Fund Investment Act.
The District may approve all collateral securities prior to their being pledged. The depository can release
or replace collateral securities pledged to secure District funds only upon obtaining the written approval
of the District.
All demand and time deposits in the depository bank were entirely covered by federal depository
insurance and by acceptable collateral securities pledged in the District’s name by Prosperity Bank and
held in safekeeping by Federal Home Loan Bank of Dallas at year-end in accordance with provisions of
the depository contract.
At August 31, 2013 the cash in the bank was $264,897,935. As of August 31, 2013 the deposits and
amount of pledged collateral and FDIC coverage was as follows:
Carrying Amount Pledged Collateral Available
of Combined and Surety FDIC
Financial Institution Deposit Bond Coverage Month
Prosperity Bank 264,897,935$ 310,701,453$ 500,000$ August 31, 2013
B. Investments
The Board of Trustees of the District has adopted a written investment policy (the “Investment Policy”)
regarding the investment of the funds as defined in the Public Funds Investment Act of 1995 (Chapter
2256, Texas Government Code). The Public Funds Investment Act requires an annual audit of
investment practices. Audit procedures in this area, conducted as part of the audit, disclosed that in the
area of investment practices, management reports, and establishment of appropriate policies, the District
was in substantial compliance with the requirements of the Act. Additionally, the investments and
investment practices of the District are in compliance with the Trustees’ investment policies.
The District’s Investment Policy emphasizes safety of principal and liquidity, addresses investment
diversification, yield, and maturity and addresses the quality and capability of investment personnel. The
Investment Policy includes a list of authorized investment instruments, a maximum allowable stated
maturity of any individual investment and the maximum average dollar weighted maturity allowed for
fund groups.
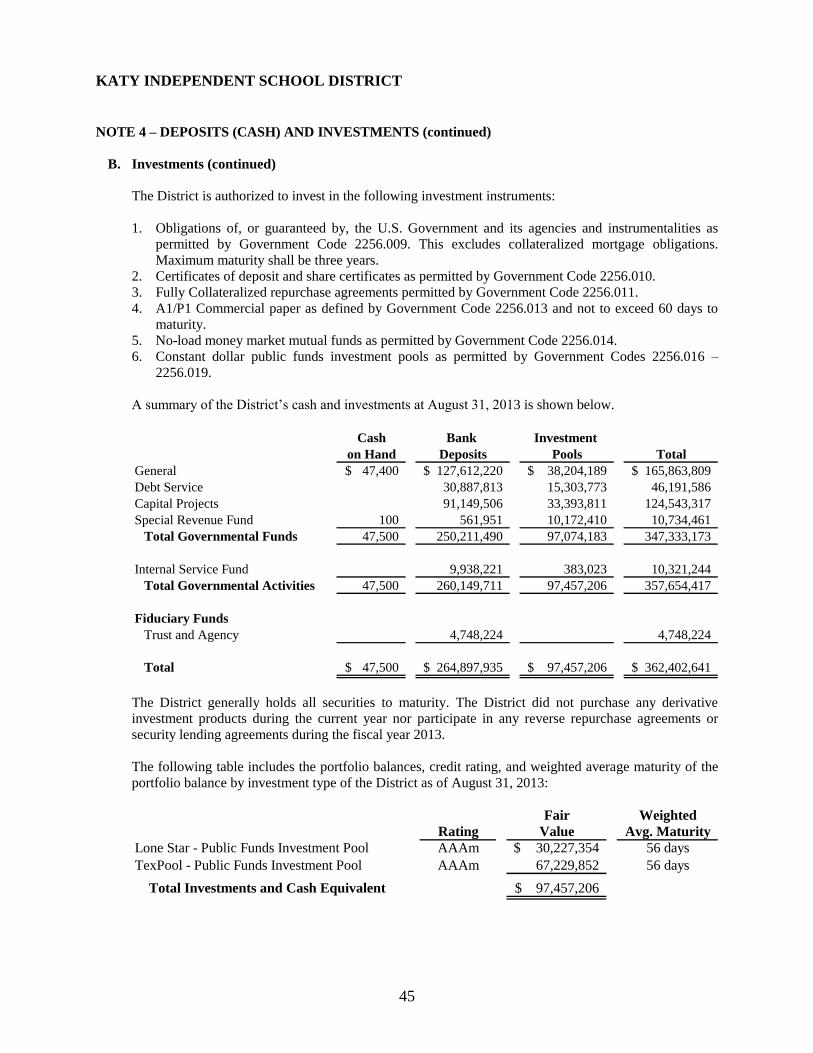
KATY INDEPENDENT SCHOOL DISTRICT
45
NOTE 4 – DEPOSITS (CASH) AND INVESTMENTS (continued)
B. Investments (continued)
The District is authorized to invest in the following investment instruments:
1. Obligations of, or guaranteed by, the U.S. Government and its agencies and instrumentalities as
permitted by Government Code 2256.009. This excludes collateralized mortgage obligations.
Maximum maturity shall be three years.
2. Certificates of deposit and share certificates as permitted by Government Code 2256.010.
3. Fully Collateralized repurchase agreements permitted by Government Code 2256.011.
4. A1/P1 Commercial paper as defined by Government Code 2256.013 and not to exceed 60 days to
maturity.
5. No-load money market mutual funds as permitted by Government Code 2256.014.
6. Constant dollar public funds investment pools as permitted by Government Codes 2256.016 –
2256.019.
A summary of the District’s cash and investments at August 31, 2013 is shown below.
Cash Bank Investment
on Hand Deposits Pools Total
General 47,400$ 127,612,220$ 38,204,189$ 165,863,809$
Debt Service 30,887,813 15,303,773 46,191,586
Capital Projects 91,149,506 33,393,811 124,543,317
Special Revenue Fund 100 561,951 10,172,410 10,734,461
Total Governmental Funds 47,500 250,211,490 97,074,183 347,333,173
Internal Service Fund 9,938,221 383,023 10,321,244
Total Governmental Activities 47,500 260,149,711 97,457,206 357,654,417
Fiduciary Funds
Trust and Agency 4,748,224 4,748,224
Total 47,500$ 264,897,935$ 97,457,206$ 362,402,641$
The District generally holds all securities to maturity. The District did not purchase any derivative
investment products during the current year nor participate in any reverse repurchase agreements or
security lending agreements during the fiscal year 2013.
The following table includes the portfolio balances, credit rating, and weighted average maturity of the
portfolio balance by investment type of the District as of August 31, 2013:
Fair Weighted
Rating Value Avg. Maturity
Lone Star - Public Funds Investment Pool AAAm 30,227,354$ 56 days
TexPool - Public Funds Investment Pool AAAm 67,229,852 56 days
Total Investments and Cash Equivalent 97,457,206$
KATY INDEPENDENT SCHOOL DISTRICT
46
NOTE 4 – DEPOSITS (CASH) AND INVESTMENTS (continued)
B. Investments (continued)
As of August 31, 2013, the District’s investments included TexPool and Lone Star Public Funds
Investment Pools. The investment pools investments are not evidenced by securities that exist in
physical or book entry form and, accordingly, do not have custodial risk.
Investment Pool policies require that local government deposits be used to purchase investments
authorized by the Public Funds Investment Act of 1987, as amended. Oversight responsibility for
TexPool is provided by The Texas State Comptroller of Public Accounts and for Lone Star by The
Texas Association of School Boards.
The value of District portions in TexPool and Lone Star are the same as the value of the Shares. These
external pooled funds operate in a manner consistent with the SEC’s Rule 2a7 of the Investment
Company Act of 1940. The external pooled funds are amortized cost rather than market value to report
net assets to compute share price, such funds have daily liquidity. Although TexPool and Lone Star have
weighted average maturities greater than one, the District considers its holdings in these funds to have a
one day weighted average maturity.
Credit Risk Related to Investments
Credit risk is the risk that another party to a deposit or investment transaction will not fulfill its
obligations. This is not to be confused with market risk, which is the risk that the market value of an
investment, collateral protecting a deposit, or securities underlying a repurchase agreement, will decline.
Market risk is not depicted in this note.
In compliance with GASB 40, local policy also addresses credit risk by monitoring investment
diversification through specific identification disclosure and weighted average maturity disclosure.
As of August 31, 2013, TexPool and Lone Star represented 18.6% and 8.3%, respectively, of the
General Fund, Debt Service Fund, Capital Projects Fund, Special Revenue Fund, Internal Service Fund
and Fiduciary Fund investments and are rated AAAm by Standard and Poor’s.
Interest Rate Risk
As a means of minimizing risk of loss due to interest rate fluctuations, the District’s Investment Policy
requires that investment maturities in the General Fund, Debt Service Fund, Capital Projects Fund, and
Special Revenue Fund will not exceed the lesser of a dollar weighted average maturity of 365 day or the
anticipated cash flow requirements of the fund. The District’s Investment Policy also limits that no
investment shall have a maturity greater than three years from the date of purchase.
As of August 31, 2013, 26.9% of the entire portfolio was invested in AAAm rated public investment
pools. The dollar weighted average maturity of the pools was 56.5 days, which is less than the threshold
of 180 days.
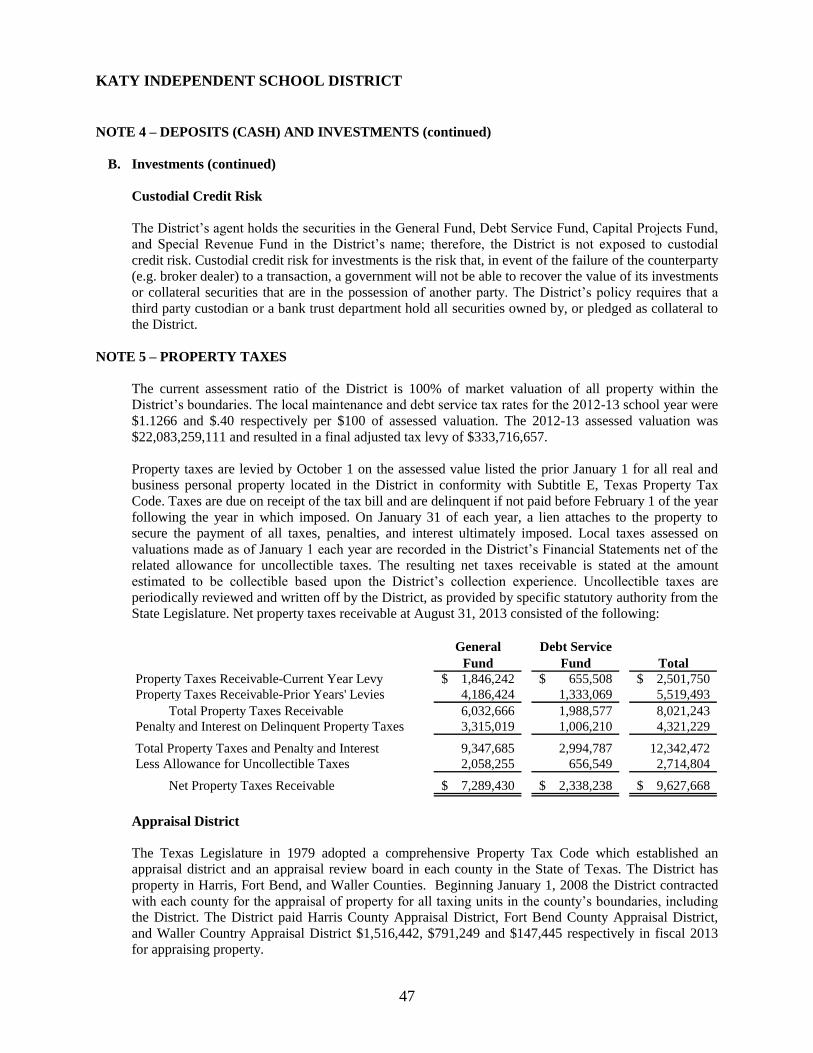
KATY INDEPENDENT SCHOOL DISTRICT
47
NOTE 4 – DEPOSITS (CASH) AND INVESTMENTS (continued)
B. Investments (continued)
Custodial Credit Risk
The District’s agent holds the securities in the General Fund, Debt Service Fund, Capital Projects Fund,
and Special Revenue Fund in the District’s name; therefore, the District is not exposed to custodial
credit risk. Custodial credit risk for investments is the risk that, in event of the failure of the counterparty
(e.g. broker dealer) to a transaction, a government will not be able to recover the value of its investments
or collateral securities that are in the possession of another party. The District’s policy requires that a
third party custodian or a bank trust department hold all securities owned by, or pledged as collateral to
the District.
NOTE 5 – PROPERTY TAXES
The current assessment ratio of the District is 100% of market valuation of all property within the
District’s boundaries. The local maintenance and debt service tax rates for the 2012-13 school year were
$1.1266 and $.40 respectively per $100 of assessed valuation. The 2012-13 assessed valuation was
$22,083,259,111 and resulted in a final adjusted tax levy of $333,716,657.
Property taxes are levied by October 1 on the assessed value listed the prior January 1 for all real and
business personal property located in the District in conformity with Subtitle E, Texas Property Tax
Code. Taxes are due on receipt of the tax bill and are delinquent if not paid before February 1 of the year
following the year in which imposed. On January 31 of each year, a lien attaches to the property to
secure the payment of all taxes, penalties, and interest ultimately imposed. Local taxes assessed on
valuations made as of January 1 each year are recorded in the District’s Financial Statements net of the
related allowance for uncollectible taxes. The resulting net taxes receivable is stated at the amount
estimated to be collectible based upon the District’s collection experience. Uncollectible taxes are
periodically reviewed and written off by the District, as provided by specific statutory authority from the
State Legislature. Net property taxes receivable at August 31, 2013 consisted of the following:
General Debt Service
Fund Fund Total
Property Taxes Receivable-Current Year Levy 1,846,242$ 655,508$ 2,501,750$
Property Taxes Receivable-Prior Years' Levies 4,186,424 1,333,069 5,519,493
Total Property Taxes Receivable 6,032,666 1,988,577 8,021,243
Penalty and Interest on Delinquent Property Taxes 3,315,019 1,006,210 4,321,229
Total Property Taxes and Penalty and Interest 9,347,685 2,994,787 12,342,472
Less Allowance for Uncollectible Taxes 2,058,255 656,549 2,714,804
Net Property Taxes Receivable 7,289,430$ 2,338,238$ 9,627,668$
Appraisal District
The Texas Legislature in 1979 adopted a comprehensive Property Tax Code which established an
appraisal district and an appraisal review board in each county in the State of Texas. The District has
property in Harris, Fort Bend, and Waller Counties. Beginning January 1, 2008 the District contracted
with each county for the appraisal of property for all taxing units in the county’s boundaries, including the District. The District paid Harris County Appraisal District, Fort Bend County Appraisal District,
and Waller Country Appraisal District $1,516,442, $791,249 and $147,445 respectively in fiscal 2013
for appraising property.
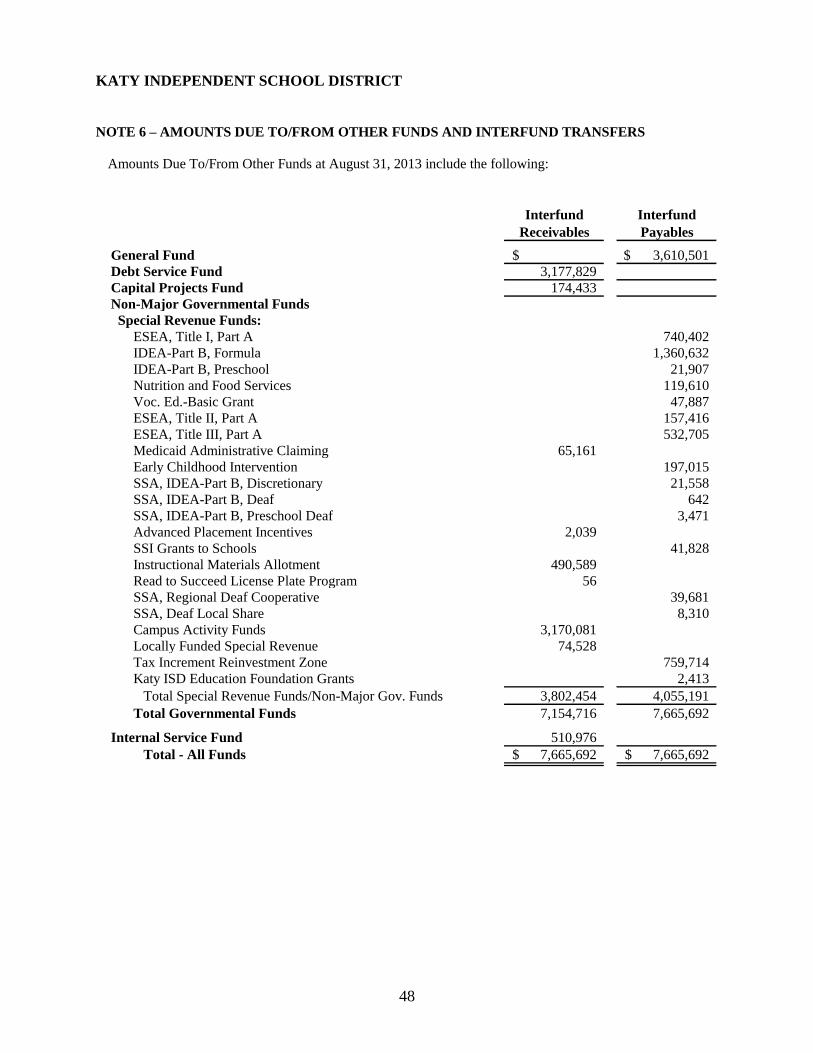
KATY INDEPENDENT SCHOOL DISTRICT
48
NOTE 6 – AMOUNTS DUE TO/FROM OTHER FUNDS AND INTERFUND TRANSFERS
Amounts Due To/From Other Funds at August 31, 2013 include the following:
Interfund Interfund
Receivables Payables
General Fund $ 3,610,501$
Debt Service Fund 3,177,829
Capital Projects Fund 174,433
Non-Major Governmental Funds
Special Revenue Funds:
ESEA, Title I, Part A 740,402
IDEA-Part B, Formula 1,360,632
IDEA-Part B, Preschool 21,907
Nutrition and Food Services 119,610
Voc. Ed.-Basic Grant 47,887
ESEA, Title II, Part A 157,416
ESEA, Title III, Part A 532,705
Medicaid Administrative Claiming 65,161
Early Childhood Intervention 197,015
SSA, IDEA-Part B, Discretionary 21,558
SSA, IDEA-Part B, Deaf 642
SSA, IDEA-Part B, Preschool Deaf 3,471
Advanced Placement Incentives 2,039
SSI Grants to Schools 41,828
Instructional Materials Allotment 490,589
Read to Succeed License Plate Program 56
SSA, Regional Deaf Cooperative 39,681
SSA, Deaf Local Share 8,310
Campus Activity Funds 3,170,081
Locally Funded Special Revenue 74,528
Tax Increment Reinvestment Zone 759,714
Katy ISD Education Foundation Grants 2,413
Total Special Revenue Funds/Non-Major Gov. Funds 3,802,454 4,055,191
Total Governmental Funds 7,154,716 7,665,692
Internal Service Fund 510,976
Total - All Funds 7,665,692$ 7,665,692$
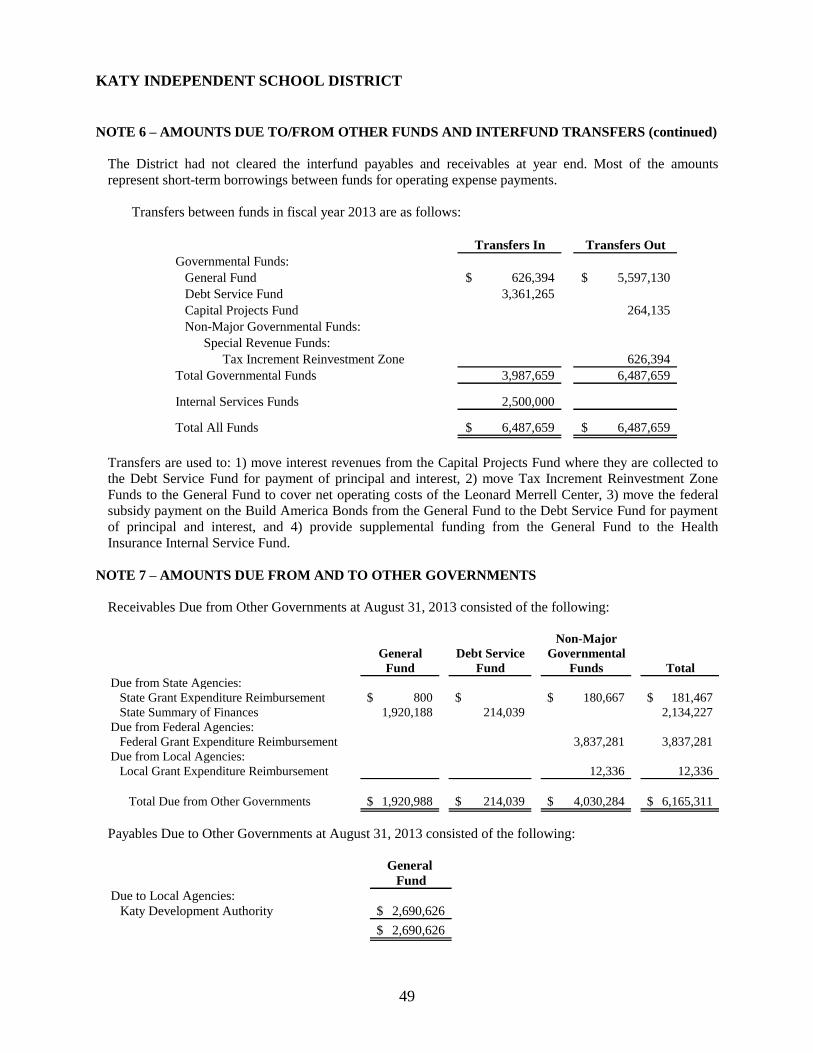
KATY INDEPENDENT SCHOOL DISTRICT
49
NOTE 6 – AMOUNTS DUE TO/FROM OTHER FUNDS AND INTERFUND TRANSFERS (continued)
The District had not cleared the interfund payables and receivables at year end. Most of the amounts
represent short-term borrowings between funds for operating expense payments.
Transfers between funds in fiscal year 2013 are as follows:
Transfers In Transfers Out
Governmental Funds:
General Fund 626,394$ 5,597,130$
Debt Service Fund 3,361,265
Capital Projects Fund 264,135
Non-Major Governmental Funds:
Special Revenue Funds:
Tax Increment Reinvestment Zone 626,394
Total Governmental Funds 3,987,659 6,487,659
Internal Services Funds 2,500,000
Total All Funds 6,487,659$ 6,487,659$
Transfers are used to: 1) move interest revenues from the Capital Projects Fund where they are collected to
the Debt Service Fund for payment of principal and interest, 2) move Tax Increment Reinvestment Zone
Funds to the General Fund to cover net operating costs of the Leonard Merrell Center, 3) move the federal
subsidy payment on the Build America Bonds from the General Fund to the Debt Service Fund for payment
of principal and interest, and 4) provide supplemental funding from the General Fund to the Health
Insurance Internal Service Fund.
NOTE 7 – AMOUNTS DUE FROM AND TO OTHER GOVERNMENTS
Receivables Due from Other Governments at August 31, 2013 consisted of the following:
Non-Major
General Debt Service Governmental
Fund Fund Funds Total
Due from State Agencies:
State Grant Expenditure Reimbursement 800$ $ 180,667$ 181,467$
State Summary of Finances 1,920,188 214,039 2,134,227
Due from Federal Agencies:
Federal Grant Expenditure Reimbursement 3,837,281 3,837,281
Due from Local Agencies:
Local Grant Expenditure Reimbursement 12,336 12,336
Total Due from Other Governments 1,920,988$ 214,039$ 4,030,284$ 6,165,311$
Payables Due to Other Governments at August 31, 2013 consisted of the following:
General
Fund
Due to Local Agencies:
Katy Development Authority 2,690,626$
2,690,626$
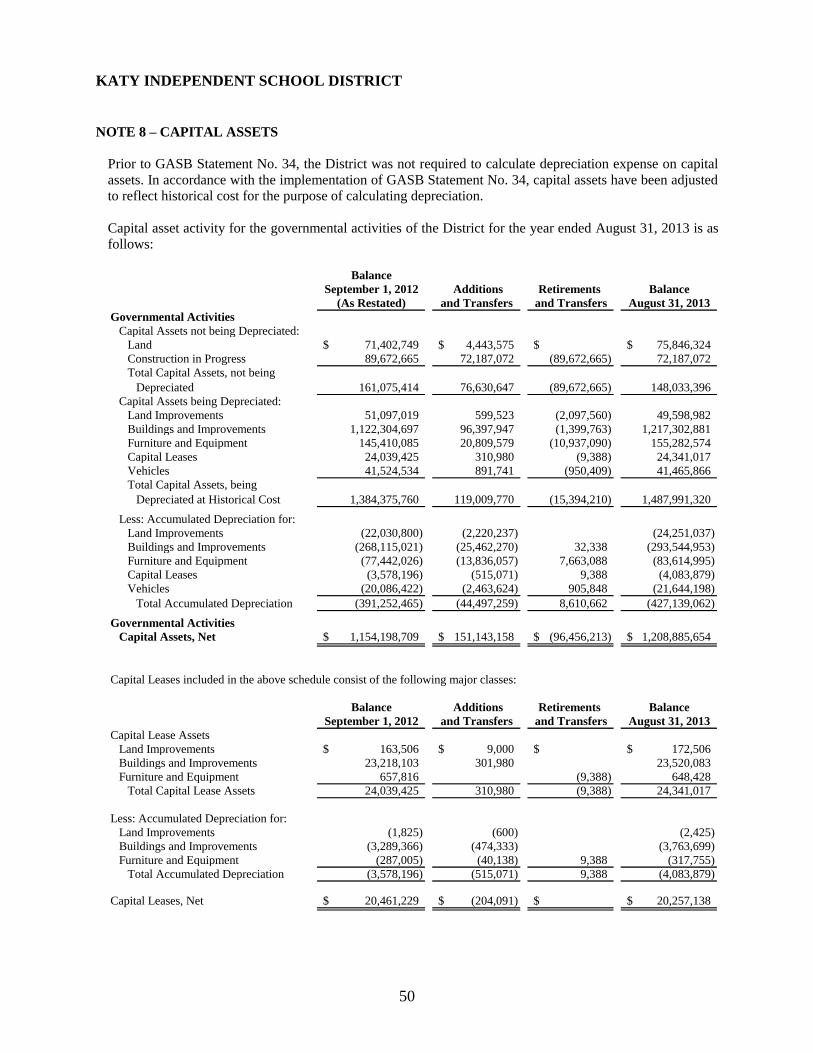
KATY INDEPENDENT SCHOOL DISTRICT
50
NOTE 8 – CAPITAL ASSETS
Prior to GASB Statement No. 34, the District was not required to calculate depreciation expense on capital
assets. In accordance with the implementation of GASB Statement No. 34, capital assets have been adjusted
to reflect historical cost for the purpose of calculating depreciation.
Capital asset activity for the governmental activities of the District for the year ended August 31, 2013 is as
follows:
Balance
September 1, 2012 Additions Retirements Balance
(As Restated) and Transfers and Transfers August 31, 2013
Governmental Activities
Capital Assets not being Depreciated:
Land 71,402,749$ 4,443,575$ $ 75,846,324$
Construction in Progress 89,672,665 72,187,072 (89,672,665) 72,187,072
Total Capital Assets, not being
Depreciated 161,075,414 76,630,647 (89,672,665) 148,033,396
Capital Assets being Depreciated:
Land Improvements 51,097,019 599,523 (2,097,560) 49,598,982
Buildings and Improvements 1,122,304,697 96,397,947 (1,399,763) 1,217,302,881
Furniture and Equipment 145,410,085 20,809,579 (10,937,090) 155,282,574
Capital Leases 24,039,425 310,980 (9,388) 24,341,017
Vehicles 41,524,534 891,741 (950,409) 41,465,866
Total Capital Assets, being
Depreciated at Historical Cost 1,384,375,760 119,009,770 (15,394,210) 1,487,991,320
Less: Accumulated Depreciation for:
Land Improvements (22,030,800) (2,220,237) (24,251,037)
Buildings and Improvements (268,115,021) (25,462,270) 32,338 (293,544,953)
Furniture and Equipment (77,442,026) (13,836,057) 7,663,088 (83,614,995)
Capital Leases (3,578,196) (515,071) 9,388 (4,083,879)
Vehicles (20,086,422) (2,463,624) 905,848 (21,644,198)
Total Accumulated Depreciation (391,252,465) (44,497,259) 8,610,662 (427,139,062)
Governmental Activities
Capital Assets, Net 1,154,198,709$ 151,143,158$ (96,456,213)$ 1,208,885,654$
Capital Leases included in the above schedule consist of the following major classes:
Balance Additions Retirements Balance
September 1, 2012 and Transfers and Transfers August 31, 2013
Capital Lease Assets
Land Improvements 163,506$ 9,000$ $ 172,506$
Buildings and Improvements 23,218,103 301,980 23,520,083
Furniture and Equipment 657,816 (9,388) 648,428
Total Capital Lease Assets 24,039,425 310,980 (9,388) 24,341,017
Less: Accumulated Depreciation for:
Land Improvements (1,825) (600) (2,425)
Buildings and Improvements (3,289,366) (474,333) (3,763,699)
Furniture and Equipment (287,005) (40,138) 9,388 (317,755)
Total Accumulated Depreciation (3,578,196) (515,071) 9,388 (4,083,879)
Capital Leases, Net 20,461,229$ (204,091)$ $ 20,257,138$
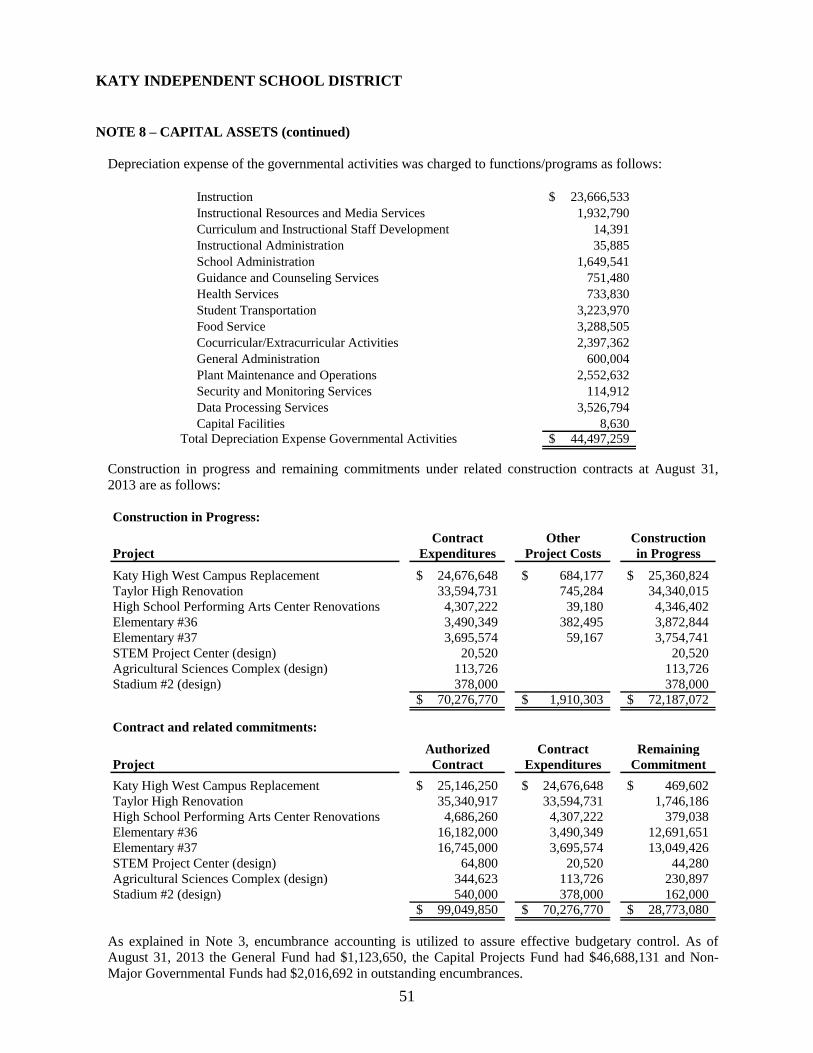
KATY INDEPENDENT SCHOOL DISTRICT
51
NOTE 8 – CAPITAL ASSETS (continued)
Depreciation expense of the governmental activities was charged to functions/programs as follows:
Instruction 23,666,533$
Instructional Resources and Media Services 1,932,790
Curriculum and Instructional Staff Development 14,391
Instructional Administration 35,885
School Administration 1,649,541
Guidance and Counseling Services 751,480
Health Services 733,830
Student Transportation 3,223,970
Food Service 3,288,505
Cocurricular/Extracurricular Activities 2,397,362
General Administration 600,004
Plant Maintenance and Operations 2,552,632
Security and Monitoring Services 114,912
Data Processing Services 3,526,794
Capital Facilities 8,630
Total Depreciation Expense Governmental Activities 44,497,259$
Construction in progress and remaining commitments under related construction contracts at August 31,
2013 are as follows:
Construction in Progress:
Contract Other Construction
Project Expenditures Project Costs in Progress
Katy High West Campus Replacement 24,676,648$ 684,177$ 25,360,824$
Taylor High Renovation 33,594,731 745,284 34,340,015
High School Performing Arts Center Renovations 4,307,222 39,180 4,346,402
Elementary #36 3,490,349 382,495 3,872,844
Elementary #37 3,695,574 59,167 3,754,741
STEM Project Center (design) 20,520 20,520
Agricultural Sciences Complex (design) 113,726 113,726
Stadium #2 (design) 378,000 378,000
70,276,770$ 1,910,303$ 72,187,072$
Contract and related commitments:
Authorized Contract Remaining
Project Contract Expenditures Commitment
Katy High West Campus Replacement 25,146,250$ 24,676,648$ 469,602$
Taylor High Renovation 35,340,917 33,594,731 1,746,186
High School Performing Arts Center Renovations 4,686,260 4,307,222 379,038
Elementary #36 16,182,000 3,490,349 12,691,651
Elementary #37 16,745,000 3,695,574 13,049,426
STEM Project Center (design) 64,800 20,520 44,280
Agricultural Sciences Complex (design) 344,623 113,726 230,897
Stadium #2 (design) 540,000 378,000 162,000
99,049,850$ 70,276,770$ 28,773,080$
As explained in Note 3, encumbrance accounting is utilized to assure effective budgetary control. As of
August 31, 2013 the General Fund had $1,123,650, the Capital Projects Fund had $46,688,131 and Non-
Major Governmental Funds had $2,016,692 in outstanding encumbrances.
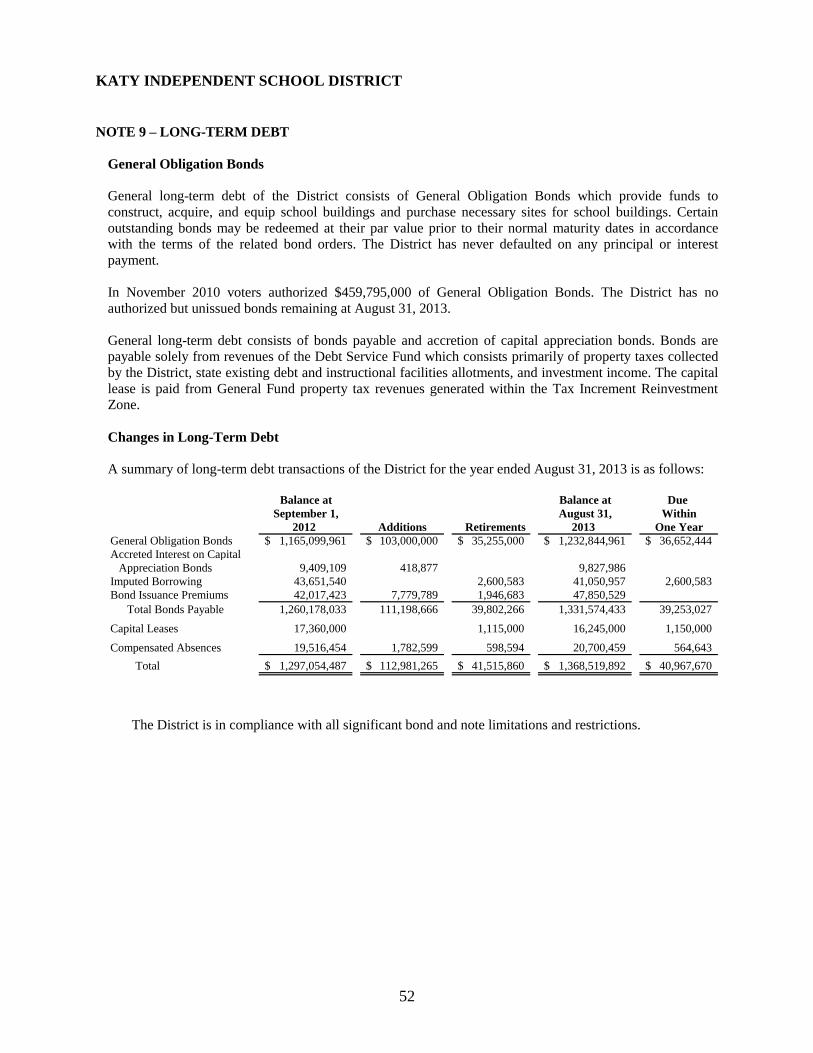
KATY INDEPENDENT SCHOOL DISTRICT
52
NOTE 9 – LONG-TERM DEBT
General Obligation Bonds
General long-term debt of the District consists of General Obligation Bonds which provide funds to
construct, acquire, and equip school buildings and purchase necessary sites for school buildings. Certain
outstanding bonds may be redeemed at their par value prior to their normal maturity dates in accordance
with the terms of the related bond orders. The District has never defaulted on any principal or interest
payment.
In November 2010 voters authorized $459,795,000 of General Obligation Bonds. The District has no
authorized but unissued bonds remaining at August 31, 2013.
General long-term debt consists of bonds payable and accretion of capital appreciation bonds. Bonds are
payable solely from revenues of the Debt Service Fund which consists primarily of property taxes collected
by the District, state existing debt and instructional facilities allotments, and investment income. The capital
lease is paid from General Fund property tax revenues generated within the Tax Increment Reinvestment
Zone.
Changes in Long-Term Debt
A summary of long-term debt transactions of the District for the year ended August 31, 2013 is as follows:
Balance at Balance at Due
September 1, August 31, Within
2012 Additions Retirements 2013 One Year
General Obligation Bonds 1,165,099,961$ 103,000,000$ 35,255,000$ 1,232,844,961$ 36,652,444$
Accreted Interest on Capital
Appreciation Bonds 9,409,109 418,877 9,827,986
Imputed Borrowing 43,651,540 2,600,583 41,050,957 2,600,583
Bond Issuance Premiums 42,017,423 7,779,789 1,946,683 47,850,529
Total Bonds Payable 1,260,178,033 111,198,666 39,802,266 1,331,574,433 39,253,027
Capital Leases 17,360,000 1,115,000 16,245,000 1,150,000
Compensated Absences 19,516,454 1,782,599 598,594 20,700,459 564,643
Total 1,297,054,487$ 112,981,265$ 41,515,860$ 1,368,519,892$ 40,967,670$
The District is in compliance with all significant bond and note limitations and restrictions.
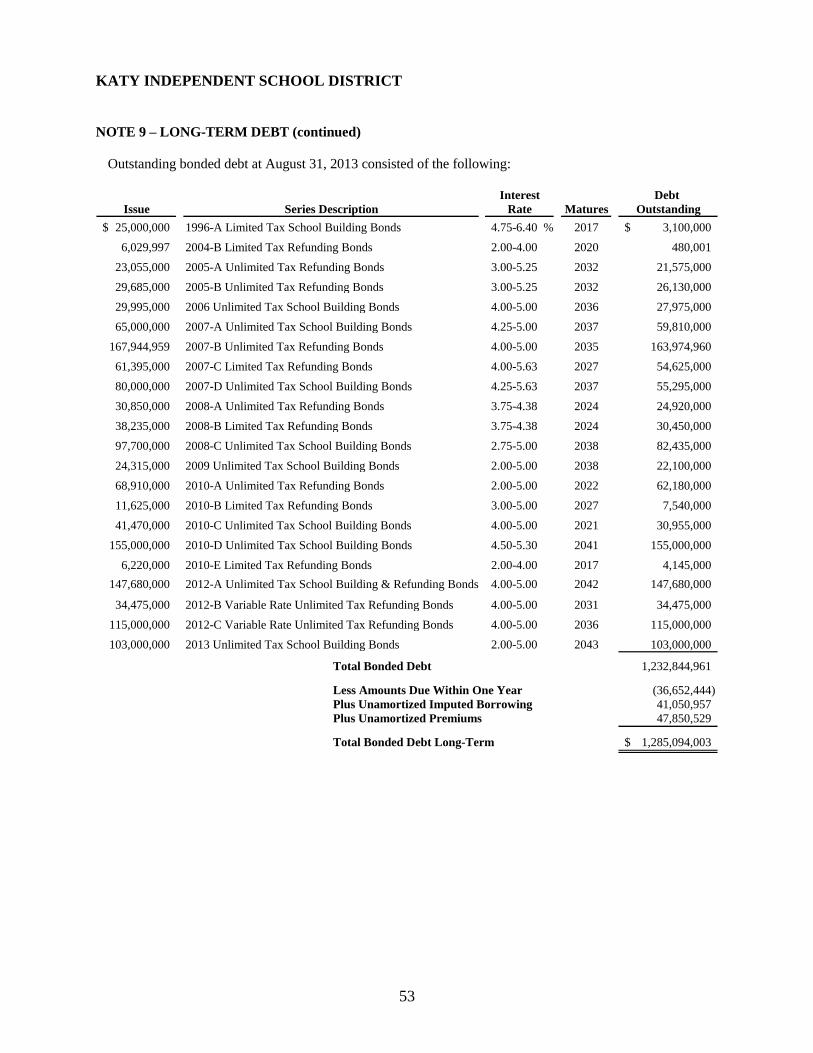
KATY INDEPENDENT SCHOOL DISTRICT
53
NOTE 9 – LONG-TERM DEBT (continued)
Outstanding bonded debt at August 31, 2013 consisted of the following:
Debt
Issue Series Description Matures Outstanding
25,000,000$ 1996-A Limited Tax School Building Bonds 4.75-6.40 % 2017 3,100,000$
6,029,997 2004-B Limited Tax Refunding Bonds 2.00-4.00 2020 480,001
23,055,000 2005-A Unlimited Tax Refunding Bonds 3.00-5.25 2032 21,575,000
29,685,000 2005-B Unlimited Tax Refunding Bonds 3.00-5.25 2032 26,130,000
29,995,000 2006 Unlimited Tax School Building Bonds 4.00-5.00 2036 27,975,000
65,000,000 2007-A Unlimited Tax School Building Bonds 4.25-5.00 2037 59,810,000
167,944,959 2007-B Unlimited Tax Refunding Bonds 4.00-5.00 2035 163,974,960
61,395,000 2007-C Limited Tax Refunding Bonds 4.00-5.63 2027 54,625,000
80,000,000 2007-D Unlimited Tax School Building Bonds 4.25-5.63 2037 55,295,000
30,850,000 2008-A Unlimited Tax Refunding Bonds 3.75-4.38 2024 24,920,000
38,235,000 2008-B Limited Tax Refunding Bonds 3.75-4.38 2024 30,450,000
97,700,000 2008-C Unlimited Tax School Building Bonds 2.75-5.00 2038 82,435,000
24,315,000 2009 Unlimited Tax School Building Bonds 2.00-5.00 2038 22,100,000
68,910,000 2010-A Unlimited Tax Refunding Bonds 2.00-5.00 2022 62,180,000
11,625,000 2010-B Limited Tax Refunding Bonds 3.00-5.00 2027 7,540,000
41,470,000 2010-C Unlimited Tax School Building Bonds 4.00-5.00 2021 30,955,000
155,000,000 2010-D Unlimited Tax School Building Bonds 4.50-5.30 2041 155,000,000
6,220,000 2010-E Limited Tax Refunding Bonds 2.00-4.00 2017 4,145,000
147,680,000 4.00-5.00 2042 147,680,000
34,475,000 2012-B Variable Rate Unlimited Tax Refunding Bonds 4.00-5.00 2031 34,475,000
115,000,000 2012-C Variable Rate Unlimited Tax Refunding Bonds 4.00-5.00 2036 115,000,000
103,000,000 2013 Unlimited Tax School Building Bonds 2.00-5.00 2043 103,000,000
1,232,844,961
(36,652,444)
41,050,957
47,850,529
1,285,094,003$
Interest
Rate
Total Bonded Debt Long-Term
2012-A Unlimited Tax School Building & Refunding Bonds
Total Bonded Debt
Less Amounts Due Within One Year
Plus Unamortized Imputed Borrowing
Plus Unamortized Premiums
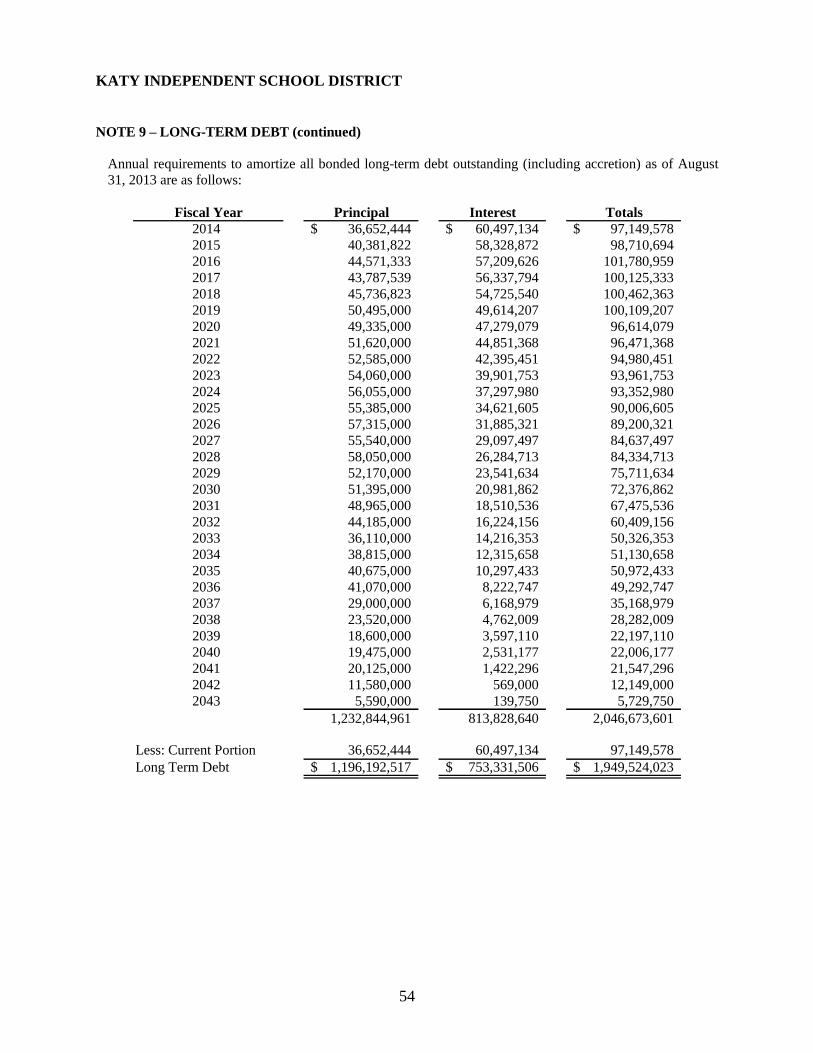
KATY INDEPENDENT SCHOOL DISTRICT
54
NOTE 9 – LONG-TERM DEBT (continued)
Annual requirements to amortize all bonded long-term debt outstanding (including accretion) as of August
31, 2013 are as follows:
Fiscal Year Principal Interest Totals
2014 36,652,444$ 60,497,134$ 97,149,578$
2015 40,381,822 58,328,872 98,710,694
2016 44,571,333 57,209,626 101,780,959
2017 43,787,539 56,337,794 100,125,333
2018 45,736,823 54,725,540 100,462,363
2019 50,495,000 49,614,207 100,109,207
2020 49,335,000 47,279,079 96,614,079
2021 51,620,000 44,851,368 96,471,368
2022 52,585,000 42,395,451 94,980,451
2023 54,060,000 39,901,753 93,961,753
2024 56,055,000 37,297,980 93,352,980
2025 55,385,000 34,621,605 90,006,605
2026 57,315,000 31,885,321 89,200,321
2027 55,540,000 29,097,497 84,637,497
2028 58,050,000 26,284,713 84,334,713
2029 52,170,000 23,541,634 75,711,634
2030 51,395,000 20,981,862 72,376,862
2031 48,965,000 18,510,536 67,475,536
2032 44,185,000 16,224,156 60,409,156
2033 36,110,000 14,216,353 50,326,353
2034 38,815,000 12,315,658 51,130,658
2035 40,675,000 10,297,433 50,972,433
2036 41,070,000 8,222,747 49,292,747
2037 29,000,000 6,168,979 35,168,979
2038 23,520,000 4,762,009 28,282,009
2039 18,600,000 3,597,110 22,197,110
2040 19,475,000 2,531,177 22,006,177
2041 20,125,000 1,422,296 21,547,296
2042 11,580,000 569,000 12,149,000
2043 5,590,000 139,750 5,729,750
1,232,844,961 813,828,640 2,046,673,601
36,652,444 60,497,134 97,149,578
Long Term Debt 1,196,192,517$ 753,331,506$ 1,949,524,023$
Less: Current Portion
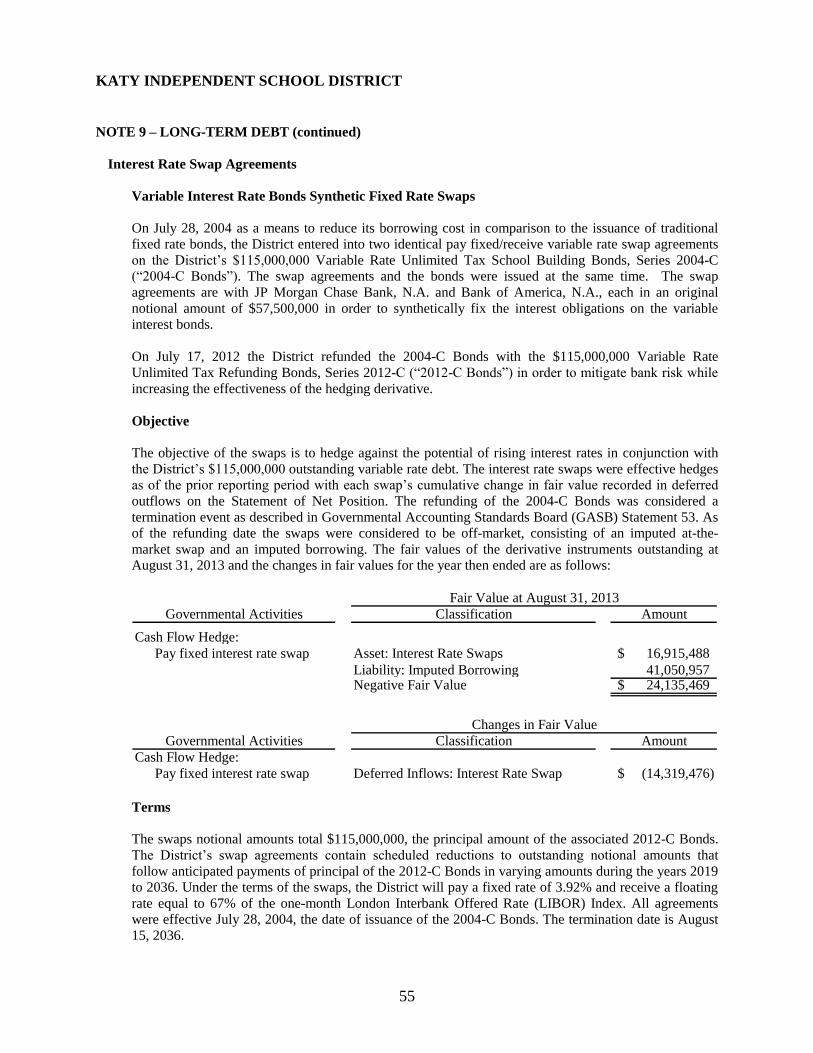
KATY INDEPENDENT SCHOOL DISTRICT
55
NOTE 9 – LONG-TERM DEBT (continued)
Interest Rate Swap Agreements
Variable Interest Rate Bonds Synthetic Fixed Rate Swaps
On July 28, 2004 as a means to reduce its borrowing cost in comparison to the issuance of traditional
fixed rate bonds, the District entered into two identical pay fixed/receive variable rate swap agreements
on the District’s $115,000,000 Variable Rate Unlimited Tax School Building Bonds, Series 2004-C
(“2004-C Bonds”). The swap agreements and the bonds were issued at the same time. The swap
agreements are with JP Morgan Chase Bank, N.A. and Bank of America, N.A., each in an original
notional amount of $57,500,000 in order to synthetically fix the interest obligations on the variable
interest bonds.
On July 17, 2012 the District refunded the 2004-C Bonds with the $115,000,000 Variable Rate
Unlimited Tax Refunding Bonds, Series 2012-C (“2012-C Bonds”) in order to mitigate bank risk while
increasing the effectiveness of the hedging derivative.
Objective
The objective of the swaps is to hedge against the potential of rising interest rates in conjunction with
the District’s $115,000,000 outstanding variable rate debt. The interest rate swaps were effective hedges
as of the prior reporting period with each swap’s cumulative change in fair value recorded in deferred
outflows on the Statement of Net Position. The refunding of the 2004-C Bonds was considered a
termination event as described in Governmental Accounting Standards Board (GASB) Statement 53. As
of the refunding date the swaps were considered to be off-market, consisting of an imputed at-the-
market swap and an imputed borrowing. The fair values of the derivative instruments outstanding at
August 31, 2013 and the changes in fair values for the year then ended are as follows:
Fair Value at August 31, 2013
Governmental Activities Classification Amount
Cash Flow Hedge:
Pay fixed interest rate swap Asset: Interest Rate Swaps 16,915,488$
Liability: Imputed Borrowing 41,050,957 Negative Fair Value 24,135,469$
Changes in Fair Value
Governmental Activities Classification Amount
Cash Flow Hedge:
Pay fixed interest rate swap Deferred Inflows: Interest Rate Swap (14,319,476)$
Terms
The swaps notional amounts total $115,000,000, the principal amount of the associated 2012-C Bonds.
The District’s swap agreements contain scheduled reductions to outstanding notional amounts that
follow anticipated payments of principal of the 2012-C Bonds in varying amounts during the years 2019
to 2036. Under the terms of the swaps, the District will pay a fixed rate of 3.92% and receive a floating
rate equal to 67% of the one-month London Interbank Offered Rate (LIBOR) Index. All agreements were effective July 28, 2004, the date of issuance of the 2004-C Bonds. The termination date is August
15, 2036.
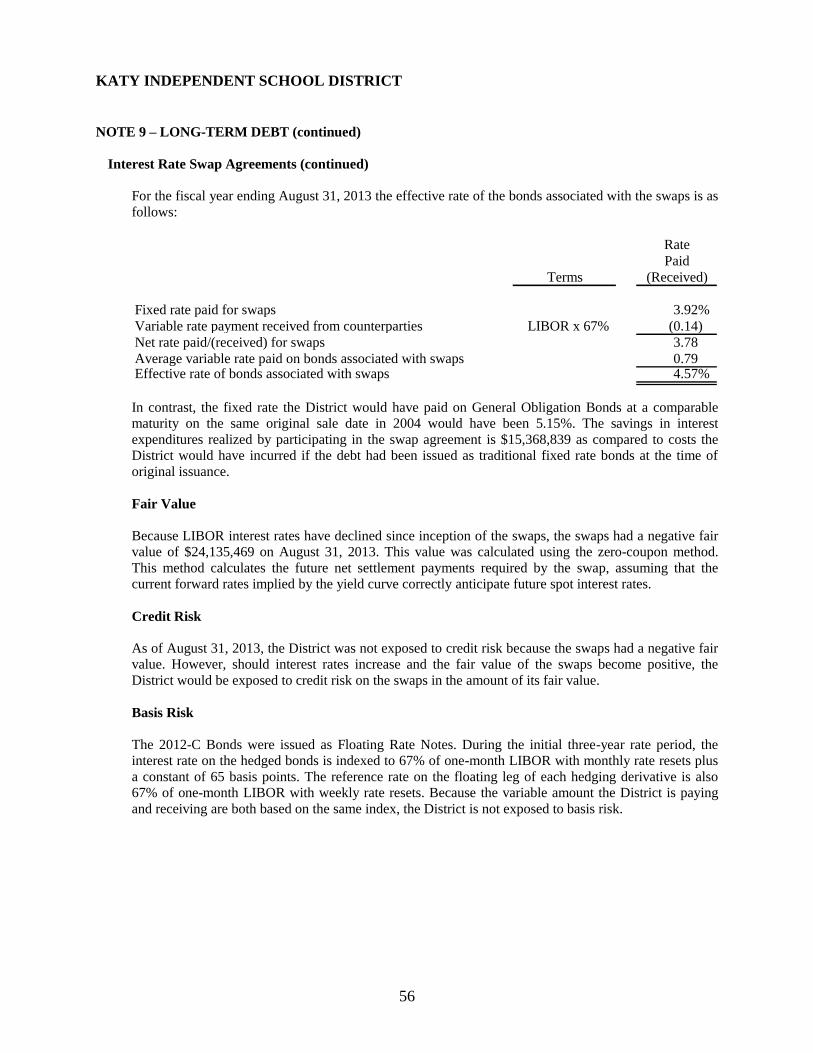
KATY INDEPENDENT SCHOOL DISTRICT
56
NOTE 9 – LONG-TERM DEBT (continued)
Interest Rate Swap Agreements (continued)
For the fiscal year ending August 31, 2013 the effective rate of the bonds associated with the swaps is as
follows:
Rate
Paid
Terms (Received)
Fixed rate paid for swaps 3.92%
Variable rate payment received from counterparties LIBOR x 67% (0.14)
Net rate paid/(received) for swaps 3.78
Average variable rate paid on bonds associated with swaps 0.79Effective rate of bonds associated with swaps 4.57%
In contrast, the fixed rate the District would have paid on General Obligation Bonds at a comparable
maturity on the same original sale date in 2004 would have been 5.15%. The savings in interest
expenditures realized by participating in the swap agreement is $15,368,839 as compared to costs the
District would have incurred if the debt had been issued as traditional fixed rate bonds at the time of
original issuance.
Fair Value
Because LIBOR interest rates have declined since inception of the swaps, the swaps had a negative fair
value of $24,135,469 on August 31, 2013. This value was calculated using the zero-coupon method.
This method calculates the future net settlement payments required by the swap, assuming that the
current forward rates implied by the yield curve correctly anticipate future spot interest rates.
Credit Risk
As of August 31, 2013, the District was not exposed to credit risk because the swaps had a negative fair
value. However, should interest rates increase and the fair value of the swaps become positive, the
District would be exposed to credit risk on the swaps in the amount of its fair value.
Basis Risk
The 2012-C Bonds were issued as Floating Rate Notes. During the initial three-year rate period, the
interest rate on the hedged bonds is indexed to 67% of one-month LIBOR with monthly rate resets plus
a constant of 65 basis points. The reference rate on the floating leg of each hedging derivative is also
67% of one-month LIBOR with weekly rate resets. Because the variable amount the District is paying
and receiving are both based on the same index, the District is not exposed to basis risk.
KATY INDEPENDENT SCHOOL DISTRICT
57
NOTE 9 – LONG-TERM DEBT (continued)
Interest Rate Swap Agreements (continued)
Interest Rate Risk
Interest payments on the hedged variable-rate debt are expected to increase (decrease) as LIBOR rates
increase (decrease). Because the variable amount the District is paying and receiving are both based on
67% of one-month LIBOR, the District’s exposure to interest rate risk is mitigated.
Termination Risk
The District has the unilateral right to voluntarily terminate the swap agreements at any time over their
term at the then prevailing market value. A counterparty may only terminate a swap if the District fails
to perform under the terms of the contract. The District’s options are to terminate with the swap
providers at an agreed market value, assign the Swap to a third party based on bids or quotes, or enter
into an off-setting swap transaction. If the swap should be terminated, the associated variable-rate bonds
would no longer carry synthetic fixed interest rates. Also, if at the time of the termination the swap has a
negative fair value, the District would be liable to the counterparty for a payment equal to the swap’s
fair value. The negative fair value of the swap agreements does not expose the District to a loss because
it is unlikely the District would exercise its termination rights when the fair value is negative. However,
should interest rates change and the fair value of the swap agreements become positive, the District
would receive payment of the fair value if the agreements were terminated.
The swap agreements are subject to termination in the event of default or if the ratings assigned to either
the District’s or the counterparty’s unenhanced long-term debt obligations are withdrawn or reduced to
BBB- by S&P or Baa3 by Moody’s. At August 31, 2013, the credit rating assigned to JP Morgan Chase
Bank, N.A. is A+ by S&P and Aa3 by Moody’s, while the credit rating assigned to Bank of America,
N.A. is A by S&P and A3 by Moody’s.
Remarketing and Rollover Risk
The 2012-C Bonds will bear interest initially at the rate of 67% of one-month LIBOR plus 65 basis
points from July 17, 2012 through and including August 14, 2015. The bonds do not require a liquidity
agent or a remarketing agent for that time period and therefore the District is not exposed to remarketing
risk during the initial rate period.
Thereafter, the bonds will bear interest at a LIBOR rate determined by a remarketing agent to be
selected by the District before the end of the initial rate period. In the event the remarketing agent at the
conversion date cannot remarket the bonds, the District does not have any obligation to purchase the
bonds at that time. In this event, the bonds that have been unsuccessfully remarketed will bear interest at
a rate of eight percent.
The District’s 2012-C Bonds and swaps have matching notional maturity dates of August 15, 2036;
therefore, the District is not exposed to rollover risk at this time.
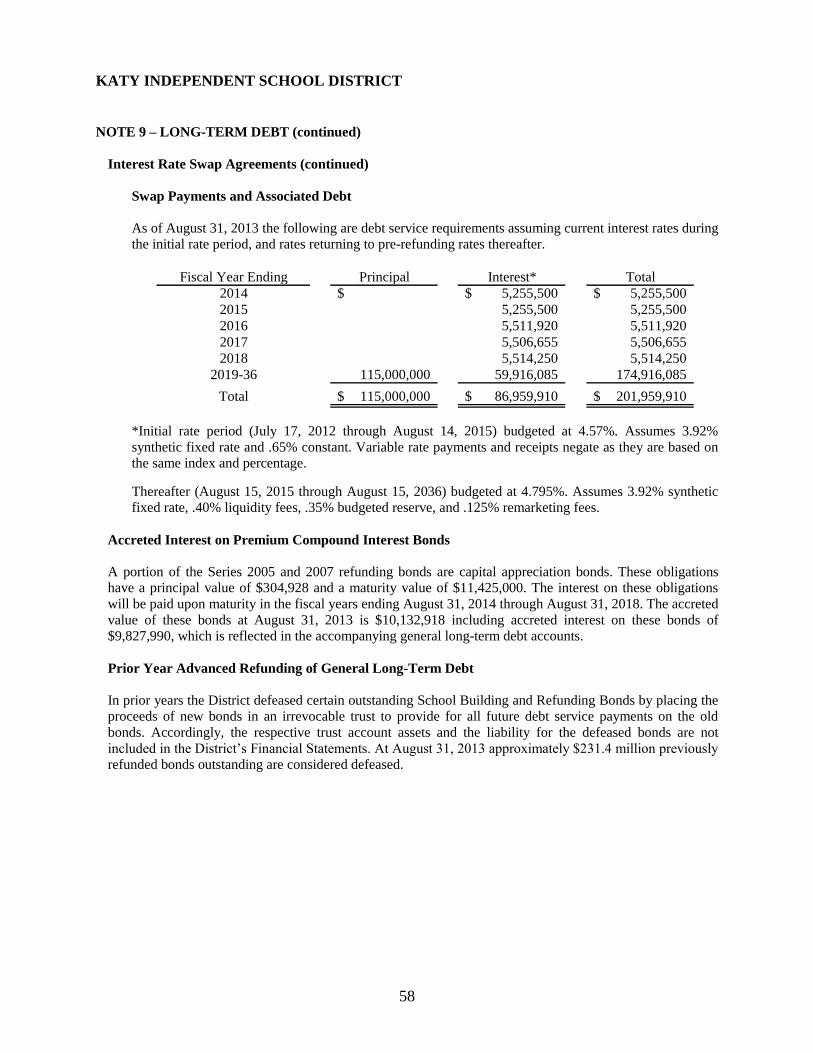
KATY INDEPENDENT SCHOOL DISTRICT
58
NOTE 9 – LONG-TERM DEBT (continued)
Interest Rate Swap Agreements (continued)
Swap Payments and Associated Debt
As of August 31, 2013 the following are debt service requirements assuming current interest rates during
the initial rate period, and rates returning to pre-refunding rates thereafter.
Fiscal Year Ending Principal Interest* Total
2014 $ 5,255,500$ 5,255,500$
2015 5,255,500 5,255,500
2016 5,511,920 5,511,920
2017 5,506,655 5,506,655
2018 5,514,250 5,514,250
2019-36 115,000,000 59,916,085 174,916,085
Total 115,000,000$ 86,959,910$ 201,959,910$
*Initial rate period (July 17, 2012 through August 14, 2015) budgeted at 4.57%. Assumes 3.92%
synthetic fixed rate and .65% constant. Variable rate payments and receipts negate as they are based on
the same index and percentage.
Thereafter (August 15, 2015 through August 15, 2036) budgeted at 4.795%. Assumes 3.92% synthetic
fixed rate, .40% liquidity fees, .35% budgeted reserve, and .125% remarketing fees.
Accreted Interest on Premium Compound Interest Bonds
A portion of the Series 2005 and 2007 refunding bonds are capital appreciation bonds. These obligations
have a principal value of $304,928 and a maturity value of $11,425,000. The interest on these obligations
will be paid upon maturity in the fiscal years ending August 31, 2014 through August 31, 2018. The accreted
value of these bonds at August 31, 2013 is $10,132,918 including accreted interest on these bonds of
$9,827,990, which is reflected in the accompanying general long-term debt accounts.
Prior Year Advanced Refunding of General Long-Term Debt
In prior years the District defeased certain outstanding School Building and Refunding Bonds by placing the
proceeds of new bonds in an irrevocable trust to provide for all future debt service payments on the old
bonds. Accordingly, the respective trust account assets and the liability for the defeased bonds are not
included in the District’s Financial Statements. At August 31, 2013 approximately $231.4 million previously
refunded bonds outstanding are considered defeased.
KATY INDEPENDENT SCHOOL DISTRICT
59
NOTE 9 – LONG-TERM DEBT (continued)
Build America Bonds
In February 2009, as part of the American Recovery and Reinvestment Act of 2009, Congress added
Sections 54AA and 6431 to the Internal Revenue Code of 1986, which permit state and local governments to
obtain certain tax advantages when issuing taxable obligations that meet certain requirements of the Code
and the related Treasury regulations. Such obligations are referred to as Build America Bonds (BABs).
In December 2010, the District issued Series 2010-D Bonds in the amount of $155,000,000 under the BABs
program. Under this program, the District receives semi-annual subsidies equal to 35% of the interest it pays
on the bonds. The subsidy payments received by the District will not be pledged as security for the payment
of the Series 2010-D Bonds and no holder of the Series 2010-D Bonds will be entitled to a tax credit or any
subsidy payment with respect to the Series 2010-D Bonds. The District intends to use the subsidy payments
for any lawful purpose, which may include payment of principal and interest on the Series 2010-D Bonds. In
the fiscal year ended August 31, 2013 the District received $3,097,130 in such subsidies. This includes a
reduction of the August 15, 2013 subsidy payment by 8.7% due to federal sequestration. The amount
received was recorded as federal revenue in the General Fund and, at the discretion of the District, was
transferred to the Debt Service Fund. The sequestration reduction percentage for 2014 has been set at 7.2%.
NOTE 10 – COMMITMENT TO FINANCE MULTI-PURPOSE COMPLEX THROUGH
PARTICIPATION IN TAX INCREMENT REINVESTMENT ZONE AGREEMENTS
Under a series of agreements, the District agreed to provide funding to finance $25,590,000 of tax-exempt
bonds issued in September 2002 by the Katy Development Authority (KDA). The Bonds are legally
described as The Katy Development Authority Tax Increment Contract Revenue Bonds (Katy ISD Contract),
Series 2002. The Bonds were issued pursuant to the terms and conditions of a Bond Resolution approved by
the KDA Board. The issuance of the bonds was approved by the Zone Board and the City Council of the
City of Katy (City). In June 2012 the KDA refunded the $18,800,000 outstanding Series 2002 Bonds by
issuing Series 2012 Refunding Bonds in the amount of $17,360,000.
Capital Lease Arrangement
The arrangements under the series of agreements constitute a capital lease arrangement for the District in
constructing a multi-purpose complex and this arrangement is not altered by the refunding. The District
recorded a capital lease obligation and a related asset in the approximate amount of the original bonds. Total
assets under capital lease at August 31, 2013 were $24,341,017. Of that amount $23,520,083 is classified as
Buildings and Improvements, $648,428 is Furniture and Equipment and $172,506 is Land Improvements.
The bond proceeds were used to construct a multi-purpose complex for large District functions. It is also
available for rent by outside entities. Although the KDA legally owns the multi-purpose center, the
agreements provide that the District lease, construct, and control the use of this facility during the life of the
bonds issued to construct it. Ownership of the multi-purpose complex will revert to the District once the
bonds are retired. District collected tax increments from the General Fund will be used to pay the debt during
this term through a lease arrangement between the District and the KDA. No rent paid to the District for use
of the multi-purpose complex will be pledged as security for the bonds.
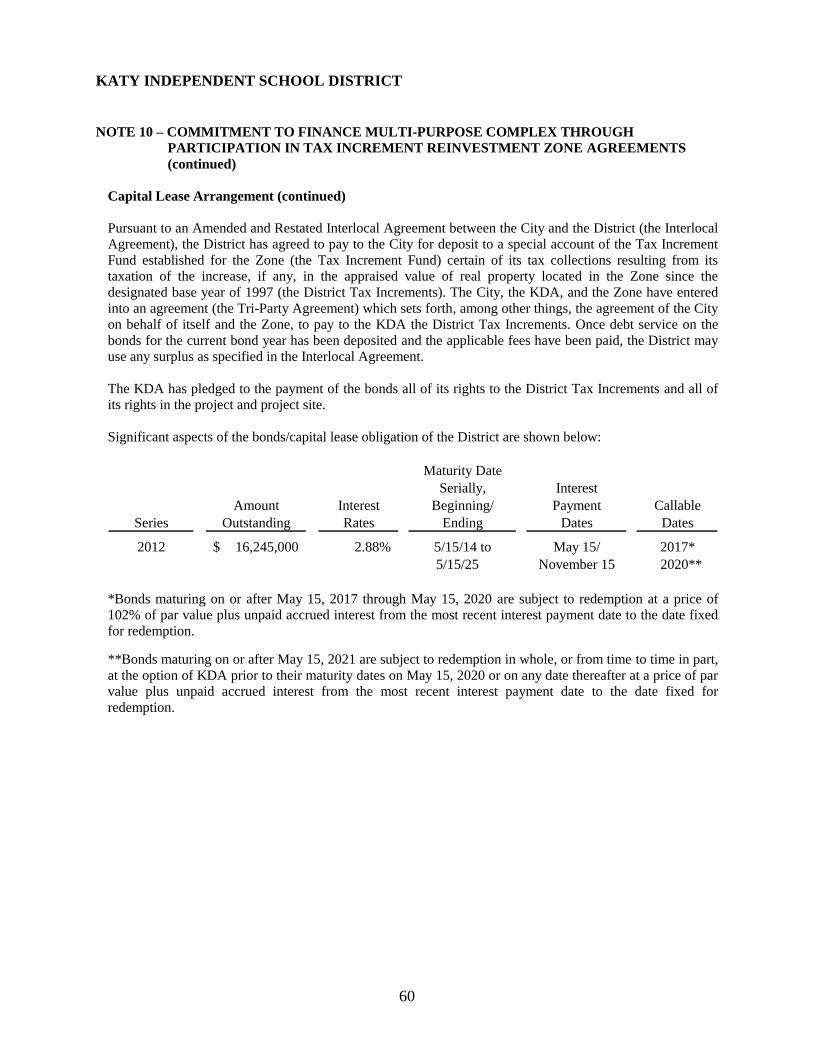
KATY INDEPENDENT SCHOOL DISTRICT
60
NOTE 10 – COMMITMENT TO FINANCE MULTI-PURPOSE COMPLEX THROUGH
PARTICIPATION IN TAX INCREMENT REINVESTMENT ZONE AGREEMENTS
(continued)
Capital Lease Arrangement (continued)
Pursuant to an Amended and Restated Interlocal Agreement between the City and the District (the Interlocal
Agreement), the District has agreed to pay to the City for deposit to a special account of the Tax Increment
Fund established for the Zone (the Tax Increment Fund) certain of its tax collections resulting from its
taxation of the increase, if any, in the appraised value of real property located in the Zone since the
designated base year of 1997 (the District Tax Increments). The City, the KDA, and the Zone have entered
into an agreement (the Tri-Party Agreement) which sets forth, among other things, the agreement of the City
on behalf of itself and the Zone, to pay to the KDA the District Tax Increments. Once debt service on the
bonds for the current bond year has been deposited and the applicable fees have been paid, the District may
use any surplus as specified in the Interlocal Agreement.
The KDA has pledged to the payment of the bonds all of its rights to the District Tax Increments and all of
its rights in the project and project site.
Significant aspects of the bonds/capital lease obligation of the District are shown below:
Maturity Date
Serially, Interest
Amount Interest Beginning/ Payment Callable
Series Outstanding Rates Ending Dates Dates
2012 16,245,000$ 2.88% 5/15/14 to May 15/ 2017*
5/15/25 November 15 2020**
*Bonds maturing on or after May 15, 2017 through May 15, 2020 are subject to redemption at a price of
102% of par value plus unpaid accrued interest from the most recent interest payment date to the date fixed
for redemption.
**Bonds maturing on or after May 15, 2021 are subject to redemption in whole, or from time to time in part,
at the option of KDA prior to their maturity dates on May 15, 2020 or on any date thereafter at a price of par
value plus unpaid accrued interest from the most recent interest payment date to the date fixed for
redemption.
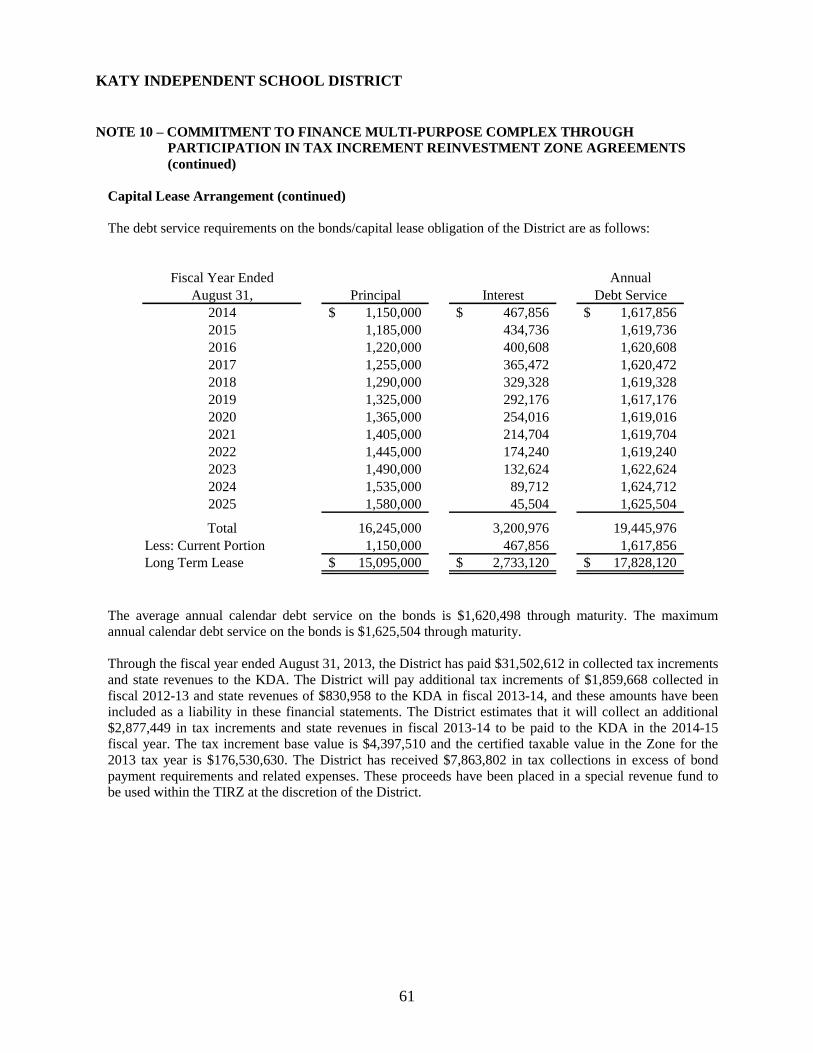
KATY INDEPENDENT SCHOOL DISTRICT
61
NOTE 10 – COMMITMENT TO FINANCE MULTI-PURPOSE COMPLEX THROUGH
PARTICIPATION IN TAX INCREMENT REINVESTMENT ZONE AGREEMENTS
(continued)
Capital Lease Arrangement (continued)
The debt service requirements on the bonds/capital lease obligation of the District are as follows:
Fiscal Year Ended Annual
August 31, Principal Interest Debt Service
2014 1,150,000$ 467,856$ 1,617,856$
2015 1,185,000 434,736 1,619,736
2016 1,220,000 400,608 1,620,608
2017 1,255,000 365,472 1,620,472
2018 1,290,000 329,328 1,619,328
2019 1,325,000 292,176 1,617,176
2020 1,365,000 254,016 1,619,016
2021 1,405,000 214,704 1,619,704
2022 1,445,000 174,240 1,619,240
2023 1,490,000 132,624 1,622,624
2024 1,535,000 89,712 1,624,712
2025 1,580,000 45,504 1,625,504
Total 16,245,000 3,200,976 19,445,976
Less: Current Portion 1,150,000 467,856 1,617,856
Long Term Lease 15,095,000$ 2,733,120$ 17,828,120$
The average annual calendar debt service on the bonds is $1,620,498 through maturity. The maximum
annual calendar debt service on the bonds is $1,625,504 through maturity.
Through the fiscal year ended August 31, 2013, the District has paid $31,502,612 in collected tax increments
and state revenues to the KDA. The District will pay additional tax increments of $1,859,668 collected in
fiscal 2012-13 and state revenues of $830,958 to the KDA in fiscal 2013-14, and these amounts have been
included as a liability in these financial statements. The District estimates that it will collect an additional
$2,877,449 in tax increments and state revenues in fiscal 2013-14 to be paid to the KDA in the 2014-15
fiscal year. The tax increment base value is $4,397,510 and the certified taxable value in the Zone for the
2013 tax year is $176,530,630. The District has received $7,863,802 in tax collections in excess of bond
payment requirements and related expenses. These proceeds have been placed in a special revenue fund to
be used within the TIRZ at the discretion of the District.
KATY INDEPENDENT SCHOOL DISTRICT
62
NOTE 10 – COMMITMENT TO FINANCE MULTI-PURPOSE COMPLEX THROUGH
PARTICIPATION IN TAX INCREMENT REINVESTMENT ZONE AGREEMENTS
(continued)
Other Significant Information
The KDA, a public not-for-profit local government corporation, was authorized to be established by the City
of Katy, Texas in 1998, to aid, assist, and act on behalf of the City in the performance of the City’s
governmental functions and to provide a means of financing certain project costs in connection with
Reinvestment Zone Number One, City of Katy, Texas (the Zone). The KDA is governed by a board of
directors (the Board), whose voting members are appointed by the City. KDA is the administrator of the
Zone. The KDA is considered a discretely presented component unit of the City in accordance with
accounting principles generally accepted in the United States of America applicable to state and local
governments.
The Zone was created by the City Council of the City, pursuant to the provisions of the Tax Increment
Financing Act, Chapter 311, Texas Tax Code (the TIF Act), to facilitate development of the land within the
boundaries of the Zone, consisting of land located entirely within the City and Fort Bend County (the
County). The majority of the Zone, consisting of 479 acres, is bounded by Interstate 10 on the north, Pin Oak
Village and Falcon Point on the south, Katy Fort Bend Road on the east, and Pin Oak Road on the west. An
interchange on Interstate provides direct access to the Zone. The remainder of the property in the Zone is
located north of Interstate 10 and is owned by the District.
The ordinance of the City establishing the Zone also established a board of directors of the Zone (the Zone
Board). The Board of Directors of the Zone consists of nine persons: five appointed by the City, one
appointed by the County, one appointed by the District, one appointed by the state senator in whose district
the Zone is located, and one appointed by the state representative in whose district the Zone is located.
As required under the TIF Act, the Zone Board adopted, and the City Council of the City approved, a Project
Plan and Reinvestment Zone Financing Plan, which has been amended (as amended, the Plan). The Plan sets
out the public improvements needed to develop or induce development within the Zone (the Public
Improvements). The cost of the Public Improvements, the cost of creation of the Zone, and related
organizational costs (the Project Costs) constitute eligible project costs under the TIF Act, which may be
financed with proceeds of the bonds.
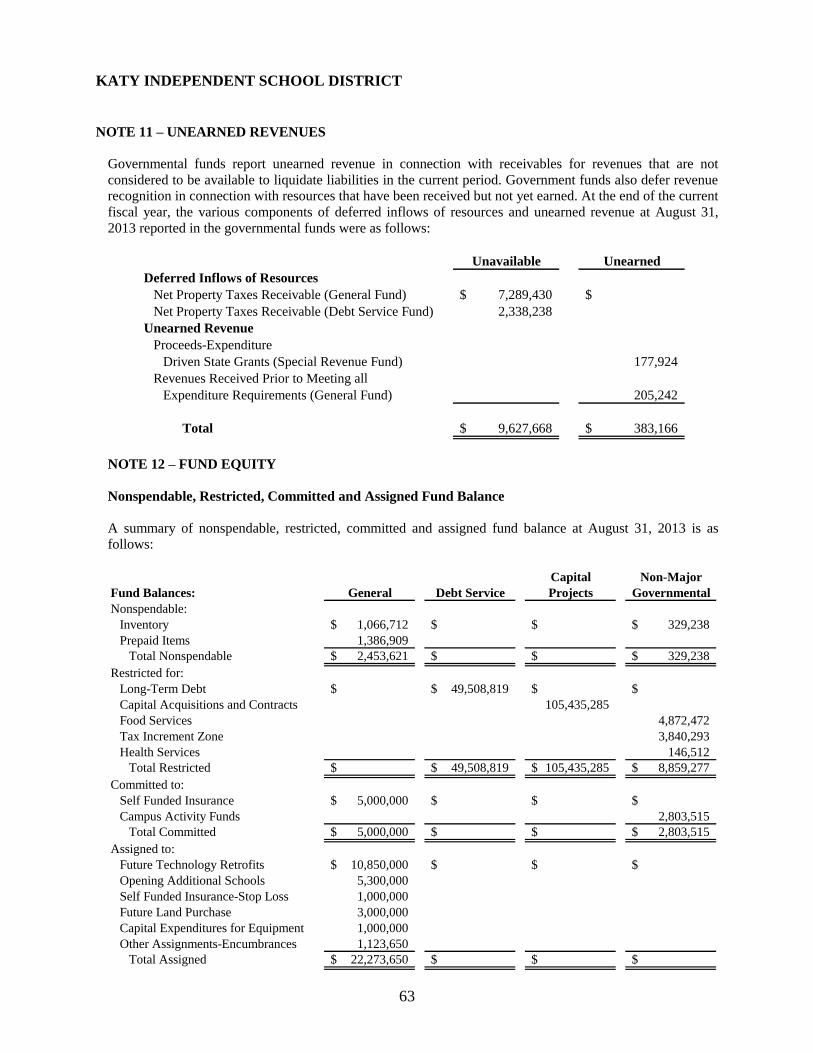
KATY INDEPENDENT SCHOOL DISTRICT
63
NOTE 11 – UNEARNED REVENUES
Governmental funds report unearned revenue in connection with receivables for revenues that are not
considered to be available to liquidate liabilities in the current period. Government funds also defer revenue
recognition in connection with resources that have been received but not yet earned. At the end of the current
fiscal year, the various components of deferred inflows of resources and unearned revenue at August 31,
2013 reported in the governmental funds were as follows:
Unavailable Unearned
Deferred Inflows of Resources
Net Property Taxes Receivable (General Fund) 7,289,430$ $
Net Property Taxes Receivable (Debt Service Fund) 2,338,238
Unearned Revenue
Proceeds-Expenditure
Driven State Grants (Special Revenue Fund) 177,924
Revenues Received Prior to Meeting all
Expenditure Requirements (General Fund) 205,242
Total 9,627,668$ 383,166$
NOTE 12 – FUND EQUITY
Nonspendable, Restricted, Committed and Assigned Fund Balance
A summary of nonspendable, restricted, committed and assigned fund balance at August 31, 2013 is as
follows:
Capital Non-Major
Fund Balances: General Debt Service Projects Governmental
Nonspendable:
Inventory 1,066,712$ $ $ 329,238$
Prepaid Items 1,386,909
Total Nonspendable 2,453,621$ $ $ 329,238$
Restricted for:
Long-Term Debt $ 49,508,819$ $ $
Capital Acquisitions and Contracts 105,435,285
Food Services 4,872,472
Tax Increment Zone 3,840,293
Health Services 146,512
Total Restricted $ 49,508,819$ 105,435,285$ 8,859,277$
Committed to:
Self Funded Insurance 5,000,000$ $ $ $
Campus Activity Funds 2,803,515
Total Committed 5,000,000$ $ $ 2,803,515$
Assigned to:
Future Technology Retrofits 10,850,000$ $ $ $
Opening Additional Schools 5,300,000
Self Funded Insurance-Stop Loss 1,000,000
Future Land Purchase 3,000,000
Capital Expenditures for Equipment 1,000,000
Other Assignments-Encumbrances 1,123,650
Total Assigned 22,273,650$ $ $ $
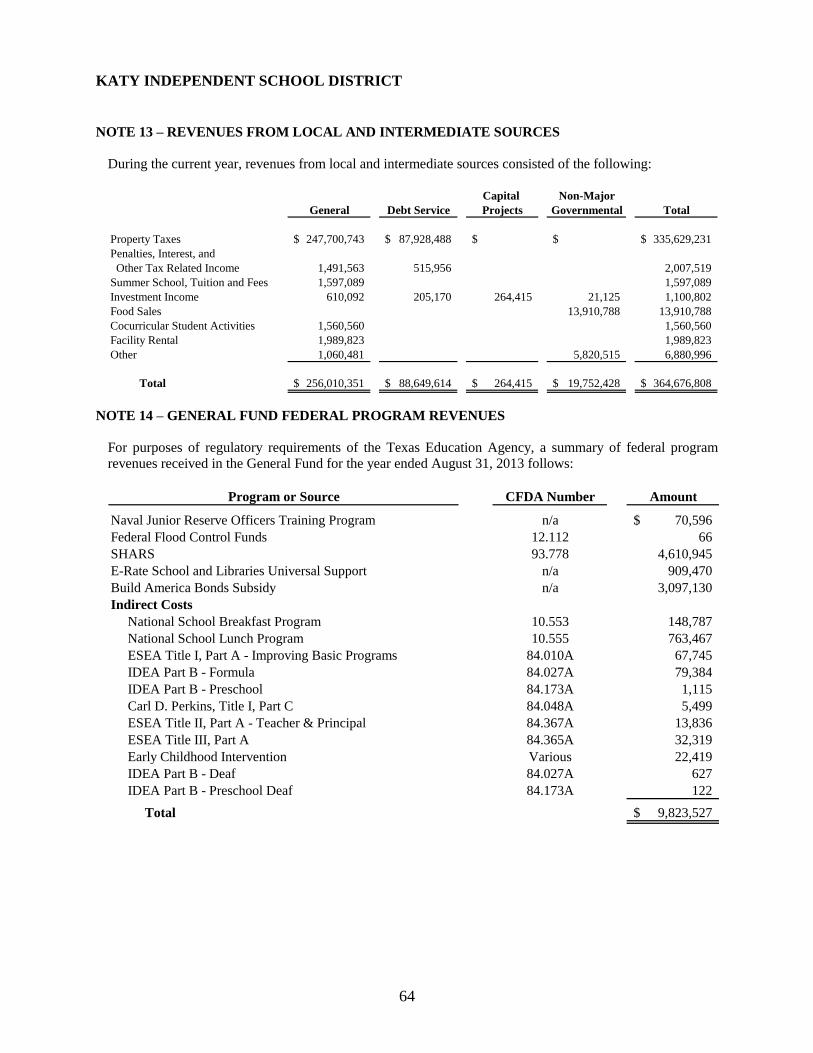
KATY INDEPENDENT SCHOOL DISTRICT
64
NOTE 13 – REVENUES FROM LOCAL AND INTERMEDIATE SOURCES
During the current year, revenues from local and intermediate sources consisted of the following:
Capital Non-Major
General Debt Service Projects Governmental Total
Property Taxes 247,700,743$ 87,928,488$ $ $ 335,629,231$
Penalties, Interest, and
Other Tax Related Income 1,491,563 515,956 2,007,519
Summer School, Tuition and Fees 1,597,089 1,597,089
Investment Income 610,092 205,170 264,415 21,125 1,100,802
Food Sales 13,910,788 13,910,788
Cocurricular Student Activities 1,560,560 1,560,560
Facility Rental 1,989,823 1,989,823
Other 1,060,481 5,820,515 6,880,996
Total 256,010,351$ 88,649,614$ 264,415$ 19,752,428$ 364,676,808$
NOTE 14 – GENERAL FUND FEDERAL PROGRAM REVENUES
For purposes of regulatory requirements of the Texas Education Agency, a summary of federal program
revenues received in the General Fund for the year ended August 31, 2013 follows:
Program or Source CFDA Number Amount
Naval Junior Reserve Officers Training Program n/a 70,596$
Federal Flood Control Funds 12.112 66
SHARS 93.778 4,610,945
E-Rate School and Libraries Universal Support n/a 909,470
Build America Bonds Subsidy n/a 3,097,130
Indirect Costs
National School Breakfast Program 10.553 148,787
National School Lunch Program 10.555 763,467
ESEA Title I, Part A - Improving Basic Programs 84.010A 67,745
IDEA Part B - Formula 84.027A 79,384
IDEA Part B - Preschool 84.173A 1,115
Carl D. Perkins, Title I, Part C 84.048A 5,499
ESEA Title II, Part A - Teacher & Principal 84.367A 13,836
ESEA Title III, Part A 84.365A 32,319
Early Childhood Intervention Various 22,419
IDEA Part B - Deaf 84.027A 627
IDEA Part B - Preschool Deaf 84.173A 122
Total 9,823,527$
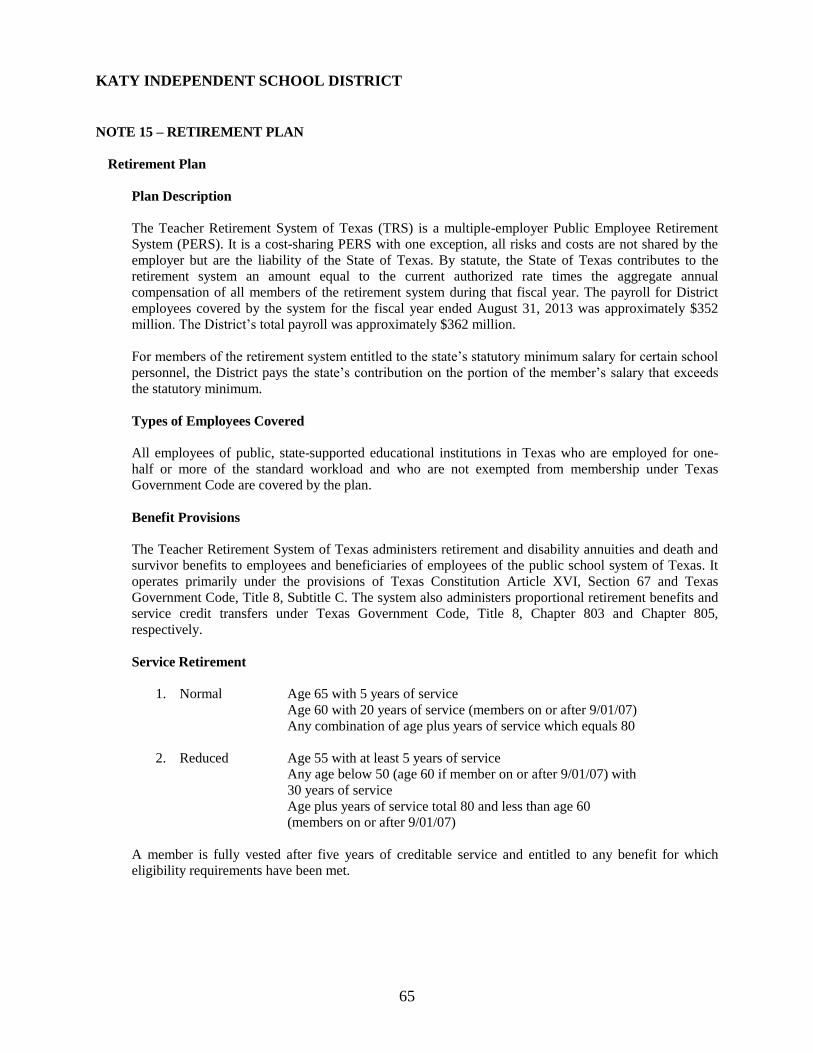
KATY INDEPENDENT SCHOOL DISTRICT
65
NOTE 15 – RETIREMENT PLAN
Retirement Plan
Plan Description
The Teacher Retirement System of Texas (TRS) is a multiple-employer Public Employee Retirement
System (PERS). It is a cost-sharing PERS with one exception, all risks and costs are not shared by the
employer but are the liability of the State of Texas. By statute, the State of Texas contributes to the
retirement system an amount equal to the current authorized rate times the aggregate annual
compensation of all members of the retirement system during that fiscal year. The payroll for District
employees covered by the system for the fiscal year ended August 31, 2013 was approximately $352
million. The District’s total payroll was approximately $362 million.
For members of the retirement system entitled to the state’s statutory minimum salary for certain school
personnel, the District pays the state’s contribution on the portion of the member’s salary that exceeds
the statutory minimum.
Types of Employees Covered
All employees of public, state-supported educational institutions in Texas who are employed for one-
half or more of the standard workload and who are not exempted from membership under Texas
Government Code are covered by the plan.
Benefit Provisions
The Teacher Retirement System of Texas administers retirement and disability annuities and death and
survivor benefits to employees and beneficiaries of employees of the public school system of Texas. It
operates primarily under the provisions of Texas Constitution Article XVI, Section 67 and Texas
Government Code, Title 8, Subtitle C. The system also administers proportional retirement benefits and
service credit transfers under Texas Government Code, Title 8, Chapter 803 and Chapter 805,
respectively.
Service Retirement
1. Normal Age 65 with 5 years of service
Age 60 with 20 years of service (members on or after 9/01/07)
Any combination of age plus years of service which equals 80
2. Reduced Age 55 with at least 5 years of service
Any age below 50 (age 60 if member on or after 9/01/07) with
30 years of service
Age plus years of service total 80 and less than age 60
(members on or after 9/01/07)
A member is fully vested after five years of creditable service and entitled to any benefit for which
eligibility requirements have been met.
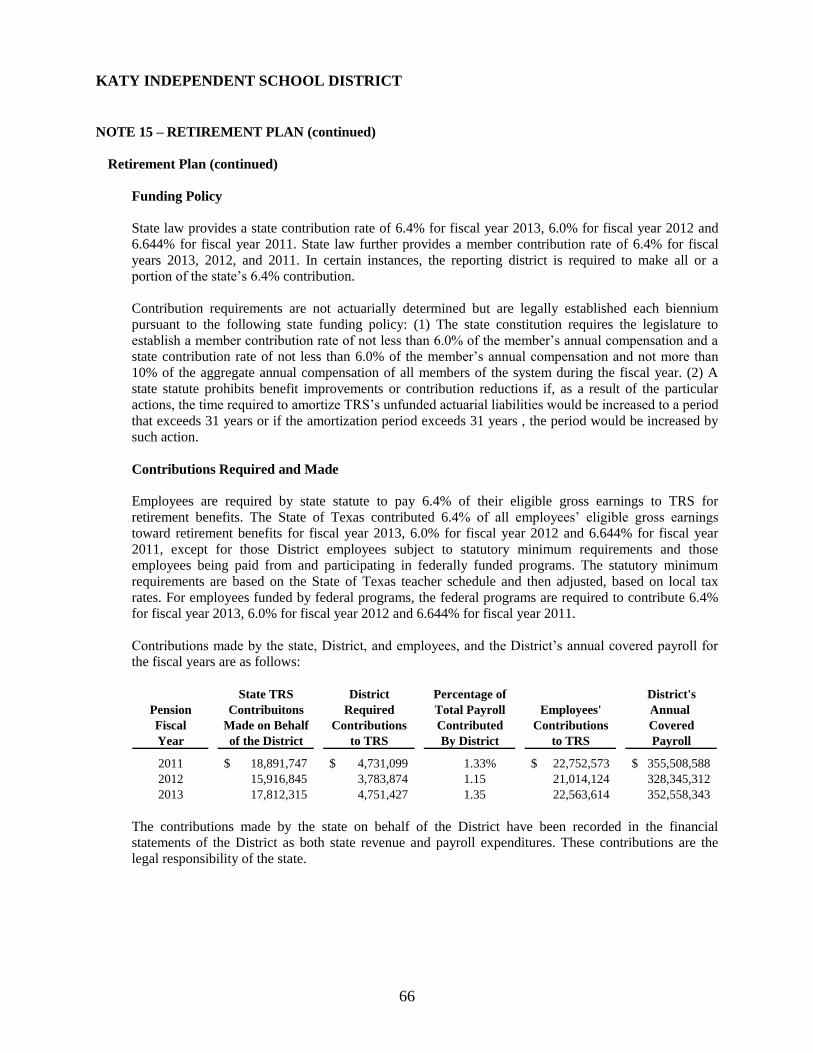
KATY INDEPENDENT SCHOOL DISTRICT
66
NOTE 15 – RETIREMENT PLAN (continued)
Retirement Plan (continued)
Funding Policy
State law provides a state contribution rate of 6.4% for fiscal year 2013, 6.0% for fiscal year 2012 and
6.644% for fiscal year 2011. State law further provides a member contribution rate of 6.4% for fiscal
years 2013, 2012, and 2011. In certain instances, the reporting district is required to make all or a
portion of the state’s 6.4% contribution.
Contribution requirements are not actuarially determined but are legally established each biennium
pursuant to the following state funding policy: (1) The state constitution requires the legislature to
establish a member contribution rate of not less than 6.0% of the member’s annual compensation and a
state contribution rate of not less than 6.0% of the member’s annual compensation and not more than
10% of the aggregate annual compensation of all members of the system during the fiscal year. (2) A
state statute prohibits benefit improvements or contribution reductions if, as a result of the particular
actions, the time required to amortize TRS’s unfunded actuarial liabilities would be increased to a period
that exceeds 31 years or if the amortization period exceeds 31 years , the period would be increased by
such action.
Contributions Required and Made
Employees are required by state statute to pay 6.4% of their eligible gross earnings to TRS for
retirement benefits. The State of Texas contributed 6.4% of all employees’ eligible gross earnings
toward retirement benefits for fiscal year 2013, 6.0% for fiscal year 2012 and 6.644% for fiscal year
2011, except for those District employees subject to statutory minimum requirements and those
employees being paid from and participating in federally funded programs. The statutory minimum
requirements are based on the State of Texas teacher schedule and then adjusted, based on local tax
rates. For employees funded by federal programs, the federal programs are required to contribute 6.4%
for fiscal year 2013, 6.0% for fiscal year 2012 and 6.644% for fiscal year 2011.
Contributions made by the state, District, and employees, and the District’s annual covered payroll for
the fiscal years are as follows:
State TRS District Percentage of District's
Pension Contribuitons Required Total Payroll Employees' Annual
Fiscal Made on Behalf Contributions Contributed Contributions Covered
Year of the District to TRS By District to TRS Payroll
2011 18,891,747$ 4,731,099$ 1.33% 22,752,573$ 355,508,588$
2012 15,916,845 3,783,874 1.15 21,014,124 328,345,312
2013 17,812,315 4,751,427 1.35 22,563,614 352,558,343
The contributions made by the state on behalf of the District have been recorded in the financial
statements of the District as both state revenue and payroll expenditures. These contributions are the
legal responsibility of the state.
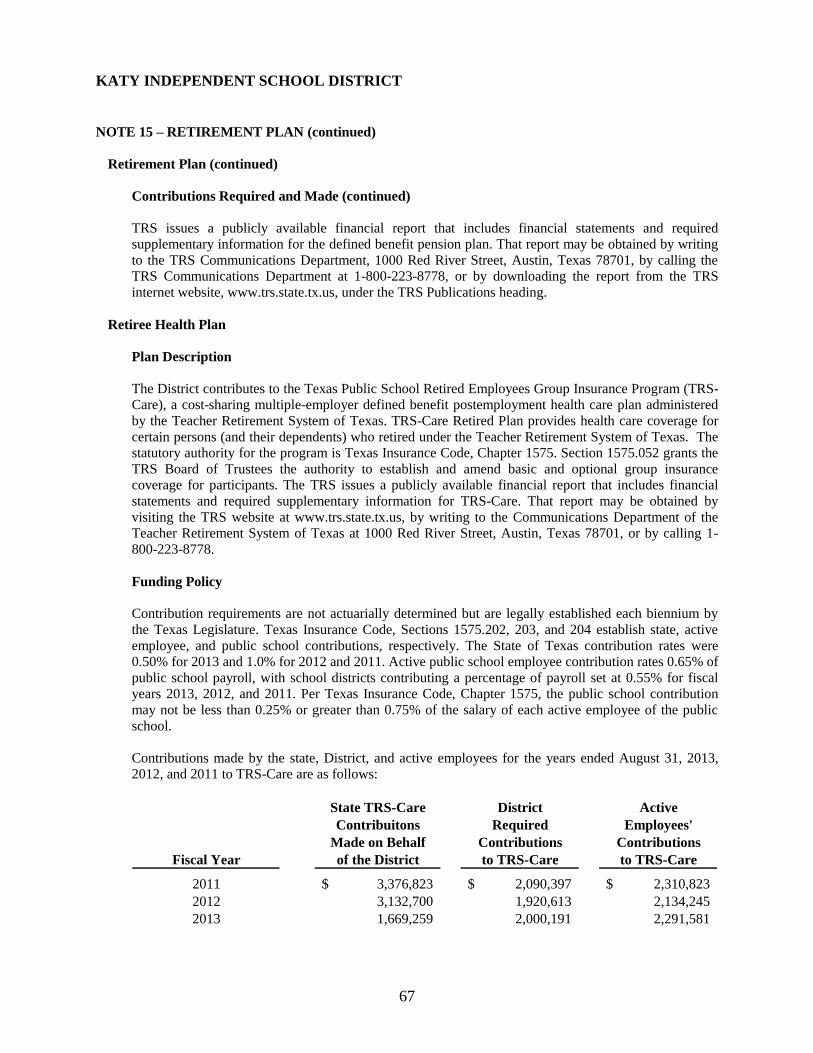
KATY INDEPENDENT SCHOOL DISTRICT
67
NOTE 15 – RETIREMENT PLAN (continued)
Retirement Plan (continued)
Contributions Required and Made (continued)
TRS issues a publicly available financial report that includes financial statements and required
supplementary information for the defined benefit pension plan. That report may be obtained by writing
to the TRS Communications Department, 1000 Red River Street, Austin, Texas 78701, by calling the
TRS Communications Department at 1-800-223-8778, or by downloading the report from the TRS
internet website, www.trs.state.tx.us, under the TRS Publications heading.
Retiree Health Plan
Plan Description
The District contributes to the Texas Public School Retired Employees Group Insurance Program (TRS-
Care), a cost-sharing multiple-employer defined benefit postemployment health care plan administered
by the Teacher Retirement System of Texas. TRS-Care Retired Plan provides health care coverage for
certain persons (and their dependents) who retired under the Teacher Retirement System of Texas. The
statutory authority for the program is Texas Insurance Code, Chapter 1575. Section 1575.052 grants the
TRS Board of Trustees the authority to establish and amend basic and optional group insurance
coverage for participants. The TRS issues a publicly available financial report that includes financial
statements and required supplementary information for TRS-Care. That report may be obtained by
visiting the TRS website at www.trs.state.tx.us, by writing to the Communications Department of the
Teacher Retirement System of Texas at 1000 Red River Street, Austin, Texas 78701, or by calling 1-
800-223-8778.
Funding Policy
Contribution requirements are not actuarially determined but are legally established each biennium by
the Texas Legislature. Texas Insurance Code, Sections 1575.202, 203, and 204 establish state, active
employee, and public school contributions, respectively. The State of Texas contribution rates were
0.50% for 2013 and 1.0% for 2012 and 2011. Active public school employee contribution rates 0.65% of
public school payroll, with school districts contributing a percentage of payroll set at 0.55% for fiscal
years 2013, 2012, and 2011. Per Texas Insurance Code, Chapter 1575, the public school contribution
may not be less than 0.25% or greater than 0.75% of the salary of each active employee of the public
school.
Contributions made by the state, District, and active employees for the years ended August 31, 2013,
2012, and 2011 to TRS-Care are as follows:
State TRS-Care District Active
Contribuitons Required Employees'
Made on Behalf Contributions Contributions
Fiscal Year of the District to TRS-Care to TRS-Care
2011 3,376,823$ 2,090,397$ 2,310,823$
2012 3,132,700 1,920,613 2,134,245
2013 1,669,259 2,000,191 2,291,581
KATY INDEPENDENT SCHOOL DISTRICT
68
NOTE 15 – RETIREMENT PLAN (continued)
Retiree Health Plan (continued)
Medicare Part D
The Medicare Prescription Drug, Improvement, and Modernization Act of 2003, effective January 1,
2006, established prescription drug coverage for Medicare beneficiaries known as Medicare Part D. One
of the provisions of Medicare Part D allows for the Texas Public School Retired Employee Group
Insurance Program (TRS-Care) to receive retiree drug subsidy payments from the federal government to
offset certain prescription drug expenditures for eligible TRS-Care participants. For the fiscal years
ended August 31, 2013, 2012, and 2011, the subsidy payments received by TRS-Care on-behalf of the
District were $977,024, $727,912, and $913,527, respectively. The contributions made on behalf of the
District have been recorded in the financial statements of the District as both revenue and payroll
expenditure.
Compensated Absences
The District pays one-half of the locally accumulated sick leave days up to a maximum of 90
accumulated days to employees who retire with five or more years of continuous employment in the
District and who retire from the state Teacher Retirement System. The majority of the payments are
administered through Public Agency Retirement Services (PARS). During 2013, $598,594 was
disbursed to 91 members. No assets are being held or accumulated for future distribution. The District
has accrued $20,700,459 in the Government-wide Financial Statements to pay for compensated
absences.
NOTE 16 – RISK MANAGEMENT
The District is exposed to various risks related to torts: theft of, damage to and destruction of assets, errors
and omissions, natural disasters, health and welfare of employees for which the District carries commercial
insurance or self-insures. No settlements have exceeded insurance coverage in the last three years.
Property, Casualty, General Liability, Professional Liability, and Unemployment
The District purchases commercial insurance for property loss with limits of $250 million, $25 million for
named windstorms. The policy covers up to $25 million per year for flood losses. In addition, the policy
covers $1 million for the one property currently in a flood plain. The District purchases an additional $.5
million building and $.5 million contents in flood protection for this facility. Casualty risks are insured by a
risk pool through an Interlocal agreement with Texas Association of School Boards (TASB), with limits of
$1 million per occurrence and $3 million aggregate for commercial general liability and a $.5 million
combined single limit automobile policy. Professional liability risks are insured with limits of $1 million.
Within these policy limits, the District’s exposure is limited to deductibles.
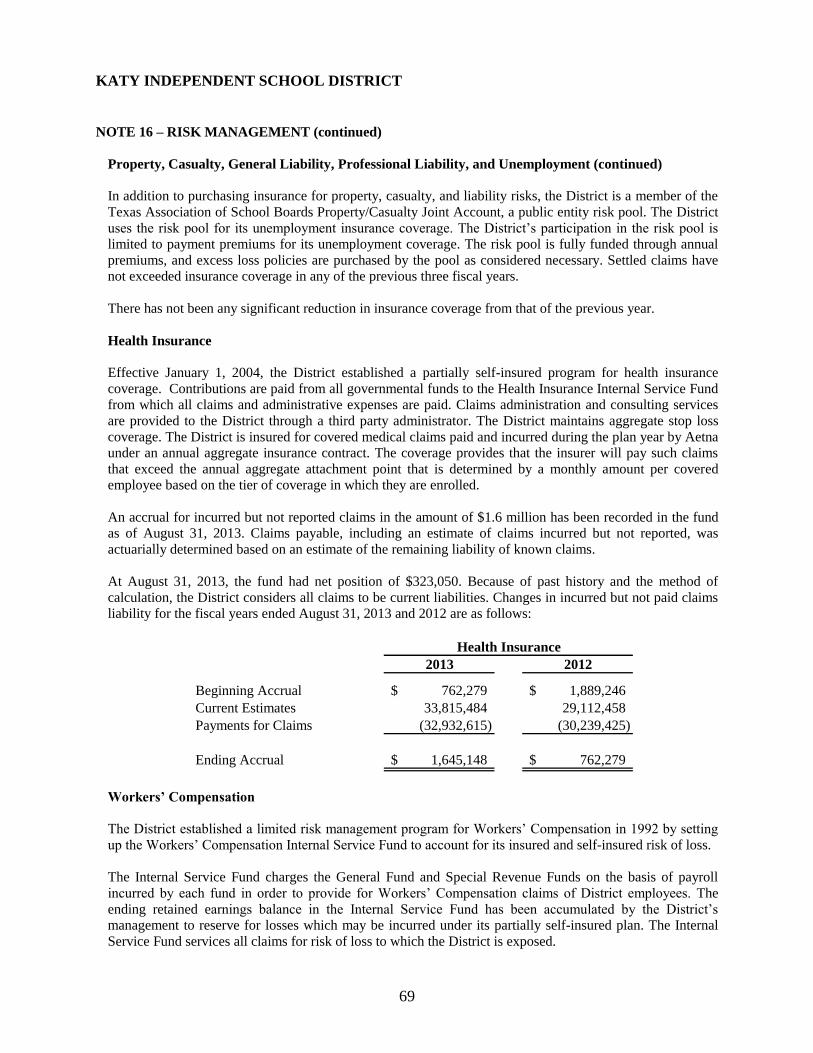
KATY INDEPENDENT SCHOOL DISTRICT
69
NOTE 16 – RISK MANAGEMENT (continued)
Property, Casualty, General Liability, Professional Liability, and Unemployment (continued)
In addition to purchasing insurance for property, casualty, and liability risks, the District is a member of the
Texas Association of School Boards Property/Casualty Joint Account, a public entity risk pool. The District
uses the risk pool for its unemployment insurance coverage. The District’s participation in the risk pool is
limited to payment premiums for its unemployment coverage. The risk pool is fully funded through annual
premiums, and excess loss policies are purchased by the pool as considered necessary. Settled claims have
not exceeded insurance coverage in any of the previous three fiscal years.
There has not been any significant reduction in insurance coverage from that of the previous year.
Health Insurance
Effective January 1, 2004, the District established a partially self-insured program for health insurance
coverage. Contributions are paid from all governmental funds to the Health Insurance Internal Service Fund
from which all claims and administrative expenses are paid. Claims administration and consulting services
are provided to the District through a third party administrator. The District maintains aggregate stop loss
coverage. The District is insured for covered medical claims paid and incurred during the plan year by Aetna
under an annual aggregate insurance contract. The coverage provides that the insurer will pay such claims
that exceed the annual aggregate attachment point that is determined by a monthly amount per covered
employee based on the tier of coverage in which they are enrolled.
An accrual for incurred but not reported claims in the amount of $1.6 million has been recorded in the fund
as of August 31, 2013. Claims payable, including an estimate of claims incurred but not reported, was
actuarially determined based on an estimate of the remaining liability of known claims.
At August 31, 2013, the fund had net position of $323,050. Because of past history and the method of
calculation, the District considers all claims to be current liabilities. Changes in incurred but not paid claims
liability for the fiscal years ended August 31, 2013 and 2012 are as follows:
2013 2012
Beginning Accrual 762,279$ 1,889,246$
Current Estimates 33,815,484 29,112,458
Payments for Claims (32,932,615) (30,239,425)
Ending Accrual 1,645,148$ 762,279$
Health Insurance
Workers’ Compensation
The District established a limited risk management program for Workers’ Compensation in 1992 by setting
up the Workers’ Compensation Internal Service Fund to account for its insured and self-insured risk of loss.
The Internal Service Fund charges the General Fund and Special Revenue Funds on the basis of payroll
incurred by each fund in order to provide for Workers’ Compensation claims of District employees. The
ending retained earnings balance in the Internal Service Fund has been accumulated by the District’s management to reserve for losses which may be incurred under its partially self-insured plan. The Internal
Service Fund services all claims for risk of loss to which the District is exposed.
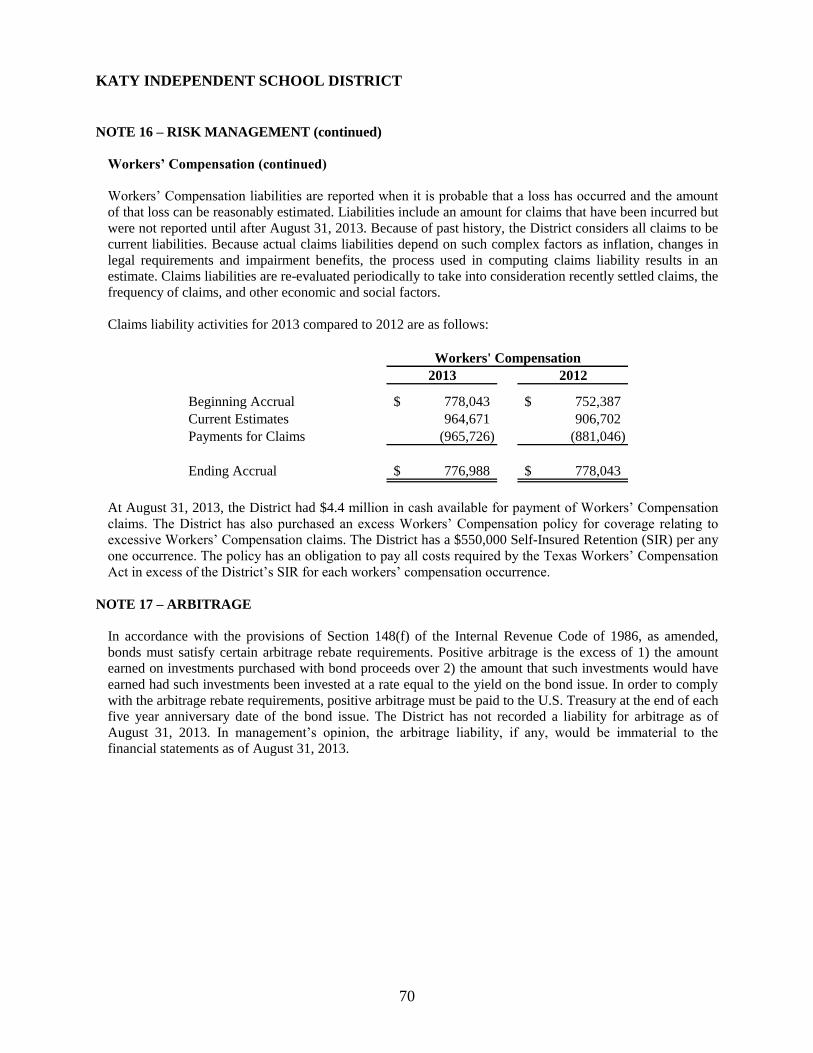
KATY INDEPENDENT SCHOOL DISTRICT
70
NOTE 16 – RISK MANAGEMENT (continued)
Workers’ Compensation (continued)
Workers’ Compensation liabilities are reported when it is probable that a loss has occurred and the amount
of that loss can be reasonably estimated. Liabilities include an amount for claims that have been incurred but
were not reported until after August 31, 2013. Because of past history, the District considers all claims to be
current liabilities. Because actual claims liabilities depend on such complex factors as inflation, changes in
legal requirements and impairment benefits, the process used in computing claims liability results in an
estimate. Claims liabilities are re-evaluated periodically to take into consideration recently settled claims, the
frequency of claims, and other economic and social factors.
Claims liability activities for 2013 compared to 2012 are as follows:
2013 2012
Beginning Accrual 778,043$ 752,387$
Current Estimates 964,671 906,702
Payments for Claims (965,726) (881,046)
Ending Accrual 776,988$ 778,043$
Workers' Compensation
At August 31, 2013, the District had $4.4 million in cash available for payment of Workers’ Compensation
claims. The District has also purchased an excess Workers’ Compensation policy for coverage relating to
excessive Workers’ Compensation claims. The District has a $550,000 Self-Insured Retention (SIR) per any
one occurrence. The policy has an obligation to pay all costs required by the Texas Workers’ Compensation
Act in excess of the District’s SIR for each workers’ compensation occurrence.
NOTE 17 – ARBITRAGE
In accordance with the provisions of Section 148(f) of the Internal Revenue Code of 1986, as amended,
bonds must satisfy certain arbitrage rebate requirements. Positive arbitrage is the excess of 1) the amount
earned on investments purchased with bond proceeds over 2) the amount that such investments would have
earned had such investments been invested at a rate equal to the yield on the bond issue. In order to comply
with the arbitrage rebate requirements, positive arbitrage must be paid to the U.S. Treasury at the end of each
five year anniversary date of the bond issue. The District has not recorded a liability for arbitrage as of
August 31, 2013. In management’s opinion, the arbitrage liability, if any, would be immaterial to the
financial statements as of August 31, 2013.
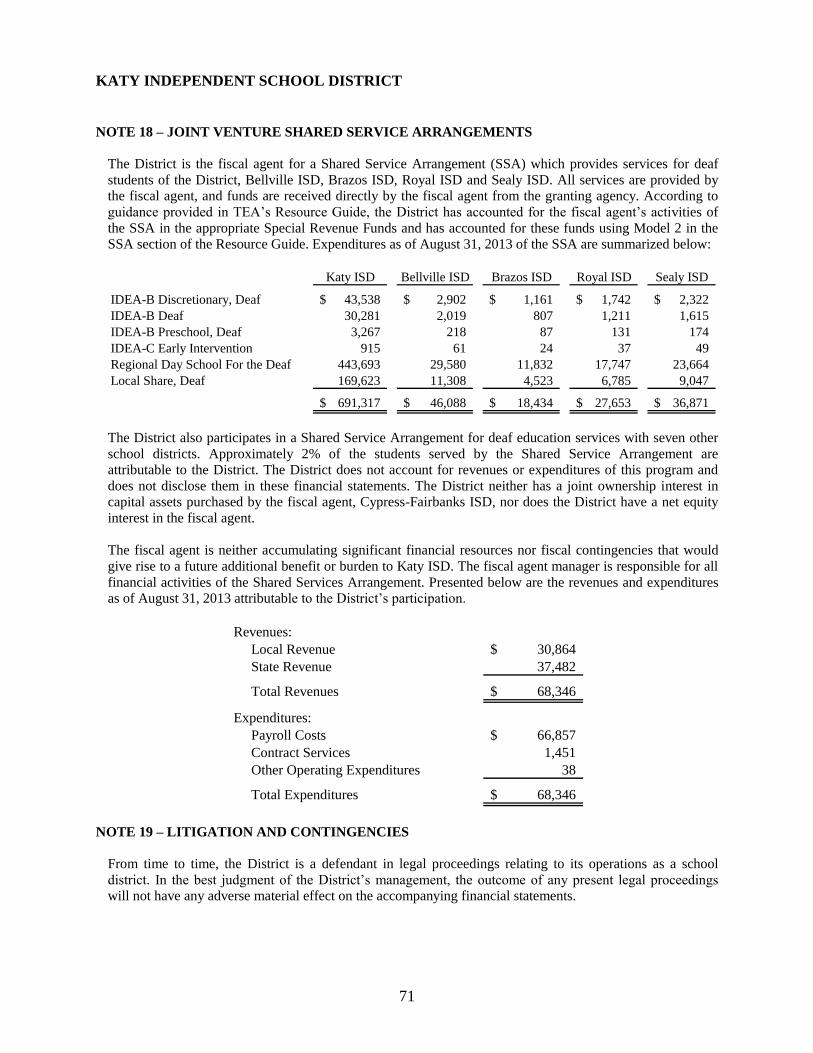
KATY INDEPENDENT SCHOOL DISTRICT
71
NOTE 18 – JOINT VENTURE SHARED SERVICE ARRANGEMENTS
The District is the fiscal agent for a Shared Service Arrangement (SSA) which provides services for deaf
students of the District, Bellville ISD, Brazos ISD, Royal ISD and Sealy ISD. All services are provided by
the fiscal agent, and funds are received directly by the fiscal agent from the granting agency. According to
guidance provided in TEA’s Resource Guide, the District has accounted for the fiscal agent’s activities of
the SSA in the appropriate Special Revenue Funds and has accounted for these funds using Model 2 in the
SSA section of the Resource Guide. Expenditures as of August 31, 2013 of the SSA are summarized below:
Katy ISD Bellville ISD Brazos ISD Royal ISD Sealy ISD
IDEA-B Discretionary, Deaf 43,538$ 2,902$ 1,161$ 1,742$ 2,322$
IDEA-B Deaf 30,281 2,019 807 1,211 1,615
IDEA-B Preschool, Deaf 3,267 218 87 131 174
IDEA-C Early Intervention 915 61 24 37 49
Regional Day School For the Deaf 443,693 29,580 11,832 17,747 23,664
Local Share, Deaf 169,623 11,308 4,523 6,785 9,047
691,317$ 46,088$ 18,434$ 27,653$ 36,871$
The District also participates in a Shared Service Arrangement for deaf education services with seven other
school districts. Approximately 2% of the students served by the Shared Service Arrangement are
attributable to the District. The District does not account for revenues or expenditures of this program and
does not disclose them in these financial statements. The District neither has a joint ownership interest in
capital assets purchased by the fiscal agent, Cypress-Fairbanks ISD, nor does the District have a net equity
interest in the fiscal agent.
The fiscal agent is neither accumulating significant financial resources nor fiscal contingencies that would
give rise to a future additional benefit or burden to Katy ISD. The fiscal agent manager is responsible for all
financial activities of the Shared Services Arrangement. Presented below are the revenues and expenditures
as of August 31, 2013 attributable to the District’s participation.
Revenues:
Local Revenue 30,864$
State Revenue 37,482
Total Revenues 68,346$
Expenditures:
Payroll Costs 66,857$
Contract Services 1,451
Other Operating Expenditures 38
Total Expenditures 68,346$
NOTE 19 – LITIGATION AND CONTINGENCIES
From time to time, the District is a defendant in legal proceedings relating to its operations as a school
district. In the best judgment of the District’s management, the outcome of any present legal proceedings
will not have any adverse material effect on the accompanying financial statements.
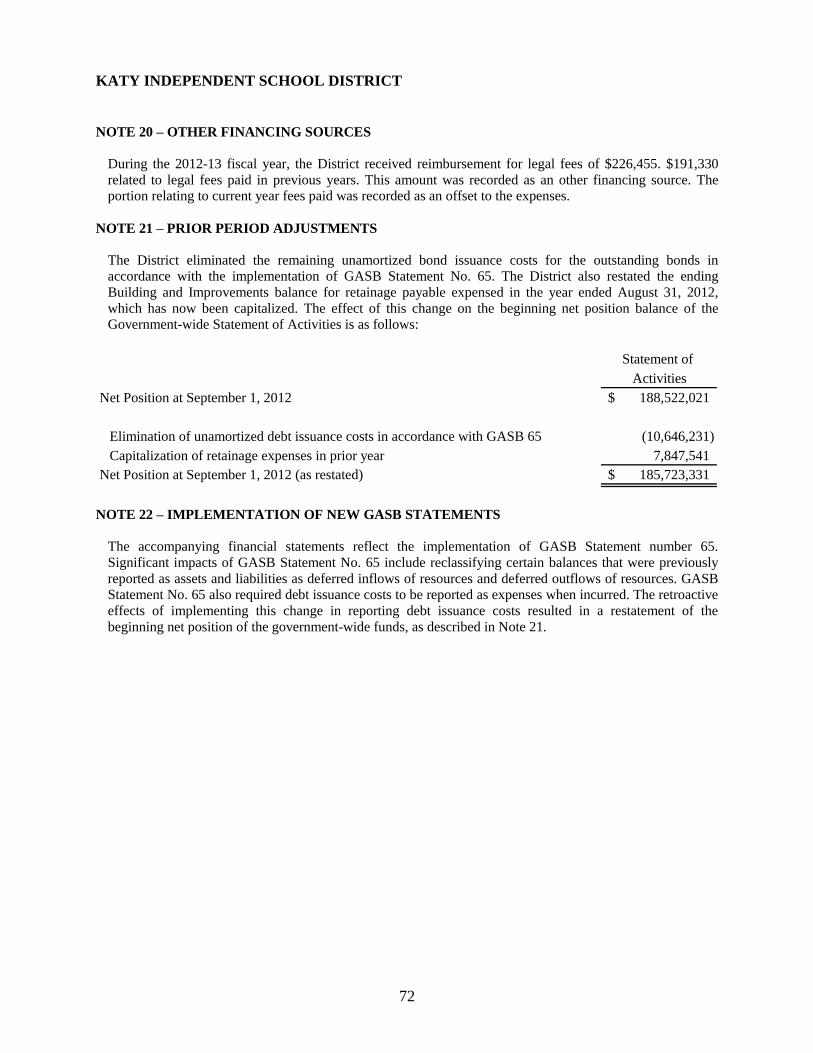
KATY INDEPENDENT SCHOOL DISTRICT
72
NOTE 20 – OTHER FINANCING SOURCES
During the 2012-13 fiscal year, the District received reimbursement for legal fees of $226,455. $191,330
related to legal fees paid in previous years. This amount was recorded as an other financing source. The
portion relating to current year fees paid was recorded as an offset to the expenses.
NOTE 21 – PRIOR PERIOD ADJUSTMENTS
The District eliminated the remaining unamortized bond issuance costs for the outstanding bonds in
accordance with the implementation of GASB Statement No. 65. The District also restated the ending
Building and Improvements balance for retainage payable expensed in the year ended August 31, 2012,
which has now been capitalized. The effect of this change on the beginning net position balance of the
Government-wide Statement of Activities is as follows:
Statement of
Activities
Net Position at September 1, 2012 188,522,021$
Elimination of unamortized debt issuance costs in accordance with GASB 65 (10,646,231)
Capitalization of retainage expenses in prior year 7,847,541
Net Position at September 1, 2012 (as restated) 185,723,331$
NOTE 22 – IMPLEMENTATION OF NEW GASB STATEMENTS
The accompanying financial statements reflect the implementation of GASB Statement number 65.
Significant impacts of GASB Statement No. 65 include reclassifying certain balances that were previously
reported as assets and liabilities as deferred inflows of resources and deferred outflows of resources. GASB
Statement No. 65 also required debt issuance costs to be reported as expenses when incurred. The retroactive
effects of implementing this change in reporting debt issuance costs resulted in a restatement of the
beginning net position of the government-wide funds, as described in Note 21.

73
REQUIRED SUPPLEMENTARY INFORMATION
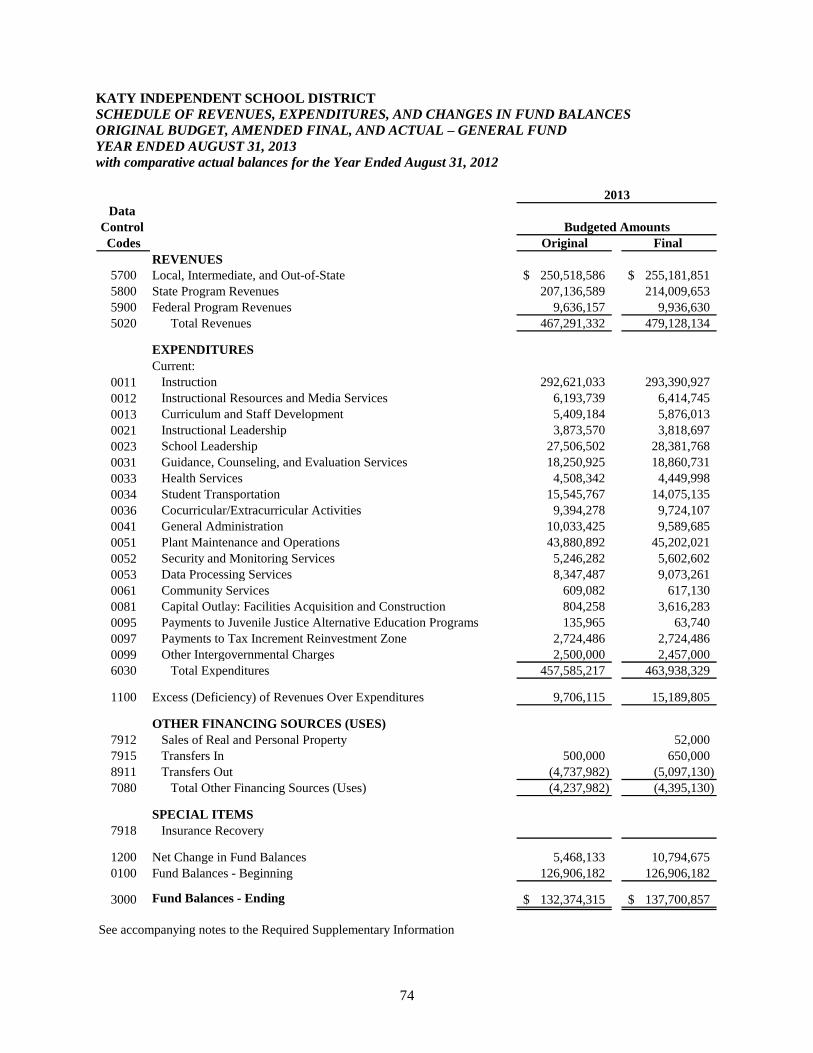
74
KATY INDEPENDENT SCHOOL DISTRICT
SCHEDULE OF REVENUES, EXPENDITURES, AND CHANGES IN FUND BALANCES
ORIGINAL BUDGET, AMENDED FINAL, AND ACTUAL – GENERAL FUND
YEAR ENDED AUGUST 31, 2013
with comparative actual balances for the Year Ended August 31, 2012
Data
Control
Codes Original Final
REVENUES
5700 Local, Intermediate, and Out-of-State 250,518,586$ 255,181,851$
5800 State Program Revenues 207,136,589 214,009,653
5900 Federal Program Revenues 9,636,157 9,936,630
5020 Total Revenues 467,291,332 479,128,134
EXPENDITURES
Current:
0011 Instruction 292,621,033 293,390,927
0012 Instructional Resources and Media Services 6,193,739 6,414,745
0013 Curriculum and Staff Development 5,409,184 5,876,013
0021 Instructional Leadership 3,873,570 3,818,697
0023 School Leadership 27,506,502 28,381,768
0031 Guidance, Counseling, and Evaluation Services 18,250,925 18,860,731
0033 Health Services 4,508,342 4,449,998
0034 Student Transportation 15,545,767 14,075,135
0036 Cocurricular/Extracurricular Activities 9,394,278 9,724,107
0041 General Administration 10,033,425 9,589,685
0051 Plant Maintenance and Operations 43,880,892 45,202,021
0052 Security and Monitoring Services 5,246,282 5,602,602
0053 Data Processing Services 8,347,487 9,073,261
0061 Community Services 609,082 617,130
0081 Capital Outlay: Facilities Acquisition and Construction 804,258 3,616,283
0095 Payments to Juvenile Justice Alternative Education Programs 135,965 63,740
0097 Payments to Tax Increment Reinvestment Zone 2,724,486 2,724,486
0099 Other Intergovernmental Charges 2,500,000 2,457,000
6030 Total Expenditures 457,585,217 463,938,329
1100 Excess (Deficiency) of Revenues Over Expenditures 9,706,115 15,189,805
OTHER FINANCING SOURCES (USES)
7912 Sales of Real and Personal Property 52,000
7915 Transfers In 500,000 650,000
8911 Transfers Out (4,737,982) (5,097,130)
7080 Total Other Financing Sources (Uses) (4,237,982) (4,395,130)
SPECIAL ITEMS
7918 Insurance Recovery
1200 Net Change in Fund Balances 5,468,133 10,794,675
0100 Fund Balances - Beginning 126,906,182 126,906,182
3000 Fund Balances - Ending 132,374,315$ 137,700,857$
Budgeted Amounts
See accompanying notes to the Required Supplementary Information
2013
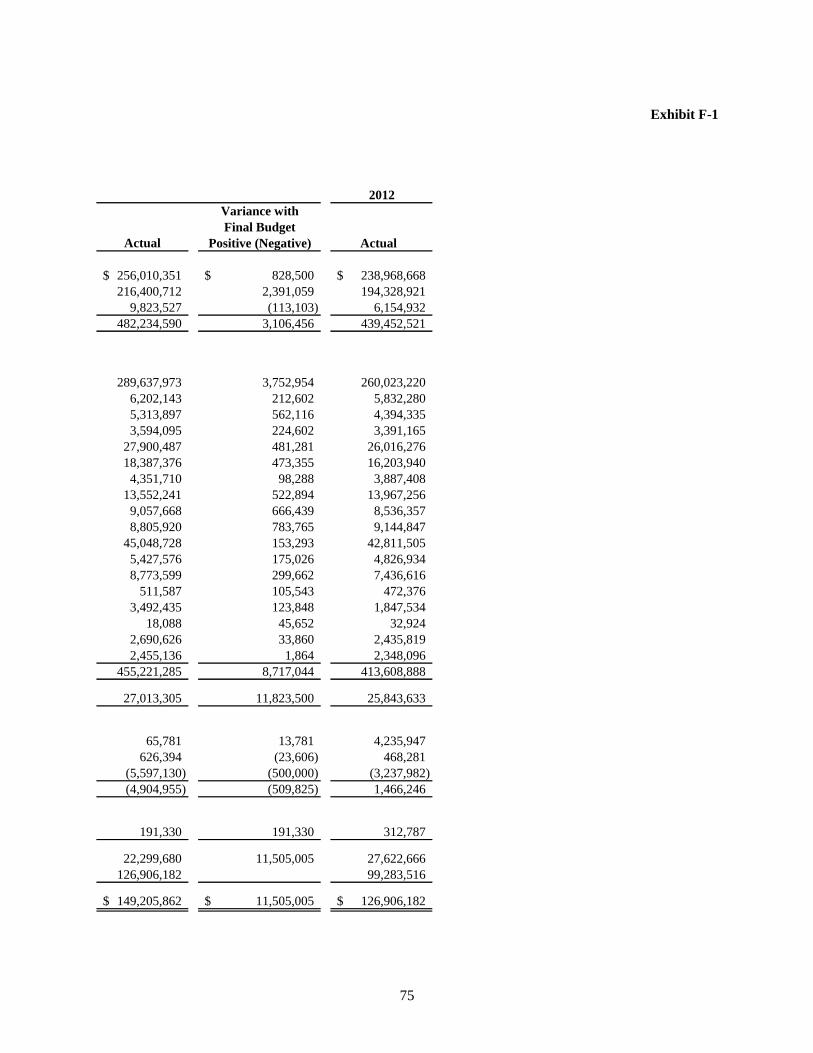
75
Exhibit F-1
2012
Variance with
Final Budget
Actual Positive (Negative) Actual
256,010,351$ 828,500$ 238,968,668$
216,400,712 2,391,059 194,328,921
9,823,527 (113,103) 6,154,932
482,234,590 3,106,456 439,452,521
289,637,973 3,752,954 260,023,220
6,202,143 212,602 5,832,280
5,313,897 562,116 4,394,335
3,594,095 224,602 3,391,165
27,900,487 481,281 26,016,276
18,387,376 473,355 16,203,940
4,351,710 98,288 3,887,408
13,552,241 522,894 13,967,256
9,057,668 666,439 8,536,357
8,805,920 783,765 9,144,847
45,048,728 153,293 42,811,505
5,427,576 175,026 4,826,934
8,773,599 299,662 7,436,616
511,587 105,543 472,376
3,492,435 123,848 1,847,534
18,088 45,652 32,924
2,690,626 33,860 2,435,819
2,455,136 1,864 2,348,096
455,221,285 8,717,044 413,608,888
27,013,305 11,823,500 25,843,633
65,781 13,781 4,235,947
626,394 (23,606) 468,281
(5,597,130) (500,000) (3,237,982)
(4,904,955) (509,825) 1,466,246
191,330 191,330 312,787
22,299,680 11,505,005 27,622,666
126,906,182 99,283,516
149,205,862$ 11,505,005$ 126,906,182$
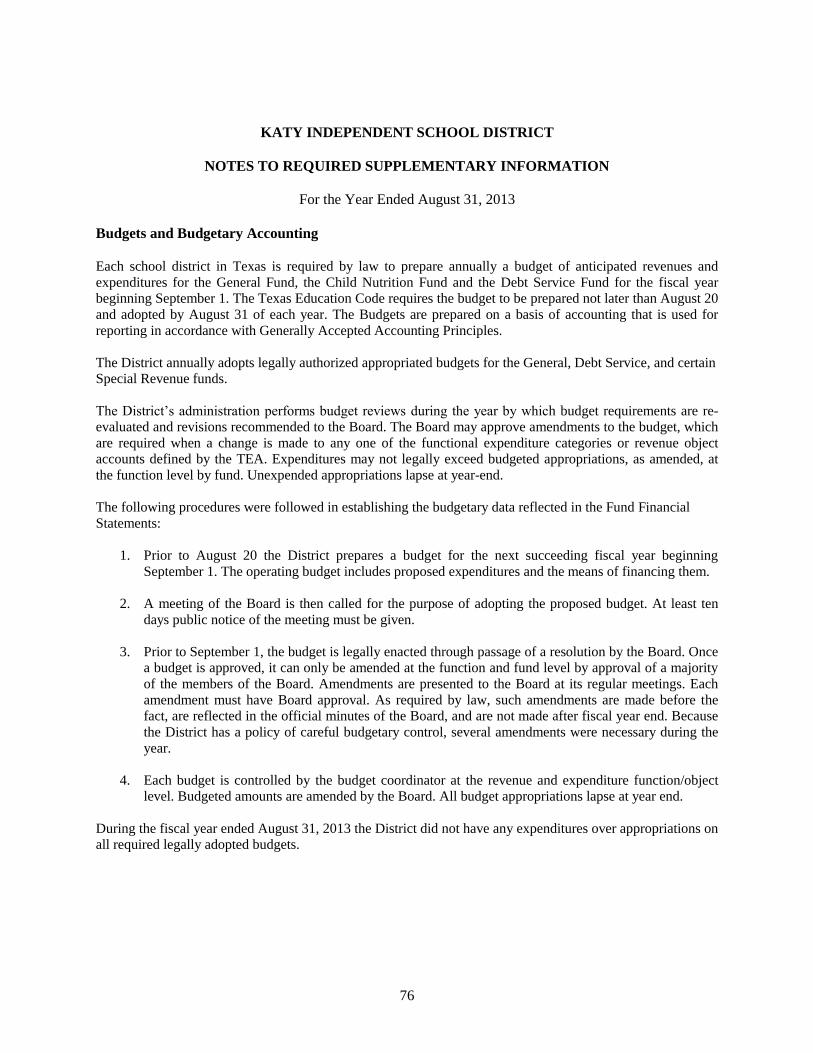
76
KATY INDEPENDENT SCHOOL DISTRICT
NOTES TO REQUIRED SUPPLEMENTARY INFORMATION
For the Year Ended August 31, 2013
Budgets and Budgetary Accounting Each school district in Texas is required by law to prepare annually a budget of anticipated revenues and
expenditures for the General Fund, the Child Nutrition Fund and the Debt Service Fund for the fiscal year
beginning September 1. The Texas Education Code requires the budget to be prepared not later than August 20
and adopted by August 31 of each year. The Budgets are prepared on a basis of accounting that is used for
reporting in accordance with Generally Accepted Accounting Principles.
The District annually adopts legally authorized appropriated budgets for the General, Debt Service, and certain
Special Revenue funds.
The District’s administration performs budget reviews during the year by which budget requirements are re-
evaluated and revisions recommended to the Board. The Board may approve amendments to the budget, which
are required when a change is made to any one of the functional expenditure categories or revenue object
accounts defined by the TEA. Expenditures may not legally exceed budgeted appropriations, as amended, at
the function level by fund. Unexpended appropriations lapse at year-end.
The following procedures were followed in establishing the budgetary data reflected in the Fund Financial
Statements:
1. Prior to August 20 the District prepares a budget for the next succeeding fiscal year beginning
September 1. The operating budget includes proposed expenditures and the means of financing them.
2. A meeting of the Board is then called for the purpose of adopting the proposed budget. At least ten
days public notice of the meeting must be given.
3. Prior to September 1, the budget is legally enacted through passage of a resolution by the Board. Once
a budget is approved, it can only be amended at the function and fund level by approval of a majority
of the members of the Board. Amendments are presented to the Board at its regular meetings. Each
amendment must have Board approval. As required by law, such amendments are made before the
fact, are reflected in the official minutes of the Board, and are not made after fiscal year end. Because
the District has a policy of careful budgetary control, several amendments were necessary during the
year.
4. Each budget is controlled by the budget coordinator at the revenue and expenditure function/object
level. Budgeted amounts are amended by the Board. All budget appropriations lapse at year end.
During the fiscal year ended August 31, 2013 the District did not have any expenditures over appropriations on
all required legally adopted budgets.

77
COMPARATIVE STATEMENTS, COMBINING STATEMENTS
AND BUDGET COMPARISONS

78
THIS PAGE INTENTIONALLY LEFT BLANK
79
GENERAL FUND
The General Fund is used to account for all financial transactions not properly included in other funds.
The principal sources of revenues include local property taxes, state reimbursement for professional
salaries and other operating expenditures, and earnings on investments. Expenditures include all costs
associated with the daily operations of the schools.
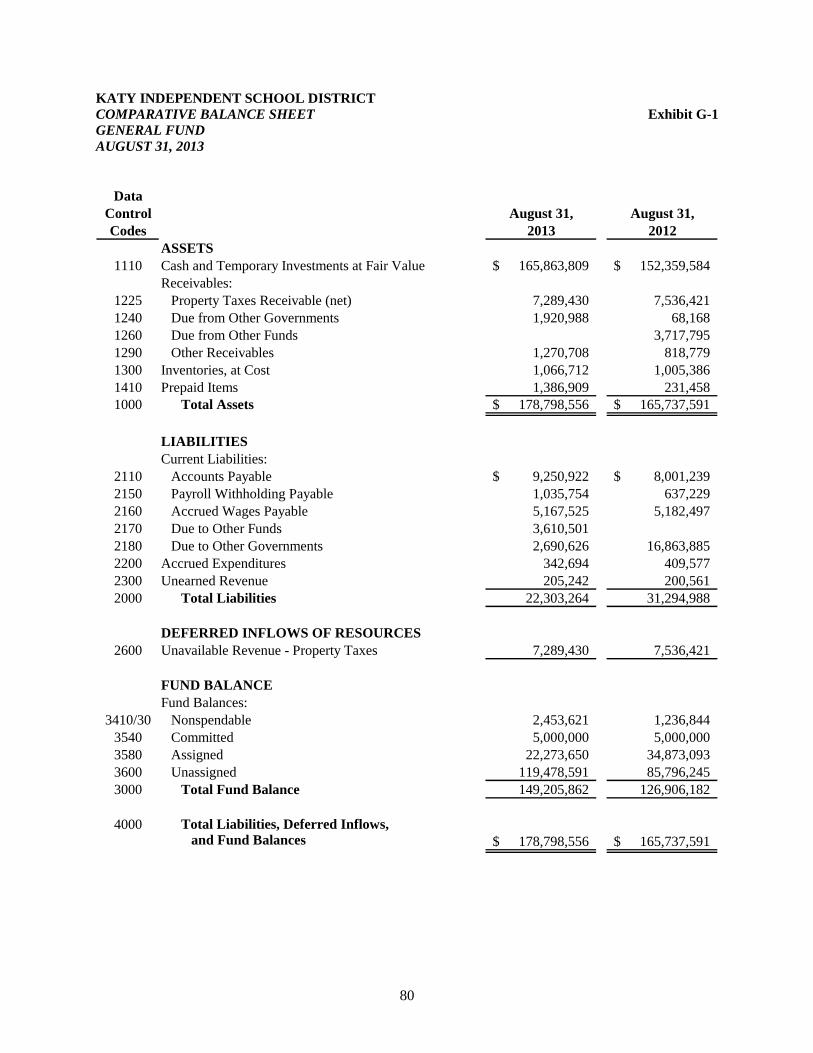
80
KATY INDEPENDENT SCHOOL DISTRICT
COMPARATIVE BALANCE SHEET Exhibit G-1
GENERAL FUND
AUGUST 31, 2013
Data
Control August 31, August 31,
Codes 2013 2012
ASSETS
1110 Cash and Temporary Investments at Fair Value 165,863,809$ 152,359,584$
Receivables:
1225 Property Taxes Receivable (net) 7,289,430 7,536,421
1240 Due from Other Governments 1,920,988 68,168
1260 Due from Other Funds 3,717,795
1290 Other Receivables 1,270,708 818,779
1300 Inventories, at Cost 1,066,712 1,005,386
1410 Prepaid Items 1,386,909 231,458
1000 Total Assets 178,798,556$ 165,737,591$
LIABILITIES
Current Liabilities:
2110 Accounts Payable 9,250,922$ 8,001,239$
2150 Payroll Withholding Payable 1,035,754 637,229
2160 Accrued Wages Payable 5,167,525 5,182,497
2170 Due to Other Funds 3,610,501
2180 Due to Other Governments 2,690,626 16,863,885
2200 Accrued Expenditures 342,694 409,577
2300 Unearned Revenue 205,242 200,561
2000 Total Liabilities 22,303,264 31,294,988
DEFERRED INFLOWS OF RESOURCES
2600 Unavailable Revenue - Property Taxes 7,289,430 7,536,421
FUND BALANCE
Fund Balances:
3410/30 Nonspendable 2,453,621 1,236,844
3540 Committed 5,000,000 5,000,000
3580 Assigned 22,273,650 34,873,093
3600 Unassigned 119,478,591 85,796,245
3000 Total Fund Balance 149,205,862 126,906,182
4000 Total Liabilities, Deferred Inflows,
and Fund Balances 178,798,556$ 165,737,591$
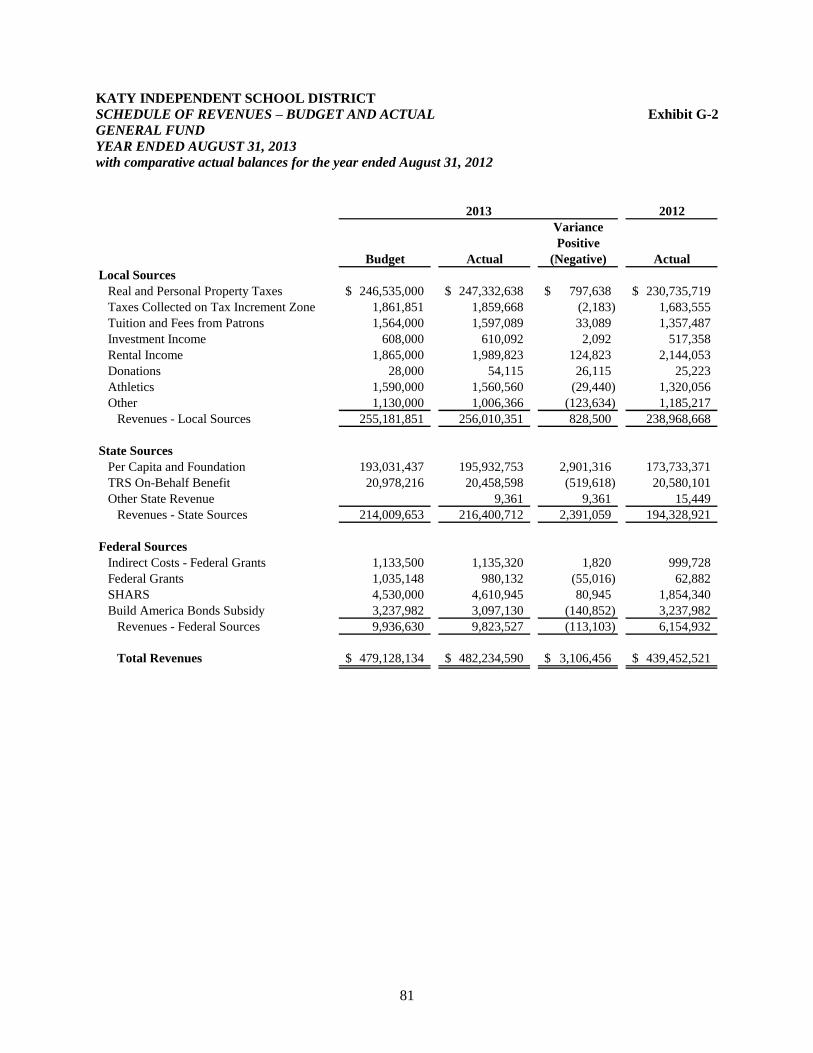
81
KATY INDEPENDENT SCHOOL DISTRICT
SCHEDULE OF REVENUES – BUDGET AND ACTUAL Exhibit G-2
GENERAL FUND
YEAR ENDED AUGUST 31, 2013
with comparative actual balances for the year ended August 31, 2012
2012
Variance
Positive
Budget Actual (Negative) Actual
Local Sources
Real and Personal Property Taxes 246,535,000$ 247,332,638$ 797,638$ 230,735,719$
Taxes Collected on Tax Increment Zone 1,861,851 1,859,668 (2,183) 1,683,555
Tuition and Fees from Patrons 1,564,000 1,597,089 33,089 1,357,487
Investment Income 608,000 610,092 2,092 517,358
Rental Income 1,865,000 1,989,823 124,823 2,144,053
Donations 28,000 54,115 26,115 25,223
Athletics 1,590,000 1,560,560 (29,440) 1,320,056
Other 1,130,000 1,006,366 (123,634) 1,185,217
Revenues - Local Sources 255,181,851 256,010,351 828,500 238,968,668
State Sources
Per Capita and Foundation 193,031,437 195,932,753 2,901,316 173,733,371
TRS On-Behalf Benefit 20,978,216 20,458,598 (519,618) 20,580,101
Other State Revenue 9,361 9,361 15,449
Revenues - State Sources 214,009,653 216,400,712 2,391,059 194,328,921
Federal Sources
Indirect Costs - Federal Grants 1,133,500 1,135,320 1,820 999,728
Federal Grants 1,035,148 980,132 (55,016) 62,882
SHARS 4,530,000 4,610,945 80,945 1,854,340
Build America Bonds Subsidy 3,237,982 3,097,130 (140,852) 3,237,982
Revenues - Federal Sources 9,936,630 9,823,527 (113,103) 6,154,932
Total Revenues 479,128,134$ 482,234,590$ 3,106,456$ 439,452,521$
2013
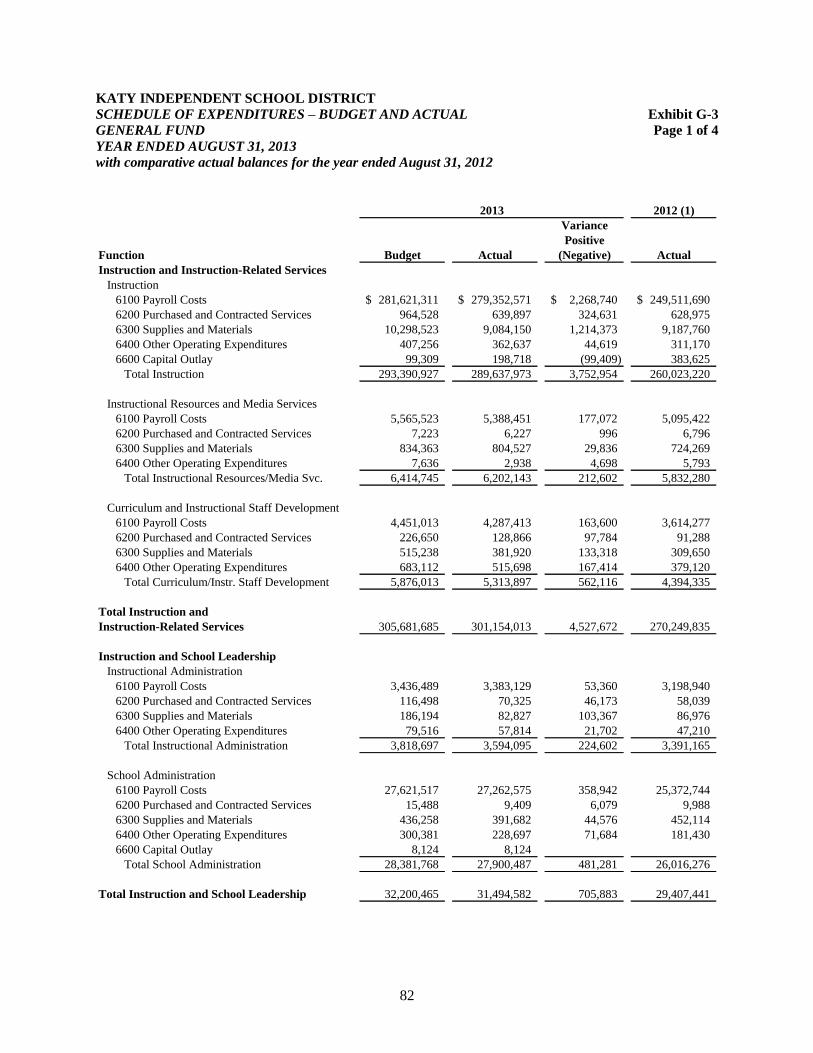
82
KATY INDEPENDENT SCHOOL DISTRICT
SCHEDULE OF EXPENDITURES – BUDGET AND ACTUAL Exhibit G-3
GENERAL FUND Page 1 of 4
YEAR ENDED AUGUST 31, 2013
with comparative actual balances for the year ended August 31, 2012
2012 (1)
Variance
Positive
Function Budget Actual (Negative) Actual
Instruction and Instruction-Related Services
Instruction
6100 Payroll Costs 281,621,311$ 279,352,571$ 2,268,740$ 249,511,690$
6200 Purchased and Contracted Services 964,528 639,897 324,631 628,975
6300 Supplies and Materials 10,298,523 9,084,150 1,214,373 9,187,760
6400 Other Operating Expenditures 407,256 362,637 44,619 311,170
6600 Capital Outlay 99,309 198,718 (99,409) 383,625
Total Instruction 293,390,927 289,637,973 3,752,954 260,023,220
Instructional Resources and Media Services
6100 Payroll Costs 5,565,523 5,388,451 177,072 5,095,422
6200 Purchased and Contracted Services 7,223 6,227 996 6,796
6300 Supplies and Materials 834,363 804,527 29,836 724,269
6400 Other Operating Expenditures 7,636 2,938 4,698 5,793
Total Instructional Resources/Media Svc. 6,414,745 6,202,143 212,602 5,832,280
Curriculum and Instructional Staff Development
6100 Payroll Costs 4,451,013 4,287,413 163,600 3,614,277
6200 Purchased and Contracted Services 226,650 128,866 97,784 91,288
6300 Supplies and Materials 515,238 381,920 133,318 309,650
6400 Other Operating Expenditures 683,112 515,698 167,414 379,120
Total Curriculum/Instr. Staff Development 5,876,013 5,313,897 562,116 4,394,335
Total Instruction and
Instruction-Related Services 305,681,685 301,154,013 4,527,672 270,249,835
Instruction and School Leadership
Instructional Administration
6100 Payroll Costs 3,436,489 3,383,129 53,360 3,198,940
6200 Purchased and Contracted Services 116,498 70,325 46,173 58,039
6300 Supplies and Materials 186,194 82,827 103,367 86,976
6400 Other Operating Expenditures 79,516 57,814 21,702 47,210
Total Instructional Administration 3,818,697 3,594,095 224,602 3,391,165
School Administration
6100 Payroll Costs 27,621,517 27,262,575 358,942 25,372,744
6200 Purchased and Contracted Services 15,488 9,409 6,079 9,988
6300 Supplies and Materials 436,258 391,682 44,576 452,114
6400 Other Operating Expenditures 300,381 228,697 71,684 181,430
6600 Capital Outlay 8,124 8,124
Total School Administration 28,381,768 27,900,487 481,281 26,016,276
Total Instruction and School Leadership 32,200,465 31,494,582 705,883 29,407,441
2013
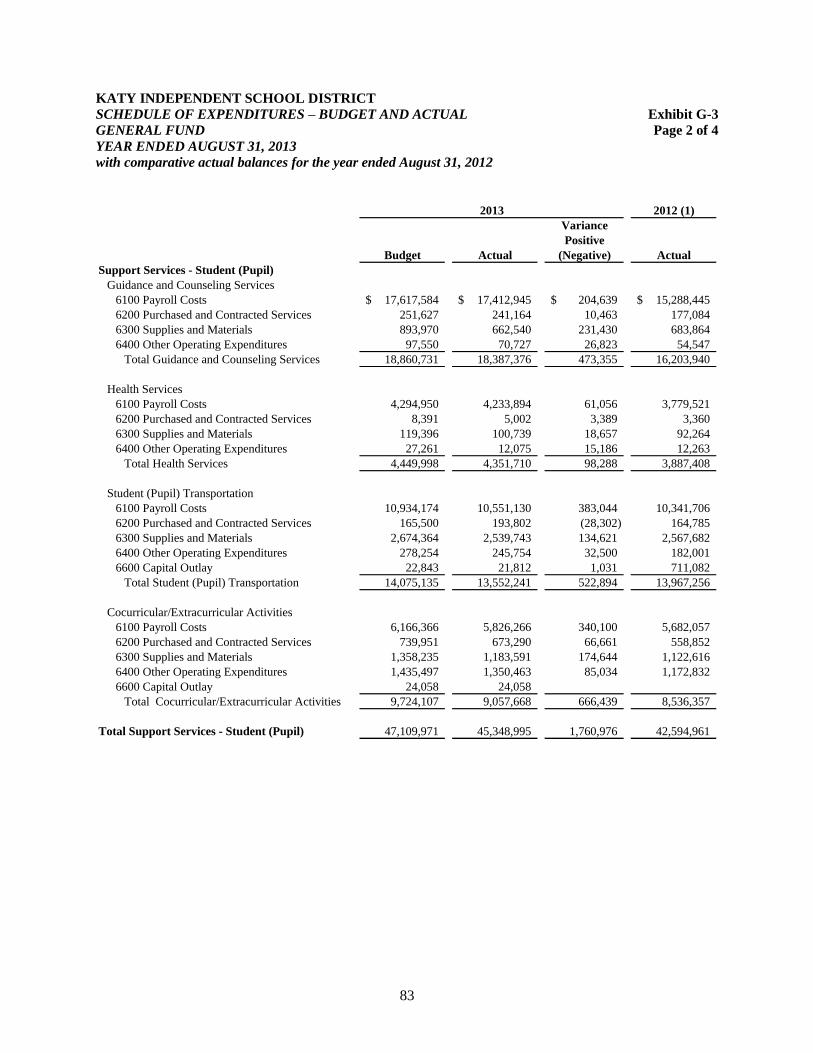
83
KATY INDEPENDENT SCHOOL DISTRICT
SCHEDULE OF EXPENDITURES – BUDGET AND ACTUAL Exhibit G-3
GENERAL FUND Page 2 of 4
YEAR ENDED AUGUST 31, 2013
with comparative actual balances for the year ended August 31, 2012
2012 (1)
Variance
Positive
Budget Actual (Negative) Actual
Support Services - Student (Pupil)
Guidance and Counseling Services
6100 Payroll Costs 17,617,584$ 17,412,945$ 204,639$ 15,288,445$
6200 Purchased and Contracted Services 251,627 241,164 10,463 177,084
6300 Supplies and Materials 893,970 662,540 231,430 683,864
6400 Other Operating Expenditures 97,550 70,727 26,823 54,547
Total Guidance and Counseling Services 18,860,731 18,387,376 473,355 16,203,940
Health Services
6100 Payroll Costs 4,294,950 4,233,894 61,056 3,779,521
6200 Purchased and Contracted Services 8,391 5,002 3,389 3,360
6300 Supplies and Materials 119,396 100,739 18,657 92,264
6400 Other Operating Expenditures 27,261 12,075 15,186 12,263
Total Health Services 4,449,998 4,351,710 98,288 3,887,408
Student (Pupil) Transportation
6100 Payroll Costs 10,934,174 10,551,130 383,044 10,341,706
6200 Purchased and Contracted Services 165,500 193,802 (28,302) 164,785
6300 Supplies and Materials 2,674,364 2,539,743 134,621 2,567,682
6400 Other Operating Expenditures 278,254 245,754 32,500 182,001
6600 Capital Outlay 22,843 21,812 1,031 711,082
Total Student (Pupil) Transportation 14,075,135 13,552,241 522,894 13,967,256
Cocurricular/Extracurricular Activities
6100 Payroll Costs 6,166,366 5,826,266 340,100 5,682,057
6200 Purchased and Contracted Services 739,951 673,290 66,661 558,852
6300 Supplies and Materials 1,358,235 1,183,591 174,644 1,122,616
6400 Other Operating Expenditures 1,435,497 1,350,463 85,034 1,172,832
6600 Capital Outlay 24,058 24,058
Total Cocurricular/Extracurricular Activities 9,724,107 9,057,668 666,439 8,536,357
Total Support Services - Student (Pupil) 47,109,971 45,348,995 1,760,976 42,594,961
2013
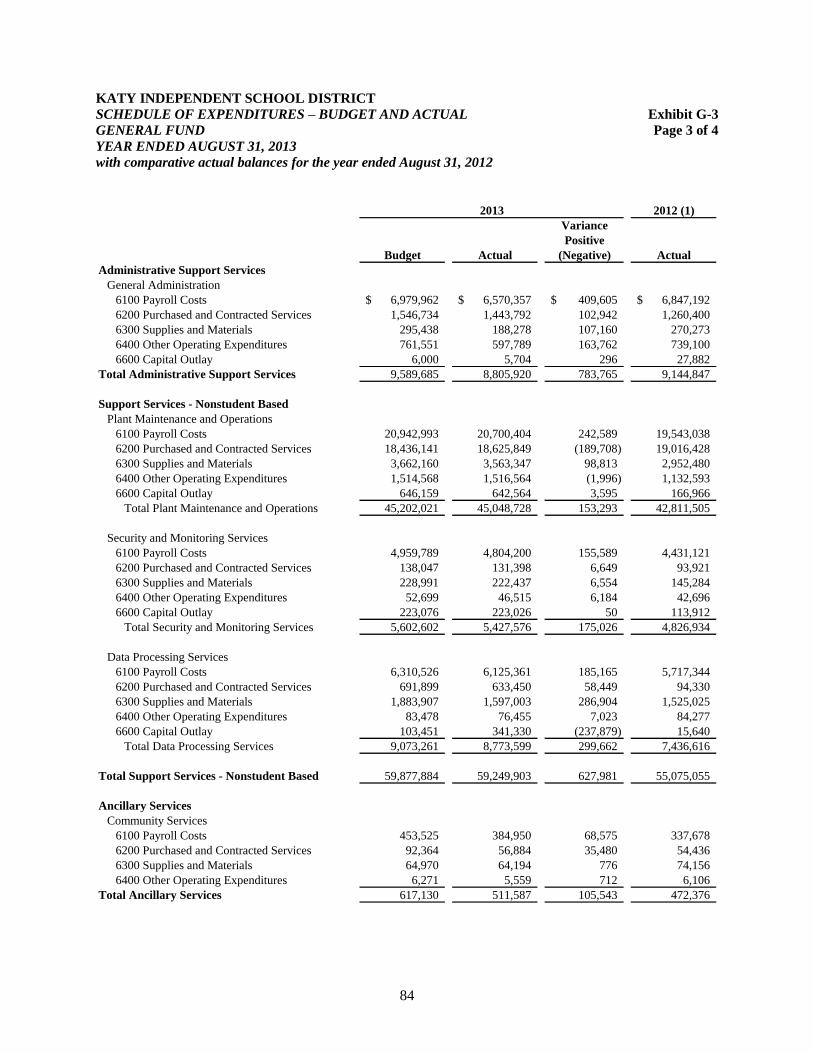
84
KATY INDEPENDENT SCHOOL DISTRICT
SCHEDULE OF EXPENDITURES – BUDGET AND ACTUAL Exhibit G-3
GENERAL FUND Page 3 of 4
YEAR ENDED AUGUST 31, 2013
with comparative actual balances for the year ended August 31, 2012
2012 (1)
Variance
Positive
Budget Actual (Negative) Actual
Administrative Support Services
General Administration
6100 Payroll Costs 6,979,962$ 6,570,357$ 409,605$ 6,847,192$
6200 Purchased and Contracted Services 1,546,734 1,443,792 102,942 1,260,400
6300 Supplies and Materials 295,438 188,278 107,160 270,273
6400 Other Operating Expenditures 761,551 597,789 163,762 739,100
6600 Capital Outlay 6,000 5,704 296 27,882
Total Administrative Support Services 9,589,685 8,805,920 783,765 9,144,847
Support Services - Nonstudent Based
Plant Maintenance and Operations
6100 Payroll Costs 20,942,993 20,700,404 242,589 19,543,038
6200 Purchased and Contracted Services 18,436,141 18,625,849 (189,708) 19,016,428
6300 Supplies and Materials 3,662,160 3,563,347 98,813 2,952,480
6400 Other Operating Expenditures 1,514,568 1,516,564 (1,996) 1,132,593
6600 Capital Outlay 646,159 642,564 3,595 166,966
Total Plant Maintenance and Operations 45,202,021 45,048,728 153,293 42,811,505
Security and Monitoring Services
6100 Payroll Costs 4,959,789 4,804,200 155,589 4,431,121
6200 Purchased and Contracted Services 138,047 131,398 6,649 93,921
6300 Supplies and Materials 228,991 222,437 6,554 145,284
6400 Other Operating Expenditures 52,699 46,515 6,184 42,696
6600 Capital Outlay 223,076 223,026 50 113,912
Total Security and Monitoring Services 5,602,602 5,427,576 175,026 4,826,934
Data Processing Services
6100 Payroll Costs 6,310,526 6,125,361 185,165 5,717,344
6200 Purchased and Contracted Services 691,899 633,450 58,449 94,330
6300 Supplies and Materials 1,883,907 1,597,003 286,904 1,525,025
6400 Other Operating Expenditures 83,478 76,455 7,023 84,277
6600 Capital Outlay 103,451 341,330 (237,879) 15,640
Total Data Processing Services 9,073,261 8,773,599 299,662 7,436,616
Total Support Services - Nonstudent Based 59,877,884 59,249,903 627,981 55,075,055
Ancillary Services
Community Services
6100 Payroll Costs 453,525 384,950 68,575 337,678
6200 Purchased and Contracted Services 92,364 56,884 35,480 54,436
6300 Supplies and Materials 64,970 64,194 776 74,156
6400 Other Operating Expenditures 6,271 5,559 712 6,106
Total Ancillary Services 617,130 511,587 105,543 472,376
2013
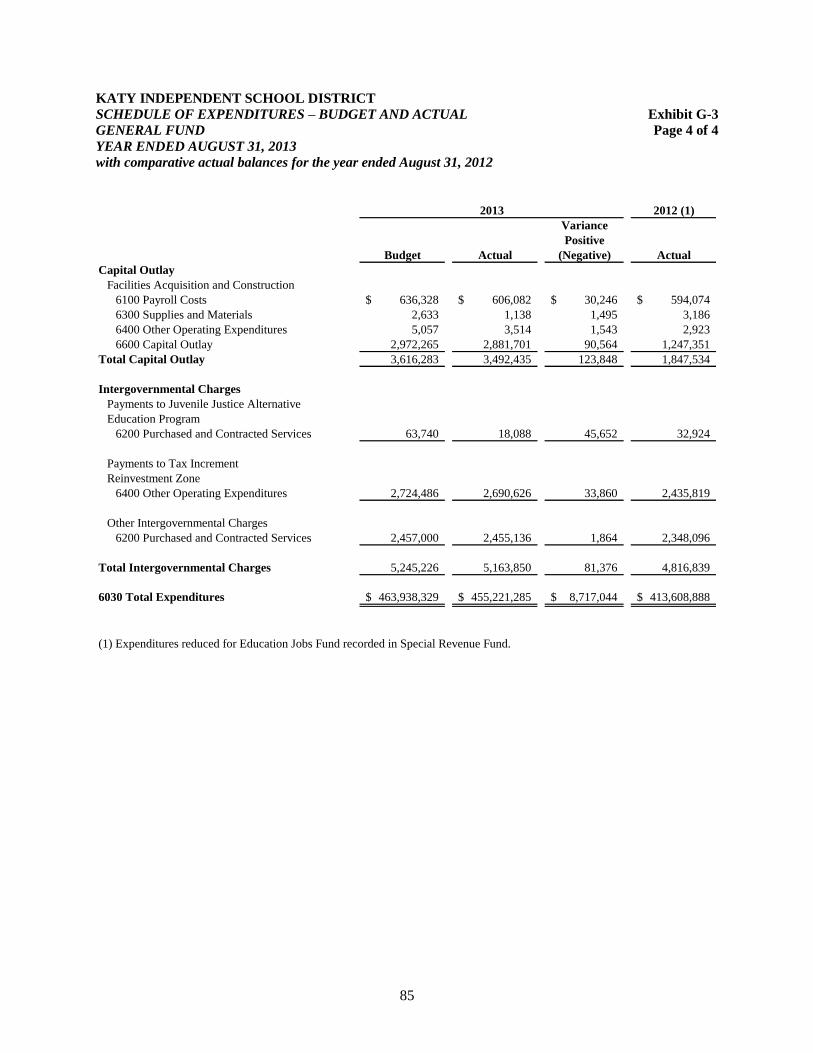
85
KATY INDEPENDENT SCHOOL DISTRICT
SCHEDULE OF EXPENDITURES – BUDGET AND ACTUAL Exhibit G-3
GENERAL FUND Page 4 of 4
YEAR ENDED AUGUST 31, 2013
with comparative actual balances for the year ended August 31, 2012
2012 (1)
Variance
Positive
Budget Actual (Negative) Actual
Capital Outlay
Facilities Acquisition and Construction
6100 Payroll Costs 636,328$ 606,082$ 30,246$ 594,074$
6300 Supplies and Materials 2,633 1,138 1,495 3,186
6400 Other Operating Expenditures 5,057 3,514 1,543 2,923
6600 Capital Outlay 2,972,265 2,881,701 90,564 1,247,351
Total Capital Outlay 3,616,283 3,492,435 123,848 1,847,534
Intergovernmental Charges
Payments to Juvenile Justice Alternative
Education Program
6200 Purchased and Contracted Services 63,740 18,088 45,652 32,924
Payments to Tax Increment
Reinvestment Zone
6400 Other Operating Expenditures 2,724,486 2,690,626 33,860 2,435,819
Other Intergovernmental Charges
6200 Purchased and Contracted Services 2,457,000 2,455,136 1,864 2,348,096
Total Intergovernmental Charges 5,245,226 5,163,850 81,376 4,816,839
6030 Total Expenditures 463,938,329$ 455,221,285$ 8,717,044$ 413,608,888$
(1) Expenditures reduced for Education Jobs Fund recorded in Special Revenue Fund.
2013

86
THIS PAGE INTENTIONALLY LEFT BLANK
87
DEBT SERVICE FUND
The Debt Service Fund is used to account for revenues from debt service taxes and earnings on
investments which are used for payment of interest and principal on the District’s bonded
indebtedness.

88
THIS PAGE INTENTIONALLY LEFT BLANK
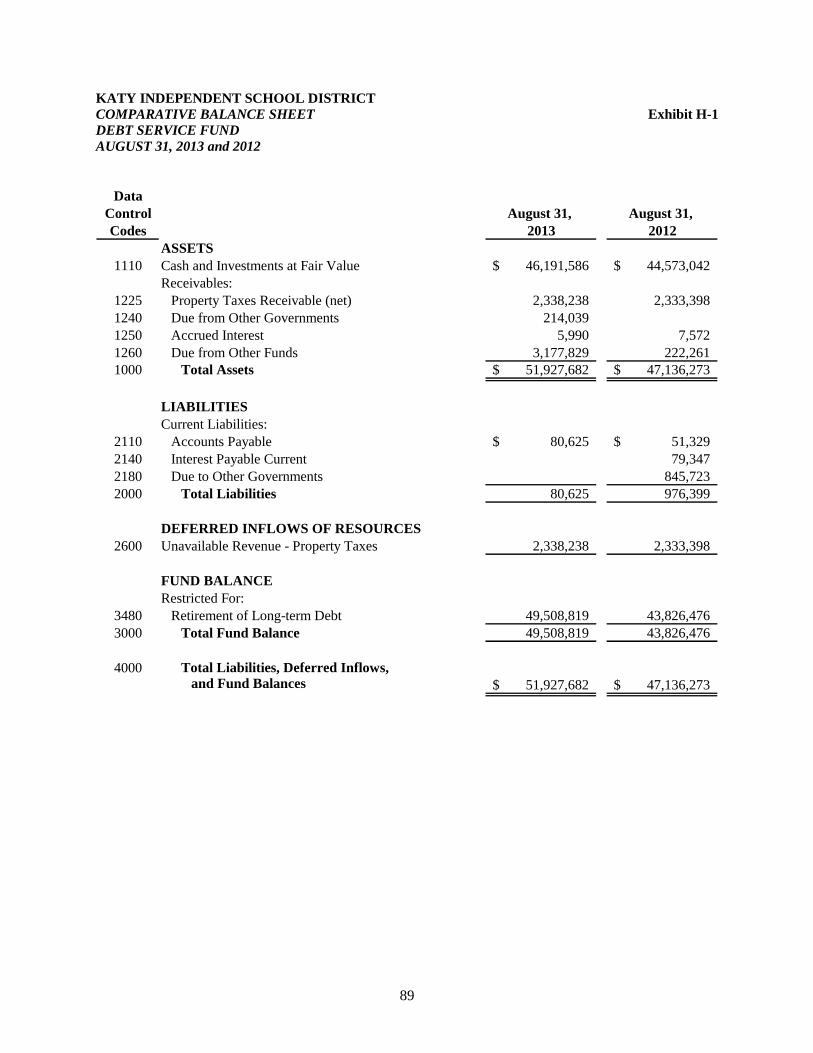
89
KATY INDEPENDENT SCHOOL DISTRICT
COMPARATIVE BALANCE SHEET Exhibit H-1
DEBT SERVICE FUND
AUGUST 31, 2013 and 2012
Data
Control August 31, August 31,
Codes 2013 2012
ASSETS
1110 Cash and Investments at Fair Value 46,191,586$ 44,573,042$
Receivables:
1225 Property Taxes Receivable (net) 2,338,238 2,333,398
1240 Due from Other Governments 214,039
1250 Accrued Interest 5,990 7,572
1260 Due from Other Funds 3,177,829 222,261
1000 Total Assets 51,927,682$ 47,136,273$
LIABILITIES
Current Liabilities:
2110 Accounts Payable 80,625$ 51,329$
2140 Interest Payable Current 79,347
2180 Due to Other Governments 845,723
2000 Total Liabilities 80,625 976,399
DEFERRED INFLOWS OF RESOURCES
2600 Unavailable Revenue - Property Taxes 2,338,238 2,333,398
FUND BALANCE
Restricted For:
3480 Retirement of Long-term Debt 49,508,819 43,826,476
3000 Total Fund Balance 49,508,819 43,826,476
4000 Total Liabilities, Deferred Inflows,
and Fund Balances 51,927,682$ 47,136,273$
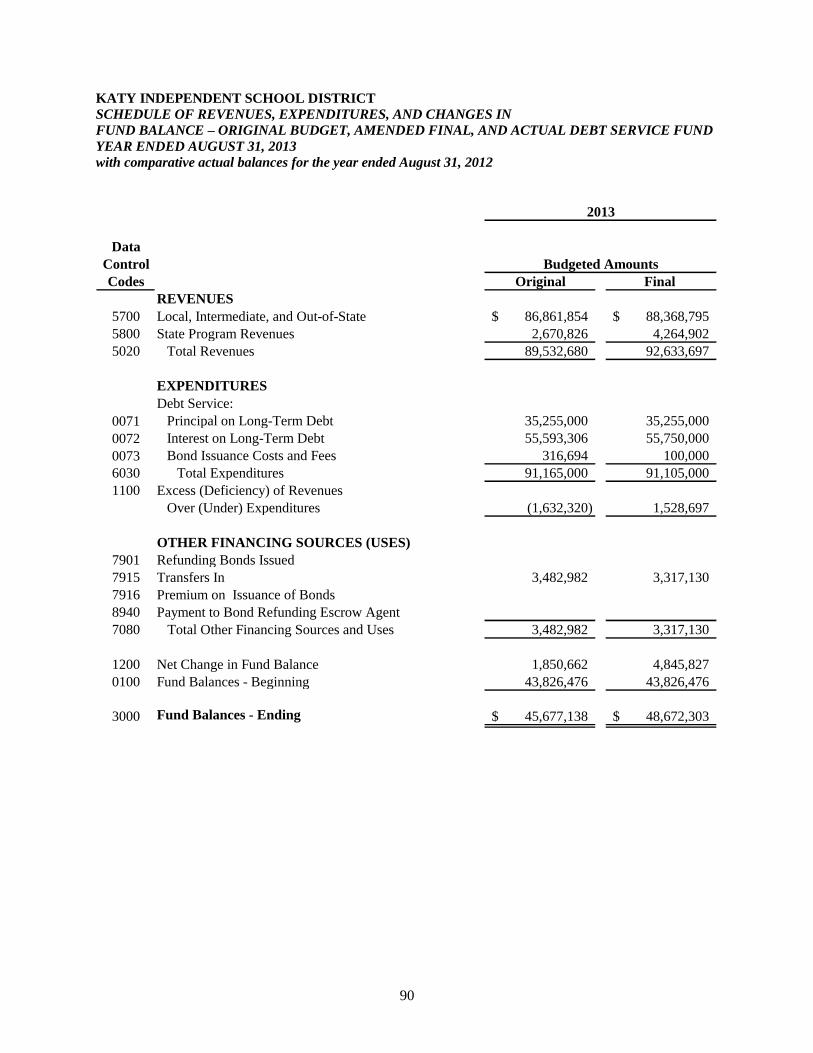
90
KATY INDEPENDENT SCHOOL DISTRICT
SCHEDULE OF REVENUES, EXPENDITURES, AND CHANGES IN
FUND BALANCE – ORIGINAL BUDGET, AMENDED FINAL, AND ACTUAL DEBT SERVICE FUND
YEAR ENDED AUGUST 31, 2013
with comparative actual balances for the year ended August 31, 2012
Data
Control
Codes Original Final
REVENUES
5700 Local, Intermediate, and Out-of-State 86,861,854$ 88,368,795$
5800 State Program Revenues 2,670,826 4,264,902
5020 Total Revenues 89,532,680 92,633,697
EXPENDITURES
Debt Service:
0071 Principal on Long-Term Debt 35,255,000 35,255,000
0072 Interest on Long-Term Debt 55,593,306 55,750,000
0073 Bond Issuance Costs and Fees 316,694 100,000
6030 Total Expenditures 91,165,000 91,105,000
1100 Excess (Deficiency) of Revenues
Over (Under) Expenditures (1,632,320) 1,528,697
OTHER FINANCING SOURCES (USES)
7901 Refunding Bonds Issued
7915 Transfers In 3,482,982 3,317,130
7916 Premium on Issuance of Bonds
8940 Payment to Bond Refunding Escrow Agent
7080 Total Other Financing Sources and Uses 3,482,982 3,317,130
1200 Net Change in Fund Balance 1,850,662 4,845,827
0100 Fund Balances - Beginning 43,826,476 43,826,476
3000 Fund Balances - Ending 45,677,138$ 48,672,303$
Budgeted Amounts
2013
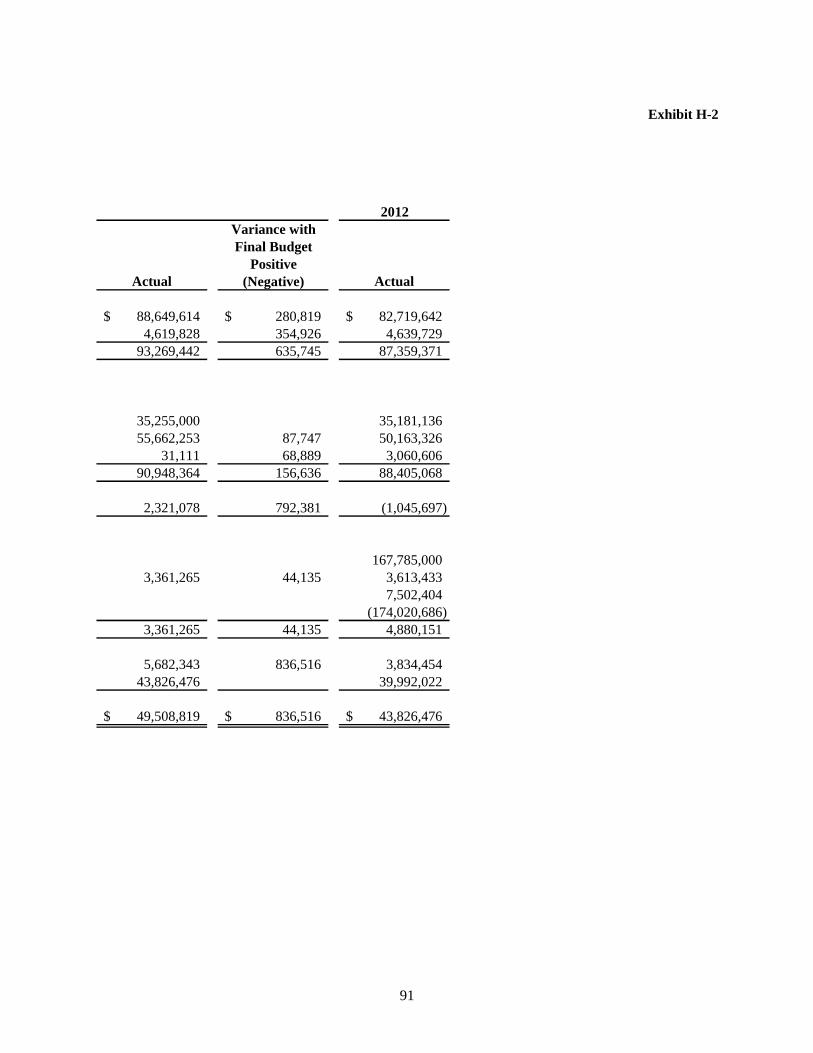
91
Exhibit H-2
2012
Variance with
Final Budget
Positive
Actual (Negative) Actual
88,649,614$ 280,819$ 82,719,642$
4,619,828 354,926 4,639,729
93,269,442 635,745 87,359,371
35,255,000 35,181,136
55,662,253 87,747 50,163,326
31,111 68,889 3,060,606
90,948,364 156,636 88,405,068
2,321,078 792,381 (1,045,697)
167,785,000
3,361,265 44,135 3,613,433
7,502,404
(174,020,686)
3,361,265 44,135 4,880,151
5,682,343 836,516 3,834,454
43,826,476 39,992,022
49,508,819$ 836,516$ 43,826,476$
92
THIS PAGE INTENTIONALLY LEFT BLANK
93
CAPITAL PROJECTS FUND
The Capital Projects Fund is used to account for proceeds from the sale of general obligation bonds and
the expenditures of these funds for the construction and equipping of new school facilities, to purchase
school sites, and the renovation or repair of present facilities.
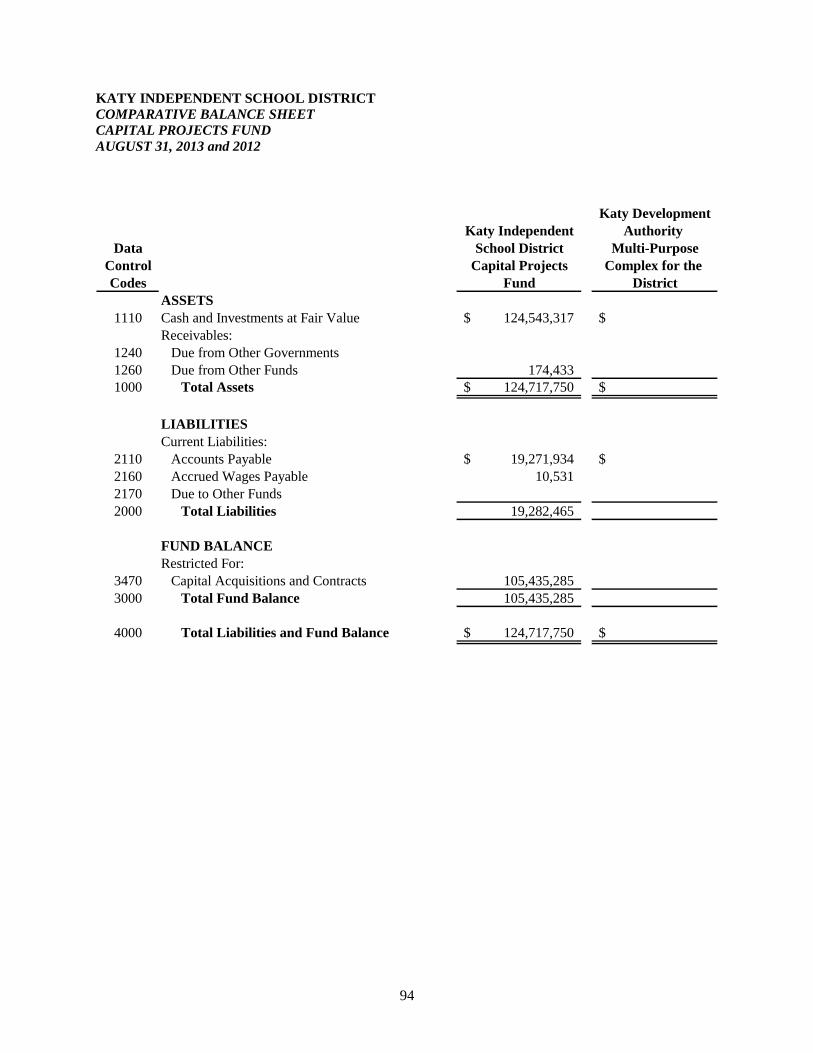
94
KATY INDEPENDENT SCHOOL DISTRICT
COMPARATIVE BALANCE SHEET
CAPITAL PROJECTS FUND
AUGUST 31, 2013 and 2012
Katy Development
Katy Independent Authority
Data School District Multi-Purpose
Control Capital Projects Complex for the
Codes Fund District
ASSETS
1110 Cash and Investments at Fair Value 124,543,317$ $
Receivables:
1240 Due from Other Governments
1260 Due from Other Funds 174,433
1000 Total Assets 124,717,750$ $
LIABILITIES
Current Liabilities:
2110 Accounts Payable 19,271,934$ $
2160 Accrued Wages Payable 10,531
2170 Due to Other Funds
2000 Total Liabilities 19,282,465
FUND BALANCE
Restricted For:
3470 Capital Acquisitions and Contracts 105,435,285
3000 Total Fund Balance 105,435,285
4000 Total Liabilities and Fund Balance 124,717,750$ $
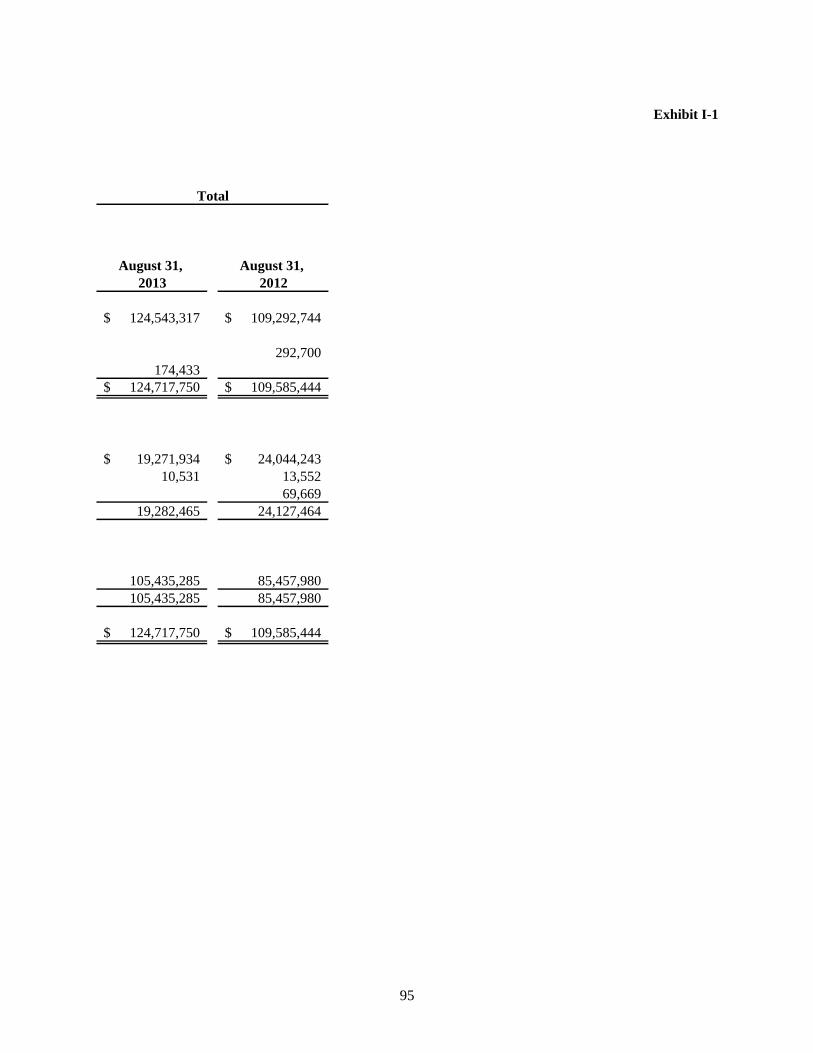
95
Exhibit I-1
August 31, August 31,
2013 2012
124,543,317$ 109,292,744$
292,700
174,433
124,717,750$ 109,585,444$
19,271,934$ 24,044,243$
10,531 13,552
69,669
19,282,465 24,127,464
105,435,285 85,457,980
105,435,285 85,457,980
124,717,750$ 109,585,444$
Total
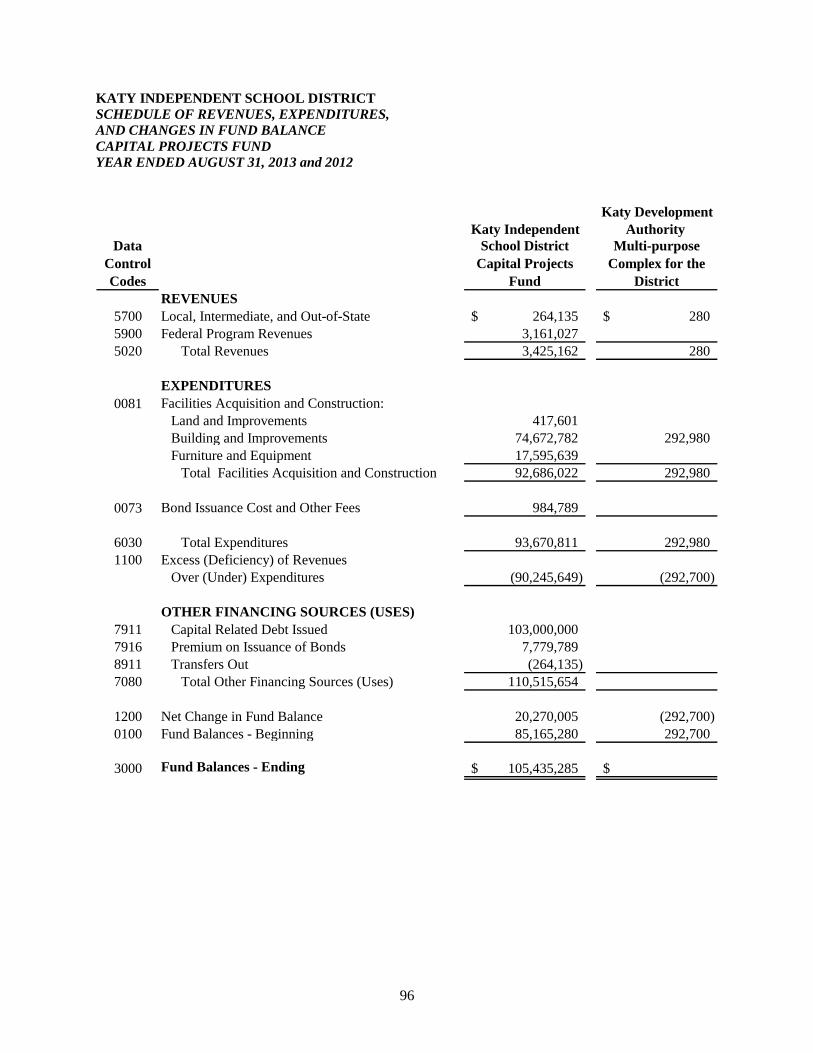
96
KATY INDEPENDENT SCHOOL DISTRICT
SCHEDULE OF REVENUES, EXPENDITURES,
AND CHANGES IN FUND BALANCE
CAPITAL PROJECTS FUND
YEAR ENDED AUGUST 31, 2013 and 2012
Katy Development
Katy Independent Authority
Data
Control
Codes
School District
Capital Projects
Fund
Multi-purpose
Complex for the
District
REVENUES
5700 Local, Intermediate, and Out-of-State 264,135$ 280$
5900 Federal Program Revenues 3,161,027
5020 Total Revenues 3,425,162 280
EXPENDITURES
0081 Facilities Acquisition and Construction:
Land and Improvements 417,601
Building and Improvements 74,672,782 292,980
Furniture and Equipment 17,595,639
Total Facilities Acquisition and Construction 92,686,022 292,980
0073 Bond Issuance Cost and Other Fees 984,789
6030 Total Expenditures 93,670,811 292,980
1100 Excess (Deficiency) of Revenues
Over (Under) Expenditures (90,245,649) (292,700)
OTHER FINANCING SOURCES (USES)
7911 Capital Related Debt Issued 103,000,000
7916 Premium on Issuance of Bonds 7,779,789
8911 Transfers Out (264,135)
7080 Total Other Financing Sources (Uses) 110,515,654
1200 Net Change in Fund Balance 20,270,005 (292,700)
0100 Fund Balances - Beginning 85,165,280 292,700
3000 Fund Balances - Ending 105,435,285$ $
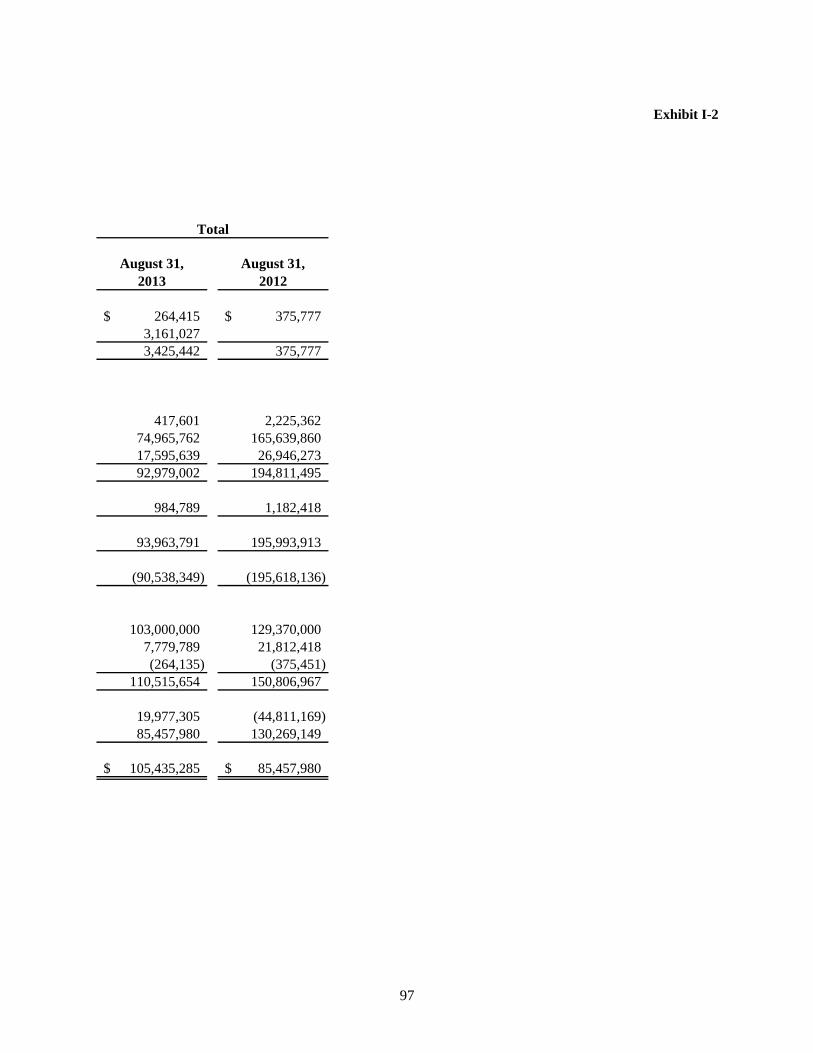
97
Exhibit I-2
August 31,
2013
August 31,
2012
264,415$ 375,777$
3,161,027
3,425,442 375,777
417,601 2,225,362
74,965,762 165,639,860
17,595,639 26,946,273
92,979,002 194,811,495
984,789 1,182,418
93,963,791 195,993,913
(90,538,349) (195,618,136)
103,000,000 129,370,000
7,779,789 21,812,418
(264,135) (375,451)
110,515,654 150,806,967
19,977,305 (44,811,169)
85,457,980 130,269,149
105,435,285$ 85,457,980$
Total

98
THIS PAGE INTENTIONALLY LEFT BLANK
99
NONMAJOR GOVERNMENTAL FUNDS
SPECIAL REVENUE FUNDS
Special Revenue Funds are used to account for financial resources restricted to or designated for specific
purposes by a grantor. Specifically, this type of fund is used to account for the District’s Food Service
program, including local and federal revenue sources for state and federally financed programs (grants)
where unused balances are returned to the grantor at the close of specified project periods, and other
revenue specific programs.
100
Special Revenue Fund Program Descriptions
Elementary and Secondary Education Act (ESEA) Title I, Part A – Improving Basic Programs - Funds are used on identified campuses to enable schools to provide opportunities for children served
to acquire the knowledge and skills contained in the challenging State content standards and to meet
the challenging State performance standards developed for all children.
Individuals with Disabilities Education Act (IDEA), Part B – Formula - Funds are used to operate
educational programs for children with disabilities. This fund also includes capacity building and
improvement (sliver) subgrants.
Individuals with Disabilities Education Act (IDEA), Part B - Preschool - Funds are used for
preschool children with disabilities.
Nutrition and Food Services - Funds are used to account for allowable expenditures, as determined
under the National School Lunch Act, for the operation and improvement of the Child Nutrition
Programs.
Vocational Education, Carl Perkins Basic Grant - Funds are used to provide instruction related to
career and technology education and to develop new and/or improve career and technology education
programs for paid and unpaid employment.
Elementary and Secondary Education Act (ESEA) Title II, Part A - Teacher and Principal Training and Recruiting – Funds are used to increase student academic achievement through
improving teacher and principal quality and increasing the number of highly qualified teachers in
classrooms and highly qualified principals and assistant principals in schools.
Elementary and Secondary Education Act (ESEA) Title III, Part A – LEP and Immigrant - Funds are used to improve the education of limited English proficient children by assisting the
children to learn English and meet challenging State academic content and student academic
achievement standards.
Medicaid Administrative Claiming Program – Funds are used for reimbursement of eligible
administrative costs for activities attributed to the implementation of the Medicaid state plan.
Summer School Program for LEP Students in Kindergarten and First Grade – Funds are used
for reimbursement of summer school costs for Limited English Proficient Students in Kindergarten
and First Grade.
Early Childhood Intervention - Funds are used to identify and provide needed intervention services
for children from birth to age 3 who are developmentally delayed or appear to be at risk for
developmental delay.
Individuals with Disabilities Education Act (IDEA), Part B-Discretionary Deaf, SSA - Funds are
used to support an education service center basic special education component and also targeted
support to LEAs, Regional Day School Programs for the Deaf, private residential placements, priority
projects, and other emerging needs.
Individuals with Disabilities Education Act (IDEA), Part B-Formula Deaf, SSA - Funds are used
to operate educational programs for children with disabilities. This fund also includes capacity
building and improvement (sliver) subgrants.
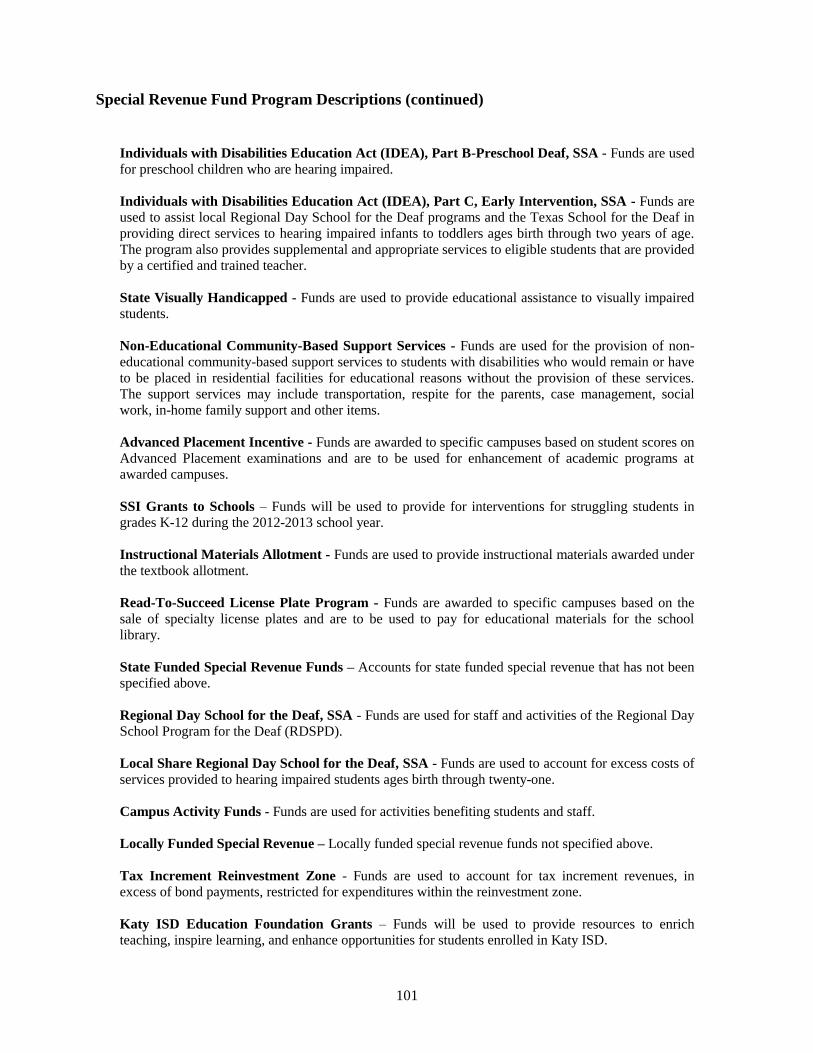
101
Special Revenue Fund Program Descriptions (continued)
Individuals with Disabilities Education Act (IDEA), Part B-Preschool Deaf, SSA - Funds are used
for preschool children who are hearing impaired.
Individuals with Disabilities Education Act (IDEA), Part C, Early Intervention, SSA - Funds are
used to assist local Regional Day School for the Deaf programs and the Texas School for the Deaf in
providing direct services to hearing impaired infants to toddlers ages birth through two years of age.
The program also provides supplemental and appropriate services to eligible students that are provided
by a certified and trained teacher.
State Visually Handicapped - Funds are used to provide educational assistance to visually impaired
students.
Non-Educational Community-Based Support Services - Funds are used for the provision of non-
educational community-based support services to students with disabilities who would remain or have
to be placed in residential facilities for educational reasons without the provision of these services.
The support services may include transportation, respite for the parents, case management, social
work, in-home family support and other items.
Advanced Placement Incentive - Funds are awarded to specific campuses based on student scores on
Advanced Placement examinations and are to be used for enhancement of academic programs at
awarded campuses.
SSI Grants to Schools – Funds will be used to provide for interventions for struggling students in
grades K-12 during the 2012-2013 school year.
Instructional Materials Allotment - Funds are used to provide instructional materials awarded under
the textbook allotment.
Read-To-Succeed License Plate Program - Funds are awarded to specific campuses based on the
sale of specialty license plates and are to be used to pay for educational materials for the school
library.
State Funded Special Revenue Funds – Accounts for state funded special revenue that has not been
specified above.
Regional Day School for the Deaf, SSA - Funds are used for staff and activities of the Regional Day
School Program for the Deaf (RDSPD).
Local Share Regional Day School for the Deaf, SSA - Funds are used to account for excess costs of
services provided to hearing impaired students ages birth through twenty-one.
Campus Activity Funds - Funds are used for activities benefiting students and staff.
Locally Funded Special Revenue – Locally funded special revenue funds not specified above.
Tax Increment Reinvestment Zone - Funds are used to account for tax increment revenues, in
excess of bond payments, restricted for expenditures within the reinvestment zone.
Katy ISD Education Foundation Grants – Funds will be used to provide resources to enrich
teaching, inspire learning, and enhance opportunities for students enrolled in Katy ISD.
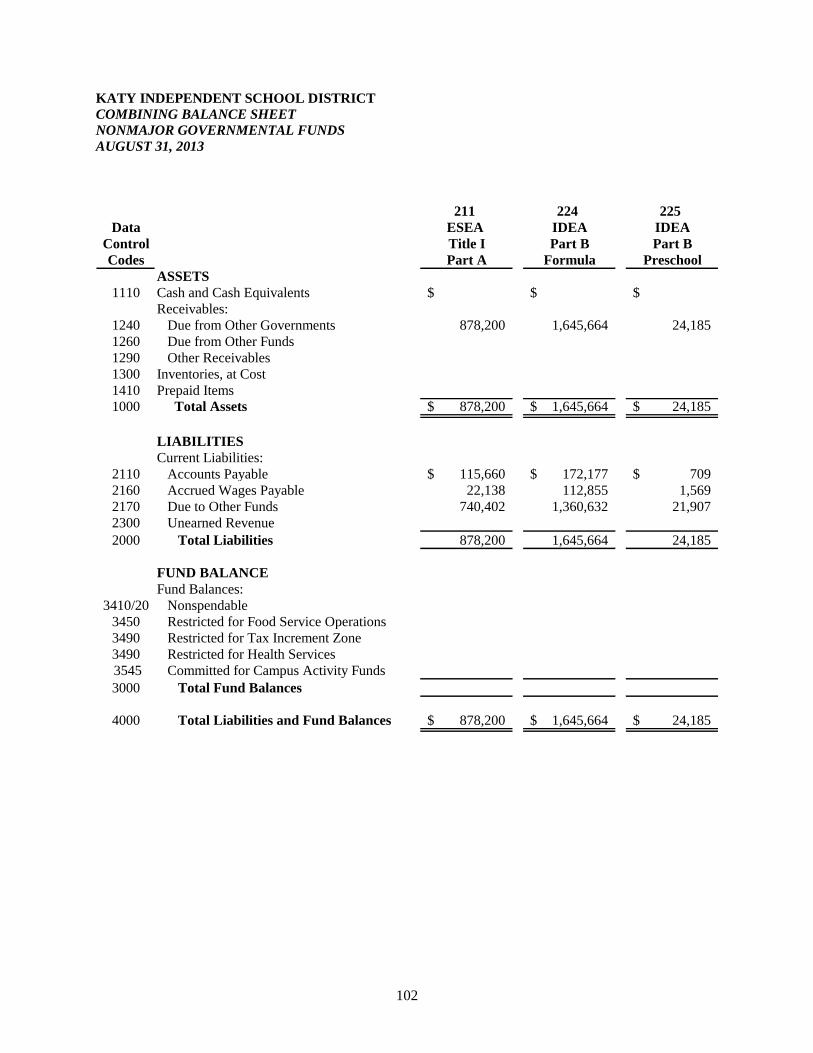
102
KATY INDEPENDENT SCHOOL DISTRICT
COMBINING BALANCE SHEET
NONMAJOR GOVERNMENTAL FUNDS
AUGUST 31, 2013
211 224 225
Data ESEA IDEA IDEA
Control Title I Part B Part B
Codes Part A Formula Preschool
ASSETS
1110 Cash and Cash Equivalents $ $ $
Receivables:
1240 Due from Other Governments 878,200 1,645,664 24,185
1260 Due from Other Funds
1290 Other Receivables
1300 Inventories, at Cost
1410 Prepaid Items
1000 Total Assets 878,200$ 1,645,664$ 24,185$
LIABILITIES
Current Liabilities:
2110 Accounts Payable 115,660$ 172,177$ 709$
2160 Accrued Wages Payable 22,138 112,855 1,569
2170 Due to Other Funds 740,402 1,360,632 21,907
2300 Unearned Revenue
2000 Total Liabilities 878,200 1,645,664 24,185
FUND BALANCE
Fund Balances:
3410/20 Nonspendable
3450 Restricted for Food Service Operations
3490 Restricted for Tax Increment Zone
3490 Restricted for Health Services
3545 Committed for Campus Activity Funds
3000 Total Fund Balances
4000 Total Liabilities and Fund Balances 878,200$ 1,645,664$ 24,185$
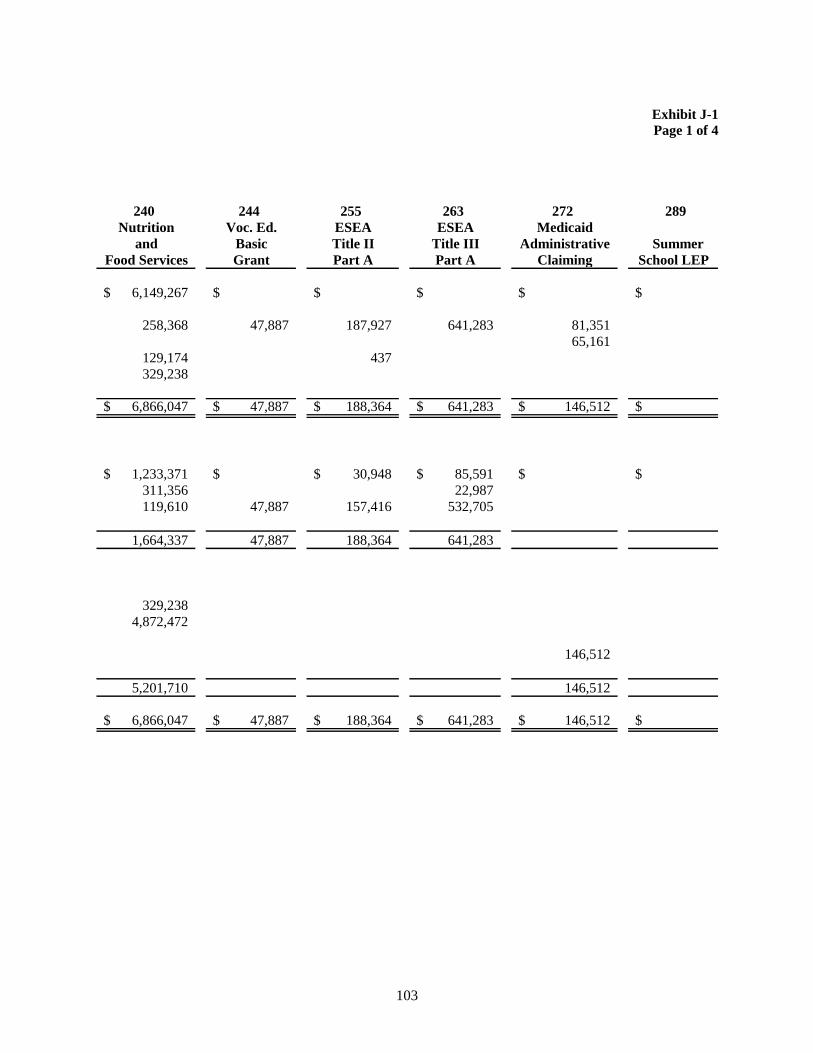
103
Exhibit J-1
Page 1 of 4
240 244 255 263 272 289
Nutrition Voc. Ed. ESEA ESEA Medicaid
and Basic Title II Title III Administrative Summer
Food Services Grant Part A Part A Claiming School LEP
6,149,267$ $ $ $ $ $
258,368 47,887 187,927 641,283 81,351
65,161
129,174 437
329,238
6,866,047$ 47,887$ 188,364$ 641,283$ 146,512$ $
1,233,371$ $ 30,948$ 85,591$ $ $
311,356 22,987
119,610 47,887 157,416 532,705
1,664,337 47,887 188,364 641,283
329,238
4,872,472
146,512
5,201,710 146,512
6,866,047$ 47,887$ 188,364$ 641,283$ 146,512$ $
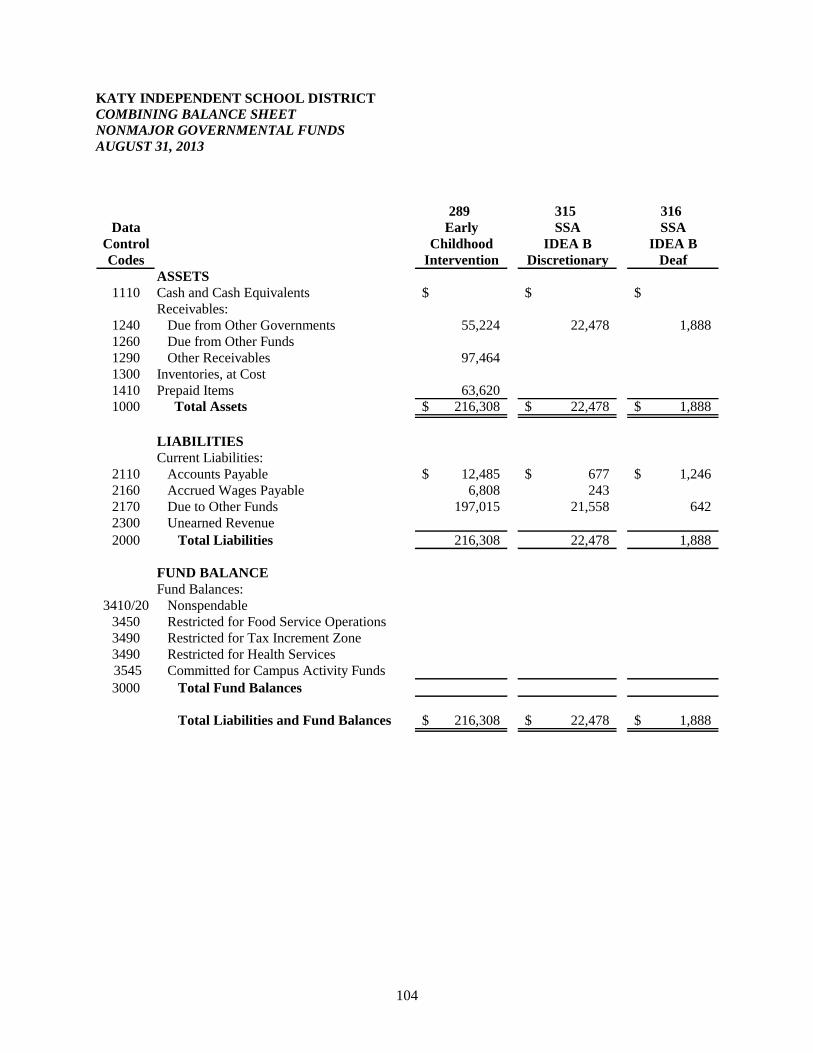
104
KATY INDEPENDENT SCHOOL DISTRICT
COMBINING BALANCE SHEET
NONMAJOR GOVERNMENTAL FUNDS
AUGUST 31, 2013
289 315 316
Data Early SSA SSA
Control Childhood IDEA B IDEA B
Codes Intervention Discretionary Deaf
ASSETS
1110 Cash and Cash Equivalents $ $ $
Receivables:
1240 Due from Other Governments 55,224 22,478 1,888
1260 Due from Other Funds
1290 Other Receivables 97,464
1300 Inventories, at Cost
1410 Prepaid Items 63,620
1000 Total Assets 216,308$ 22,478$ 1,888$
LIABILITIES
Current Liabilities:
2110 Accounts Payable 12,485$ 677$ 1,246$
2160 Accrued Wages Payable 6,808 243
2170 Due to Other Funds 197,015 21,558 642
2300 Unearned Revenue
2000 Total Liabilities 216,308 22,478 1,888
FUND BALANCE
Fund Balances:
3410/20 Nonspendable
3450 Restricted for Food Service Operations
3490 Restricted for Tax Increment Zone
3490 Restricted for Health Services
3545 Committed for Campus Activity Funds
3000 Total Fund Balances
Total Liabilities and Fund Balances 216,308$ 22,478$ 1,888$
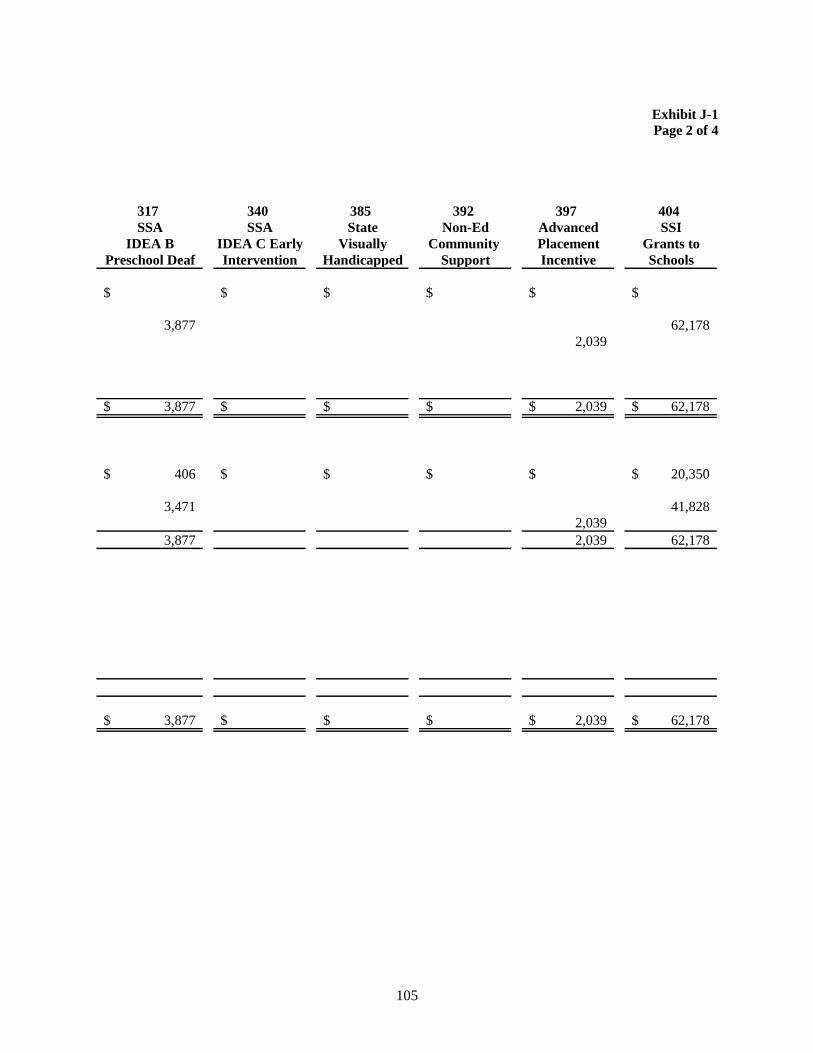
105
Exhibit J-1
Page 2 of 4
317 340 385 392 397 404
SSA SSA State Non-Ed Advanced SSI
IDEA B IDEA C Early Visually Community Placement Grants to
Preschool Deaf Intervention Handicapped Support Incentive Schools
$ $ $ $ $ $
3,877 62,178
2,039
3,877$ $ $ $ 2,039$ 62,178$
406$ $ $ $ $ 20,350$
3,471 41,828
2,039
3,877 2,039 62,178
3,877$ $ $ $ 2,039$ 62,178$
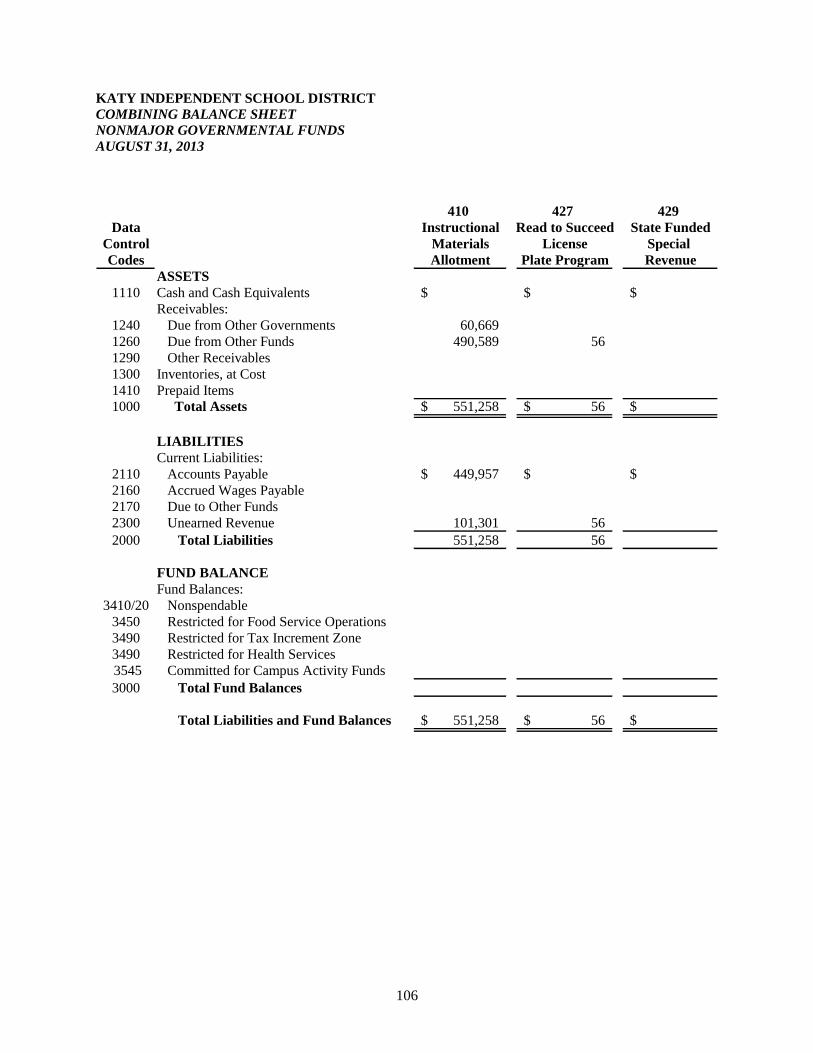
106
KATY INDEPENDENT SCHOOL DISTRICT
COMBINING BALANCE SHEET
NONMAJOR GOVERNMENTAL FUNDS
AUGUST 31, 2013
410 427 429
Data Instructional Read to Succeed State Funded
Control Materials License Special
Codes Allotment Plate Program Revenue
ASSETS
1110 Cash and Cash Equivalents $ $ $
Receivables:
1240 Due from Other Governments 60,669
1260 Due from Other Funds 490,589 56
1290 Other Receivables
1300 Inventories, at Cost
1410 Prepaid Items
1000 Total Assets 551,258$ 56$ $
LIABILITIES
Current Liabilities:
2110 Accounts Payable 449,957$ $ $
2160 Accrued Wages Payable
2170 Due to Other Funds
2300 Unearned Revenue 101,301 56
2000 Total Liabilities 551,258 56
FUND BALANCE
Fund Balances:
3410/20 Nonspendable
3450 Restricted for Food Service Operations
3490 Restricted for Tax Increment Zone
3490 Restricted for Health Services
3545 Committed for Campus Activity Funds
3000 Total Fund Balances
Total Liabilities and Fund Balances 551,258$ 56$ $
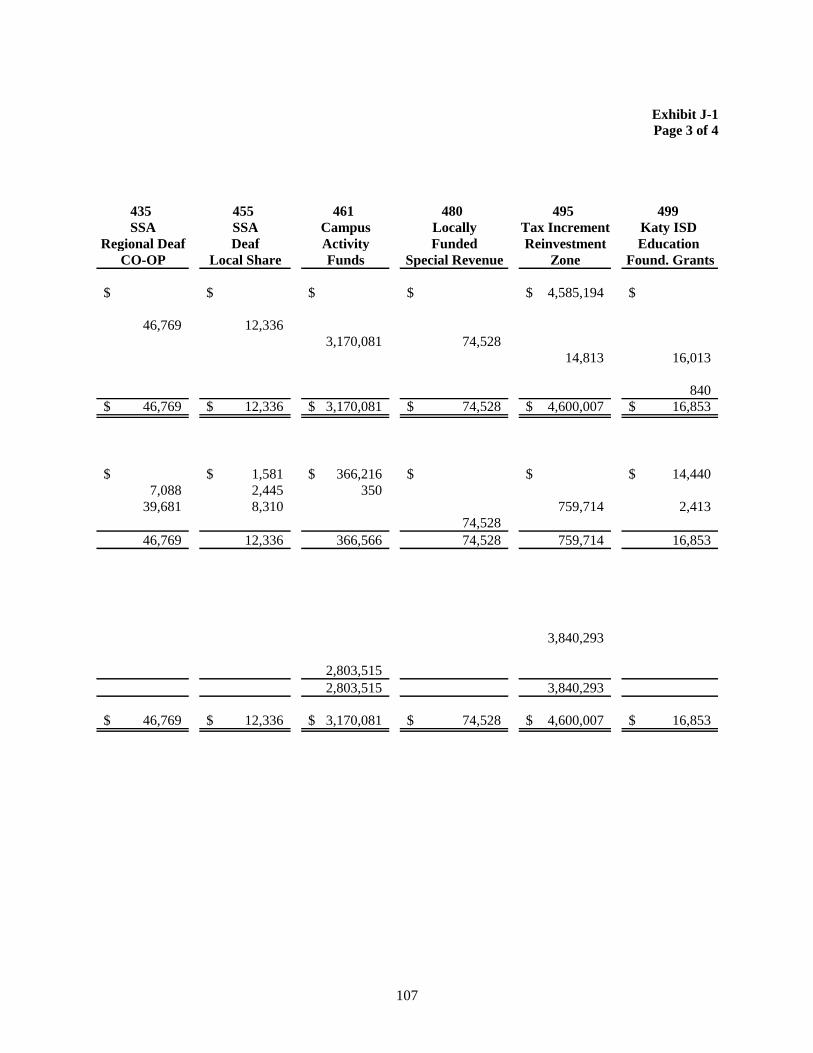
107
Exhibit J-1
Page 3 of 4
435 455 461 480 495 499
SSA SSA Campus Locally Tax Increment Katy ISD
Regional Deaf Deaf Activity Funded Reinvestment Education
CO-OP Local Share Funds Special Revenue Zone Found. Grants
$ $ $ $ 4,585,194$ $
46,769 12,336
3,170,081 74,528
14,813 16,013
840
46,769$ 12,336$ 3,170,081$ 74,528$ 4,600,007$ 16,853$
$ 1,581$ 366,216$ $ $ 14,440$
7,088 2,445 350
39,681 8,310 759,714 2,413
74,528
46,769 12,336 366,566 74,528 759,714 16,853
3,840,293
2,803,515
2,803,515 3,840,293
46,769$ 12,336$ 3,170,081$ 74,528$ 4,600,007$ 16,853$
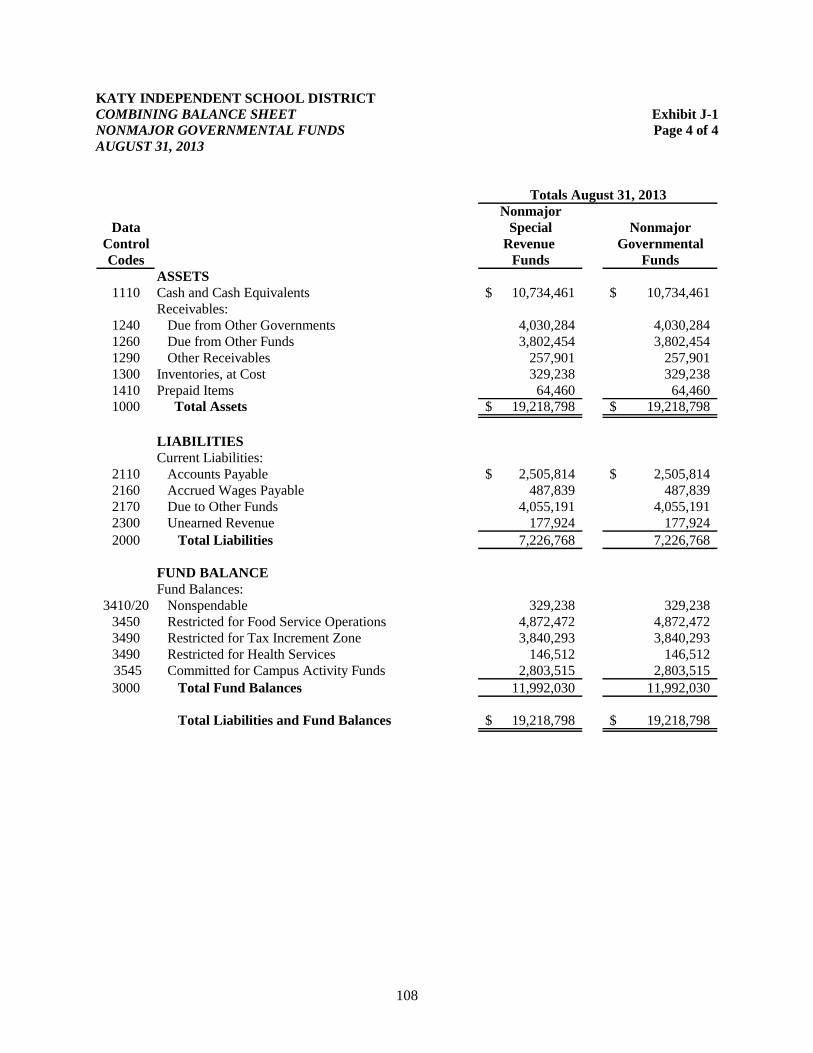
108
KATY INDEPENDENT SCHOOL DISTRICT
COMBINING BALANCE SHEET Exhibit J-1
NONMAJOR GOVERNMENTAL FUNDS Page 4 of 4
AUGUST 31, 2013
Nonmajor
Data Special Nonmajor
Control Revenue Governmental
Codes Funds Funds
ASSETS
1110 Cash and Cash Equivalents 10,734,461$ 10,734,461$
Receivables:
1240 Due from Other Governments 4,030,284 4,030,284
1260 Due from Other Funds 3,802,454 3,802,454
1290 Other Receivables 257,901 257,901
1300 Inventories, at Cost 329,238 329,238
1410 Prepaid Items 64,460 64,460
1000 Total Assets 19,218,798$ 19,218,798$
LIABILITIES
Current Liabilities:
2110 Accounts Payable 2,505,814$ 2,505,814$
2160 Accrued Wages Payable 487,839 487,839
2170 Due to Other Funds 4,055,191 4,055,191
2300 Unearned Revenue 177,924 177,924
2000 Total Liabilities 7,226,768 7,226,768
FUND BALANCE
Fund Balances:
3410/20 Nonspendable 329,238 329,238
3450 Restricted for Food Service Operations 4,872,472 4,872,472
3490 Restricted for Tax Increment Zone 3,840,293 3,840,293
3490 Restricted for Health Services 146,512 146,512
3545 Committed for Campus Activity Funds 2,803,515 2,803,515
3000 Total Fund Balances 11,992,030 11,992,030
Total Liabilities and Fund Balances 19,218,798$ 19,218,798$
Totals August 31, 2013

109
THIS PAGE INTENTIONALLY LEFT BLANK
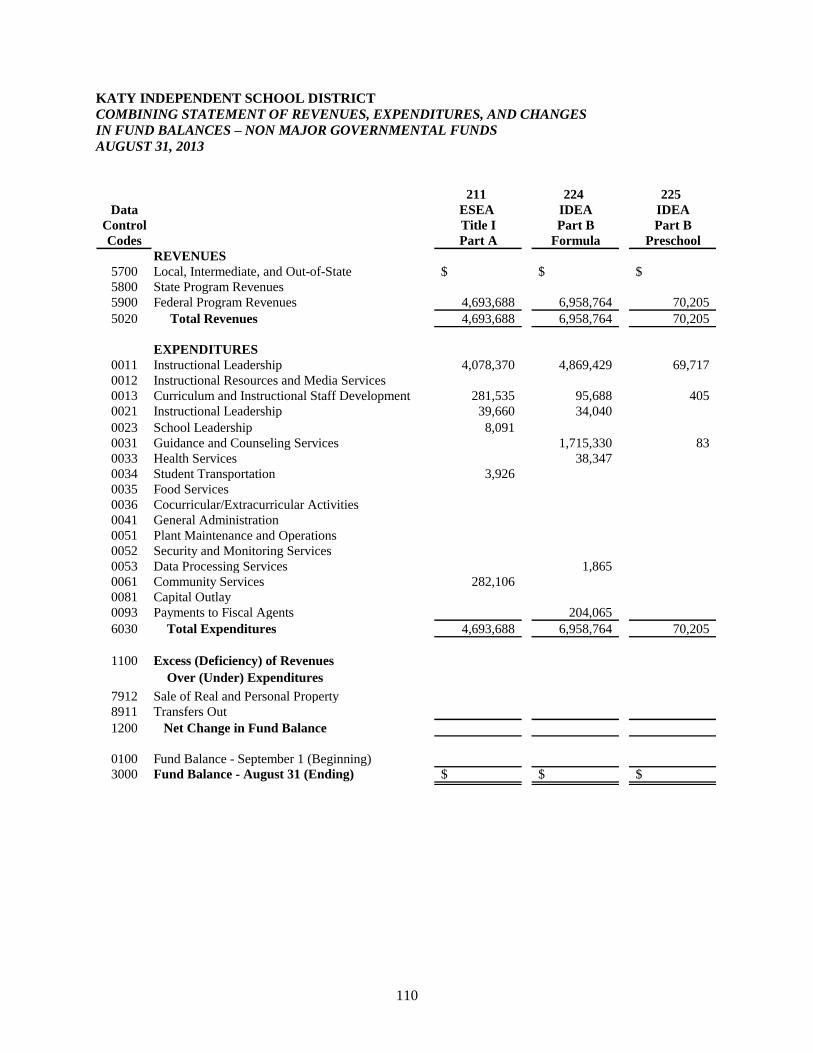
110
KATY INDEPENDENT SCHOOL DISTRICT
COMBINING STATEMENT OF REVENUES, EXPENDITURES, AND CHANGES
IN FUND BALANCES – NON MAJOR GOVERNMENTAL FUNDS
AUGUST 31, 2013
211 224 225
Data ESEA IDEA IDEA
Control Title I Part B Part B
Codes Part A Formula Preschool
REVENUES
5700 Local, Intermediate, and Out-of-State $ $ $
5800 State Program Revenues
5900 Federal Program Revenues 4,693,688 6,958,764 70,205
5020 Total Revenues 4,693,688 6,958,764 70,205
EXPENDITURES
0011 Instructional Leadership 4,078,370 4,869,429 69,717
0012 Instructional Resources and Media Services
0013 Curriculum and Instructional Staff Development 281,535 95,688 405
0021 Instructional Leadership 39,660 34,040
0023 School Leadership 8,091
0031 Guidance and Counseling Services 1,715,330 83
0033 Health Services 38,347
0034 Student Transportation 3,926
0035 Food Services
0036 Cocurricular/Extracurricular Activities
0041 General Administration
0051 Plant Maintenance and Operations
0052 Security and Monitoring Services
0053 Data Processing Services 1,865
0061 Community Services 282,106
0081 Capital Outlay
0093 Payments to Fiscal Agents 204,065
6030 Total Expenditures 4,693,688 6,958,764 70,205
1100 Excess (Deficiency) of Revenues
Over (Under) Expenditures
7912 Sale of Real and Personal Property
8911 Transfers Out
1200 Net Change in Fund Balance
0100 Fund Balance - September 1 (Beginning)
3000 Fund Balance - August 31 (Ending) $ $ $
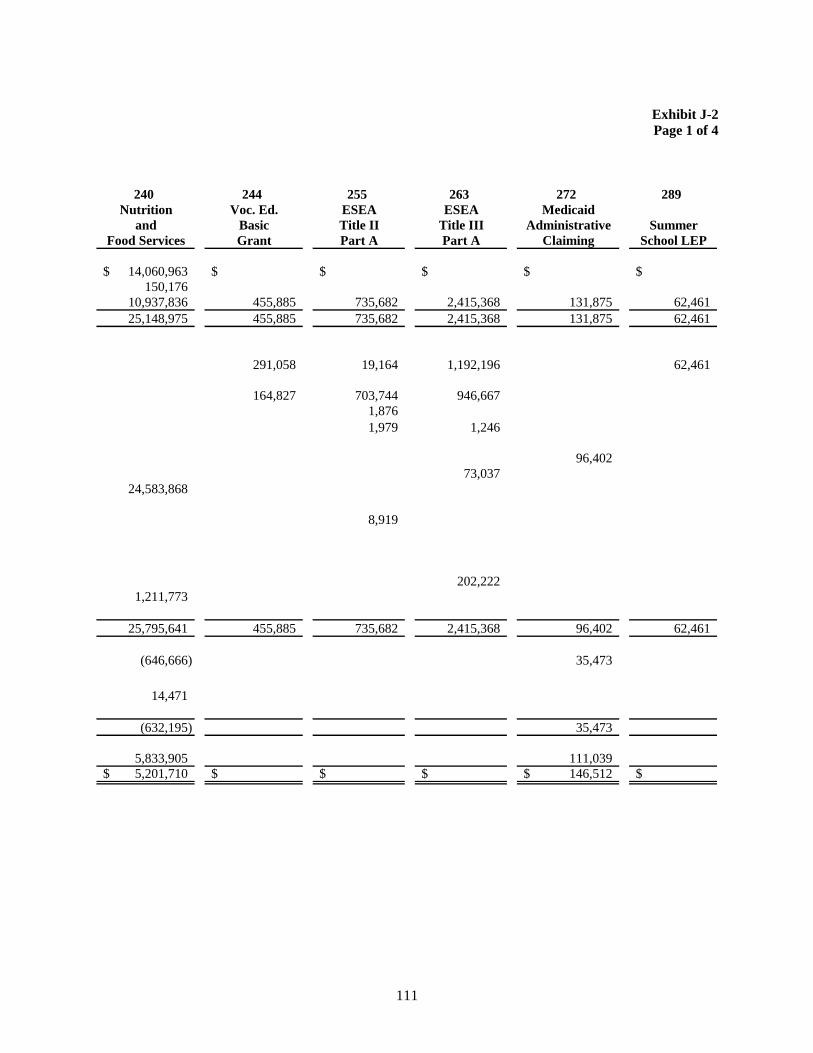
111
Exhibit J-2
Page 1 of 4
240 244 255 263 272 289
Nutrition Voc. Ed. ESEA ESEA Medicaid
and Basic Title II Title III Administrative Summer
Food Services Grant Part A Part A Claiming School LEP
14,060,963$ $ $ $ $ $
150,176
10,937,836 455,885 735,682 2,415,368 131,875 62,461
25,148,975 455,885 735,682 2,415,368 131,875 62,461
291,058 19,164 1,192,196 62,461
164,827 703,744 946,667
1,876
1,979 1,246
96,402
73,037
24,583,868
8,919
202,222
1,211,773
25,795,641 455,885 735,682 2,415,368 96,402 62,461
(646,666) 35,473
14,471
(632,195) 35,473
5,833,905 111,039
5,201,710$ $ $ $ 146,512$ $
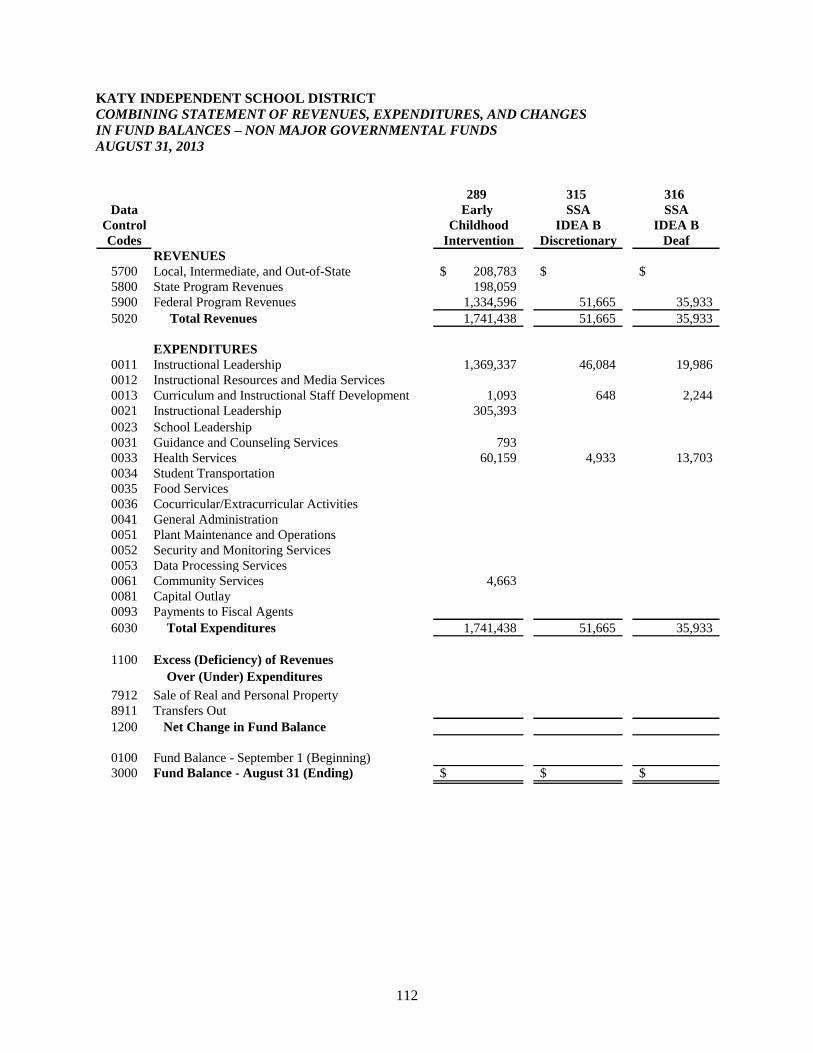
112
KATY INDEPENDENT SCHOOL DISTRICT
COMBINING STATEMENT OF REVENUES, EXPENDITURES, AND CHANGES
IN FUND BALANCES – NON MAJOR GOVERNMENTAL FUNDS
AUGUST 31, 2013
289 315 316
Data Early SSA SSA
Control Childhood IDEA B IDEA B
Codes Intervention Discretionary Deaf
REVENUES
5700 Local, Intermediate, and Out-of-State 208,783$ $ $
5800 State Program Revenues 198,059
5900 Federal Program Revenues 1,334,596 51,665 35,933
5020 Total Revenues 1,741,438 51,665 35,933
EXPENDITURES
0011 Instructional Leadership 1,369,337 46,084 19,986
0012 Instructional Resources and Media Services
0013 Curriculum and Instructional Staff Development 1,093 648 2,244
0021 Instructional Leadership 305,393
0023 School Leadership
0031 Guidance and Counseling Services 793
0033 Health Services 60,159 4,933 13,703
0034 Student Transportation
0035 Food Services
0036 Cocurricular/Extracurricular Activities
0041 General Administration
0051 Plant Maintenance and Operations
0052 Security and Monitoring Services
0053 Data Processing Services
0061 Community Services 4,663
0081 Capital Outlay
0093 Payments to Fiscal Agents
6030 Total Expenditures 1,741,438 51,665 35,933
1100 Excess (Deficiency) of Revenues
Over (Under) Expenditures
7912 Sale of Real and Personal Property
8911 Transfers Out
1200 Net Change in Fund Balance
0100 Fund Balance - September 1 (Beginning)
3000 Fund Balance - August 31 (Ending) $ $ $
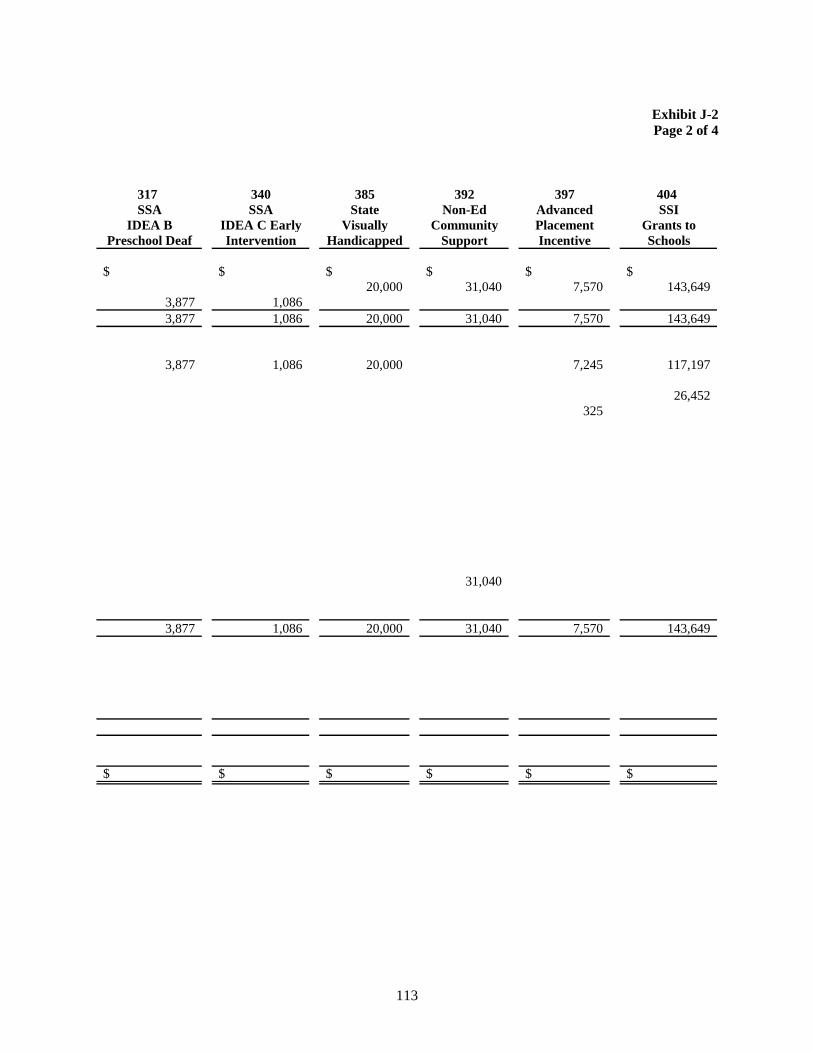
113
Exhibit J-2
Page 2 of 4
317 340 385 392 397 404
SSA SSA State Non-Ed Advanced SSI
IDEA B IDEA C Early Visually Community Placement Grants to
Preschool Deaf Intervention Handicapped Support Incentive Schools
$ $ $ $ $ $
20,000 31,040 7,570 143,649
3,877 1,086
3,877 1,086 20,000 31,040 7,570 143,649
3,877 1,086 20,000 7,245 117,197
26,452
325
31,040
3,877 1,086 20,000 31,040 7,570 143,649
$ $ $ $ $ $
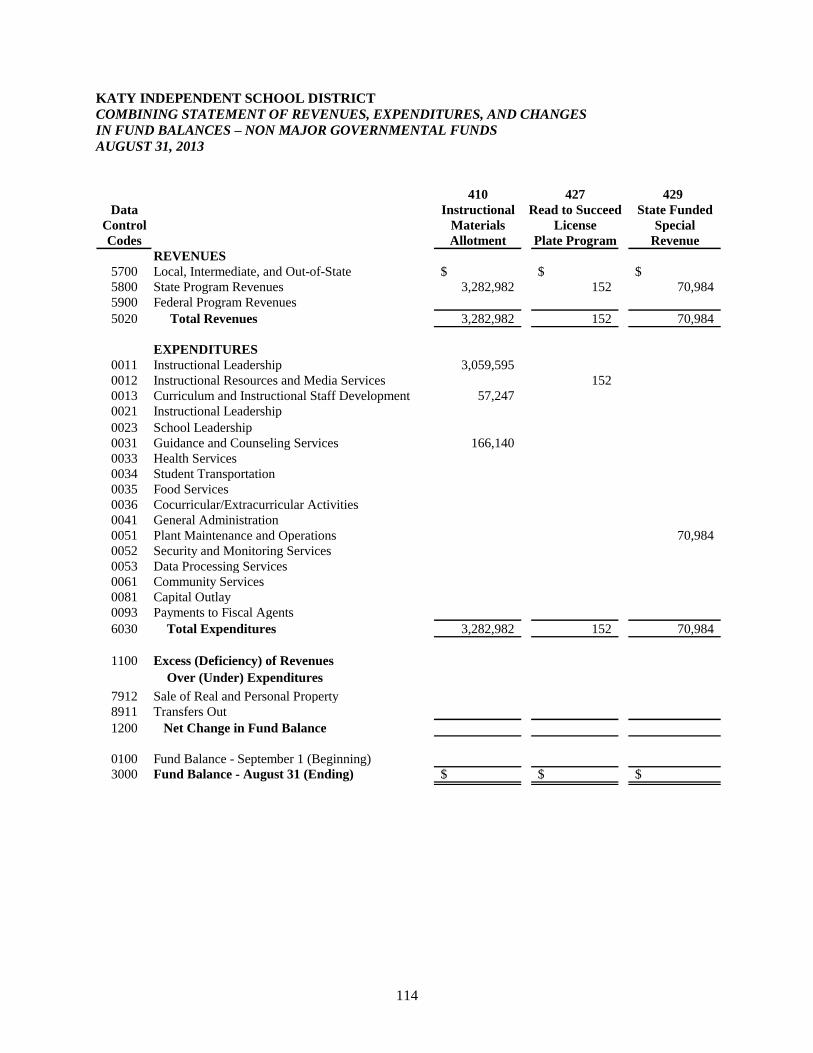
114
KATY INDEPENDENT SCHOOL DISTRICT
COMBINING STATEMENT OF REVENUES, EXPENDITURES, AND CHANGES
IN FUND BALANCES – NON MAJOR GOVERNMENTAL FUNDS
AUGUST 31, 2013
410 427 429
Data Instructional Read to Succeed State Funded
Control Materials License Special
Codes Allotment Plate Program Revenue
REVENUES
5700 Local, Intermediate, and Out-of-State $ $ $
5800 State Program Revenues 3,282,982 152 70,984
5900 Federal Program Revenues
5020 Total Revenues 3,282,982 152 70,984
EXPENDITURES
0011 Instructional Leadership 3,059,595
0012 Instructional Resources and Media Services 152
0013 Curriculum and Instructional Staff Development 57,247
0021 Instructional Leadership
0023 School Leadership
0031 Guidance and Counseling Services 166,140
0033 Health Services
0034 Student Transportation
0035 Food Services
0036 Cocurricular/Extracurricular Activities
0041 General Administration
0051 Plant Maintenance and Operations 70,984
0052 Security and Monitoring Services
0053 Data Processing Services
0061 Community Services
0081 Capital Outlay
0093 Payments to Fiscal Agents
6030 Total Expenditures 3,282,982 152 70,984
1100 Excess (Deficiency) of Revenues
Over (Under) Expenditures
7912 Sale of Real and Personal Property
8911 Transfers Out
1200 Net Change in Fund Balance
0100 Fund Balance - September 1 (Beginning)
3000 Fund Balance - August 31 (Ending) $ $ $
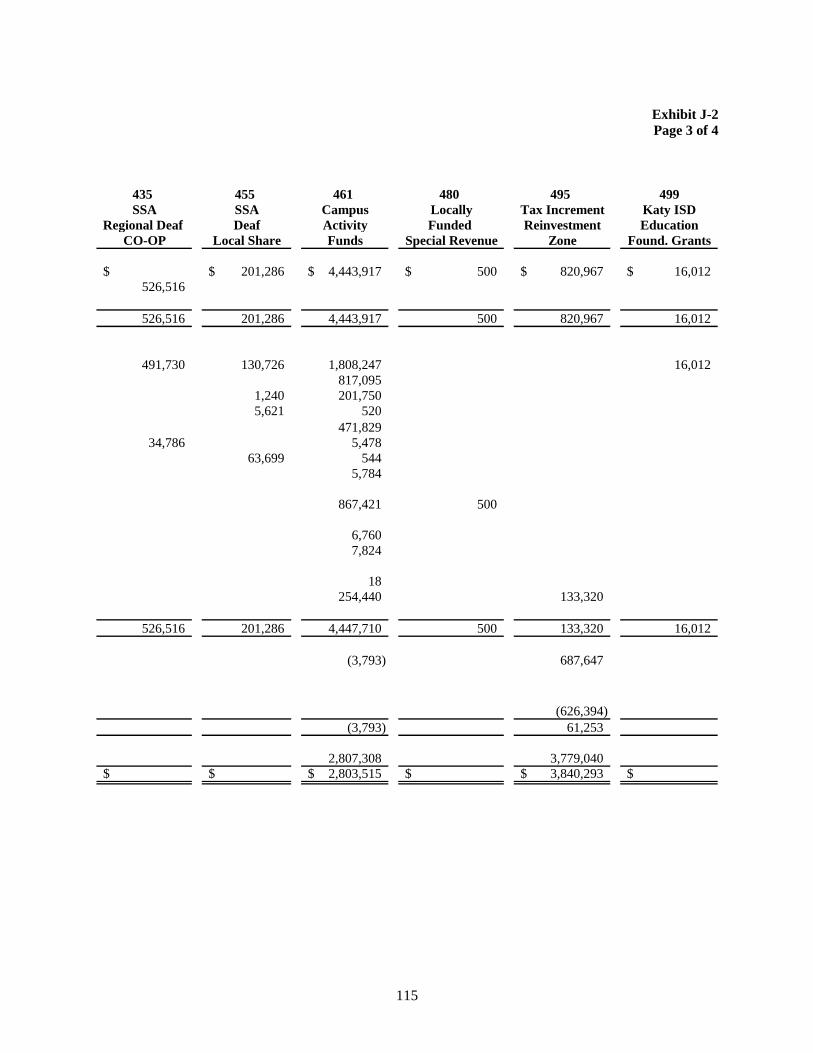
115
Exhibit J-2
Page 3 of 4
435 455 461 480 495 499
SSA SSA Campus Locally Tax Increment Katy ISD
Regional Deaf Deaf Activity Funded Reinvestment Education
CO-OP Local Share Funds Special Revenue Zone Found. Grants
$ 201,286$ 4,443,917$ 500$ 820,967$ 16,012$
526,516
526,516 201,286 4,443,917 500 820,967 16,012
491,730 130,726 1,808,247 16,012
817,095
1,240 201,750
5,621 520
471,829
34,786 5,478
63,699 544
5,784
867,421 500
6,760
7,824
18
254,440 133,320
526,516 201,286 4,447,710 500 133,320 16,012
(3,793) 687,647
(626,394)
(3,793) 61,253
2,807,308 3,779,040
$ $ 2,803,515$ $ 3,840,293$ $
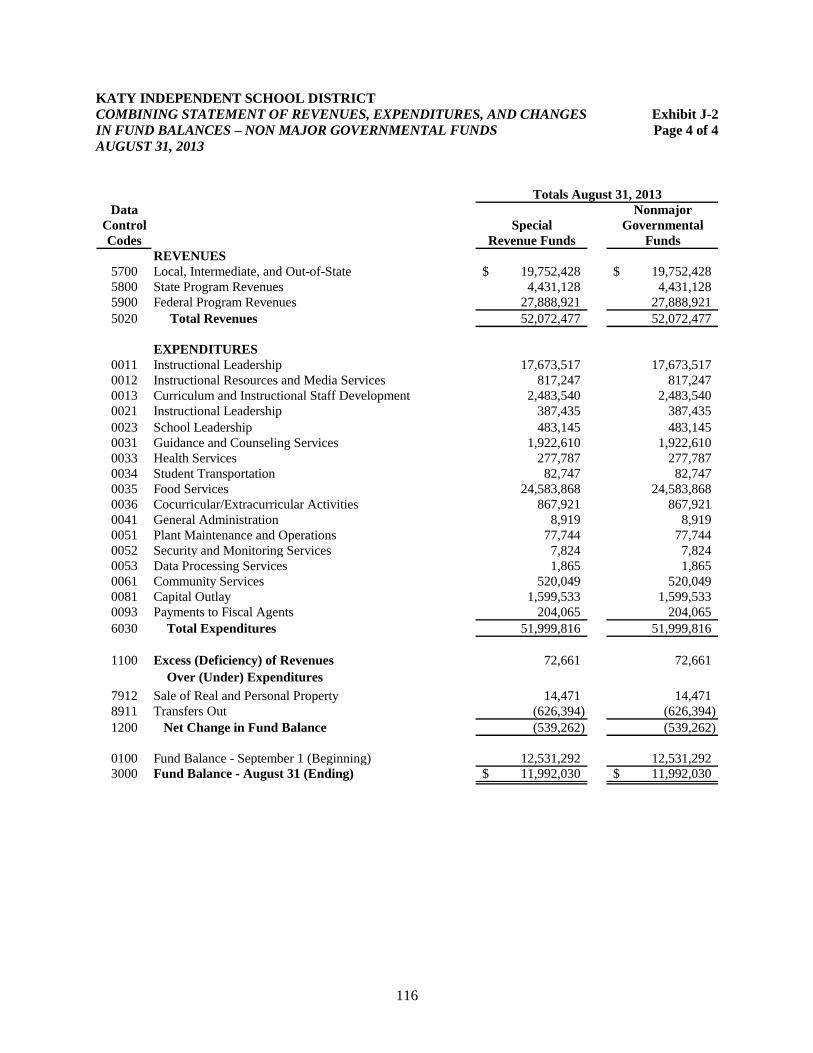
116
KATY INDEPENDENT SCHOOL DISTRICT
COMBINING STATEMENT OF REVENUES, EXPENDITURES, AND CHANGES Exhibit J-2
IN FUND BALANCES – NON MAJOR GOVERNMENTAL FUNDS Page 4 of 4
AUGUST 31, 2013
Data Nonmajor
Control Special Governmental
Codes Revenue Funds Funds
REVENUES
5700 Local, Intermediate, and Out-of-State 19,752,428$ 19,752,428$
5800 State Program Revenues 4,431,128 4,431,128
5900 Federal Program Revenues 27,888,921 27,888,921
5020 Total Revenues 52,072,477 52,072,477
EXPENDITURES
0011 Instructional Leadership 17,673,517 17,673,517
0012 Instructional Resources and Media Services 817,247 817,247
0013 Curriculum and Instructional Staff Development 2,483,540 2,483,540
0021 Instructional Leadership 387,435 387,435
0023 School Leadership 483,145 483,145
0031 Guidance and Counseling Services 1,922,610 1,922,610
0033 Health Services 277,787 277,787
0034 Student Transportation 82,747 82,747
0035 Food Services 24,583,868 24,583,868
0036 Cocurricular/Extracurricular Activities 867,921 867,921
0041 General Administration 8,919 8,919
0051 Plant Maintenance and Operations 77,744 77,744
0052 Security and Monitoring Services 7,824 7,824
0053 Data Processing Services 1,865 1,865
0061 Community Services 520,049 520,049
0081 Capital Outlay 1,599,533 1,599,533
0093 Payments to Fiscal Agents 204,065 204,065
6030 Total Expenditures 51,999,816 51,999,816
1100 Excess (Deficiency) of Revenues 72,661 72,661
Over (Under) Expenditures
7912 Sale of Real and Personal Property 14,471 14,471
8911 Transfers Out (626,394) (626,394)
1200 Net Change in Fund Balance (539,262) (539,262)
0100 Fund Balance - September 1 (Beginning) 12,531,292 12,531,292
3000 Fund Balance - August 31 (Ending) 11,992,030$ 11,992,030$
Totals August 31, 2013

117
THIS PAGE INTENTIONALLY LEFT BLANK
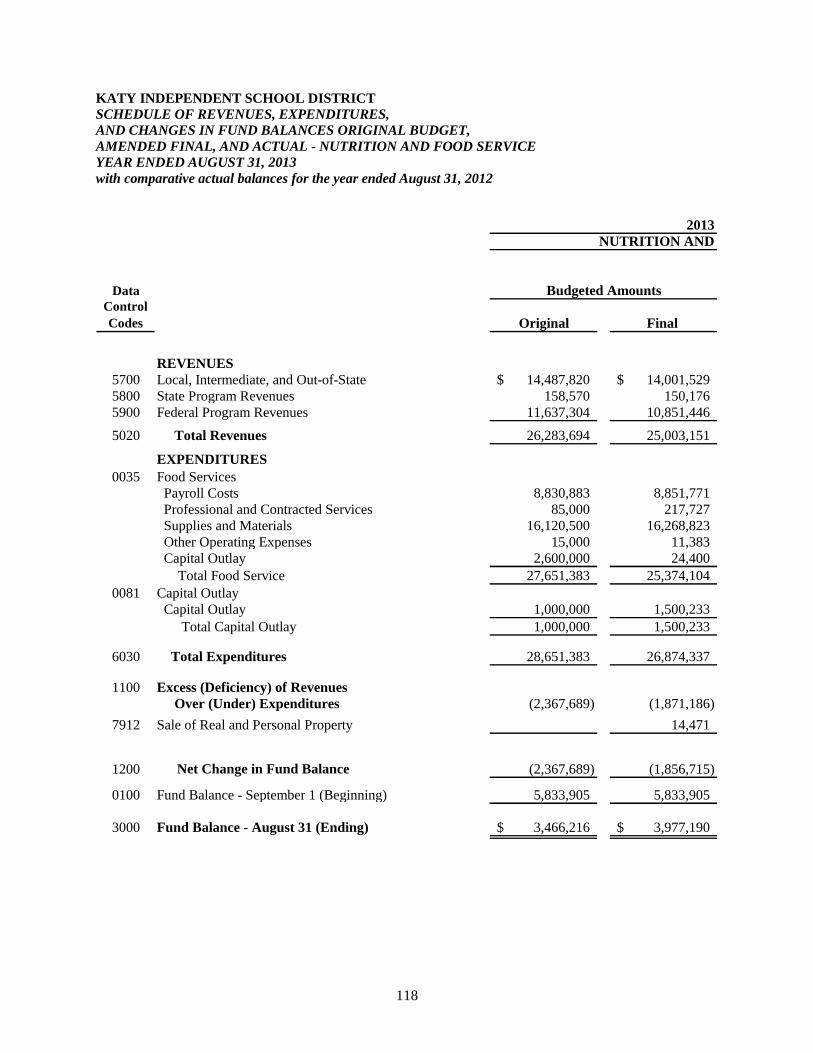
118
KATY INDEPENDENT SCHOOL DISTRICT
SCHEDULE OF REVENUES, EXPENDITURES,
AND CHANGES IN FUND BALANCES ORIGINAL BUDGET,
AMENDED FINAL, AND ACTUAL - NUTRITION AND FOOD SERVICE
YEAR ENDED AUGUST 31, 2013
with comparative actual balances for the year ended August 31, 2012
2013
NUTRITION AND
Data
Control
Codes Original Final
REVENUES
5700 Local, Intermediate, and Out-of-State 14,487,820$ 14,001,529$
5800 State Program Revenues 158,570 150,176
5900 Federal Program Revenues 11,637,304 10,851,446
5020 Total Revenues 26,283,694 25,003,151
EXPENDITURES
0035 Food Services
Payroll Costs 8,830,883 8,851,771
Professional and Contracted Services 85,000 217,727
Supplies and Materials 16,120,500 16,268,823
Other Operating Expenses 15,000 11,383
Capital Outlay 2,600,000 24,400
Total Food Service 27,651,383 25,374,104
0081 Capital Outlay
Capital Outlay 1,000,000 1,500,233
Total Capital Outlay 1,000,000 1,500,233
6030 Total Expenditures 28,651,383 26,874,337
1100 Excess (Deficiency) of Revenues
Over (Under) Expenditures (2,367,689) (1,871,186)
7912 Sale of Real and Personal Property 14,471
1200 Net Change in Fund Balance (2,367,689) (1,856,715)
0100 Fund Balance - September 1 (Beginning) 5,833,905 5,833,905
3000 Fund Balance - August 31 (Ending) 3,466,216$ 3,977,190$
Budgeted Amounts
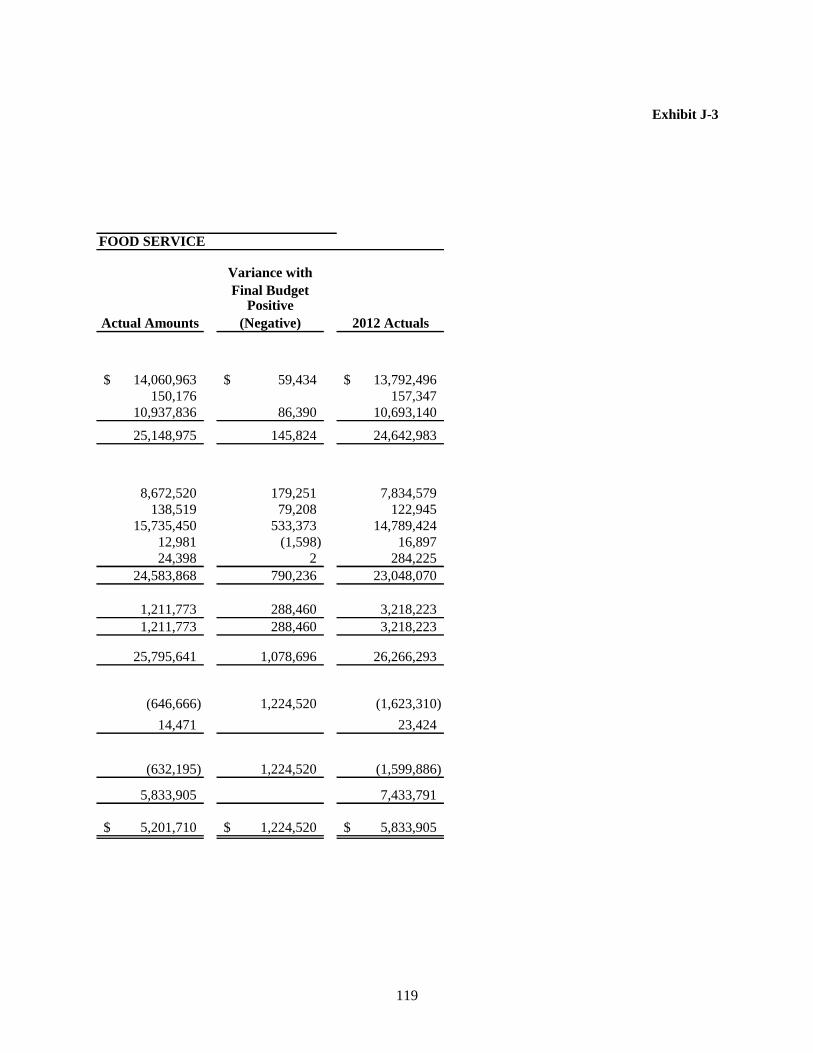
119
Exhibit J-3
FOOD SERVICE
Variance with
Final Budget
Actual Amounts
Positive
(Negative) 2012 Actuals
14,060,963$ 59,434$ 13,792,496$
150,176 157,347
10,937,836 86,390 10,693,140
25,148,975 145,824 24,642,983
8,672,520 179,251 7,834,579
138,519 79,208 122,945
15,735,450 533,373 14,789,424
12,981 (1,598) 16,897
24,398 2 284,225
24,583,868 790,236 23,048,070
1,211,773 288,460 3,218,223
1,211,773 288,460 3,218,223
25,795,641 1,078,696 26,266,293
(646,666) 1,224,520 (1,623,310)
14,471 23,424
(632,195) 1,224,520 (1,599,886)
5,833,905 7,433,791
5,201,710$ 1,224,520$ 5,833,905$

120
THIS PAGE INTENTIONALLY LEFT BLANK
121
INTERNAL SERVICE FUNDS
The Internal Service Funds are used to account for revenues and expenses related to services provided to
organizations inside the District on a cost reimbursement basis.
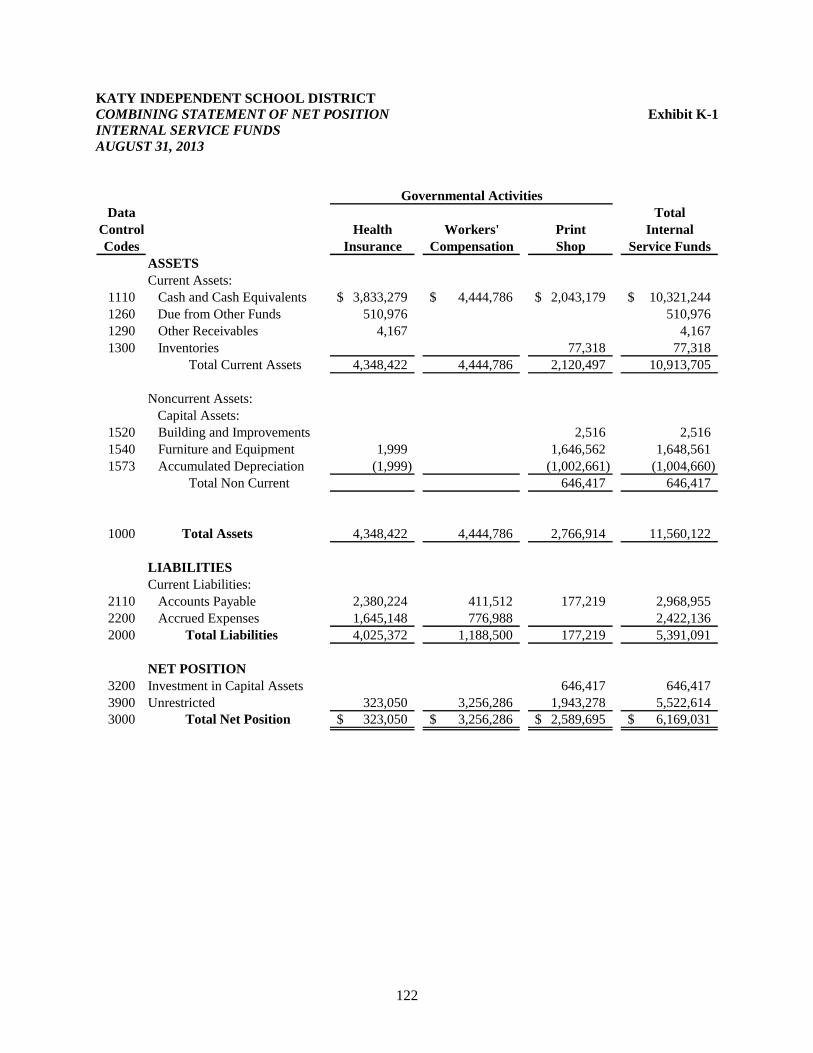
122
KATY INDEPENDENT SCHOOL DISTRICT
COMBINING STATEMENT OF NET POSITION Exhibit K-1
INTERNAL SERVICE FUNDS
AUGUST 31, 2013
Data Total
Control Health Workers' Print Internal
Codes Insurance Compensation Shop Service Funds
ASSETS
Current Assets:
1110 Cash and Cash Equivalents 3,833,279$ 4,444,786$ 2,043,179$ 10,321,244$
1260 Due from Other Funds 510,976 510,976
1290 Other Receivables 4,167 4,167
1300 Inventories 77,318 77,318
Total Current Assets 4,348,422 4,444,786 2,120,497 10,913,705
Noncurrent Assets:
Capital Assets:
1520 Building and Improvements 2,516 2,516
1540 Furniture and Equipment 1,999 1,646,562 1,648,561
1573 Accumulated Depreciation (1,999) (1,002,661) (1,004,660)
Total Non Current 646,417 646,417
1000 Total Assets 4,348,422 4,444,786 2,766,914 11,560,122
LIABILITIES
Current Liabilities:
2110 Accounts Payable 2,380,224 411,512 177,219 2,968,955
2200 Accrued Expenses 1,645,148 776,988 2,422,136
2000 Total Liabilities 4,025,372 1,188,500 177,219 5,391,091
NET POSITION
3200 Investment in Capital Assets 646,417 646,417
3900 Unrestricted 323,050 3,256,286 1,943,278 5,522,614
3000 Total Net Position 323,050$ 3,256,286$ 2,589,695$ 6,169,031$
Governmental Activities
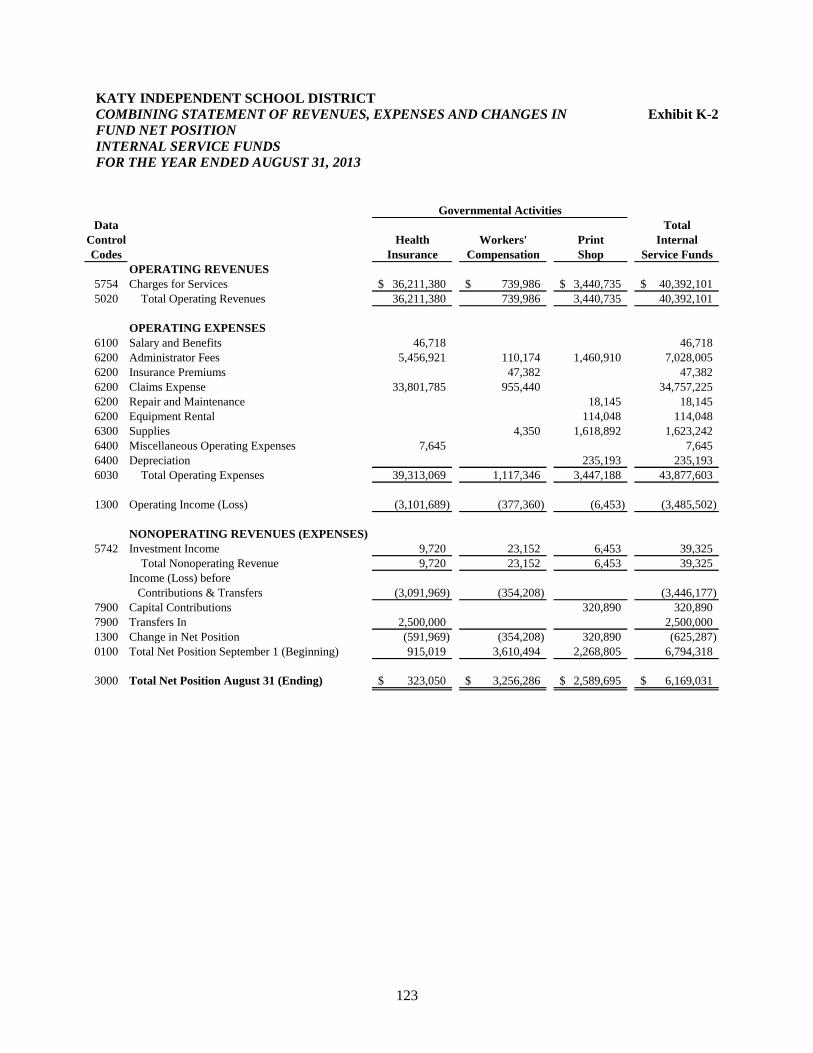
123
KATY INDEPENDENT SCHOOL DISTRICT
COMBINING STATEMENT OF REVENUES, EXPENSES AND CHANGES IN Exhibit K-2
FUND NET POSITION
INTERNAL SERVICE FUNDS
FOR THE YEAR ENDED AUGUST 31, 2013
Data Total
Control Health Workers' Print Internal
Codes Insurance Compensation Shop Service Funds
OPERATING REVENUES
5754 Charges for Services 36,211,380$ 739,986$ 3,440,735$ 40,392,101$
5020 Total Operating Revenues 36,211,380 739,986 3,440,735 40,392,101
OPERATING EXPENSES
6100 Salary and Benefits 46,718 46,718
6200 Administrator Fees 5,456,921 110,174 1,460,910 7,028,005
6200 Insurance Premiums 47,382 47,382
6200 Claims Expense 33,801,785 955,440 34,757,225
6200 Repair and Maintenance 18,145 18,145
6200 Equipment Rental 114,048 114,048
6300 Supplies 4,350 1,618,892 1,623,242
6400 Miscellaneous Operating Expenses 7,645 7,645
6400 Depreciation 235,193 235,193
6030 Total Operating Expenses 39,313,069 1,117,346 3,447,188 43,877,603
1300 Operating Income (Loss) (3,101,689) (377,360) (6,453) (3,485,502)
NONOPERATING REVENUES (EXPENSES)
5742 Investment Income 9,720 23,152 6,453 39,325
Total Nonoperating Revenue 9,720 23,152 6,453 39,325
Income (Loss) before
Contributions & Transfers (3,091,969) (354,208) (3,446,177)
7900 Capital Contributions 320,890 320,890
7900 Transfers In 2,500,000 2,500,000
1300 Change in Net Position (591,969) (354,208) 320,890 (625,287)
0100 Total Net Position September 1 (Beginning) 915,019 3,610,494 2,268,805 6,794,318
3000 Total Net Position August 31 (Ending) 323,050$ 3,256,286$ 2,589,695$ 6,169,031$
Governmental Activities
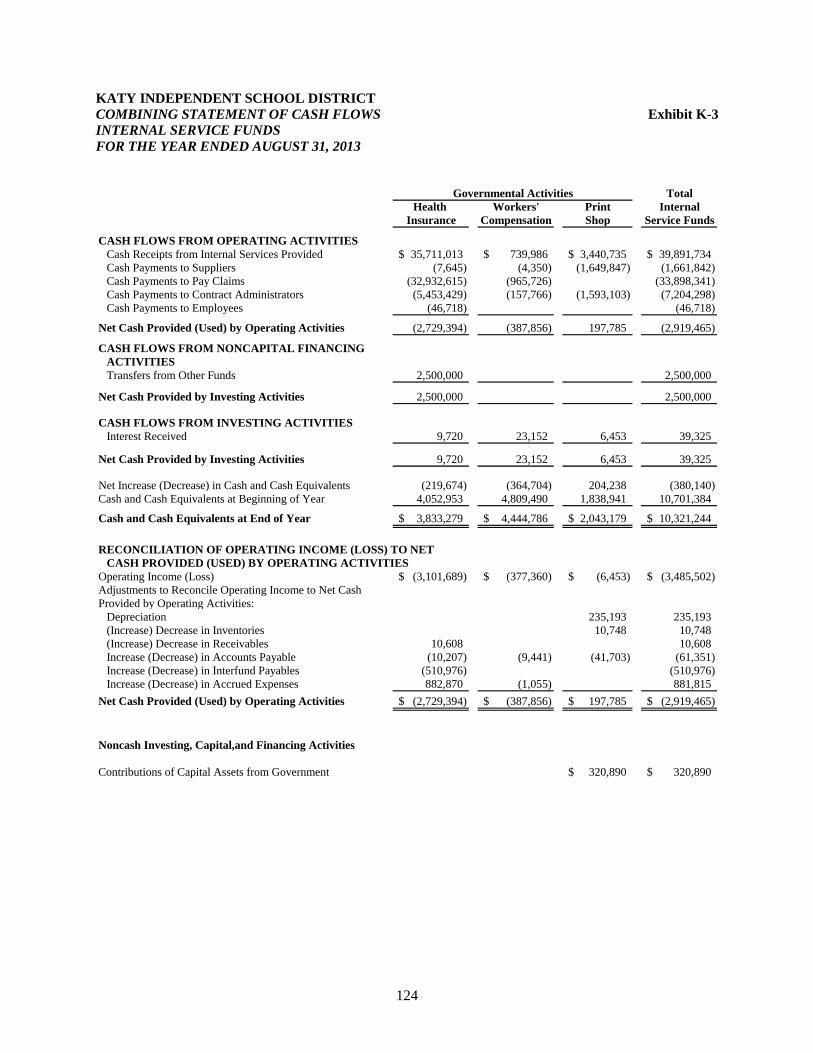
124
KATY INDEPENDENT SCHOOL DISTRICT
COMBINING STATEMENT OF CASH FLOWS Exhibit K-3
INTERNAL SERVICE FUNDS
FOR THE YEAR ENDED AUGUST 31, 2013
Total
Health Workers' Print Internal
Insurance Compensation Shop Service Funds
CASH FLOWS FROM OPERATING ACTIVITIES
Cash Receipts from Internal Services Provided 35,711,013$ 739,986$ 3,440,735$ 39,891,734$
Cash Payments to Suppliers (7,645) (4,350) (1,649,847) (1,661,842)
Cash Payments to Pay Claims (32,932,615) (965,726) (33,898,341)
Cash Payments to Contract Administrators (5,453,429) (157,766) (1,593,103) (7,204,298)
Cash Payments to Employees (46,718) (46,718)
Net Cash Provided (Used) by Operating Activities (2,729,394) (387,856) 197,785 (2,919,465)
CASH FLOWS FROM NONCAPITAL FINANCING
ACTIVITIES
Transfers from Other Funds 2,500,000 2,500,000
Net Cash Provided by Investing Activities 2,500,000 2,500,000
CASH FLOWS FROM INVESTING ACTIVITIES
Interest Received 9,720 23,152 6,453 39,325
Net Cash Provided by Investing Activities 9,720 23,152 6,453 39,325
Net Increase (Decrease) in Cash and Cash Equivalents (219,674) (364,704) 204,238 (380,140)
Cash and Cash Equivalents at Beginning of Year 4,052,953 4,809,490 1,838,941 10,701,384
Cash and Cash Equivalents at End of Year 3,833,279$ 4,444,786$ 2,043,179$ 10,321,244$
RECONCILIATION OF OPERATING INCOME (LOSS) TO NET
CASH PROVIDED (USED) BY OPERATING ACTIVITIES
Operating Income (Loss) (3,101,689)$ (377,360)$ (6,453)$ (3,485,502)$
Adjustments to Reconcile Operating Income to Net Cash
Provided by Operating Activities:
Depreciation 235,193 235,193
(Increase) Decrease in Inventories 10,748 10,748
(Increase) Decrease in Receivables 10,608 10,608
Increase (Decrease) in Accounts Payable (10,207) (9,441) (41,703) (61,351)
Increase (Decrease) in Interfund Payables (510,976) (510,976)
Increase (Decrease) in Accrued Expenses 882,870 (1,055) 881,815
Net Cash Provided (Used) by Operating Activities (2,729,394)$ (387,856)$ 197,785$ (2,919,465)$
Noncash Investing, Capital,and Financing Activities
Contributions of Capital Assets from Government 320,890$ 320,890$
Governmental Activities
125
FIDUCIARY FUNDS
Agency Fund The Agency Fund is used to account for assets held by the District as an agent for employees and various
student groups throughout the District.
Student Activity Fund The Agency Fund is used to account for assets held for various student groups throughout the District.
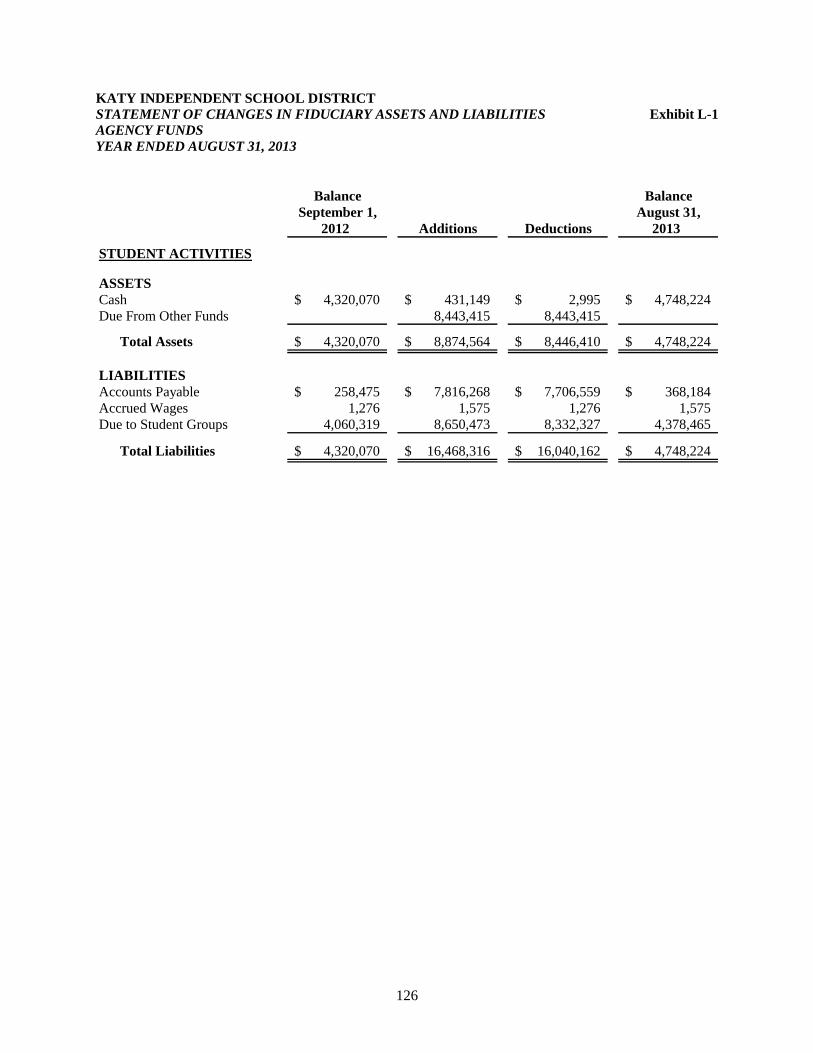
126
KATY INDEPENDENT SCHOOL DISTRICT
STATEMENT OF CHANGES IN FIDUCIARY ASSETS AND LIABILITIES Exhibit L-1
AGENCY FUNDS
YEAR ENDED AUGUST 31, 2013
Balance Balance
September 1, August 31,
2012 Additions Deductions 2013
STUDENT ACTIVITIES
ASSETS
Cash 4,320,070$ 431,149$ 2,995$ 4,748,224$
Due From Other Funds 8,443,415 8,443,415
Total Assets 4,320,070$ 8,874,564$ 8,446,410$ 4,748,224$
LIABILITIES
Accounts Payable 258,475$ 7,816,268$ 7,706,559$ 368,184$
Accrued Wages 1,276 1,575 1,276 1,575
Due to Student Groups 4,060,319 8,650,473 8,332,327 4,378,465
Total Liabilities 4,320,070$ 16,468,316$ 16,040,162$ 4,748,224$
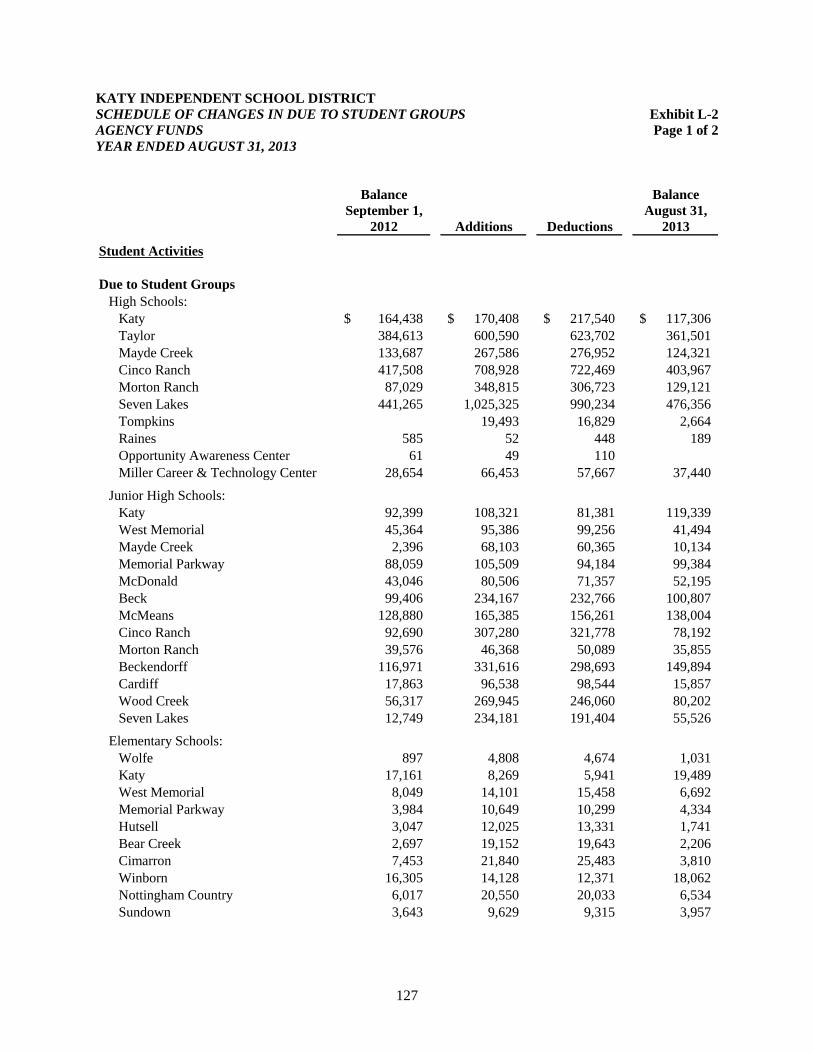
127
KATY INDEPENDENT SCHOOL DISTRICT
SCHEDULE OF CHANGES IN DUE TO STUDENT GROUPS Exhibit L-2
AGENCY FUNDS Page 1 of 2
YEAR ENDED AUGUST 31, 2013
Balance Balance
September 1, August 31,
2012 Additions Deductions 2013
Student Activities
Due to Student Groups
High Schools:
Katy 164,438$ 170,408$ 217,540$ 117,306$
Taylor 384,613 600,590 623,702 361,501
Mayde Creek 133,687 267,586 276,952 124,321
Cinco Ranch 417,508 708,928 722,469 403,967
Morton Ranch 87,029 348,815 306,723 129,121
Seven Lakes 441,265 1,025,325 990,234 476,356
Tompkins 19,493 16,829 2,664
Raines 585 52 448 189
Opportunity Awareness Center 61 49 110
Miller Career & Technology Center 28,654 66,453 57,667 37,440
Junior High Schools:
Katy 92,399 108,321 81,381 119,339
West Memorial 45,364 95,386 99,256 41,494
Mayde Creek 2,396 68,103 60,365 10,134
Memorial Parkway 88,059 105,509 94,184 99,384
McDonald 43,046 80,506 71,357 52,195
Beck 99,406 234,167 232,766 100,807
McMeans 128,880 165,385 156,261 138,004
Cinco Ranch 92,690 307,280 321,778 78,192
Morton Ranch 39,576 46,368 50,089 35,855
Beckendorff 116,971 331,616 298,693 149,894
Cardiff 17,863 96,538 98,544 15,857
Wood Creek 56,317 269,945 246,060 80,202
Seven Lakes 12,749 234,181 191,404 55,526
Elementary Schools:
Wolfe 897 4,808 4,674 1,031
Katy 17,161 8,269 5,941 19,489
West Memorial 8,049 14,101 15,458 6,692
Memorial Parkway 3,984 10,649 10,299 4,334
Hutsell 3,047 12,025 13,331 1,741
Bear Creek 2,697 19,152 19,643 2,206
Cimarron 7,453 21,840 25,483 3,810
Winborn 16,305 14,128 12,371 18,062
Nottingham Country 6,017 20,550 20,033 6,534
Sundown 3,643 9,629 9,315 3,957
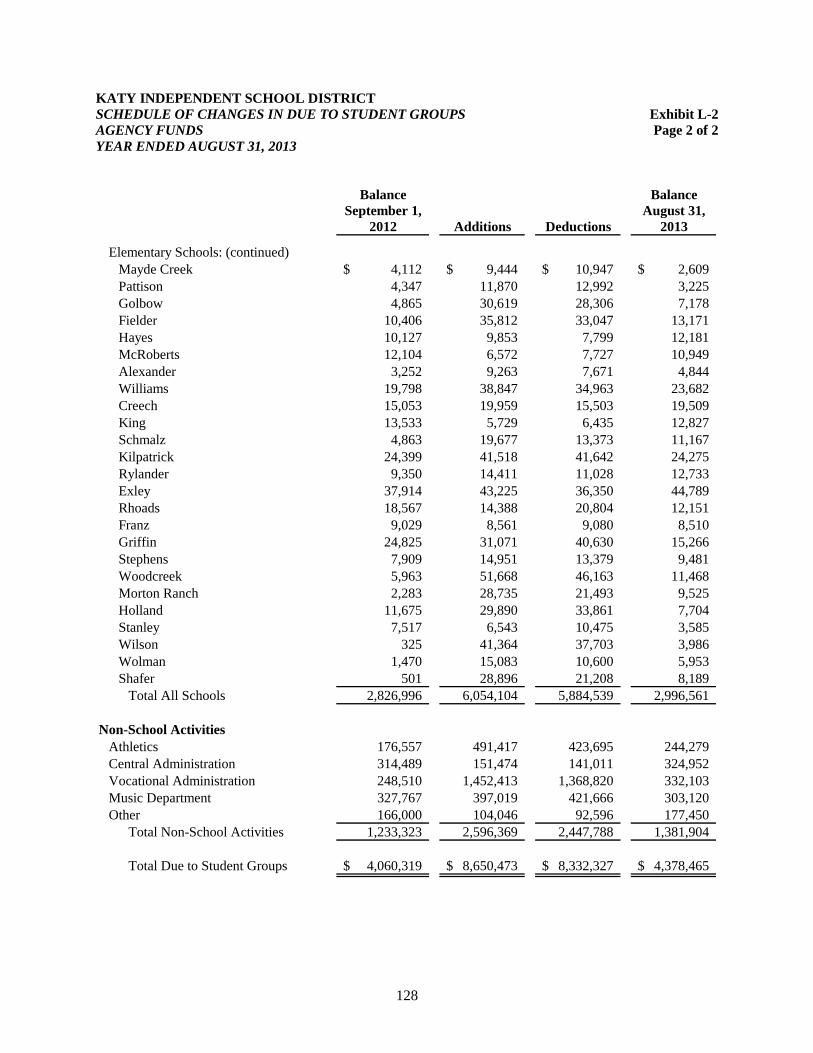
128
KATY INDEPENDENT SCHOOL DISTRICT
SCHEDULE OF CHANGES IN DUE TO STUDENT GROUPS Exhibit L-2
AGENCY FUNDS Page 2 of 2
YEAR ENDED AUGUST 31, 2013
Balance Balance
September 1, August 31,
2012 Additions Deductions 2013
Elementary Schools: (continued)
Mayde Creek 4,112$ 9,444$ 10,947$ 2,609$
Pattison 4,347 11,870 12,992 3,225
Golbow 4,865 30,619 28,306 7,178
Fielder 10,406 35,812 33,047 13,171
Hayes 10,127 9,853 7,799 12,181
McRoberts 12,104 6,572 7,727 10,949
Alexander 3,252 9,263 7,671 4,844
Williams 19,798 38,847 34,963 23,682
Creech 15,053 19,959 15,503 19,509
King 13,533 5,729 6,435 12,827
Schmalz 4,863 19,677 13,373 11,167
Kilpatrick 24,399 41,518 41,642 24,275
Rylander 9,350 14,411 11,028 12,733
Exley 37,914 43,225 36,350 44,789
Rhoads 18,567 14,388 20,804 12,151
Franz 9,029 8,561 9,080 8,510
Griffin 24,825 31,071 40,630 15,266
Stephens 7,909 14,951 13,379 9,481
Woodcreek 5,963 51,668 46,163 11,468
Morton Ranch 2,283 28,735 21,493 9,525
Holland 11,675 29,890 33,861 7,704
Stanley 7,517 6,543 10,475 3,585
Wilson 325 41,364 37,703 3,986
Wolman 1,470 15,083 10,600 5,953
Shafer 501 28,896 21,208 8,189
Total All Schools 2,826,996 6,054,104 5,884,539 2,996,561
Non-School Activities
Athletics 176,557 491,417 423,695 244,279
Central Administration 314,489 151,474 141,011 324,952
Vocational Administration 248,510 1,452,413 1,368,820 332,103
Music Department 327,767 397,019 421,666 303,120
Other 166,000 104,046 92,596 177,450
Total Non-School Activities 1,233,323 2,596,369 2,447,788 1,381,904
Total Due to Student Groups 4,060,319$ 8,650,473$ 8,332,327$ 4,378,465$
129
CAPITAL ASSETS USED
IN THE
OPERATIONS OF
GOVERNMENTAL FUNDS Capital assets purchased or constructed by the District are shown at original cost. Donated assets are
valued at the fair market value on the date donated. Costs incurred for the purchase or construction of
general capital assets are recorded as expenditures in the General Fund, Special Revenue Fund, and
Capital Projects Fund and are capitalized as capital assets used in the operations of Governmental Funds.
The capital assets consist principally of school buildings and related equipment.
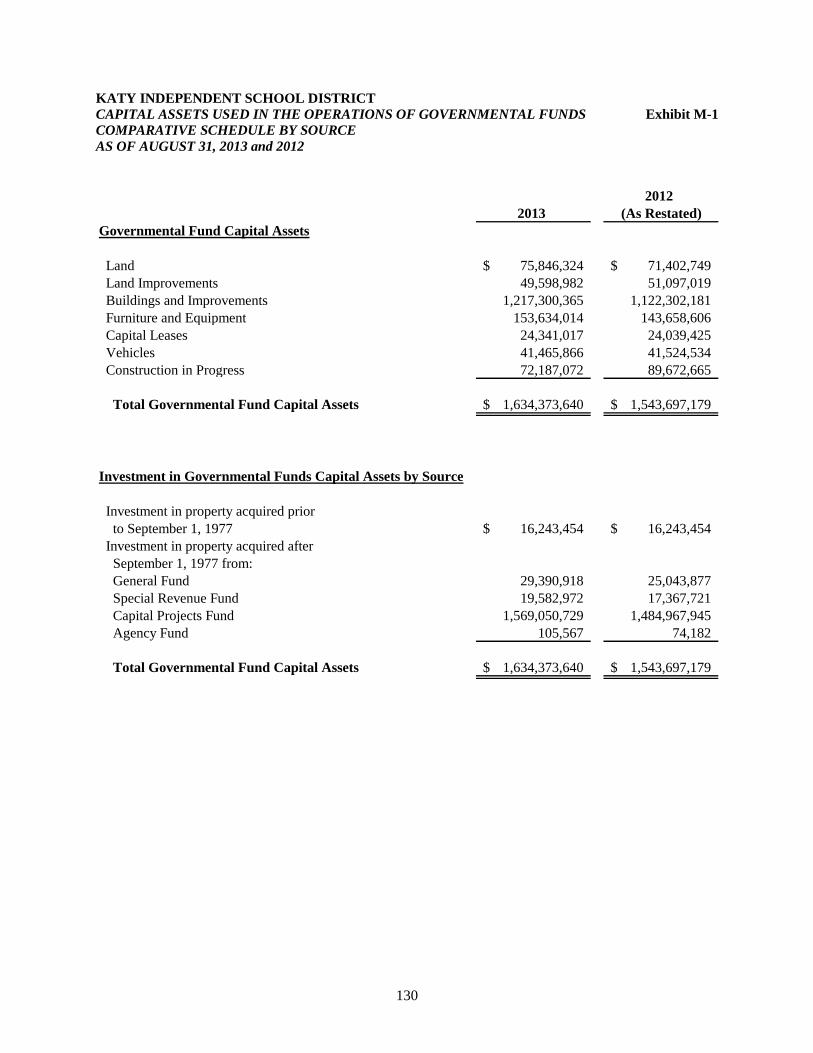
130
KATY INDEPENDENT SCHOOL DISTRICT
CAPITAL ASSETS USED IN THE OPERATIONS OF GOVERNMENTAL FUNDS Exhibit M-1
COMPARATIVE SCHEDULE BY SOURCE
AS OF AUGUST 31, 2013 and 2012
2012
2013 (As Restated)
Governmental Fund Capital Assets
Land 75,846,324$ 71,402,749$
Land Improvements 49,598,982 51,097,019
Buildings and Improvements 1,217,300,365 1,122,302,181
Furniture and Equipment 153,634,014 143,658,606
Capital Leases 24,341,017 24,039,425
Vehicles 41,465,866 41,524,534
Construction in Progress 72,187,072 89,672,665
Total Governmental Fund Capital Assets 1,634,373,640$ 1,543,697,179$
Investment in Governmental Funds Capital Assets by Source
Investment in property acquired prior
to September 1, 1977 16,243,454$ 16,243,454$
Investment in property acquired after
September 1, 1977 from:
General Fund 29,390,918 25,043,877
Special Revenue Fund 19,582,972 17,367,721
Capital Projects Fund 1,569,050,729 1,484,967,945
Agency Fund 105,567 74,182
Total Governmental Fund Capital Assets 1,634,373,640$ 1,543,697,179$
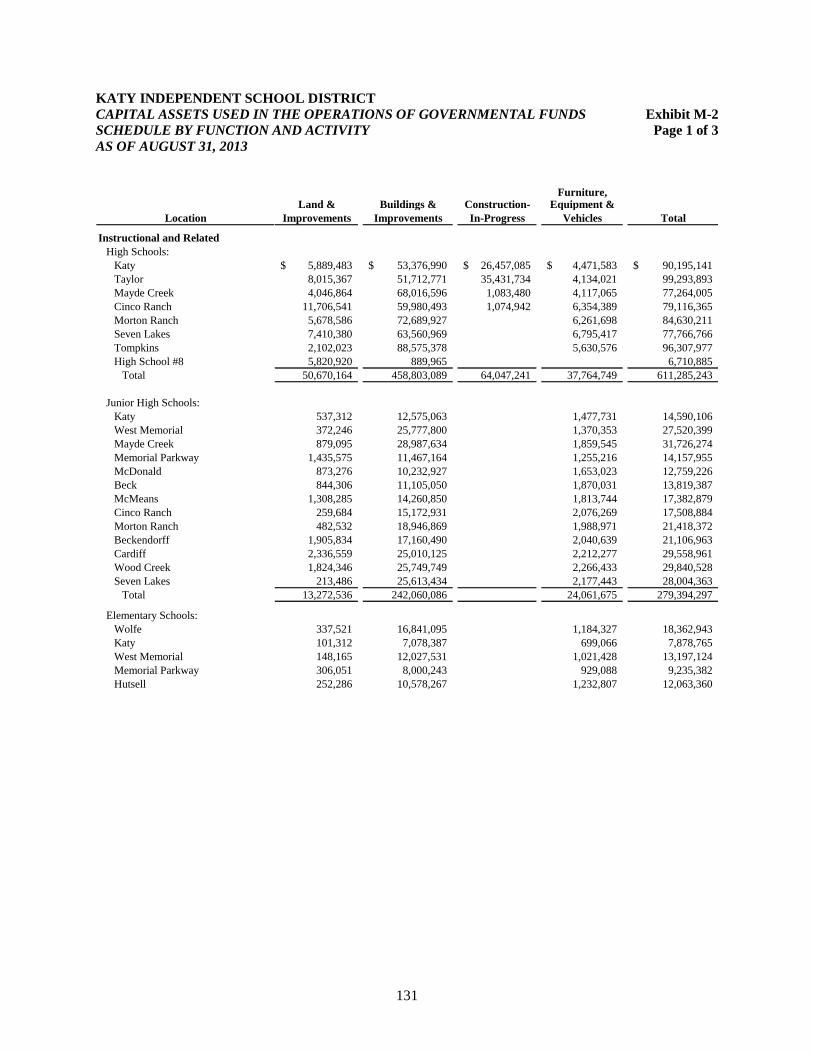
131
KATY INDEPENDENT SCHOOL DISTRICT
CAPITAL ASSETS USED IN THE OPERATIONS OF GOVERNMENTAL FUNDS Exhibit M-2
SCHEDULE BY FUNCTION AND ACTIVITY Page 1 of 3
AS OF AUGUST 31, 2013
Furniture,
Land & Buildings & Construction- Equipment &
Location Improvements Improvements In-Progress Vehicles Total
Instructional and Related
High Schools:
Katy 5,889,483$ 53,376,990$ 26,457,085$ 4,471,583$ 90,195,141$
Taylor 8,015,367 51,712,771 35,431,734 4,134,021 99,293,893
Mayde Creek 4,046,864 68,016,596 1,083,480 4,117,065 77,264,005
Cinco Ranch 11,706,541 59,980,493 1,074,942 6,354,389 79,116,365
Morton Ranch 5,678,586 72,689,927 6,261,698 84,630,211
Seven Lakes 7,410,380 63,560,969 6,795,417 77,766,766
Tompkins 2,102,023 88,575,378 5,630,576 96,307,977
High School #8 5,820,920 889,965 6,710,885
Total 50,670,164 458,803,089 64,047,241 37,764,749 611,285,243
Junior High Schools:
Katy 537,312 12,575,063 1,477,731 14,590,106
West Memorial 372,246 25,777,800 1,370,353 27,520,399
Mayde Creek 879,095 28,987,634 1,859,545 31,726,274
Memorial Parkway 1,435,575 11,467,164 1,255,216 14,157,955
McDonald 873,276 10,232,927 1,653,023 12,759,226
Beck 844,306 11,105,050 1,870,031 13,819,387
McMeans 1,308,285 14,260,850 1,813,744 17,382,879
Cinco Ranch 259,684 15,172,931 2,076,269 17,508,884
Morton Ranch 482,532 18,946,869 1,988,971 21,418,372
Beckendorff 1,905,834 17,160,490 2,040,639 21,106,963
Cardiff 2,336,559 25,010,125 2,212,277 29,558,961
Wood Creek 1,824,346 25,749,749 2,266,433 29,840,528
Seven Lakes 213,486 25,613,434 2,177,443 28,004,363
Total 13,272,536 242,060,086 24,061,675 279,394,297
Elementary Schools:
Wolfe 337,521 16,841,095 1,184,327 18,362,943
Katy 101,312 7,078,387 699,066 7,878,765
West Memorial 148,165 12,027,531 1,021,428 13,197,124
Memorial Parkway 306,051 8,000,243 929,088 9,235,382
Hutsell 252,286 10,578,267 1,232,807 12,063,360
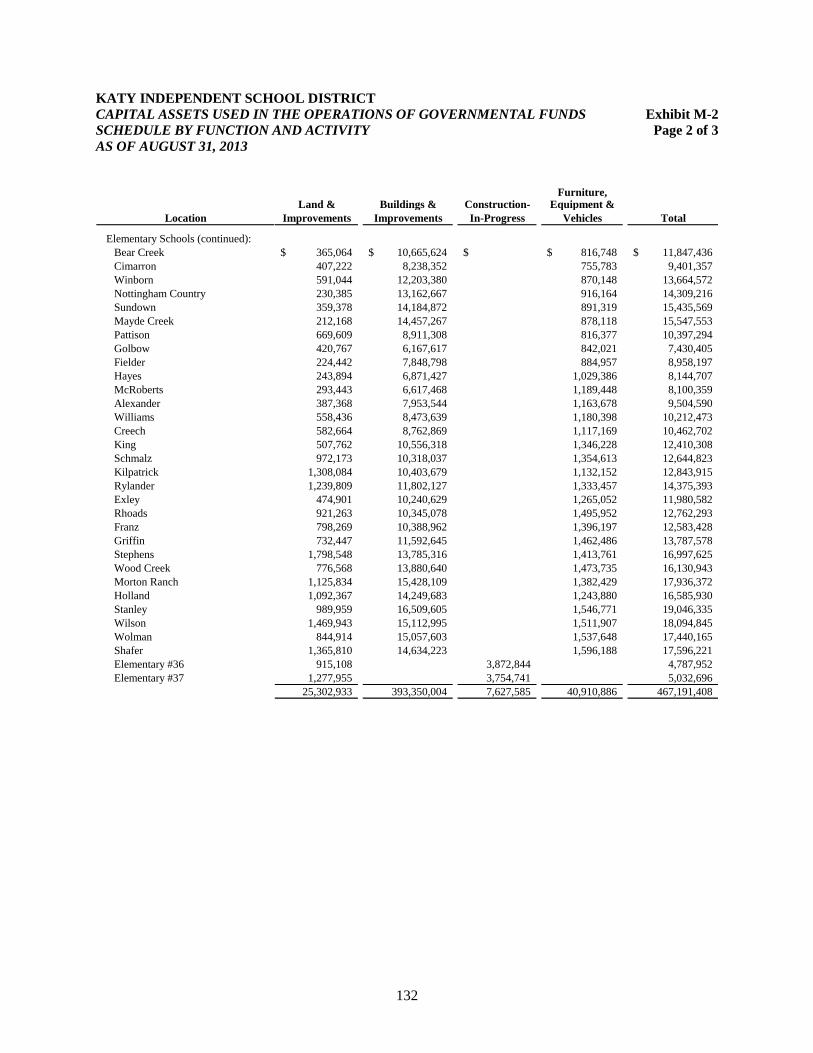
132
KATY INDEPENDENT SCHOOL DISTRICT
CAPITAL ASSETS USED IN THE OPERATIONS OF GOVERNMENTAL FUNDS Exhibit M-2
SCHEDULE BY FUNCTION AND ACTIVITY Page 2 of 3
AS OF AUGUST 31, 2013
Furniture,
Land & Buildings & Construction- Equipment &
Location Improvements Improvements In-Progress Vehicles Total
Elementary Schools (continued):
Bear Creek 365,064$ 10,665,624$ $ 816,748$ 11,847,436$
Cimarron 407,222 8,238,352 755,783 9,401,357
Winborn 591,044 12,203,380 870,148 13,664,572
Nottingham Country 230,385 13,162,667 916,164 14,309,216
Sundown 359,378 14,184,872 891,319 15,435,569
Mayde Creek 212,168 14,457,267 878,118 15,547,553
Pattison 669,609 8,911,308 816,377 10,397,294
Golbow 420,767 6,167,617 842,021 7,430,405
Fielder 224,442 7,848,798 884,957 8,958,197
Hayes 243,894 6,871,427 1,029,386 8,144,707
McRoberts 293,443 6,617,468 1,189,448 8,100,359
Alexander 387,368 7,953,544 1,163,678 9,504,590
Williams 558,436 8,473,639 1,180,398 10,212,473
Creech 582,664 8,762,869 1,117,169 10,462,702
King 507,762 10,556,318 1,346,228 12,410,308
Schmalz 972,173 10,318,037 1,354,613 12,644,823
Kilpatrick 1,308,084 10,403,679 1,132,152 12,843,915
Rylander 1,239,809 11,802,127 1,333,457 14,375,393
Exley 474,901 10,240,629 1,265,052 11,980,582
Rhoads 921,263 10,345,078 1,495,952 12,762,293
Franz 798,269 10,388,962 1,396,197 12,583,428
Griffin 732,447 11,592,645 1,462,486 13,787,578
Stephens 1,798,548 13,785,316 1,413,761 16,997,625
Wood Creek 776,568 13,880,640 1,473,735 16,130,943
Morton Ranch 1,125,834 15,428,109 1,382,429 17,936,372
Holland 1,092,367 14,249,683 1,243,880 16,585,930
Stanley 989,959 16,509,605 1,546,771 19,046,335
Wilson 1,469,943 15,112,995 1,511,907 18,094,845
Wolman 844,914 15,057,603 1,537,648 17,440,165
Shafer 1,365,810 14,634,223 1,596,188 17,596,221
Elementary #36 915,108 3,872,844 4,787,952
Elementary #37 1,277,955 3,754,741 5,032,696
25,302,933 393,350,004 7,627,585 40,910,886 467,191,408
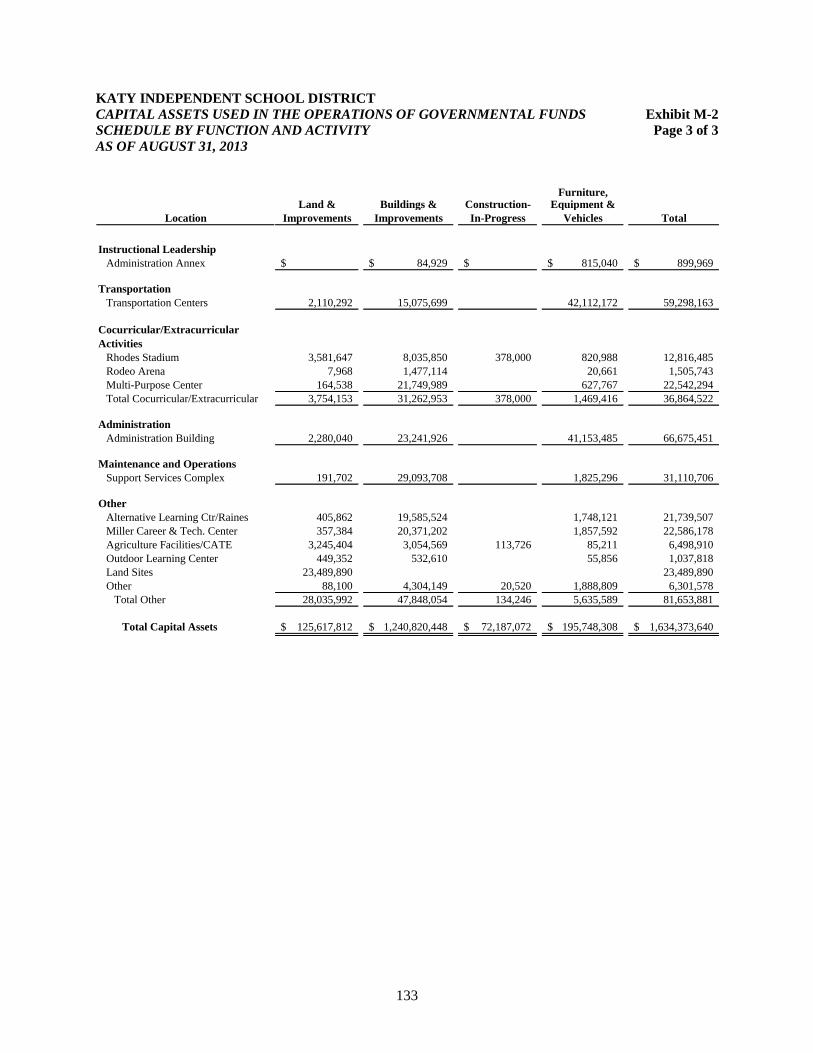
133
KATY INDEPENDENT SCHOOL DISTRICT
CAPITAL ASSETS USED IN THE OPERATIONS OF GOVERNMENTAL FUNDS Exhibit M-2
SCHEDULE BY FUNCTION AND ACTIVITY Page 3 of 3
AS OF AUGUST 31, 2013
Furniture,
Land & Buildings & Construction- Equipment &
Location Improvements Improvements In-Progress Vehicles Total
Instructional Leadership
Administration Annex $ 84,929$ $ 815,040$ 899,969$
Transportation
Transportation Centers 2,110,292 15,075,699 42,112,172 59,298,163
Rhodes Stadium 3,581,647 8,035,850 378,000 820,988 12,816,485
Rodeo Arena 7,968 1,477,114 20,661 1,505,743
Multi-Purpose Center 164,538 21,749,989 627,767 22,542,294
Total Cocurricular/Extracurricular 3,754,153 31,262,953 378,000 1,469,416 36,864,522
Administration
Administration Building 2,280,040 23,241,926 41,153,485 66,675,451
Maintenance and Operations
Support Services Complex 191,702 29,093,708 1,825,296 31,110,706
Other
Alternative Learning Ctr/Raines 405,862 19,585,524 1,748,121 21,739,507
Miller Career & Tech. Center 357,384 20,371,202 1,857,592 22,586,178
Agriculture Facilities/CATE 3,245,404 3,054,569 113,726 85,211 6,498,910
Outdoor Learning Center 449,352 532,610 55,856 1,037,818
Land Sites 23,489,890 23,489,890
Other 88,100 4,304,149 20,520 1,888,809 6,301,578
Total Other 28,035,992 47,848,054 134,246 5,635,589 81,653,881
Total Capital Assets 125,617,812$ 1,240,820,448$ 72,187,072$ 195,748,308$ 1,634,373,640$
Cocurricular/Extracurricular
Activities
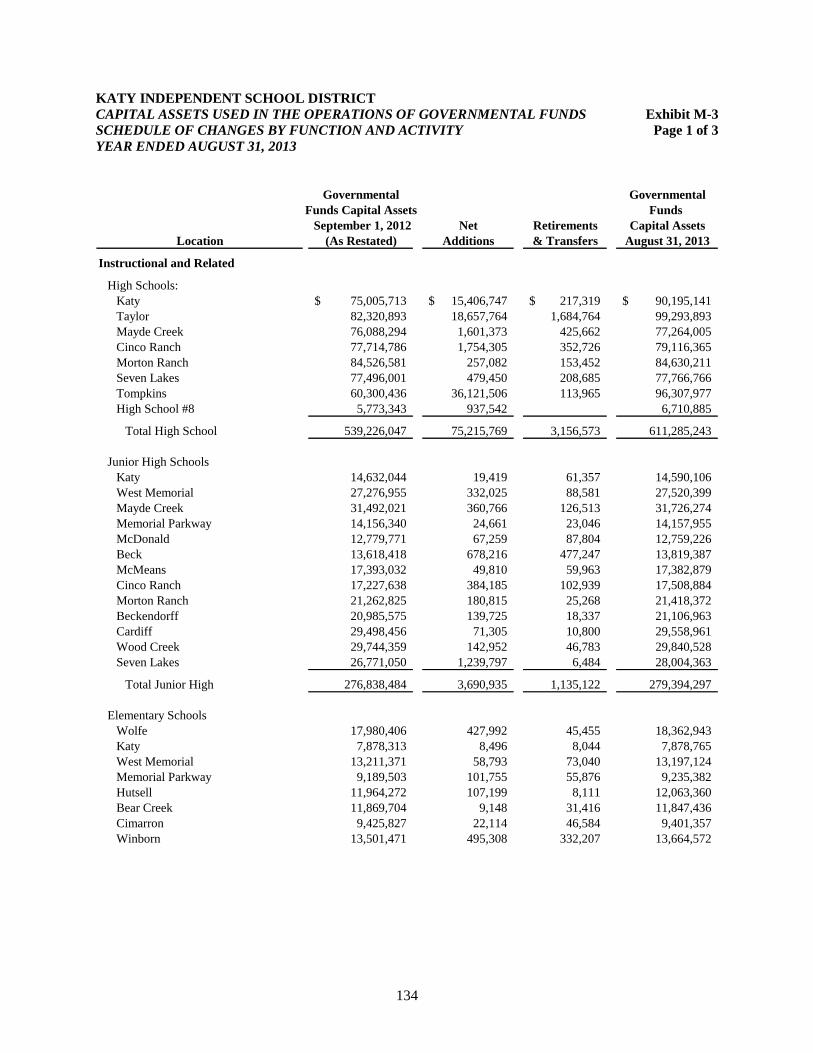
134
KATY INDEPENDENT SCHOOL DISTRICT
CAPITAL ASSETS USED IN THE OPERATIONS OF GOVERNMENTAL FUNDS Exhibit M-3
SCHEDULE OF CHANGES BY FUNCTION AND ACTIVITY Page 1 of 3
YEAR ENDED AUGUST 31, 2013
Governmental Governmental
Funds Capital Assets Funds
September 1, 2012 Net Retirements Capital Assets
Location (As Restated) Additions & Transfers August 31, 2013
Instructional and Related
High Schools:
Katy 75,005,713$ 15,406,747$ 217,319$ 90,195,141$
Taylor 82,320,893 18,657,764 1,684,764 99,293,893
Mayde Creek 76,088,294 1,601,373 425,662 77,264,005
Cinco Ranch 77,714,786 1,754,305 352,726 79,116,365
Morton Ranch 84,526,581 257,082 153,452 84,630,211
Seven Lakes 77,496,001 479,450 208,685 77,766,766
Tompkins 60,300,436 36,121,506 113,965 96,307,977
High School #8 5,773,343 937,542 6,710,885
Total High School 539,226,047 75,215,769 3,156,573 611,285,243
Junior High Schools
Katy 14,632,044 19,419 61,357 14,590,106
West Memorial 27,276,955 332,025 88,581 27,520,399
Mayde Creek 31,492,021 360,766 126,513 31,726,274
Memorial Parkway 14,156,340 24,661 23,046 14,157,955
McDonald 12,779,771 67,259 87,804 12,759,226
Beck 13,618,418 678,216 477,247 13,819,387
McMeans 17,393,032 49,810 59,963 17,382,879
Cinco Ranch 17,227,638 384,185 102,939 17,508,884
Morton Ranch 21,262,825 180,815 25,268 21,418,372
Beckendorff 20,985,575 139,725 18,337 21,106,963
Cardiff 29,498,456 71,305 10,800 29,558,961
Wood Creek 29,744,359 142,952 46,783 29,840,528
Seven Lakes 26,771,050 1,239,797 6,484 28,004,363
Total Junior High 276,838,484 3,690,935 1,135,122 279,394,297
Elementary Schools
Wolfe 17,980,406 427,992 45,455 18,362,943
Katy 7,878,313 8,496 8,044 7,878,765
West Memorial 13,211,371 58,793 73,040 13,197,124
Memorial Parkway 9,189,503 101,755 55,876 9,235,382
Hutsell 11,964,272 107,199 8,111 12,063,360
Bear Creek 11,869,704 9,148 31,416 11,847,436
Cimarron 9,425,827 22,114 46,584 9,401,357
Winborn 13,501,471 495,308 332,207 13,664,572
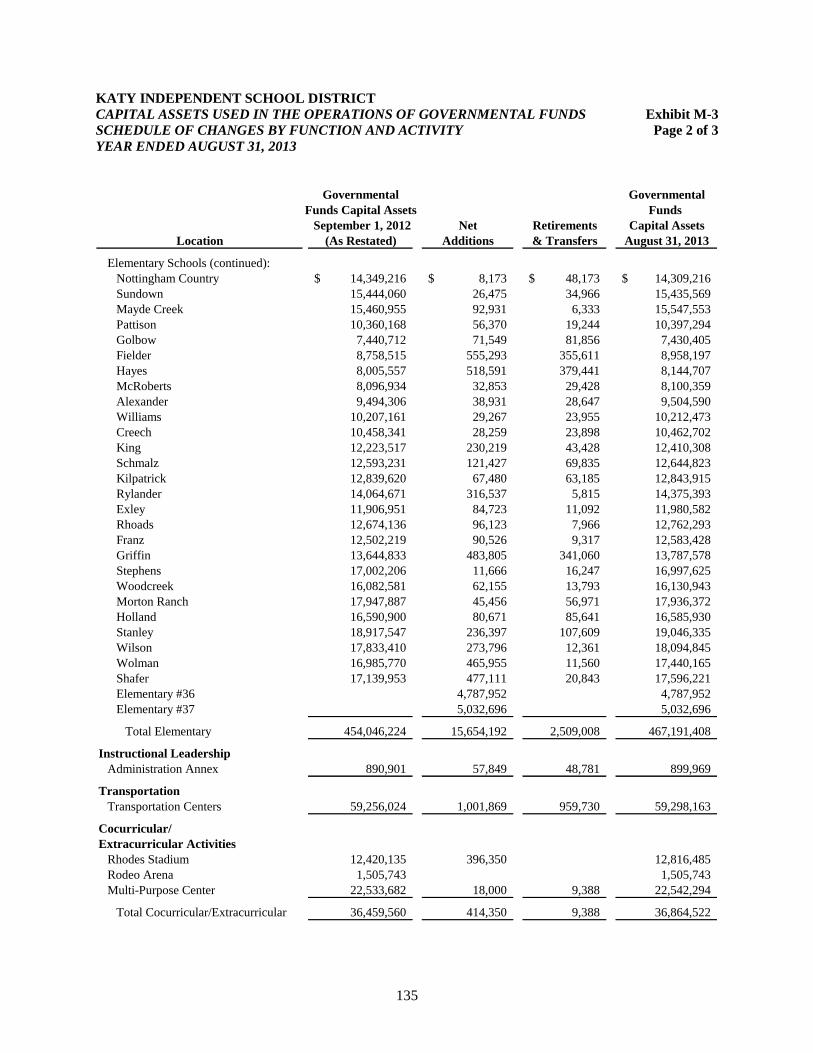
135
KATY INDEPENDENT SCHOOL DISTRICT
CAPITAL ASSETS USED IN THE OPERATIONS OF GOVERNMENTAL FUNDS Exhibit M-3
SCHEDULE OF CHANGES BY FUNCTION AND ACTIVITY Page 2 of 3
YEAR ENDED AUGUST 31, 2013
Governmental Governmental
Funds Capital Assets Funds
September 1, 2012 Net Retirements Capital Assets
Location (As Restated) Additions & Transfers August 31, 2013
Elementary Schools (continued):
Nottingham Country 14,349,216$ 8,173$ 48,173$ 14,309,216$
Sundown 15,444,060 26,475 34,966 15,435,569
Mayde Creek 15,460,955 92,931 6,333 15,547,553
Pattison 10,360,168 56,370 19,244 10,397,294
Golbow 7,440,712 71,549 81,856 7,430,405
Fielder 8,758,515 555,293 355,611 8,958,197
Hayes 8,005,557 518,591 379,441 8,144,707
McRoberts 8,096,934 32,853 29,428 8,100,359
Alexander 9,494,306 38,931 28,647 9,504,590
Williams 10,207,161 29,267 23,955 10,212,473
Creech 10,458,341 28,259 23,898 10,462,702
King 12,223,517 230,219 43,428 12,410,308
Schmalz 12,593,231 121,427 69,835 12,644,823
Kilpatrick 12,839,620 67,480 63,185 12,843,915
Rylander 14,064,671 316,537 5,815 14,375,393
Exley 11,906,951 84,723 11,092 11,980,582
Rhoads 12,674,136 96,123 7,966 12,762,293
Franz 12,502,219 90,526 9,317 12,583,428
Griffin 13,644,833 483,805 341,060 13,787,578
Stephens 17,002,206 11,666 16,247 16,997,625
Woodcreek 16,082,581 62,155 13,793 16,130,943
Morton Ranch 17,947,887 45,456 56,971 17,936,372
Holland 16,590,900 80,671 85,641 16,585,930
Stanley 18,917,547 236,397 107,609 19,046,335
Wilson 17,833,410 273,796 12,361 18,094,845
Wolman 16,985,770 465,955 11,560 17,440,165
Shafer 17,139,953 477,111 20,843 17,596,221
Elementary #36 4,787,952 4,787,952
Elementary #37 5,032,696 5,032,696
Total Elementary 454,046,224 15,654,192 2,509,008 467,191,408
Instructional Leadership
Administration Annex 890,901 57,849 48,781 899,969
Transportation
Transportation Centers 59,256,024 1,001,869 959,730 59,298,163
Cocurricular/
Extracurricular Activities
Rhodes Stadium 12,420,135 396,350 12,816,485
Rodeo Arena 1,505,743 1,505,743
Multi-Purpose Center 22,533,682 18,000 9,388 22,542,294
Total Cocurricular/Extracurricular 36,459,560 414,350 9,388 36,864,522
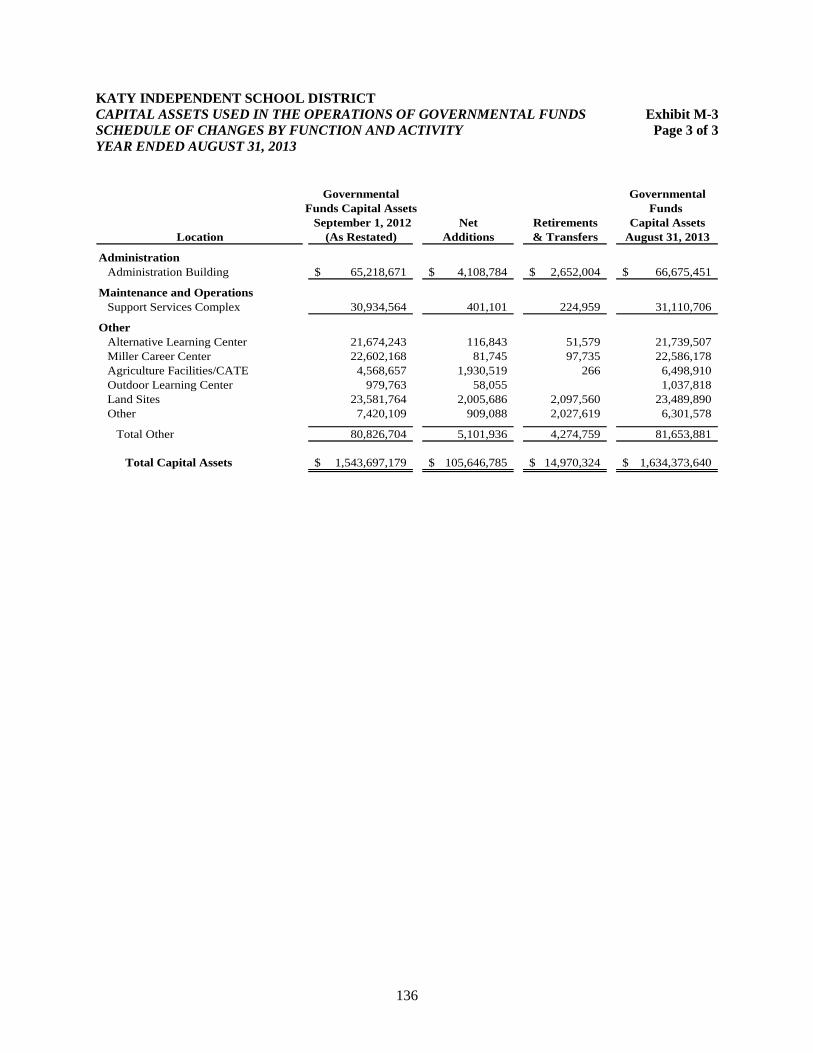
136
KATY INDEPENDENT SCHOOL DISTRICT
CAPITAL ASSETS USED IN THE OPERATIONS OF GOVERNMENTAL FUNDS Exhibit M-3
SCHEDULE OF CHANGES BY FUNCTION AND ACTIVITY Page 3 of 3
YEAR ENDED AUGUST 31, 2013
Governmental Governmental
Funds Capital Assets Funds
September 1, 2012 Net Retirements Capital Assets
Location (As Restated) Additions & Transfers August 31, 2013
Administration
Administration Building 65,218,671$ 4,108,784$ 2,652,004$ 66,675,451$
Maintenance and Operations
Support Services Complex 30,934,564 401,101 224,959 31,110,706
Other
Alternative Learning Center 21,674,243 116,843 51,579 21,739,507
Miller Career Center 22,602,168 81,745 97,735 22,586,178
Agriculture Facilities/CATE 4,568,657 1,930,519 266 6,498,910
Outdoor Learning Center 979,763 58,055 1,037,818
Land Sites 23,581,764 2,005,686 2,097,560 23,489,890
Other 7,420,109 909,088 2,027,619 6,301,578
Total Other 80,826,704 5,101,936 4,274,759 81,653,881
Total Capital Assets 1,543,697,179$ 105,646,785$ 14,970,324$ 1,634,373,640$
137
GENERAL LONG-TERM DEBT
ON
GOVERNMENTAL FUNDS
The purpose of the Long-Term Debt Accounts is to record and present the liability of the District for
long-term debt until the debt is retired. The long-term debt of the District consists of bonds issued for the
purposes of constructing and equipping new facilities, renovation of existing facilities, and obligations
related to compensated absences.
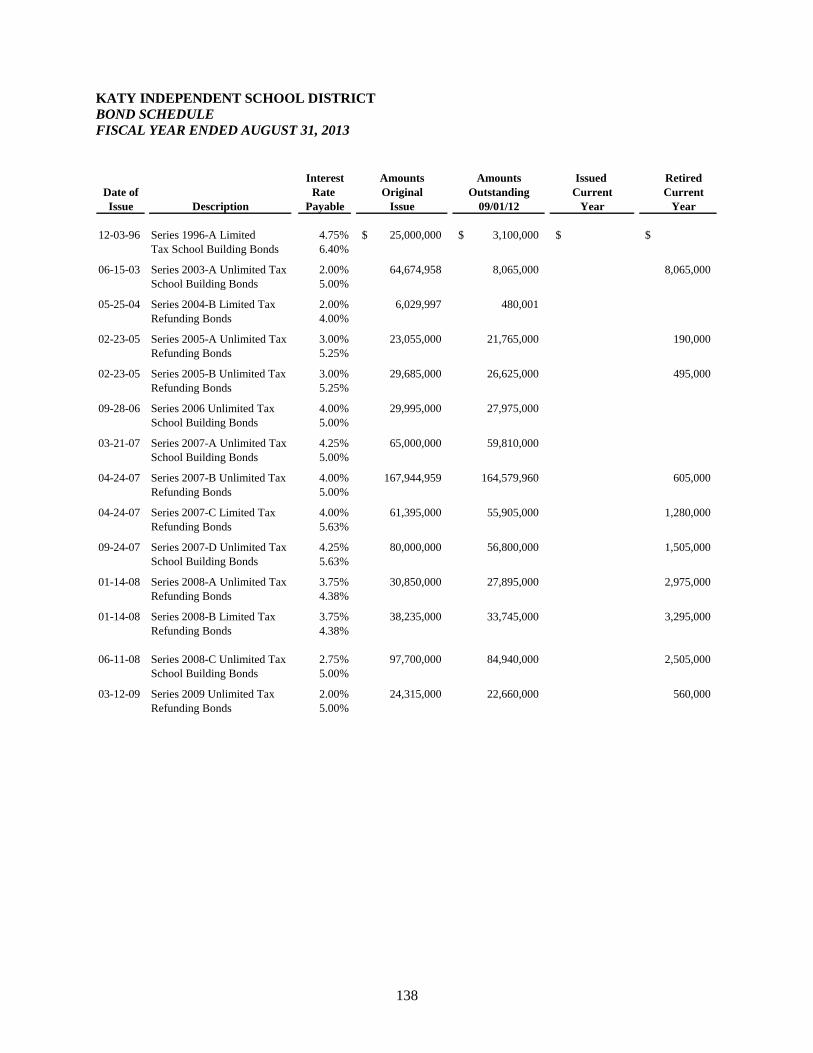
138
KATY INDEPENDENT SCHOOL DISTRICT
BOND SCHEDULE
FISCAL YEAR ENDED AUGUST 31, 2013
Interest Amounts Amounts Issued Retired
Date of Rate Original Outstanding Current Current
Issue Description Payable Issue 09/01/12 Year Year
12-03-96 Series 1996-A Limited 4.75% 25,000,000$ 3,100,000$ $ $
Tax School Building Bonds 6.40%
06-15-03 Series 2003-A Unlimited Tax 2.00% 64,674,958 8,065,000 8,065,000
School Building Bonds 5.00%
05-25-04 Series 2004-B Limited Tax 2.00% 6,029,997 480,001
Refunding Bonds 4.00%
02-23-05 Series 2005-A Unlimited Tax 3.00% 23,055,000 21,765,000 190,000
Refunding Bonds 5.25%
02-23-05 Series 2005-B Unlimited Tax 3.00% 29,685,000 26,625,000 495,000
Refunding Bonds 5.25%
09-28-06 Series 2006 Unlimited Tax 4.00% 29,995,000 27,975,000
School Building Bonds 5.00%
03-21-07 Series 2007-A Unlimited Tax 4.25% 65,000,000 59,810,000
School Building Bonds 5.00%
04-24-07 Series 2007-B Unlimited Tax 4.00% 167,944,959 164,579,960 605,000
Refunding Bonds 5.00%
04-24-07 Series 2007-C Limited Tax 4.00% 61,395,000 55,905,000 1,280,000
Refunding Bonds 5.63%
09-24-07 Series 2007-D Unlimited Tax 4.25% 80,000,000 56,800,000 1,505,000
School Building Bonds 5.63%
01-14-08 Series 2008-A Unlimited Tax 3.75% 30,850,000 27,895,000 2,975,000
Refunding Bonds 4.38%
01-14-08 Series 2008-B Limited Tax 3.75% 38,235,000 33,745,000 3,295,000
Refunding Bonds 4.38%
06-11-08 Series 2008-C Unlimited Tax 2.75% 97,700,000 84,940,000 2,505,000
School Building Bonds 5.00%
03-12-09 Series 2009 Unlimited Tax 2.00% 24,315,000 22,660,000 560,000
Refunding Bonds 5.00%
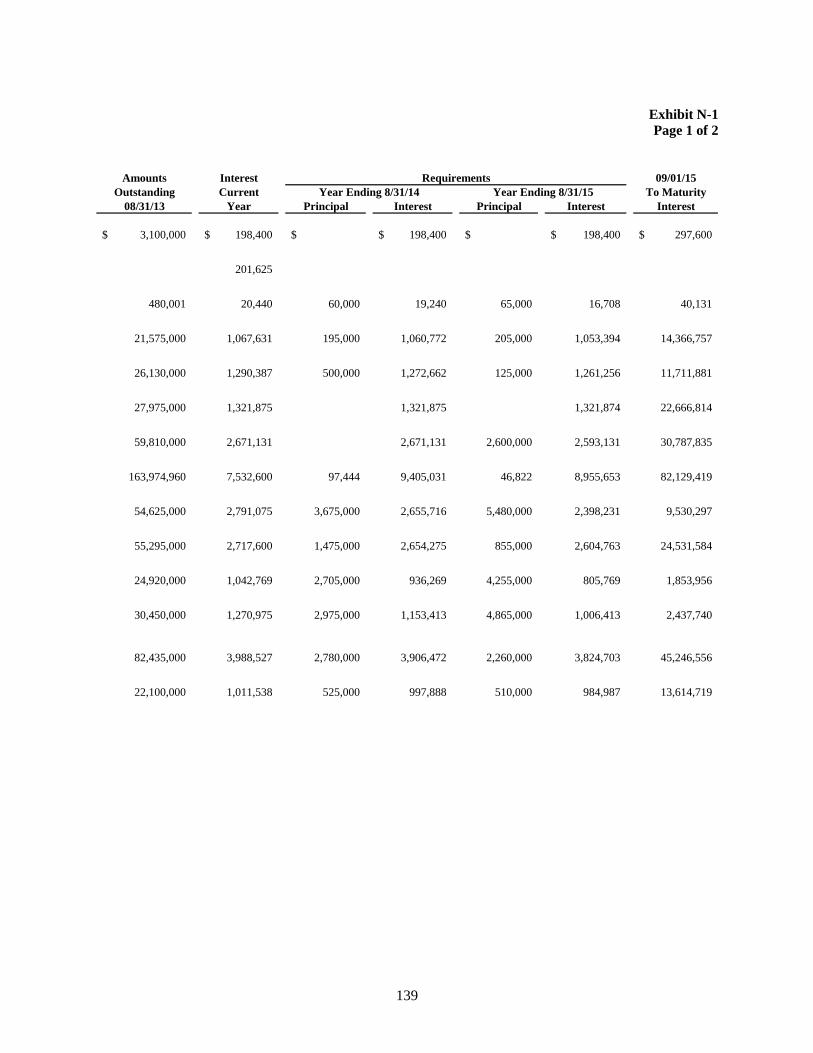
139
Exhibit N-1
Page 1 of 2
Amounts Interest Requirements 09/01/15
Outstanding Current Year Ending 8/31/14 Year Ending 8/31/15 To Maturity
08/31/13 Year Principal Interest Principal Interest Interest
3,100,000$ 198,400$ $ 198,400$ $ 198,400$ 297,600$
201,625
480,001 20,440 60,000 19,240 65,000 16,708 40,131
21,575,000 1,067,631 195,000 1,060,772 205,000 1,053,394 14,366,757
26,130,000 1,290,387 500,000 1,272,662 125,000 1,261,256 11,711,881
27,975,000 1,321,875 1,321,875 1,321,874 22,666,814
59,810,000 2,671,131 2,671,131 2,600,000 2,593,131 30,787,835
163,974,960 7,532,600 97,444 9,405,031 46,822 8,955,653 82,129,419
54,625,000 2,791,075 3,675,000 2,655,716 5,480,000 2,398,231 9,530,297
55,295,000 2,717,600 1,475,000 2,654,275 855,000 2,604,763 24,531,584
24,920,000 1,042,769 2,705,000 936,269 4,255,000 805,769 1,853,956
30,450,000 1,270,975 2,975,000 1,153,413 4,865,000 1,006,413 2,437,740
82,435,000 3,988,527 2,780,000 3,906,472 2,260,000 3,824,703 45,246,556
22,100,000 1,011,538 525,000 997,888 510,000 984,987 13,614,719
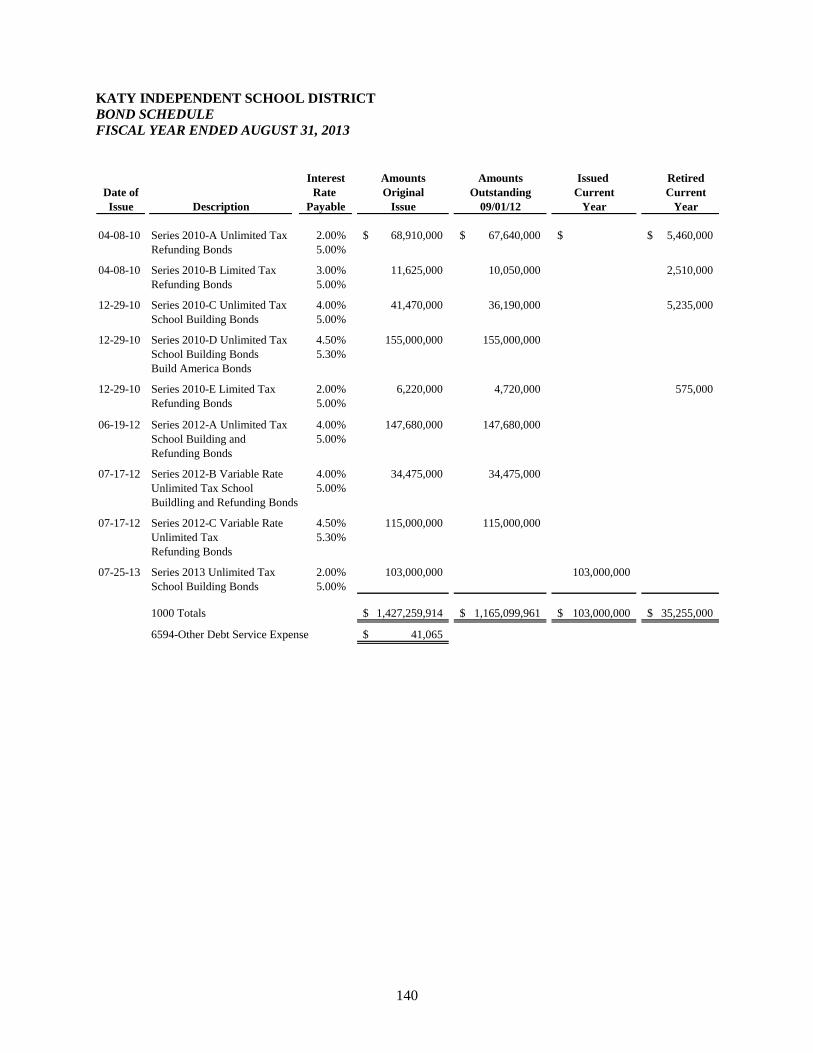
140
KATY INDEPENDENT SCHOOL DISTRICT
BOND SCHEDULE
FISCAL YEAR ENDED AUGUST 31, 2013
Interest Amounts Amounts Issued Retired
Date of Rate Original Outstanding Current Current
Issue Description Payable Issue 09/01/12 Year Year
04-08-10 Series 2010-A Unlimited Tax 2.00% 68,910,000$ 67,640,000$ $ 5,460,000$
Refunding Bonds 5.00%
04-08-10 Series 2010-B Limited Tax 3.00% 11,625,000 10,050,000 2,510,000
Refunding Bonds 5.00%
12-29-10 Series 2010-C Unlimited Tax 4.00% 41,470,000 36,190,000 5,235,000
School Building Bonds 5.00%
12-29-10 Series 2010-D Unlimited Tax 4.50% 155,000,000 155,000,000
School Building Bonds 5.30%
Build America Bonds
12-29-10 Series 2010-E Limited Tax 2.00% 6,220,000 4,720,000 575,000
Refunding Bonds 5.00%
06-19-12 Series 2012-A Unlimited Tax 4.00% 147,680,000 147,680,000
School Building and 5.00%
Refunding Bonds
07-17-12 Series 2012-B Variable Rate 4.00% 34,475,000 34,475,000
Unlimited Tax School 5.00%
Buildling and Refunding Bonds
07-17-12 Series 2012-C Variable Rate 4.50% 115,000,000 115,000,000
Unlimited Tax 5.30%
Refunding Bonds
07-25-13 Series 2013 Unlimited Tax 2.00% 103,000,000 103,000,000
School Building Bonds 5.00%
1000 Totals 1,427,259,914$ 1,165,099,961$ 103,000,000$ 35,255,000$
6594-Other Debt Service Expense 41,065$
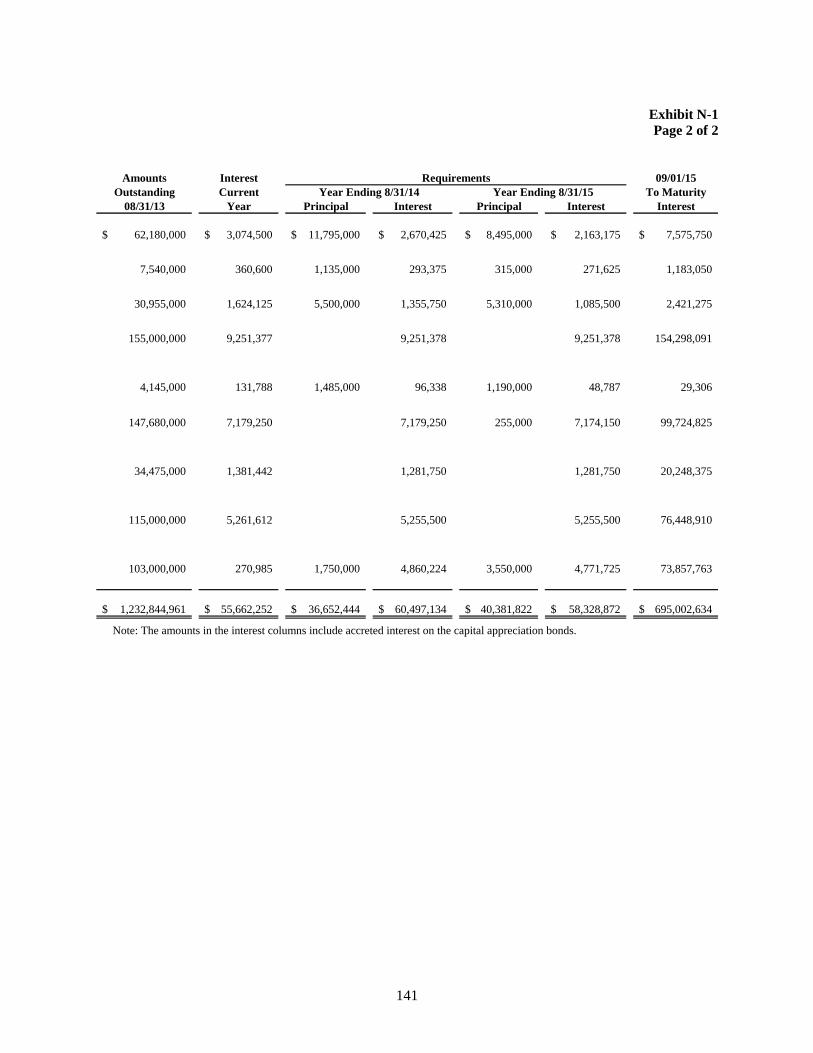
141
Exhibit N-1
Page 2 of 2
Amounts Interest Requirements 09/01/15
Outstanding Current Year Ending 8/31/14 Year Ending 8/31/15 To Maturity
08/31/13 Year Principal Interest Principal Interest Interest
62,180,000$ 3,074,500$ 11,795,000$ 2,670,425$ 8,495,000$ 2,163,175$ 7,575,750$
7,540,000 360,600 1,135,000 293,375 315,000 271,625 1,183,050
30,955,000 1,624,125 5,500,000 1,355,750 5,310,000 1,085,500 2,421,275
155,000,000 9,251,377 9,251,378 9,251,378 154,298,091
4,145,000 131,788 1,485,000 96,338 1,190,000 48,787 29,306
147,680,000 7,179,250 7,179,250 255,000 7,174,150 99,724,825
34,475,000 1,381,442 1,281,750 1,281,750 20,248,375
115,000,000 5,261,612 5,255,500 5,255,500 76,448,910
103,000,000 270,985 1,750,000 4,860,224 3,550,000 4,771,725 73,857,763
1,232,844,961$ 55,662,252$ 36,652,444$ 60,497,134$ 40,381,822$ 58,328,872$ 695,002,634$
Note: The amounts in the interest columns include accreted interest on the capital appreciation bonds.

142
THIS PAGE INTENTIONALLY LEFT BLANK
143
COMPLIANCE SCHEDULES
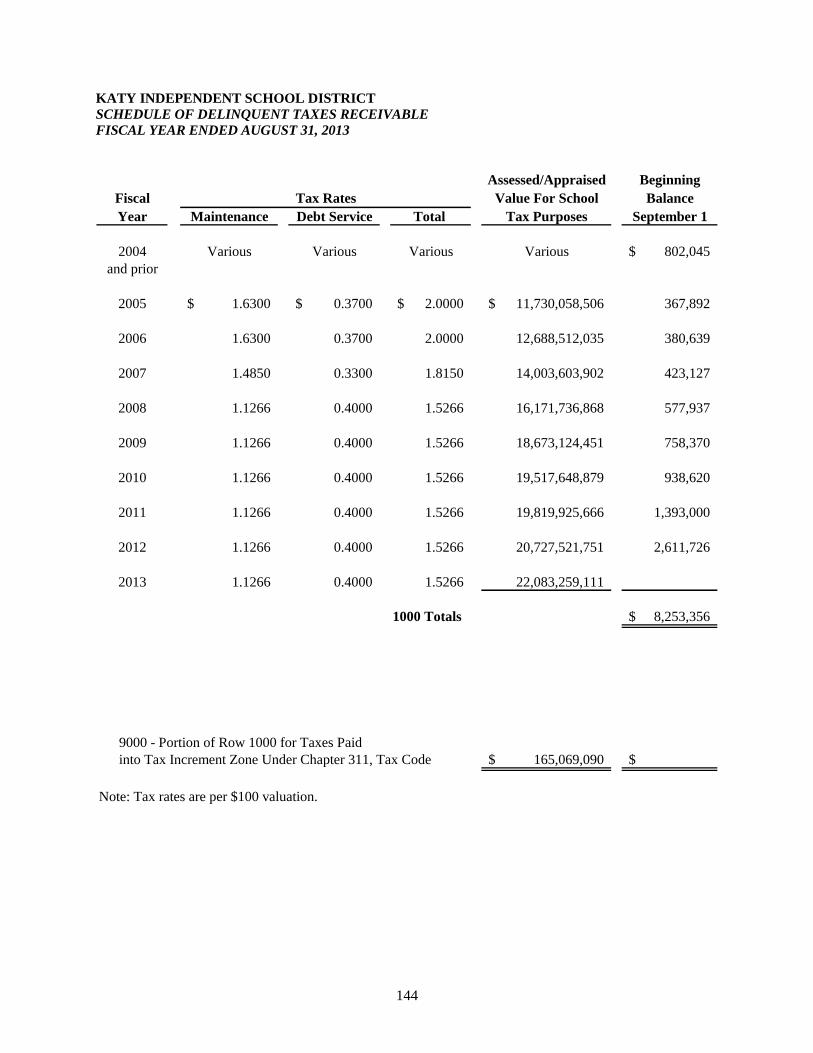
144
KATY INDEPENDENT SCHOOL DISTRICT
SCHEDULE OF DELINQUENT TAXES RECEIVABLE
FISCAL YEAR ENDED AUGUST 31, 2013
Assessed/Appraised Beginning
Fiscal Value For School Balance
Year Maintenance Debt Service Total Tax Purposes September 1
2004 Various Various Various Various 802,045$
and prior
2005 1.6300$ 0.3700$ 2.0000$ 11,730,058,506$ 367,892
2006 1.6300 0.3700 2.0000 12,688,512,035 380,639
2007 1.4850 0.3300 1.8150 14,003,603,902 423,127
2008 1.1266 0.4000 1.5266 16,171,736,868 577,937
2009 1.1266 0.4000 1.5266 18,673,124,451 758,370
2010 1.1266 0.4000 1.5266 19,517,648,879 938,620
2011 1.1266 0.4000 1.5266 19,819,925,666 1,393,000
2012 1.1266 0.4000 1.5266 20,727,521,751 2,611,726
2013 1.1266 0.4000 1.5266 22,083,259,111
1000 Totals 8,253,356$
9000 - Portion of Row 1000 for Taxes Paid
into Tax Increment Zone Under Chapter 311, Tax Code 165,069,090$ $
Note: Tax rates are per $100 valuation.
Tax Rates
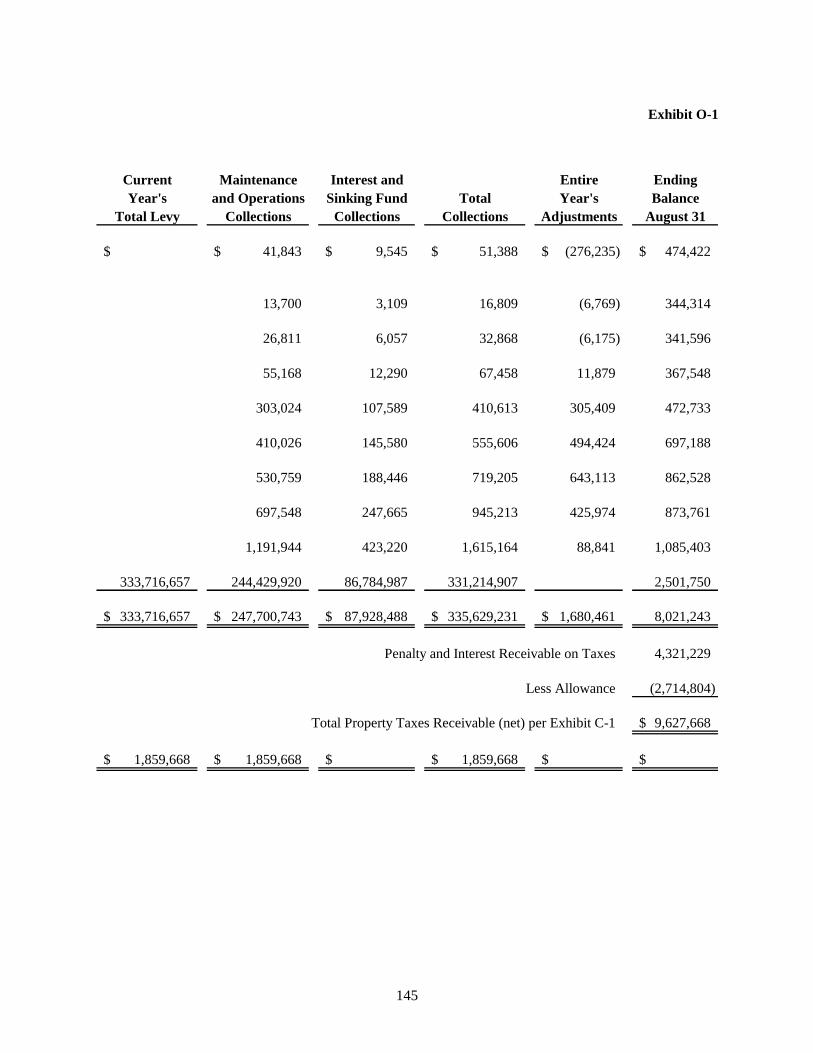
145
Exhibit O-1
Current Maintenance Interest and Entire Ending
Year's and Operations Sinking Fund Total Year's Balance
Total Levy Collections Collections Collections Adjustments August 31
$ 41,843$ 9,545$ 51,388$ (276,235)$ 474,422$
13,700 3,109 16,809 (6,769) 344,314
26,811 6,057 32,868 (6,175) 341,596
55,168 12,290 67,458 11,879 367,548
303,024 107,589 410,613 305,409 472,733
410,026 145,580 555,606 494,424 697,188
530,759 188,446 719,205 643,113 862,528
697,548 247,665 945,213 425,974 873,761
1,191,944 423,220 1,615,164 88,841 1,085,403
333,716,657 244,429,920 86,784,987 331,214,907 2,501,750
333,716,657$ 247,700,743$ 87,928,488$ 335,629,231$ 1,680,461$ 8,021,243
Penalty and Interest Receivable on Taxes 4,321,229
Less Allowance (2,714,804)
Total Property Taxes Receivable (net) per Exhibit C-1 9,627,668$
1,859,668$ 1,859,668$ $ 1,859,668$ $ $
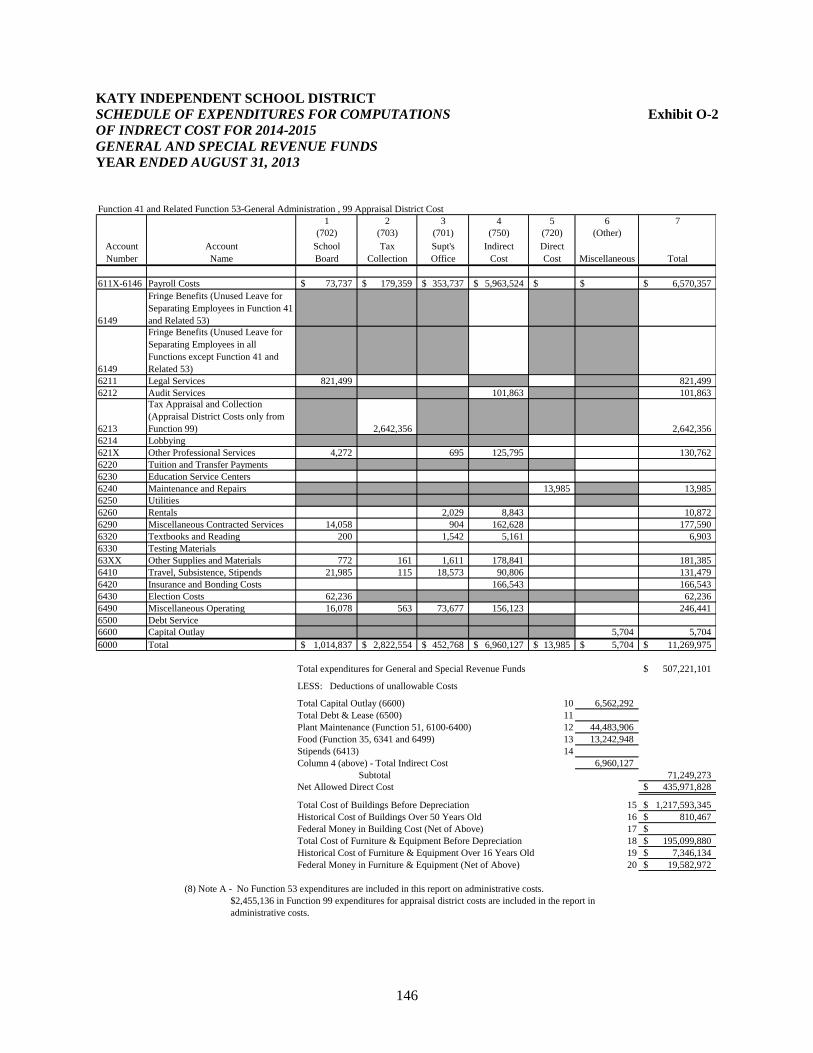
146
KATY INDEPENDENT SCHOOL DISTRICT
SCHEDULE OF EXPENDITURES FOR COMPUTATIONS Exhibit O-2
OF INDRECT COST FOR 2014-2015
GENERAL AND SPECIAL REVENUE FUNDS
YEAR ENDED AUGUST 31, 2013
Function 41 and Related Function 53-General Administration , 99 Appraisal District Cost
1 2 3 4 5 6 7
(702) (703) (701) (750) (720) (Other)
Account Account School Tax Supt's Indirect Direct
Number Name Board Collection Office Cost Cost Miscellaneous Total
611X-6146 Payroll Costs 73,737$ 179,359$ 353,737$ 5,963,524$ $ $ 6,570,357$
6149
Fringe Benefits (Unused Leave for
Separating Employees in Function 41
and Related 53)
6149
Fringe Benefits (Unused Leave for
Separating Employees in all
Functions except Function 41 and
Related 53)
6211 Legal Services 821,499 821,499
6212 Audit Services 101,863 101,863
6213
Tax Appraisal and Collection
(Appraisal District Costs only from
Function 99) 2,642,356 2,642,356
6214 Lobbying
621X Other Professional Services 4,272 695 125,795 130,762
6220 Tuition and Transfer Payments
6230 Education Service Centers
6240 Maintenance and Repairs 13,985 13,985
6250 Utilities
6260 Rentals 2,029 8,843 10,872
6290 Miscellaneous Contracted Services 14,058 904 162,628 177,590
6320 Textbooks and Reading 200 1,542 5,161 6,903
6330 Testing Materials
63XX Other Supplies and Materials 772 161 1,611 178,841 181,385
6410 Travel, Subsistence, Stipends 21,985 115 18,573 90,806 131,479
6420 Insurance and Bonding Costs 166,543 166,543
6430 Election Costs 62,236 62,236
6490 Miscellaneous Operating 16,078 563 73,677 156,123 246,441
6500 Debt Service
6600 Capital Outlay 5,704 5,704
6000 Total 1,014,837$ 2,822,554$ 452,768$ 6,960,127$ 13,985$ 5,704$ 11,269,975$
Total expenditures for General and Special Revenue Funds 507,221,101$
LESS: Deductions of unallowable Costs
Total Capital Outlay (6600) 10 6,562,292
Total Debt & Lease (6500) 11
Plant Maintenance (Function 51, 6100-6400) 12 44,483,906
Food (Function 35, 6341 and 6499) 13 13,242,948
Stipends (6413) 14
Column 4 (above) - Total Indirect Cost 6,960,127
Subtotal 71,249,273
Net Allowed Direct Cost 435,971,828$
Total Cost of Buildings Before Depreciation 15 1,217,593,345$
Historical Cost of Buildings Over 50 Years Old 16 810,467$
Federal Money in Building Cost (Net of Above) 17 $
Total Cost of Furniture & Equipment Before Depreciation 18 195,099,880$
Historical Cost of Furniture & Equipment Over 16 Years Old 19 7,346,134$
Federal Money in Furniture & Equipment (Net of Above) 20 19,582,972$
(8) Note A - No Function 53 expenditures are included in this report on administrative costs.
$2,455,136 in Function 99 expenditures for appraisal district costs are included in the report in
administrative costs.
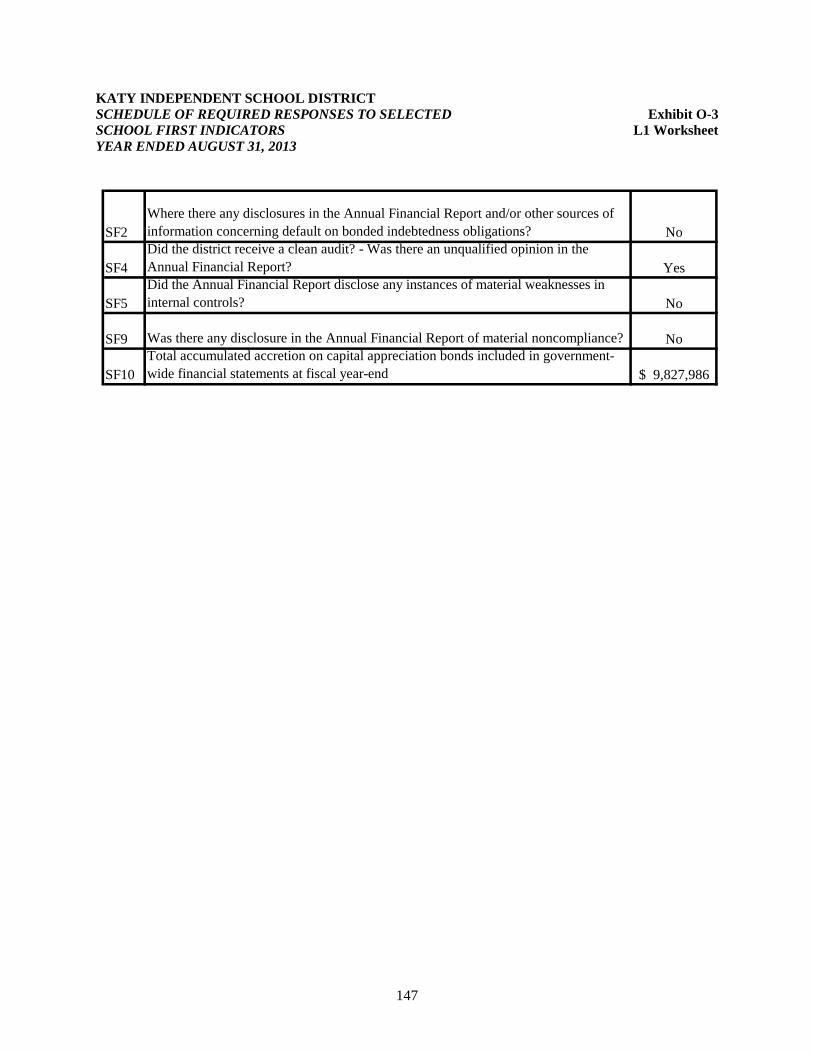
147
KATY INDEPENDENT SCHOOL DISTRICT
SCHEDULE OF REQUIRED RESPONSES TO SELECTED Exhibit O-3
SCHOOL FIRST INDICATORS L1 Worksheet
YEAR ENDED AUGUST 31, 2013
SF2
Where there any disclosures in the Annual Financial Report and/or other sources of
information concerning default on bonded indebtedness obligations? No
SF4
Did the district receive a clean audit? - Was there an unqualified opinion in the
Annual Financial Report? Yes
SF5
Did the Annual Financial Report disclose any instances of material weaknesses in
internal controls? No
SF9 Was there any disclosure in the Annual Financial Report of material noncompliance? No
SF10
Total accumulated accretion on capital appreciation bonds included in government-
wide financial statements at fiscal year-end 9,827,986$

148
THIS PAGE INTENTIONALLY LEFT BLANK
149
STATISTICAL SECTION (UNAUDITED)
The statistical section of the Katy Independent School District’s Comprehensive Annual
Financial Report presents detailed information as a context for understanding what the
information in the financial statements, note disclosures, and required supplementary information
says about the District’s economic condition and overall financial health. To assist financial
statement users, the information contained within this section is categorized as follows:
Financial Trends Information These schedules contain trend information to show how the District’s financial performance
and position have changed over time.
Revenue Capacity Information
These schedules contain information to help assess the factors affecting the District’s most
significant local revenue source, the property tax.
Debt Capacity Information These schedules present information to help assess the affordability of the District’s current
debt burden and its ability to issue additional debt in the future.
Demographic and Economic Information These schedules provide demographic and economic indicators to help in understanding the
environment in which the District operates and to facilitate in comparisons over time.
Operating Information These schedules provide information about the District’s operations and resources to assist in
using the financial statement information to better understand and assess the District’s
economic condition.

150
THIS PAGE INTENTIONALLY LEFT BLANK
151
FINANCIAL TRENDS INFORMATION
These schedules contain trend information to assist users in understanding how the District’s
financial position has changed over time.
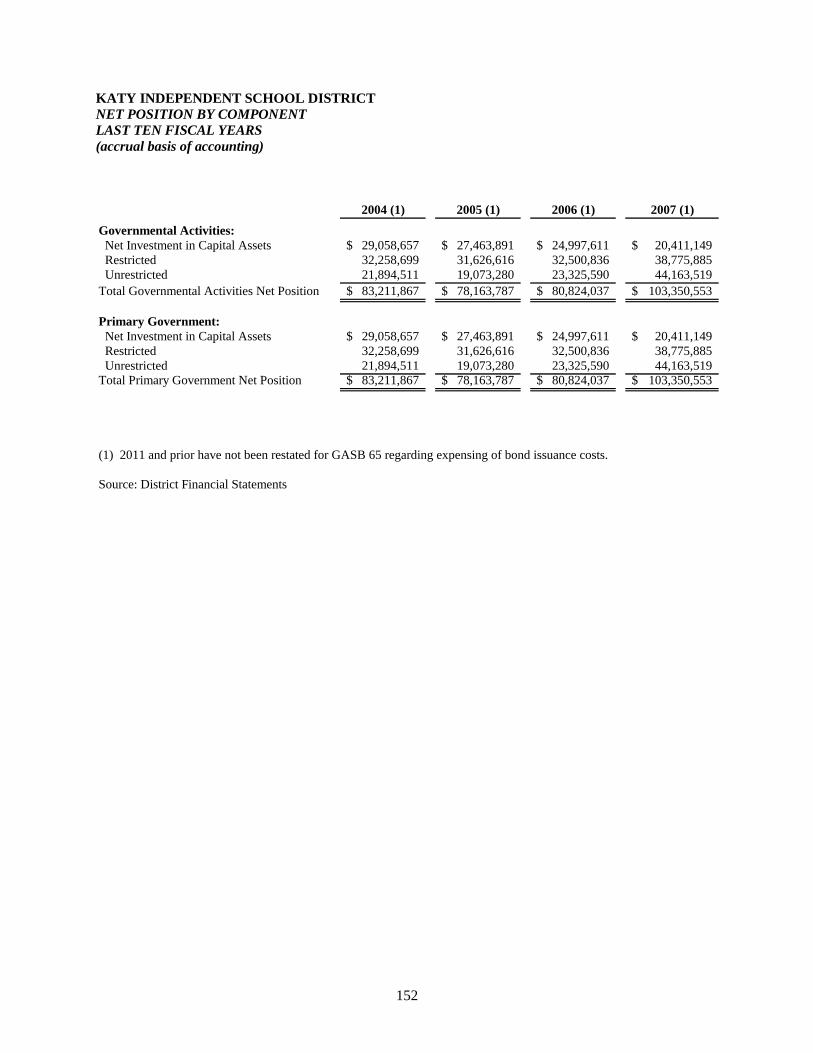
152
KATY INDEPENDENT SCHOOL DISTRICT
NET POSITION BY COMPONENT
LAST TEN FISCAL YEARS
(accrual basis of accounting)
2004 (1) 2005 (1) 2006 (1) 2007 (1)
Governmental Activities:
Net Investment in Capital Assets 29,058,657$ 27,463,891$ 24,997,611$ 20,411,149$
Restricted 32,258,699 31,626,616 32,500,836 38,775,885
Unrestricted 21,894,511 19,073,280 23,325,590 44,163,519
Total Governmental Activities Net Position 83,211,867$ 78,163,787$ 80,824,037$ 103,350,553$
Primary Government:
Net Investment in Capital Assets 29,058,657$ 27,463,891$ 24,997,611$ 20,411,149$
Restricted 32,258,699 31,626,616 32,500,836 38,775,885
Unrestricted 21,894,511 19,073,280 23,325,590 44,163,519
Total Primary Government Net Position 83,211,867$ 78,163,787$ 80,824,037$ 103,350,553$
(1) 2011 and prior have not been restated for GASB 65 regarding expensing of bond issuance costs.
Source: District Financial Statements
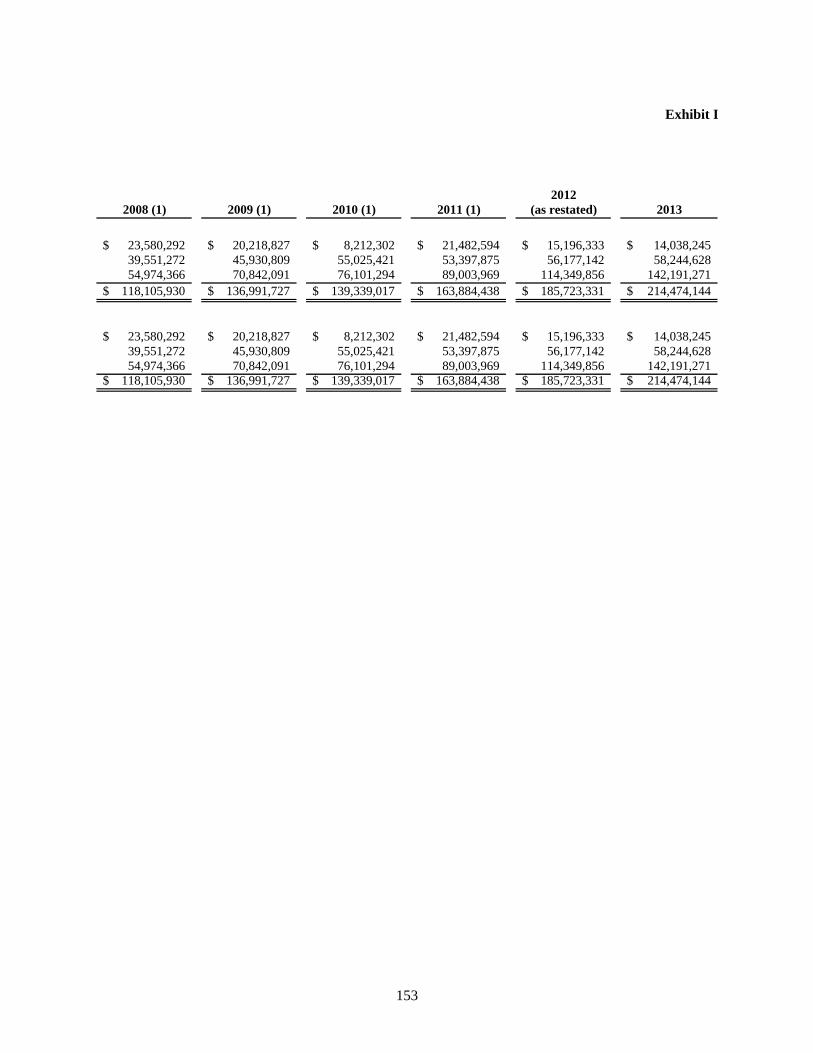
153
Exhibit I
2012
2008 (1) 2009 (1) 2010 (1) 2011 (1) (as restated) 2013
23,580,292$ 20,218,827$ 8,212,302$ 21,482,594$ 15,196,333$ 14,038,245$
39,551,272 45,930,809 55,025,421 53,397,875 56,177,142 58,244,628
54,974,366 70,842,091 76,101,294 89,003,969 114,349,856 142,191,271
118,105,930$ 136,991,727$ 139,339,017$ 163,884,438$ 185,723,331$ 214,474,144$
23,580,292$ 20,218,827$ 8,212,302$ 21,482,594$ 15,196,333$ 14,038,245$
39,551,272 45,930,809 55,025,421 53,397,875 56,177,142 58,244,628
54,974,366 70,842,091 76,101,294 89,003,969 114,349,856 142,191,271
118,105,930$ 136,991,727$ 139,339,017$ 163,884,438$ 185,723,331$ 214,474,144$
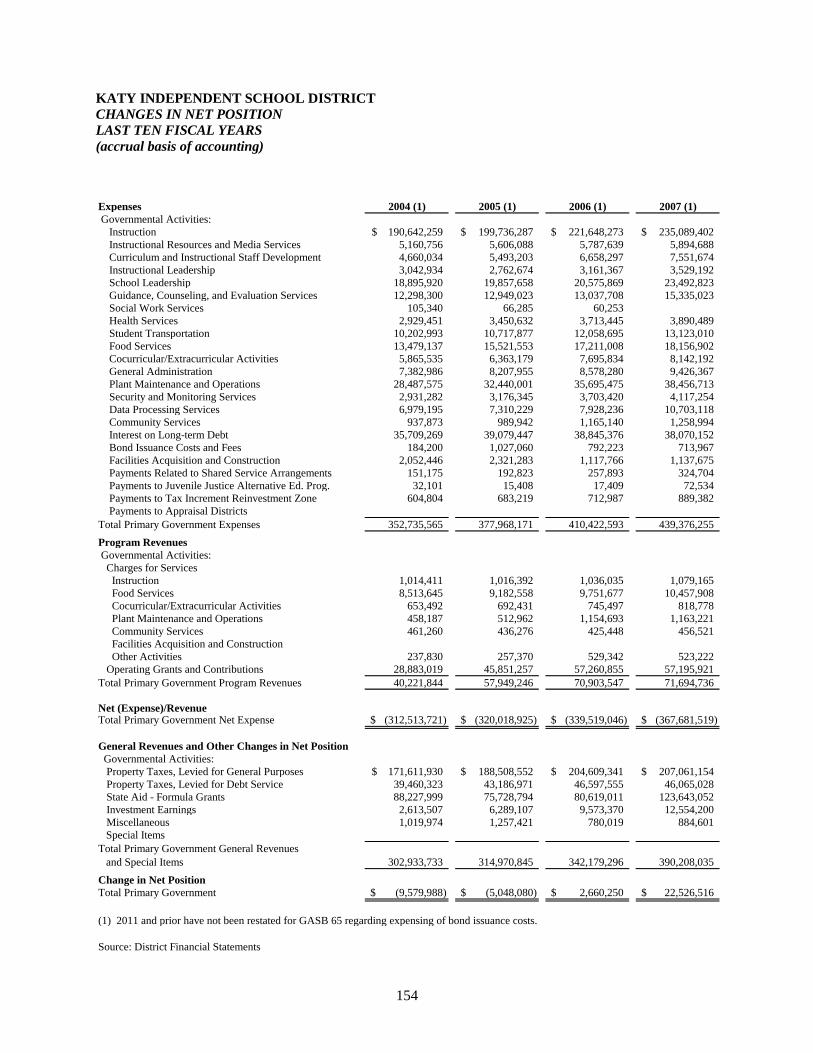
154
KATY INDEPENDENT SCHOOL DISTRICT
CHANGES IN NET POSITION
LAST TEN FISCAL YEARS
(accrual basis of accounting)
Expenses 2004 (1) 2005 (1) 2006 (1) 2007 (1)
Governmental Activities:
Instruction 190,642,259$ 199,736,287$ 221,648,273$ 235,089,402$
Instructional Resources and Media Services 5,160,756 5,606,088 5,787,639 5,894,688
Curriculum and Instructional Staff Development 4,660,034 5,493,203 6,658,297 7,551,674
Instructional Leadership 3,042,934 2,762,674 3,161,367 3,529,192
School Leadership 18,895,920 19,857,658 20,575,869 23,492,823
Guidance, Counseling, and Evaluation Services 12,298,300 12,949,023 13,037,708 15,335,023
Social Work Services 105,340 66,285 60,253
Health Services 2,929,451 3,450,632 3,713,445 3,890,489
Student Transportation 10,202,993 10,717,877 12,058,695 13,123,010
Food Services 13,479,137 15,521,553 17,211,008 18,156,902
Cocurricular/Extracurricular Activities 5,865,535 6,363,179 7,695,834 8,142,192
General Administration 7,382,986 8,207,955 8,578,280 9,426,367
Plant Maintenance and Operations 28,487,575 32,440,001 35,695,475 38,456,713
Security and Monitoring Services 2,931,282 3,176,345 3,703,420 4,117,254
Data Processing Services 6,979,195 7,310,229 7,928,236 10,703,118
Community Services 937,873 989,942 1,165,140 1,258,994
Interest on Long-term Debt 35,709,269 39,079,447 38,845,376 38,070,152
Bond Issuance Costs and Fees 184,200 1,027,060 792,223 713,967
Facilities Acquisition and Construction 2,052,446 2,321,283 1,117,766 1,137,675
Payments Related to Shared Service Arrangements 151,175 192,823 257,893 324,704
Payments to Juvenile Justice Alternative Ed. Prog. 32,101 15,408 17,409 72,534
Payments to Tax Increment Reinvestment Zone 604,804 683,219 712,987 889,382
Payments to Appraisal Districts
Total Primary Government Expenses 352,735,565 377,968,171 410,422,593 439,376,255
Program Revenues
Governmental Activities:
Charges for Services
Instruction 1,014,411 1,016,392 1,036,035 1,079,165
Food Services 8,513,645 9,182,558 9,751,677 10,457,908
Cocurricular/Extracurricular Activities 653,492 692,431 745,497 818,778
Plant Maintenance and Operations 458,187 512,962 1,154,693 1,163,221
Community Services 461,260 436,276 425,448 456,521
Facilities Acquisition and Construction
Other Activities 237,830 257,370 529,342 523,222
Operating Grants and Contributions 28,883,019 45,851,257 57,260,855 57,195,921
Total Primary Government Program Revenues 40,221,844 57,949,246 70,903,547 71,694,736
Net (Expense)/RevenueTotal Primary Government Net Expense (312,513,721)$ (320,018,925)$ (339,519,046)$ (367,681,519)$
General Revenues and Other Changes in Net Position
Governmental Activities:
Property Taxes, Levied for General Purposes 171,611,930$ 188,508,552$ 204,609,341$ 207,061,154$
Property Taxes, Levied for Debt Service 39,460,323 43,186,971 46,597,555 46,065,028
State Aid - Formula Grants 88,227,999 75,728,794 80,619,011 123,643,052
Investment Earnings 2,613,507 6,289,107 9,573,370 12,554,200
Miscellaneous 1,019,974 1,257,421 780,019 884,601
Special Items
Total Primary Government General Revenues
and Special Items 302,933,733 314,970,845 342,179,296 390,208,035
Change in Net Position
Total Primary Government (9,579,988)$ (5,048,080)$ 2,660,250$ 22,526,516$
(1) 2011 and prior have not been restated for GASB 65 regarding expensing of bond issuance costs.
Source: District Financial Statements
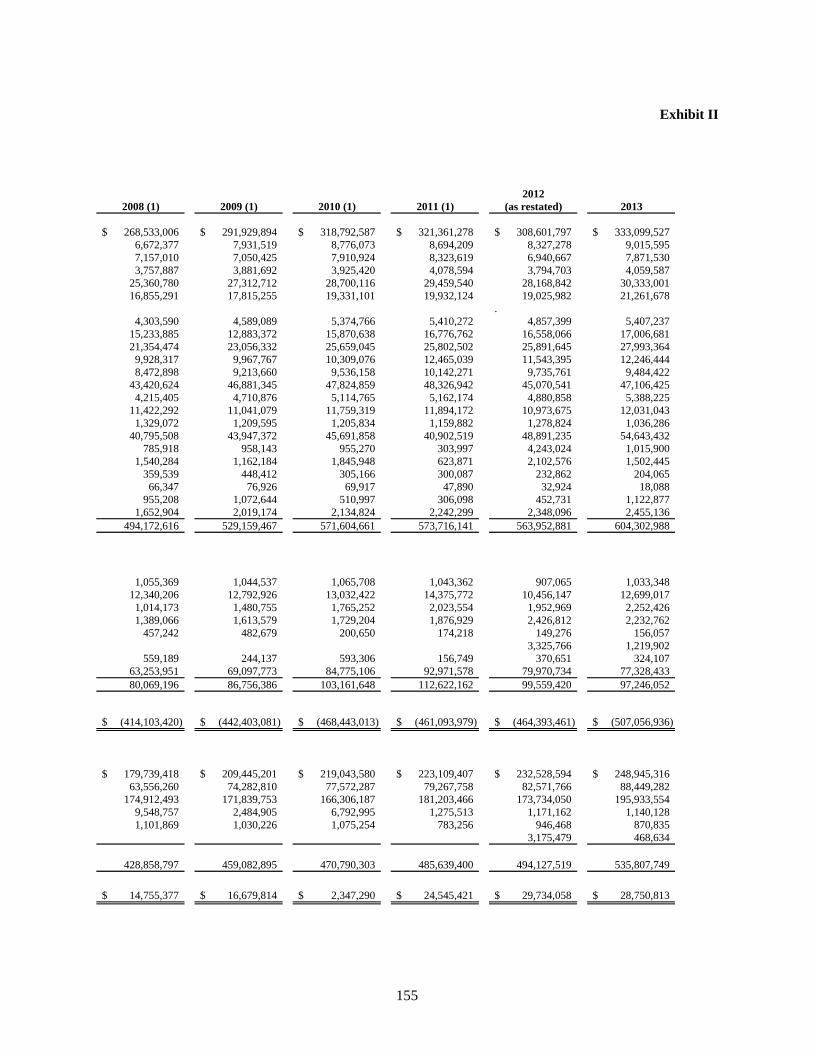
155
Exhibit II
2012
2008 (1) 2009 (1) 2010 (1) 2011 (1) (as restated) 2013
268,533,006$ 291,929,894$ 318,792,587$ 321,361,278$ 308,601,797$ 333,099,527$
6,672,377 7,931,519 8,776,073 8,694,209 8,327,278 9,015,595
7,157,010 7,050,425 7,910,924 8,323,619 6,940,667 7,871,530
3,757,887 3,881,692 3,925,420 4,078,594 3,794,703 4,059,587
25,360,780 27,312,712 28,700,116 29,459,540 28,168,842 30,333,001
16,855,291 17,815,255 19,331,101 19,932,124 19,025,982 21,261,678
.
4,303,590 4,589,089 5,374,766 5,410,272 4,857,399 5,407,237
15,233,885 12,883,372 15,870,638 16,776,762 16,558,066 17,006,681
21,354,474 23,056,332 25,659,045 25,802,502 25,891,645 27,993,364
9,928,317 9,967,767 10,309,076 12,465,039 11,543,395 12,246,444
8,472,898 9,213,660 9,536,158 10,142,271 9,735,761 9,484,422
43,420,624 46,881,345 47,824,859 48,326,942 45,070,541 47,106,425
4,215,405 4,710,876 5,114,765 5,162,174 4,880,858 5,388,225
11,422,292 11,041,079 11,759,319 11,894,172 10,973,675 12,031,043
1,329,072 1,209,595 1,205,834 1,159,882 1,278,824 1,036,286
40,795,508 43,947,372 45,691,858 40,902,519 48,891,235 54,643,432
785,918 958,143 955,270 303,997 4,243,024 1,015,900
1,540,284 1,162,184 1,845,948 623,871 2,102,576 1,502,445
359,539 448,412 305,166 300,087 232,862 204,065
66,347 76,926 69,917 47,890 32,924 18,088
955,208 1,072,644 510,997 306,098 452,731 1,122,877
1,652,904 2,019,174 2,134,824 2,242,299 2,348,096 2,455,136
494,172,616 529,159,467 571,604,661 573,716,141 563,952,881 604,302,988
1,055,369 1,044,537 1,065,708 1,043,362 907,065 1,033,348
12,340,206 12,792,926 13,032,422 14,375,772 10,456,147 12,699,017
1,014,173 1,480,755 1,765,252 2,023,554 1,952,969 2,252,426
1,389,066 1,613,579 1,729,204 1,876,929 2,426,812 2,232,762
457,242 482,679 200,650 174,218 149,276 156,057
3,325,766 1,219,902
559,189 244,137 593,306 156,749 370,651 324,107
63,253,951 69,097,773 84,775,106 92,971,578 79,970,734 77,328,433
80,069,196 86,756,386 103,161,648 112,622,162 99,559,420 97,246,052
(414,103,420)$ (442,403,081)$ (468,443,013)$ (461,093,979)$ (464,393,461)$ (507,056,936)$
179,739,418$ 209,445,201$ 219,043,580$ 223,109,407$ 232,528,594$ 248,945,316$
63,556,260 74,282,810 77,572,287 79,267,758 82,571,766 88,449,282
174,912,493 171,839,753 166,306,187 181,203,466 173,734,050 195,933,554
9,548,757 2,484,905 6,792,995 1,275,513 1,171,162 1,140,128
1,101,869 1,030,226 1,075,254 783,256 946,468 870,835
3,175,479 468,634
428,858,797 459,082,895 470,790,303 485,639,400 494,127,519 535,807,749
14,755,377$ 16,679,814$ 2,347,290$ 24,545,421$ 29,734,058$ 28,750,813$
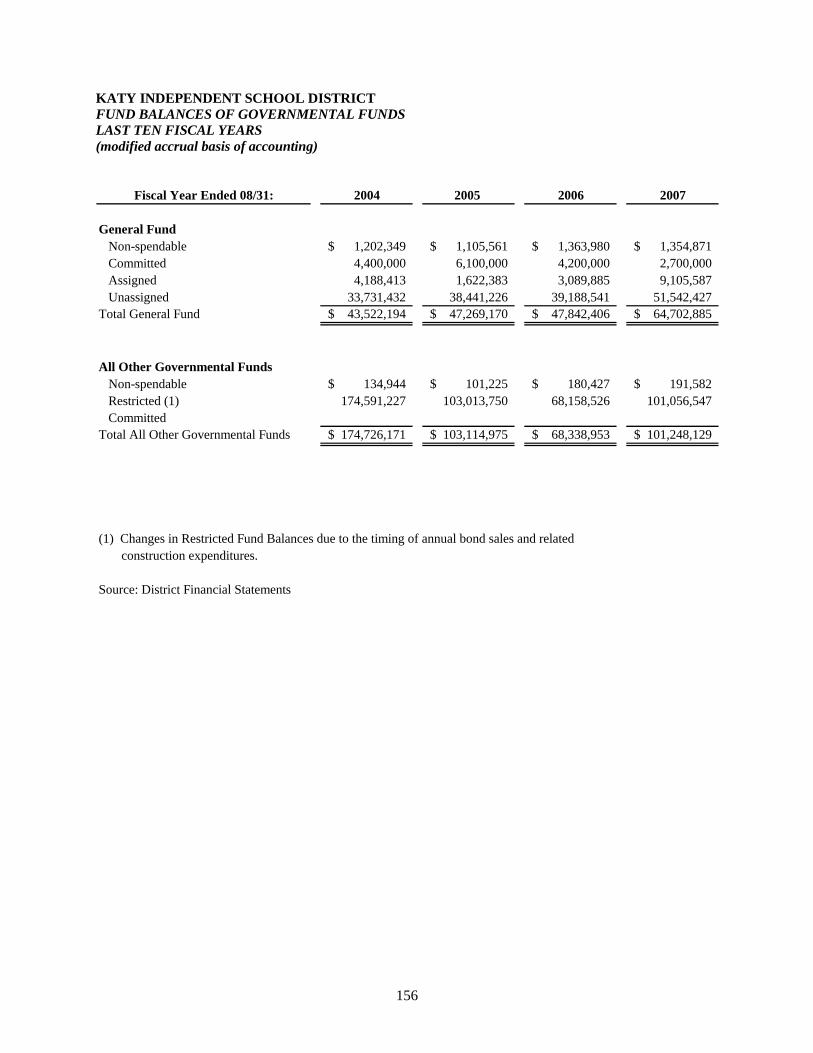
156
KATY INDEPENDENT SCHOOL DISTRICT
FUND BALANCES OF GOVERNMENTAL FUNDS
LAST TEN FISCAL YEARS
(modified accrual basis of accounting)
Fiscal Year Ended 08/31: 2004 2005 2006 2007
General Fund
Non-spendable 1,202,349$ 1,105,561$ 1,363,980$ 1,354,871$
Committed 4,400,000 6,100,000 4,200,000 2,700,000
Assigned 4,188,413 1,622,383 3,089,885 9,105,587
Unassigned 33,731,432 38,441,226 39,188,541 51,542,427
Total General Fund 43,522,194$ 47,269,170$ 47,842,406$ 64,702,885$
All Other Governmental Funds
Non-spendable 134,944$ 101,225$ 180,427$ 191,582$
Restricted (1) 174,591,227 103,013,750 68,158,526 101,056,547
Committed
Total All Other Governmental Funds 174,726,171$ 103,114,975$ 68,338,953$ 101,248,129$
(1) Changes in Restricted Fund Balances due to the timing of annual bond sales and related
construction expenditures.
Source: District Financial Statements
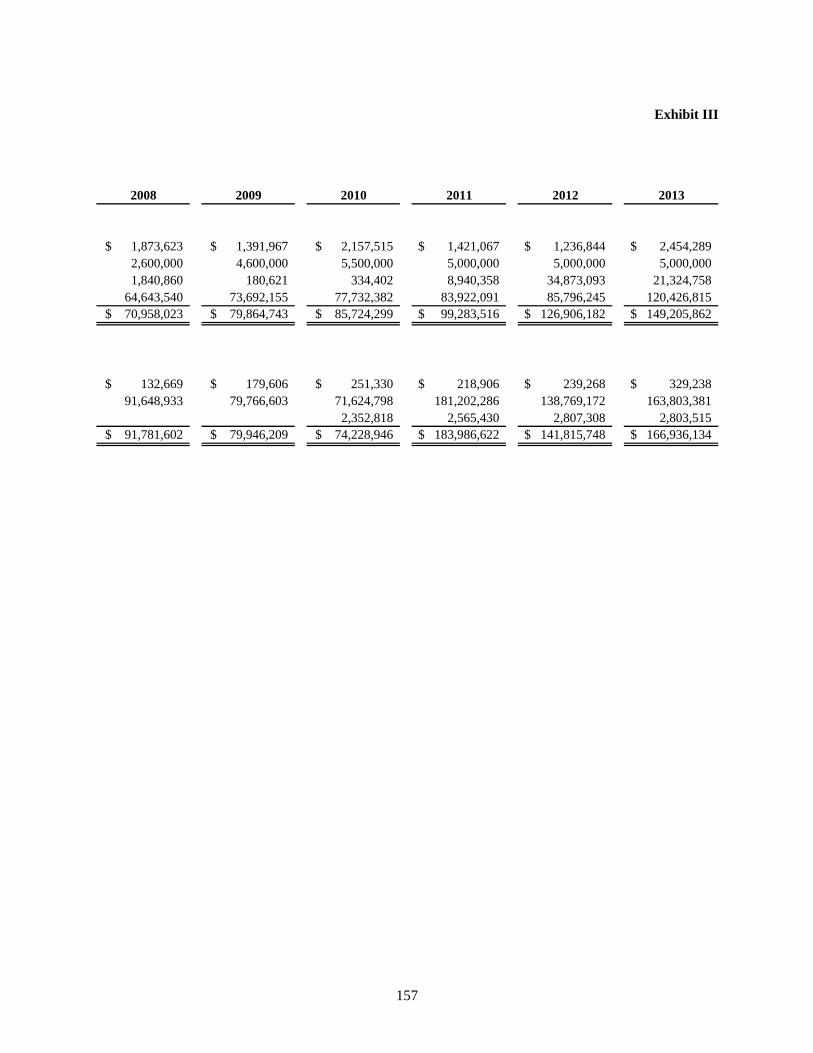
157
Exhibit III
2008 2009 2010 2011 2012 2013
1,873,623$ 1,391,967$ 2,157,515$ 1,421,067$ 1,236,844$ 2,454,289$
2,600,000 4,600,000 5,500,000 5,000,000 5,000,000 5,000,000
1,840,860 180,621 334,402 8,940,358 34,873,093 21,324,758
64,643,540 73,692,155 77,732,382 83,922,091 85,796,245 120,426,815
70,958,023$ 79,864,743$ 85,724,299$ 99,283,516$ 126,906,182$ 149,205,862$
132,669$ 179,606$ 251,330$ 218,906$ 239,268$ 329,238$
91,648,933 79,766,603 71,624,798 181,202,286 138,769,172 163,803,381
2,352,818 2,565,430 2,807,308 2,803,515
91,781,602$ 79,946,209$ 74,228,946$ 183,986,622$ 141,815,748$ 166,936,134$
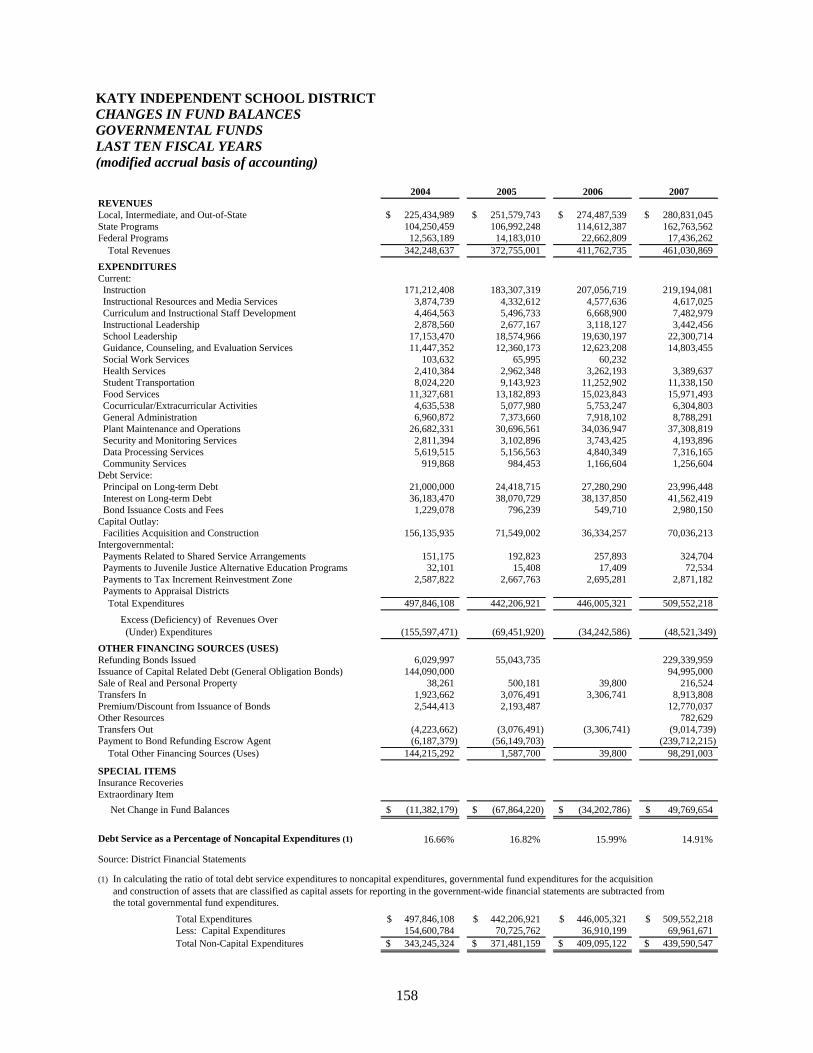
158
KATY INDEPENDENT SCHOOL DISTRICT
CHANGES IN FUND BALANCES
GOVERNMENTAL FUNDS
LAST TEN FISCAL YEARS
(modified accrual basis of accounting)
2004 2005 2006 2007
REVENUES
Local, Intermediate, and Out-of-State 225,434,989$ 251,579,743$ 274,487,539$ 280,831,045$
State Programs 104,250,459 106,992,248 114,612,387 162,763,562
Federal Programs 12,563,189 14,183,010 22,662,809 17,436,262
Total Revenues 342,248,637 372,755,001 411,762,735 461,030,869
EXPENDITURES
Current:
Instruction 171,212,408 183,307,319 207,056,719 219,194,081
Instructional Resources and Media Services 3,874,739 4,332,612 4,577,636 4,617,025
Curriculum and Instructional Staff Development 4,464,563 5,496,733 6,668,900 7,482,979
Instructional Leadership 2,878,560 2,677,167 3,118,127 3,442,456
School Leadership 17,153,470 18,574,966 19,630,197 22,300,714
Guidance, Counseling, and Evaluation Services 11,447,352 12,360,173 12,623,208 14,803,455
Social Work Services 103,632 65,995 60,232
Health Services 2,410,384 2,962,348 3,262,193 3,389,637
Student Transportation 8,024,220 9,143,923 11,252,902 11,338,150
Food Services 11,327,681 13,182,893 15,023,843 15,971,493
Cocurricular/Extracurricular Activities 4,635,538 5,077,980 5,753,247 6,304,803
General Administration 6,960,872 7,373,660 7,918,102 8,788,291
Plant Maintenance and Operations 26,682,331 30,696,561 34,036,947 37,308,819
Security and Monitoring Services 2,811,394 3,102,896 3,743,425 4,193,896
Data Processing Services 5,619,515 5,156,563 4,840,349 7,316,165
Community Services 919,868 984,453 1,166,604 1,256,604
Debt Service:
Principal on Long-term Debt 21,000,000 24,418,715 27,280,290 23,996,448
Interest on Long-term Debt 36,183,470 38,070,729 38,137,850 41,562,419
Bond Issuance Costs and Fees 1,229,078 796,239 549,710 2,980,150
Capital Outlay:
Facilities Acquisition and Construction 156,135,935 71,549,002 36,334,257 70,036,213
Intergovernmental:
Payments Related to Shared Service Arrangements 151,175 192,823 257,893 324,704
Payments to Juvenile Justice Alternative Education Programs 32,101 15,408 17,409 72,534
Payments to Tax Increment Reinvestment Zone 2,587,822 2,667,763 2,695,281 2,871,182
Payments to Appraisal Districts
Total Expenditures 497,846,108 442,206,921 446,005,321 509,552,218
Excess (Deficiency) of Revenues Over
(Under) Expenditures (155,597,471) (69,451,920) (34,242,586) (48,521,349)
OTHER FINANCING SOURCES (USES)
Refunding Bonds Issued 6,029,997 55,043,735 229,339,959
Issuance of Capital Related Debt (General Obligation Bonds) 144,090,000 94,995,000
Sale of Real and Personal Property 38,261 500,181 39,800 216,524
Transfers In 1,923,662 3,076,491 3,306,741 8,913,808
Premium/Discount from Issuance of Bonds 2,544,413 2,193,487 12,770,037
Other Resources 782,629
Transfers Out (4,223,662) (3,076,491) (3,306,741) (9,014,739)
Payment to Bond Refunding Escrow Agent (6,187,379) (56,149,703) (239,712,215)
Total Other Financing Sources (Uses) 144,215,292 1,587,700 39,800 98,291,003
SPECIAL ITEMS
Insurance Recoveries
Extraordinary Item
Net Change in Fund Balances (11,382,179)$ (67,864,220)$ (34,202,786)$ 49,769,654$
Debt Service as a Percentage of Noncapital Expenditures (1) 16.66% 16.82% 15.99% 14.91%
Source: District Financial Statements
(1) In calculating the ratio of total debt service expenditures to noncapital expenditures, governmental fund expenditures for the acquisition
and construction of assets that are classified as capital assets for reporting in the government-wide financial statements are subtracted from
the total governmental fund expenditures.
Total Expenditures 497,846,108$ 442,206,921$ 446,005,321$ 509,552,218$
Less: Capital Expenditures 154,600,784 70,725,762 36,910,199 69,961,671
Total Non-Capital Expenditures 343,245,324$ 371,481,159$ 409,095,122$ 439,590,547$
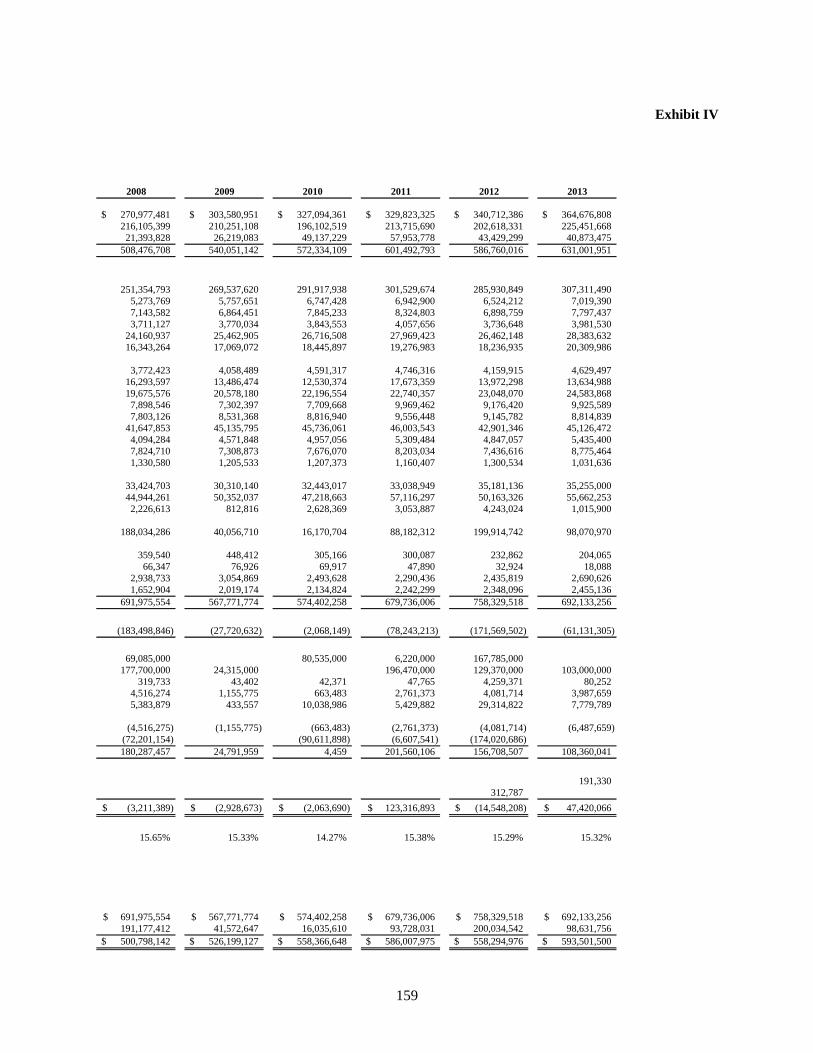
159
Exhibit IV
2008 2009 2010 2011 2012 2013
270,977,481$ 303,580,951$ 327,094,361$ 329,823,325$ 340,712,386$ 364,676,808$
216,105,399 210,251,108 196,102,519 213,715,690 202,618,331 225,451,668
21,393,828 26,219,083 49,137,229 57,953,778 43,429,299 40,873,475
508,476,708 540,051,142 572,334,109 601,492,793 586,760,016 631,001,951
251,354,793 269,537,620 291,917,938 301,529,674 285,930,849 307,311,490
5,273,769 5,757,651 6,747,428 6,942,900 6,524,212 7,019,390
7,143,582 6,864,451 7,845,233 8,324,803 6,898,759 7,797,437
3,711,127 3,770,034 3,843,553 4,057,656 3,736,648 3,981,530
24,160,937 25,462,905 26,716,508 27,969,423 26,462,148 28,383,632
16,343,264 17,069,072 18,445,897 19,276,983 18,236,935 20,309,986
3,772,423 4,058,489 4,591,317 4,746,316 4,159,915 4,629,497
16,293,597 13,486,474 12,530,374 17,673,359 13,972,298 13,634,988
19,675,576 20,578,180 22,196,554 22,740,357 23,048,070 24,583,868
7,898,546 7,302,397 7,709,668 9,969,462 9,176,420 9,925,589
7,803,126 8,531,368 8,816,940 9,556,448 9,145,782 8,814,839
41,647,853 45,135,795 45,736,061 46,003,543 42,901,346 45,126,472
4,094,284 4,571,848 4,957,056 5,309,484 4,847,057 5,435,400
7,824,710 7,308,873 7,676,070 8,203,034 7,436,616 8,775,464
1,330,580 1,205,533 1,207,373 1,160,407 1,300,534 1,031,636
33,424,703 30,310,140 32,443,017 33,038,949 35,181,136 35,255,000
44,944,261 50,352,037 47,218,663 57,116,297 50,163,326 55,662,253
2,226,613 812,816 2,628,369 3,053,887 4,243,024 1,015,900
188,034,286 40,056,710 16,170,704 88,182,312 199,914,742 98,070,970
359,540 448,412 305,166 300,087 232,862 204,065
66,347 76,926 69,917 47,890 32,924 18,088
2,938,733 3,054,869 2,493,628 2,290,436 2,435,819 2,690,626
1,652,904 2,019,174 2,134,824 2,242,299 2,348,096 2,455,136
691,975,554 567,771,774 574,402,258 679,736,006 758,329,518 692,133,256
(183,498,846) (27,720,632) (2,068,149) (78,243,213) (171,569,502) (61,131,305)
69,085,000 80,535,000 6,220,000 167,785,000
177,700,000 24,315,000 196,470,000 129,370,000 103,000,000
319,733 43,402 42,371 47,765 4,259,371 80,252
4,516,274 1,155,775 663,483 2,761,373 4,081,714 3,987,659
5,383,879 433,557 10,038,986 5,429,882 29,314,822 7,779,789
(4,516,275) (1,155,775) (663,483) (2,761,373) (4,081,714) (6,487,659)
(72,201,154) (90,611,898) (6,607,541) (174,020,686)
180,287,457 24,791,959 4,459 201,560,106 156,708,507 108,360,041
191,330
312,787
(3,211,389)$ (2,928,673)$ (2,063,690)$ 123,316,893$ (14,548,208)$ 47,420,066$
15.65% 15.33% 14.27% 15.38% 15.29% 15.32%
691,975,554$ 567,771,774$ 574,402,258$ 679,736,006$ 758,329,518$ 692,133,256$
191,177,412 41,572,647 16,035,610 93,728,031 200,034,542 98,631,756
500,798,142$ 526,199,127$ 558,366,648$ 586,007,975$ 558,294,976$ 593,501,500$

160
THIS PAGE INTENTIONALLY LEFT BLANK
161
REVENUE CAPACITY INFORMATION
These schedules contain information to assist users in understanding and assessing the factors
affecting the District’s ability to generate its own-source revenues.
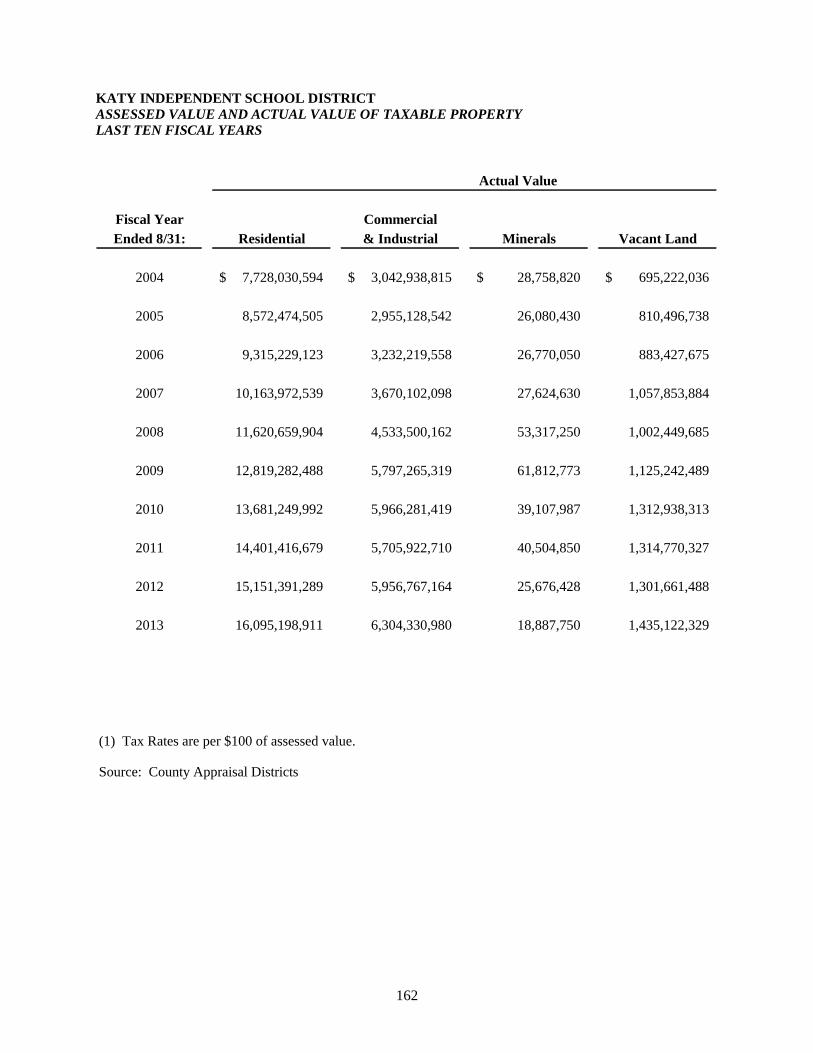
162
KATY INDEPENDENT SCHOOL DISTRICT
ASSESSED VALUE AND ACTUAL VALUE OF TAXABLE PROPERTY
LAST TEN FISCAL YEARS
Actual Value
Fiscal Year Commercial
Ended 8/31: Residential & Industrial Minerals Vacant Land
2004 7,728,030,594$ 3,042,938,815$ 28,758,820$ 695,222,036$
2005 8,572,474,505 2,955,128,542 26,080,430 810,496,738
2006 9,315,229,123 3,232,219,558 26,770,050 883,427,675
2007 10,163,972,539 3,670,102,098 27,624,630 1,057,853,884
2008 11,620,659,904 4,533,500,162 53,317,250 1,002,449,685
2009 12,819,282,488 5,797,265,319 61,812,773 1,125,242,489
2010 13,681,249,992 5,966,281,419 39,107,987 1,312,938,313
2011 14,401,416,679 5,705,922,710 40,504,850 1,314,770,327
2012 15,151,391,289 5,956,767,164 25,676,428 1,301,661,488
2013 16,095,198,911 6,304,330,980 18,887,750 1,435,122,329
(1) Tax Rates are per $100 of assessed value.
Source: County Appraisal Districts
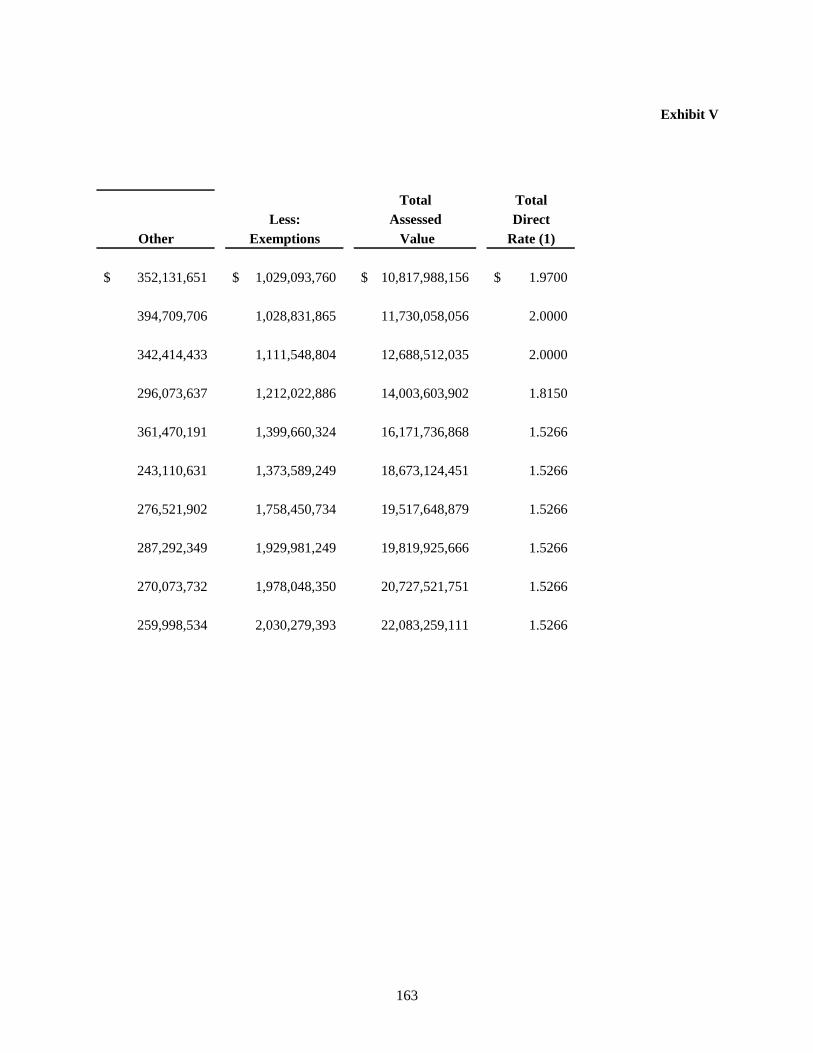
163
Exhibit V
Total Total
Less: Assessed Direct
Other Exemptions Value Rate (1)
352,131,651$ 1,029,093,760$ 10,817,988,156$ 1.9700$
394,709,706 1,028,831,865 11,730,058,056 2.0000
342,414,433 1,111,548,804 12,688,512,035 2.0000
296,073,637 1,212,022,886 14,003,603,902 1.8150
361,470,191 1,399,660,324 16,171,736,868 1.5266
243,110,631 1,373,589,249 18,673,124,451 1.5266
276,521,902 1,758,450,734 19,517,648,879 1.5266
287,292,349 1,929,981,249 19,819,925,666 1.5266
270,073,732 1,978,048,350 20,727,521,751 1.5266
259,998,534 2,030,279,393 22,083,259,111 1.5266
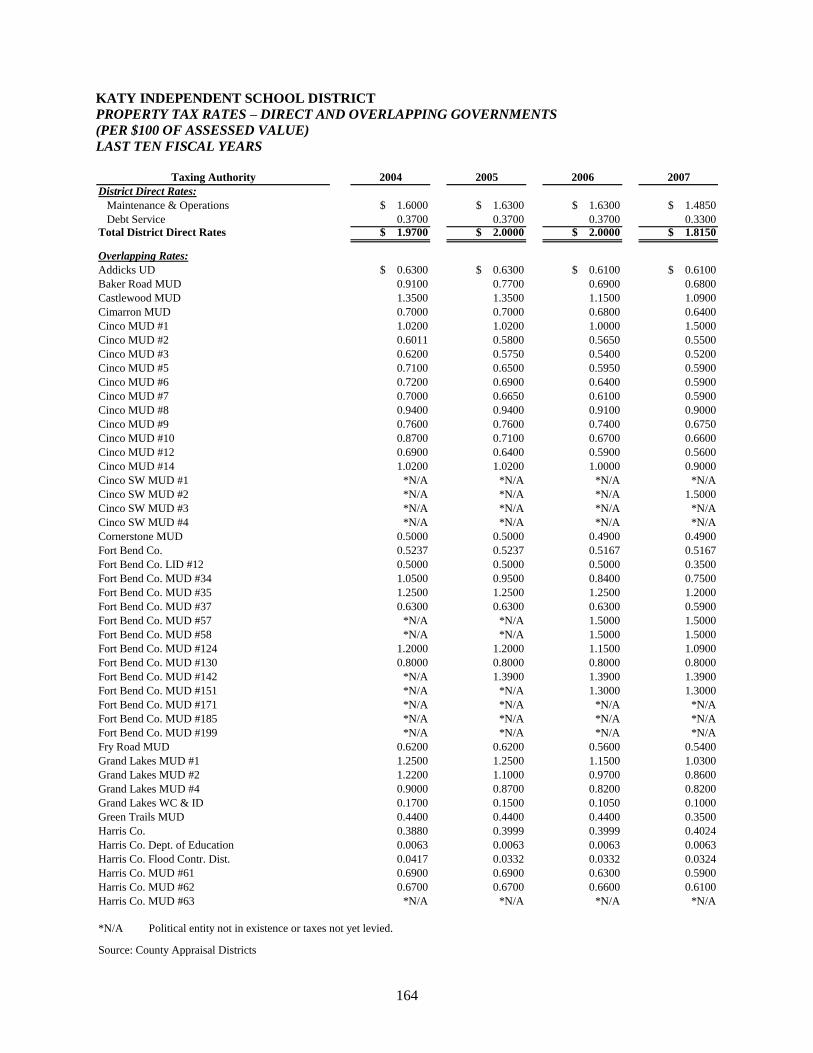
164
KATY INDEPENDENT SCHOOL DISTRICT
PROPERTY TAX RATES – DIRECT AND OVERLAPPING GOVERNMENTS
(PER $100 OF ASSESSED VALUE)
LAST TEN FISCAL YEARS
Taxing Authority 2004 2005 2006 2007
District Direct Rates:
Maintenance & Operations $ 1.6000 $ 1.6300 $ 1.6300 $ 1.4850
Debt Service 0.3700 0.3700 0.3700 0.3300
Total District Direct Rates $ 1.9700 $ 2.0000 $ 2.0000 $ 1.8150
Overlapping Rates:
Addicks UD $ 0.6300 $ 0.6300 $ 0.6100 $ 0.6100
Baker Road MUD 0.9100 0.7700 0.6900 0.6800
Castlewood MUD 1.3500 1.3500 1.1500 1.0900
Cimarron MUD 0.7000 0.7000 0.6800 0.6400
Cinco MUD #1 1.0200 1.0200 1.0000 1.5000
Cinco MUD #2 0.6011 0.5800 0.5650 0.5500
Cinco MUD #3 0.6200 0.5750 0.5400 0.5200
Cinco MUD #5 0.7100 0.6500 0.5950 0.5900
Cinco MUD #6 0.7200 0.6900 0.6400 0.5900
Cinco MUD #7 0.7000 0.6650 0.6100 0.5900
Cinco MUD #8 0.9400 0.9400 0.9100 0.9000
Cinco MUD #9 0.7600 0.7600 0.7400 0.6750
Cinco MUD #10 0.8700 0.7100 0.6700 0.6600
Cinco MUD #12 0.6900 0.6400 0.5900 0.5600
Cinco MUD #14 1.0200 1.0200 1.0000 0.9000
Cinco SW MUD #1 *N/A *N/A *N/A *N/A
Cinco SW MUD #2 *N/A *N/A *N/A 1.5000
Cinco SW MUD #3 *N/A *N/A *N/A *N/A
Cinco SW MUD #4 *N/A *N/A *N/A *N/A
Cornerstone MUD 0.5000 0.5000 0.4900 0.4900
Fort Bend Co. 0.5237 0.5237 0.5167 0.5167
Fort Bend Co. LID #12 0.5000 0.5000 0.5000 0.3500
Fort Bend Co. MUD #34 1.0500 0.9500 0.8400 0.7500
Fort Bend Co. MUD #35 1.2500 1.2500 1.2500 1.2000
Fort Bend Co. MUD #37 0.6300 0.6300 0.6300 0.5900
Fort Bend Co. MUD #57 *N/A *N/A 1.5000 1.5000
Fort Bend Co. MUD #58 *N/A *N/A 1.5000 1.5000
Fort Bend Co. MUD #124 1.2000 1.2000 1.1500 1.0900
Fort Bend Co. MUD #130 0.8000 0.8000 0.8000 0.8000
Fort Bend Co. MUD #142 *N/A 1.3900 1.3900 1.3900
Fort Bend Co. MUD #151 *N/A *N/A 1.3000 1.3000
Fort Bend Co. MUD #171 *N/A *N/A *N/A *N/A
Fort Bend Co. MUD #185 *N/A *N/A *N/A *N/A
Fort Bend Co. MUD #199 *N/A *N/A *N/A *N/A
Fry Road MUD 0.6200 0.6200 0.5600 0.5400
Grand Lakes MUD #1 1.2500 1.2500 1.1500 1.0300
Grand Lakes MUD #2 1.2200 1.1000 0.9700 0.8600
Grand Lakes MUD #4 0.9000 0.8700 0.8200 0.8200
Grand Lakes WC & ID 0.1700 0.1500 0.1050 0.1000
Green Trails MUD 0.4400 0.4400 0.4400 0.3500
Harris Co. 0.3880 0.3999 0.3999 0.4024
Harris Co. Dept. of Education 0.0063 0.0063 0.0063 0.0063
Harris Co. Flood Contr. Dist. 0.0417 0.0332 0.0332 0.0324
Harris Co. MUD #61 0.6900 0.6900 0.6300 0.5900
Harris Co. MUD #62 0.6700 0.6700 0.6600 0.6100
Harris Co. MUD #63 *N/A *N/A *N/A *N/A
*N/A Political entity not in existence or taxes not yet levied.
Source: County Appraisal Districts
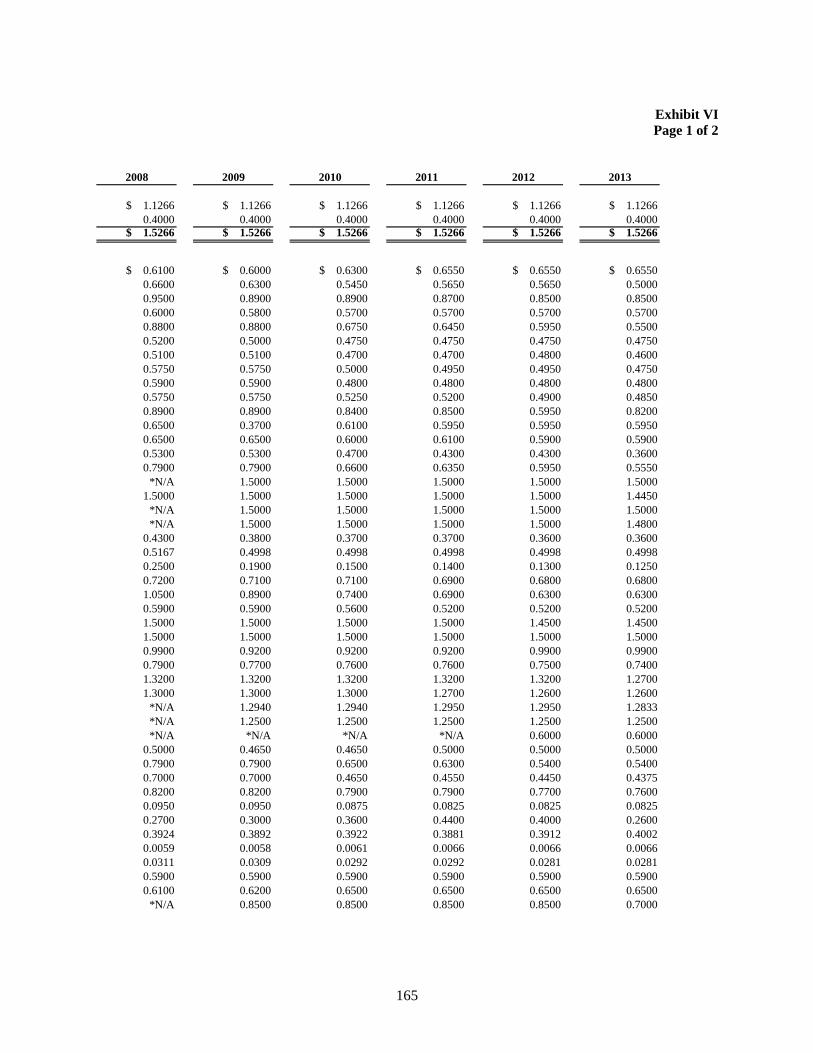
165
Exhibit VI
Page 1 of 2
2008 2009 2010 2011 2012 2013
$ 1.1266 $ 1.1266 $ 1.1266 $ 1.1266 $ 1.1266 $ 1.1266
0.4000 0.4000 0.4000 0.4000 0.4000 0.4000
$ 1.5266 $ 1.5266 $ 1.5266 $ 1.5266 $ 1.5266 $ 1.5266
$ 0.6100 $ 0.6000 $ 0.6300 $ 0.6550 $ 0.6550 $ 0.6550
0.6600 0.6300 0.5450 0.5650 0.5650 0.5000
0.9500 0.8900 0.8900 0.8700 0.8500 0.8500
0.6000 0.5800 0.5700 0.5700 0.5700 0.5700
0.8800 0.8800 0.6750 0.6450 0.5950 0.5500
0.5200 0.5000 0.4750 0.4750 0.4750 0.4750
0.5100 0.5100 0.4700 0.4700 0.4800 0.4600
0.5750 0.5750 0.5000 0.4950 0.4950 0.4750
0.5900 0.5900 0.4800 0.4800 0.4800 0.4800
0.5750 0.5750 0.5250 0.5200 0.4900 0.4850
0.8900 0.8900 0.8400 0.8500 0.5950 0.8200
0.6500 0.3700 0.6100 0.5950 0.5950 0.5950
0.6500 0.6500 0.6000 0.6100 0.5900 0.5900
0.5300 0.5300 0.4700 0.4300 0.4300 0.3600
0.7900 0.7900 0.6600 0.6350 0.5950 0.5550
*N/A 1.5000 1.5000 1.5000 1.5000 1.5000
1.5000 1.5000 1.5000 1.5000 1.5000 1.4450
*N/A 1.5000 1.5000 1.5000 1.5000 1.5000
*N/A 1.5000 1.5000 1.5000 1.5000 1.4800
0.4300 0.3800 0.3700 0.3700 0.3600 0.3600
0.5167 0.4998 0.4998 0.4998 0.4998 0.4998
0.2500 0.1900 0.1500 0.1400 0.1300 0.1250
0.7200 0.7100 0.7100 0.6900 0.6800 0.6800
1.0500 0.8900 0.7400 0.6900 0.6300 0.6300
0.5900 0.5900 0.5600 0.5200 0.5200 0.5200
1.5000 1.5000 1.5000 1.5000 1.4500 1.4500
1.5000 1.5000 1.5000 1.5000 1.5000 1.5000
0.9900 0.9200 0.9200 0.9200 0.9900 0.9900
0.7900 0.7700 0.7600 0.7600 0.7500 0.7400
1.3200 1.3200 1.3200 1.3200 1.3200 1.2700
1.3000 1.3000 1.3000 1.2700 1.2600 1.2600
*N/A 1.2940 1.2940 1.2950 1.2950 1.2833
*N/A 1.2500 1.2500 1.2500 1.2500 1.2500
*N/A *N/A *N/A *N/A 0.6000 0.6000
0.5000 0.4650 0.4650 0.5000 0.5000 0.5000
0.7900 0.7900 0.6500 0.6300 0.5400 0.5400
0.7000 0.7000 0.4650 0.4550 0.4450 0.4375
0.8200 0.8200 0.7900 0.7900 0.7700 0.7600
0.0950 0.0950 0.0875 0.0825 0.0825 0.0825
0.2700 0.3000 0.3600 0.4400 0.4000 0.2600
0.3924 0.3892 0.3922 0.3881 0.3912 0.4002
0.0059 0.0058 0.0061 0.0066 0.0066 0.0066
0.0311 0.0309 0.0292 0.0292 0.0281 0.0281
0.5900 0.5900 0.5900 0.5900 0.5900 0.5900
0.6100 0.6200 0.6500 0.6500 0.6500 0.6500
*N/A 0.8500 0.8500 0.8500 0.8500 0.7000
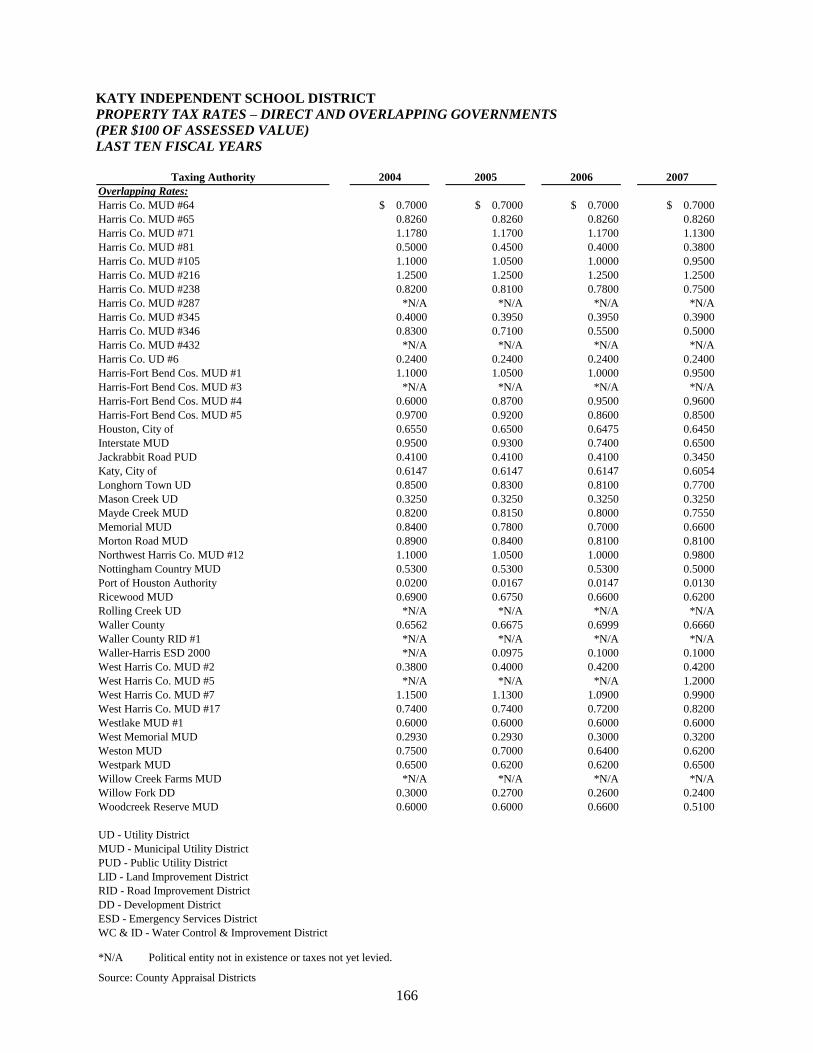
166
KATY INDEPENDENT SCHOOL DISTRICT
PROPERTY TAX RATES – DIRECT AND OVERLAPPING GOVERNMENTS
(PER $100 OF ASSESSED VALUE)
LAST TEN FISCAL YEARS
Taxing Authority 2004 2005 2006 2007
Overlapping Rates:
Harris Co. MUD #64 $ 0.7000 $ 0.7000 $ 0.7000 $ 0.7000
Harris Co. MUD #65 0.8260 0.8260 0.8260 0.8260
Harris Co. MUD #71 1.1780 1.1700 1.1700 1.1300
Harris Co. MUD #81 0.5000 0.4500 0.4000 0.3800
Harris Co. MUD #105 1.1000 1.0500 1.0000 0.9500
Harris Co. MUD #216 1.2500 1.2500 1.2500 1.2500
Harris Co. MUD #238 0.8200 0.8100 0.7800 0.7500
Harris Co. MUD #287 *N/A *N/A *N/A *N/A
Harris Co. MUD #345 0.4000 0.3950 0.3950 0.3900
Harris Co. MUD #346 0.8300 0.7100 0.5500 0.5000
Harris Co. MUD #432 *N/A *N/A *N/A *N/A
Harris Co. UD #6 0.2400 0.2400 0.2400 0.2400
Harris-Fort Bend Cos. MUD #1 1.1000 1.0500 1.0000 0.9500
Harris-Fort Bend Cos. MUD #3 *N/A *N/A *N/A *N/A
Harris-Fort Bend Cos. MUD #4 0.6000 0.8700 0.9500 0.9600
Harris-Fort Bend Cos. MUD #5 0.9700 0.9200 0.8600 0.8500
Houston, City of 0.6550 0.6500 0.6475 0.6450
Interstate MUD 0.9500 0.9300 0.7400 0.6500
Jackrabbit Road PUD 0.4100 0.4100 0.4100 0.3450
Katy, City of 0.6147 0.6147 0.6147 0.6054
Longhorn Town UD 0.8500 0.8300 0.8100 0.7700
Mason Creek UD 0.3250 0.3250 0.3250 0.3250
Mayde Creek MUD 0.8200 0.8150 0.8000 0.7550
Memorial MUD 0.8400 0.7800 0.7000 0.6600
Morton Road MUD 0.8900 0.8400 0.8100 0.8100
Northwest Harris Co. MUD #12 1.1000 1.0500 1.0000 0.9800
Nottingham Country MUD 0.5300 0.5300 0.5300 0.5000
Port of Houston Authority 0.0200 0.0167 0.0147 0.0130
Ricewood MUD 0.6900 0.6750 0.6600 0.6200
Rolling Creek UD *N/A *N/A *N/A *N/A
Waller County 0.6562 0.6675 0.6999 0.6660
Waller County RID #1 *N/A *N/A *N/A *N/A
Waller-Harris ESD 2000 *N/A 0.0975 0.1000 0.1000
West Harris Co. MUD #2 0.3800 0.4000 0.4200 0.4200
West Harris Co. MUD #5 *N/A *N/A *N/A 1.2000
West Harris Co. MUD #7 1.1500 1.1300 1.0900 0.9900
West Harris Co. MUD #17 0.7400 0.7400 0.7200 0.8200
Westlake MUD #1 0.6000 0.6000 0.6000 0.6000
West Memorial MUD 0.2930 0.2930 0.3000 0.3200
Weston MUD 0.7500 0.7000 0.6400 0.6200
Westpark MUD 0.6500 0.6200 0.6200 0.6500
Willow Creek Farms MUD *N/A *N/A *N/A *N/A
Willow Fork DD 0.3000 0.2700 0.2600 0.2400
Woodcreek Reserve MUD 0.6000 0.6000 0.6600 0.5100
UD - Utility District
MUD - Municipal Utility District
PUD - Public Utility District
LID - Land Improvement District
RID - Road Improvement District
DD - Development District
ESD - Emergency Services District
WC & ID - Water Control & Improvement District
*N/A Political entity not in existence or taxes not yet levied.
Source: County Appraisal Districts
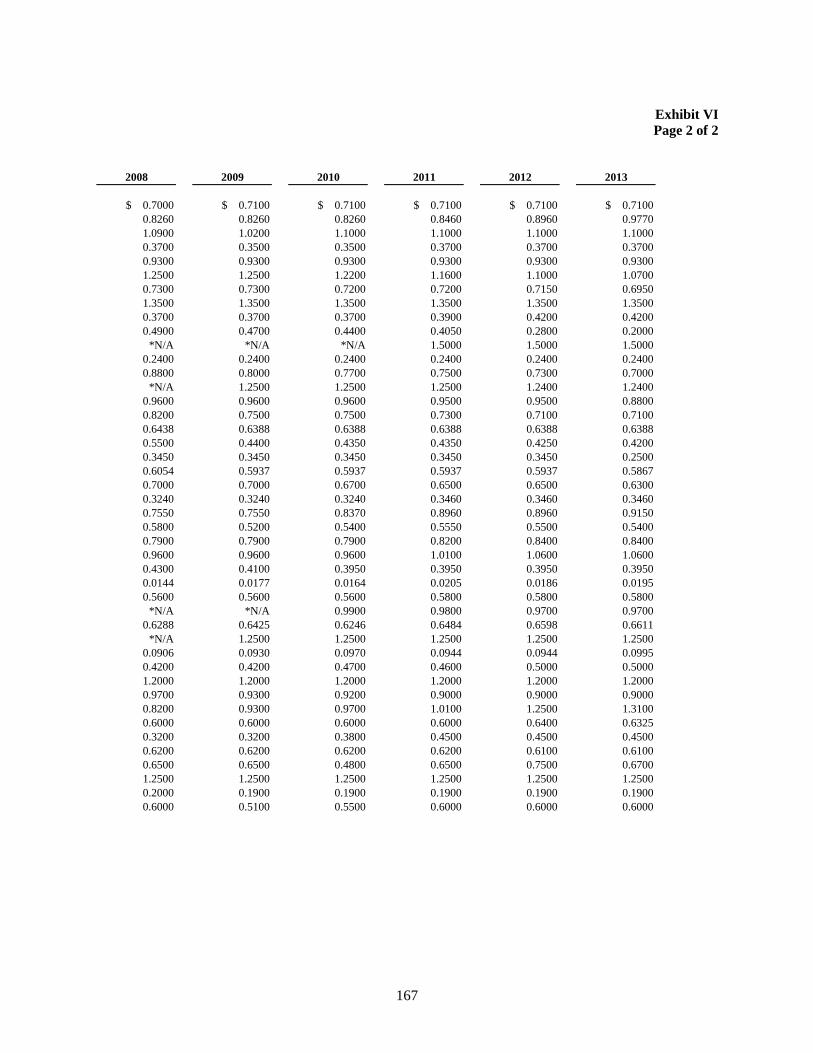
167
Exhibit VI
Page 2 of 2
2008 2009 2010 2011 2012 2013
$ 0.7000 $ 0.7100 $ 0.7100 $ 0.7100 $ 0.7100 $ 0.7100
0.8260 0.8260 0.8260 0.8460 0.8960 0.9770
1.0900 1.0200 1.1000 1.1000 1.1000 1.1000
0.3700 0.3500 0.3500 0.3700 0.3700 0.3700
0.9300 0.9300 0.9300 0.9300 0.9300 0.9300
1.2500 1.2500 1.2200 1.1600 1.1000 1.0700
0.7300 0.7300 0.7200 0.7200 0.7150 0.6950
1.3500 1.3500 1.3500 1.3500 1.3500 1.3500
0.3700 0.3700 0.3700 0.3900 0.4200 0.4200
0.4900 0.4700 0.4400 0.4050 0.2800 0.2000
*N/A *N/A *N/A 1.5000 1.5000 1.5000
0.2400 0.2400 0.2400 0.2400 0.2400 0.2400
0.8800 0.8000 0.7700 0.7500 0.7300 0.7000
*N/A 1.2500 1.2500 1.2500 1.2400 1.2400
0.9600 0.9600 0.9600 0.9500 0.9500 0.8800
0.8200 0.7500 0.7500 0.7300 0.7100 0.7100
0.6438 0.6388 0.6388 0.6388 0.6388 0.6388
0.5500 0.4400 0.4350 0.4350 0.4250 0.4200
0.3450 0.3450 0.3450 0.3450 0.3450 0.2500
0.6054 0.5937 0.5937 0.5937 0.5937 0.5867
0.7000 0.7000 0.6700 0.6500 0.6500 0.6300
0.3240 0.3240 0.3240 0.3460 0.3460 0.3460
0.7550 0.7550 0.8370 0.8960 0.8960 0.9150
0.5800 0.5200 0.5400 0.5550 0.5500 0.5400
0.7900 0.7900 0.7900 0.8200 0.8400 0.8400
0.9600 0.9600 0.9600 1.0100 1.0600 1.0600
0.4300 0.4100 0.3950 0.3950 0.3950 0.3950
0.0144 0.0177 0.0164 0.0205 0.0186 0.0195
0.5600 0.5600 0.5600 0.5800 0.5800 0.5800
*N/A *N/A 0.9900 0.9800 0.9700 0.9700
0.6288 0.6425 0.6246 0.6484 0.6598 0.6611
*N/A 1.2500 1.2500 1.2500 1.2500 1.2500
0.0906 0.0930 0.0970 0.0944 0.0944 0.0995
0.4200 0.4200 0.4700 0.4600 0.5000 0.5000
1.2000 1.2000 1.2000 1.2000 1.2000 1.2000
0.9700 0.9300 0.9200 0.9000 0.9000 0.9000
0.8200 0.9300 0.9700 1.0100 1.2500 1.3100
0.6000 0.6000 0.6000 0.6000 0.6400 0.6325
0.3200 0.3200 0.3800 0.4500 0.4500 0.4500
0.6200 0.6200 0.6200 0.6200 0.6100 0.6100
0.6500 0.6500 0.4800 0.6500 0.7500 0.6700
1.2500 1.2500 1.2500 1.2500 1.2500 1.2500
0.2000 0.1900 0.1900 0.1900 0.1900 0.1900
0.6000 0.5100 0.5500 0.6000 0.6000 0.6000
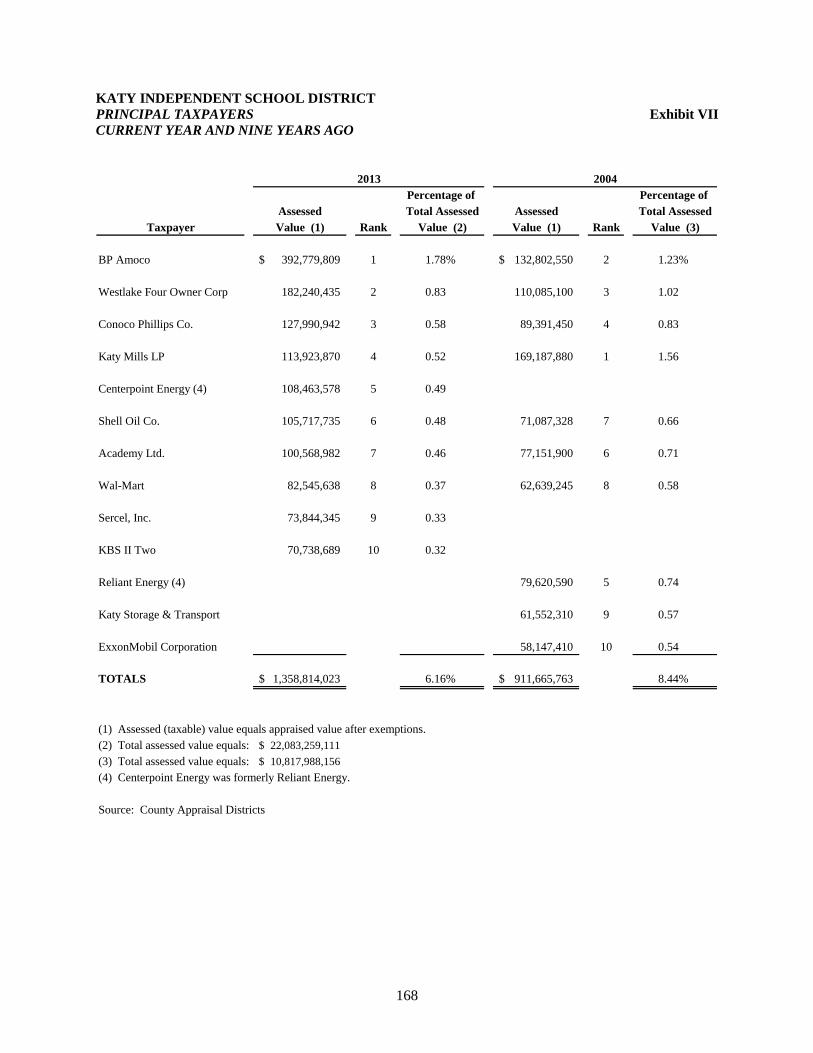
168
KATY INDEPENDENT SCHOOL DISTRICT
PRINCIPAL TAXPAYERS Exhibit VII
CURRENT YEAR AND NINE YEARS AGO
2013 2004
Percentage of Percentage of
Assessed Total Assessed Assessed Total Assessed
Taxpayer Value (1) Rank Value (2) Value (1) Rank Value (3)
BP Amoco 392,779,809$ 1 1.78% 132,802,550$ 2 1.23%
Westlake Four Owner Corp 182,240,435 2 0.83 110,085,100 3 1.02
Conoco Phillips Co. 127,990,942 3 0.58 89,391,450 4 0.83
Katy Mills LP 113,923,870 4 0.52 169,187,880 1 1.56
Centerpoint Energy (4) 108,463,578 5 0.49
Shell Oil Co. 105,717,735 6 0.48 71,087,328 7 0.66
Academy Ltd. 100,568,982 7 0.46 77,151,900 6 0.71
Wal-Mart 82,545,638 8 0.37 62,639,245 8 0.58
Sercel, Inc. 73,844,345 9 0.33
KBS II Two 70,738,689 10 0.32
Reliant Energy (4) 79,620,590 5 0.74
Katy Storage & Transport 61,552,310 9 0.57
ExxonMobil Corporation 58,147,410 10 0.54
TOTALS 1,358,814,023$ 6.16% 911,665,763$ 8.44%
(1) Assessed (taxable) value equals appraised value after exemptions.
(2) Total assessed value equals: 22,083,259,111$
(3) Total assessed value equals: 10,817,988,156$
(4) Centerpoint Energy was formerly Reliant Energy.
Source: County Appraisal Districts
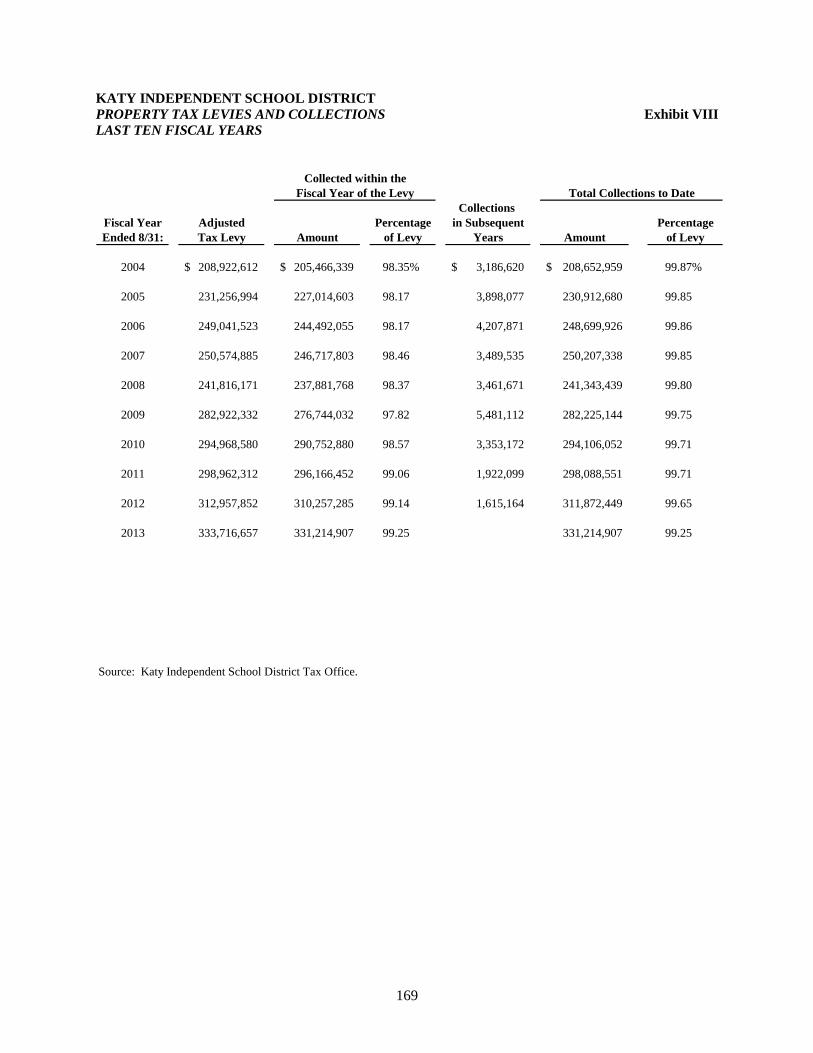
169
KATY INDEPENDENT SCHOOL DISTRICT
PROPERTY TAX LEVIES AND COLLECTIONS Exhibit VIII
LAST TEN FISCAL YEARS
Collected within the
Fiscal Year of the Levy Total Collections to Date
Collections
Fiscal Year Adjusted Percentage in Subsequent Percentage
Ended 8/31: Tax Levy Amount of Levy Years Amount of Levy
2004 208,922,612$ 205,466,339$ 98.35% 3,186,620$ 208,652,959$ 99.87%
2005 231,256,994 227,014,603 98.17 3,898,077 230,912,680 99.85
2006 249,041,523 244,492,055 98.17 4,207,871 248,699,926 99.86
2007 250,574,885 246,717,803 98.46 3,489,535 250,207,338 99.85
2008 241,816,171 237,881,768 98.37 3,461,671 241,343,439 99.80
2009 282,922,332 276,744,032 97.82 5,481,112 282,225,144 99.75
2010 294,968,580 290,752,880 98.57 3,353,172 294,106,052 99.71
2011 298,962,312 296,166,452 99.06 1,922,099 298,088,551 99.71
2012 312,957,852 310,257,285 99.14 1,615,164 311,872,449 99.65
2013 333,716,657 331,214,907 99.25 331,214,907 99.25
Source: Katy Independent School District Tax Office.

170
THIS PAGE INTENTIONALLY LEFT BLANK
171
DEBT CAPACITY INFORMATION
These schedules contain information to assist users in understanding and assessing the District’s
debt burden and its ability to issue additional debt in the future.
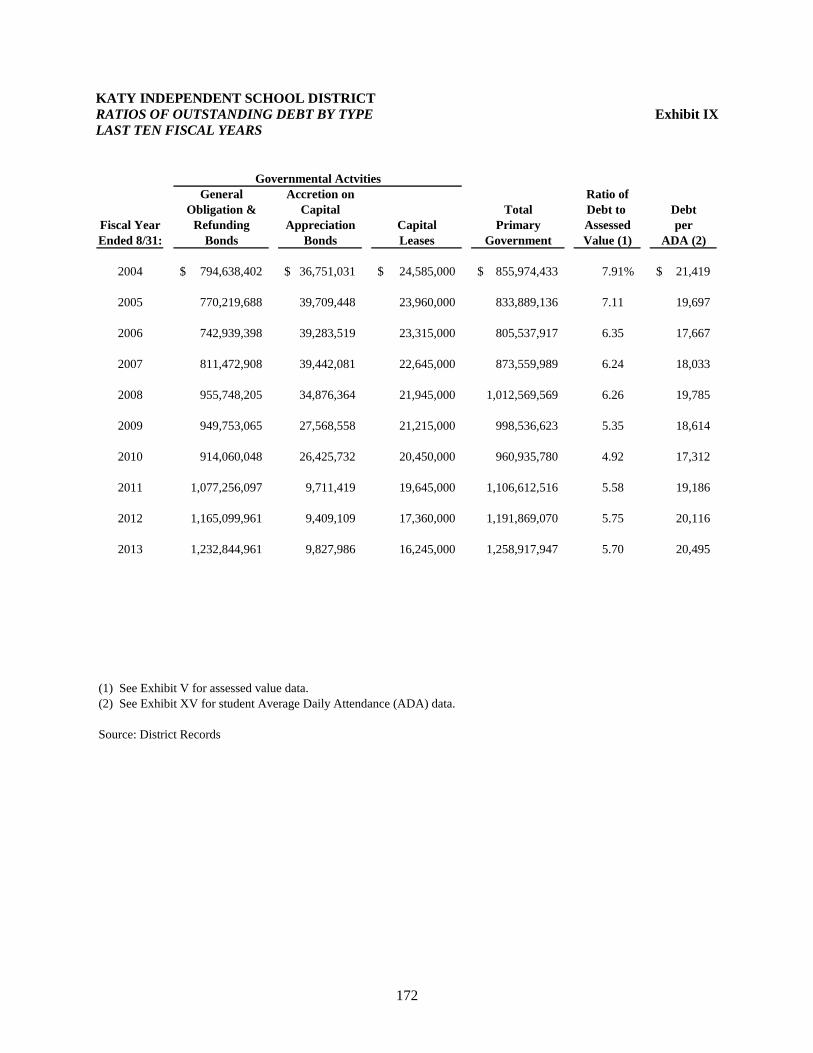
172
KATY INDEPENDENT SCHOOL DISTRICT
RATIOS OF OUTSTANDING DEBT BY TYPE Exhibit IX
LAST TEN FISCAL YEARS
General Accretion on Ratio of
Obligation & Capital Total Debt to Debt
Fiscal Year Refunding Appreciation Capital Primary Assessed per
Ended 8/31: Bonds Bonds Leases Government Value (1) ADA (2)
2004 794,638,402$ 36,751,031$ 24,585,000$ 855,974,433$ 7.91% 21,419$
2005 770,219,688 39,709,448 23,960,000 833,889,136 7.11 19,697
2006 742,939,398 39,283,519 23,315,000 805,537,917 6.35 17,667
2007 811,472,908 39,442,081 22,645,000 873,559,989 6.24 18,033
2008 955,748,205 34,876,364 21,945,000 1,012,569,569 6.26 19,785
2009 949,753,065 27,568,558 21,215,000 998,536,623 5.35 18,614
2010 914,060,048 26,425,732 20,450,000 960,935,780 4.92 17,312
2011 1,077,256,097 9,711,419 19,645,000 1,106,612,516 5.58 19,186
2012 1,165,099,961 9,409,109 17,360,000 1,191,869,070 5.75 20,116
2013 1,232,844,961 9,827,986 16,245,000 1,258,917,947 5.70 20,495
(1) See Exhibit V for assessed value data.
(2) See Exhibit XV for student Average Daily Attendance (ADA) data.
Source: District Records
Governmental Actvities
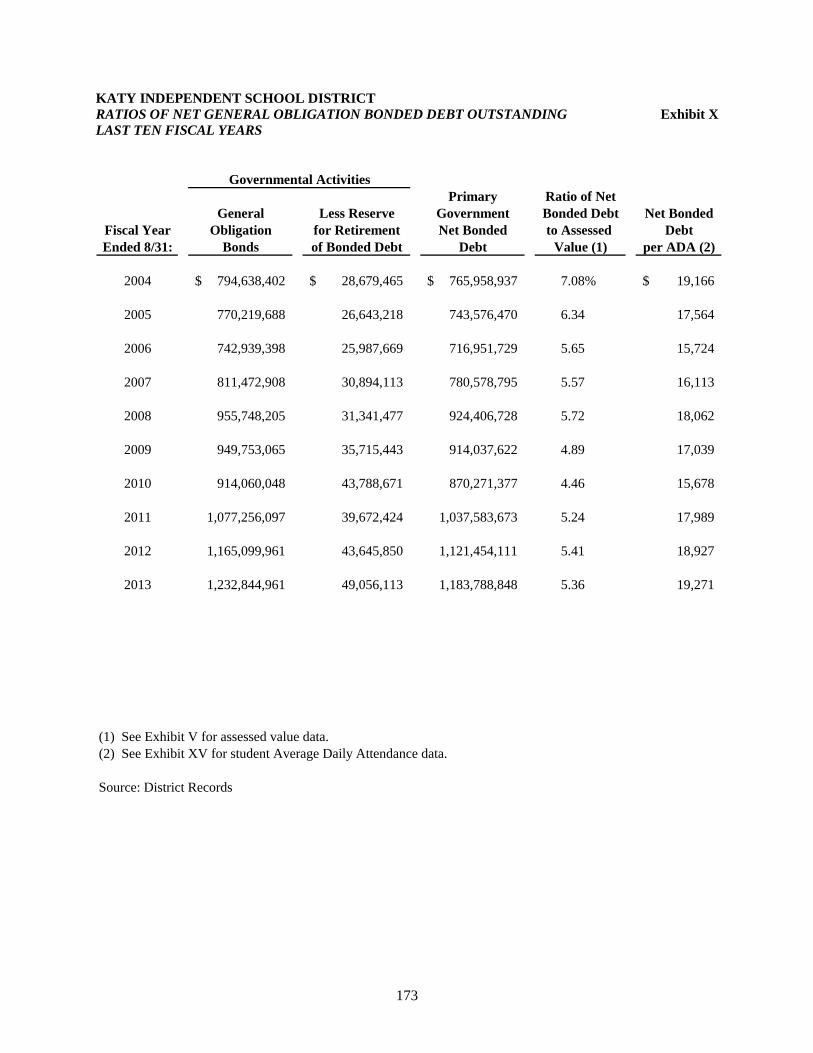
173
KATY INDEPENDENT SCHOOL DISTRICT
RATIOS OF NET GENERAL OBLIGATION BONDED DEBT OUTSTANDING Exhibit X
LAST TEN FISCAL YEARS
Primary Ratio of Net
General Less Reserve Government Bonded Debt Net Bonded
Fiscal Year Obligation for Retirement Net Bonded to Assessed Debt
Ended 8/31: Bonds of Bonded Debt Debt Value (1) per ADA (2)
2004 794,638,402$ 28,679,465$ 765,958,937$ 7.08% 19,166$
2005 770,219,688 26,643,218 743,576,470 6.34 17,564
2006 742,939,398 25,987,669 716,951,729 5.65 15,724
2007 811,472,908 30,894,113 780,578,795 5.57 16,113
2008 955,748,205 31,341,477 924,406,728 5.72 18,062
2009 949,753,065 35,715,443 914,037,622 4.89 17,039
2010 914,060,048 43,788,671 870,271,377 4.46 15,678
2011 1,077,256,097 39,672,424 1,037,583,673 5.24 17,989
2012 1,165,099,961 43,645,850 1,121,454,111 5.41 18,927
2013 1,232,844,961 49,056,113 1,183,788,848 5.36 19,271
(1) See Exhibit V for assessed value data.
(2) See Exhibit XV for student Average Daily Attendance data.
Source: District Records
Governmental Activities
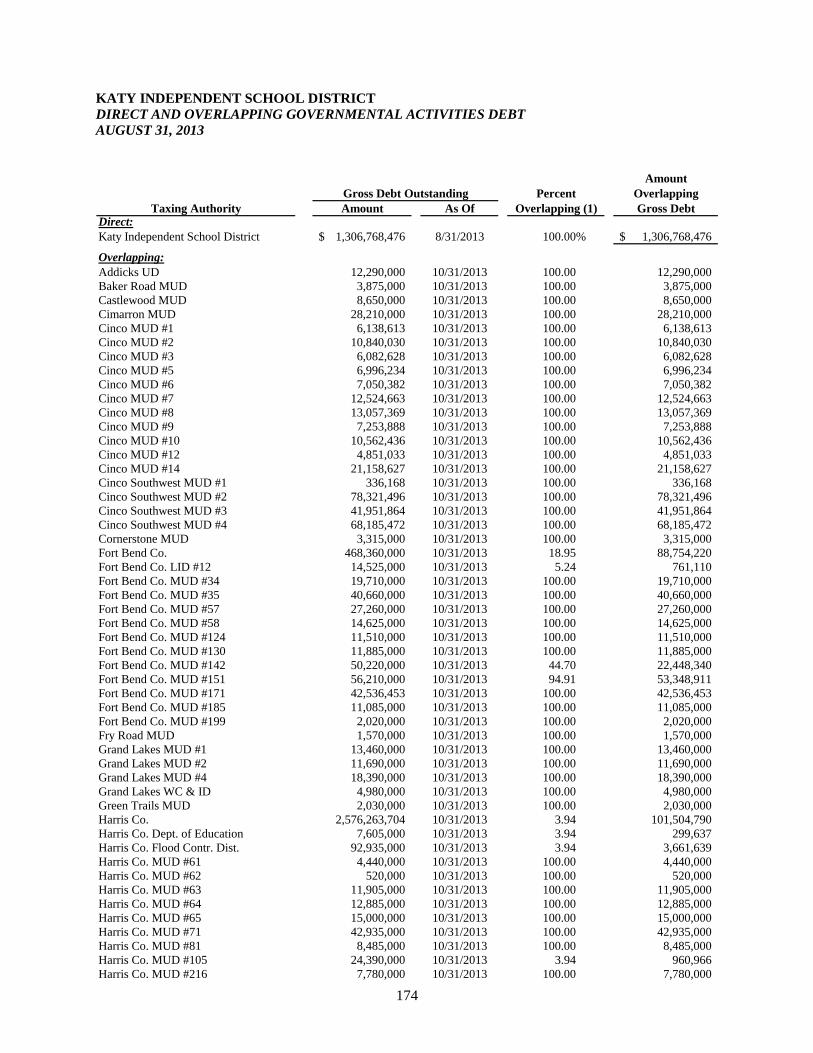
174
KATY INDEPENDENT SCHOOL DISTRICT
DIRECT AND OVERLAPPING GOVERNMENTAL ACTIVITIES DEBT
AUGUST 31, 2013
Amount
Percent Overlapping
Taxing Authority Amount As Of Overlapping (1) Gross DebtDirect:
Katy Independent School District 1,306,768,476$ 8/31/2013 100.00% 1,306,768,476$
Overlapping:
Addicks UD 12,290,000 10/31/2013 100.00 12,290,000
Baker Road MUD 3,875,000 10/31/2013 100.00 3,875,000
Castlewood MUD 8,650,000 10/31/2013 100.00 8,650,000
Cimarron MUD 28,210,000 10/31/2013 100.00 28,210,000
Cinco MUD #1 6,138,613 10/31/2013 100.00 6,138,613
Cinco MUD #2 10,840,030 10/31/2013 100.00 10,840,030
Cinco MUD #3 6,082,628 10/31/2013 100.00 6,082,628
Cinco MUD #5 6,996,234 10/31/2013 100.00 6,996,234
Cinco MUD #6 7,050,382 10/31/2013 100.00 7,050,382
Cinco MUD #7 12,524,663 10/31/2013 100.00 12,524,663
Cinco MUD #8 13,057,369 10/31/2013 100.00 13,057,369
Cinco MUD #9 7,253,888 10/31/2013 100.00 7,253,888
Cinco MUD #10 10,562,436 10/31/2013 100.00 10,562,436
Cinco MUD #12 4,851,033 10/31/2013 100.00 4,851,033
Cinco MUD #14 21,158,627 10/31/2013 100.00 21,158,627
Cinco Southwest MUD #1 336,168 10/31/2013 100.00 336,168
Cinco Southwest MUD #2 78,321,496 10/31/2013 100.00 78,321,496
Cinco Southwest MUD #3 41,951,864 10/31/2013 100.00 41,951,864
Cinco Southwest MUD #4 68,185,472 10/31/2013 100.00 68,185,472
Cornerstone MUD 3,315,000 10/31/2013 100.00 3,315,000
Fort Bend Co. 468,360,000 10/31/2013 18.95 88,754,220
Fort Bend Co. LID #12 14,525,000 10/31/2013 5.24 761,110
Fort Bend Co. MUD #34 19,710,000 10/31/2013 100.00 19,710,000
Fort Bend Co. MUD #35 40,660,000 10/31/2013 100.00 40,660,000
Fort Bend Co. MUD #57 27,260,000 10/31/2013 100.00 27,260,000
Fort Bend Co. MUD #58 14,625,000 10/31/2013 100.00 14,625,000
Fort Bend Co. MUD #124 11,510,000 10/31/2013 100.00 11,510,000
Fort Bend Co. MUD #130 11,885,000 10/31/2013 100.00 11,885,000
Fort Bend Co. MUD #142 50,220,000 10/31/2013 44.70 22,448,340
Fort Bend Co. MUD #151 56,210,000 10/31/2013 94.91 53,348,911
Fort Bend Co. MUD #171 42,536,453 10/31/2013 100.00 42,536,453
Fort Bend Co. MUD #185 11,085,000 10/31/2013 100.00 11,085,000
Fort Bend Co. MUD #199 2,020,000 10/31/2013 100.00 2,020,000
Fry Road MUD 1,570,000 10/31/2013 100.00 1,570,000
Grand Lakes MUD #1 13,460,000 10/31/2013 100.00 13,460,000
Grand Lakes MUD #2 11,690,000 10/31/2013 100.00 11,690,000
Grand Lakes MUD #4 18,390,000 10/31/2013 100.00 18,390,000
Grand Lakes WC & ID 4,980,000 10/31/2013 100.00 4,980,000
Green Trails MUD 2,030,000 10/31/2013 100.00 2,030,000
Harris Co. 2,576,263,704 10/31/2013 3.94 101,504,790
Harris Co. Dept. of Education 7,605,000 10/31/2013 3.94 299,637
Harris Co. Flood Contr. Dist. 92,935,000 10/31/2013 3.94 3,661,639
Harris Co. MUD #61 4,440,000 10/31/2013 100.00 4,440,000
Harris Co. MUD #62 520,000 10/31/2013 100.00 520,000
Harris Co. MUD #63 11,905,000 10/31/2013 100.00 11,905,000
Harris Co. MUD #64 12,885,000 10/31/2013 100.00 12,885,000
Harris Co. MUD #65 15,000,000 10/31/2013 100.00 15,000,000
Harris Co. MUD #71 42,935,000 10/31/2013 100.00 42,935,000
Harris Co. MUD #81 8,485,000 10/31/2013 100.00 8,485,000
Harris Co. MUD #105 24,390,000 10/31/2013 3.94 960,966
Harris Co. MUD #216 7,780,000 10/31/2013 100.00 7,780,000
Gross Debt Outstanding
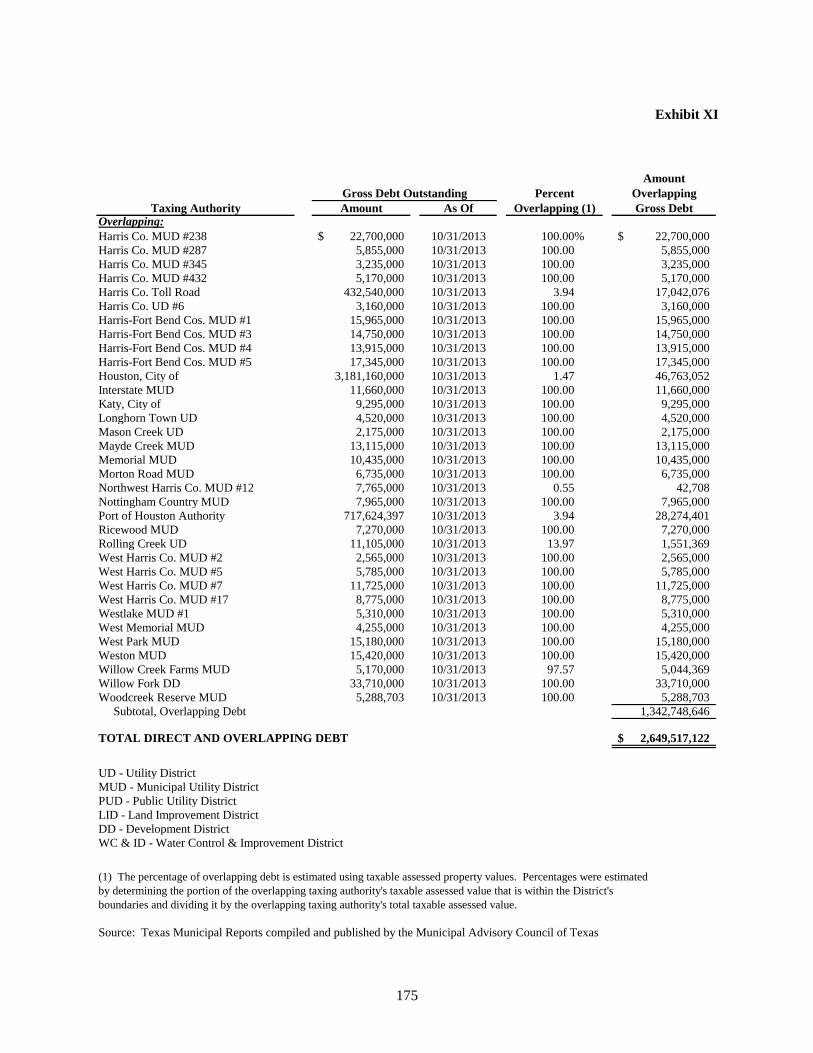
175
Exhibit XI
Amount
Percent Overlapping
Taxing Authority Amount As Of Overlapping (1) Gross DebtOverlapping:
Harris Co. MUD #238 22,700,000$ 10/31/2013 100.00% 22,700,000$
Harris Co. MUD #287 5,855,000 10/31/2013 100.00 5,855,000
Harris Co. MUD #345 3,235,000 10/31/2013 100.00 3,235,000
Harris Co. MUD #432 5,170,000 10/31/2013 100.00 5,170,000
Harris Co. Toll Road 432,540,000 10/31/2013 3.94 17,042,076
Harris Co. UD #6 3,160,000 10/31/2013 100.00 3,160,000
Harris-Fort Bend Cos. MUD #1 15,965,000 10/31/2013 100.00 15,965,000
Harris-Fort Bend Cos. MUD #3 14,750,000 10/31/2013 100.00 14,750,000
Harris-Fort Bend Cos. MUD #4 13,915,000 10/31/2013 100.00 13,915,000
Harris-Fort Bend Cos. MUD #5 17,345,000 10/31/2013 100.00 17,345,000
Houston, City of 3,181,160,000 10/31/2013 1.47 46,763,052
Interstate MUD 11,660,000 10/31/2013 100.00 11,660,000
Katy, City of 9,295,000 10/31/2013 100.00 9,295,000
Longhorn Town UD 4,520,000 10/31/2013 100.00 4,520,000
Mason Creek UD 2,175,000 10/31/2013 100.00 2,175,000
Mayde Creek MUD 13,115,000 10/31/2013 100.00 13,115,000
Memorial MUD 10,435,000 10/31/2013 100.00 10,435,000
Morton Road MUD 6,735,000 10/31/2013 100.00 6,735,000
Northwest Harris Co. MUD #12 7,765,000 10/31/2013 0.55 42,708
Nottingham Country MUD 7,965,000 10/31/2013 100.00 7,965,000
Port of Houston Authority 717,624,397 10/31/2013 3.94 28,274,401
Ricewood MUD 7,270,000 10/31/2013 100.00 7,270,000
Rolling Creek UD 11,105,000 10/31/2013 13.97 1,551,369
West Harris Co. MUD #2 2,565,000 10/31/2013 100.00 2,565,000
West Harris Co. MUD #5 5,785,000 10/31/2013 100.00 5,785,000
West Harris Co. MUD #7 11,725,000 10/31/2013 100.00 11,725,000
West Harris Co. MUD #17 8,775,000 10/31/2013 100.00 8,775,000
Westlake MUD #1 5,310,000 10/31/2013 100.00 5,310,000
West Memorial MUD 4,255,000 10/31/2013 100.00 4,255,000
West Park MUD 15,180,000 10/31/2013 100.00 15,180,000
Weston MUD 15,420,000 10/31/2013 100.00 15,420,000
Willow Creek Farms MUD 5,170,000 10/31/2013 97.57 5,044,369
Willow Fork DD 33,710,000 10/31/2013 100.00 33,710,000
Woodcreek Reserve MUD 5,288,703 10/31/2013 100.00 5,288,703
Subtotal, Overlapping Debt 1,342,748,646
TOTAL DIRECT AND OVERLAPPING DEBT 2,649,517,122$
UD - Utility District
MUD - Municipal Utility District
PUD - Public Utility District
LID - Land Improvement District
DD - Development District
WC & ID - Water Control & Improvement District
(1) The percentage of overlapping debt is estimated using taxable assessed property values. Percentages were estimated
by determining the portion of the overlapping taxing authority's taxable assessed value that is within the District's
boundaries and dividing it by the overlapping taxing authority's total taxable assessed value.
Source: Texas Municipal Reports compiled and published by the Municipal Advisory Council of Texas
Gross Debt Outstanding

176
THIS PAGE INTENTIONALLY LEFT BLANK
177
DEMOGRAPHIC AND ECONOMIC INFORMATION
These schedules contain information to assist users in understanding the socioeconomic
environment in which the District operates and to provide information that facilitates
comparisons of financial statement information over time and with other school districts.
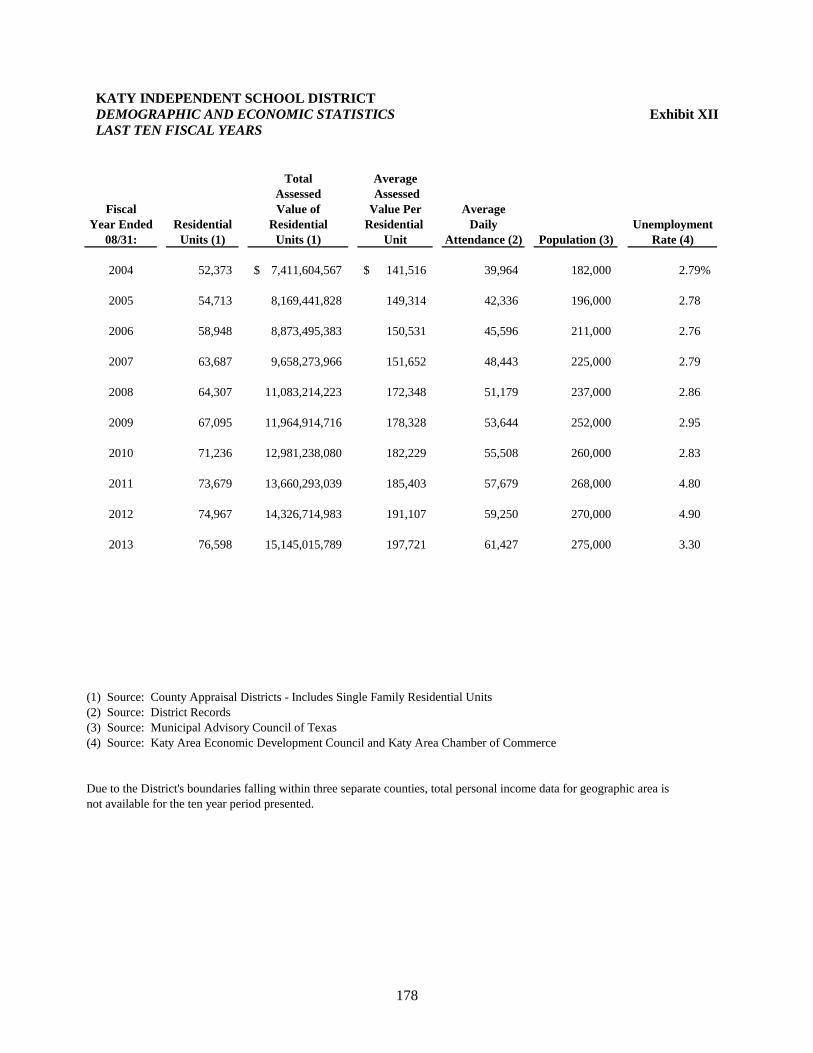
178
KATY INDEPENDENT SCHOOL DISTRICT
DEMOGRAPHIC AND ECONOMIC STATISTICS Exhibit XII
LAST TEN FISCAL YEARS
Total Average
Assessed Assessed
Fiscal Value of Value Per Average
Year Ended Residential Residential Residential Daily Unemployment
08/31: Units (1) Units (1) Unit Attendance (2) Population (3) Rate (4)
2004 52,373 7,411,604,567$ 141,516$ 39,964 182,000 2.79%
2005 54,713 8,169,441,828 149,314 42,336 196,000 2.78
2006 58,948 8,873,495,383 150,531 45,596 211,000 2.76
2007 63,687 9,658,273,966 151,652 48,443 225,000 2.79
2008 64,307 11,083,214,223 172,348 51,179 237,000 2.86
2009 67,095 11,964,914,716 178,328 53,644 252,000 2.95
2010 71,236 12,981,238,080 182,229 55,508 260,000 2.83
2011 73,679 13,660,293,039 185,403 57,679 268,000 4.80
2012 74,967 14,326,714,983 191,107 59,250 270,000 4.90
2013 76,598 15,145,015,789 197,721 61,427 275,000 3.30
(1) Source: County Appraisal Districts - Includes Single Family Residential Units
(2) Source: District Records
(3) Source: Municipal Advisory Council of Texas
(4) Source: Katy Area Economic Development Council and Katy Area Chamber of Commerce
Due to the District's boundaries falling within three separate counties, total personal income data for geographic area is
not available for the ten year period presented.
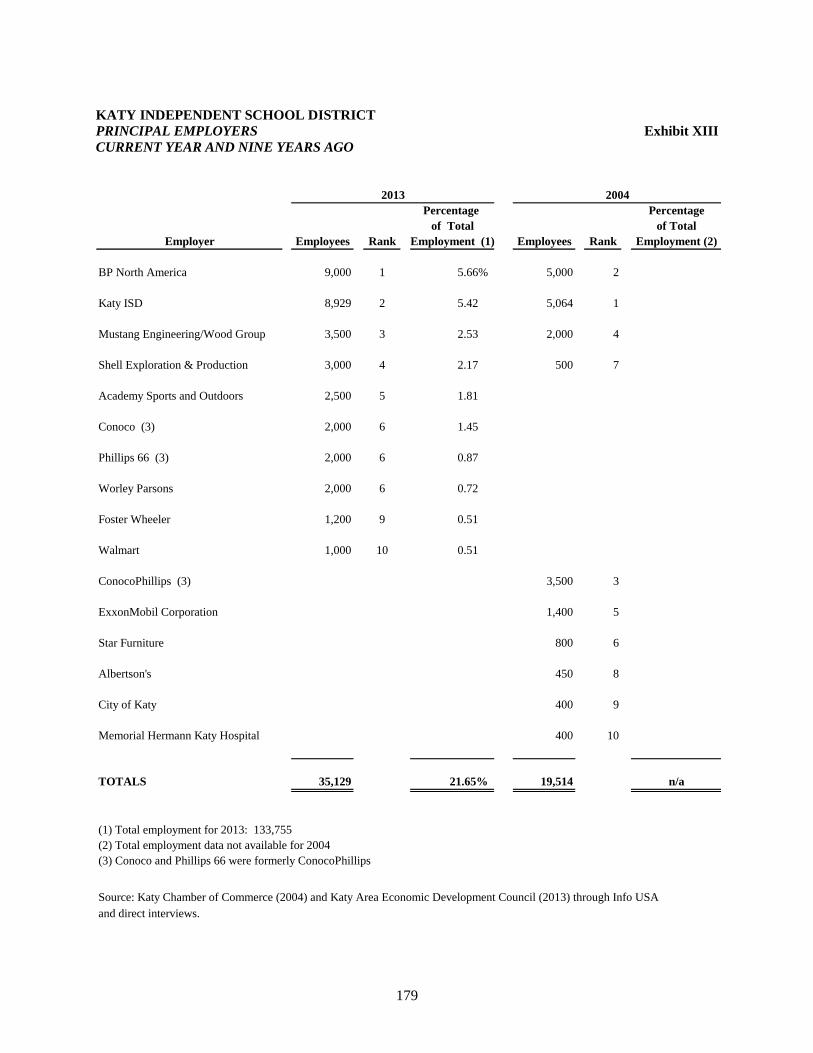
179
KATY INDEPENDENT SCHOOL DISTRICT
PRINCIPAL EMPLOYERS Exhibit XIII
CURRENT YEAR AND NINE YEARS AGO
2013 2004
Percentage Percentage
of Total of Total
Employer Employees Rank Employment (1) Employees Rank Employment (2)
BP North America 9,000 1 5.66% 5,000 2
Katy ISD 8,929 2 5.42 5,064 1
Mustang Engineering/Wood Group 3,500 3 2.53 2,000 4
Shell Exploration & Production 3,000 4 2.17 500 7
Academy Sports and Outdoors 2,500 5 1.81
Conoco (3) 2,000 6 1.45
Phillips 66 (3) 2,000 6 0.87
Worley Parsons 2,000 6 0.72
Foster Wheeler 1,200 9 0.51
Walmart 1,000 10 0.51
ConocoPhillips (3) 3,500 3
ExxonMobil Corporation 1,400 5
Star Furniture 800 6
Albertson's 450 8
City of Katy 400 9
Memorial Hermann Katy Hospital 400 10
TOTALS 35,129 21.65% 19,514 n/a
(1) Total employment for 2013: 133,755
(2) Total employment data not available for 2004
(3) Conoco and Phillips 66 were formerly ConocoPhillips
Source: Katy Chamber of Commerce (2004) and Katy Area Economic Development Council (2013) through Info USA
and direct interviews.

180
THIS PAGE INTENTIONALLY LEFT BLANK

181
OPERATING INFORMATION
These schedules contain information intended to provide contextual information about the
District’s operations and resources to assist readers in using financial statement information to
understand and assess the District’s economic condition.
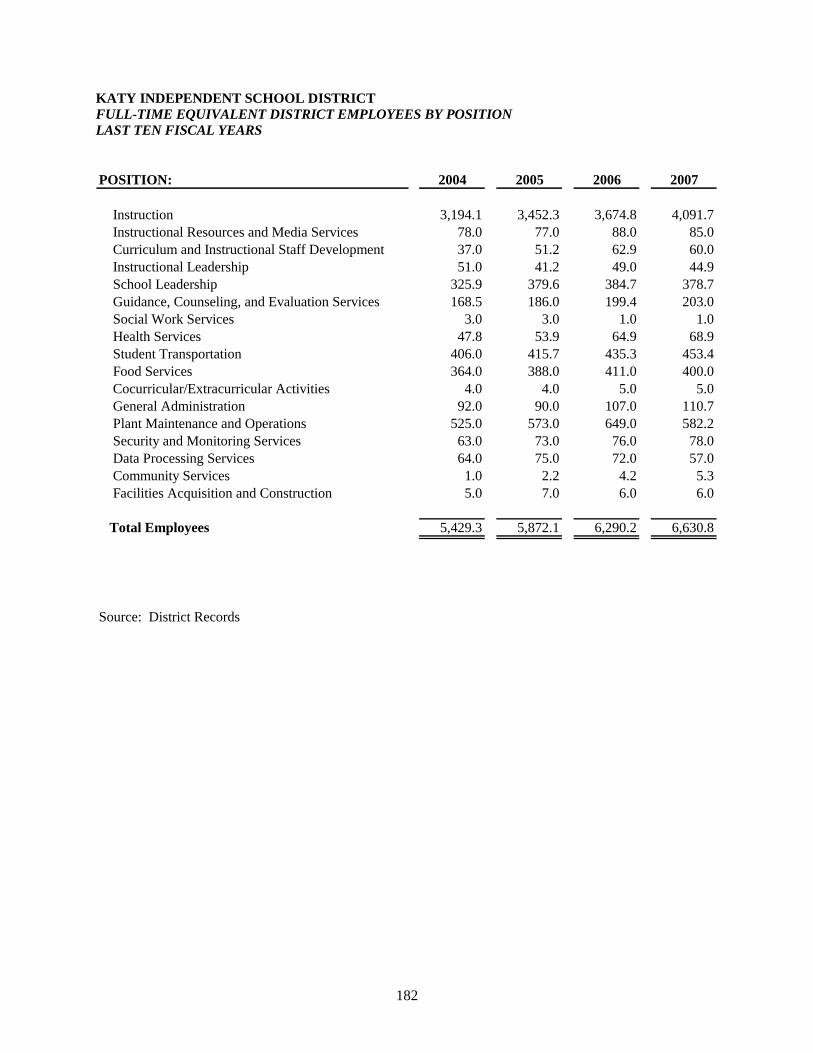
182
KATY INDEPENDENT SCHOOL DISTRICT
FULL-TIME EQUIVALENT DISTRICT EMPLOYEES BY POSITION
LAST TEN FISCAL YEARS
POSITION: 2004 2005 2006 2007
Instruction 3,194.1 3,452.3 3,674.8 4,091.7
Instructional Resources and Media Services 78.0 77.0 88.0 85.0
Curriculum and Instructional Staff Development 37.0 51.2 62.9 60.0
Instructional Leadership 51.0 41.2 49.0 44.9
School Leadership 325.9 379.6 384.7 378.7
Guidance, Counseling, and Evaluation Services 168.5 186.0 199.4 203.0
Social Work Services 3.0 3.0 1.0 1.0
Health Services 47.8 53.9 64.9 68.9
Student Transportation 406.0 415.7 435.3 453.4
Food Services 364.0 388.0 411.0 400.0
Cocurricular/Extracurricular Activities 4.0 4.0 5.0 5.0
General Administration 92.0 90.0 107.0 110.7
Plant Maintenance and Operations 525.0 573.0 649.0 582.2
Security and Monitoring Services 63.0 73.0 76.0 78.0
Data Processing Services 64.0 75.0 72.0 57.0
Community Services 1.0 2.2 4.2 5.3
Facilities Acquisition and Construction 5.0 7.0 6.0 6.0
Total Employees 5,429.3 5,872.1 6,290.2 6,630.8
Source: District Records
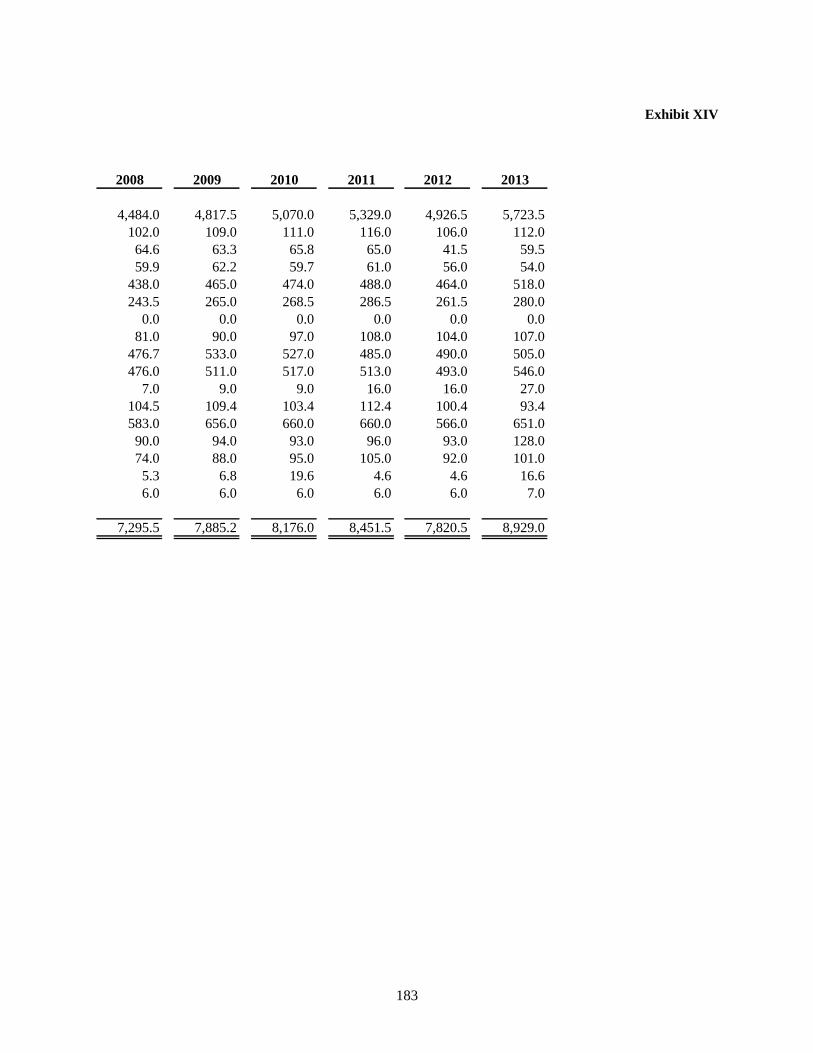
183
Exhibit XIV
2008 2009 2010 2011 2012 2013
4,484.0 4,817.5 5,070.0 5,329.0 4,926.5 5,723.5
102.0 109.0 111.0 116.0 106.0 112.0
64.6 63.3 65.8 65.0 41.5 59.5
59.9 62.2 59.7 61.0 56.0 54.0
438.0 465.0 474.0 488.0 464.0 518.0
243.5 265.0 268.5 286.5 261.5 280.0
0.0 0.0 0.0 0.0 0.0 0.0
81.0 90.0 97.0 108.0 104.0 107.0
476.7 533.0 527.0 485.0 490.0 505.0
476.0 511.0 517.0 513.0 493.0 546.0
7.0 9.0 9.0 16.0 16.0 27.0
104.5 109.4 103.4 112.4 100.4 93.4
583.0 656.0 660.0 660.0 566.0 651.0
90.0 94.0 93.0 96.0 93.0 128.0
74.0 88.0 95.0 105.0 92.0 101.0
5.3 6.8 19.6 4.6 4.6 16.6
6.0 6.0 6.0 6.0 6.0 7.0
7,295.5 7,885.2 8,176.0 8,451.5 7,820.5 8,929.0
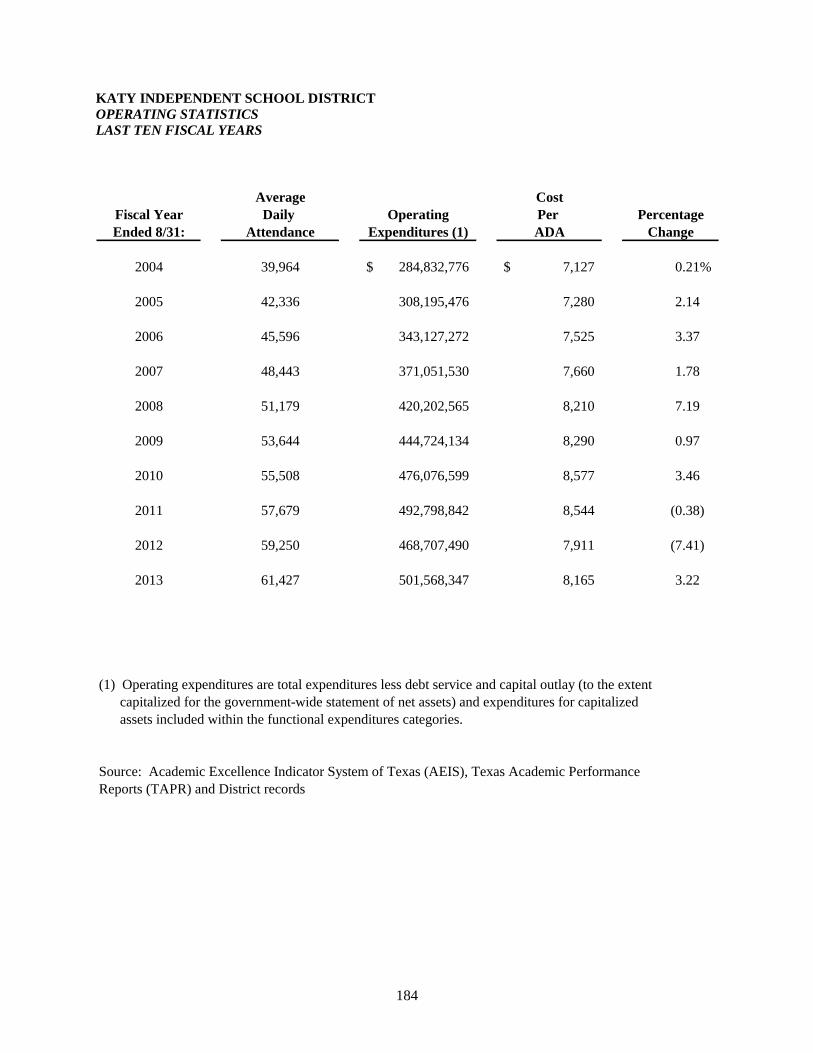
184
KATY INDEPENDENT SCHOOL DISTRICT
OPERATING STATISTICS
LAST TEN FISCAL YEARS
Average Cost
Fiscal Year Daily Operating Per Percentage
Ended 8/31: Attendance Expenditures (1) ADA Change
2004 39,964 284,832,776$ 7,127$ 0.21%
2005 42,336 308,195,476 7,280 2.14
2006 45,596 343,127,272 7,525 3.37
2007 48,443 371,051,530 7,660 1.78
2008 51,179 420,202,565 8,210 7.19
2009 53,644 444,724,134 8,290 0.97
2010 55,508 476,076,599 8,577 3.46
2011 57,679 492,798,842 8,544 (0.38)
2012 59,250 468,707,490 7,911 (7.41)
2013 61,427 501,568,347 8,165 3.22
(1) Operating expenditures are total expenditures less debt service and capital outlay (to the extent
capitalized for the government-wide statement of net assets) and expenditures for capitalized
assets included within the functional expenditures categories.
Source: Academic Excellence Indicator System of Texas (AEIS), Texas Academic Performance
Reports (TAPR) and District records
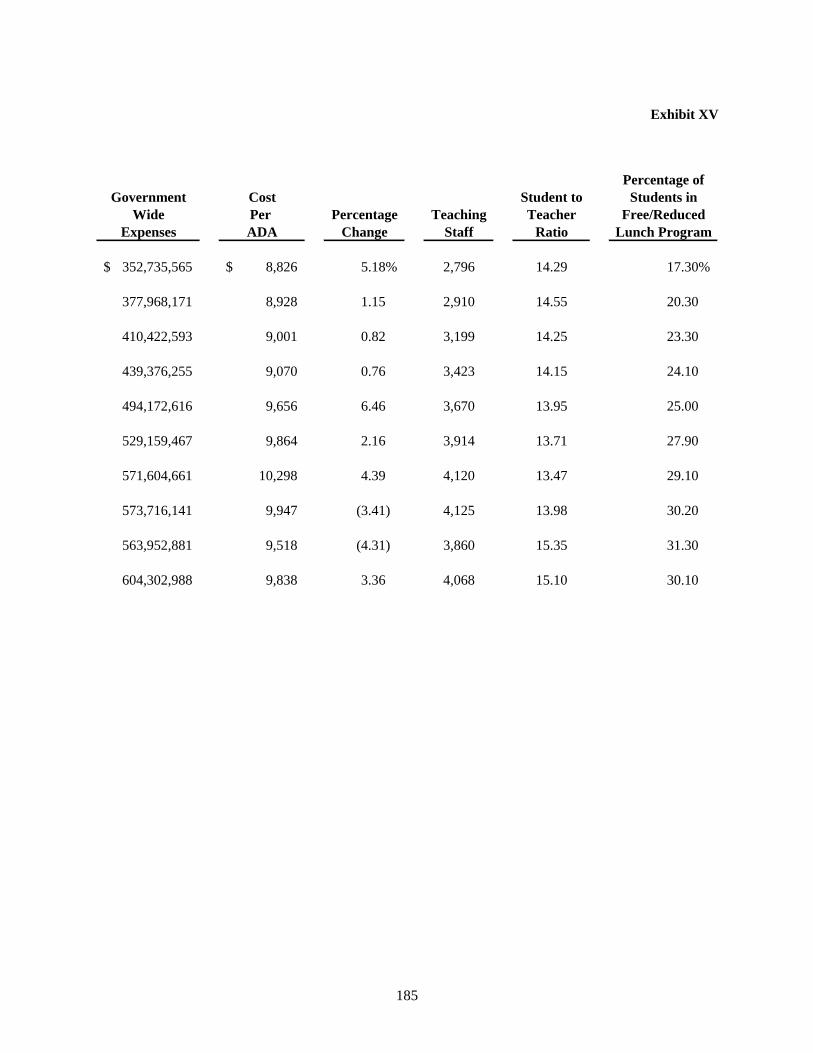
185
Exhibit XV
Percentage of
Government Cost Student to Students in
Wide Per Percentage Teaching Teacher Free/Reduced
Expenses ADA Change Staff Ratio Lunch Program
352,735,565$ 8,826$ 5.18% 2,796 14.29 17.30%
377,968,171 8,928 1.15 2,910 14.55 20.30
410,422,593 9,001 0.82 3,199 14.25 23.30
439,376,255 9,070 0.76 3,423 14.15 24.10
494,172,616 9,656 6.46 3,670 13.95 25.00
529,159,467 9,864 2.16 3,914 13.71 27.90
571,604,661 10,298 4.39 4,120 13.47 29.10
573,716,141 9,947 (3.41) 4,125 13.98 30.20
563,952,881 9,518 (4.31) 3,860 15.35 31.30
604,302,988 9,838 3.36 4,068 15.10 30.10
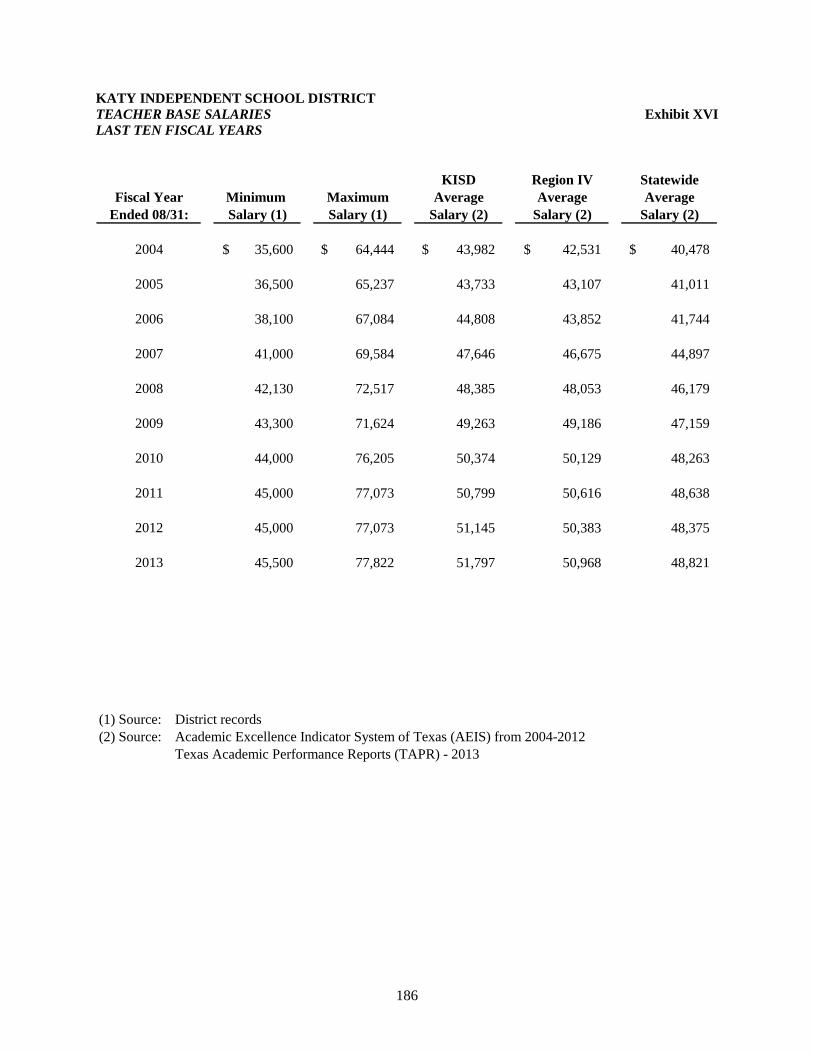
186
KATY INDEPENDENT SCHOOL DISTRICT
TEACHER BASE SALARIES Exhibit XVI
LAST TEN FISCAL YEARS
KISD Region IV Statewide
Minimum Maximum Average Average Average
Salary (1) Salary (1) Salary (2) Salary (2) Salary (2)
35,600$ 64,444$ 43,982$ 42,531$ 40,478$
36,500 65,237 43,733 43,107 41,011
38,100 67,084 44,808 43,852 41,744
41,000 69,584 47,646 46,675 44,897
42,130 72,517 48,385 48,053 46,179
43,300 71,624 49,263 49,186 47,159
44,000 76,205 50,374 50,129 48,263
45,000 77,073 50,799 50,616 48,638
45,000 77,073 51,145 50,383 48,375
45,500 77,822 51,797 50,968 48,821
(1) Source: District records
(2) Source: Academic Excellence Indicator System of Texas (AEIS) from 2004-2012
Texas Academic Performance Reports (TAPR) - 2013
2012
2013
2009
2010
2011
2008
Fiscal Year
Ended 08/31:
2004
2005
2006
2007

187
THIS PAGE INTENTIONALLY LEFT BLANK
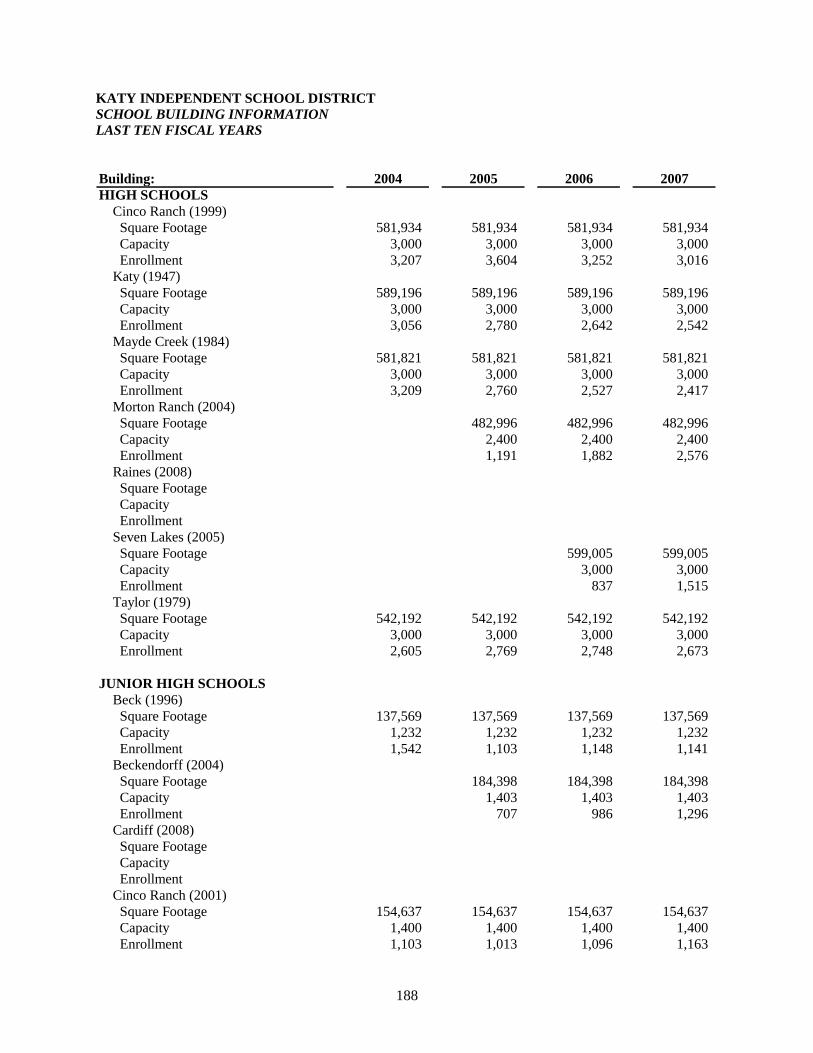
188
KATY INDEPENDENT SCHOOL DISTRICT
SCHOOL BUILDING INFORMATION
LAST TEN FISCAL YEARS
Building: 2004 2005 2006 2007
HIGH SCHOOLS
Cinco Ranch (1999)
Square Footage 581,934 581,934 581,934 581,934
Capacity 3,000 3,000 3,000 3,000
Enrollment 3,207 3,604 3,252 3,016
Katy (1947)
Square Footage 589,196 589,196 589,196 589,196
Capacity 3,000 3,000 3,000 3,000
Enrollment 3,056 2,780 2,642 2,542
Mayde Creek (1984)
Square Footage 581,821 581,821 581,821 581,821
Capacity 3,000 3,000 3,000 3,000
Enrollment 3,209 2,760 2,527 2,417
Morton Ranch (2004)
Square Footage 482,996 482,996 482,996
Capacity 2,400 2,400 2,400
Enrollment 1,191 1,882 2,576
Raines (2008)
Square Footage
Capacity
Enrollment
Seven Lakes (2005)
Square Footage 599,005 599,005
Capacity 3,000 3,000
Enrollment 837 1,515
Taylor (1979)
Square Footage 542,192 542,192 542,192 542,192
Capacity 3,000 3,000 3,000 3,000
Enrollment 2,605 2,769 2,748 2,673
JUNIOR HIGH SCHOOLS
Beck (1996)
Square Footage 137,569 137,569 137,569 137,569
Capacity 1,232 1,232 1,232 1,232
Enrollment 1,542 1,103 1,148 1,141
Beckendorff (2004)
Square Footage 184,398 184,398 184,398
Capacity 1,403 1,403 1,403
Enrollment 707 986 1,296
Cardiff (2008)
Square Footage
Capacity
Enrollment
Cinco Ranch (2001)
Square Footage 154,637 154,637 154,637 154,637
Capacity 1,400 1,400 1,400 1,400
Enrollment 1,103 1,013 1,096 1,163
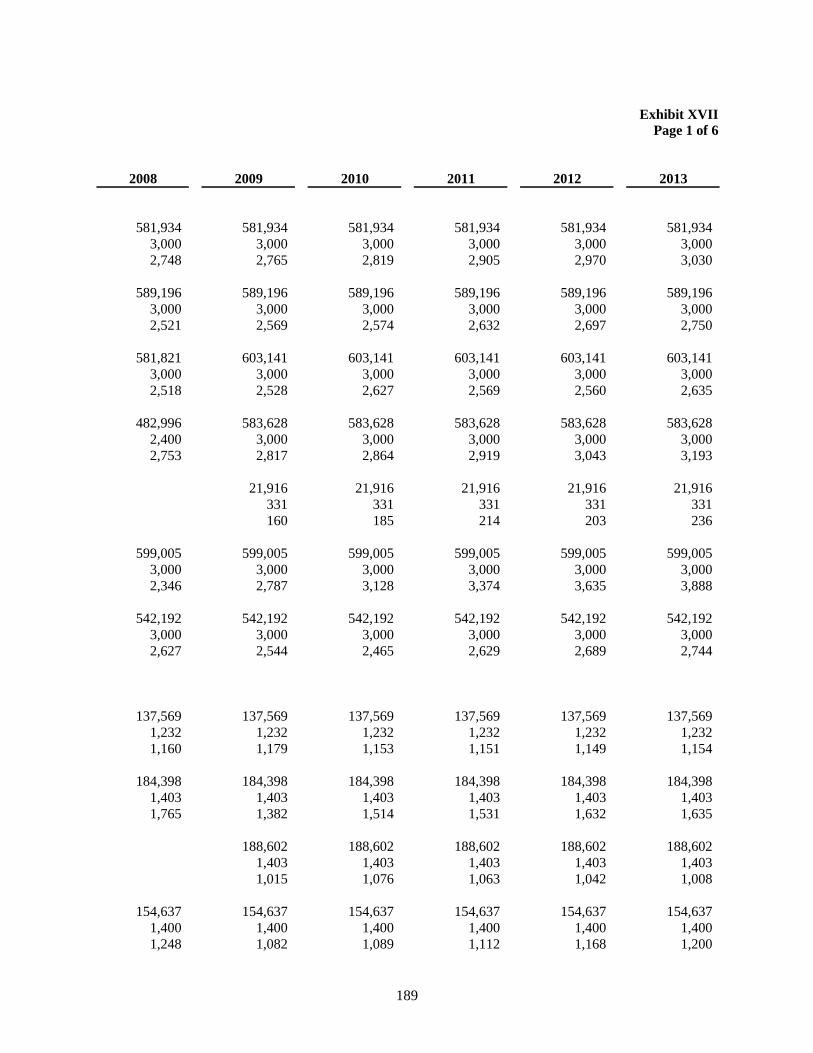
189
Exhibit XVII
Page 1 of 6
2008 2009 2010 2011 2012 2013
581,934 581,934 581,934 581,934 581,934 581,934
3,000 3,000 3,000 3,000 3,000 3,000
2,748 2,765 2,819 2,905 2,970 3,030
589,196 589,196 589,196 589,196 589,196 589,196
3,000 3,000 3,000 3,000 3,000 3,000
2,521 2,569 2,574 2,632 2,697 2,750
581,821 603,141 603,141 603,141 603,141 603,141
3,000 3,000 3,000 3,000 3,000 3,000
2,518 2,528 2,627 2,569 2,560 2,635
482,996 583,628 583,628 583,628 583,628 583,628
2,400 3,000 3,000 3,000 3,000 3,000
2,753 2,817 2,864 2,919 3,043 3,193
21,916 21,916 21,916 21,916 21,916
331 331 331 331 331
160 185 214 203 236
599,005 599,005 599,005 599,005 599,005 599,005
3,000 3,000 3,000 3,000 3,000 3,000
2,346 2,787 3,128 3,374 3,635 3,888
542,192 542,192 542,192 542,192 542,192 542,192
3,000 3,000 3,000 3,000 3,000 3,000
2,627 2,544 2,465 2,629 2,689 2,744
137,569 137,569 137,569 137,569 137,569 137,569
1,232 1,232 1,232 1,232 1,232 1,232
1,160 1,179 1,153 1,151 1,149 1,154
184,398 184,398 184,398 184,398 184,398 184,398
1,403 1,403 1,403 1,403 1,403 1,403
1,765 1,382 1,514 1,531 1,632 1,635
188,602 188,602 188,602 188,602 188,602
1,403 1,403 1,403 1,403 1,403
1,015 1,076 1,063 1,042 1,008
154,637 154,637 154,637 154,637 154,637 154,637
1,400 1,400 1,400 1,400 1,400 1,400
1,248 1,082 1,089 1,112 1,168 1,200
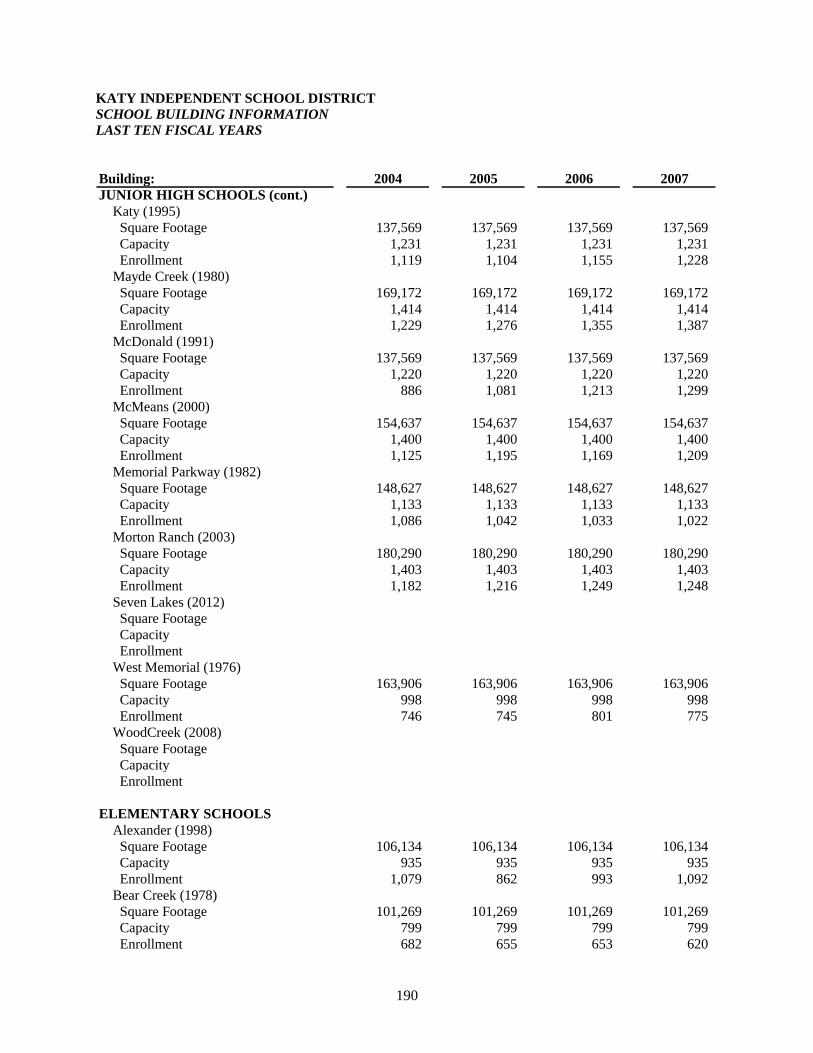
190
KATY INDEPENDENT SCHOOL DISTRICT
SCHOOL BUILDING INFORMATION
LAST TEN FISCAL YEARS
Building: 2004 2005 2006 2007
JUNIOR HIGH SCHOOLS (cont.)
Katy (1995)
Square Footage 137,569 137,569 137,569 137,569
Capacity 1,231 1,231 1,231 1,231
Enrollment 1,119 1,104 1,155 1,228
Mayde Creek (1980)
Square Footage 169,172 169,172 169,172 169,172
Capacity 1,414 1,414 1,414 1,414
Enrollment 1,229 1,276 1,355 1,387
McDonald (1991)
Square Footage 137,569 137,569 137,569 137,569
Capacity 1,220 1,220 1,220 1,220
Enrollment 886 1,081 1,213 1,299
McMeans (2000)
Square Footage 154,637 154,637 154,637 154,637
Capacity 1,400 1,400 1,400 1,400
Enrollment 1,125 1,195 1,169 1,209
Memorial Parkway (1982)
Square Footage 148,627 148,627 148,627 148,627
Capacity 1,133 1,133 1,133 1,133
Enrollment 1,086 1,042 1,033 1,022
Morton Ranch (2003)
Square Footage 180,290 180,290 180,290 180,290
Capacity 1,403 1,403 1,403 1,403
Enrollment 1,182 1,216 1,249 1,248
Seven Lakes (2012)
Square Footage
Capacity
Enrollment
West Memorial (1976)
Square Footage 163,906 163,906 163,906 163,906
Capacity 998 998 998 998
Enrollment 746 745 801 775
WoodCreek (2008)
Square Footage
Capacity
Enrollment
ELEMENTARY SCHOOLS
Alexander (1998)
Square Footage 106,134 106,134 106,134 106,134
Capacity 935 935 935 935
Enrollment 1,079 862 993 1,092
Bear Creek (1978)
Square Footage 101,269 101,269 101,269 101,269
Capacity 799 799 799 799
Enrollment 682 655 653 620
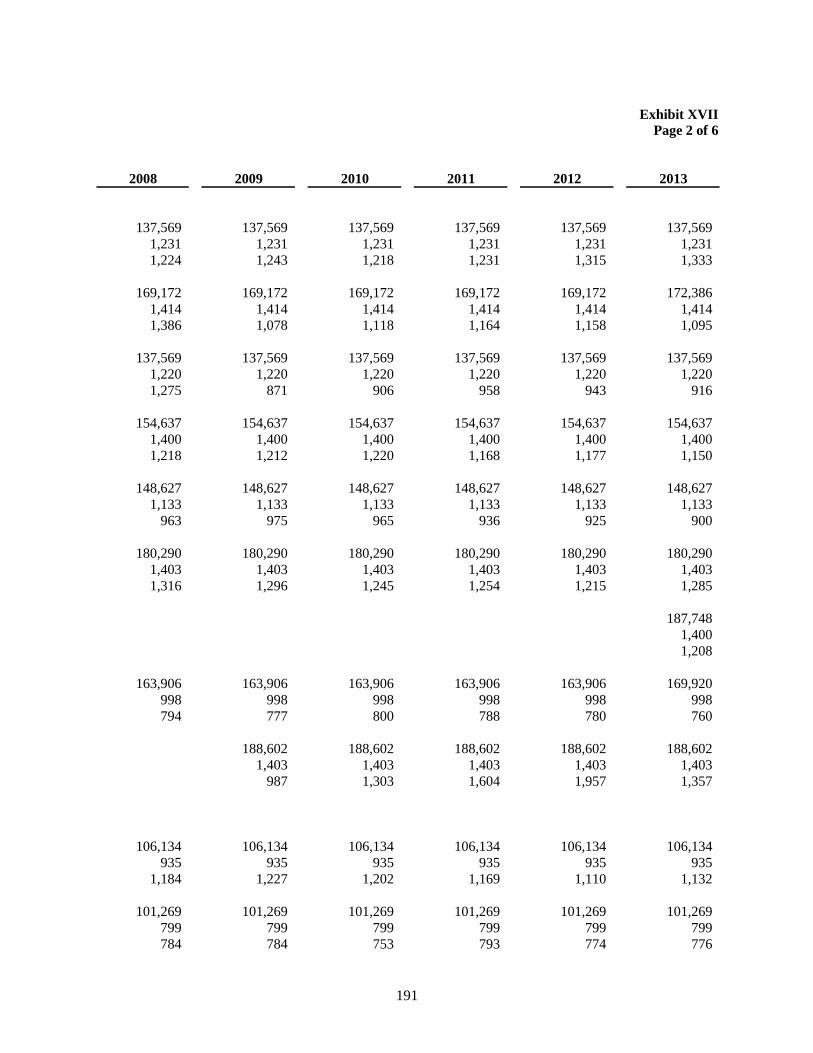
191
Exhibit XVII
Page 2 of 6
2008 2009 2010 2011 2012 2013
137,569 137,569 137,569 137,569 137,569 137,569
1,231 1,231 1,231 1,231 1,231 1,231
1,224 1,243 1,218 1,231 1,315 1,333
169,172 169,172 169,172 169,172 169,172 172,386
1,414 1,414 1,414 1,414 1,414 1,414
1,386 1,078 1,118 1,164 1,158 1,095
137,569 137,569 137,569 137,569 137,569 137,569
1,220 1,220 1,220 1,220 1,220 1,220
1,275 871 906 958 943 916
154,637 154,637 154,637 154,637 154,637 154,637
1,400 1,400 1,400 1,400 1,400 1,400
1,218 1,212 1,220 1,168 1,177 1,150
148,627 148,627 148,627 148,627 148,627 148,627
1,133 1,133 1,133 1,133 1,133 1,133
963 975 965 936 925 900
180,290 180,290 180,290 180,290 180,290 180,290
1,403 1,403 1,403 1,403 1,403 1,403
1,316 1,296 1,245 1,254 1,215 1,285
187,748
1,400
1,208
163,906 163,906 163,906 163,906 163,906 169,920
998 998 998 998 998 998
794 777 800 788 780 760
188,602 188,602 188,602 188,602 188,602
1,403 1,403 1,403 1,403 1,403
987 1,303 1,604 1,957 1,357
106,134 106,134 106,134 106,134 106,134 106,134
935 935 935 935 935 935
1,184 1,227 1,202 1,169 1,110 1,132
101,269 101,269 101,269 101,269 101,269 101,269
799 799 799 799 799 799
784 784 753 793 774 776
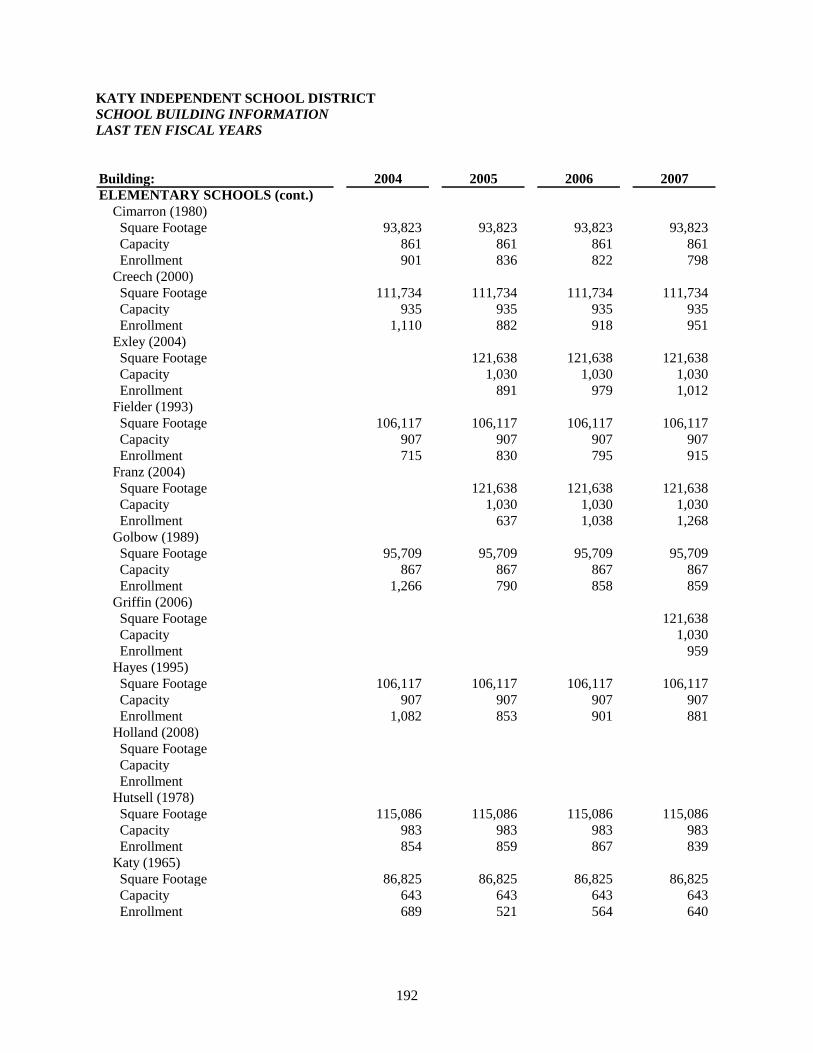
192
KATY INDEPENDENT SCHOOL DISTRICT
SCHOOL BUILDING INFORMATION
LAST TEN FISCAL YEARS
Building: 2004 2005 2006 2007
ELEMENTARY SCHOOLS (cont.)
Cimarron (1980)
Square Footage 93,823 93,823 93,823 93,823
Capacity 861 861 861 861
Enrollment 901 836 822 798
Creech (2000)
Square Footage 111,734 111,734 111,734 111,734
Capacity 935 935 935 935
Enrollment 1,110 882 918 951
Exley (2004)
Square Footage 121,638 121,638 121,638
Capacity 1,030 1,030 1,030
Enrollment 891 979 1,012
Fielder (1993)
Square Footage 106,117 106,117 106,117 106,117
Capacity 907 907 907 907
Enrollment 715 830 795 915
Franz (2004)
Square Footage 121,638 121,638 121,638
Capacity 1,030 1,030 1,030
Enrollment 637 1,038 1,268
Golbow (1989)
Square Footage 95,709 95,709 95,709 95,709
Capacity 867 867 867 867
Enrollment 1,266 790 858 859
Griffin (2006)
Square Footage 121,638
Capacity 1,030
Enrollment 959
Hayes (1995)
Square Footage 106,117 106,117 106,117 106,117
Capacity 907 907 907 907
Enrollment 1,082 853 901 881
Holland (2008)
Square Footage
Capacity
Enrollment
Hutsell (1978)
Square Footage 115,086 115,086 115,086 115,086
Capacity 983 983 983 983
Enrollment 854 859 867 839
Katy (1965)
Square Footage 86,825 86,825 86,825 86,825
Capacity 643 643 643 643
Enrollment 689 521 564 640
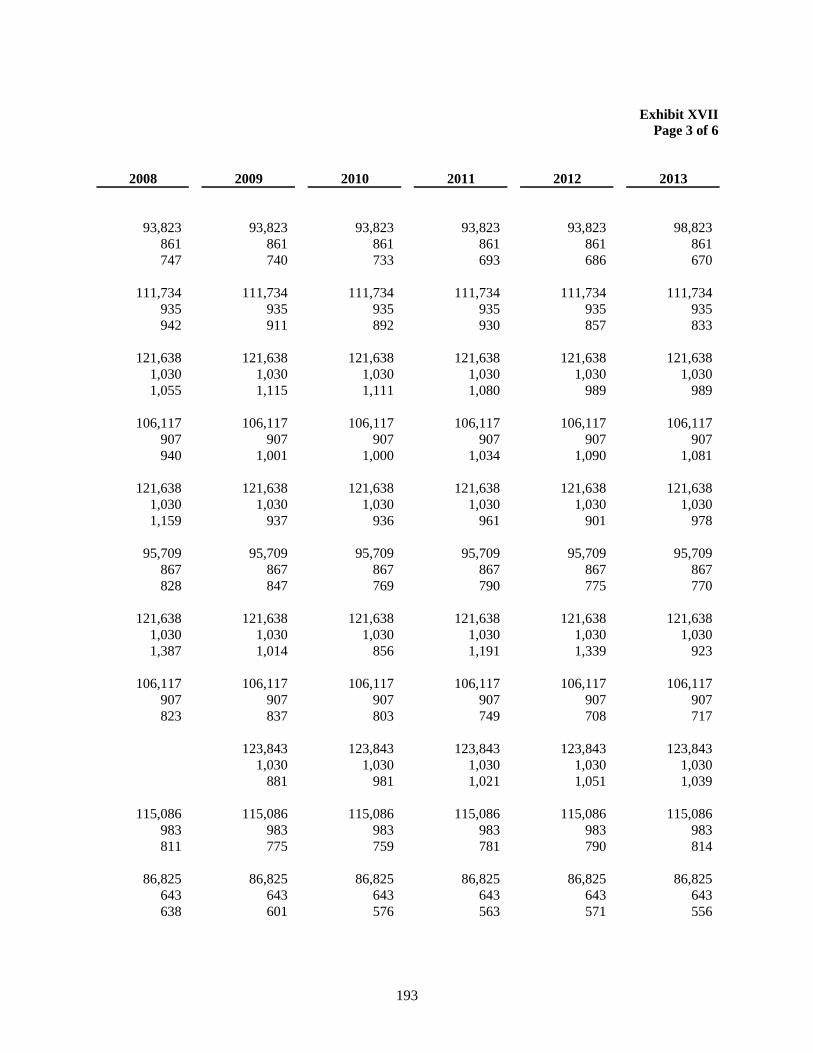
193
Exhibit XVII
Page 3 of 6
2008 2009 2010 2011 2012 2013
93,823 93,823 93,823 93,823 93,823 98,823
861 861 861 861 861 861
747 740 733 693 686 670
111,734 111,734 111,734 111,734 111,734 111,734
935 935 935 935 935 935
942 911 892 930 857 833
121,638 121,638 121,638 121,638 121,638 121,638
1,030 1,030 1,030 1,030 1,030 1,030
1,055 1,115 1,111 1,080 989 989
106,117 106,117 106,117 106,117 106,117 106,117
907 907 907 907 907 907
940 1,001 1,000 1,034 1,090 1,081
121,638 121,638 121,638 121,638 121,638 121,638
1,030 1,030 1,030 1,030 1,030 1,030
1,159 937 936 961 901 978
95,709 95,709 95,709 95,709 95,709 95,709
867 867 867 867 867 867
828 847 769 790 775 770
121,638 121,638 121,638 121,638 121,638 121,638
1,030 1,030 1,030 1,030 1,030 1,030
1,387 1,014 856 1,191 1,339 923
106,117 106,117 106,117 106,117 106,117 106,117
907 907 907 907 907 907
823 837 803 749 708 717
123,843 123,843 123,843 123,843 123,843
1,030 1,030 1,030 1,030 1,030
881 981 1,021 1,051 1,039
115,086 115,086 115,086 115,086 115,086 115,086
983 983 983 983 983 983
811 775 759 781 790 814
86,825 86,825 86,825 86,825 86,825 86,825
643 643 643 643 643 643
638 601 576 563 571 556
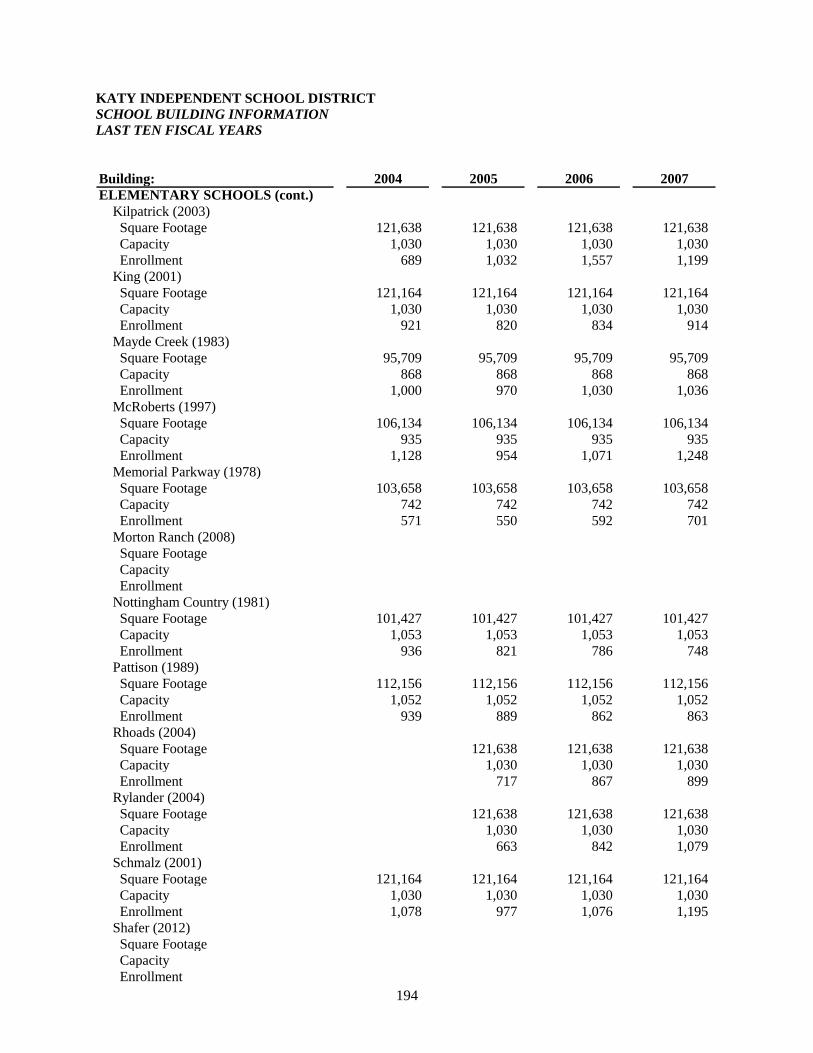
194
KATY INDEPENDENT SCHOOL DISTRICT
SCHOOL BUILDING INFORMATION
LAST TEN FISCAL YEARS
Building: 2004 2005 2006 2007
ELEMENTARY SCHOOLS (cont.)
Kilpatrick (2003)
Square Footage 121,638 121,638 121,638 121,638
Capacity 1,030 1,030 1,030 1,030
Enrollment 689 1,032 1,557 1,199
King (2001)
Square Footage 121,164 121,164 121,164 121,164
Capacity 1,030 1,030 1,030 1,030
Enrollment 921 820 834 914
Mayde Creek (1983)
Square Footage 95,709 95,709 95,709 95,709
Capacity 868 868 868 868
Enrollment 1,000 970 1,030 1,036
McRoberts (1997)
Square Footage 106,134 106,134 106,134 106,134
Capacity 935 935 935 935
Enrollment 1,128 954 1,071 1,248
Memorial Parkway (1978)
Square Footage 103,658 103,658 103,658 103,658
Capacity 742 742 742 742
Enrollment 571 550 592 701
Morton Ranch (2008)
Square Footage
Capacity
Enrollment
Nottingham Country (1981)
Square Footage 101,427 101,427 101,427 101,427
Capacity 1,053 1,053 1,053 1,053
Enrollment 936 821 786 748
Pattison (1989)
Square Footage 112,156 112,156 112,156 112,156
Capacity 1,052 1,052 1,052 1,052
Enrollment 939 889 862 863
Rhoads (2004)
Square Footage 121,638 121,638 121,638
Capacity 1,030 1,030 1,030
Enrollment 717 867 899
Rylander (2004)
Square Footage 121,638 121,638 121,638
Capacity 1,030 1,030 1,030
Enrollment 663 842 1,079
Schmalz (2001)
Square Footage 121,164 121,164 121,164 121,164
Capacity 1,030 1,030 1,030 1,030
Enrollment 1,078 977 1,076 1,195
Shafer (2012)
Square Footage
Capacity
Enrollment
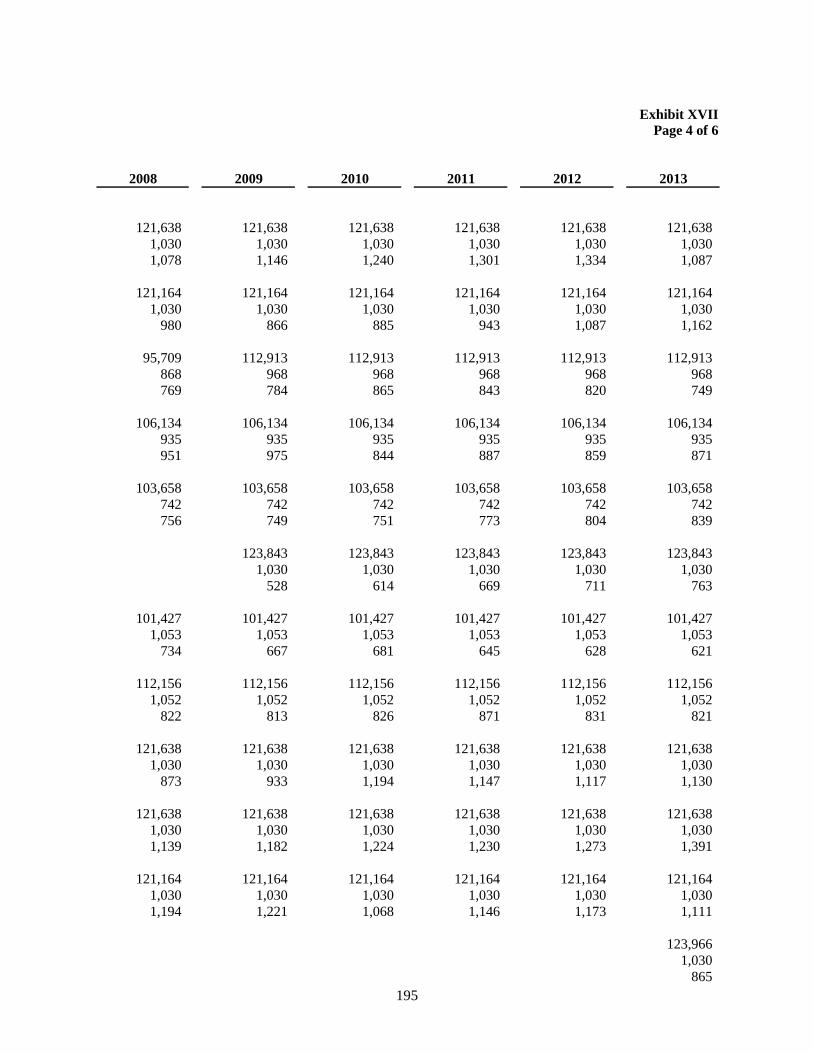
195
Exhibit XVII
Page 4 of 6
2008 2009 2010 2011 2012 2013
121,638 121,638 121,638 121,638 121,638 121,638
1,030 1,030 1,030 1,030 1,030 1,030
1,078 1,146 1,240 1,301 1,334 1,087
121,164 121,164 121,164 121,164 121,164 121,164
1,030 1,030 1,030 1,030 1,030 1,030
980 866 885 943 1,087 1,162
95,709 112,913 112,913 112,913 112,913 112,913
868 968 968 968 968 968
769 784 865 843 820 749
106,134 106,134 106,134 106,134 106,134 106,134
935 935 935 935 935 935
951 975 844 887 859 871
103,658 103,658 103,658 103,658 103,658 103,658
742 742 742 742 742 742
756 749 751 773 804 839
123,843 123,843 123,843 123,843 123,843
1,030 1,030 1,030 1,030 1,030
528 614 669 711 763
101,427 101,427 101,427 101,427 101,427 101,427
1,053 1,053 1,053 1,053 1,053 1,053
734 667 681 645 628 621
112,156 112,156 112,156 112,156 112,156 112,156
1,052 1,052 1,052 1,052 1,052 1,052
822 813 826 871 831 821
121,638 121,638 121,638 121,638 121,638 121,638
1,030 1,030 1,030 1,030 1,030 1,030
873 933 1,194 1,147 1,117 1,130
121,638 121,638 121,638 121,638 121,638 121,638
1,030 1,030 1,030 1,030 1,030 1,030
1,139 1,182 1,224 1,230 1,273 1,391
121,164 121,164 121,164 121,164 121,164 121,164
1,030 1,030 1,030 1,030 1,030 1,030
1,194 1,221 1,068 1,146 1,173 1,111
123,966
1,030
865
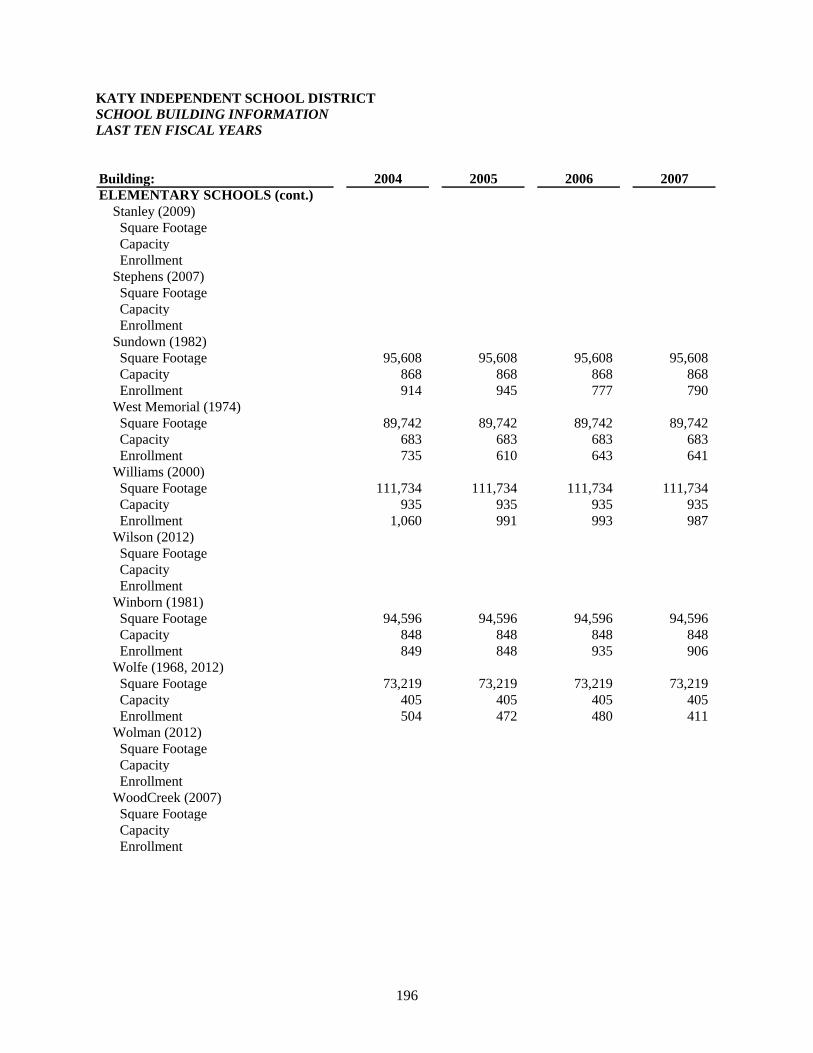
196
KATY INDEPENDENT SCHOOL DISTRICT
SCHOOL BUILDING INFORMATION
LAST TEN FISCAL YEARS
Building: 2004 2005 2006 2007
ELEMENTARY SCHOOLS (cont.)
Stanley (2009)
Square Footage
Capacity
Enrollment
Stephens (2007)
Square Footage
Capacity
Enrollment
Sundown (1982)
Square Footage 95,608 95,608 95,608 95,608
Capacity 868 868 868 868
Enrollment 914 945 777 790
West Memorial (1974)
Square Footage 89,742 89,742 89,742 89,742
Capacity 683 683 683 683
Enrollment 735 610 643 641
Williams (2000)
Square Footage 111,734 111,734 111,734 111,734
Capacity 935 935 935 935
Enrollment 1,060 991 993 987
Wilson (2012)
Square Footage
Capacity
Enrollment
Winborn (1981)
Square Footage 94,596 94,596 94,596 94,596
Capacity 848 848 848 848
Enrollment 849 848 935 906
Wolfe (1968, 2012)
Square Footage 73,219 73,219 73,219 73,219
Capacity 405 405 405 405
Enrollment 504 472 480 411
Wolman (2012)
Square Footage
Capacity
Enrollment
WoodCreek (2007)
Square Footage
Capacity
Enrollment
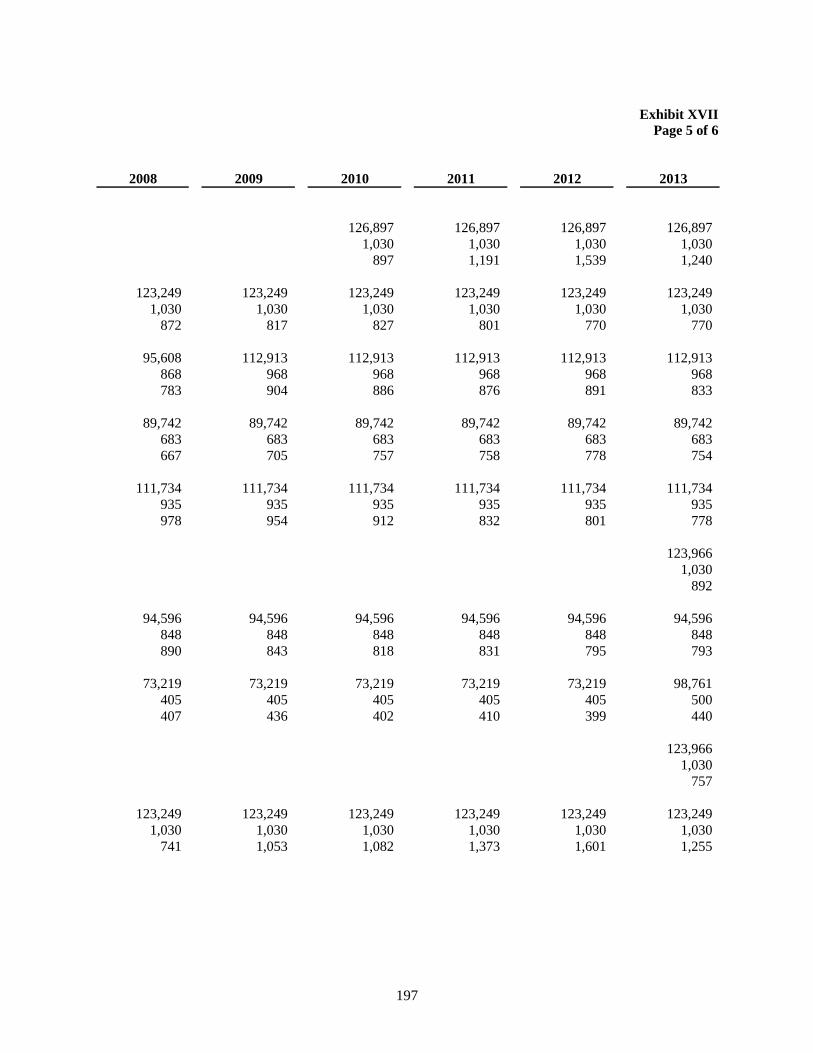
197
Exhibit XVII
Page 5 of 6
2008 2009 2010 2011 2012 2013
126,897 126,897 126,897 126,897
1,030 1,030 1,030 1,030
897 1,191 1,539 1,240
123,249 123,249 123,249 123,249 123,249 123,249
1,030 1,030 1,030 1,030 1,030 1,030
872 817 827 801 770 770
95,608 112,913 112,913 112,913 112,913 112,913
868 968 968 968 968 968
783 904 886 876 891 833
89,742 89,742 89,742 89,742 89,742 89,742
683 683 683 683 683 683
667 705 757 758 778 754
111,734 111,734 111,734 111,734 111,734 111,734
935 935 935 935 935 935
978 954 912 832 801 778
123,966
1,030
892
94,596 94,596 94,596 94,596 94,596 94,596
848 848 848 848 848 848
890 843 818 831 795 793
73,219 73,219 73,219 73,219 73,219 98,761
405 405 405 405 405 500
407 436 402 410 399 440
123,966
1,030
757
123,249 123,249 123,249 123,249 123,249 123,249
1,030 1,030 1,030 1,030 1,030 1,030
741 1,053 1,082 1,373 1,601 1,255
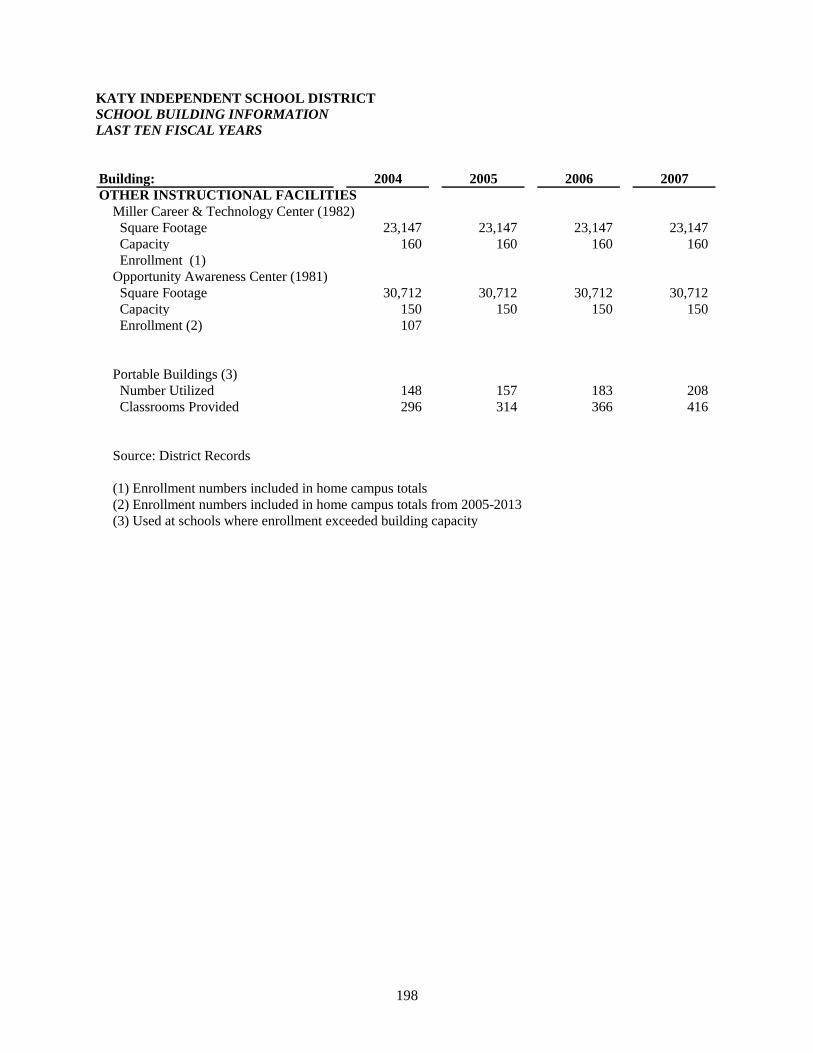
198
KATY INDEPENDENT SCHOOL DISTRICT
SCHOOL BUILDING INFORMATION
LAST TEN FISCAL YEARS
Building: 2004 2005 2006 2007
OTHER INSTRUCTIONAL FACILITIES
Miller Career & Technology Center (1982)
Square Footage 23,147 23,147 23,147 23,147
Capacity 160 160 160 160
Enrollment (1)
Opportunity Awareness Center (1981)
Square Footage 30,712 30,712 30,712 30,712
Capacity 150 150 150 150
Enrollment (2) 107
Portable Buildings (3)
Number Utilized 148 157 183 208
Classrooms Provided 296 314 366 416
Source: District Records
(1) Enrollment numbers included in home campus totals
(2) Enrollment numbers included in home campus totals from 2005-2013
(3) Used at schools where enrollment exceeded building capacity
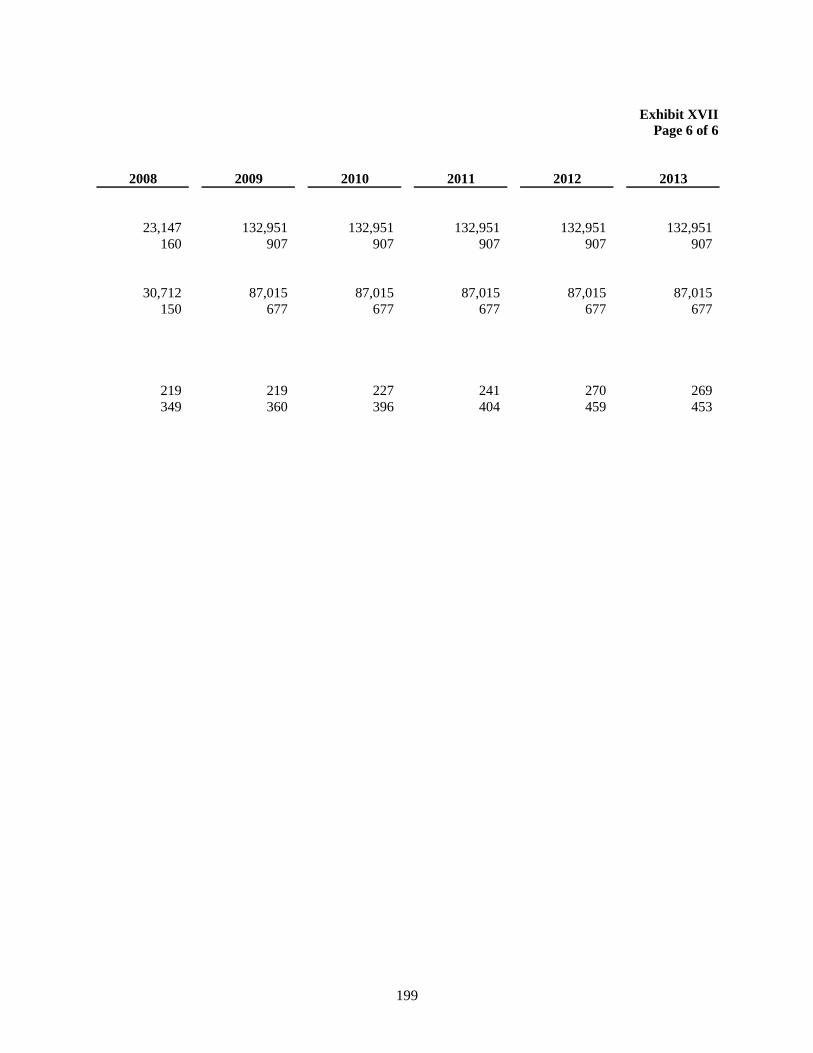
199
Exhibit XVII
Page 6 of 6
2008 2009 2010 2011 2012 2013
23,147 132,951 132,951 132,951 132,951 132,951
160 907 907 907 907 907
30,712 87,015 87,015 87,015 87,015 87,015
150 677 677 677 677 677
219 219 227 241 270 269
349 360 396 404 459 453
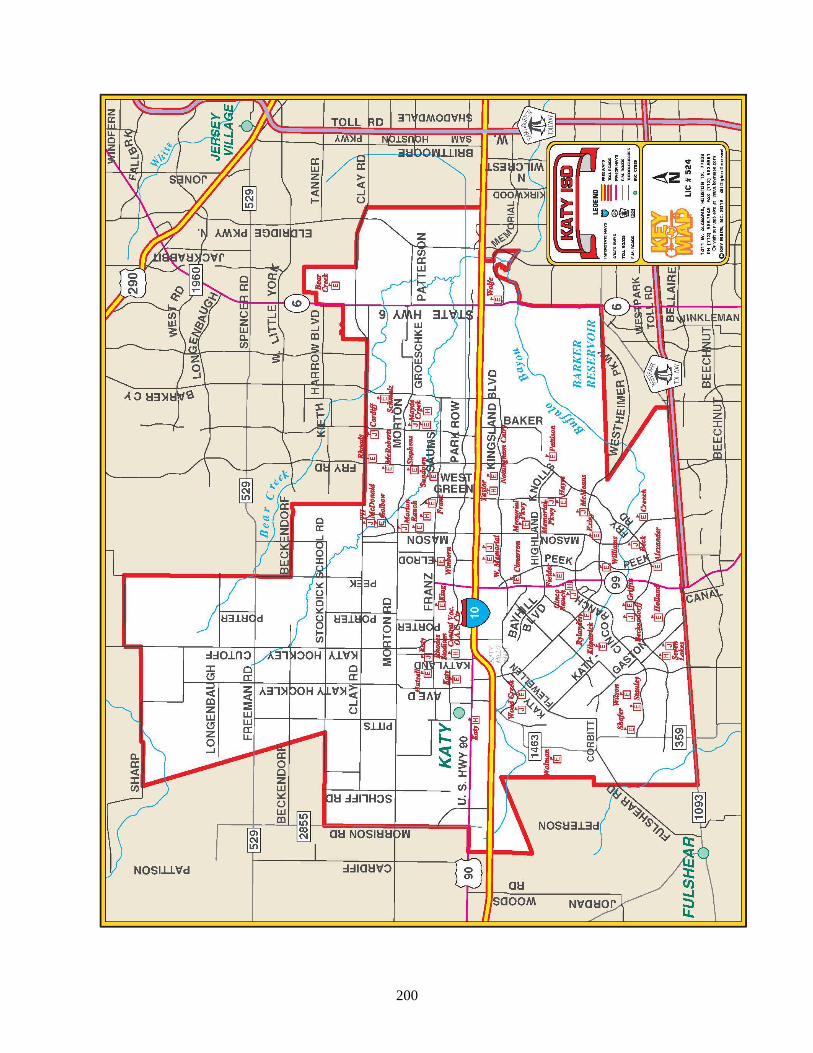
200
Katy Independent School District
6301 South Stadium Lane
P.O. Box 159
Katy, Texas 77492-0159