Embed Size (px)
Citation preview
Financial Report March 2019
CORPORATE INFORMATION
as at March 31, 2019
Board of Directors
Azhar Hamid Chief Financial Officer Al-Ameen Islamic Dedidcated Equity Fund
Chairman Umair Ahmed Launch Date: 05 Jan 2016
Yasir Qadri
Chief Executive Officer Company Secretary Al- Ameen Islamic Financial Planning Fund - II
Aly Osman Launch Date: 21 February 2017
Syed Furrukh Zaeem
Director Registered Office UBL Capital Protected Fund - III
4th Floor, STSM Building, Launch Date: 26 January 2017
Naz Khan Beaumont Road, Civil Lines,
Director Karachi, Pakistan. UBL Financial Planning Fund
Launch Date: 28 September 2017
Tauqeer Mazhar Head Office
Director 4th Floor, STSM Building, Al- Ameen Islamic Financial Planning Fund - III
Beaumont Road, Civil Lines, Launch Date: 28 May 2018
Sadia Saeed Karachi, Pakistan.
Director UAN: (92-21) 111-825-262 UBL Dedicated Equity Fund
Fax: (92-21) 32214930 Launch Date: 29 May 2018
Imran Sarwar
Director Date of incorporation of the Management UBL Financial Sector FundCompany/ Pension Fund Manager Launch Date: 06 April 2018Incorporated in Pakistan on
Audit Committee 3 April 2001 as a Public Limited UBL Special Saving Fund
Naz Khan Company under the Companies Launch Date: 09 November 2018
Chair Ordinance, 1984
Imran Sarwar Management Quality Rating
Member AM1 by JCR-VIS Credit Rating Company Conventional Investment Plans
Sadia Saeed Funds Under Management UBL Mahana Munafa Plan
Member UBL Liquidity Plus Fund
Launch Date: 21 June 2009 UBL Children Savings Plan
Tauqeer Mazhar
Member UBL Government Securities Fund UBL Equity Builder Plan
Launch Date: 27 July 2011
UBL Wealth Builder Plan
Risk and Compliance Committee UBL Money Market Fund
Imran Sarwar Launch Date: 14 October 2010
Chairman Islamic Investment Plans
Al-Ameen Mahana Munafa Plan
Syed Furrukh Zaeem UBL Income Opportunity Fund
Member Launch Date: 29 March 2013 Al-Ameen Children Savings Plan
Yasir Qadri UBL Growth & Income Fund Al-Ameen Equity Builder Plan
Member Launch Date: 2 March 2006
Al-Ameen Wealth Builder Plan
Azhar Hamid UBL Asset Allocation Fund
Member Launch Date: 20 August 2013 Al-Ameen Hajj Savings Plan
Tauqeer Mazhar UBL Stock Advantage Fund
Member Launch Date: 4 August 2006
Al-Ameen Islamic Sovereign Fund
HR & Compensation Committee Launch Date: 07 November 2010
Azhar Hamid
Chairman Al-Ameen Islamic Aggressive Income Fund
Launch Date: 20 October 2007
Naz Khan
Member Al-Ameen Islamic Cash Fund
Launch Date: 17 September 2012
Syed Furrukh Zaeem
Member Al-Ameen Shariah Stock Fund
Launch Date: 24 December 2006
Sadia Saeed Member Al-Ameen Islamic Asset Allocation Fund
Launch Date: 10 December 2013
Yasir QadriMember Al- Ameen Islamic Financial Planning Fund
Launch Date: 23 June 2015
Shariah Advisory Board
Mufti Muhammad Hassaan Kaleem UBL Retirement Savings Fund
Member Launch Date: 10 May 2010
Mufti Muhammad Najeeb Khan Al-Ameen Islamic Retirement Savings Fund
Member Launch Date: 10 May 2010
Al Ameen Funds - Directors Report – Nine Months Period Ended March 31, 2019 Page 1
Directors’ Report The Board of Directors of UBL Fund Managers Limited is pleased to present to you the reports of its Al-Amen series represented by Al-Ameen Islamic Cash Fund (AICF), Al-Ameen Islamic Sovereign Fund (AISF), Al-Ameen Islamic Aggressive Income Fund (AIAIF), AL-Ameen Islamic Asset Allocation Fund (AIAAF), Al-Ameen Shariah Stock Fund (ASSF), Al-Ameen Islamic Dedicated Equity Fund (AIDEF), , Al-Ameen Islamic Active Allocation Plan – V (AIActAP-V), Al-Ameen Islamic Active Allocation Plan – VI (AIActAP-VI), Al-Ameen Islamic Active Allocation Plan – VII (AIActAP-VII), Al-Ameen Islamic Active Allocation Plan – VIII (AIActAP-VIII), Al-Ameen Islamic Active Allocation Plan – IX (AIActAP-IX), Al-Ameen Islamic Active Allocation Plan – X
(AIActAP-X), Al‐Ameen Islamic Active Principal Preservation Plan‐I (AIAPPP‐I), Al‐Ameen Islamic Active Principal Preservation
Plan‐II (AIAPPP‐II), Al‐Ameen Islamic Active Principal Preservation Plan‐III (AIAPPP‐III) and Al‐Ameen Islamic Active Principal Preservation Plan‐IV (AIAPPP‐IV) for nine months period ended March 31, 2019.
Economy & Money Market Review – 9MFY’19
The economy of Pakistan has shown signs of major economic slowdown during 9MFY19. During the period, SBP raised its policy rate by 425bps from 6.50% to 10.75%. Similarly, currency also devalued by ~16% during the period under review. The restrictive measures have resulted in slowdown in large scale manufacturing which declined by 2.3% during 7MFY19 with sectors like cement, automobiles and petroleum products showing decline in demand. Breakup of LSM shows significant decline in Food beverages, Petroleum Products and Iron & Steel Products segments. The decline in cyclical sectors was primarily attributable to slowdown in aggregate demand due to high interest rate and PKR devaluation. The latest balance of payment numbers have been extremely positive as monthly current account deficit declined by 59%MoM and 72%YoY, settling at just USD356mn, a 29 month low, in February. Reduction in CAD was broad‐based with all heads showing improvement. During 8MFY19, CAD has declined by 23%YoY to USD 8,844mn. Going forward, we expect further improvement in monthly CAD run rate, where we expect it to remain around USD600/700mn on account of monetary and exchange rate adjustments along with fiscal consolidation. Remittances have also shown sign of improvement and registered a growth of ~12% during 8MFY19 compared to SPLY, which has funded 70% of trade deficit. FX Inflows in the form of multilateral and bilateral debt will be the main source of financing of current account and external debt repayments. Average Inflation for 9MFY19 clocked in at 6.7% with increase primarily attributable to food index and transport segment. Core inflation‟s averaged at 8.2% 9MFY19. We expect inflation to remain at consistent level given the recent rise in oil prices and holy month of Ramadan approaching. The State Bank of Pakistan in its latest MPS decided to raise the policy rate to 10.75% on account of escalated core inflation. We don‟t see any major hike in interest rates going forward.
Stock Market Review – 9MFY’19
The KSE-100 index in recent months has remained bearish with 3QFY19 return of mere 1.7%. During 9MFY19, foreign investors sold heavily (net USD 373mn worth of shares). The average daily traded shares during this period also remained dry at ~82.6mn as the confidence of the investor is still shaky due to weak economic outlook. Moreover, yields on risk free instruments as a substitute investment became increasingly eye-catching given the rise in interest rates. The investor‟s confidence seems to be in doldrums recently but consistent policies on macro and micro level would definitely bring the confidence back as we have seen it in the past. Valuations at current levels remain attractive and an impending IMF program would lend clarity to investors and act as a catalyst for market performance. The market is trading at a significant discount to region (Fwd P/E 7.3 vs 13.1 region average). The dividend yield is also highest among the region (7% vs 2.5% region average), these factors along with expected IMF bailout advocates a strong fundamental
Al Ameen Funds - Directors Report – Nine Months Period Ended March 31, 2019 Page 2
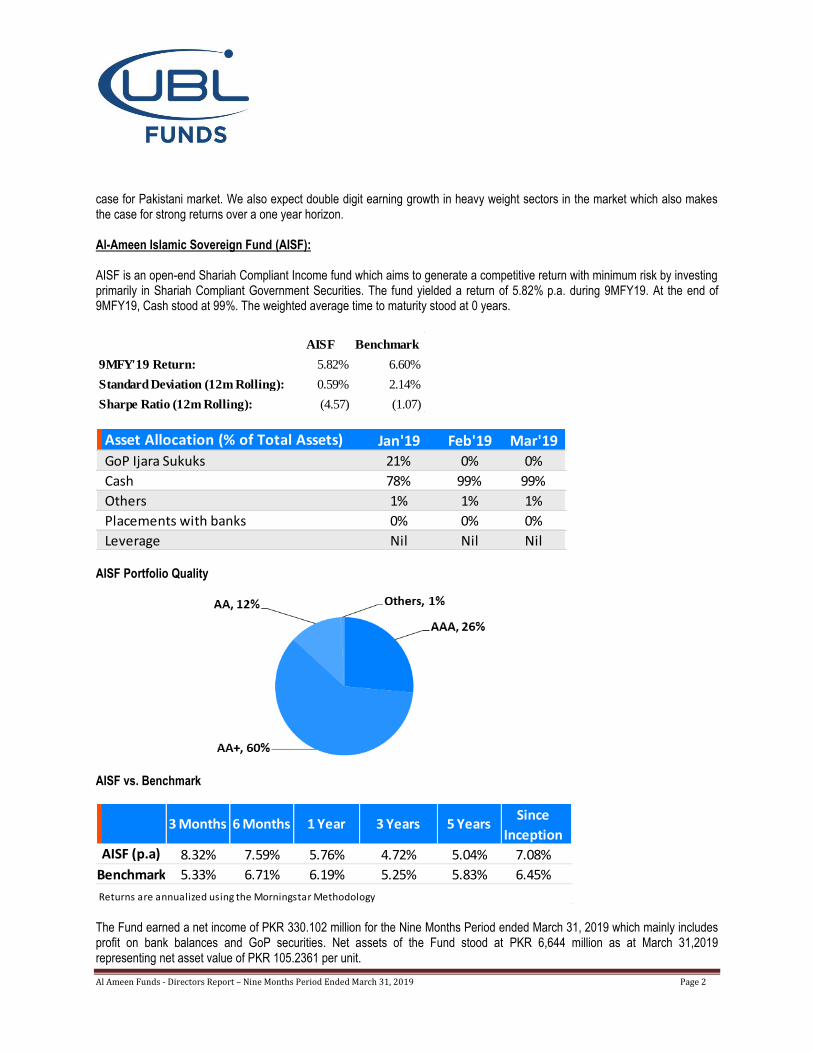
case for Pakistani market. We also expect double digit earning growth in heavy weight sectors in the market which also makes the case for strong returns over a one year horizon. Al-Ameen Islamic Sovereign Fund (AISF): AISF is an open-end Shariah Compliant Income fund which aims to generate a competitive return with minimum risk by investing primarily in Shariah Compliant Government Securities. The fund yielded a return of 5.82% p.a. during 9MFY19. At the end of 9MFY19, Cash stood at 99%. The weighted average time to maturity stood at 0 years.
AISF Benchmark
9MFY'19 Return: 5.82% 6.60%
Standard Deviation (12m Rolling): 0.59% 2.14%
Sharpe Ratio (12m Rolling): (4.57) (1.07)
Asset Allocation (% of Total Assets) Jan'19 Feb'19 Mar'19GoP Ijara Sukuks 21% 0% 0%
Cash 78% 99% 99%
Others 1% 1% 1%
Placements with banks 0% 0% 0%
Leverage Nil Nil Nil AISF Portfolio Quality
AISF vs. Benchmark
8.32% 7.59% 5.76% 4.72% 5.04% 7.08%
5.33% 6.71% 6.19% 5.25% 5.83% 6.45%
Returns are annualized using the Morningstar Methodology
1 Year 3 Years 5 YearsSince
Inception
Benchmark
AISF (p.a)
3 Months 6 Months
The Fund earned a net income of PKR 330.102 million for the Nine Months Period ended March 31, 2019 which mainly includes profit on bank balances and GoP securities. Net assets of the Fund stood at PKR 6,644 million as at March 31,2019 representing net asset value of PKR 105.2361 per unit.
Al Ameen Funds - Directors Report – Nine Months Period Ended March 31, 2019 Page 3
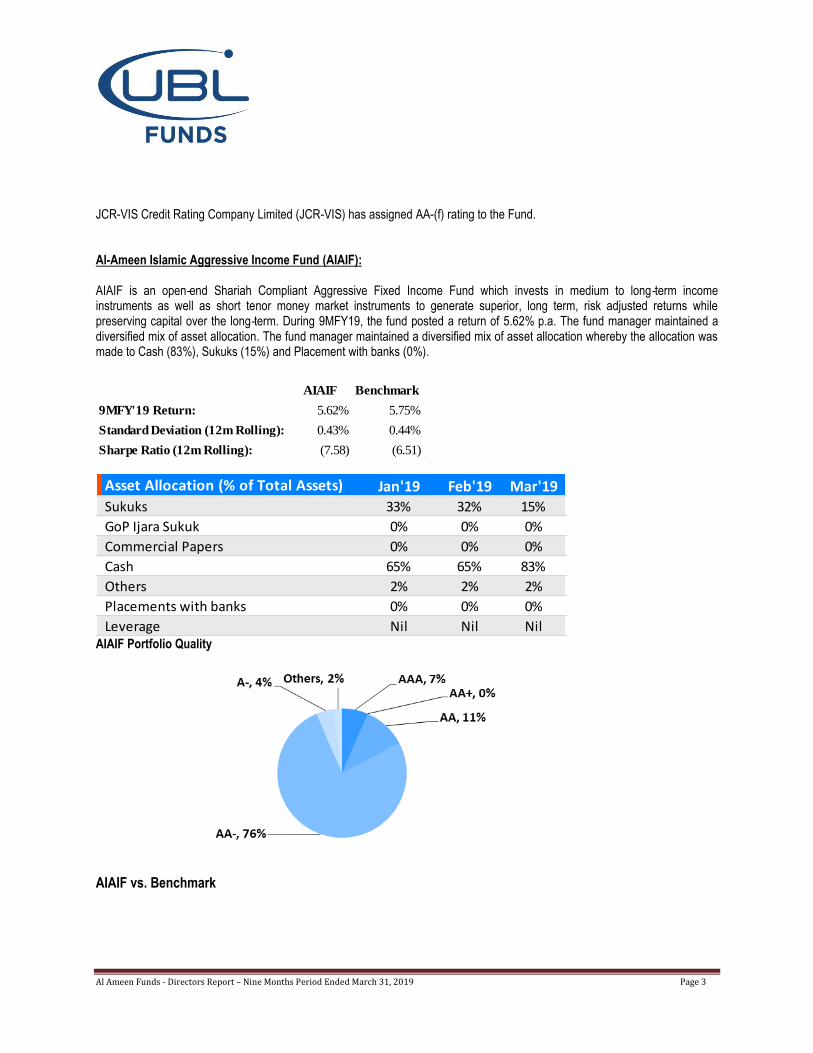
JCR-VIS Credit Rating Company Limited (JCR-VIS) has assigned AA-(f) rating to the Fund. Al-Ameen Islamic Aggressive Income Fund (AIAIF): AIAIF is an open‐end Shariah Compliant Aggressive Fixed Income Fund which invests in medium to long‐term income instruments as well as short tenor money market instruments to generate superior, long term, risk adjusted returns while preserving capital over the long‐term. During 9MFY19, the fund posted a return of 5.62% p.a. The fund manager maintained a diversified mix of asset allocation. The fund manager maintained a diversified mix of asset allocation whereby the allocation was made to Cash (83%), Sukuks (15%) and Placement with banks (0%).
AIAIF Benchmark
9MFY'19 Return: 5.62% 5.75%
Standard Deviation (12m Rolling): 0.43% 0.44%
Sharpe Ratio (12m Rolling): (7.58) (6.51)
Asset Allocation (% of Total Assets) Jan'19 Feb'19 Mar'19
Sukuks 33% 32% 15%
GoP Ijara Sukuk 0% 0% 0%
Commercial Papers 0% 0% 0%
Cash 65% 65% 83%
Others 2% 2% 2%
Placements with banks 0% 0% 0%
Leverage Nil Nil Nil AIAIF Portfolio Quality
AIAIF vs. Benchmark
Al Ameen Funds - Directors Report – Nine Months Period Ended March 31, 2019 Page 4
7.78% 6.04% 5.18% 4.70% 6.58% 5.72%
6.30% 5.94% 5.64% 5.43% 6.17% 7.24%Returns are annualized using the Morningstar Methodology
1 Year 3 Years 5 Years
Benchmark
AIAIF (p.a)
3 Months 6 MonthsSince
Inception
The Fund earned a net income of PKR 22.484 million for the Nine Months Period ended March 31, 2019. Net assets of the Fund stood at PKR 457 million as at March 31, 2019 representing net asset value of PKR 104.1242 per unit. JCR-VIS Credit Rating Company Limited (JCR-VIS) has assigned BBB+ (f) rating to the Fund. Al-Ameen Shariah Stock Fund (ASSF):
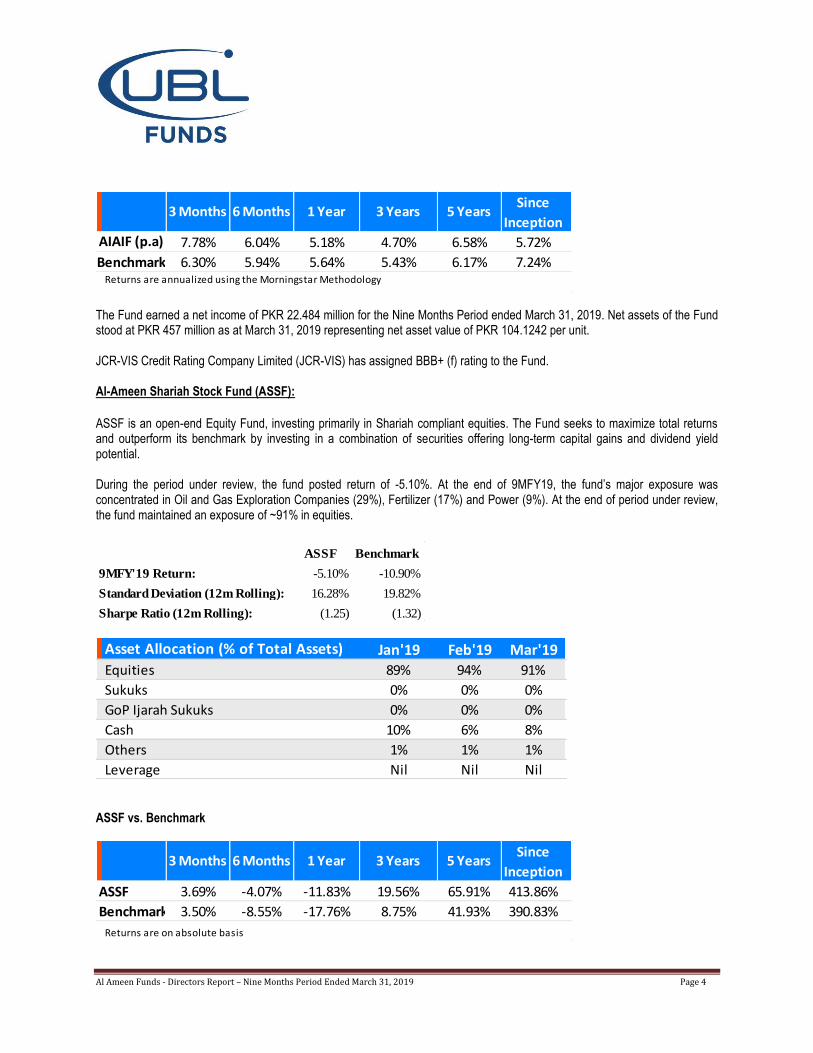
ASSF is an open-end Equity Fund, investing primarily in Shariah compliant equities. The Fund seeks to maximize total returns and outperform its benchmark by investing in a combination of securities offering long-term capital gains and dividend yield potential. During the period under review, the fund posted return of -5.10%. At the end of 9MFY19, the fund‟s major exposure was concentrated in Oil and Gas Exploration Companies (29%), Fertilizer (17%) and Power (9%). At the end of period under review, the fund maintained an exposure of ~91% in equities.
ASSF Benchmark
9MFY'19 Return: -5.10% -10.90%
Standard Deviation (12m Rolling): 16.28% 19.82%
Sharpe Ratio (12m Rolling): (1.25) (1.32)
Asset Allocation (% of Total Assets) Jan'19 Feb'19 Mar'19
Equities 89% 94% 91%
Sukuks 0% 0% 0%
GoP Ijarah Sukuks 0% 0% 0%
Cash 10% 6% 8%
Others 1% 1% 1%
Leverage Nil Nil Nil ASSF vs. Benchmark
ASSF 3.69% -4.07% -11.83% 19.56% 65.91% 413.86%
Benchmark 3.50% -8.55% -17.76% 8.75% 41.93% 390.83%
Returns are on absolute basis
Since
Inception3 Months 6 Months 1 Year 3 Years 5 Years
Al Ameen Funds - Directors Report – Nine Months Period Ended March 31, 2019 Page 5
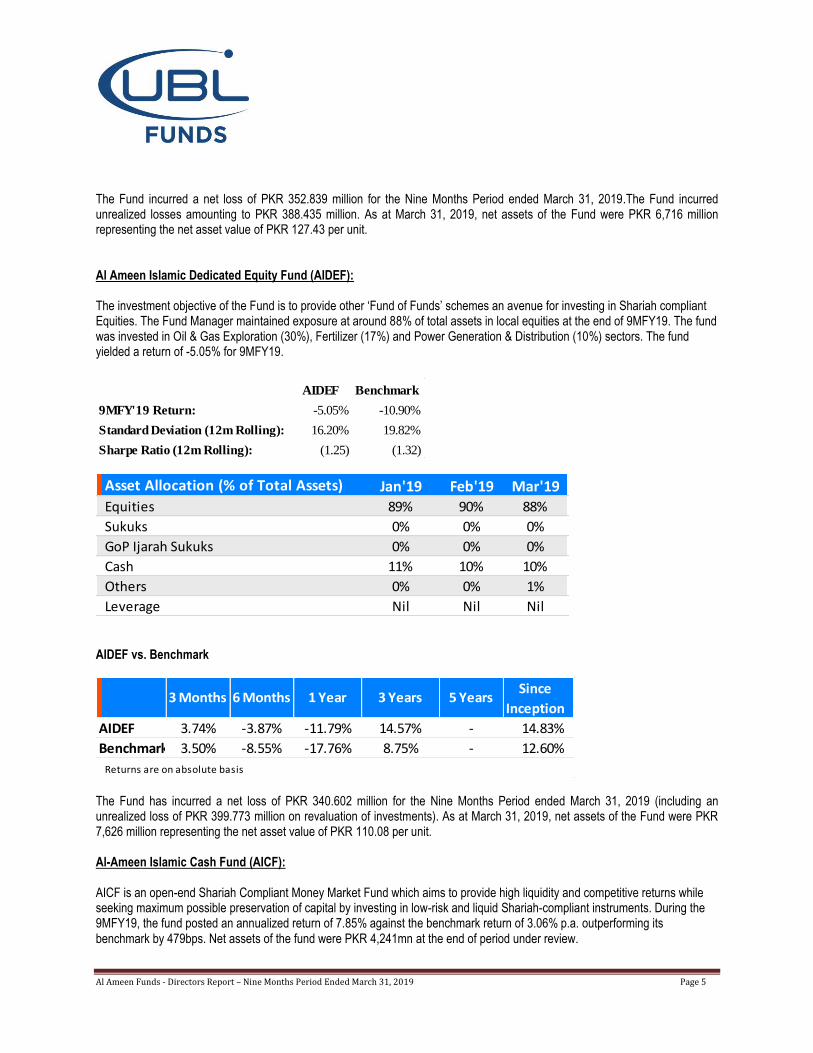
The Fund incurred a net loss of PKR 352.839 million for the Nine Months Period ended March 31, 2019.The Fund incurred unrealized losses amounting to PKR 388.435 million. As at March 31, 2019, net assets of the Fund were PKR 6,716 million representing the net asset value of PKR 127.43 per unit. Al Ameen Islamic Dedicated Equity Fund (AIDEF): The investment objective of the Fund is to provide other „Fund of Funds‟ schemes an avenue for investing in Shariah compliant Equities. The Fund Manager maintained exposure at around 88% of total assets in local equities at the end of 9MFY19. The fund was invested in Oil & Gas Exploration (30%), Fertilizer (17%) and Power Generation & Distribution (10%) sectors. The fund yielded a return of -5.05% for 9MFY19.
AIDEF Benchmark
9MFY'19 Return: -5.05% -10.90%
Standard Deviation (12m Rolling): 16.20% 19.82%
Sharpe Ratio (12m Rolling): (1.25) (1.32)
Asset Allocation (% of Total Assets) Jan'19 Feb'19 Mar'19
Equities 89% 90% 88%
Sukuks 0% 0% 0%
GoP Ijarah Sukuks 0% 0% 0%
Cash 11% 10% 10%
Others 0% 0% 1%
Leverage Nil Nil Nil AIDEF vs. Benchmark
AIDEF 3.74% -3.87% -11.79% 14.57% - 14.83%
Benchmark 3.50% -8.55% -17.76% 8.75% - 12.60%
Returns are on absolute basis
Since
Inception3 Months 6 Months 1 Year 3 Years 5 Years
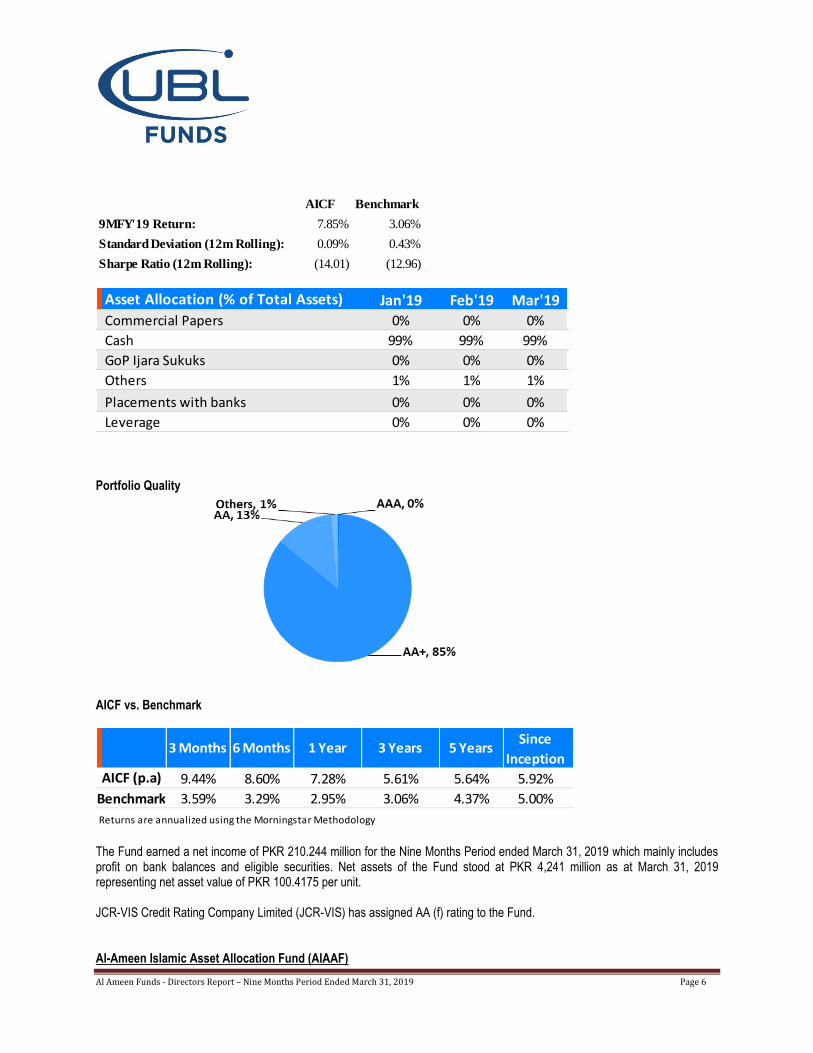
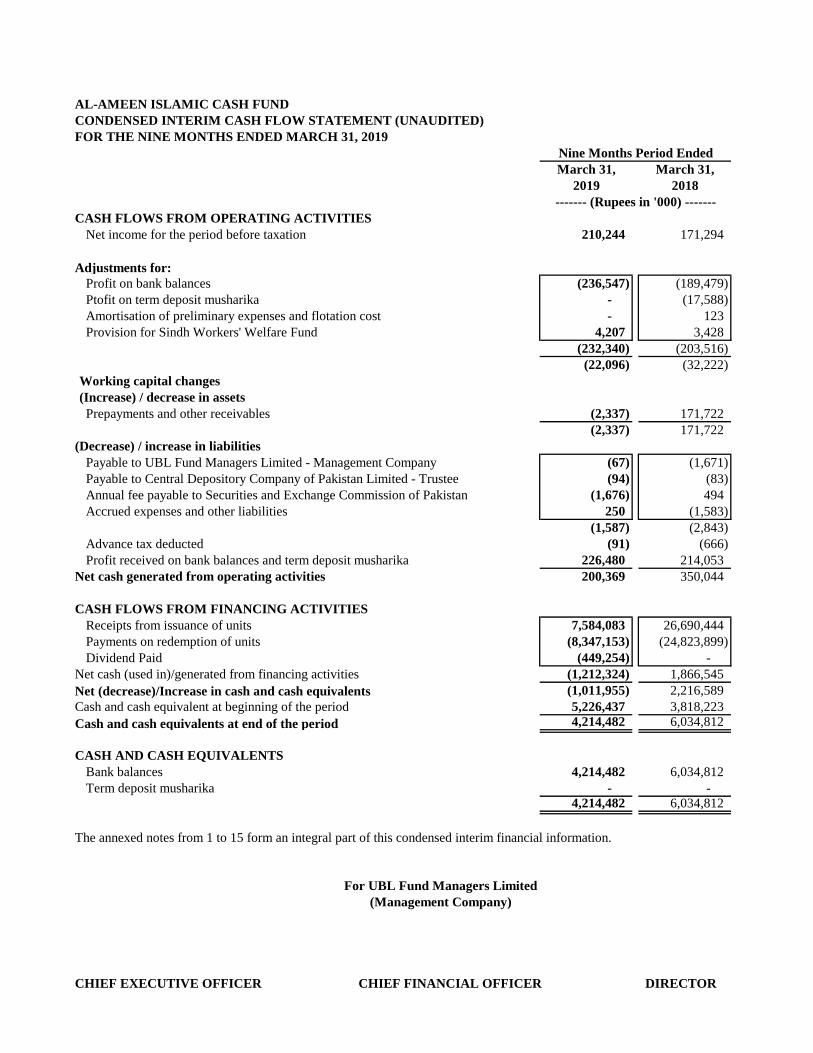
The Fund has incurred a net loss of PKR 340.602 million for the Nine Months Period ended March 31, 2019 (including an unrealized loss of PKR 399.773 million on revaluation of investments). As at March 31, 2019, net assets of the Fund were PKR 7,626 million representing the net asset value of PKR 110.08 per unit. Al-Ameen Islamic Cash Fund (AICF): AICF is an open-end Shariah Compliant Money Market Fund which aims to provide high liquidity and competitive returns while seeking maximum possible preservation of capital by investing in low-risk and liquid Shariah-compliant instruments. During the 9MFY19, the fund posted an annualized return of 7.85% against the benchmark return of 3.06% p.a. outperforming its benchmark by 479bps. Net assets of the fund were PKR 4,241mn at the end of period under review.
Al Ameen Funds - Directors Report – Nine Months Period Ended March 31, 2019 Page 6
AICF Benchmark
9MFY'19 Return: 7.85% 3.06%
Standard Deviation (12m Rolling): 0.09% 0.43%
Sharpe Ratio (12m Rolling): (14.01) (12.96)
Asset Allocation (% of Total Assets) Jan'19 Feb'19 Mar'19
Commercial Papers 0% 0% 0%
Cash 99% 99% 99%
GoP Ijara Sukuks 0% 0% 0%
Others 1% 1% 1%
Placements with banks 0% 0% 0%
Leverage 0% 0% 0% Portfolio Quality
AICF vs. Benchmark
9.44% 8.60% 7.28% 5.61% 5.64% 5.92%
3.59% 3.29% 2.95% 3.06% 4.37% 5.00%
Returns are annualized using the Morningstar Methodology
3 Months 6 Months 1 Year 3 Years 5 YearsSince
Inception
Benchmark
AICF (p.a)
The Fund earned a net income of PKR 210.244 million for the Nine Months Period ended March 31, 2019 which mainly includes profit on bank balances and eligible securities. Net assets of the Fund stood at PKR 4,241 million as at March 31, 2019 representing net asset value of PKR 100.4175 per unit. JCR-VIS Credit Rating Company Limited (JCR-VIS) has assigned AA (f) rating to the Fund. Al-Ameen Islamic Asset Allocation Fund (AIAAF)
Al Ameen Funds - Directors Report – Nine Months Period Ended March 31, 2019 Page 7
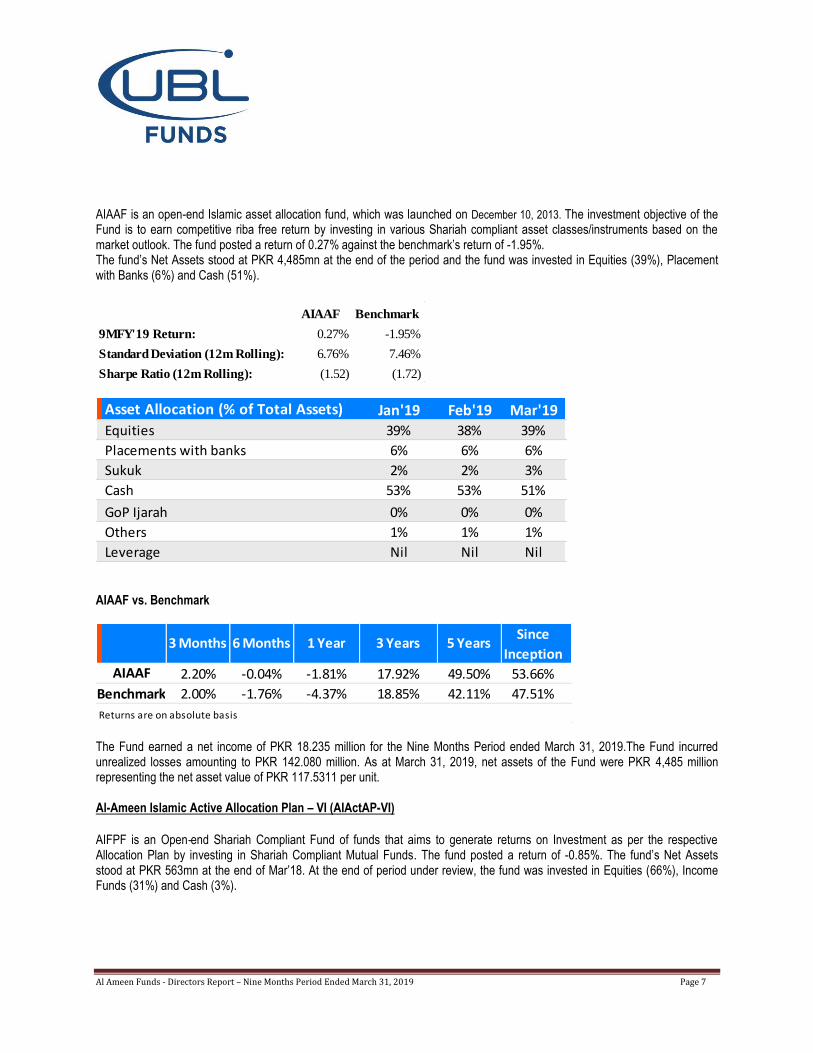
AIAAF is an open-end Islamic asset allocation fund, which was launched on December 10, 2013. The investment objective of the Fund is to earn competitive riba free return by investing in various Shariah compliant asset classes/instruments based on the market outlook. The fund posted a return of 0.27% against the benchmark‟s return of -1.95%. The fund‟s Net Assets stood at PKR 4,485mn at the end of the period and the fund was invested in Equities (39%), Placement with Banks (6%) and Cash (51%).
AIAAF Benchmark
9MFY'19 Return: 0.27% -1.95%
Standard Deviation (12m Rolling): 6.76% 7.46%
Sharpe Ratio (12m Rolling): (1.52) (1.72)
Asset Allocation (% of Total Assets) Jan'19 Feb'19 Mar'19
Equities 39% 38% 39%
Placements with banks 6% 6% 6%
Sukuk 2% 2% 3%
Cash 53% 53% 51%
GoP Ijarah 0% 0% 0%
Others 1% 1% 1%
Leverage Nil Nil Nil AIAAF vs. Benchmark
2.20% -0.04% -1.81% 17.92% 49.50% 53.66%
2.00% -1.76% -4.37% 18.85% 42.11% 47.51%
3 Months 6 Months 1 Year 3 Years 5 Years Since
Inception
Benchmark
AIAAF
Returns are on absolute basis The Fund earned a net income of PKR 18.235 million for the Nine Months Period ended March 31, 2019.The Fund incurred unrealized losses amounting to PKR 142.080 million. As at March 31, 2019, net assets of the Fund were PKR 4,485 million representing the net asset value of PKR 117.5311 per unit. Al-Ameen Islamic Active Allocation Plan – VI (AIActAP-VI)
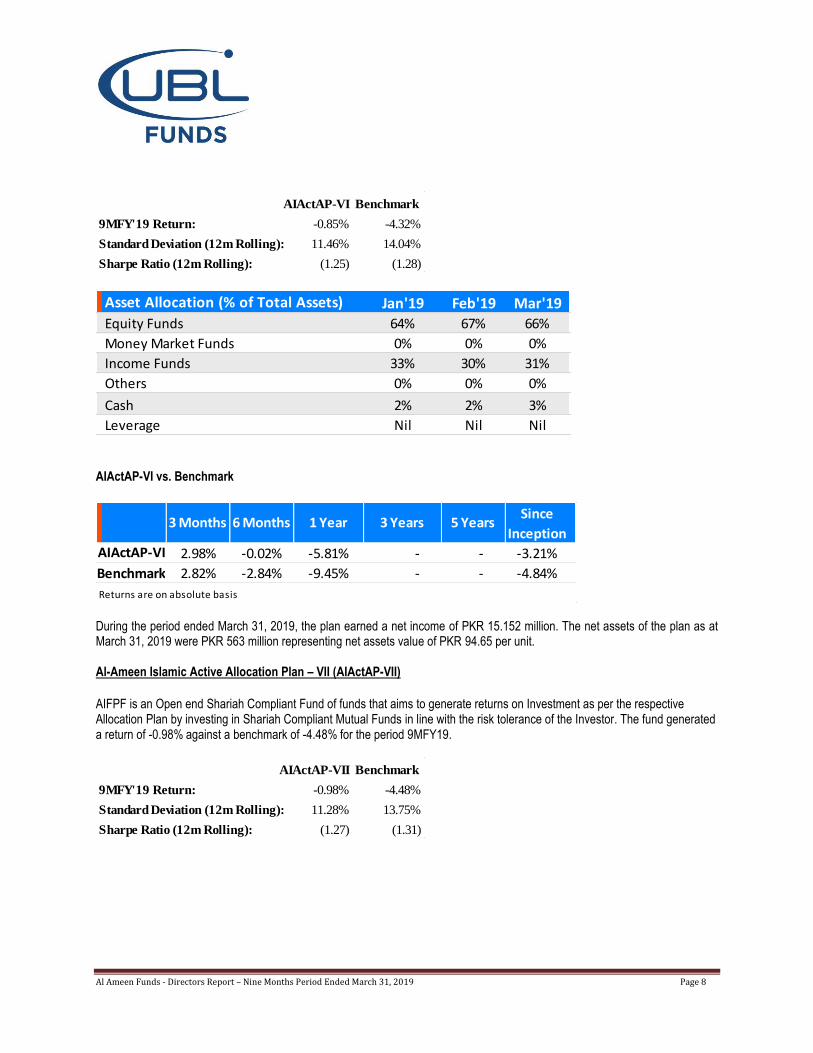
AIFPF is an Open‐end Shariah Compliant Fund of funds that aims to generate returns on Investment as per the respective Allocation Plan by investing in Shariah Compliant Mutual Funds. The fund posted a return of -0.85%. The fund‟s Net Assets stood at PKR 563mn at the end of Mar‟18. At the end of period under review, the fund was invested in Equities (66%), Income Funds (31%) and Cash (3%).
Al Ameen Funds - Directors Report – Nine Months Period Ended March 31, 2019 Page 8
Benchmark
9MFY'19 Return: -0.85% -4.32%
Standard Deviation (12m Rolling): 11.46% 14.04%
Sharpe Ratio (12m Rolling): (1.25) (1.28)
AIActAP-VI
Asset Allocation (% of Total Assets) Jan'19 Feb'19 Mar'19
Equity Funds 64% 67% 66%
Money Market Funds 0% 0% 0%
Income Funds 33% 30% 31%
Others 0% 0% 0%
Cash 2% 2% 3%
Leverage Nil Nil Nil AIActAP-VI vs. Benchmark
2.98% -0.02% -5.81% - - -3.21%
2.82% -2.84% -9.45% - - -4.84%
AIActAP-VI
3 Months 6 Months 1 Year 3 Years 5 YearsSince
Inception
Benchmark
Returns are on absolute basis During the period ended March 31, 2019, the plan earned a net income of PKR 15.152 million. The net assets of the plan as at March 31, 2019 were PKR 563 million representing net assets value of PKR 94.65 per unit. Al-Ameen Islamic Active Allocation Plan – VII (AIActAP-VII)
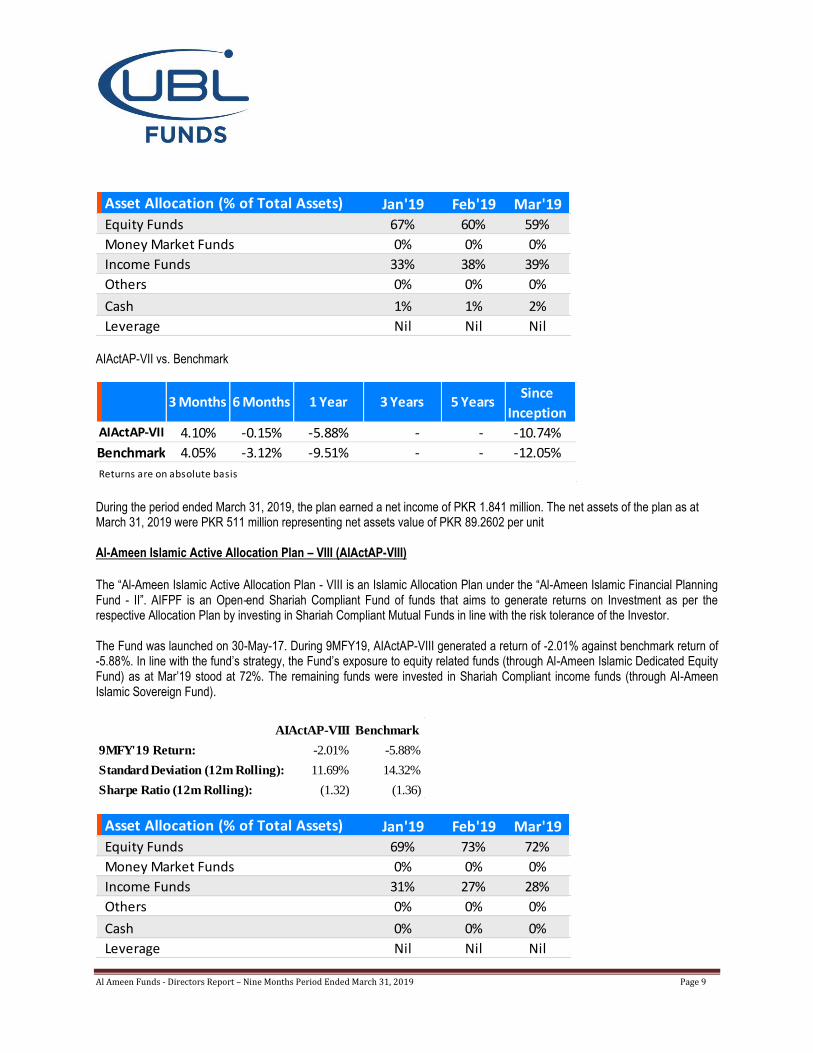
AIFPF is an Open end Shariah Compliant Fund of funds that aims to generate returns on Investment as per the respective Allocation Plan by investing in Shariah Compliant Mutual Funds in line with the risk tolerance of the Investor. The fund generated a return of -0.98% against a benchmark of -4.48% for the period 9MFY19.
Benchmark
9MFY'19 Return: -0.98% -4.48%
Standard Deviation (12m Rolling): 11.28% 13.75%
Sharpe Ratio (12m Rolling): (1.27) (1.31)
AIActAP-VII
Al Ameen Funds - Directors Report – Nine Months Period Ended March 31, 2019 Page 9
Asset Allocation (% of Total Assets) Jan'19 Feb'19 Mar'19
Equity Funds 67% 60% 59%
Money Market Funds 0% 0% 0%
Income Funds 33% 38% 39%
Others 0% 0% 0%
Cash 1% 1% 2%
Leverage Nil Nil Nil AIActAP-VII vs. Benchmark
4.10% -0.15% -5.88% - - -10.74%
4.05% -3.12% -9.51% - - -12.05%
AIActAP-VII
3 Months 6 Months 1 Year 3 Years 5 YearsSince
Inception
Benchmark
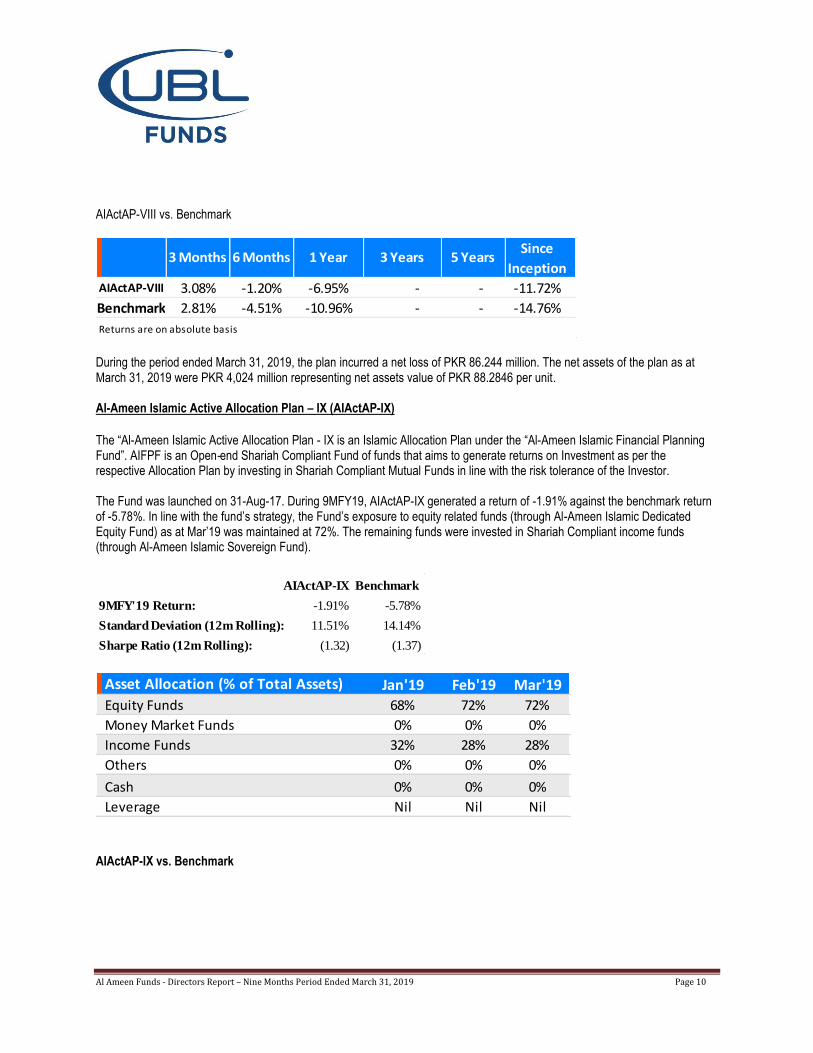
Returns are on absolute basis During the period ended March 31, 2019, the plan earned a net income of PKR 1.841 million. The net assets of the plan as at March 31, 2019 were PKR 511 million representing net assets value of PKR 89.2602 per unit Al-Ameen Islamic Active Allocation Plan – VIII (AIActAP-VIII) The “Al-Ameen Islamic Active Allocation Plan - VIII is an Islamic Allocation Plan under the “Al-Ameen Islamic Financial Planning Fund - II”. AIFPF is an Open‐end Shariah Compliant Fund of funds that aims to generate returns on Investment as per the respective Allocation Plan by investing in Shariah Compliant Mutual Funds in line with the risk tolerance of the Investor. The Fund was launched on 30-May-17. During 9MFY19, AIActAP-VIII generated a return of -2.01% against benchmark return of -5.88%. In line with the fund‟s strategy, the Fund‟s exposure to equity related funds (through Al-Ameen Islamic Dedicated Equity Fund) as at Mar‟19 stood at 72%. The remaining funds were invested in Shariah Compliant income funds (through Al-Ameen Islamic Sovereign Fund).
Benchmark
9MFY'19 Return: -2.01% -5.88%
Standard Deviation (12m Rolling): 11.69% 14.32%
Sharpe Ratio (12m Rolling): (1.32) (1.36)
AIActAP-VIII
Asset Allocation (% of Total Assets) Jan'19 Feb'19 Mar'19
Equity Funds 69% 73% 72%
Money Market Funds 0% 0% 0%
Income Funds 31% 27% 28%
Others 0% 0% 0%
Cash 0% 0% 0%
Leverage Nil Nil Nil
Al Ameen Funds - Directors Report – Nine Months Period Ended March 31, 2019 Page 10
AIActAP-VIII vs. Benchmark
3.08% -1.20% -6.95% - - -11.72%
2.81% -4.51% -10.96% - - -14.76%
3 Months 6 Months 1 Year 3 Years 5 YearsSince
Inception
Benchmark
Returns are on absolute basis
AIActAP-VIII
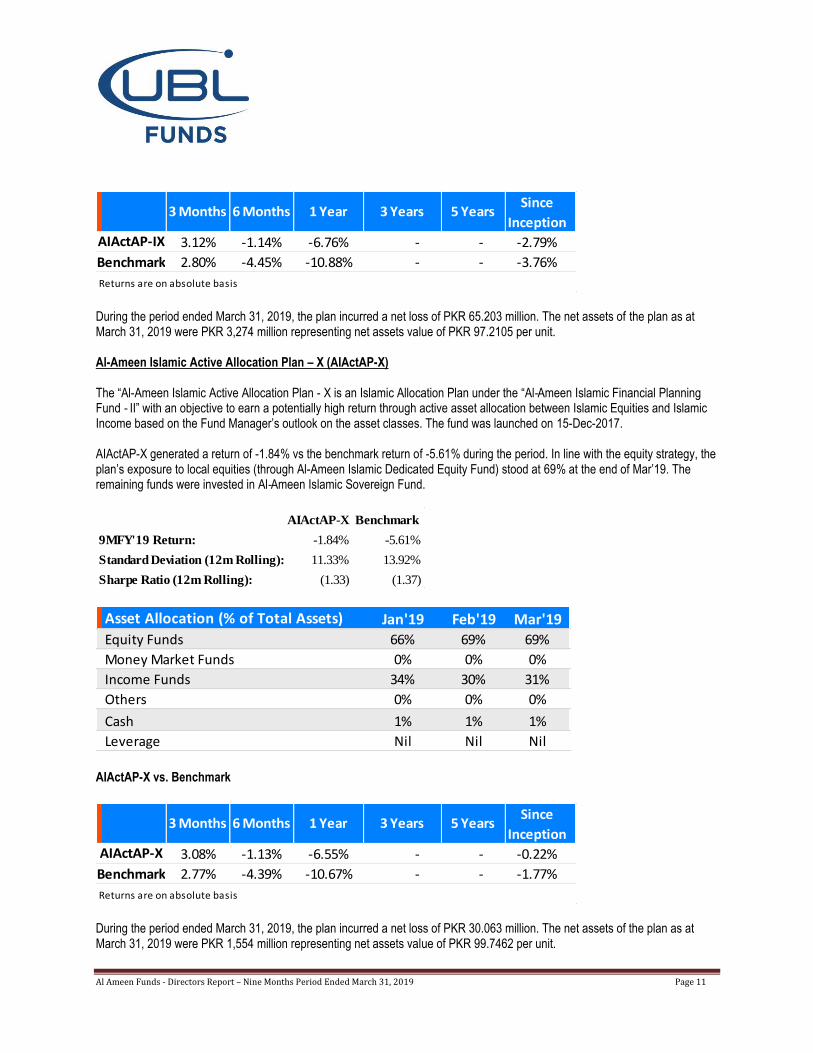
During the period ended March 31, 2019, the plan incurred a net loss of PKR 86.244 million. The net assets of the plan as at March 31, 2019 were PKR 4,024 million representing net assets value of PKR 88.2846 per unit. Al-Ameen Islamic Active Allocation Plan – IX (AIActAP-IX) The “Al-Ameen Islamic Active Allocation Plan - IX is an Islamic Allocation Plan under the “Al-Ameen Islamic Financial Planning Fund”. AIFPF is an Open‐end Shariah Compliant Fund of funds that aims to generate returns on Investment as per the respective Allocation Plan by investing in Shariah Compliant Mutual Funds in line with the risk tolerance of the Investor. The Fund was launched on 31-Aug-17. During 9MFY19, AIActAP-IX generated a return of -1.91% against the benchmark return of -5.78%. In line with the fund‟s strategy, the Fund‟s exposure to equity related funds (through Al-Ameen Islamic Dedicated Equity Fund) as at Mar‟19 was maintained at 72%. The remaining funds were invested in Shariah Compliant income funds (through Al-Ameen Islamic Sovereign Fund).
Benchmark
9MFY'19 Return: -1.91% -5.78%
Standard Deviation (12m Rolling): 11.51% 14.14%
Sharpe Ratio (12m Rolling): (1.32) (1.37)
AIActAP-IX
Asset Allocation (% of Total Assets) Jan'19 Feb'19 Mar'19
Equity Funds 68% 72% 72%
Money Market Funds 0% 0% 0%
Income Funds 32% 28% 28%
Others 0% 0% 0%
Cash 0% 0% 0%
Leverage Nil Nil Nil
AIActAP-IX vs. Benchmark
Al Ameen Funds - Directors Report – Nine Months Period Ended March 31, 2019 Page 11
3.12% -1.14% -6.76% - - -2.79%
2.80% -4.45% -10.88% - - -3.76%
AIActAP-IX
3 Months 6 Months 1 Year 3 Years 5 YearsSince
Inception
Benchmark
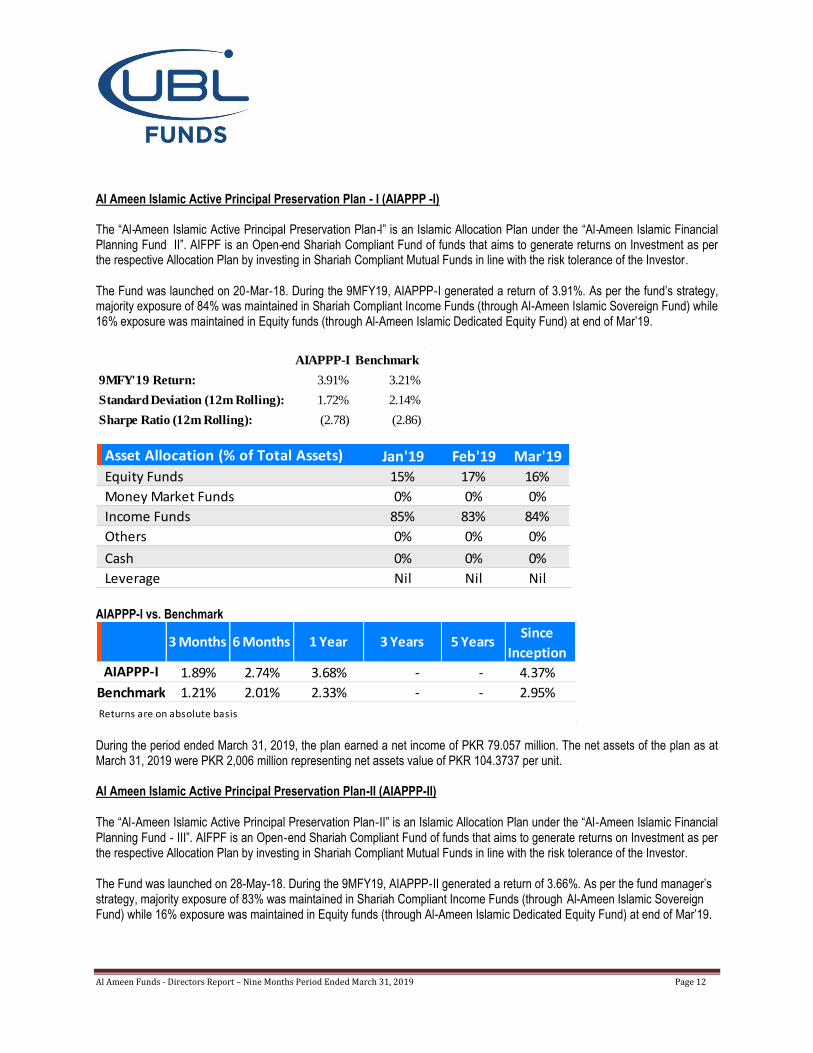
Returns are on absolute basis During the period ended March 31, 2019, the plan incurred a net loss of PKR 65.203 million. The net assets of the plan as at March 31, 2019 were PKR 3,274 million representing net assets value of PKR 97.2105 per unit. Al-Ameen Islamic Active Allocation Plan – X (AIActAP-X) The “Al-Ameen Islamic Active Allocation Plan - X is an Islamic Allocation Plan under the “Al‐Ameen Islamic Financial Planning Fund ‐ II” with an objective to earn a potentially high return through active asset allocation between Islamic Equities and Islamic Income based on the Fund Manager‟s outlook on the asset classes. The fund was launched on 15-Dec-2017. AIActAP-X generated a return of -1.84% vs the benchmark return of -5.61% during the period. In line with the equity strategy, the plan‟s exposure to local equities (through Al-Ameen Islamic Dedicated Equity Fund) stood at 69% at the end of Mar‟19. The remaining funds were invested in Al‐Ameen Islamic Sovereign Fund.
Benchmark
9MFY'19 Return: -1.84% -5.61%
Standard Deviation (12m Rolling): 11.33% 13.92%
Sharpe Ratio (12m Rolling): (1.33) (1.37)
AIActAP-X
Asset Allocation (% of Total Assets) Jan'19 Feb'19 Mar'19
Equity Funds 66% 69% 69%
Money Market Funds 0% 0% 0%
Income Funds 34% 30% 31%
Others 0% 0% 0%
Cash 1% 1% 1%
Leverage Nil Nil Nil AIActAP-X vs. Benchmark
3.08% -1.13% -6.55% - - -0.22%
2.77% -4.39% -10.67% - - -1.77%
AIActAP-X
3 Months 6 Months 1 Year 3 Years 5 YearsSince
Inception
Benchmark
Returns are on absolute basis During the period ended March 31, 2019, the plan incurred a net loss of PKR 30.063 million. The net assets of the plan as at March 31, 2019 were PKR 1,554 million representing net assets value of PKR 99.7462 per unit.
Al Ameen Funds - Directors Report – Nine Months Period Ended March 31, 2019 Page 12
Al Ameen Islamic Active Principal Preservation Plan - I (AIAPPP -I) The “Al‐Ameen Islamic Active Principal Preservation Plan‐I” is an Islamic Allocation Plan under the “Al‐Ameen Islamic Financial Planning Fund II”. AIFPF is an Open‐end Shariah Compliant Fund of funds that aims to generate returns on Investment as per the respective Allocation Plan by investing in Shariah Compliant Mutual Funds in line with the risk tolerance of the Investor.
The Fund was launched on 20‐Mar‐18. During the 9MFY19, AIAPPP‐I generated a return of 3.91%. As per the fund‟s strategy, majority exposure of 84% was maintained in Shariah Compliant Income Funds (through Al-Ameen Islamic Sovereign Fund) while 16% exposure was maintained in Equity funds (through Al-Ameen Islamic Dedicated Equity Fund) at end of Mar‟19.
Benchmark
9MFY'19 Return: 3.91% 3.21%
Standard Deviation (12m Rolling): 1.72% 2.14%
Sharpe Ratio (12m Rolling): (2.78) (2.86)
AIAPPP-I
Asset Allocation (% of Total Assets) Jan'19 Feb'19 Mar'19
Equity Funds 15% 17% 16%
Money Market Funds 0% 0% 0%
Income Funds 85% 83% 84%
Others 0% 0% 0%
Cash 0% 0% 0%
Leverage Nil Nil Nil AIAPPP-I vs. Benchmark
1.89% 2.74% 3.68% - - 4.37%
1.21% 2.01% 2.33% - - 2.95%
3 Months 6 Months 1 Year 3 Years 5 YearsSince
Inception
Benchmark
Returns are on absolute basis
AIAPPP-I
During the period ended March 31, 2019, the plan earned a net income of PKR 79.057 million. The net assets of the plan as at March 31, 2019 were PKR 2,006 million representing net assets value of PKR 104.3737 per unit. Al Ameen Islamic Active Principal Preservation Plan-II (AIAPPP-II)
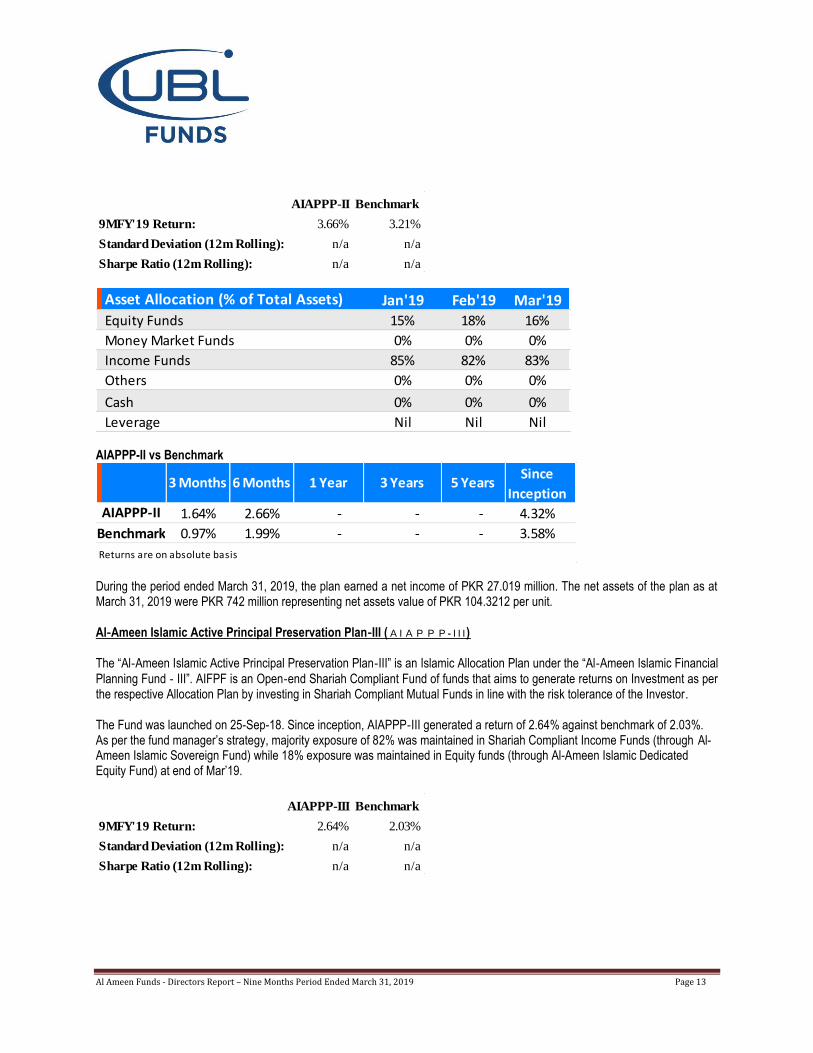
The “Al‐Ameen Islamic Active Principal Preservation Plan‐II” is an Islamic Allocation Plan under the “Al‐Ameen Islamic Financial Planning Fund ‐ III”. AIFPF is an Open‐end Shariah Compliant Fund of funds that aims to generate returns on Investment as per the respective Allocation Plan by investing in Shariah Compliant Mutual Funds in line with the risk tolerance of the Investor. The Fund was launched on 28-May-18. During the 9MFY19, AIAPPP‐II generated a return of 3.66%. As per the fund manager‟s strategy, majority exposure of 83% was maintained in Shariah Compliant Income Funds (through Al-Ameen Islamic Sovereign Fund) while 16% exposure was maintained in Equity funds (through Al-Ameen Islamic Dedicated Equity Fund) at end of Mar‟19.
Al Ameen Funds - Directors Report – Nine Months Period Ended March 31, 2019 Page 13
Benchmark
9MFY'19 Return: 3.66% 3.21%
Standard Deviation (12m Rolling): n/a n/a
Sharpe Ratio (12m Rolling): n/a n/a
AIAPPP-II
Asset Allocation (% of Total Assets) Jan'19 Feb'19 Mar'19
Equity Funds 15% 18% 16%
Money Market Funds 0% 0% 0%
Income Funds 85% 82% 83%
Others 0% 0% 0%
Cash 0% 0% 0%
Leverage Nil Nil Nil AIAPPP-II vs Benchmark
1.64% 2.66% - - - 4.32%
0.97% 1.99% - - - 3.58%
3 Months 6 Months 1 Year 3 Years 5 YearsSince
Inception
Benchmark
Returns are on absolute basis
AIAPPP-II
During the period ended March 31, 2019, the plan earned a net income of PKR 27.019 million. The net assets of the plan as at March 31, 2019 were PKR 742 million representing net assets value of PKR 104.3212 per unit.
Al‐Ameen Islamic Active Principal Preservation Plan‐III ( A I A P P P ‐ I I I) The “Al‐Ameen Islamic Active Principal Preservation Plan‐III” is an Islamic Allocation Plan under the “Al‐Ameen Islamic Financial
Planning Fund ‐ III”. AIFPF is an Open‐end Shariah Compliant Fund of funds that aims to generate returns on Investment as per the respective Allocation Plan by investing in Shariah Compliant Mutual Funds in line with the risk tolerance of the Investor.
The Fund was launched on 25-Sep-18. Since inception, AIAPPP‐III generated a return of 2.64% against benchmark of 2.03%. As per the fund manager‟s strategy, majority exposure of 82% was maintained in Shariah Compliant Income Funds (through Al-Ameen Islamic Sovereign Fund) while 18% exposure was maintained in Equity funds (through Al-Ameen Islamic Dedicated Equity Fund) at end of Mar‟19.
Benchmark
9MFY'19 Return: 2.64% 2.03%
Standard Deviation (12m Rolling): n/a n/a
Sharpe Ratio (12m Rolling): n/a n/a
AIAPPP-III
Al Ameen Funds - Directors Report – Nine Months Period Ended March 31, 2019 Page 14
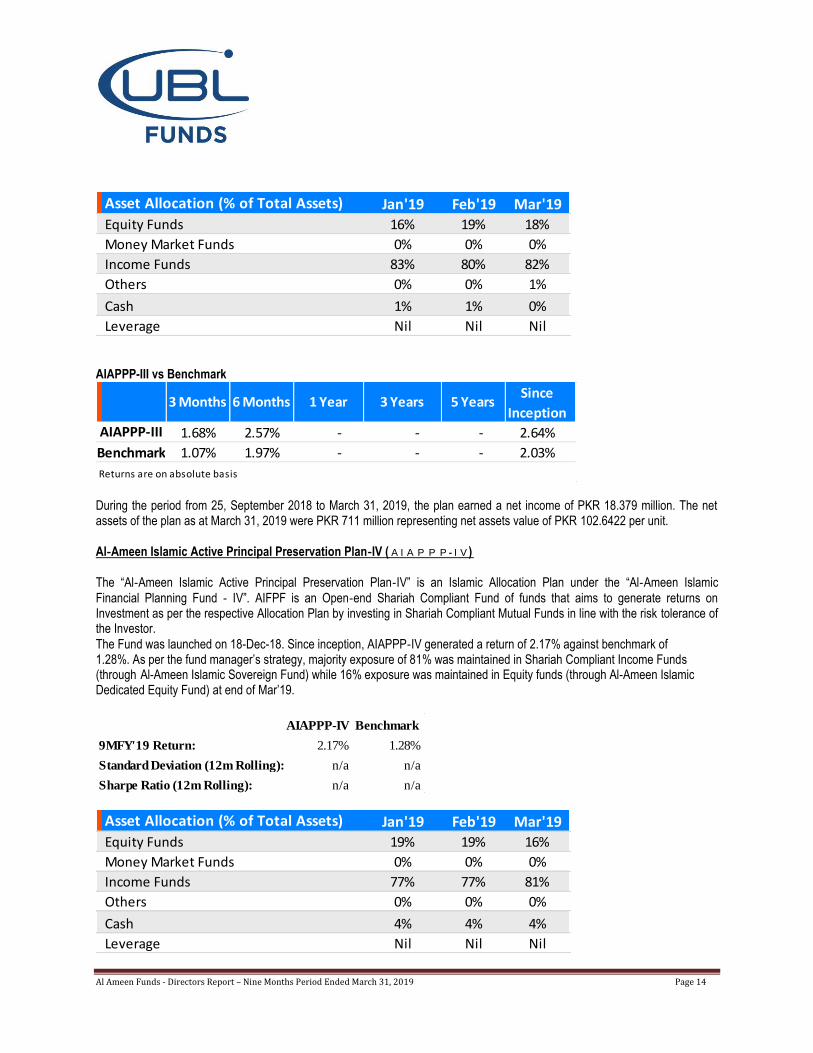
Asset Allocation (% of Total Assets) Jan'19 Feb'19 Mar'19
Equity Funds 16% 19% 18%
Money Market Funds 0% 0% 0%
Income Funds 83% 80% 82%
Others 0% 0% 1%
Cash 1% 1% 0%
Leverage Nil Nil Nil AIAPPP-III vs Benchmark
1.68% 2.57% - - - 2.64%
1.07% 1.97% - - - 2.03%
AIAPPP-III
3 Months 6 Months 1 Year 3 Years 5 YearsSince
Inception
Benchmark
Returns are on absolute basis During the period from 25, September 2018 to March 31, 2019, the plan earned a net income of PKR 18.379 million. The net assets of the plan as at March 31, 2019 were PKR 711 million representing net assets value of PKR 102.6422 per unit.
Al‐Ameen Islamic Active Principal Preservation Plan‐IV ( A I A P P P ‐ I V ) The “Al‐Ameen Islamic Active Principal Preservation Plan‐IV” is an Islamic Allocation Plan under the “Al‐Ameen Islamic
Financial Planning Fund ‐ IV”. AIFPF is an Open‐end Shariah Compliant Fund of funds that aims to generate returns on Investment as per the respective Allocation Plan by investing in Shariah Compliant Mutual Funds in line with the risk tolerance of the Investor.
The Fund was launched on 18-Dec-18. Since inception, AIAPPP‐IV generated a return of 2.17% against benchmark of 1.28%. As per the fund manager‟s strategy, majority exposure of 81% was maintained in Shariah Compliant Income Funds (through Al-Ameen Islamic Sovereign Fund) while 16% exposure was maintained in Equity funds (through Al-Ameen Islamic Dedicated Equity Fund) at end of Mar‟19.
Benchmark
9MFY'19 Return: 2.17% 1.28%
Standard Deviation (12m Rolling): n/a n/a
Sharpe Ratio (12m Rolling): n/a n/a
AIAPPP-IV
Asset Allocation (% of Total Assets) Jan'19 Feb'19 Mar'19
Equity Funds 19% 19% 16%
Money Market Funds 0% 0% 0%
Income Funds 77% 77% 81%
Others 0% 0% 0%
Cash 4% 4% 4%
Leverage Nil Nil Nil
Al Ameen Funds - Directors Report – Nine Months Period Ended March 31, 2019 Page 15
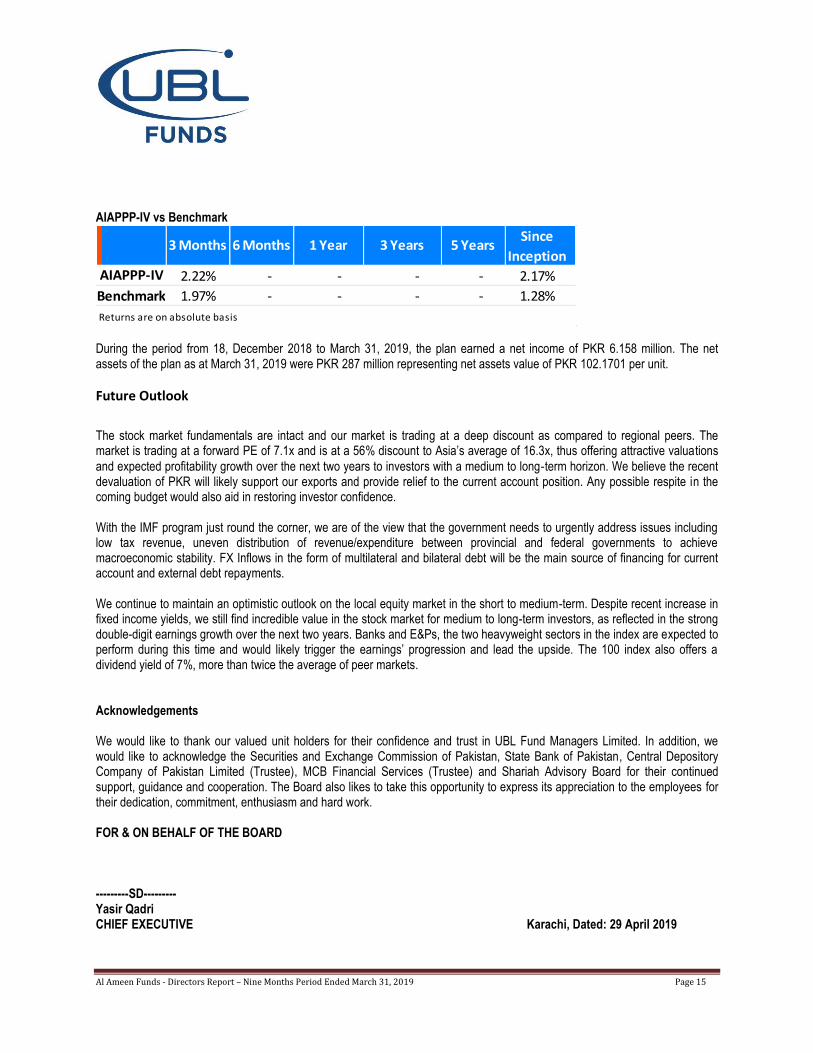
AIAPPP-IV vs Benchmark
2.22% - - - - 2.17%
1.97% - - - - 1.28%
AIAPPP-IV
3 Months 6 Months 1 Year 3 Years 5 YearsSince
Inception
Benchmark
Returns are on absolute basis During the period from 18, December 2018 to March 31, 2019, the plan earned a net income of PKR 6.158 million. The net assets of the plan as at March 31, 2019 were PKR 287 million representing net assets value of PKR 102.1701 per unit.
Future Outlook
The stock market fundamentals are intact and our market is trading at a deep discount as compared to regional peers. The market is trading at a forward PE of 7.1x and is at a 56% discount to Asia‟s average of 16.3x, thus offering attractive valuations
and expected profitability growth over the next two years to investors with a medium to long‐term horizon. We believe the recent devaluation of PKR will likely support our exports and provide relief to the current account position. Any possible respite in the coming budget would also aid in restoring investor confidence. With the IMF program just round the corner, we are of the view that the government needs to urgently address issues including low tax revenue, uneven distribution of revenue/expenditure between provincial and federal governments to achieve macroeconomic stability. FX Inflows in the form of multilateral and bilateral debt will be the main source of financing for current account and external debt repayments. We continue to maintain an optimistic outlook on the local equity market in the short to medium-term. Despite recent increase in fixed income yields, we still find incredible value in the stock market for medium to long-term investors, as reflected in the strong double-digit earnings growth over the next two years. Banks and E&Ps, the two heavyweight sectors in the index are expected to perform during this time and would likely trigger the earnings‟ progression and lead the upside. The 100 index also offers a dividend yield of 7%, more than twice the average of peer markets. Acknowledgements We would like to thank our valued unit holders for their confidence and trust in UBL Fund Managers Limited. In addition, we would like to acknowledge the Securities and Exchange Commission of Pakistan, State Bank of Pakistan, Central Depository Company of Pakistan Limited (Trustee), MCB Financial Services (Trustee) and Shariah Advisory Board for their continued support, guidance and cooperation. The Board also likes to take this opportunity to express its appreciation to the employees for their dedication, commitment, enthusiasm and hard work. FOR & ON BEHALF OF THE BOARD ---------SD--------- Yasir Qadri CHIEF EXECUTIVE Karachi, Dated: 29 April 2019
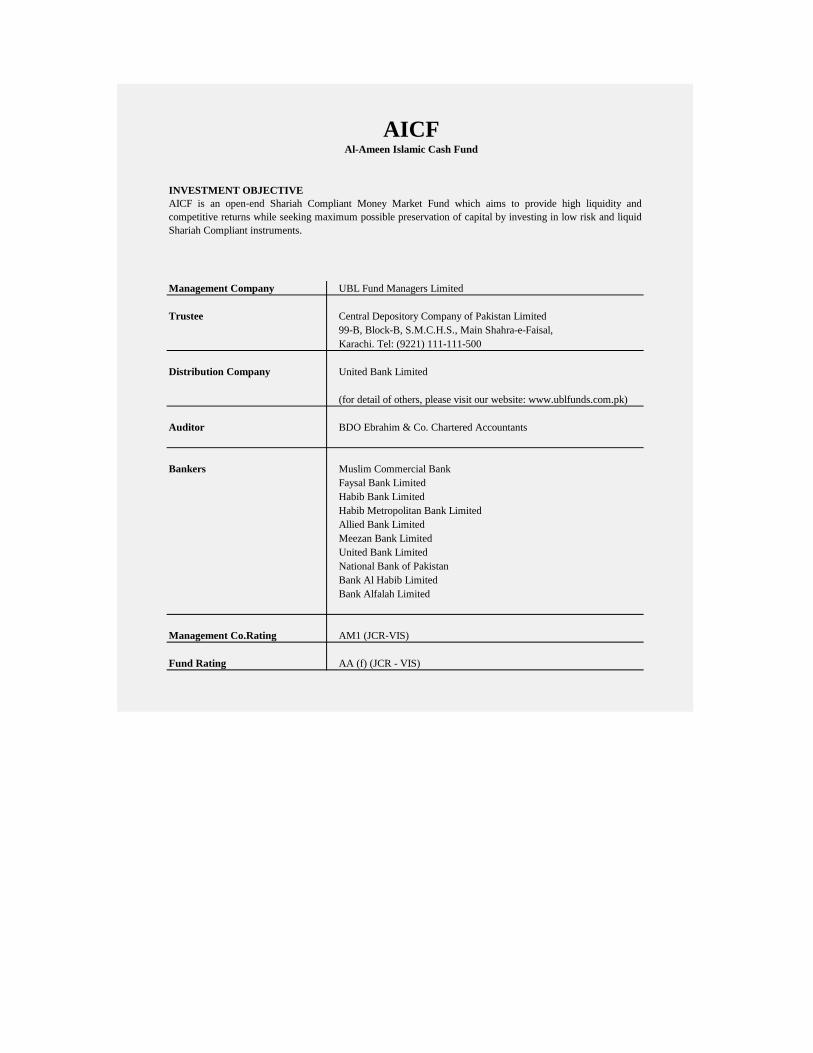
INVESTMENT OBJECTIVE
Management Company UBL Fund Managers Limited
Trustee Central Depository Company of Pakistan Limited
99-B, Block-B, S.M.C.H.S., Main Shahra-e-Faisal,
Karachi. Tel: (9221) 111-111-500
Distribution Company United Bank Limited
Auditor BDO Ebrahim & Co. Chartered Accountants
Bankers Muslim Commercial Bank
Faysal Bank Limited
Habib Bank Limited
Habib Metropolitan Bank Limited
Allied Bank Limited
Meezan Bank Limited
United Bank Limited
National Bank of Pakistan
Bank Al Habib Limited
Bank Alfalah Limited
Management Co.Rating AM1 (JCR‐VIS)
Fund Rating AA (f) (JCR - VIS)
AICFAl-Ameen Islamic Cash Fund
AICF is an open‐end Shariah Compliant Money Market Fund which aims to provide high liquidity and
competitive returns while seeking maximum possible preservation of capital by investing in low risk and liquid
Shariah Compliant instruments.
(for detail of others, please visit our website: www.ublfunds.com.pk)
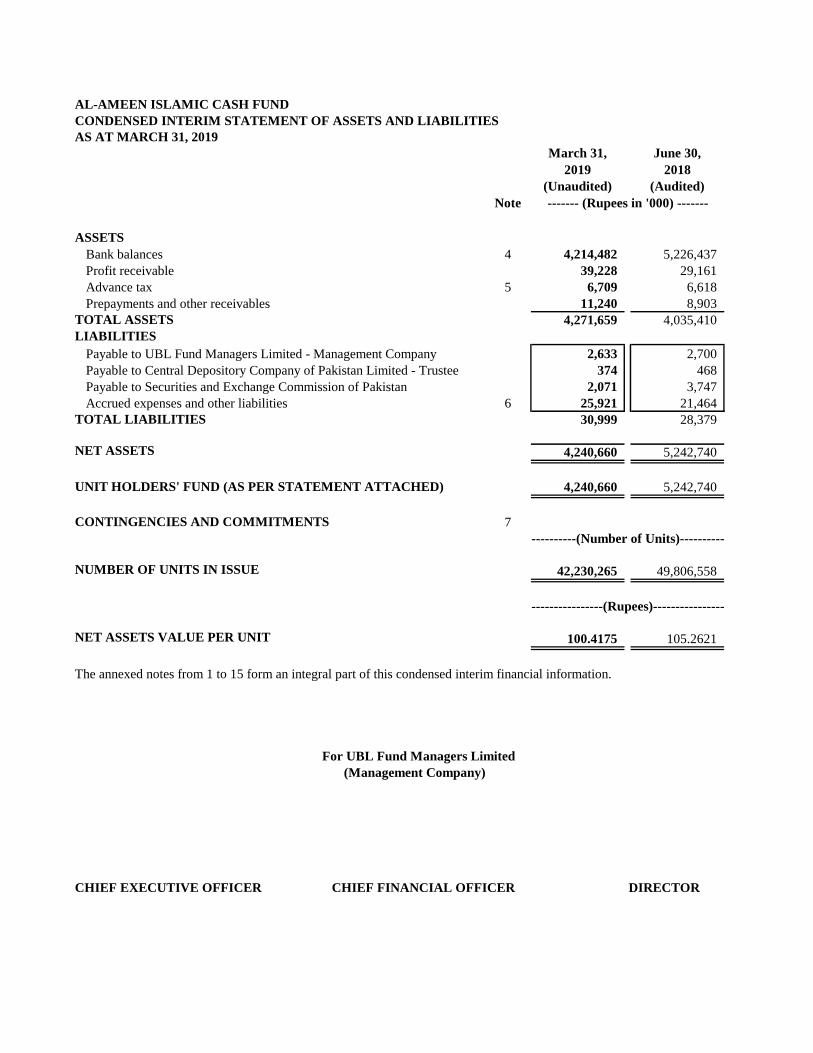
AL-AMEEN ISLAMIC CASH FUND
CONDENSED INTERIM STATEMENT OF ASSETS AND LIABILITIES
AS AT MARCH 31, 2019
March 31,
2019
June 30,
2018
(Unaudited) (Audited)
Note
ASSETS
Bank balances 4 4,214,482 5,226,437
Profit receivable 39,228 29,161
Advance tax 5 6,709 6,618
Prepayments and other receivables 11,240 8,903
TOTAL ASSETS 4,271,659 4,035,410
LIABILITIES
Payable to UBL Fund Managers Limited - Management Company 2,633 2,700
374 468
Payable to Securities and Exchange Commission of Pakistan 2,071 3,747
Accrued expenses and other liabilities 6 25,921 21,464
TOTAL LIABILITIES 30,999 28,379
NET ASSETS 4,240,660 5,242,740
4,240,660 5,242,740
CONTINGENCIES AND COMMITMENTS 7
NUMBER OF UNITS IN ISSUE 42,230,265 49,806,558
NET ASSETS VALUE PER UNIT 100.4175 105.2621
The annexed notes from 1 to 15 form an integral part of this condensed interim financial information.
For UBL Fund Managers Limited
(Management Company)
CHIEF EXECUTIVE OFFICER CHIEF FINANCIAL OFFICER DIRECTOR
------- (Rupees in '000) -------
Payable to Central Depository Company of Pakistan Limited - Trustee
UNIT HOLDERS' FUND (AS PER STATEMENT ATTACHED)
--------------(Number of Units)--------------
--------------------(Rupees)--------------------
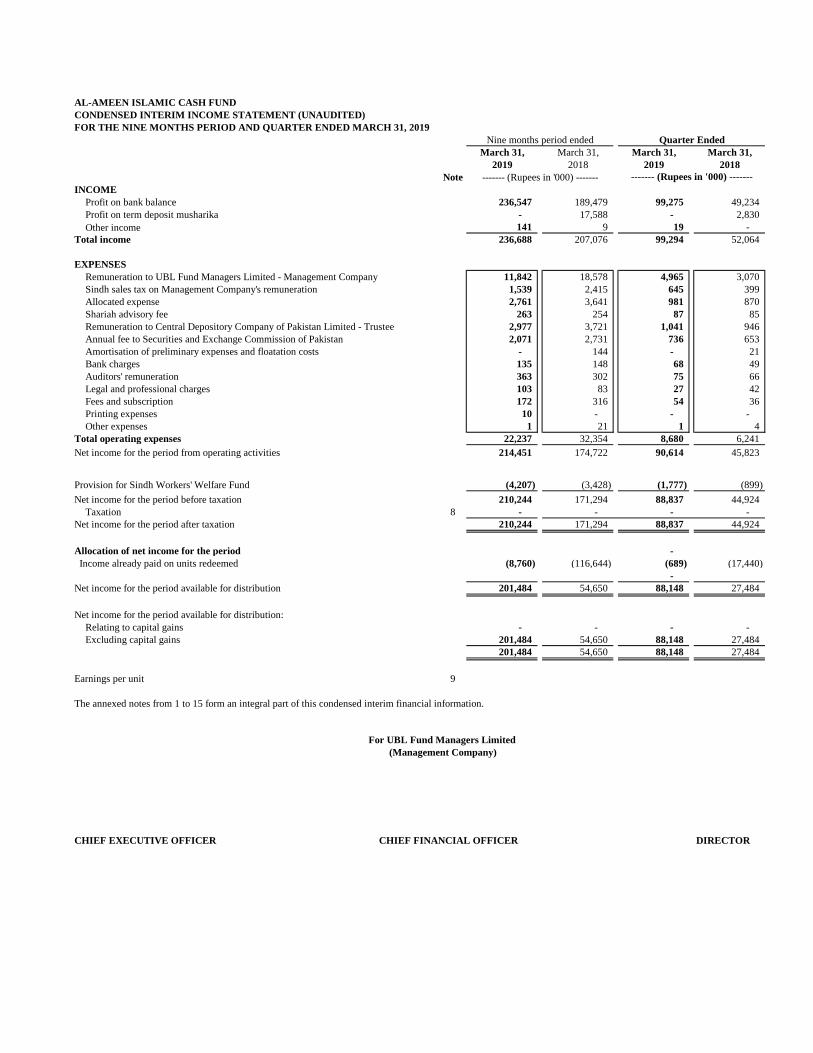
AL-AMEEN ISLAMIC CASH FUND
CONDENSED INTERIM INCOME STATEMENT (UNAUDITED)
FOR THE NINE MONTHS PERIOD AND QUARTER ENDED MARCH 31, 2019
March 31, March 31, March 31, March 31,
2019 2018 2019 2018
Note
INCOME
Profit on bank balance 236,547 189,479 99,275 49,234
Profit on term deposit musharika - 17,588 - 2,830
141 9 19 -
Total income 236,688 207,076 99,294 52,064
EXPENSES
Remuneration to UBL Fund Managers Limited - Management Company 11,842 18,578 4,965 3,070
Sindh sales tax on Management Company's remuneration 1,539 2,415 645 399
Allocated expense 2,761 3,641 981 870
Shariah advisory fee 263 254 87 85
Remuneration to Central Depository Company of Pakistan Limited - Trustee 2,977 3,721 1,041 946
Annual fee to Securities and Exchange Commission of Pakistan 2,071 2,731 736 653
Amortisation of preliminary expenses and floatation costs - 144 - 21
Bank charges 135 148 68 49
Auditors' remuneration 363 302 75 66
Legal and professional charges 103 83 27 42
Fees and subscription 172 316 54 36
Printing expenses 10 - - -
Other expenses 1 21 1 4
Total operating expenses 22,237 32,354 8,680 6,241
Net income for the period from operating activities 214,451 174,722 90,614 45,823
Provision for Sindh Workers' Welfare Fund (4,207) (3,428) (1,777) (899)
Net income for the period before taxation 210,244 171,294 88,837 44,924
Taxation 8 - - - -
Net income for the period after taxation 210,244 171,294 88,837 44,924
Allocation of net income for the period -
Income already paid on units redeemed (8,760) (116,644) (689) (17,440)
-
Net income for the period available for distribution 201,484 54,650 88,148 27,484
Net income for the period available for distribution:
Relating to capital gains - - - -
Excluding capital gains 201,484 54,650 88,148 27,484
201,484 54,650 88,148 27,484
Earnings per unit 9
The annexed notes from 1 to 15 form an integral part of this condensed interim financial information.
CHIEF EXECUTIVE OFFICER CHIEF FINANCIAL OFFICER DIRECTOR
(Management Company)
Nine months period ended Quarter Ended
------- (Rupees in '000) ------- ------- (Rupees in '000) -------
Other income
For UBL Fund Managers Limited
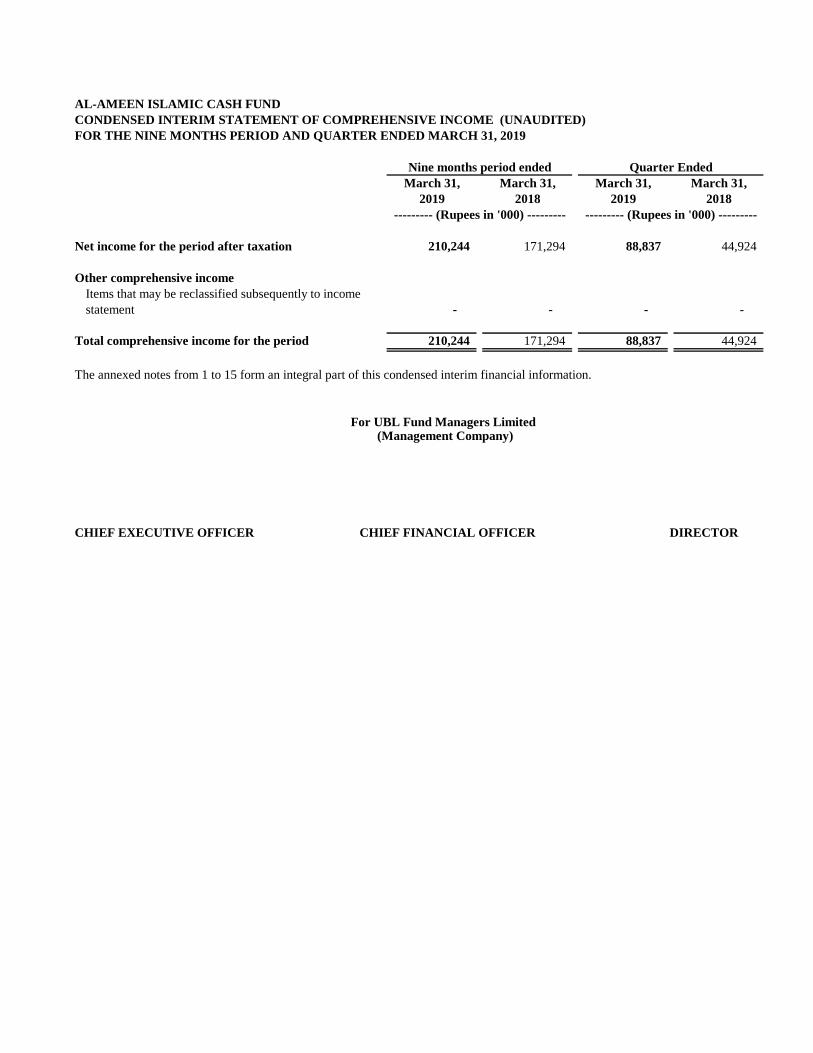
AL-AMEEN ISLAMIC CASH FUND
CONDENSED INTERIM STATEMENT OF COMPREHENSIVE INCOME (UNAUDITED)
FOR THE NINE MONTHS PERIOD AND QUARTER ENDED MARCH 31, 2019
March 31, March 31, March 31, March 31,
2019 2018 2019 2018
Net income for the period after taxation 210,244 171,294 88,837 44,924
Other comprehensive income
Items that may be reclassified subsequently to income
statement - - - -
Total comprehensive income for the period 210,244 171,294 88,837 44,924
The annexed notes from 1 to 15 form an integral part of this condensed interim financial information.
CHIEF EXECUTIVE OFFICER CHIEF FINANCIAL OFFICER DIRECTOR
(Management Company)
Nine months period ended Quarter Ended
--------- (Rupees in '000) --------- --------- (Rupees in '000) ---------
For UBL Fund Managers Limited
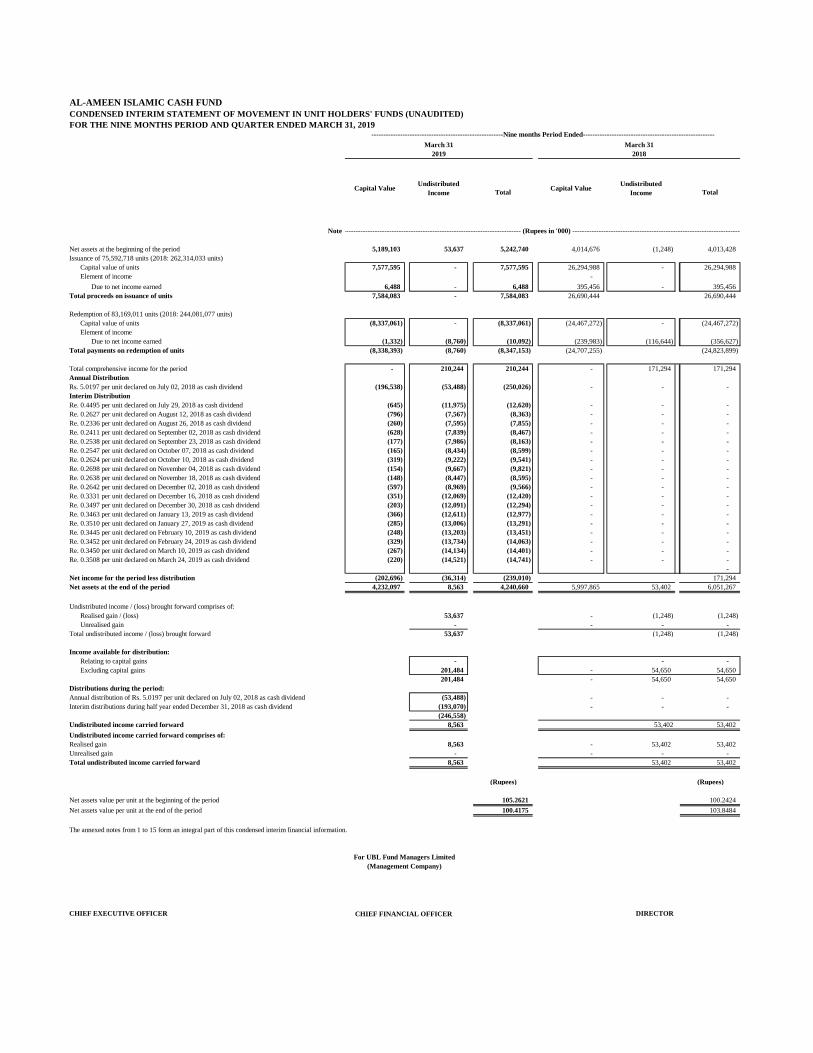
AL-AMEEN ISLAMIC CASH FUND
CONDENSED INTERIM STATEMENT OF MOVEMENT IN UNIT HOLDERS' FUNDS (UNAUDITED)
FOR THE NINE MONTHS PERIOD AND QUARTER ENDED MARCH 31, 2019
Capital ValueUndistributed
IncomeCapital Value
Undistributed
Income
Note
Net assets at the beginning of the period 5,189,103 53,637 5,242,740 4,014,676 (1,248) 4,013,428
Issuance of 75,592,718 units (2018: 262,314,033 units)
Capital value of units 7,577,595 - 7,577,595 26,294,988 - 26,294,988
Element of income -
Due to net income earned 6,488 - 6,488 395,456 - 395,456
Total proceeds on issuance of units 7,584,083 - 7,584,083 26,690,444 26,690,444
Redemption of 83,169,011 units (2018: 244,081,077 units)
Capital value of units (8,337,061) - (8,337,061) (24,467,272) - (24,467,272)
Element of income
Due to net income earned (1,332) (8,760) (10,092) (239,983) (116,644) (356,627)
Total payments on redemption of units (8,338,393) (8,760) (8,347,153) (24,707,255) (24,823,899)
Total comprehensive income for the period - 210,244 210,244 - 171,294 171,294
Annual Distribution
Rs. 5.0197 per unit declared on July 02, 2018 as cash dividend (196,538) (53,488) (250,026) - - -
Interim Distribution
Re. 0.4495 per unit declared on July 29, 2018 as cash dividend (645) (11,975) (12,620) - - -
Re. 0.2627 per unit declared on August 12, 2018 as cash dividend (796) (7,567) (8,363) - - -
Re. 0.2336 per unit declared on August 26, 2018 as cash dividend (260) (7,595) (7,855) - - -
Re. 0.2411 per unit declared on September 02, 2018 as cash dividend (628) (7,839) (8,467) - - -
Re. 0.2538 per unit declared on September 23, 2018 as cash dividend (177) (7,986) (8,163) - - -
Re. 0.2547 per unit declared on October 07, 2018 as cash dividend (165) (8,434) (8,599) - - -
Re. 0.2624 per unit declared on October 10, 2018 as cash dividend (319) (9,222) (9,541) - - -
Re. 0.2698 per unit declared on November 04, 2018 as cash dividend (154) (9,667) (9,821) - - -
Re. 0.2638 per unit declared on November 18, 2018 as cash dividend (148) (8,447) (8,595) - - -
Re. 0.2642 per unit declared on December 02, 2018 as cash dividend (597) (8,969) (9,566) - - -
Re. 0.3331 per unit declared on December 16, 2018 as cash dividend (351) (12,069) (12,420) - - -
Re. 0.3497 per unit declared on December 30, 2018 as cash dividend (203) (12,091) (12,294) - - -
Re. 0.3463 per unit declared on January 13, 2019 as cash dividend (366) (12,611) (12,977) - - -
Re. 0.3510 per unit declared on January 27, 2019 as cash dividend (285) (13,006) (13,291) - - -
Re. 0.3445 per unit declared on February 10, 2019 as cash dividend (248) (13,203) (13,451) - - -
Re. 0.3452 per unit declared on February 24, 2019 as cash dividend (329) (13,734) (14,063) - - -
Re. 0.3450 per unit declared on March 10, 2019 as cash dividend (267) (14,134) (14,401) - - -
Re. 0.3508 per unit declared on March 24, 2019 as cash dividend (220) (14,521) (14,741) - - -
-
Net income for the period less distribution (202,696) (36,314) (239,010) 171,294
Net assets at the end of the period 4,232,097 8,563 4,240,660 5,997,865 53,402 6,051,267
Undistributed income / (loss) brought forward comprises of:
Realised gain / (loss) 53,637 - (1,248) (1,248)
Unrealised gain - - - -
Total undistributed income / (loss) brought forward 53,637 (1,248) (1,248)
Income available for distribution:
Relating to capital gains - - -
Excluding capital gains 201,484 - 54,650 54,650
201,484 - 54,650 54,650
Distributions during the period:
Annual distribution of Rs. 5.0197 per unit declared on July 02, 2018 as cash dividend (53,488) - - -
Interim distributions during half year ended December 31, 2018 as cash dividend (193,070) - - -
(246,558)
Undistributed income carried forward 8,563 53,402 53,402
Undistributed income carried forward comprises of:
Realised gain 8,563 - 53,402 53,402
Unrealised gain - - - -
Total undistributed income carried forward 8,563 53,402 53,402
(Rupees) (Rupees)
Net assets value per unit at the beginning of the period 105.2621 100.2424
Net assets value per unit at the end of the period 100.4175 103.8484
The annexed notes from 1 to 15 form an integral part of this condensed interim financial information.
CHIEF EXECUTIVE OFFICER CHIEF FINANCIAL OFFICER DIRECTOR
(Management Company)
-------------------------------------------------------Nine months Period Ended-------------------------------------------------------
March 31
2019
Total Total
--------------------------------------------------------------------------- (Rupees in '000) ------------------------------------------------------------------------
For UBL Fund Managers Limited
March 31
2018
AL-AMEEN ISLAMIC CASH FUND
CONDENSED INTERIM CASH FLOW STATEMENT (UNAUDITED)
FOR THE NINE MONTHS ENDED MARCH 31, 2019
March 31, March 31,
2019 2018
CASH FLOWS FROM OPERATING ACTIVITIES
Net income for the period before taxation 210,244 171,294
Adjustments for:
Profit on bank balances (236,547) (189,479)
Ptofit on term deposit musharika - (17,588)
Amortisation of preliminary expenses and flotation cost - 123
Provision for Sindh Workers' Welfare Fund 4,207 3,428
(232,340) (203,516)
(22,096) (32,222)
Working capital changes
(Increase) / decrease in assets
Prepayments and other receivables (2,337) 171,722
(2,337) 171,722
(Decrease) / increase in liabilities
Payable to UBL Fund Managers Limited - Management Company (67) (1,671)
Payable to Central Depository Company of Pakistan Limited - Trustee (94) (83)
Annual fee payable to Securities and Exchange Commission of Pakistan (1,676) 494
Accrued expenses and other liabilities 250 (1,583)
(1,587) (2,843)
Advance tax deducted (91) (666)
Profit received on bank balances and term deposit musharika 226,480 214,053
Net cash generated from operating activities 200,369 350,044
CASH FLOWS FROM FINANCING ACTIVITIES
Receipts from issuance of units 7,584,083 26,690,444
Payments on redemption of units (8,347,153) (24,823,899)
Dividend Paid (449,254) -
Net cash (used in)/generated from financing activities (1,212,324) 1,866,545
Net (decrease)/Increase in cash and cash equivalents (1,011,955) 2,216,589
Cash and cash equivalent at beginning of the period 5,226,437 3,818,223
Cash and cash equivalents at end of the period 4,214,482 6,034,812
CASH AND CASH EQUIVALENTS
Bank balances 4,214,482 6,034,812
Term deposit musharika - - 4,214,482 6,034,812
The annexed notes from 1 to 15 form an integral part of this condensed interim financial information.
Nine Months Period Ended
------- (Rupees in '000) -------
For UBL Fund Managers Limited
(Management Company)
CHIEF EXECUTIVE OFFICER CHIEF FINANCIAL OFFICER DIRECTOR
AL-AMEEN ISLAMIC CASH FUND
NOTES TO THE CONDENSED INTERIM FINANCIAL INFORMATION (UNAUDITED)
FOR THE NINE MONTH PERIOD ENDED MARCH 31, 2019
1 LEGAL STATUS AND NATURE OF BUSINESS
1.1
1.2
1.3
1.4
1.5
1.6
2 BASIS OF PREPARATION
2.1 Statement of compliance
2.1.1
The Fund provides high liquidity and competitive returns while seeking maximum possible preservation of capital by investing
in low risk and liquid Shariah Compliant instruments. Under Circular 07 dated March 6, 2009 issued by the SECP, the Fund
has been categorised by the Management Company as Shariah Compliant Money Market Fund.
This condensed interim financial information has been prepared in accordance with the accounting and reporting standards as
applicable in Pakistan for interim financial reporting. The accounting and reporting standards as applicable in Pakistan for
interim financial reporting comprise of International Accounting Standard (IAS) 34 - Interim Financial Reporting, issued by
the International Accounting Standards Board (IASB) as notified under the Companies Act, 2017, the requirements of the
Trust Deed, the NBFC Rules, the Non-Banking Finance Companies and Notified Entities Regulations, 2008 (the 'NBFC
Regulations'), provisions of and directives issued under the Companies Act, 2017 and the directives issued by the SECP.
Wherever the requirements of the Trust Deed, the NBFC Rules, the NBFC Regulations or the directives issued by the SECP
Wherever the requirements of the Trust Deed, the NBFC Rules, the NBFC Regulations, provisions of and directives issued
under the Companies Act, 2017 and the directives issued by the SECP differ with the requirements of the IAS 34, the
requirements of the Trust Deed, the NBFC Rules, the NBFC Regulations, provisions of and directives issued under the
Companies Act, 2017 and the directives issued by the SECP have been followed.
Title to the assets of the Fund are held in the name of the Central Depository Company of Pakistan Limited as the Trustee of
the Fund.
JCR - VIS Credit Rating Company has re-affirmed quality rating of AM1 (stable outlook) to the Management Company as at
December 27, 2018 and a stability rating of "AA(f)" to the Fund as at March 31, 2019.
Al-Ameen Islamic Cash Fund (the Fund) was established under the Trust Deed executed between UBL Fund Managers
Limited, (wholly owned subsidiary company of United Bank Limited) as its Management Company, a company incorporated
under the repealed Companies Ordinance, 1984 (now Companies Act, 2017) and the Central Depository Company of Pakistan
Limited, as its Trustee. The Trust Deed was executed on May 29, 2012 and the Fund was authorized by the Securities and
Exchange Commission of Pakistan ("SECP") on July 26, 2012 in accordance with the Non-Banking Finance Companies
(Establishment and Regulation) Rules, 2003 ("NBFC Rules"). The registered office of the Management Company is situated at
4th floor, STSM Building, Beaumont Road, Civil Lines, Karachi. The Fund commenced its operations from September 19,
2012.
The Management Company of the Fund is registered with the SECP as a Non-Banking Finance Company under the NBFC
Rules.
The Fund is an open-ended mutual fund listed on the Pakistan Stock Exchange Limited. Units are offered for public
subscription on a continuous basis. The units are transferable and can be redeemed by surrendering them to the Fund at the
option of the unit holders.
2.1.2
2.1.3
2.1.4
2.1.5
2.2
2.3 Functional and presentation currency
3
3.1
3.2
The comparative statement of asset and liabilities presented in this condensed interim financial information has been extracted
from the annual audited financial statements of the Fund for the year ended June 30, 2018, whereas the comparative condensed
interim income statement, condensed interim statement of comprehensive income, condensed interim statement of cash flows,
condensed interim statement of movement in unit holders’ fund are extracted from the unaudited condensed interim financial
information for the nine months period ended March 31,2018
This condensed interim financial information is unaudited, but has been reviewed by the auditors. Further, the figures of the
condensed interim income statement and condensed interim statement of comprehensive income for the quarter ended March
31, 2019 have not been reviewed.
In compliance with Schedule V of the NBFC Regulations the directors of the Management Company hereby declare that this
condensed interim financial information gives a true and fair view of the state of the Fund’s affairs as at March 31, 2019.
Basis of measurement
This condensed interim financial information has been prepared under the historical cost convention, except that certain
financial assets are stated at fair value.
This condensed interim financial information has been prepared following accrual basis of accounting except for cash flow
information.
The disclosures made in this condensed interim financial information have, however, been limited based on the requirements
of International Accounting Standard 34: 'Interim Financial Reporting'. This condensed interim financial information does not
include all the information and disclosures required in a full set of financial statements and should be read in conjunction with
the annual audited financial statements of the Fund for the year ended June 30, 2018.
Items included in the condensed interim financial information are measured using the currency of the primary economic
environment in which the Fund operates. This condensed interim financial information is presented in Pakistani Rupees which
is the Fund's functional and presentation currency.
SIGNIFICANT ACCOUNTING AND RISK MANAGEMENT POLICIES, ESTIMATES, ASSUMPTIONS AND
CHANGES THEREIN
The accounting policies applied in the preparation of this condensed interim financial information are the same as those
applied in the preparation of the audited financial statements of the Fund for the year ended June 30, 2018 except as disclosed
in note 3.6.
The preparation of this condensed interim financial information in conformity with approved accounting standards requires
management to make estimates, assumptions and use judgements that affect the application of accounting policies and reported
amounts of assets, liabilities, income and expenses. Estimates, assumptions and judgments are continually evaluated and are
based on historical experience and other factors, including reasonable expectations of future events. Revisions to accounting
estimates are recognised prospectively commencing from the period of revision.
3.3
3.4
3.5
3.6
i. Classification and measurement of financial assets and financial liabilities
-
-
IFRS 9 largely retains the existing requirements in IAS 39 for the classification and measurement of financial liabilities.
However, it eliminates the previous IAS 39 categories for financial assets of held to maturity, loans and receivables and
available for sale.
The adoption of IFRS 9 has not had a significant effect on the Fund’s accounting policies related to financial liabilities. The
impact of IFRS 9 on the classification and measurement of financial assets is set out below.
Under IFRS 9, on initial recognition, a financial asset is classified as measured at: amortised cost; fair value through other
comprehensive income (FVOCI) – debt investment; FVOCI – equity investment; or fair value through profit and loss (FVTPL).
The classification of financial assets under IFRS 9 is generally based on the business model in which a financial asset is
managed and its contractual cash flow characteristics.
A financial asset is measured at amortised cost if it meets both of the following conditions and is not designated as at FVTPL:
it is held within a business model whose objective is to hold assets to collect contractual cash flows; and
The Fund's financial risk management objectives and policies are consistent with that disclosed in annual audited financial
statements of the Fund for the year ended June 30, 2018.
IFRS 9 'Financial Instruments' was issued on July 24, 2017. This standard is adopted locally by the Securities and Exchange
Commission of Pakistan and is effective for accounting periods beginning on or after July 1, 2018. A number of other new
standards are effective from July 1, 2018 but they do not have a material effect on the Fund’s condensed interim financial
information.
IFRS 9 sets out requirements for recognising and measuring financial assets, financial liabilities and some contracts to buy or
sell non-financial items. This standard replaces IAS 39 Financial Instruments: Recognition and Measurement
.
The details of new significant accounting policies and the nature and effect of the changes to previous accounting policies are
set out below:
The significant estimates, judgements and assumptions made by the management in applying the accounting policies and the
key sources of estimation uncertainty are the same as those applied to the annual audited financial statements as at and for the
year ended June 30, 2018.
There are certain standards, interpretations and amendments to approved accounting standards which have been published and
are mandatory for the Fund's accounting period beginning on or after July 01, 2018. These standards, interpretations and
amendments are either not relevant to the Fund's operations or are not expected to have a significant effect on this condensed
interim financial information except as disclosed in note 3.6.
its contractual terms give rise on specified dates to cash flows that are solely payments of principal and interest on the
principal amount outstanding.
A debt investment is measured at FVOCI if it meets both of the following conditions and is not designated as at FVTPL:
-
-
Financial assets at
FVTPL
Financial assets at
amortised cost
Debt investments at
FVOCI
Equity investments at
FVOCI
it is held within a business model whose objective is achieved by both collecting contractual cash flows and selling
financial assets; and
its contractual terms give rise on specified dates to cash flows that are solely payments of principal and interest on the
principal amount outstanding.
On initial recognition of an equity investment that is not held for trading, the Fund may irrevocably elect to present subsequent
changes in the investment’s fair value in OCI. This election is made on an investment-by-investment basis.
All financial assets not classified as measured at amortised cost or FVOCI as described above are measured at FVTPL. On
initial recognition, the Fund may irrevocably designate a financial asset that otherwise meets the requirements to be measured
at amortised cost or at FVOCI as at FVTPL if doing so eliminates or significantly reduces an accounting mismatch that would
otherwise arise.
A financial asset is initially measured at fair value plus, for an item not at FVTPL, transaction costs that are directly
attributable to its acquisition.
The following accounting policies apply to the subsequent measurement of financial assets:
These assets are subsequently measured at fair value. Net gains
and losses, including any interest or dividend income, are
recognised in income statement.
These assets are subsequently measured at amortised cost using
the effective interest method. The amortised cost is reduced by
impairment losses (see (ii) below). Interest income, foreign
exchange gains and losses and impairment are recognised in
income statement.
These assets are subsequently measured at fair value. Interest
income calculated using the effective interest method, foreign
exchange gains and losses and impairment are recognised in profit
or loss. Other net gains and losses are recognised in OCI. On
derecognition, gains and losses accumulated in OCI are
reclassified to income statement.
These assets are subsequently measured at fair value. Dividends
are recognised as income in profit or loss unless the dividend
clearly represents a recovery of part of the cost of the investment.
Other net gains and losses are recognised in OCI and are never
reclassified to income statement.
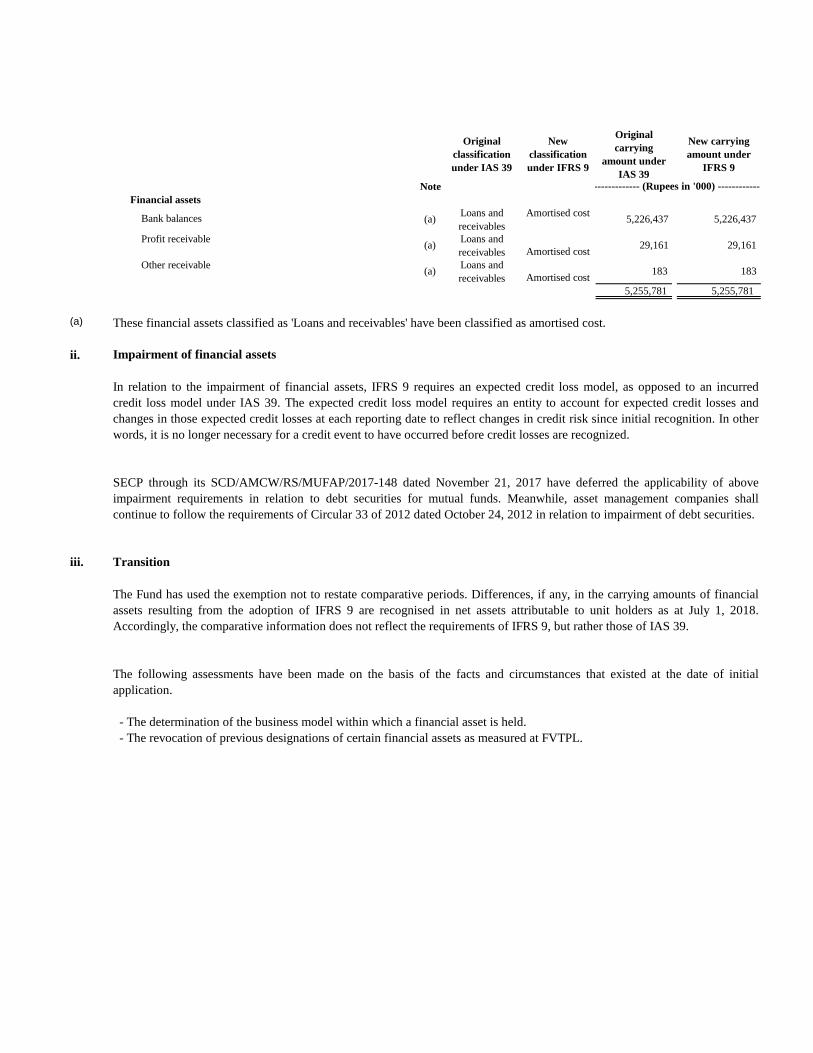
The following table and the accompanying notes below explain the original measurement categories under IAS 39 and the new
measurement categories under IFRS 9 for each class of the Fund’s financial assets as at July 1, 2018.
Original
classification
under IAS 39
New
classification
under IFRS 9
Original
carrying
amount under
IAS 39
New carrying
amount under
IFRS 9
Note
Financial assets
(a)Loans and
receivables
Amortised cost 5,226,437 5,226,437
(a)Loans and
receivables Amortised cost 29,161 29,161
(a)Loans and
receivables Amortised cost 183 183
5,255,781 5,255,781
(a)
ii. Impairment of financial assets
iii. Transition
---------------------------------------------------------- (Rupees in '000) ----------------------------------------------------------
Bank balances
Profit receivable
Other receivable
These financial assets classified as 'Loans and receivables' have been classified as amortised cost.
In relation to the impairment of financial assets, IFRS 9 requires an expected credit loss model, as opposed to an incurred
credit loss model under IAS 39. The expected credit loss model requires an entity to account for expected credit losses and
changes in those expected credit losses at each reporting date to reflect changes in credit risk since initial recognition. In other
words, it is no longer necessary for a credit event to have occurred before credit losses are recognized.
SECP through its SCD/AMCW/RS/MUFAP/2017-148 dated November 21, 2017 have deferred the applicability of above
impairment requirements in relation to debt securities for mutual funds. Meanwhile, asset management companies shall
continue to follow the requirements of Circular 33 of 2012 dated October 24, 2012 in relation to impairment of debt securities.
The Fund has used the exemption not to restate comparative periods. Differences, if any, in the carrying amounts of financial
assets resulting from the adoption of IFRS 9 are recognised in net assets attributable to unit holders as at July 1, 2018.
Accordingly, the comparative information does not reflect the requirements of IFRS 9, but rather those of IAS 39.
The following assessments have been made on the basis of the facts and circumstances that existed at the date of initial
application.
- The determination of the business model within which a financial asset is held.
- The revocation of previous designations of certain financial assets as measured at FVTPL.
(Unaudited) (Audited)
March 31, June 30,
2019 2018
Note
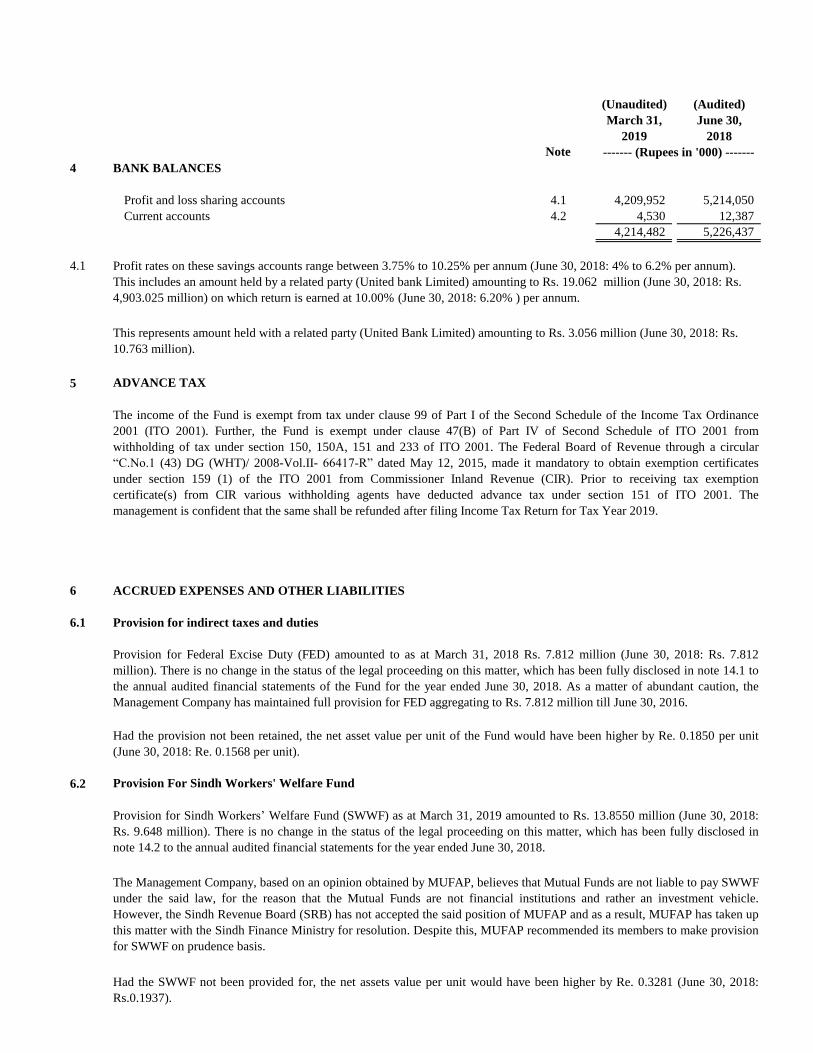
4 BANK BALANCES
Profit and loss sharing accounts 4.1 4,209,952 5,214,050
Current accounts 4.2 4,530 12,387
4,214,482 5,226,437
4.1
4.2
5 ADVANCE TAX
6 ACCRUED EXPENSES AND OTHER LIABILITIES
6.1 Provision for indirect taxes and duties
6.2 Provision For Sindh Workers' Welfare Fund
------- (Rupees in '000) -------
The income of the Fund is exempt from tax under clause 99 of Part I of the Second Schedule of the Income Tax Ordinance
2001 (ITO 2001). Further, the Fund is exempt under clause 47(B) of Part IV of Second Schedule of ITO 2001 from
withholding of tax under section 150, 150A, 151 and 233 of ITO 2001. The Federal Board of Revenue through a circular
“C.No.1 (43) DG (WHT)/ 2008-Vol.II- 66417-R” dated May 12, 2015, made it mandatory to obtain exemption certificates
under section 159 (1) of the ITO 2001 from Commissioner Inland Revenue (CIR). Prior to receiving tax exemption
certificate(s) from CIR various withholding agents have deducted advance tax under section 151 of ITO 2001. The
management is confident that the same shall be refunded after filing Income Tax Return for Tax Year 2019.
Provision for Federal Excise Duty (FED) amounted to as at March 31, 2018 Rs. 7.812 million (June 30, 2018: Rs. 7.812
million). There is no change in the status of the legal proceeding on this matter, which has been fully disclosed in note 14.1 to
the annual audited financial statements of the Fund for the year ended June 30, 2018. As a matter of abundant caution, the
Management Company has maintained full provision for FED aggregating to Rs. 7.812 million till June 30, 2016.
This represents amount held with a related party (United Bank Limited) amounting to Rs. 3.056 million (June 30, 2018: Rs.
10.763 million).
Profit rates on these savings accounts range between 3.75% to 10.25% per annum (June 30, 2018: 4% to 6.2% per annum).
This includes an amount held by a related party (United bank Limited) amounting to Rs. 19.062 million (June 30, 2018: Rs.
4,903.025 million) on which return is earned at 10.00% (June 30, 2018: 6.20% ) per annum.
The Management Company, based on an opinion obtained by MUFAP, believes that Mutual Funds are not liable to pay SWWF
under the said law, for the reason that the Mutual Funds are not financial institutions and rather an investment vehicle.
However, the Sindh Revenue Board (SRB) has not accepted the said position of MUFAP and as a result, MUFAP has taken up
this matter with the Sindh Finance Ministry for resolution. Despite this, MUFAP recommended its members to make provision
for SWWF on prudence basis.
Had the SWWF not been provided for, the net assets value per unit would have been higher by Re. 0.3281 (June 30, 2018:
Rs.0.1937).
Had the provision not been retained, the net asset value per unit of the Fund would have been higher by Re. 0.1850 per unit
(June 30, 2018: Re. 0.1568 per unit).
Provision for Sindh Workers’ Welfare Fund (SWWF) as at March 31, 2019 amounted to Rs. 13.8550 million (June 30, 2018:
Rs. 9.648 million). There is no change in the status of the legal proceeding on this matter, which has been fully disclosed in
note 14.2 to the annual audited financial statements for the year ended June 30, 2018.
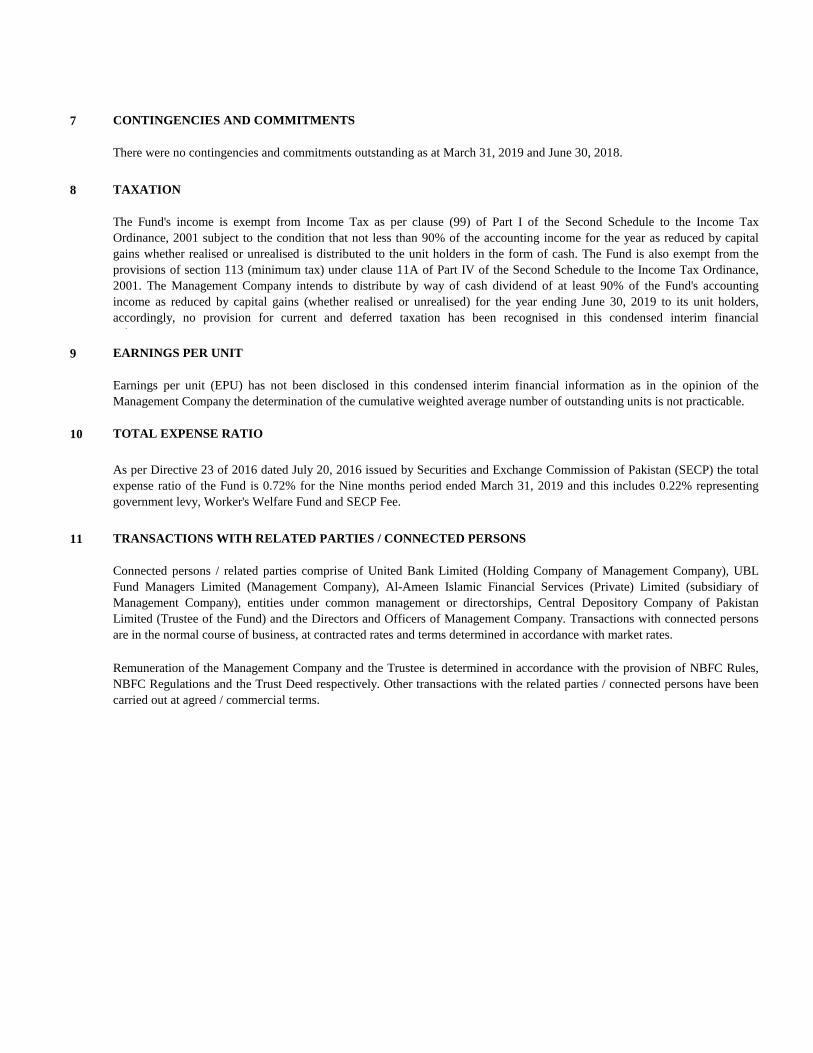
7 CONTINGENCIES AND COMMITMENTS
8 TAXATION
9 EARNINGS PER UNIT
10 TOTAL EXPENSE RATIO
11 TRANSACTIONS WITH RELATED PARTIES / CONNECTED PERSONS
There were no contingencies and commitments outstanding as at March 31, 2019 and June 30, 2018.
The Fund's income is exempt from Income Tax as per clause (99) of Part I of the Second Schedule to the Income Tax
Ordinance, 2001 subject to the condition that not less than 90% of the accounting income for the year as reduced by capital
gains whether realised or unrealised is distributed to the unit holders in the form of cash. The Fund is also exempt from the
provisions of section 113 (minimum tax) under clause 11A of Part IV of the Second Schedule to the Income Tax Ordinance,
2001. The Management Company intends to distribute by way of cash dividend of at least 90% of the Fund's accounting
income as reduced by capital gains (whether realised or unrealised) for the year ending June 30, 2019 to its unit holders,
accordingly, no provision for current and deferred taxation has been recognised in this condensed interim financial
information.
Earnings per unit (EPU) has not been disclosed in this condensed interim financial information as in the opinion of the
Management Company the determination of the cumulative weighted average number of outstanding units is not practicable.
As per Directive 23 of 2016 dated July 20, 2016 issued by Securities and Exchange Commission of Pakistan (SECP) the total
expense ratio of the Fund is 0.72% for the Nine months period ended March 31, 2019 and this includes 0.22% representing
government levy, Worker's Welfare Fund and SECP Fee.
Connected persons / related parties comprise of United Bank Limited (Holding Company of Management Company), UBL
Fund Managers Limited (Management Company), Al-Ameen Islamic Financial Services (Private) Limited (subsidiary of
Management Company), entities under common management or directorships, Central Depository Company of Pakistan
Limited (Trustee of the Fund) and the Directors and Officers of Management Company. Transactions with connected persons
are in the normal course of business, at contracted rates and terms determined in accordance with market rates.
Remuneration of the Management Company and the Trustee is determined in accordance with the provision of NBFC Rules,
NBFC Regulations and the Trust Deed respectively. Other transactions with the related parties / connected persons have been
carried out at agreed / commercial terms.
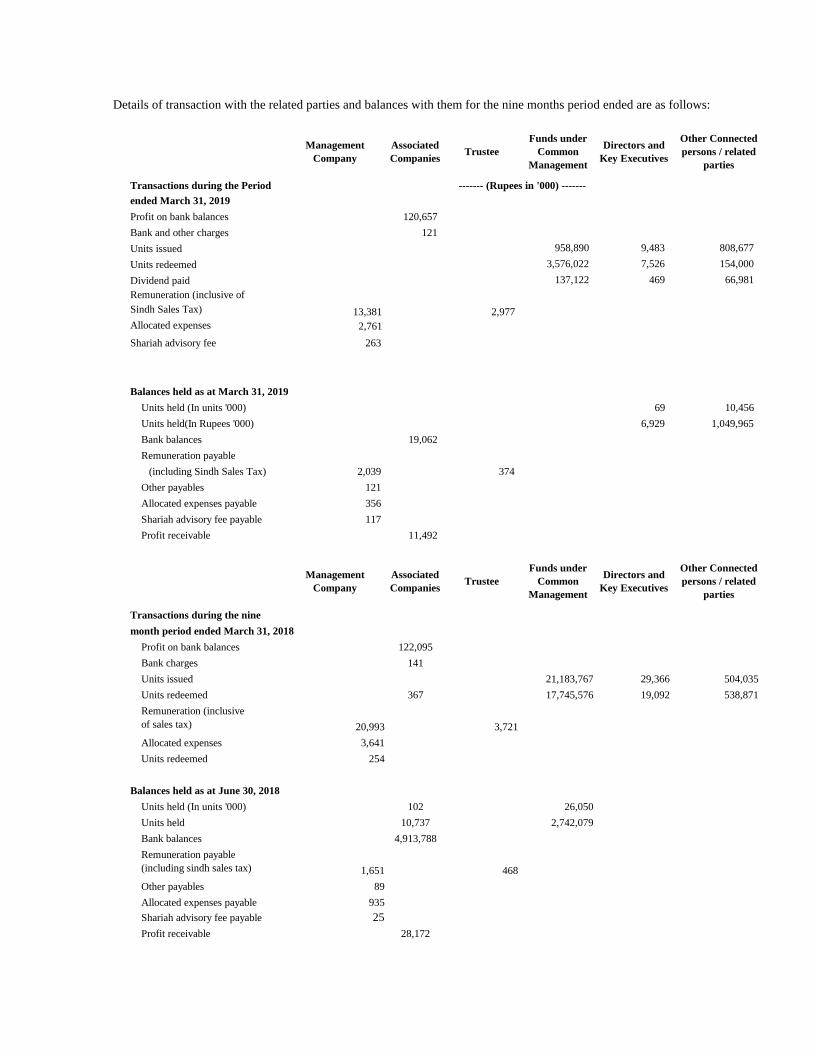
Transactions during the Period
ended March 31, 2019
Profit on bank balances
Bank and other charges
Units issued 958,890 9,483 808,677
Units redeemed 3,576,022 7,526 154,000
Dividend paid 137,122 469 66,981
Remuneration (inclusive of
Sindh Sales Tax) 13,381 2,977
Allocated expenses 2,761
Shariah advisory fee 263
Balances held as at March 31, 2019
Units held (In units '000) 69 10,456
Units held(In Rupees '000) 6,929 1,049,965
Bank balances
Remuneration payable
(including Sindh Sales Tax) 2,039 374
Other payables 121
Allocated expenses payable 356
Shariah advisory fee payable 117
Profit receivable
Transactions during the nine
month period ended March 31, 2018
Profit on bank balances
Bank charges
Units issued 21,183,767 29,366 504,035
Units redeemed 17,745,576 19,092 538,871
Remuneration (inclusive
of sales tax) 20,993 3,721
Allocated expenses 3,641
Units redeemed 254
Balances held as at June 30, 2018
Units held (In units '000) 26,050
Units held 2,742,079
Bank balances
Remuneration payable
(including sindh sales tax) 1,651 468
Other payables 89
Allocated expenses payable 935
Shariah advisory fee payable 25
Profit receivable
------- (Rupees in '000) -------
Management
Company
Associated
Companies Trustee
Details of transaction with the related parties and balances with them for the nine months period ended are as follows:
Other Connected
persons / related
parties
122,095
141
367
102
10,737
4,913,788
28,172
121
Management
CompanyTrustee
Funds under
Common
Management
Directors and
Key Executives
Associated
Companies
120,657
11,492
19,062
Other Connected
persons / related
parties
Funds under
Common
Management
Directors and
Key Executives
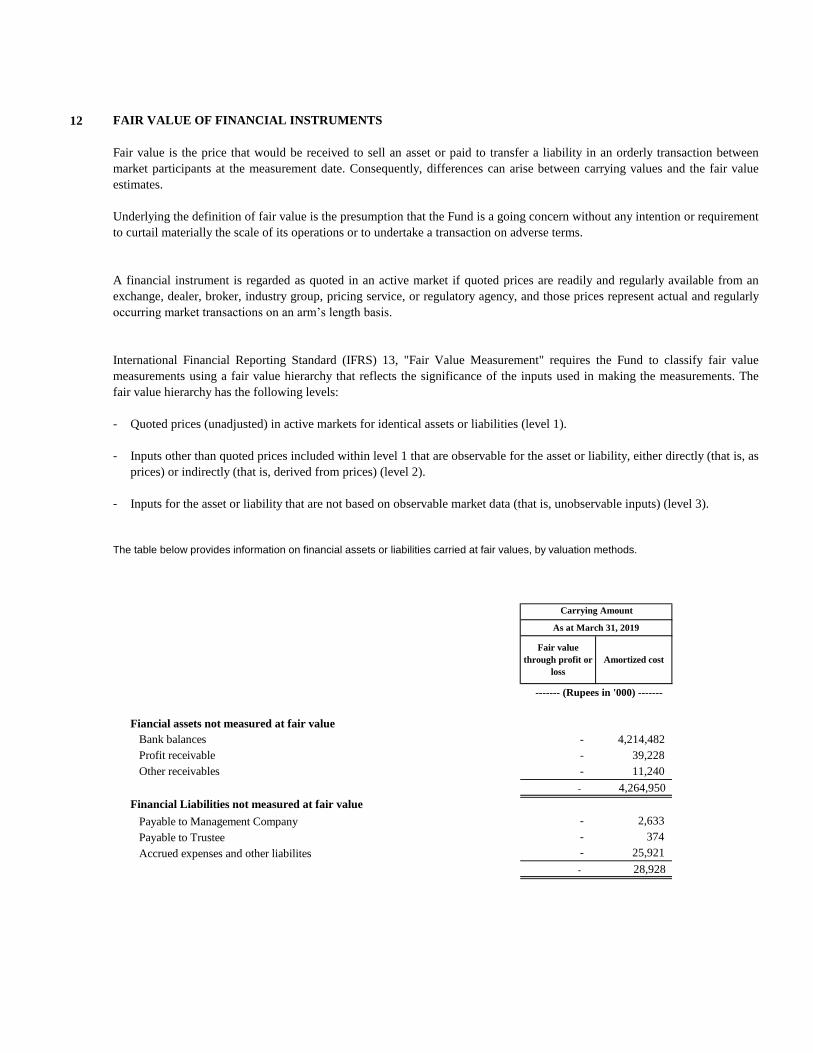
12 FAIR VALUE OF FINANCIAL INSTRUMENTS
-
-
-
Bank balances - 4,214,482
Profit receivable - 39,228
Other receivables - 11,240
- 4,264,950
- 2,633
- 374
- 25,921
- 28,928
Payable to Management Company
Accrued expenses and other liabilites
Payable to Trustee
Carrying Amount
As at March 31, 2019
Fair value
through profit or
loss
Amortized cost
------- (Rupees in '000) -------
Fiancial assets not measured at fair value
Financial Liabilities not measured at fair value
A financial instrument is regarded as quoted in an active market if quoted prices are readily and regularly available from an
exchange, dealer, broker, industry group, pricing service, or regulatory agency, and those prices represent actual and regularly
occurring market transactions on an arm’s length basis.
International Financial Reporting Standard (IFRS) 13, "Fair Value Measurement" requires the Fund to classify fair value
measurements using a fair value hierarchy that reflects the significance of the inputs used in making the measurements. The
fair value hierarchy has the following levels:
Quoted prices (unadjusted) in active markets for identical assets or liabilities (level 1).
Inputs other than quoted prices included within level 1 that are observable for the asset or liability, either directly (that is, as
prices) or indirectly (that is, derived from prices) (level 2).
Inputs for the asset or liability that are not based on observable market data (that is, unobservable inputs) (level 3).
Fair value is the price that would be received to sell an asset or paid to transfer a liability in an orderly transaction between
market participants at the measurement date. Consequently, differences can arise between carrying values and the fair value
estimates.
Underlying the definition of fair value is the presumption that the Fund is a going concern without any intention or requirement
to curtail materially the scale of its operations or to undertake a transaction on adverse terms.
The table below provides information on financial assets or liabilities carried at fair values, by valuation methods.
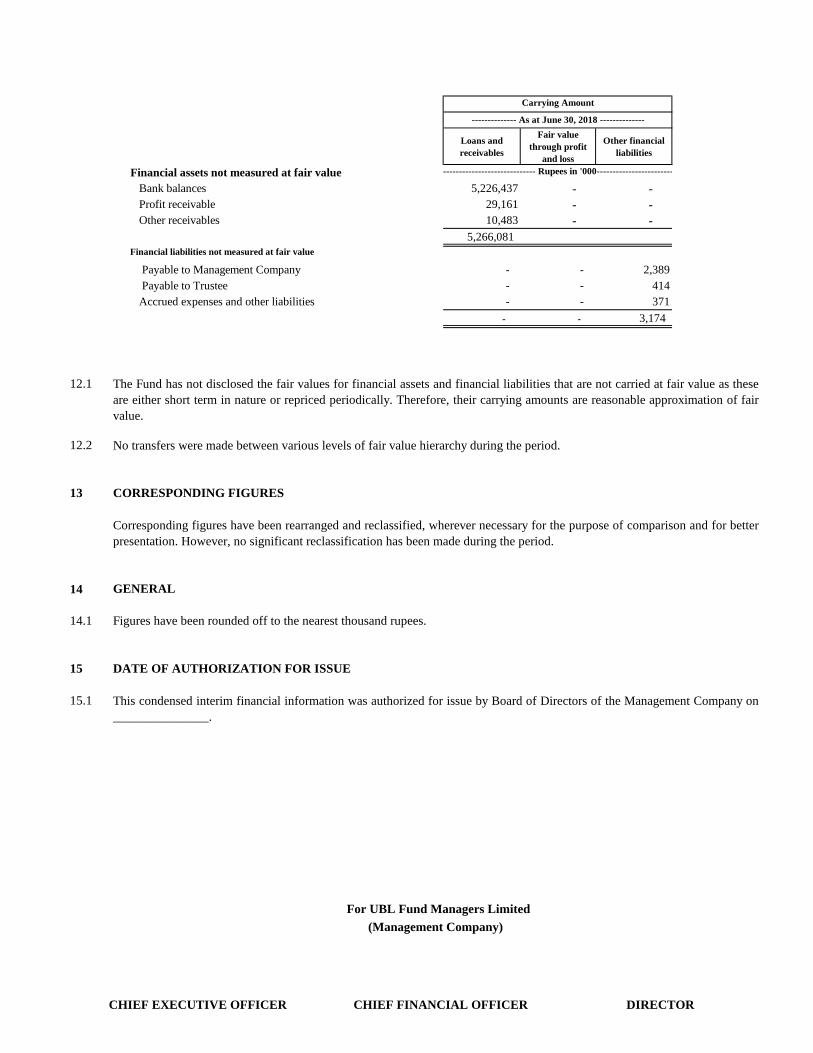
Loans and
receivables
Fair value
through profit
and loss
Other financial
liabilities
Bank balances 5,226,437 - -
Profit receivable 29,161 - -
Other receivables 10,483 - -
5,266,081
Financial liabilities not measured at fair value
- - 2,389
Payable to Trustee - - 414
- - 371
- - 3,174
12.1
12.2
13 CORRESPONDING FIGURES
14 GENERAL
14.1
15 DATE OF AUTHORIZATION FOR ISSUE
15.1
Payable to Management Company
Accrued expenses and other liabilities
-------------------------------------- Rupees in '000---------------------------------
Carrying Amount
-------------- As at June 30, 2018 --------------
Financial assets not measured at fair value
Figures have been rounded off to the nearest thousand rupees.
This condensed interim financial information was authorized for issue by Board of Directors of the Management Company on
_______________.
For UBL Fund Managers Limited
(Management Company)
CHIEF EXECUTIVE OFFICER CHIEF FINANCIAL OFFICER DIRECTOR
The Fund has not disclosed the fair values for financial assets and financial liabilities that are not carried at fair value as these
are either short term in nature or repriced periodically. Therefore, their carrying amounts are reasonable approximation of fair
value.
No transfers were made between various levels of fair value hierarchy during the period.
Corresponding figures have been rearranged and reclassified, wherever necessary for the purpose of comparison and for better
presentation. However, no significant reclassification has been made during the period.
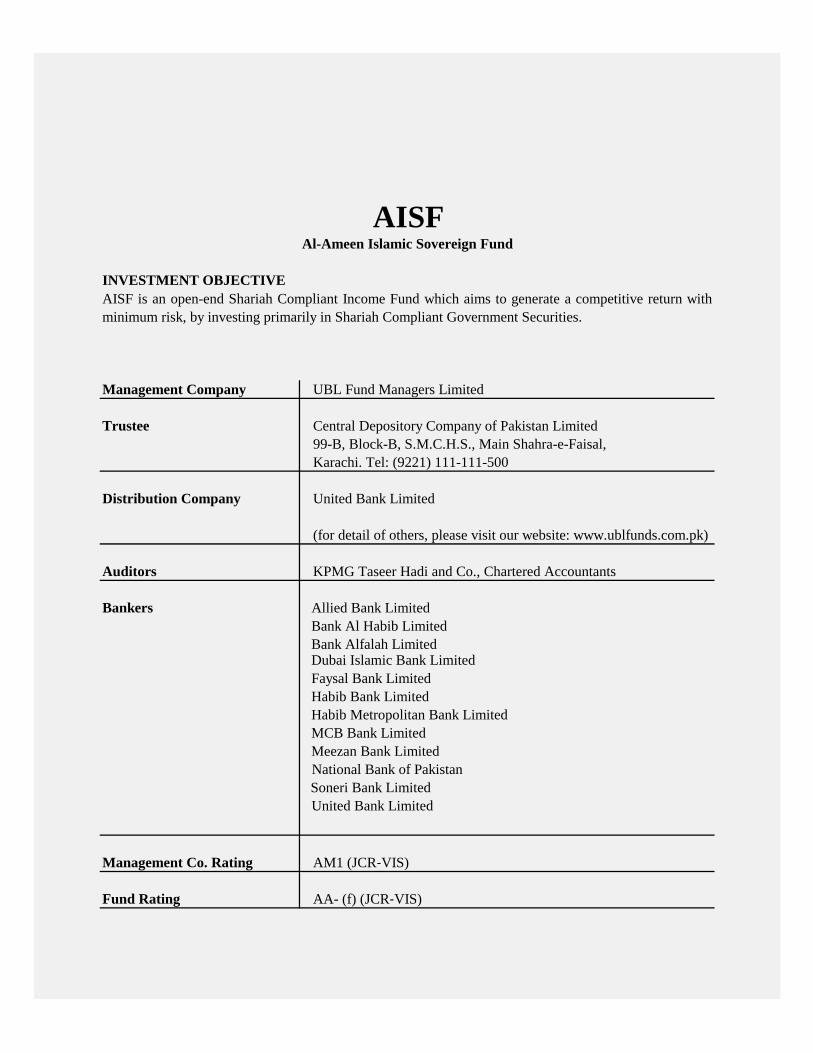
Al-Ameen Islamic Sovereign Fund
INVESTMENT OBJECTIVE
Management Company UBL Fund Managers Limited
Trustee Central Depository Company of Pakistan Limited
99-B, Block-B, S.M.C.H.S., Main Shahra-e-Faisal,
Karachi. Tel: (9221) 111-111-500
Distribution Company United Bank Limited
Auditors KPMG Taseer Hadi and Co., Chartered Accountants
Bankers Allied Bank Limited
Bank Al Habib Limited
Bank Alfalah Limited
Faysal Bank Limited
Habib Bank Limited
Habib Metropolitan Bank Limited
MCB Bank Limited
Meezan Bank Limited
National Bank of Pakistan
Soneri Bank Limited
United Bank Limited
Management Co. Rating AM1 (JCR‐VIS)
Fund Rating AA- (f) (JCR‐VIS)
AISF
AISF is an open-end Shariah Compliant Income Fund which aims to generate a competitive return with
minimum risk, by investing primarily in Shariah Compliant Government Securities.
(for detail of others, please visit our website: www.ublfunds.com.pk)
Dubai Islamic Bank Limited
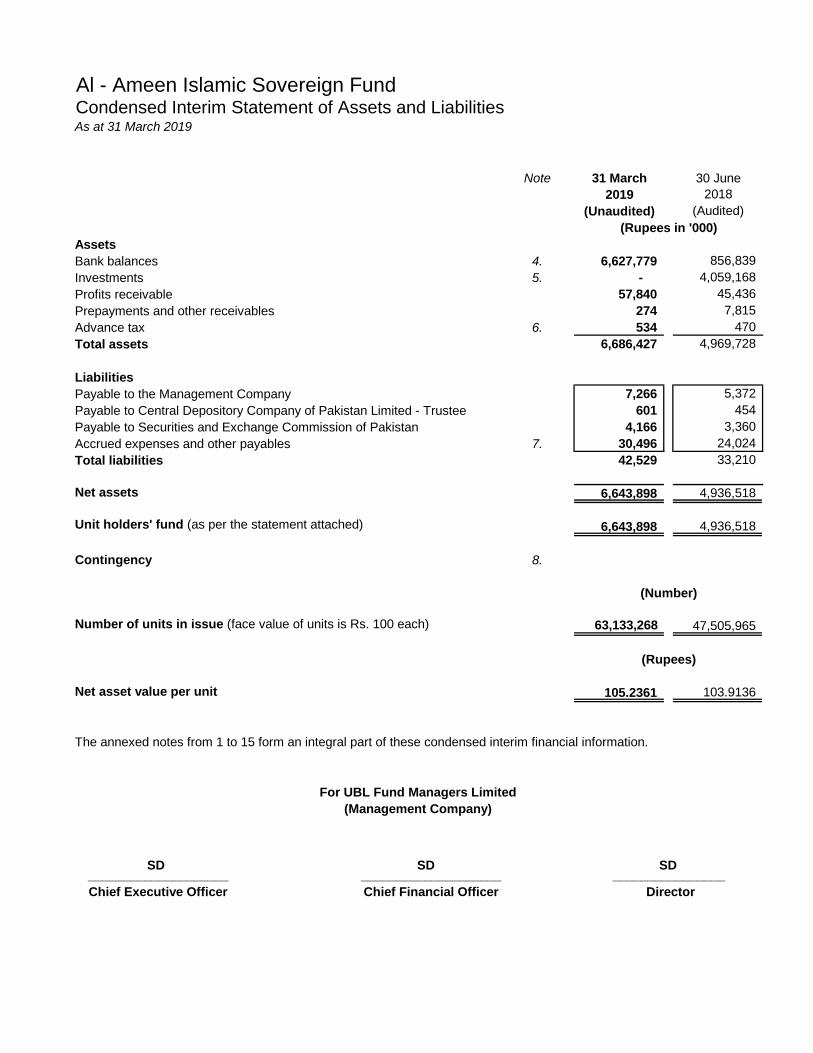
Al - Ameen Islamic Sovereign FundCondensed Interim Statement of Assets and LiabilitiesAs at 31 March 2019
Note 31 March 30 June
2019 2018
(Unaudited) (Audited)
Assets
Bank balances 4. 6,627,779 856,839
Investments 5. - 4,059,168
Profits receivable 57,840 45,436
Prepayments and other receivables 274 7,815
Advance tax 6. 534 470
Total assets 6,686,427 4,969,728
Liabilities
Payable to the Management Company 7,266 5,372
Payable to Central Depository Company of Pakistan Limited - Trustee 601 454
Payable to Securities and Exchange Commission of Pakistan 4,166 3,360
Accrued expenses and other payables 7. 30,496 24,024
Total liabilities 42,529 33,210
Net assets 6,643,898 4,936,518
Unit holders' fund (as per the statement attached) 6,643,898 4,936,518
Contingency 8.
Number of units in issue (face value of units is Rs. 100 each) 63,133,268 47,505,965
Net asset value per unit 105.2361 103.9136
The annexed notes from 1 to 15 form an integral part of these condensed interim financial information.
____________________ ____________________ ________________
Chief Executive Officer Chief Financial Officer Director
(Rupees in '000)
(Number)
(Rupees)
For UBL Fund Managers Limited
(Management Company)
SD SD SD
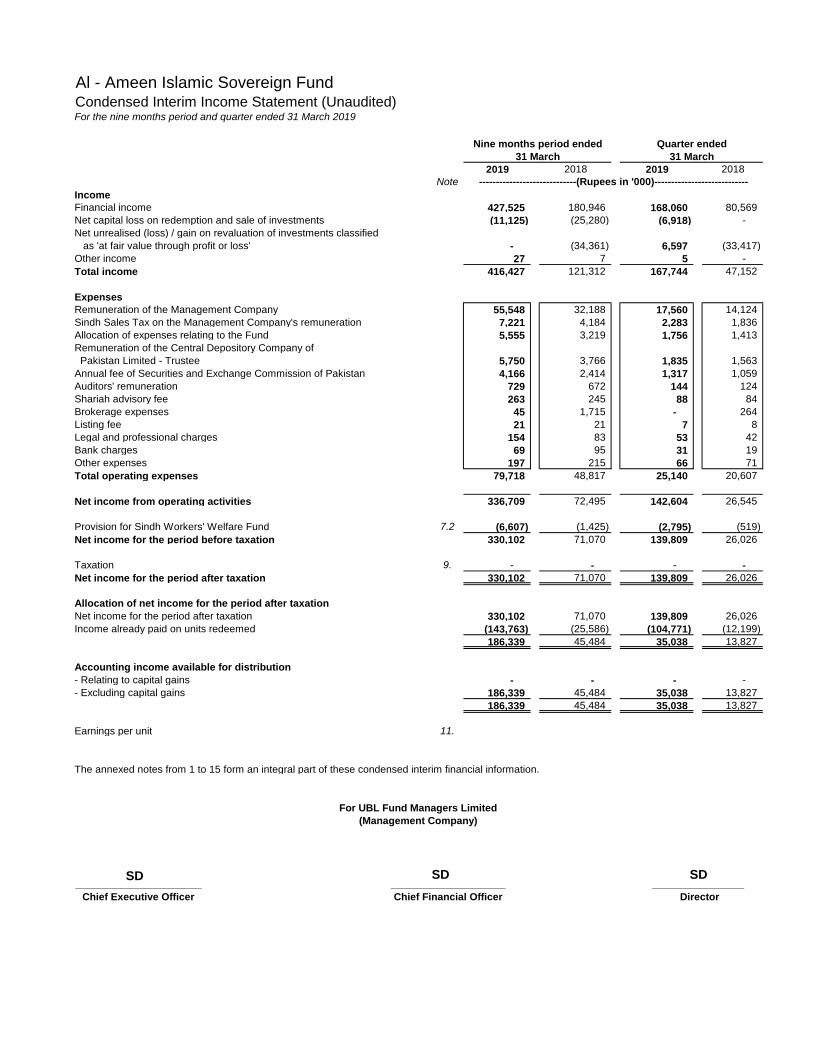
Al - Ameen Islamic Sovereign FundCondensed Interim Income Statement (Unaudited)For the nine months period and quarter ended 31 March 2019
2019 2018 2019 2018
Note
Income
Financial income 427,525 180,946 168,060 80,569
Net capital loss on redemption and sale of investments (11,125) (25,280) (6,918) -
Net unrealised (loss) / gain on revaluation of investments classified
as 'at fair value through profit or loss' - (34,361) 6,597 (33,417)
Other income 27 7 5 -
Total income 416,427 121,312 167,744 47,152
Expenses
Remuneration of the Management Company 55,548 32,188 17,560 14,124
Sindh Sales Tax on the Management Company's remuneration 7,221 4,184 2,283 1,836
Allocation of expenses relating to the Fund 5,555 3,219 1,756 1,413
Remuneration of the Central Depository Company of
Pakistan Limited - Trustee 5,750 3,766 1,835 1,563
Annual fee of Securities and Exchange Commission of Pakistan 4,166 2,414 1,317 1,059
Auditors' remuneration 729 672 144 124
Shariah advisory fee 263 245 88 84
Brokerage expenses 45 1,715 - 264
Listing fee 21 21 7 8
Legal and professional charges 154 83 53 42
Bank charges 69 95 31 19
Other expenses 197 215 66 71
Total operating expenses 79,718 48,817 25,140 20,607
Net income from operating activities 336,709 72,495 142,604 26,545
Provision for Sindh Workers' Welfare Fund 7.2 (6,607) (1,425) (2,795) (519)
Net income for the period before taxation 330,102 71,070 139,809 26,026
Taxation 9. - - - -
Net income for the period after taxation 330,102 71,070 139,809 26,026
Allocation of net income for the period after taxation
Net income for the period after taxation 330,102 71,070 139,809 26,026
Income already paid on units redeemed (143,763) (25,586) (104,771) (12,199)
186,339 45,484 35,038 13,827
Accounting income available for distribution
- Relating to capital gains - - - -
- Excluding capital gains 186,339 45,484 35,038 13,827
186,339 45,484 35,038 13,827
Earnings per unit 11.
The annexed notes from 1 to 15 form an integral part of these condensed interim financial information.
______________________ ____________________ ________________
Chief Executive Officer Chief Financial Officer Director
-----------------------------(Rupees in '000)----------------------------
For UBL Fund Managers Limited
(Management Company)
31 March 31 March
Nine months period ended Quarter ended
SD SD SD
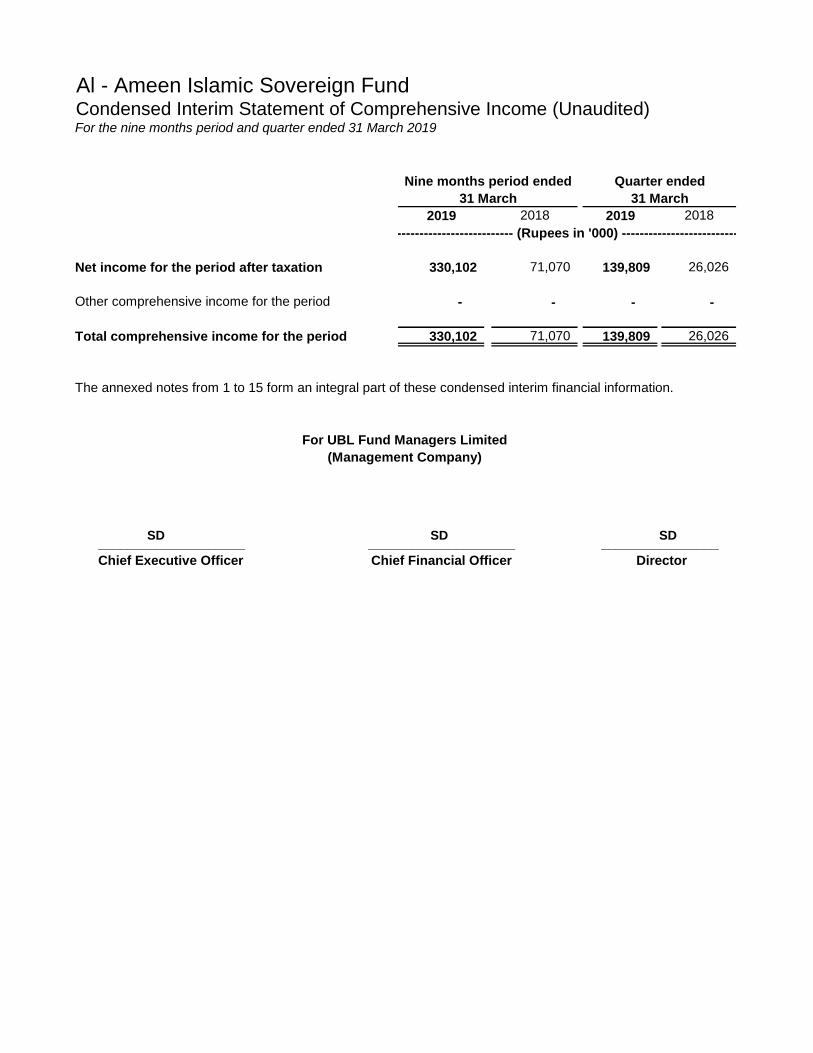
Al - Ameen Islamic Sovereign FundCondensed Interim Statement of Comprehensive Income (Unaudited)For the nine months period and quarter ended 31 March 2019
2019 2018 2019 2018
Net income for the period after taxation 330,102 71,070 139,809 26,026
Other comprehensive income for the period - - - -
Total comprehensive income for the period 330,102 71,070 139,809 26,026
The annexed notes from 1 to 15 form an integral part of these condensed interim financial information.
____________________ ____________________ ________________
Chief Executive Officer Chief Financial Officer Director
Nine months period ended Quarter ended
31 March 31 March
------------------------------------------------- (Rupees in '000) -------------------------------------------------
For UBL Fund Managers Limited
(Management Company)
SD SD SD
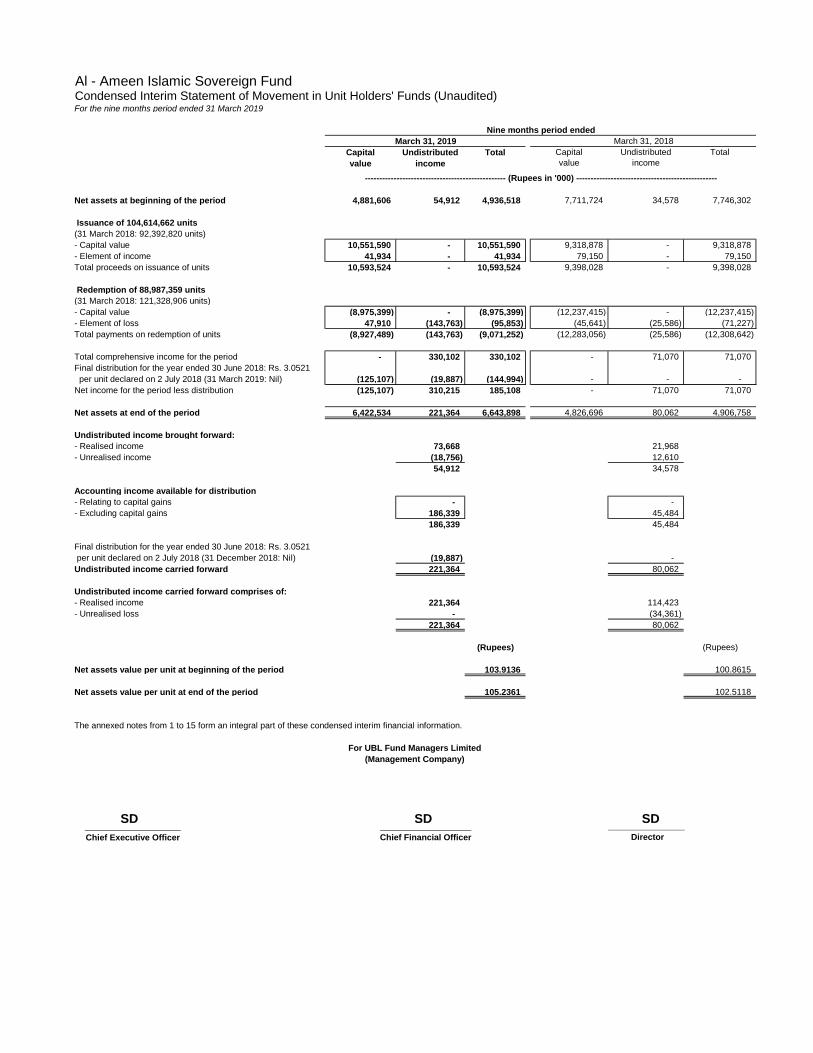
Al - Ameen Islamic Sovereign FundCondensed Interim Statement of Movement in Unit Holders' Funds (Unaudited)For the nine months period ended 31 March 2019
Capital
value
Undistributed
income
Total Capital
value
Undistributed
income
Total
Net assets at beginning of the period 4,881,606 54,912 4,936,518 7,711,724 34,578 7,746,302
Issuance of 104,614,662 units
(31 March 2018: 92,392,820 units)
- Capital value 10,551,590 - 10,551,590 9,318,878 - 9,318,878
- Element of income 41,934 - 41,934 79,150 - 79,150
Total proceeds on issuance of units 10,593,524 - 10,593,524 9,398,028 - 9,398,028
Redemption of 88,987,359 units
(31 March 2018: 121,328,906 units)
- Capital value (8,975,399) - (8,975,399) (12,237,415) - (12,237,415)
- Element of loss 47,910 (143,763) (95,853) (45,641) (25,586) (71,227)
Total payments on redemption of units (8,927,489) (143,763) (9,071,252) (12,283,056) (25,586) (12,308,642)
Total comprehensive income for the period - 330,102 330,102 - 71,070 71,070
Final distribution for the year ended 30 June 2018: Rs. 3.0521
per unit declared on 2 July 2018 (31 March 2019: Nil) (125,107) (19,887) (144,994) - - -
Net income for the period less distribution (125,107) 310,215 185,108 - 71,070 71,070
Net assets at end of the period 6,422,534 221,364 6,643,898 4,826,696 80,062 4,906,758
Undistributed income brought forward:
- Realised income 73,668 21,968
- Unrealised income (18,756) 12,610
54,912 34,578
Accounting income available for distribution
- Relating to capital gains - -
- Excluding capital gains 186,339 45,484
186,339 45,484
Final distribution for the year ended 30 June 2018: Rs. 3.0521
per unit declared on 2 July 2018 (31 December 2018: Nil) (19,887) -
Undistributed income carried forward 221,364 80,062
Undistributed income carried forward comprises of:
- Realised income 221,364 114,423
- Unrealised loss - (34,361)
221,364 80,062
(Rupees) (Rupees)
Net assets value per unit at beginning of the period 103.9136 100.8615
Net assets value per unit at end of the period 105.2361 102.5118
The annexed notes from 1 to 15 form an integral part of these condensed interim financial information.
____________________ ________________
Chief Executive Officer Director
___________________
Chief Financial Officer
Nine months period ended
March 31, 2019
------------------------------------------------- (Rupees in '000) -------------------------------------------------
For UBL Fund Managers Limited
(Management Company)
March 31, 2018
SD SD SD
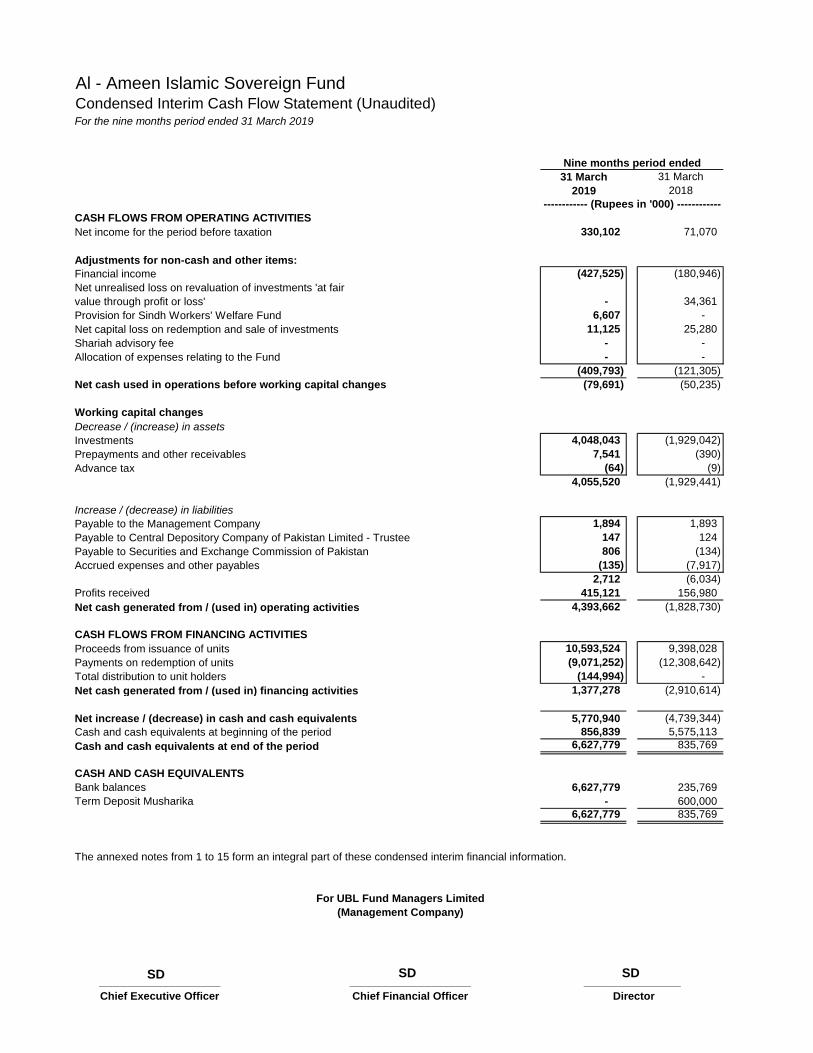
Al - Ameen Islamic Sovereign FundCondensed Interim Cash Flow Statement (Unaudited)For the nine months period ended 31 March 2019
31 March 31 March
2019 2018
CASH FLOWS FROM OPERATING ACTIVITIES
Net income for the period before taxation 330,102 71,070
Adjustments for non-cash and other items:
Financial income (427,525) (180,946)
Net unrealised loss on revaluation of investments 'at fair
value through profit or loss' - 34,361
Provision for Sindh Workers' Welfare Fund 6,607 -
Net capital loss on redemption and sale of investments 11,125 25,280
Shariah advisory fee - -
Allocation of expenses relating to the Fund - -
(409,793) (121,305)
Net cash used in operations before working capital changes (79,691) (50,235)
Working capital changes
Decrease / (increase) in assets
Investments 4,048,043 (1,929,042)
Prepayments and other receivables 7,541 (390)
Advance tax (64) (9)
4,055,520 (1,929,441)
Increase / (decrease) in liabilities
Payable to the Management Company 1,894 1,893
Payable to Central Depository Company of Pakistan Limited - Trustee 147 124
Payable to Securities and Exchange Commission of Pakistan 806 (134)
Accrued expenses and other payables (135) (7,917)
2,712 (6,034)
Profits received 415,121 156,980
Net cash generated from / (used in) operating activities 4,393,662 (1,828,730)
CASH FLOWS FROM FINANCING ACTIVITIES
Proceeds from issuance of units 10,593,524 9,398,028
Payments on redemption of units (9,071,252) (12,308,642)
Total distribution to unit holders (144,994) -
Net cash generated from / (used in) financing activities 1,377,278 (2,910,614)
Net increase / (decrease) in cash and cash equivalents 5,770,940 (4,739,344)
Cash and cash equivalents at beginning of the period 856,839 5,575,113
Cash and cash equivalents at end of the period 6,627,779 835,769
CASH AND CASH EQUIVALENTS
Bank balances 6,627,779 235,769
Term Deposit Musharika - 600,000
6,627,779 835,769
The annexed notes from 1 to 15 form an integral part of these condensed interim financial information.
____________________ ____________________ ________________
Chief Executive Officer Chief Financial Officer Director
Nine months period ended
------------ (Rupees in '000) ------------
For UBL Fund Managers Limited
(Management Company)
SD SD SD
Al - Ameen Islamic Sovereign FundNotes to the Condensed Interim Financial Information (Unaudited)For the nine months period ended 31 March 2019
1. LEGAL STATUS AND NATURE OF BUSINESS
The Fund has been rated as AA-(f) by JCR - VIS on 31 December 2018.
2. BASIS OF PREPARATION
2.1 Statement of compliance
2.1.1 These condensed interim financial information have been prepared in accordance with the accounting and reporting standards as
applicable in Pakistan. The accounting and reporting standards applicable in Pakistan comprise of:
- International Financial Reporting Standards (IFRS Standards) issued by the International Accounting Standards Board (IASB) as
notified under the Companies Act, 2017;
- Provisions of and directives issued under the Companies Act, 2017 along with part VIIIA of the repealed Companies Ordinance,
1984; and
- Non-Banking Finance Companies (Establishment and Regulations) Rules, 2003 (the NBFC Rules), Non-Banking Finance
Companies and Notified Entities Regulations, 2008 (the NBFC Regulations).
Where provisions of and directives issued under the Companies Act, 2017, part VIIIA of the repealed Companies Ordinance, 1984,
the NBFC Rules and the NBFC Regulations differ from the IFRS Standards, the provisions of and directives issued under the
Companies Act, 2017, part VIIIA of the repealed Companies Ordinance, 1984, the NBFC Rules and the NBFC Regulations have been
followed.
2.1.2 The disclosures made in this condensed interim financial information have, however, been limited based on the requirements of
International Accounting Standard 34: 'Interim Financial Reporting'. This condensed interim financial information does not include all
the information and disclosures required in a full set of financial statements and should be read in conjunction with the annual
published audited financial statements of the Fund for the year ended 30 June 2018.
2.1.3 These condensed interim financial information are unaudited and are being submitted to the unit holders as required under Regulation
38(2)(f) of the Non-Banking Finance Companies and Notified Entities Regulations, 2008 (the NBFC Regulations). However, a limited
scope review has been carried out by the auditors in accordance with the requirements of clause (xix) of the Code of Corporate
Governance issued by the Securities and Exchange Commission of Pakistan.
2.1.4
JCR-VIS Credit Rating Company has re-affirmed quality rating of 'AM1' (stable outlook) to the Management Company as on 27 December
2018.
Al-Ameen Islamic Sovereign Fund (the Fund), was established under the Trust Deed executed between UBL Fund Managers Limited (the
Management Company - a wholly owned subsidiary company of United Bank Limited), as the Management Company, and the Central
Depository Company of Pakistan Limited (CDC) as the Trustee. The Trust Deed was executed on 25 August 2010 and was approved by the
Securities and Exchange Commission of Pakistan (SECP) on 17 September 2010 in accordance with the requirements of the Non-Banking
Finance Companies (Establishment and Regulation) Rules, 2003 (NBFC Rules). The Fund commenced its operations from 7 November 2010.
The comparative statement of asset and liabilities presented in this condensed interim financial information has been extracted from the
annual audited financial statements of the Fund for the year ended June 30, 2018, whereas the comparative condensed interim income
statement, condensed interim statement of comprehensive income, condensed interim statement of cash flows, condensed interim statement
of movement in unit holders‟ fund are extracted from the unaudited condensed interim financial statements for the period ended March 31,
2018.
The Management Company of the Fund is registered with the SECP as a Non-Banking Finance Company under the NBFC Rules, 2003. The
registered office of the Management Company is situated at 4th Floor, STSM Building, Beaumount Road, Civil Lines, Karachi.
The Fund is an open ended mutual fund and is listed on the Pakistan Stock Exchange Limited. Units are offered for subscription on a
continuous basis to general public. The units are transferable and can be redeemed by surrendering them to the Fund at the option of the unit
holders.
Title to the assets of the Fund are held in the name of the Central Depository Company of Pakistan Limited as the Trustee of the Fund.
The investment objective of the fund is to provide a competitive rate of return with a moderate level of risk to its investors by investing in
designated authorised investments approved by the Shariah Advisory Board.
2.1.5 In compliance with Schedule V of the Non-Banking Finance Companies and Notified Entities Regulations, 2008, the directors of the
Management Company declare that this condensed interim financial information give a true and fair view of the state of the Fund‟s
affairs as at 31 March 2019.
2.1.6 Standards, interpretations and amendments to published approved accounting standards that are not yet effective
There are certain amendments which are effective from annual period beginning on or after 1 July 2019. These amendments are
not likely to have an impact on the Fund's financial position. Therefore these are not stated in this condensed interim financial
information.
3. SUMMARY OF SIGNIFICANT ACCOUNTING POLICIES, ESTIMATES AND JUDGEMENTS
3.1 Except as described below, the accounting policies applied in this condensed interim financial information are the same as those
applied in the preparation of the annual financial statements of the Fund for the year ended 30 June 2018.
3.2 Securities and Exchange Commission of Pakistan (SECP) vide its SRO. 229 (I)/2019 has modified the effective date for applicability of
IFRS 9 'Financial Instruments', however the Fund has opted for early adoption of the said standard from 1 July 2018 as permitted. The
Fund also adopted IFRS 15 „Revenue from contracts with customers‟ from 1 July 2018. A number of other new standards are effective
from 1 July 2018 but they do not have a material effect on the Fund's financial information.
3.3 IFRS 9 sets out requirements for recognising and measuring financial assets, financial liabilities and some contracts to buy or sell
non-financial items. This standard replaces IAS 39 Financial Instruments: Recognition and Measurement. The new standard brings
fundamental changes to the accounting for financial assets and to certain aspects of the accounting for financial liabilities. As a result
of adoption of IFRS 9, the Fund has adopted consequential amendments to IAS 1 Presentation of Financial statements', which
requires separate presentation in the income statement and statement of comprehensive income, profit / markup calculated using the
effective interest method.
3.4 The adoption of IFRS 15 did not impact the timing or amount of dividend, profit, markup and other investment income and related
assets and liabilities recognised by the fund. Accordingly, there is no impact on comparative information.
3.5 The details of new significant accounting policies and the nature and effect of the changes to previous accounting policies are set out
below.
i. Classification and measurement of financial assets and financial liabilities
IFRS 9 contains three principal classification categories for financial assets: measured at amortised cost, fair value through other
comprehensive income (FVOCI) and fair value through profit or loss (FVTPL).
IFRS 9 classification is generally based on the business model in which a financial asset is managed and its contractual cash flows.
The standard eliminates the previous IAS 39 categories of held to maturity, loans and receivables and available for sale.
IFRS 9 largely retains the existing requirements in IAS 39 for the classification and measurement of financial liabilities.
The adoption of IFRS 9 did not have a significant effect on the Fund‟s accounting policies related to financial liabilities. The impact of
IFRS 9 on the classification and measurement of financial assets is set out below:
The following assessments have been made on the basis of the facts and circumstances that existed at the date of initial application:
- The determination of business model within which a financial asset is held
- The designation and revocation of previous designation of certain financial assets as measured at FVTPL.
A financial asset is measured at amortised cost if it meets both of the following conditions and is not designated as at FVTPL:
- it is held within a business model whose objective is to hold assets to collect contractual cash flows; and
- its contractual terms give rise on specified dates to cash flows that are solely payments of principal and interest on the principal
amount outstanding.
A debt investment is measured at FVOCI if it meets both of the following conditions and is not designated as at FVTPL:
- it is held within a business model whose objective is achieved by both collecting contractual cash flows and selling financial
assets; and
- its contractual terms give rise on specified dates to cash flows that are solely payments of principal and interest on the principal
amount outstanding.
All financial assets not classified as measured at amortised cost or FVOCI as described above are measured at FVTPL. On initial
recognition, the Fund may irrevocably designate a financial asset that otherwise meets the requirements to be measured at amortised
cost or at FVOCI as at FVTPL if doing so eliminates or significantly reduces an accounting mismatch that would otherwise arise.
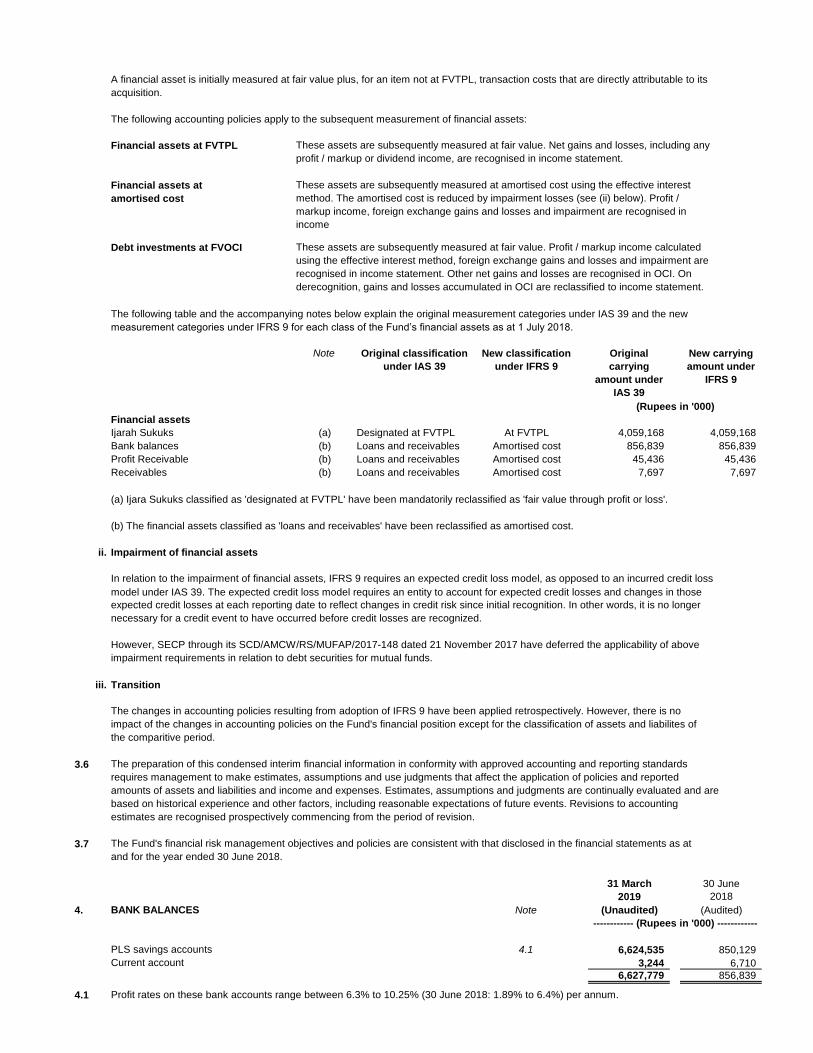
A financial asset is initially measured at fair value plus, for an item not at FVTPL, transaction costs that are directly attributable to its
acquisition.
The following accounting policies apply to the subsequent measurement of financial assets:
Financial assets at FVTPL These assets are subsequently measured at fair value. Net gains and losses, including any
profit / markup or dividend income, are recognised in income statement.
Financial assets at These assets are subsequently measured at amortised cost using the effective interest
amortised cost method. The amortised cost is reduced by impairment losses (see (ii) below). Profit /
markup income, foreign exchange gains and losses and impairment are recognised in
income
statement.Debt investments at FVOCI These assets are subsequently measured at fair value. Profit / markup income calculated
using the effective interest method, foreign exchange gains and losses and impairment are
recognised in income statement. Other net gains and losses are recognised in OCI. On
derecognition, gains and losses accumulated in OCI are reclassified to income statement.
The following table and the accompanying notes below explain the original measurement categories under IAS 39 and the new
measurement categories under IFRS 9 for each class of the Fund‟s financial assets as at 1 July 2018.
Note
(Rupees in '000)
Financial assets
Ijarah Sukuks (a) Designated at FVTPL At FVTPL 4,059,168 4,059,168
Bank balances (b) Loans and receivables Amortised cost 856,839 856,839
Profit Receivable (b) Loans and receivables Amortised cost 45,436 45,436
Receivables (b) Loans and receivables Amortised cost 7,697 7,697
(a) Ijara Sukuks classified as 'designated at FVTPL' have been mandatorily reclassified as 'fair value through profit or loss'.
(b) The financial assets classified as 'loans and receivables' have been reclassified as amortised cost.
ii. Impairment of financial assets
In relation to the impairment of financial assets, IFRS 9 requires an expected credit loss model, as opposed to an incurred credit loss
model under IAS 39. The expected credit loss model requires an entity to account for expected credit losses and changes in those
expected credit losses at each reporting date to reflect changes in credit risk since initial recognition. In other words, it is no longer
necessary for a credit event to have occurred before credit losses are recognized.
However, SECP through its SCD/AMCW/RS/MUFAP/2017-148 dated 21 November 2017 have deferred the applicability of above
impairment requirements in relation to debt securities for mutual funds.
iii. Transition
The changes in accounting policies resulting from adoption of IFRS 9 have been applied retrospectively. However, there is no
impact of the changes in accounting policies on the Fund's financial position except for the classification of assets and liabilites of
the comparitive period.
3.6 The preparation of this condensed interim financial information in conformity with approved accounting and reporting standards
requires management to make estimates, assumptions and use judgments that affect the application of policies and reported
amounts of assets and liabilities and income and expenses. Estimates, assumptions and judgments are continually evaluated and are
based on historical experience and other factors, including reasonable expectations of future events. Revisions to accounting
estimates are recognised prospectively commencing from the period of revision.
3.7 The Fund's financial risk management objectives and policies are consistent with that disclosed in the financial statements as at
and for the year ended 30 June 2018.
31 March 30 June
2019 2018
4. BANK BALANCES Note (Unaudited) (Audited)
PLS savings accounts 4.1 6,624,535 850,129
Current account 3,244 6,710
6,627,779 856,839
4.1 Profit rates on these bank accounts range between 6.3% to 10.25% (30 June 2018: 1.89% to 6.4%) per annum.
------------ (Rupees in '000) ------------
New classification
under IFRS 9
Original
carrying
amount under
IAS 39
New carrying
amount under
IFRS 9
Original classification
under IAS 39

4.2 Circular No. 16 dated 07 July 2010 issued by the SECP requires details of investments not compliant with the investment criteria specified for the category assigned to open-end collective
investment schemes or the investment requirements of the constitutive 'documents of the Fund to be disclosed in the annual accounts of the Fund. The table below gives the details of such non
compliant investments.
Disclosure of excess exposure (per asset class) as at 31 March 2019
Name of investment Maximum exposure Quarter average Excess
Cash requirement 30% 88.55% 58.55%
31 March 30 June
5. INVESTMENTS 2019 2018
(Unaudited) (Audited)
Note
At fair value through profit or loss 5.1 - 4,059,168
5.1 At fair value through profit or loss - Government Securities
Note
Government of Pakistan
Ijarah Sukuk XVI - 3 years 24,340 16,550 (40,890) - - - 2,443,249 - -
Ijarah Sukuk XVII - 3 years 16,090 - (16,090) - - - 1,615,919 56.99% 26.56%
40,430 16,550 (56,980) - - - 4,059,168 56.99% 26.56%
5.1.1 The nominal value of each GOP Ijarah Sukuk is Rs.100,000.
5.2 Circular No. 16 dated 07 July 2010 issued by the SECP requires details of investments not compliant with the investment criteria specified for the category assigned to open-end collective
investment schemes or the investment requirements of the constitutive documents of the Fund to be disclosed in the annual accounts of the Fund. The table below gives the details of such non
compliant investments.
Disclosure of excess exposure (per asset class) as at 31 March 2019
Name of investment Required Quarter average Excess/(Short)
Government securities 70% 10.84% -59.16%
--------------------- (Number of Holdings) --------------------- ------------------ (Rupees in '000) ------------------
------------ (Rupees in '000) ------------
As at 01 July
2018
Purhased
during the
period
Sold / matured
during the
period
As at 31
March 2019
Carrying value
as at 31 March
2019
Market value
as at 31 March
2019
Market value
as at 30 June
2018
Percentage of
total
investments
Percentage of
net assets
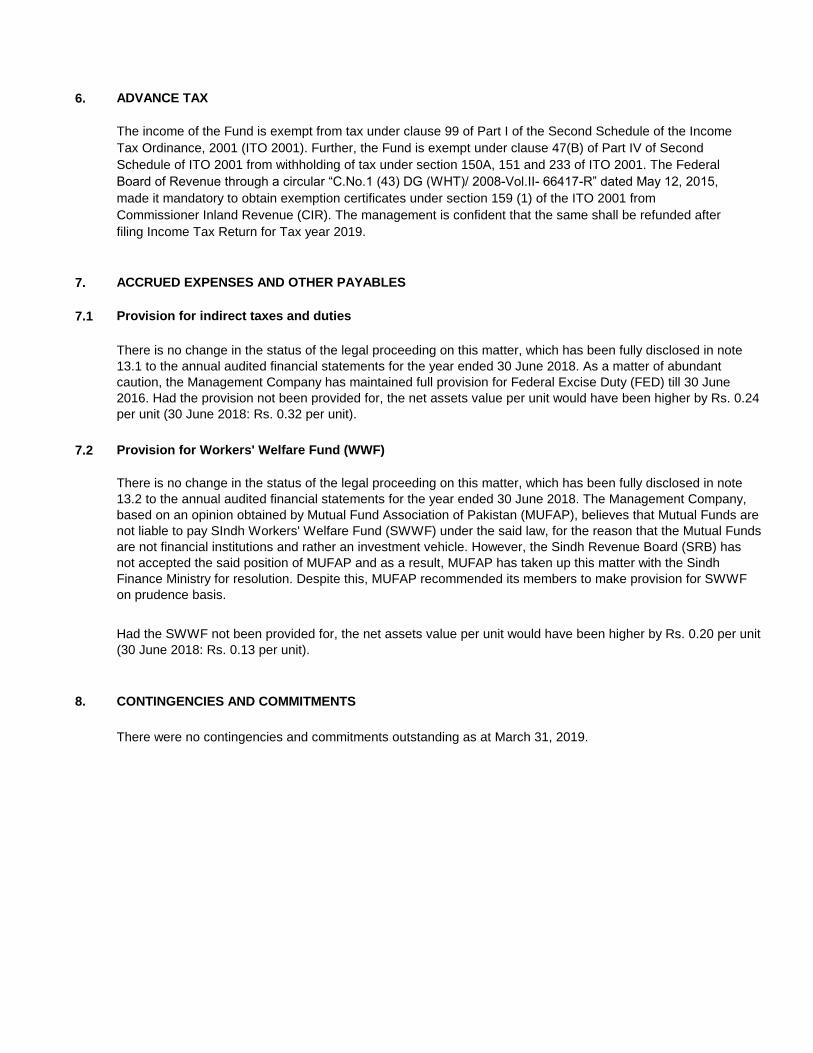
6. ADVANCE TAX
The income of the Fund is exempt from tax under clause 99 of Part I of the Second Schedule of the Income
Tax Ordinance, 2001 (ITO 2001). Further, the Fund is exempt under clause 47(B) of Part IV of Second
Schedule of ITO 2001 from withholding of tax under section 150A, 151 and 233 of ITO 2001. The Federal
Board of Revenue through a circular “C.No.1 (43) DG (WHT)/ 2008-Vol.II- 66417-R” dated May 12, 2015,
made it mandatory to obtain exemption certificates under section 159 (1) of the ITO 2001 from
Commissioner Inland Revenue (CIR). The management is confident that the same shall be refunded after
filing Income Tax Return for Tax year 2019.
7. ACCRUED EXPENSES AND OTHER PAYABLES
7.1 Provision for indirect taxes and duties
7.2 Provision for Workers' Welfare Fund (WWF)
8. CONTINGENCIES AND COMMITMENTS
There were no contingencies and commitments outstanding as at March 31, 2019.
There is no change in the status of the legal proceeding on this matter, which has been fully disclosed in note
13.1 to the annual audited financial statements for the year ended 30 June 2018. As a matter of abundant
caution, the Management Company has maintained full provision for Federal Excise Duty (FED) till 30 June
2016. Had the provision not been provided for, the net assets value per unit would have been higher by Rs. 0.24
per unit (30 June 2018: Rs. 0.32 per unit).
Had the SWWF not been provided for, the net assets value per unit would have been higher by Rs. 0.20 per unit
(30 June 2018: Rs. 0.13 per unit).
There is no change in the status of the legal proceeding on this matter, which has been fully disclosed in note
13.2 to the annual audited financial statements for the year ended 30 June 2018. The Management Company,
based on an opinion obtained by Mutual Fund Association of Pakistan (MUFAP), believes that Mutual Funds are
not liable to pay SIndh Workers' Welfare Fund (SWWF) under the said law, for the reason that the Mutual Funds
are not financial institutions and rather an investment vehicle. However, the Sindh Revenue Board (SRB) has
not accepted the said position of MUFAP and as a result, MUFAP has taken up this matter with the Sindh
Finance Ministry for resolution. Despite this, MUFAP recommended its members to make provision for SWWF
on prudence basis.
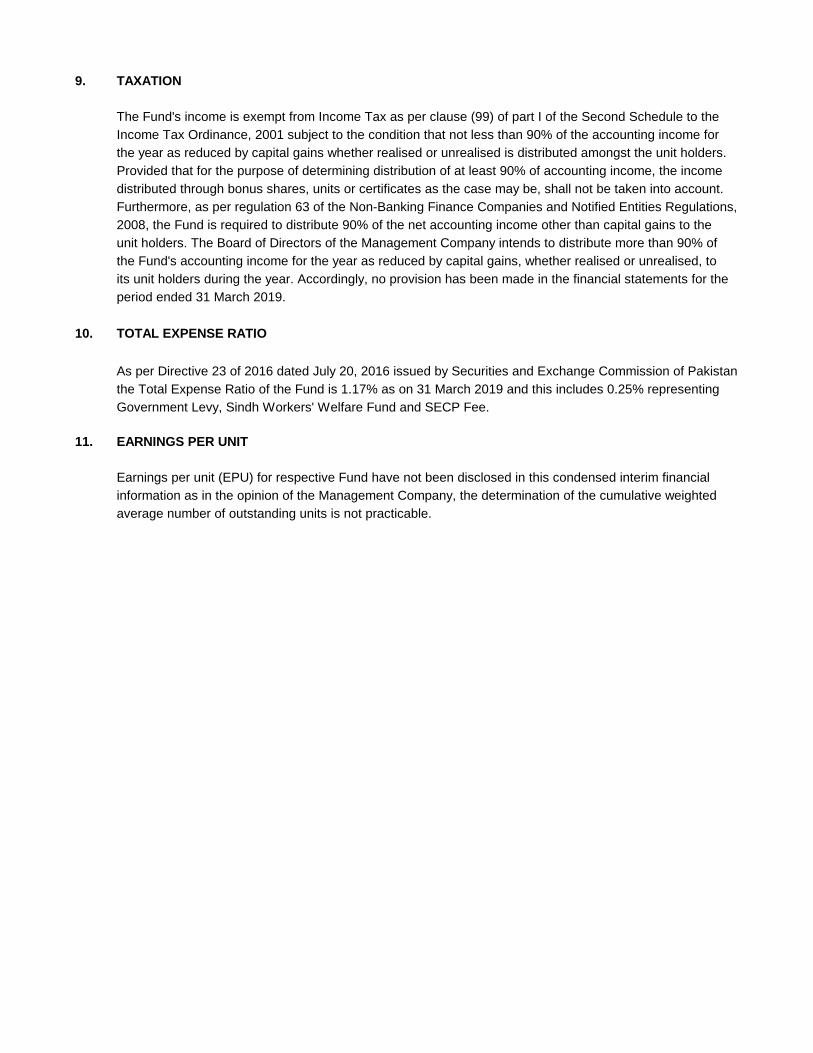
9. TAXATION
The Fund's income is exempt from Income Tax as per clause (99) of part I of the Second Schedule to the
Income Tax Ordinance, 2001 subject to the condition that not less than 90% of the accounting income for
the year as reduced by capital gains whether realised or unrealised is distributed amongst the unit holders.
Provided that for the purpose of determining distribution of at least 90% of accounting income, the income
distributed through bonus shares, units or certificates as the case may be, shall not be taken into account.
Furthermore, as per regulation 63 of the Non-Banking Finance Companies and Notified Entities Regulations,
2008, the Fund is required to distribute 90% of the net accounting income other than capital gains to the
unit holders. The Board of Directors of the Management Company intends to distribute more than 90% of
the Fund's accounting income for the year as reduced by capital gains, whether realised or unrealised, to
its unit holders during the year. Accordingly, no provision has been made in the financial statements for the
period ended 31 March 2019.
10. TOTAL EXPENSE RATIO
As per Directive 23 of 2016 dated July 20, 2016 issued by Securities and Exchange Commission of Pakistan
the Total Expense Ratio of the Fund is 1.17% as on 31 March 2019 and this includes 0.25% representing
Government Levy, Sindh Workers' Welfare Fund and SECP Fee.
11. EARNINGS PER UNIT
Earnings per unit (EPU) for respective Fund have not been disclosed in this condensed interim financial
information as in the opinion of the Management Company, the determination of the cumulative weighted
average number of outstanding units is not practicable.
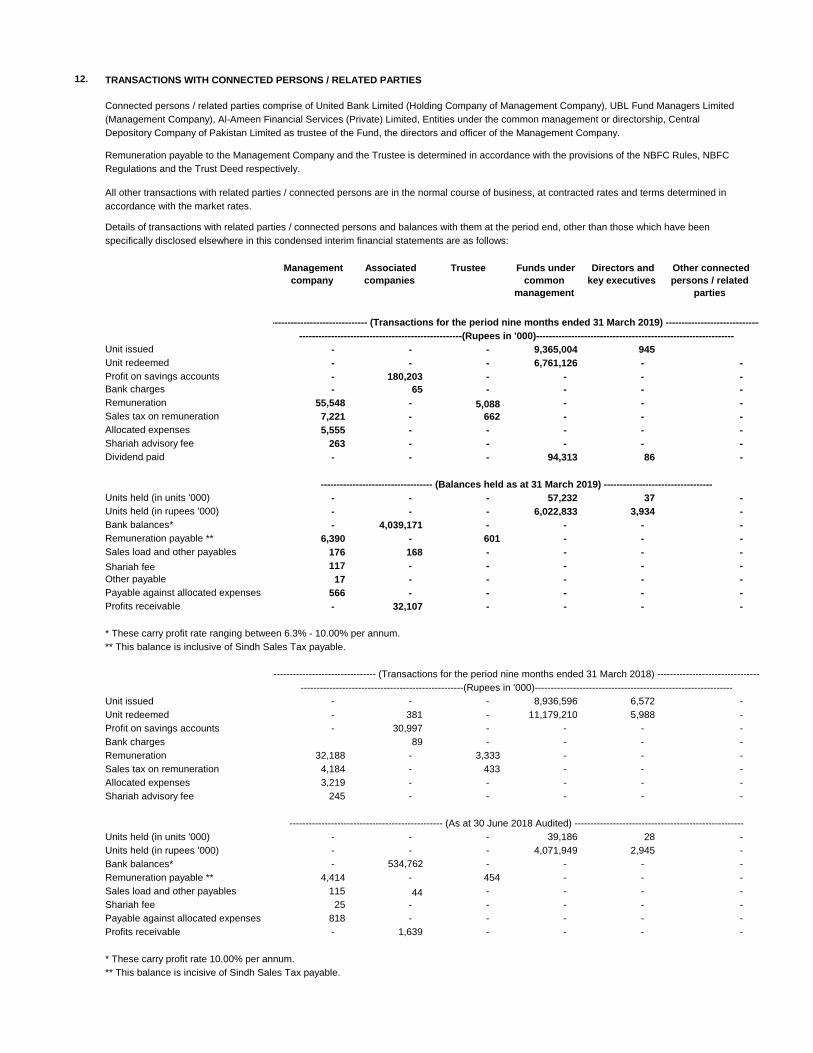
12. TRANSACTIONS WITH CONNECTED PERSONS / RELATED PARTIES
Connected persons / related parties comprise of United Bank Limited (Holding Company of Management Company), UBL Fund Managers Limited
(Management Company), Al-Ameen Financial Services (Private) Limited, Entities under the common management or directorship, Central
Depository Company of Pakistan Limited as trustee of the Fund, the directors and officer of the Management Company.
Remuneration payable to the Management Company and the Trustee is determined in accordance with the provisions of the NBFC Rules, NBFC
Regulations and the Trust Deed respectively.
All other transactions with related parties / connected persons are in the normal course of business, at contracted rates and terms determined in
accordance with the market rates.
Details of transactions with related parties / connected persons and balances with them at the period end, other than those which have been
specifically disclosed elsewhere in this condensed interim financial statements are as follows:
Unit issued - - - 9,365,004 945
Unit redeemed - - - 6,761,126 - -
Profit on savings accounts - 180,203 - - - -
Bank charges - 65 - - - -
Remuneration 55,548 - 5,088 - - -
Sales tax on remuneration 7,221 - 662 - - -
Allocated expenses 5,555 - - - - -
Shariah advisory fee 263 - - - - -
Dividend paid - - - 94,313 86 -
Units held (in units '000) - - - 57,232 37 -
Units held (in rupees '000) - - - 6,022,833 3,934 -
Bank balances* - 4,039,171 - - - -
Remuneration payable ** 6,390 - 601 - - -
Sales load and other payables 176 168 - - - -
Shariah fee 117 - - - - -
Other payable 17 - - - - -
Payable against allocated expenses 566 - - - - -
Profits receivable - 32,107 - - - -
* These carry profit rate ranging between 6.3% - 10.00% per annum.
** This balance is inclusive of Sindh Sales Tax payable.
Unit issued - - - 8,936,596 6,572 -
Unit redeemed - 381 - 11,179,210 5,988 -
Profit on savings accounts - 30,997 - - - -
Bank charges 89 - - - -
Remuneration 32,188 - 3,333 - - -
Sales tax on remuneration 4,184 - 433 - - -
Allocated expenses 3,219 - - - - -
Shariah advisory fee 245 - - - - -
Units held (in units '000) - - - 39,186 28 -
Units held (in rupees '000) - - - 4,071,949 2,945 -
Bank balances* - 534,762 - - - -
Remuneration payable ** 4,414 - 454 - - -
Sales load and other payables 115 44 - - - -
Shariah fee 25 - - - - -
Payable against allocated expenses 818 - - - - -
Profits receivable - 1,639 - - - -
* These carry profit rate 10.00% per annum.
** This balance is incisive of Sindh Sales Tax payable.
------------------------------------------------ (As at 30 June 2018 Audited) -----------------------------------------------------
Management
company
Associated
companies
Trustee Funds under
common
management
Directors and
key executives
Other connected
persons / related
parties
------------------------------------- (Transactions for the period nine months ended 31 March 2019) -------------------------------------
---------------------------------------------------(Rupees in '000)--------------------------------------------------------------
----------------------------------- (Balances held as at 31 March 2019) ----------------------------------
------------------------------------- (Transactions for the period nine months ended 31 March 2018) -------------------------------------
---------------------------------------------------(Rupees in '000)--------------------------------------------------------------
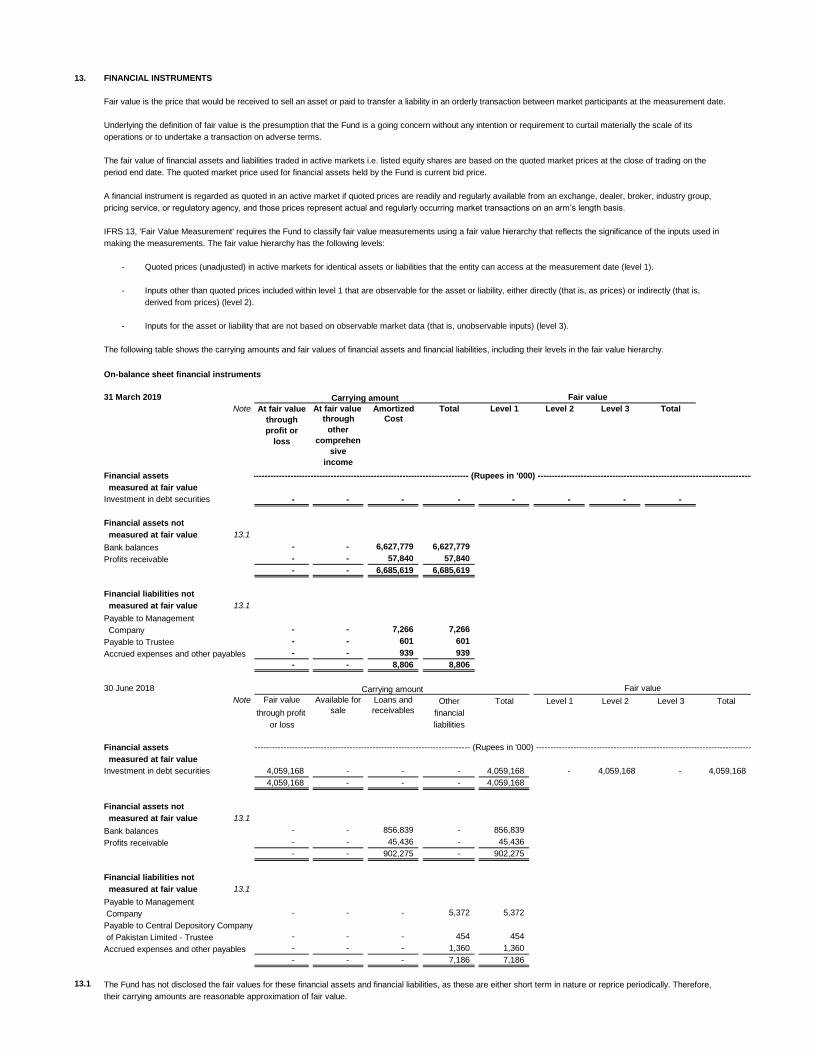
13. FINANCIAL INSTRUMENTS
Fair value is the price that would be received to sell an asset or paid to transfer a liability in an orderly transaction between market participants at the measurement date.
Underlying the definition of fair value is the presumption that the Fund is a going concern without any intention or requirement to curtail materially the scale of its
operations or to undertake a transaction on adverse terms.
The fair value of financial assets and liabilities traded in active markets i.e. listed equity shares are based on the quoted market prices at the close of trading on the
period end date. The quoted market price used for financial assets held by the Fund is current bid price.
A financial instrument is regarded as quoted in an active market if quoted prices are readily and regularly available from an exchange, dealer, broker, industry group,
pricing service, or regulatory agency, and those prices represent actual and regularly occurring market transactions on an arm‟s length basis.
IFRS 13, 'Fair Value Measurement' requires the Fund to classify fair value measurements using a fair value hierarchy that reflects the significance of the inputs used in
making the measurements. The fair value hierarchy has the following levels:
- Quoted prices (unadjusted) in active markets for identical assets or liabilities that the entity can access at the measurement date (level 1).
- Inputs other than quoted prices included within level 1 that are observable for the asset or liability, either directly (that is, as prices) or indirectly (that is,
derived from prices) (level 2).
- Inputs for the asset or liability that are not based on observable market data (that is, unobservable inputs) (level 3).
The following table shows the carrying amounts and fair values of financial assets and financial liabilities, including their levels in the fair value hierarchy.
On-balance sheet financial instruments
31 March 2019
Note At fair value Amortized Total Level 1 Level 2 Level 3 Total
through Cost
other
comprehen
sive
income
Financial assets
measured at fair value
Investment in debt securities - - - - - - - -
Financial assets not
measured at fair value 13.1
Bank balances - - 6,627,779 6,627,779
Profits receivable - - 57,840 57,840
- - 6,685,619 6,685,619
Financial liabilities not
measured at fair value 13.1
Payable to Management
Company - - 7,266 7,266
Payable to Trustee - - 601 601
Accrued expenses and other payables - - 939 939
- - 8,806 8,806
30 June 2018
Note Fair value
through profit Other Total Level 1 Level 2 Level 3 Total
through profit financial
or loss liabilities
Financial assets
measured at fair value
Investment in debt securities 4,059,168 - - - 4,059,168 - 4,059,168 - 4,059,168
4,059,168 - - - 4,059,168
Financial assets not
measured at fair value 13.1
Bank balances - - 856,839 - 856,839
Profits receivable - - 45,436 - 45,436
- - 902,275 - 902,275
Financial liabilities not
measured at fair value 13.1
Payable to Management
Company - - - 5,372 5,372
Payable to Central Depository Company
of Pakistan Limited - Trustee - - - 454 454
Accrued expenses and other payables - - - 1,360 1,360
- - - 7,186 7,186
13.1 The Fund has not disclosed the fair values for these financial assets and financial liabilities, as these are either short term in nature or reprice periodically. Therefore,
their carrying amounts are reasonable approximation of fair value.
At fair value
through
profit or
loss
Carrying amount Fair value
------------------------------------------------------------------------------ (Rupees in '000) ------------------------------------------------------------------------------
------------------------------------------------------------------------------ (Rupees in '000) ------------------------------------------------------------------------------
Carrying amount Fair value
Available for
sale
Loans and
receivables
14. GENERAL
14.1
15. DATE OF AUTHORISATION FOR ISSUE
15.1 This condensed interim financial information was authorized for issue by Board of Directors of the
Management Company on A pril 2 9 , 2 0 1 9. .
_____________________ _________________
Chief Financial Officer Director
For UBL Fund Managers Limited
(Management Company)
_____________________
Chief Executive Officer
Figures have been rounded off to the nearest thousand of rupees unless otherwise stated.
SD SD SD
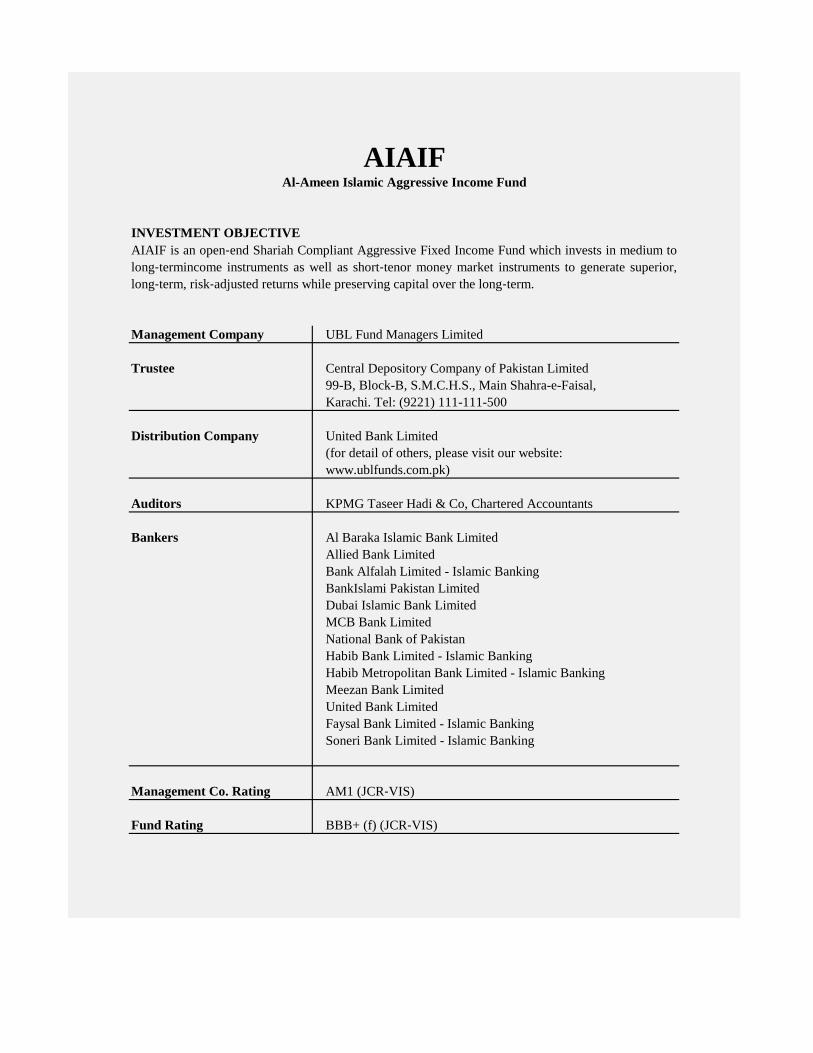
Management Company UBL Fund Managers Limited
Trustee Central Depository Company of Pakistan Limited
99-B, Block-B, S.M.C.H.S., Main Shahra-e-Faisal,
Karachi. Tel: (9221) 111-111-500
Distribution Company United Bank Limited
Auditors KPMG Taseer Hadi & Co, Chartered Accountants
Bankers Al Baraka Islamic Bank Limited
Allied Bank Limited
Bank Alfalah Limited - Islamic Banking
BankIslami Pakistan Limited
Dubai Islamic Bank Limited
MCB Bank Limited
National Bank of Pakistan
Habib Bank Limited - Islamic Banking
Habib Metropolitan Bank Limited - Islamic Banking
Meezan Bank Limited
United Bank Limited
Faysal Bank Limited - Islamic Banking
Soneri Bank Limited - Islamic Banking
Management Co. Rating AM1 (JCR‐VIS)
Fund Rating BBB+ (f) (JCR‐VIS)
AIAIFAl-Ameen Islamic Aggressive Income Fund
INVESTMENT OBJECTIVE
AIAIF is an open‐end Shariah Compliant Aggressive Fixed Income Fund which invests in medium to
long‐termincome instruments as well as short‐tenor money market instruments to generate superior,
long‐term, risk‐adjusted returns while preserving capital over the long‐term.
(for detail of others, please visit our website:
www.ublfunds.com.pk)
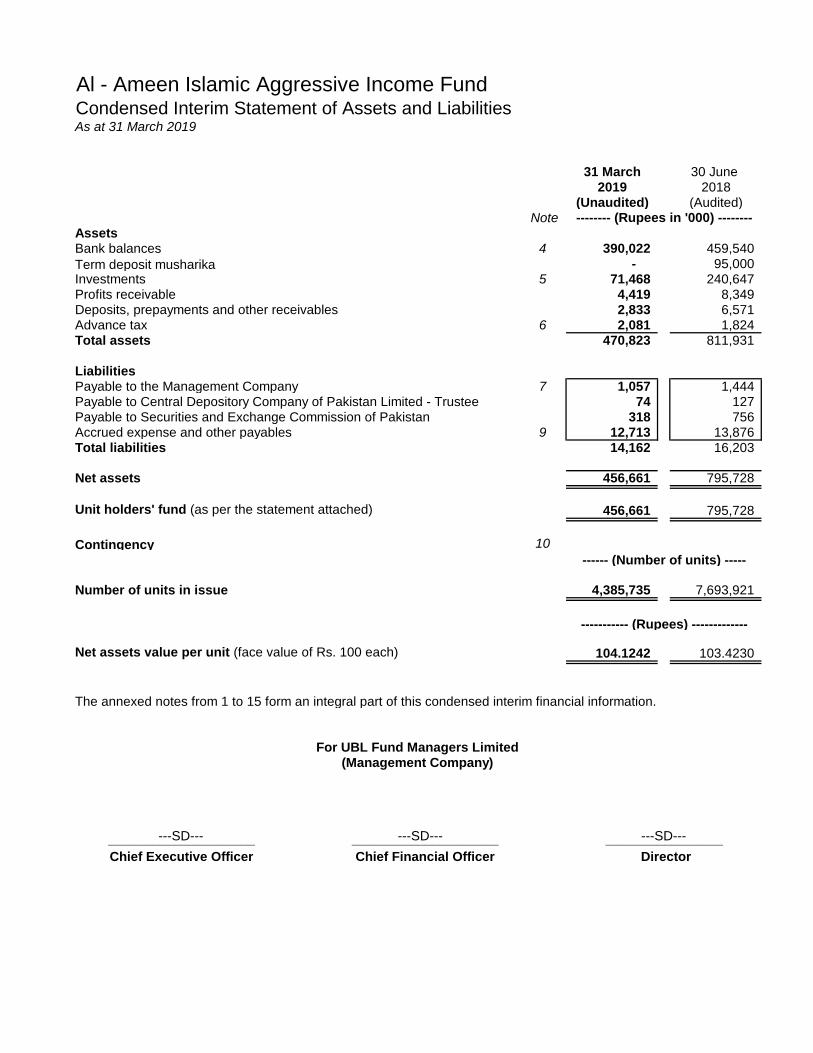
Al - Ameen Islamic Aggressive Income FundCondensed Interim Statement of Assets and Liabilities As at 31 March 2019
31 March 30 June
2019 2018(Unaudited) (Audited)
Note
AssetsBank balances 4 390,022 459,540
Term deposit musharika - 95,000 Investments 5 71,468 240,647 Profits receivable 4,419 8,349 Deposits, prepayments and other receivables 2,833 6,571 Advance tax 6 2,081 1,824 Total assets 470,823 811,931
LiabilitiesPayable to the Management Company 7 1,057 1,444 Payable to Central Depository Company of Pakistan Limited - Trustee 74 127 Payable to Securities and Exchange Commission of Pakistan 318 756 Accrued expense and other payables 9 12,713 13,876 Total liabilities 14,162 16,203
Net assets 456,661 795,728
Unit holders' fund (as per the statement attached) 456,661 795,728
Contingency 10
Number of units in issue 4,385,735 7,693,921
Net assets value per unit (face value of Rs. 100 each) 104.1242 103.4230
The annexed notes from 1 to 15 form an integral part of this condensed interim financial information.
____________________ ____________________ ________________
Chief Executive Officer Chief Financial Officer Director
(Management Company)
-------- (Rupees in '000) --------
------ (Number of units) -----
----------- (Rupees) -------------
For UBL Fund Managers Limited
---SD--- ---SD--- ---SD---
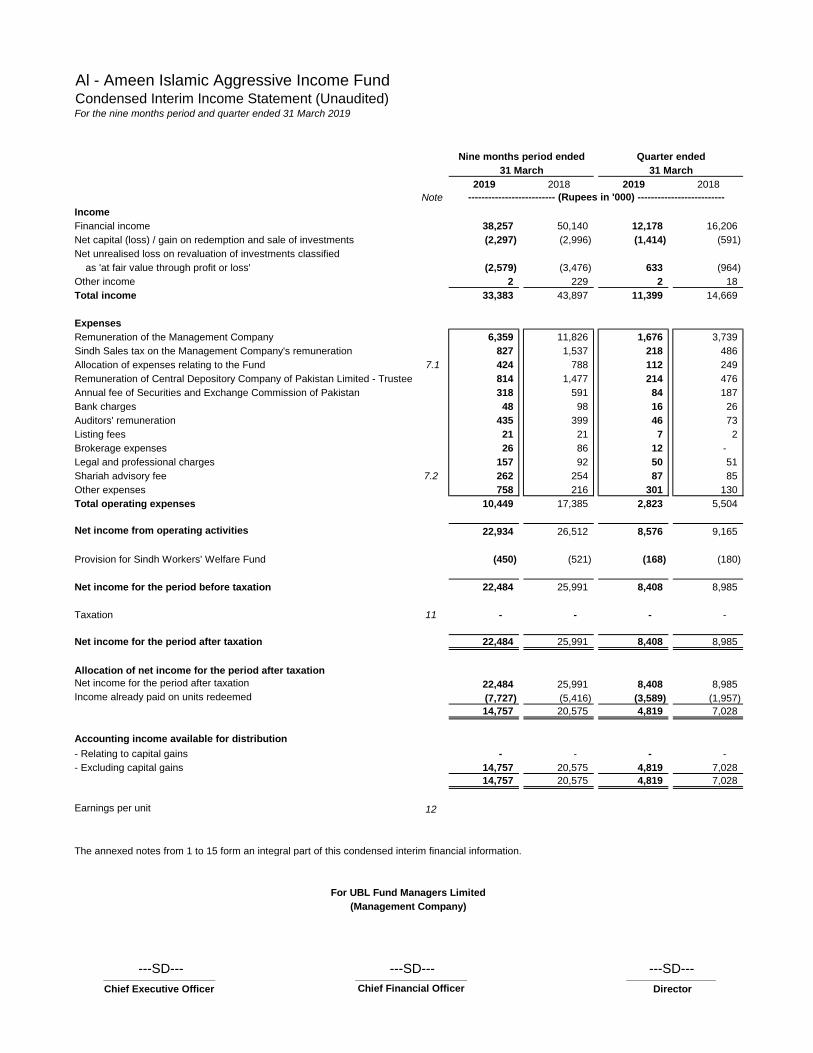
Al - Ameen Islamic Aggressive Income FundCondensed Interim Income Statement (Unaudited)For the nine months period and quarter ended 31 March 2019
2019 2018 2019 2018
Note
Income
Financial income 38,257 50,140 12,178 16,206
Net capital (loss) / gain on redemption and sale of investments (2,297) (2,996) (1,414) (591)
Net unrealised loss on revaluation of investments classified
as 'at fair value through profit or loss' (2,579) (3,476) 633 (964)
Other income 2 229 2 18
Total income 33,383 43,897 11,399 14,669
Expenses
Remuneration of the Management Company 6,359 11,826 1,676 3,739
Sindh Sales tax on the Management Company's remuneration 827 1,537 218 486
Allocation of expenses relating to the Fund 7.1 424 788 112 249
Remuneration of Central Depository Company of Pakistan Limited - Trustee 814 1,477 214 476
Annual fee of Securities and Exchange Commission of Pakistan 318 591 84 187
Bank charges 48 98 16 26
Auditors' remuneration 435 399 46 73
Listing fees 21 21 7 2
Brokerage expenses 26 86 12 -
Legal and professional charges 157 92 50 51
Shariah advisory fee 7.2 262 254 87 85
Other expenses 758 216 301 130
Total operating expenses 10,449 17,385 2,823 5,504
Net income from operating activities 22,934 26,512 8,576 9,165
Provision for Sindh Workers' Welfare Fund (450) (521) (168) (180)
Net income for the period before taxation 22,484 25,991 8,408 8,985
Taxation 11 - - - -
Net income for the period after taxation 22,484 25,991 8,408 8,985
Allocation of net income for the period after taxation
Net income for the period after taxation 22,484 25,991 8,408 8,985
Income already paid on units redeemed (7,727) (5,416) (3,589) (1,957)
14,757 20,575 4,819 7,028
Accounting income available for distribution
- Relating to capital gains - - - -
- Excluding capital gains 14,757 20,575 4,819 7,028
14,757 20,575 4,819 7,028
Earnings per unit 12
The annexed notes from 1 to 15 form an integral part of this condensed interim financial information.
____________________ ________________
Chief Executive Officer DirectorChief Financial Officer
-------------------------- (Rupees in '000) --------------------------
For UBL Fund Managers Limited
(Management Company)
Nine months period ended Quarter ended
31 March 31 March
____________________---SD--- ---SD--- ---SD---
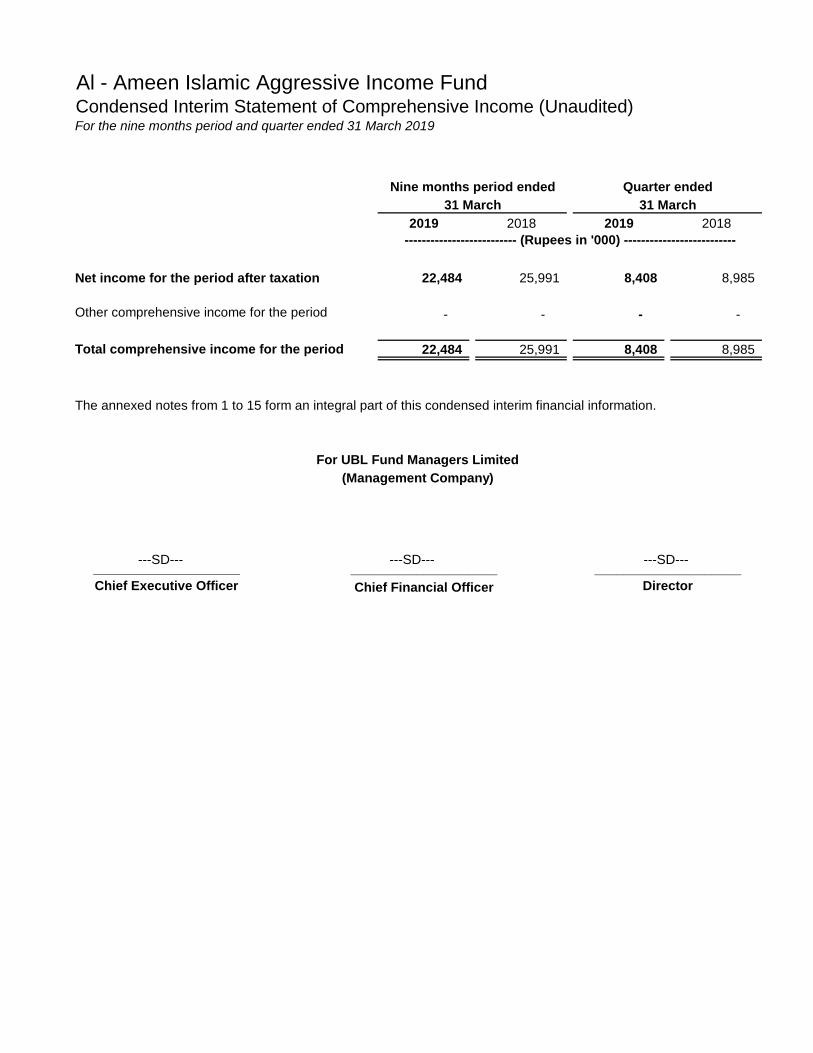
Al - Ameen Islamic Aggressive Income FundCondensed Interim Statement of Comprehensive Income (Unaudited)For the nine months period and quarter ended 31 March 2019
2019 2018 2019 2018
Net income for the period after taxation 22,484 25,991 8,408 8,985
Other comprehensive income for the period - - - -
Total comprehensive income for the period 22,484 25,991 8,408 8,985
The annexed notes from 1 to 15 form an integral part of this condensed interim financial information.
____________________ ____________________
Chief Financial Officer Director
____________________
Chief Executive Officer
For UBL Fund Managers Limited
(Management Company)
Quarter endedNine months period ended
-------------------------- (Rupees in '000) --------------------------
31 March 31 March
---SD--- ---SD--- ---SD---
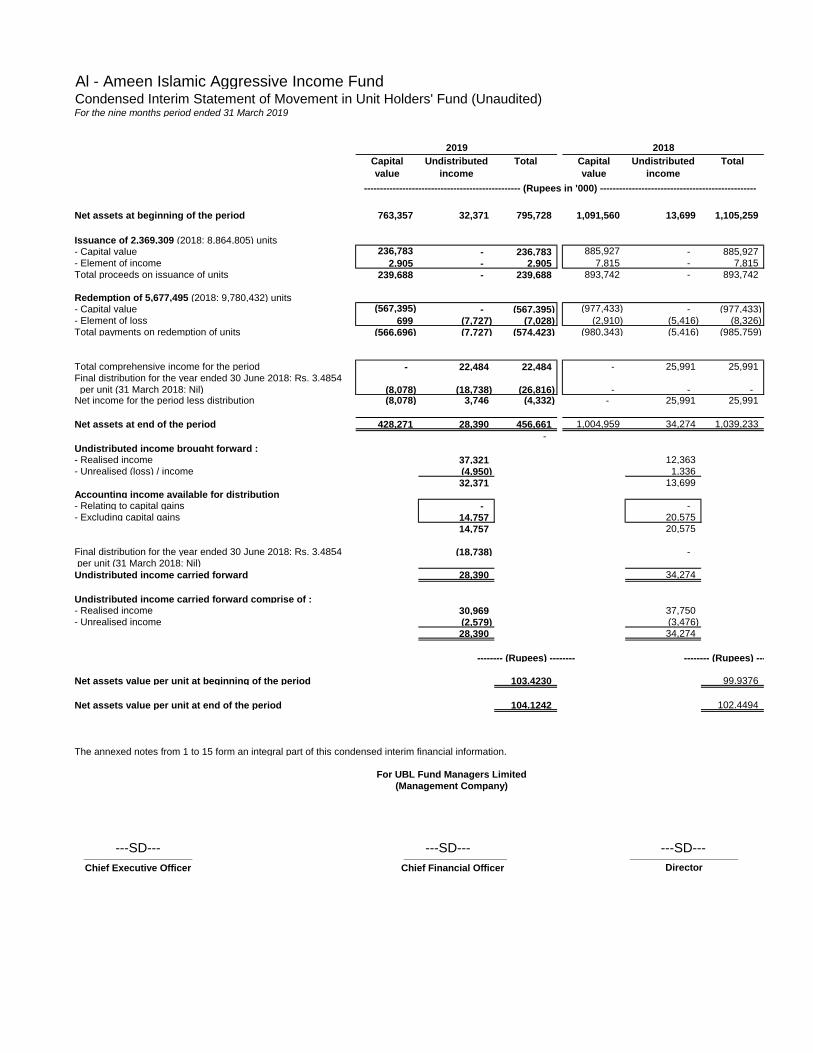
Al - Ameen Islamic Aggressive Income FundCondensed Interim Statement of Movement in Unit Holders' Fund (Unaudited)For the nine months period ended 31 March 2019
Capital
value
Undistributed
income
Total Capital
value
Undistributed
income
Total
Net assets at beginning of the period 763,357 32,371 795,728 1,091,560 13,699 1,105,259
Issuance of 2,369,309 (2018: 8,864,805) units- Capital value 236,783 - 236,783 885,927 - 885,927
- Element of income 2,905 - 2,905 7,815 - 7,815
Total proceeds on issuance of units 239,688 - 239,688 893,742 - 893,742
Redemption of 5,677,495 (2018: 9,780,432) units- Capital value (567,395) - (567,395) (977,433) - (977,433)
- Element of loss 699 (7,727) (7,028) (2,910) (5,416) (8,326)
Total payments on redemption of units (566,696) (7,727) (574,423) (980,343) (5,416) (985,759)
Total comprehensive income for the period - 22,484 22,484 - 25,991 25,991
Final distribution for the year ended 30 June 2018: Rs. 3.4854
per unit (31 March 2018: Nil) (8,078) (18,738) (26,816) - - - Net income for the period less distribution (8,078) 3,746 (4,332) - 25,991 25,991
Net assets at end of the period 428,271 28,390 456,661 1,004,959 34,274 1,039,233
-
Undistributed income brought forward :- Realised income 37,321 12,363
- Unrealised (loss) / income (4,950) 1,336
32,371 13,699
Accounting income available for distribution- Relating to capital gains - -
- Excluding capital gains 14,757 20,575
14,757 20,575
Final distribution for the year ended 30 June 2018: Rs. 3.4854 (18,738) -
per unit (31 March 2018: Nil)
Undistributed income carried forward 28,390 34,274
Undistributed income carried forward comprise of :- Realised income 30,969 37,750
- Unrealised income (2,579) (3,476)
28,390 34,274
-------- (Rupees) -------- -------- (Rupees) --------
Net assets value per unit at beginning of the period 103.4230 99.9376
Net assets value per unit at end of the period 104.1242 102.4494
The annexed notes from 1 to 15 form an integral part of this condensed interim financial information.
____________________ ___________________ ____________________
Chief Executive Officer Chief Financial Officer Director
2019
------------------------------------------------- (Rupees in '000) -------------------------------------------------
For UBL Fund Managers Limited
(Management Company)
2018
---SD--- ---SD--- ---SD---
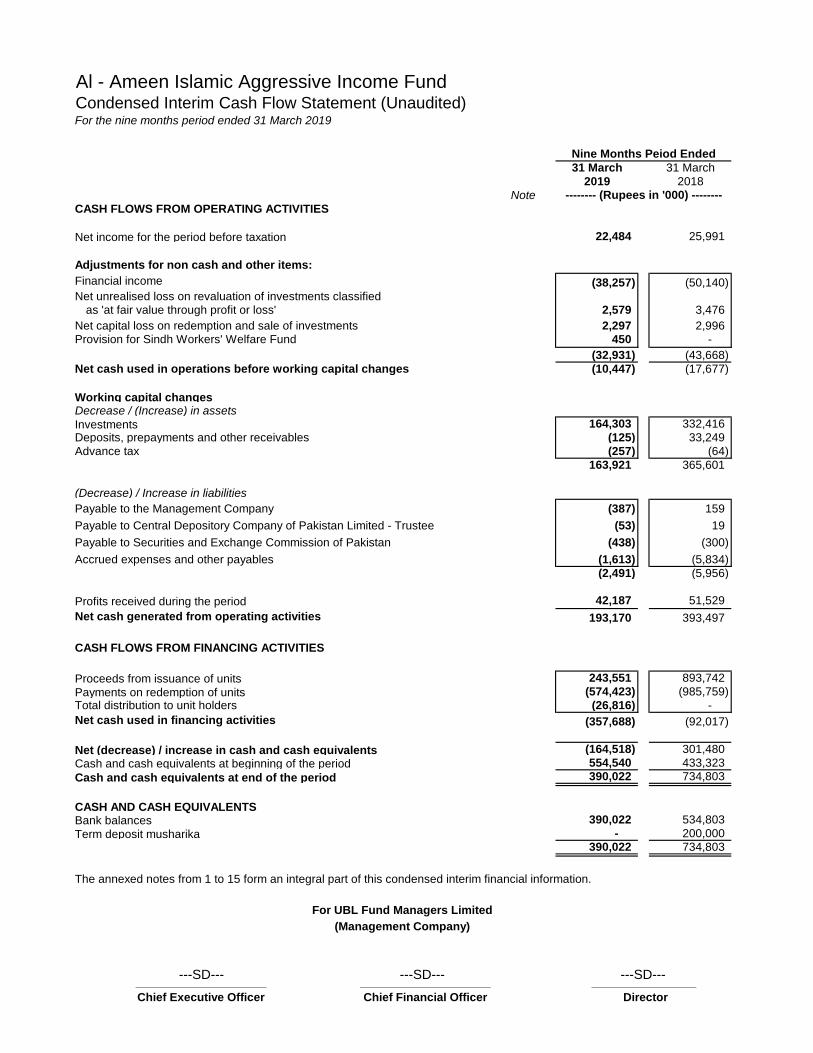
Al - Ameen Islamic Aggressive Income FundCondensed Interim Cash Flow Statement (Unaudited)For the nine months period ended 31 March 2019
31 March 31 March
2019 2018
Note
CASH FLOWS FROM OPERATING ACTIVITIES
Net income for the period before taxation 22,484 25,991
Adjustments for non cash and other items:
Financial income (38,257) (50,140)
Net unrealised loss on revaluation of investments classified as 'at fair value through profit or loss' 2,579 3,476
Net capital loss on redemption and sale of investments 2,297 2,996 Provision for Sindh Workers' Welfare Fund 450 -
(32,931) (43,668)
Net cash used in operations before working capital changes (10,447) (17,677)
Working capital changesDecrease / (Increase) in assets
Investments 164,303 332,416
Deposits, prepayments and other receivables (125) 33,249
Advance tax (257) (64)
163,921 365,601
(Decrease) / Increase in liabilities
Payable to the Management Company (387) 159
Payable to Central Depository Company of Pakistan Limited - Trustee (53) 19
Payable to Securities and Exchange Commission of Pakistan (438) (300)
Accrued expenses and other payables (1,613) (5,834)
(2,491) (5,956)
Profits received during the period 42,187 51,529
Net cash generated from operating activities 193,170 393,497
CASH FLOWS FROM FINANCING ACTIVITIES
Proceeds from issuance of units 243,551 893,742
Payments on redemption of units (574,423) (985,759)
Total distribution to unit holders (26,816) -
Net cash used in financing activities (357,688) (92,017)
Net (decrease) / increase in cash and cash equivalents (164,518) 301,480
Cash and cash equivalents at beginning of the period 554,540 433,323
Cash and cash equivalents at end of the period 390,022 734,803
CASH AND CASH EQUIVALENTSBank balances 390,022 534,803
Term deposit musharika - 200,000 390,022 734,803
The annexed notes from 1 to 15 form an integral part of this condensed interim financial information.
____________________ ____________________ ________________
Chief Executive Officer Chief Financial Officer Director
-------- (Rupees in '000) --------
For UBL Fund Managers Limited
(Management Company)
Nine Months Peiod Ended
---SD--- ---SD--- ---SD---
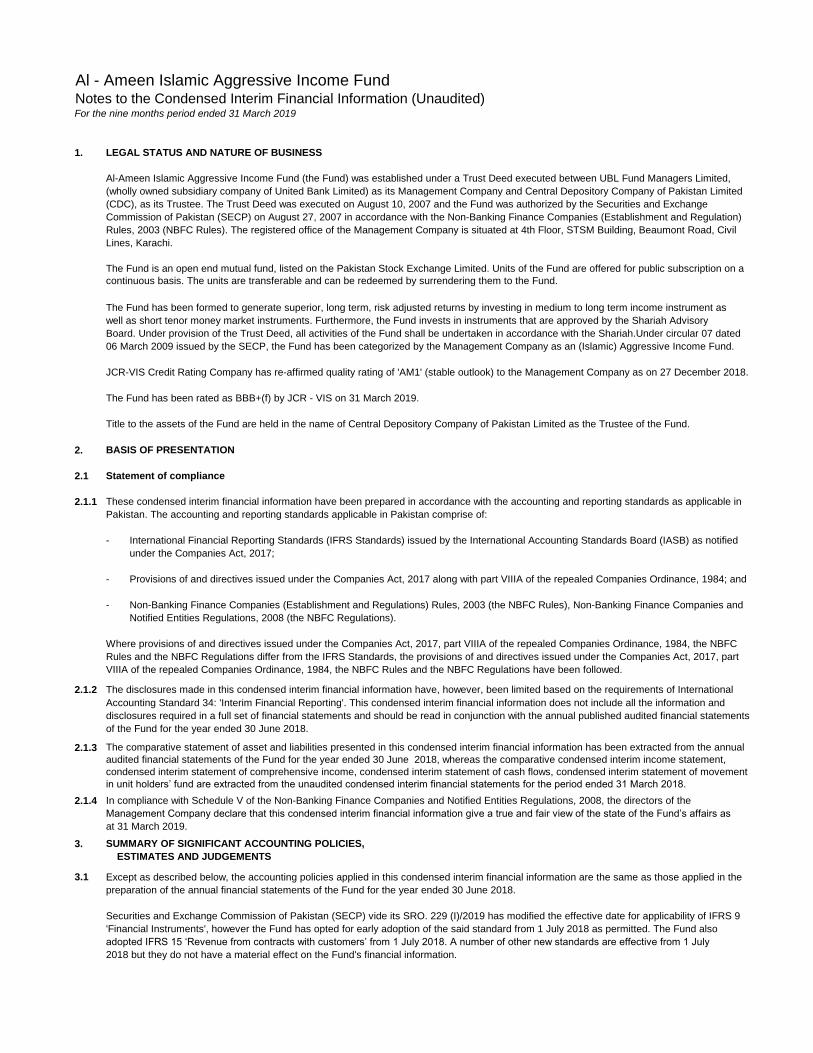
Al - Ameen Islamic Aggressive Income FundNotes to the Condensed Interim Financial Information (Unaudited)For the nine months period ended 31 March 2019
1. LEGAL STATUS AND NATURE OF BUSINESS
Al-Ameen Islamic Aggressive Income Fund (the Fund) was established under a Trust Deed executed between UBL Fund Managers Limited,
(wholly owned subsidiary company of United Bank Limited) as its Management Company and Central Depository Company of Pakistan Limited
(CDC), as its Trustee. The Trust Deed was executed on August 10, 2007 and the Fund was authorized by the Securities and Exchange
Commission of Pakistan (SECP) on August 27, 2007 in accordance with the Non-Banking Finance Companies (Establishment and Regulation)
Rules, 2003 (NBFC Rules). The registered office of the Management Company is situated at 4th Floor, STSM Building, Beaumont Road, Civil
Lines, Karachi.
The Fund has been formed to generate superior, long term, risk adjusted returns by investing in medium to long term income instrument as
well as short tenor money market instruments. Furthermore, the Fund invests in instruments that are approved by the Shariah Advisory
Board. Under provision of the Trust Deed, all activities of the Fund shall be undertaken in accordance with the Shariah.Under circular 07 dated
06 March 2009 issued by the SECP, the Fund has been categorized by the Management Company as an (Islamic) Aggressive Income Fund.
JCR-VIS Credit Rating Company has re-affirmed quality rating of 'AM1' (stable outlook) to the Management Company as on 27 December 2018.
The Fund has been rated as BBB+(f) by JCR - VIS on 31 March 2019.
Title to the assets of the Fund are held in the name of Central Depository Company of Pakistan Limited as the Trustee of the Fund.
2. BASIS OF PRESENTATION
2.1 Statement of compliance
2.1.1 These condensed interim financial information have been prepared in accordance with the accounting and reporting standards as applicable in
Pakistan. The accounting and reporting standards applicable in Pakistan comprise of:
- International Financial Reporting Standards (IFRS Standards) issued by the International Accounting Standards Board (IASB) as notified
under the Companies Act, 2017;
- Provisions of and directives issued under the Companies Act, 2017 along with part VIIIA of the repealed Companies Ordinance, 1984; and
- Non-Banking Finance Companies (Establishment and Regulations) Rules, 2003 (the NBFC Rules), Non-Banking Finance Companies and
Notified Entities Regulations, 2008 (the NBFC Regulations).
Where provisions of and directives issued under the Companies Act, 2017, part VIIIA of the repealed Companies Ordinance, 1984, the NBFC
Rules and the NBFC Regulations differ from the IFRS Standards, the provisions of and directives issued under the Companies Act, 2017, part
VIIIA of the repealed Companies Ordinance, 1984, the NBFC Rules and the NBFC Regulations have been followed.
2.1.2 The disclosures made in this condensed interim financial information have, however, been limited based on the requirements of International
Accounting Standard 34: 'Interim Financial Reporting'. This condensed interim financial information does not include all the information and
disclosures required in a full set of financial statements and should be read in conjunction with the annual published audited financial statements
of the Fund for the year ended 30 June 2018.
2.1.3
2.1.4 In compliance with Schedule V of the Non-Banking Finance Companies and Notified Entities Regulations, 2008, the directors of the
Management Company declare that this condensed interim financial information give a true and fair view of the state of the Fund‟s affairs as
at 31 March 2019.
3. SUMMARY OF SIGNIFICANT ACCOUNTING POLICIES,
ESTIMATES AND JUDGEMENTS
3.1 Except as described below, the accounting policies applied in this condensed interim financial information are the same as those applied in the
preparation of the annual financial statements of the Fund for the year ended 30 June 2018.
Securities and Exchange Commission of Pakistan (SECP) vide its SRO. 229 (I)/2019 has modified the effective date for applicability of IFRS 9
'Financial Instruments', however the Fund has opted for early adoption of the said standard from 1 July 2018 as permitted. The Fund also
adopted IFRS 15 „Revenue from contracts with customers‟ from 1 July 2018. A number of other new standards are effective from 1 July
2018 but they do not have a material effect on the Fund's financial information.
The Fund is an open end mutual fund, listed on the Pakistan Stock Exchange Limited. Units of the Fund are offered for public subscription on a
continuous basis. The units are transferable and can be redeemed by surrendering them to the Fund.
The comparative statement of asset and liabilities presented in this condensed interim financial information has been extracted from the annual
audited financial statements of the Fund for the year ended 30 June 2018, whereas the comparative condensed interim income statement,
condensed interim statement of comprehensive income, condensed interim statement of cash flows, condensed interim statement of movement
in unit holders‟ fund are extracted from the unaudited condensed interim financial statements for the period ended 31 March 2018.
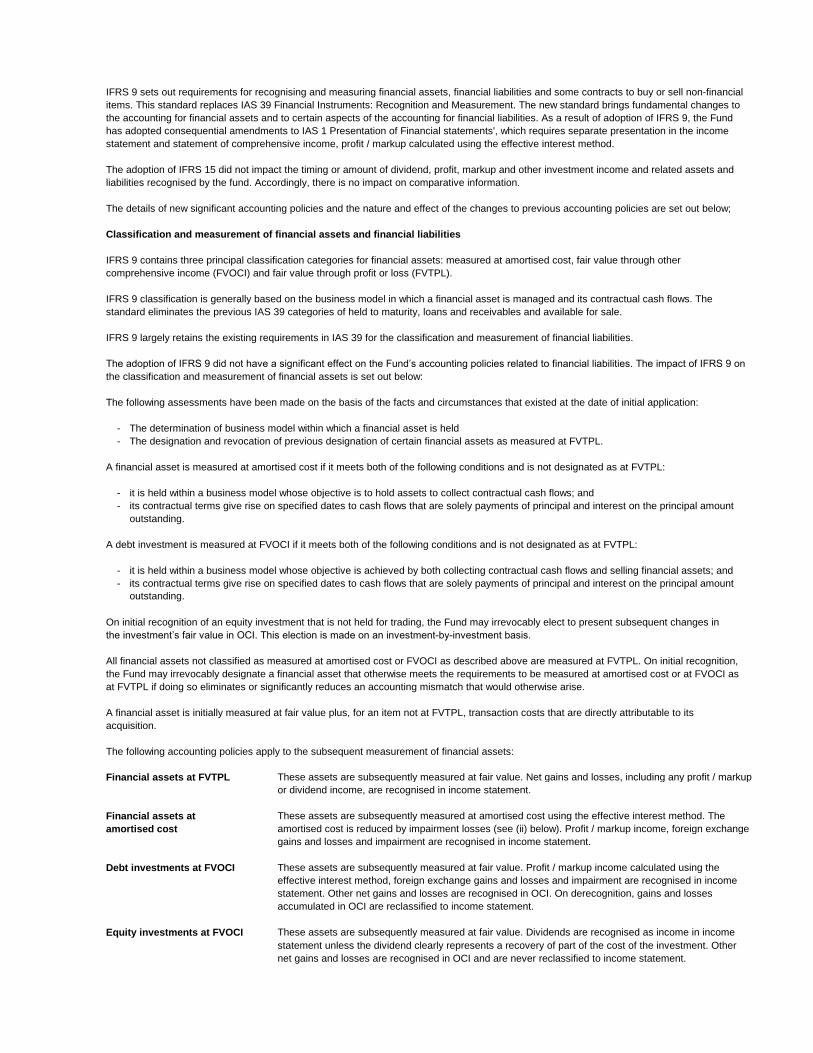
IFRS 9 sets out requirements for recognising and measuring financial assets, financial liabilities and some contracts to buy or sell non-financial
items. This standard replaces IAS 39 Financial Instruments: Recognition and Measurement. The new standard brings fundamental changes to
the accounting for financial assets and to certain aspects of the accounting for financial liabilities. As a result of adoption of IFRS 9, the Fund
has adopted consequential amendments to IAS 1 Presentation of Financial statements', which requires separate presentation in the income
statement and statement of comprehensive income, profit / markup calculated using the effective interest method.
The adoption of IFRS 15 did not impact the timing or amount of dividend, profit, markup and other investment income and related assets and
liabilities recognised by the fund. Accordingly, there is no impact on comparative information.
The details of new significant accounting policies and the nature and effect of the changes to previous accounting policies are set out below;
Classification and measurement of financial assets and financial liabilities
IFRS 9 contains three principal classification categories for financial assets: measured at amortised cost, fair value through other
comprehensive income (FVOCI) and fair value through profit or loss (FVTPL).
IFRS 9 classification is generally based on the business model in which a financial asset is managed and its contractual cash flows. The
standard eliminates the previous IAS 39 categories of held to maturity, loans and receivables and available for sale.
IFRS 9 largely retains the existing requirements in IAS 39 for the classification and measurement of financial liabilities.
The adoption of IFRS 9 did not have a significant effect on the Fund‟s accounting policies related to financial liabilities. The impact of IFRS 9 on
the classification and measurement of financial assets is set out below:
The following assessments have been made on the basis of the facts and circumstances that existed at the date of initial application:
- The determination of business model within which a financial asset is held
- The designation and revocation of previous designation of certain financial assets as measured at FVTPL.
A financial asset is measured at amortised cost if it meets both of the following conditions and is not designated as at FVTPL:
- it is held within a business model whose objective is to hold assets to collect contractual cash flows; and
- its contractual terms give rise on specified dates to cash flows that are solely payments of principal and interest on the principal amount
outstanding.
A debt investment is measured at FVOCI if it meets both of the following conditions and is not designated as at FVTPL:
- it is held within a business model whose objective is achieved by both collecting contractual cash flows and selling financial assets; and
- its contractual terms give rise on specified dates to cash flows that are solely payments of principal and interest on the principal amount
outstanding.
On initial recognition of an equity investment that is not held for trading, the Fund may irrevocably elect to present subsequent changes in
the investment‟s fair value in OCI. This election is made on an investment-by-investment basis.
All financial assets not classified as measured at amortised cost or FVOCI as described above are measured at FVTPL. On initial recognition,
the Fund may irrevocably designate a financial asset that otherwise meets the requirements to be measured at amortised cost or at FVOCI as
at FVTPL if doing so eliminates or significantly reduces an accounting mismatch that would otherwise arise.
A financial asset is initially measured at fair value plus, for an item not at FVTPL, transaction costs that are directly attributable to its
acquisition.
The following accounting policies apply to the subsequent measurement of financial assets:
Financial assets at FVTPL These assets are subsequently measured at fair value. Net gains and losses, including any profit / markup
or dividend income, are recognised in income statement.
Financial assets at These assets are subsequently measured at amortised cost using the effective interest method. The
amortised cost amortised cost is reduced by impairment losses (see (ii) below). Profit / markup income, foreign exchange
gains and losses and impairment are recognised in income statement.
Debt investments at FVOCI These assets are subsequently measured at fair value. Profit / markup income calculated using the
effective interest method, foreign exchange gains and losses and impairment are recognised in income
statement. Other net gains and losses are recognised in OCI. On derecognition, gains and losses
accumulated in OCI are reclassified to income statement.
Equity investments at FVOCI These assets are subsequently measured at fair value. Dividends are recognised as income in income
statement unless the dividend clearly represents a recovery of part of the cost of the investment. Other
net gains and losses are recognised in OCI and are never reclassified to income statement.
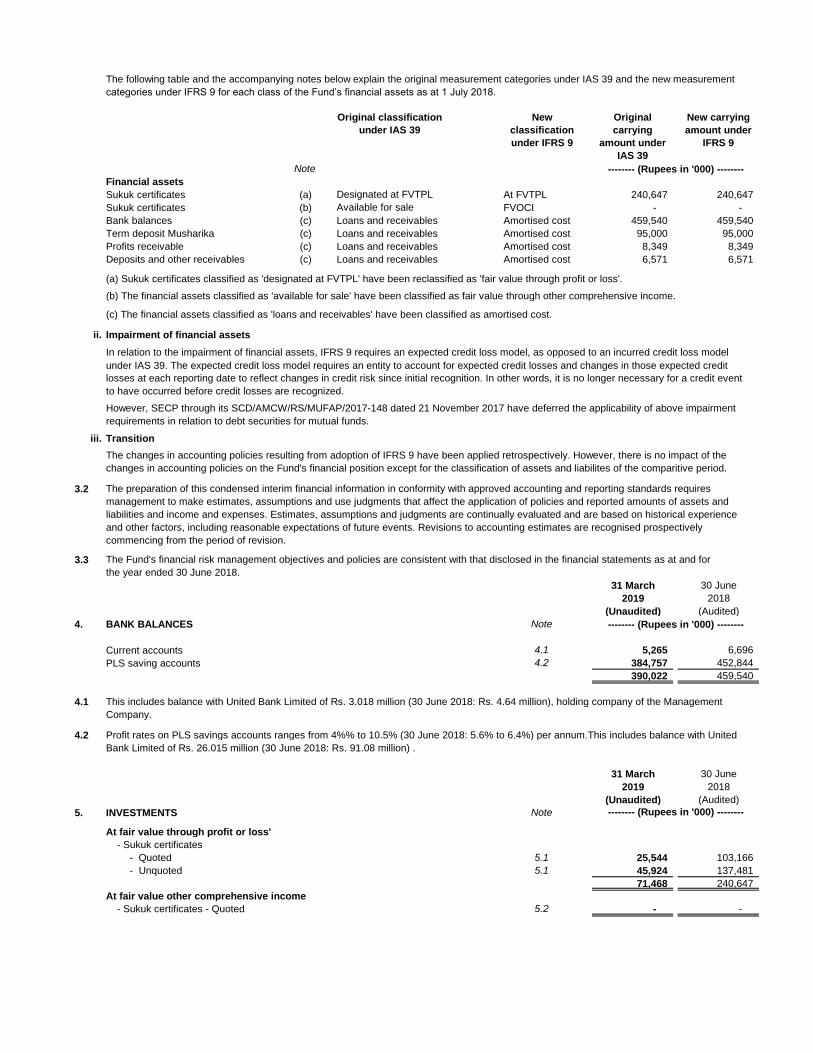
The following table and the accompanying notes below explain the original measurement categories under IAS 39 and the new measurement
categories under IFRS 9 for each class of the Fund‟s financial assets as at 1 July 2018.
Note
Financial assets
Sukuk certificates (a) Designated at FVTPL At FVTPL 240,647 240,647
Sukuk certificates (b) Available for sale FVOCI - -
Bank balances (c) Loans and receivables Amortised cost 459,540 459,540
Term deposit Musharika (c) Loans and receivables Amortised cost 95,000 95,000
Profits receivable (c) Loans and receivables Amortised cost 8,349 8,349
Deposits and other receivables (c) Loans and receivables Amortised cost 6,571 6,571
(a) Sukuk certificates classified as 'designated at FVTPL' have been reclassified as 'fair value through profit or loss'.
(b) The financial assets classified as 'available for sale' have been classified as fair value through other comprehensive income.
(c) The financial assets classified as 'loans and receivables' have been classified as amortised cost.
ii. Impairment of financial assets
In relation to the impairment of financial assets, IFRS 9 requires an expected credit loss model, as opposed to an incurred credit loss model
under IAS 39. The expected credit loss model requires an entity to account for expected credit losses and changes in those expected credit
losses at each reporting date to reflect changes in credit risk since initial recognition. In other words, it is no longer necessary for a credit event
to have occurred before credit losses are recognized.
However, SECP through its SCD/AMCW/RS/MUFAP/2017-148 dated 21 November 2017 have deferred the applicability of above impairment
requirements in relation to debt securities for mutual funds.
iii. Transition
The changes in accounting policies resulting from adoption of IFRS 9 have been applied retrospectively. However, there is no impact of the
changes in accounting policies on the Fund's financial position except for the classification of assets and liabilites of the comparitive period.
3.2 The preparation of this condensed interim financial information in conformity with approved accounting and reporting standards requires
management to make estimates, assumptions and use judgments that affect the application of policies and reported amounts of assets and
liabilities and income and expenses. Estimates, assumptions and judgments are continually evaluated and are based on historical experience
and other factors, including reasonable expectations of future events. Revisions to accounting estimates are recognised prospectively
commencing from the period of revision.
3.3 The Fund's financial risk management objectives and policies are consistent with that disclosed in the financial statements as at and for
the year ended 30 June 2018.
31 March 30 June
2019 2018
(Unaudited) (Audited)
4. BANK BALANCES Note
Current accounts 4.1 5,265 6,696
PLS saving accounts 4.2 384,757 452,844
390,022 459,540
4.1 This includes balance with United Bank Limited of Rs. 3.018 million (30 June 2018: Rs. 4.64 million), holding company of the Management
Company.
4.2 Profit rates on PLS savings accounts ranges from 4%% to 10.5% (30 June 2018: 5.6% to 6.4%) per annum.This includes balance with United
Bank Limited of Rs. 26.015 million (30 June 2018: Rs. 91.08 million) .
31 March 30 June
2019 2018
(Unaudited) (Audited)
5. INVESTMENTS Note
At fair value through profit or loss'
- Sukuk certificates
- Quoted 5.1 25,544 103,166
- Unquoted 5.1 45,924 137,481
71,468 240,647
At fair value other comprehensive income
- Sukuk certificates - Quoted 5.2 - -
-------- (Rupees in '000) --------
-------- (Rupees in '000) --------
Original classification
under IAS 39
New
classification
under IFRS 9
New carrying
amount under
IFRS 9
Original
carrying
amount under
IAS 39
-------- (Rupees in '000) --------
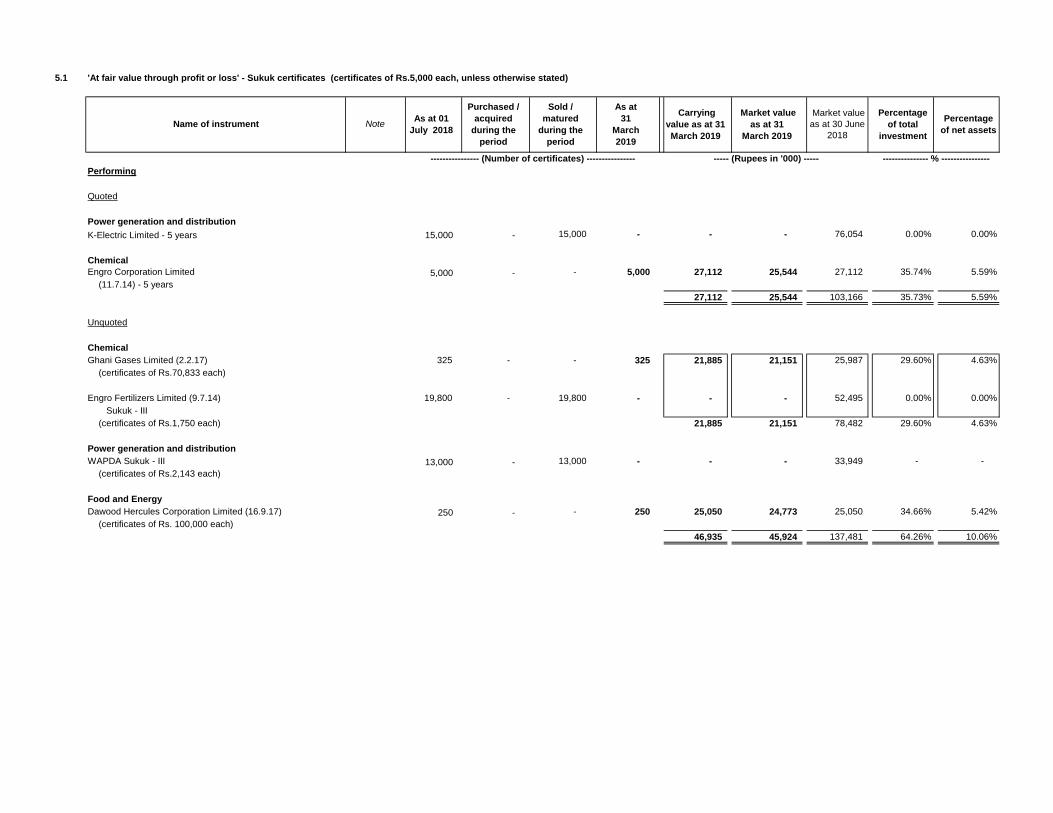
5.1 'At fair value through profit or loss' - Sukuk certificates (certificates of Rs.5,000 each, unless otherwise stated)
Performing
Quoted
Power generation and distribution
K-Electric Limited - 5 years 15,000 - 15,000 - - - 76,054 0.00% 0.00%
Chemical
Engro Corporation Limited 5,000 - - 5,000 27,112 25,544 27,112 35.74% 5.59%
(11.7.14) - 5 years
27,112 25,544 103,166 35.73% 5.59%
Unquoted
Chemical
Ghani Gases Limited (2.2.17) 325 - - 325 21,885 21,151 25,987 29.60% 4.63%
(certificates of Rs.70,833 each)
Engro Fertilizers Limited (9.7.14) 19,800 - 19,800 - - - 52,495 0.00% 0.00%
Sukuk - III
(certificates of Rs.1,750 each) 21,885 21,151 78,482 29.60% 4.63%
Power generation and distribution
WAPDA Sukuk - III 13,000 - 13,000 - - - 33,949 - -
(certificates of Rs.2,143 each)
Food and Energy
Dawood Hercules Corporation Limited (16.9.17) 250 - - 250 25,050 24,773 25,050 34.66% 5.42%
(certificates of Rs. 100,000 each)
46,935 45,924 137,481 64.26% 10.06%
NoteName of instrument
As at
31
March
2019
Carrying
value as at 31
March 2019
---------------- (Number of certificates) ----------------
Market value
as at 31
March 2019
Purchased /
acquired
during the
period
Sold /
matured
during the
period
Market value
as at 30 June
2018
--------------- % ----------------
As at 01
July 2018
Percentage
of total
investment
Percentage
of net assets
----- (Rupees in '000) -----
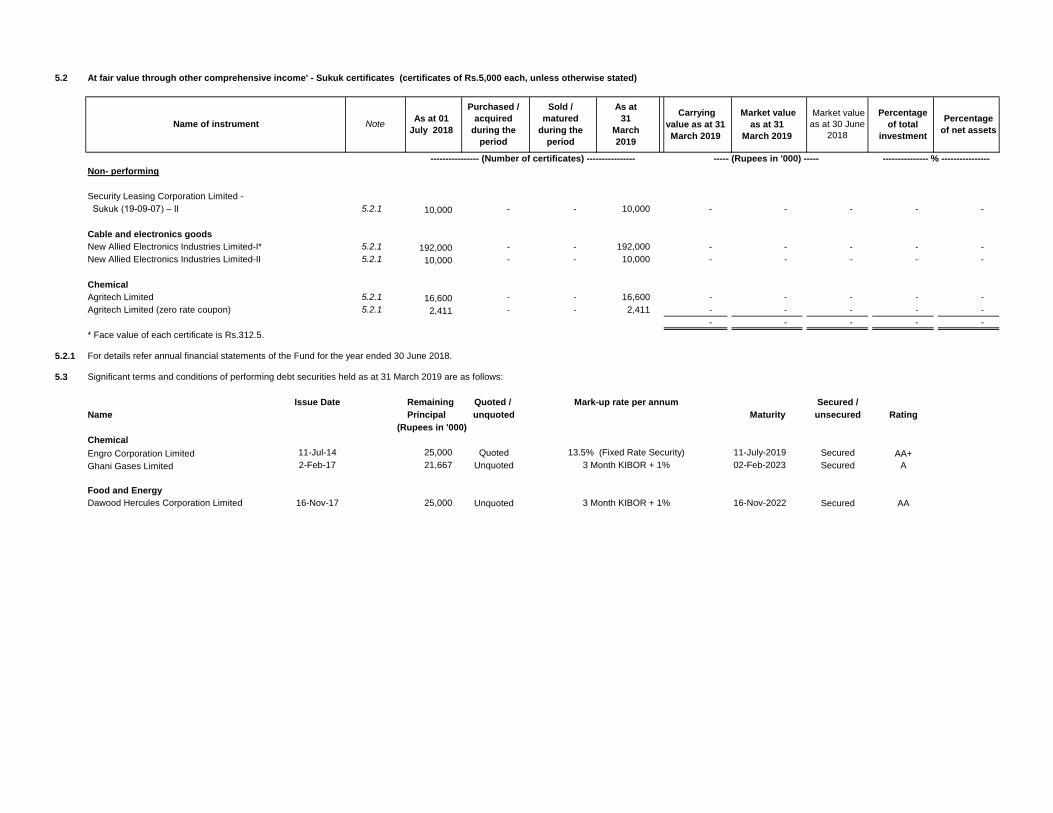
5.2 At fair value through other comprehensive income' - Sukuk certificates (certificates of Rs.5,000 each, unless otherwise stated)
Non- performing
Security Leasing Corporation Limited -
Sukuk (19-09-07) – II 5.2.1 10,000 - - 10,000 - - - - -
Cable and electronics goods
New Allied Electronics Industries Limited-I* 5.2.1 192,000 - - 192,000 - - - - -
New Allied Electronics Industries Limited-II 5.2.1 10,000 - - 10,000 - - - - -
Chemical
Agritech Limited 5.2.1 16,600 - - 16,600 - - - - -
Agritech Limited (zero rate coupon) 5.2.1 2,411 - - 2,411 - - - - -
- - - - -
* Face value of each certificate is Rs.312.5.
5.2.1 For details refer annual financial statements of the Fund for the year ended 30 June 2018.
5.3 Significant terms and conditions of performing debt securities held as at 31 March 2019 are as follows:
Issue Date Remaining Quoted / Mark-up rate per annum Secured /
Name Principal unquoted Maturity unsecured Rating
(Rupees in '000)
Chemical
Engro Corporation Limited 11-Jul-14 25,000 Quoted 13.5% (Fixed Rate Security) 11-July-2019 Secured AA+
Ghani Gases Limited 2-Feb-17 21,667 Unquoted 3 Month KIBOR + 1% 02-Feb-2023 Secured A
Food and Energy
Dawood Hercules Corporation Limited 16-Nov-17 25,000 Unquoted 3 Month KIBOR + 1% 16-Nov-2022 Secured AA
Percentage
of net assets
---------------- (Number of certificates) ---------------- ----- (Rupees in '000) ----- --------------- % ----------------
Name of instrument NoteAs at 01
July 2018
Purchased /
acquired
during the
period
Sold /
matured
during the
period
As at
31
March
2019
Carrying
value as at 31
March 2019
Market value
as at 31
March 2019
Market value
as at 30 June
2018
Percentage
of total
investment
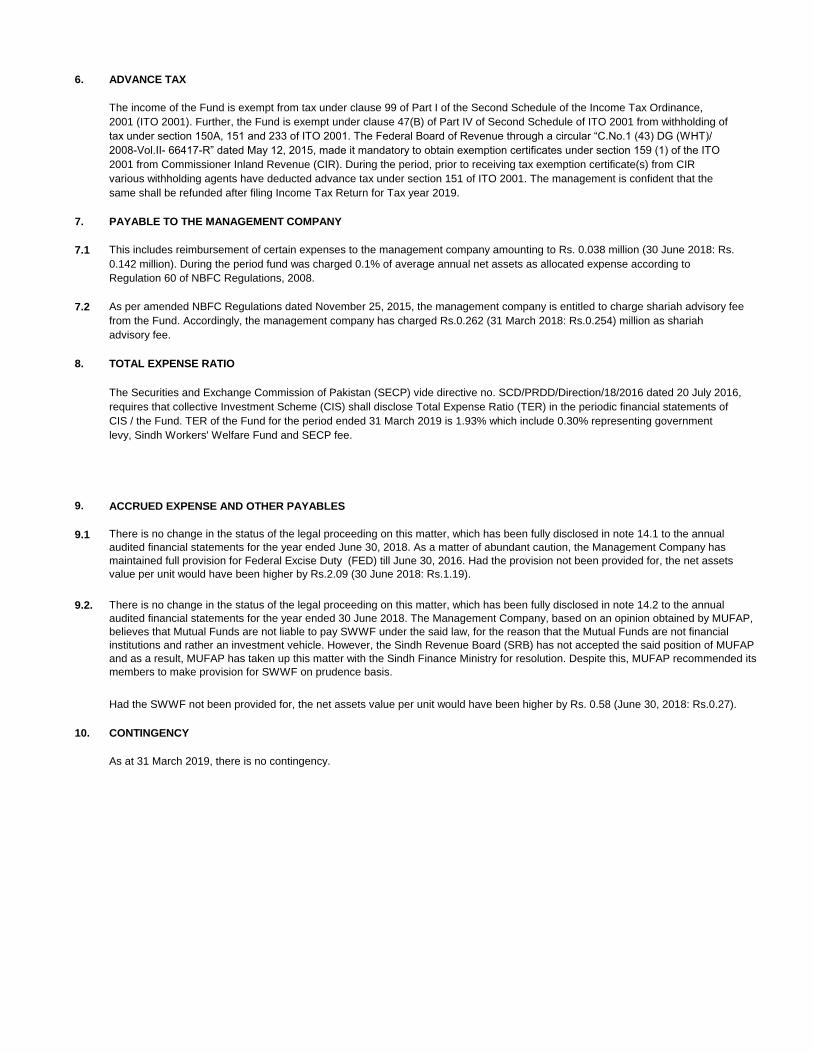
6. ADVANCE TAX
The income of the Fund is exempt from tax under clause 99 of Part I of the Second Schedule of the Income Tax Ordinance,
2001 (ITO 2001). Further, the Fund is exempt under clause 47(B) of Part IV of Second Schedule of ITO 2001 from withholding of
tax under section 150A, 151 and 233 of ITO 2001. The Federal Board of Revenue through a circular “C.No.1 (43) DG (WHT)/
2008-Vol.II- 66417-R” dated May 12, 2015, made it mandatory to obtain exemption certificates under section 159 (1) of the ITO
2001 from Commissioner Inland Revenue (CIR). During the period, prior to receiving tax exemption certificate(s) from CIR
various withholding agents have deducted advance tax under section 151 of ITO 2001. The management is confident that the
same shall be refunded after filing Income Tax Return for Tax year 2019.
7. PAYABLE TO THE MANAGEMENT COMPANY
7.1 This includes reimbursement of certain expenses to the management company amounting to Rs. 0.038 million (30 June 2018: Rs.
0.142 million). During the period fund was charged 0.1% of average annual net assets as allocated expense according to
Regulation 60 of NBFC Regulations, 2008.
7.2 As per amended NBFC Regulations dated November 25, 2015, the management company is entitled to charge shariah advisory fee
from the Fund. Accordingly, the management company has charged Rs.0.262 (31 March 2018: Rs.0.254) million as shariah
advisory fee.
8. TOTAL EXPENSE RATIO
The Securities and Exchange Commission of Pakistan (SECP) vide directive no. SCD/PRDD/Direction/18/2016 dated 20 July 2016,
requires that collective Investment Scheme (CIS) shall disclose Total Expense Ratio (TER) in the periodic financial statements of
CIS / the Fund. TER of the Fund for the period ended 31 March 2019 is 1.93% which include 0.30% representing government
levy, Sindh Workers' Welfare Fund and SECP fee.
9. ACCRUED EXPENSE AND OTHER PAYABLES
9.1
9.2.
10. CONTINGENCY
As at 31 March 2019, there is no contingency.
There is no change in the status of the legal proceeding on this matter, which has been fully disclosed in note 14.2 to the annual
audited financial statements for the year ended 30 June 2018. The Management Company, based on an opinion obtained by MUFAP,
believes that Mutual Funds are not liable to pay SWWF under the said law, for the reason that the Mutual Funds are not financial
institutions and rather an investment vehicle. However, the Sindh Revenue Board (SRB) has not accepted the said position of MUFAP
and as a result, MUFAP has taken up this matter with the Sindh Finance Ministry for resolution. Despite this, MUFAP recommended its
members to make provision for SWWF on prudence basis.
There is no change in the status of the legal proceeding on this matter, which has been fully disclosed in note 14.1 to the annual
audited financial statements for the year ended June 30, 2018. As a matter of abundant caution, the Management Company has
maintained full provision for Federal Excise Duty (FED) till June 30, 2016. Had the provision not been provided for, the net assets
value per unit would have been higher by Rs.2.09 (30 June 2018: Rs.1.19).
Had the SWWF not been provided for, the net assets value per unit would have been higher by Rs. 0.58 (June 30, 2018: Rs.0.27).
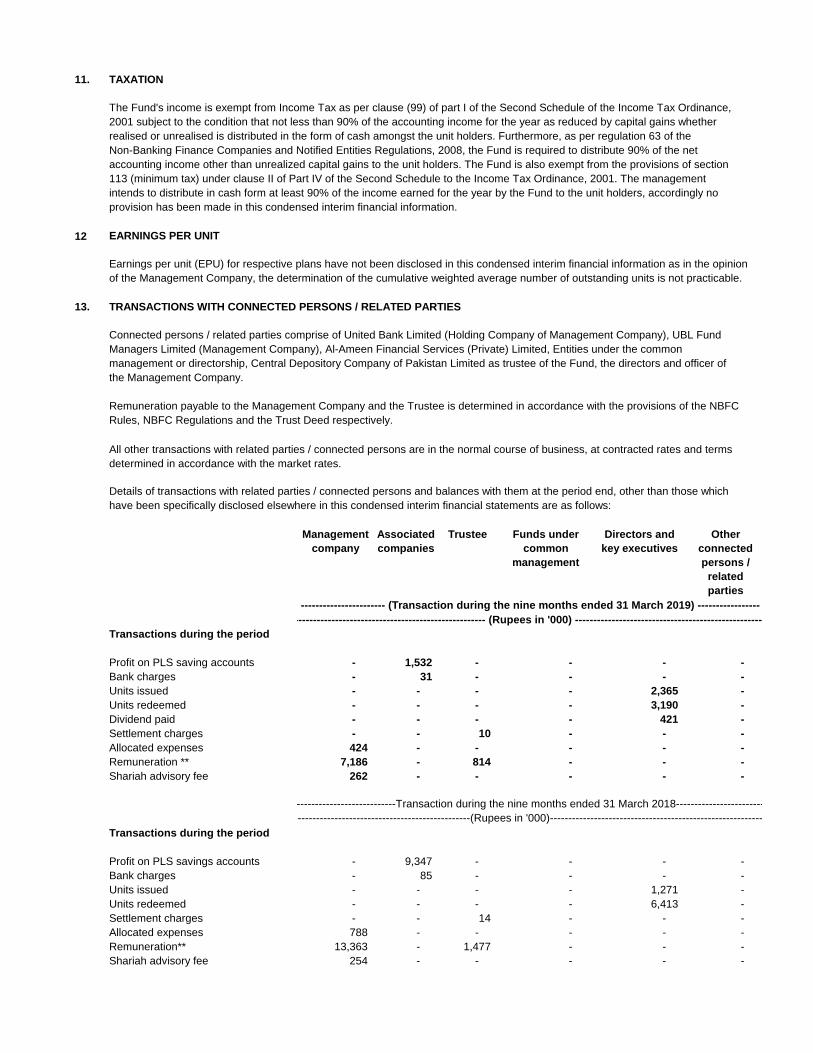
11. TAXATION
The Fund's income is exempt from Income Tax as per clause (99) of part I of the Second Schedule of the Income Tax Ordinance,
2001 subject to the condition that not less than 90% of the accounting income for the year as reduced by capital gains whether
realised or unrealised is distributed in the form of cash amongst the unit holders. Furthermore, as per regulation 63 of the
Non-Banking Finance Companies and Notified Entities Regulations, 2008, the Fund is required to distribute 90% of the net
accounting income other than unrealized capital gains to the unit holders. The Fund is also exempt from the provisions of section
113 (minimum tax) under clause II of Part IV of the Second Schedule to the Income Tax Ordinance, 2001. The management
intends to distribute in cash form at least 90% of the income earned for the year by the Fund to the unit holders, accordingly no
provision has been made in this condensed interim financial information.
12 EARNINGS PER UNIT
Earnings per unit (EPU) for respective plans have not been disclosed in this condensed interim financial information as in the opinion
of the Management Company, the determination of the cumulative weighted average number of outstanding units is not practicable.
13. TRANSACTIONS WITH CONNECTED PERSONS / RELATED PARTIES
Connected persons / related parties comprise of United Bank Limited (Holding Company of Management Company), UBL Fund
Managers Limited (Management Company), Al-Ameen Financial Services (Private) Limited, Entities under the common
management or directorship, Central Depository Company of Pakistan Limited as trustee of the Fund, the directors and officer of
the Management Company.
Remuneration payable to the Management Company and the Trustee is determined in accordance with the provisions of the NBFC
Rules, NBFC Regulations and the Trust Deed respectively.
All other transactions with related parties / connected persons are in the normal course of business, at contracted rates and terms
determined in accordance with the market rates.
Details of transactions with related parties / connected persons and balances with them at the period end, other than those which
have been specifically disclosed elsewhere in this condensed interim financial statements are as follows:
Transactions during the period
Profit on PLS saving accounts - 1,532 - - - -
Bank charges - 31 - - - -
Units issued - - - - 2,365 -
Units redeemed - - - - 3,190 -
Dividend paid - - - - 421 -
Settlement charges - - 10 - - -
Allocated expenses 424 - - - - -
Remuneration ** 7,186 - 814 - - -
Shariah advisory fee 262 - - - - -
Transactions during the period
Profit on PLS savings accounts - 9,347 - - - -
Bank charges - 85 - - - -
Units issued - - - - 1,271 -
Units redeemed - - - - 6,413 -
Settlement charges - - 14 - - -
Allocated expenses 788 - - - - -
Remuneration** 13,363 - 1,477 - - -
Shariah advisory fee 254 - - - - -
----------------------- (Transaction during the nine months ended 31 March 2019) -----------------
Other
connected
persons /
related
parties
Management
company
Associated
companies
Trustee Funds under
common
management
Directors and
key executives
------------------------------------------------------ (Rupees in '000) ------------------------------------------------------
---------------------------Transaction during the nine months ended 31 March 2018------------------------
---------------------------------------------------(Rupees in '000)--------------------------------------------------------------
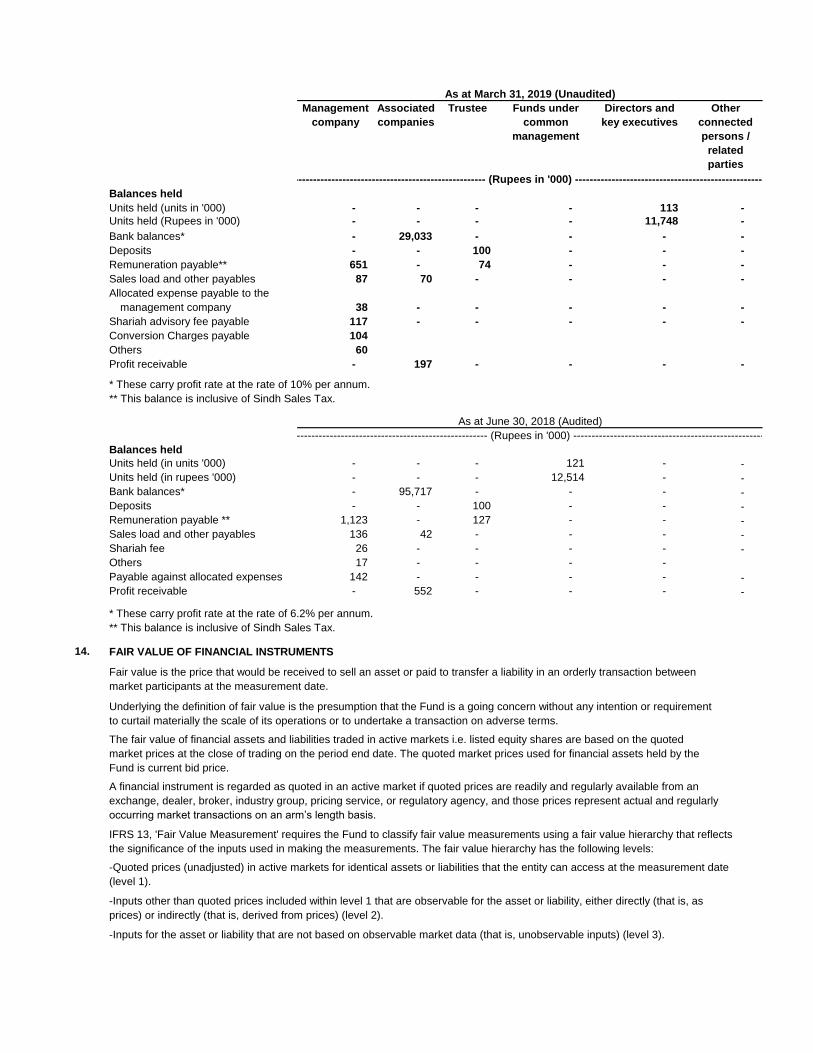
Balances held
Units held (units in '000) - - - - 113 -
Units held (Rupees in '000) - - - - 11,748 -
Bank balances* - 29,033 - - - -
Deposits - - 100 - - -
Remuneration payable** 651 - 74 - - -
Sales load and other payables 87 70 - - - -
Allocated expense payable to the
management company 38 - - - - -
Shariah advisory fee payable 117 - - - - -
Conversion Charges payable 104
Others 60
Profit receivable - 197 - - - -
* These carry profit rate at the rate of 10% per annum.
** This balance is inclusive of Sindh Sales Tax.
Balances held
Units held (in units '000) - - - 121 - -
Units held (in rupees '000) - - - 12,514 - -
Bank balances* - 95,717 - - - -
Deposits - - 100 - - -
Remuneration payable ** 1,123 - 127 - - -
Sales load and other payables 136 42 - - - -
Shariah fee 26 - - - - -
Others 17 - - - -
Payable against allocated expenses 142 - - - - -
Profit receivable - 552 - - - -
* These carry profit rate at the rate of 6.2% per annum.
** This balance is inclusive of Sindh Sales Tax.
14. FAIR VALUE OF FINANCIAL INSTRUMENTS
Fair value is the price that would be received to sell an asset or paid to transfer a liability in an orderly transaction between
market participants at the measurement date.
Underlying the definition of fair value is the presumption that the Fund is a going concern without any intention or requirement
to curtail materially the scale of its operations or to undertake a transaction on adverse terms.
The fair value of financial assets and liabilities traded in active markets i.e. listed equity shares are based on the quoted
market prices at the close of trading on the period end date. The quoted market prices used for financial assets held by the
Fund is current bid price.
A financial instrument is regarded as quoted in an active market if quoted prices are readily and regularly available from an
exchange, dealer, broker, industry group, pricing service, or regulatory agency, and those prices represent actual and regularly
occurring market transactions on an arm‟s length basis.
IFRS 13, 'Fair Value Measurement' requires the Fund to classify fair value measurements using a fair value hierarchy that reflects
the significance of the inputs used in making the measurements. The fair value hierarchy has the following levels:
-Quoted prices (unadjusted) in active markets for identical assets or liabilities that the entity can access at the measurement date
(level 1).
-Inputs other than quoted prices included within level 1 that are observable for the asset or liability, either directly (that is, as
prices) or indirectly (that is, derived from prices) (level 2).
-Inputs for the asset or liability that are not based on observable market data (that is, unobservable inputs) (level 3).
As at June 30, 2018 (Audited)
------------------------------------------------------ (Rupees in '000) ------------------------------------------------------
------------------------------------------------------ (Rupees in '000) ------------------------------------------------------
Management
company
Associated
companies
Trustee Funds under
common
management
Directors and
key executives
Other
connected
persons /
related
parties
As at March 31, 2019 (Unaudited)
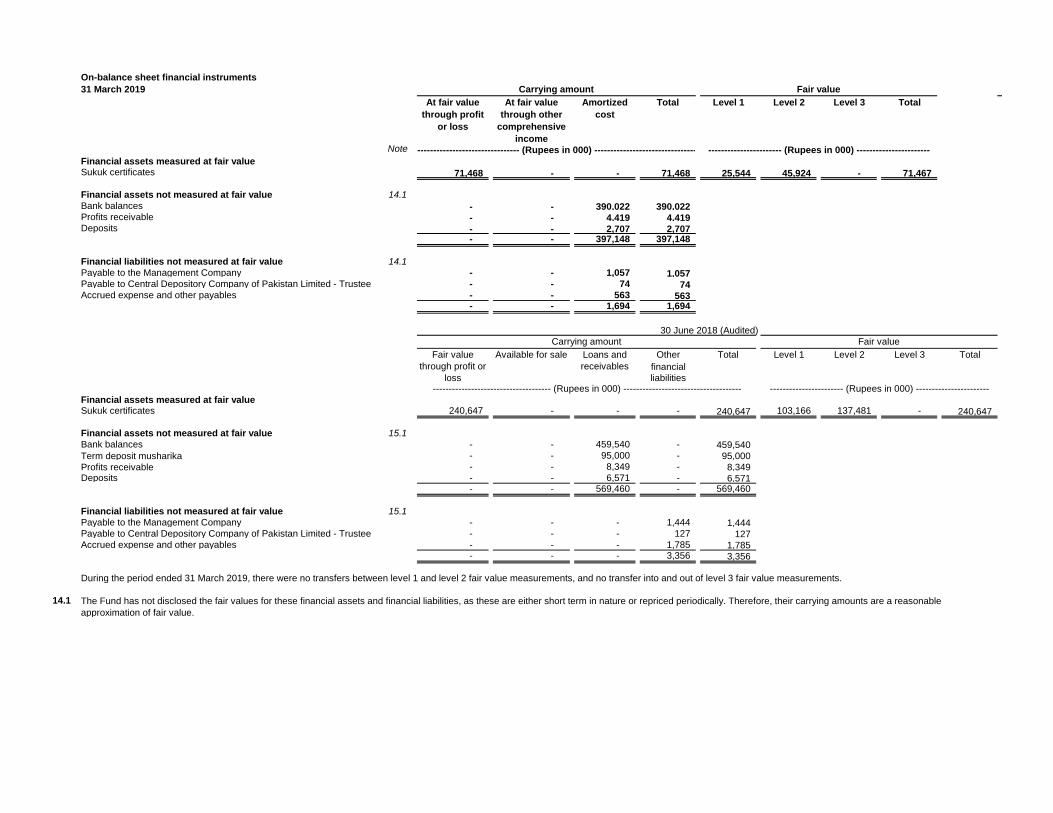
On-balance sheet financial instruments
31 March 2019
Level 1 Level 2 Level 3 Total
Note
Financial assets measured at fair valueSukuk certificates 71,468 - - 71,468 25,544 45,924 - 71,467
Financial assets not measured at fair value 14.1
Bank balances - - 390,022 390,022 Profits receivable - - 4,419 4,419 Deposits - - 2,707 2,707
- - 397,148 397,148
Financial liabilities not measured at fair value 14.1
Payable to the Management Company - - 1,057 1,057 Payable to Central Depository Company of Pakistan Limited - Trustee - - 74 74 Accrued expense and other payables - - 563 563
- - 1,694 1,694
Other Level 1 Level 2 Level 3 Total
financial
liabilities
Financial assets measured at fair valueSukuk certificates 240,647 - - - 240,647 103,166 137,481 - 240,647
Financial assets not measured at fair value 15.1
Bank balances - - 459,540 - 459,540
Term deposit musharika - - 95,000 - 95,000
Profits receivable - - 8,349 - 8,349 Deposits - - 6,571 - 6,571
- - 569,460 - 569,460
Financial liabilities not measured at fair value 15.1
Payable to the Management Company - - - 1,444 1,444 Payable to Central Depository Company of Pakistan Limited - Trustee - - - 127 127 Accrued expense and other payables - - - 1,785 1,785
- - - 3,356 3,356
During the period ended 31 March 2019, there were no transfers between level 1 and level 2 fair value measurements, and no transfer into and out of level 3 fair value measurements.
14.1
------------------------------------- (Rupees in 000) ------------------------------------------------------------ (Rupees in 000) -----------------------
The Fund has not disclosed the fair values for these financial assets and financial liabilities, as these are either short term in nature or repriced periodically. Therefore, their carrying amounts are a reasonable
approximation of fair value.
----------------------- (Rupees in 000) -----------------------
30 June 2018 (Audited)
Fair value
through profit or
loss
Available for sale Loans and
receivables
------------------------------------- (Rupees in 000) -------------------------------------
Fair valueCarrying amount
Total
Carrying amount Fair value
At fair value
through other
comprehensive
income
Amortized
cost
TotalAt fair value
through profit
or loss
15. GENERAL
15.1 This condensed interim financial information is presented in Pakistan Rupees which is also the Fund's
functional currency and all financial information presented has been rounded off to the nearest thousand
rupees unless otherwise stated.
15.2 Corresponding figures have been rearranged / reclassified wherever necessary for better presentation and
comparison. However, there were no material reclassifications to report.
15.3 This condensed interim financial information was authorized for issue by Board of Directors of the
Management Company on _______________.
____________________ ________________
Chief Executive Officer Director
____________________
Chief Financial Officer
For UBL Fund Managers Limited
(Management Company)
---SD--- ---SD--- ---SD---
29 April 2019
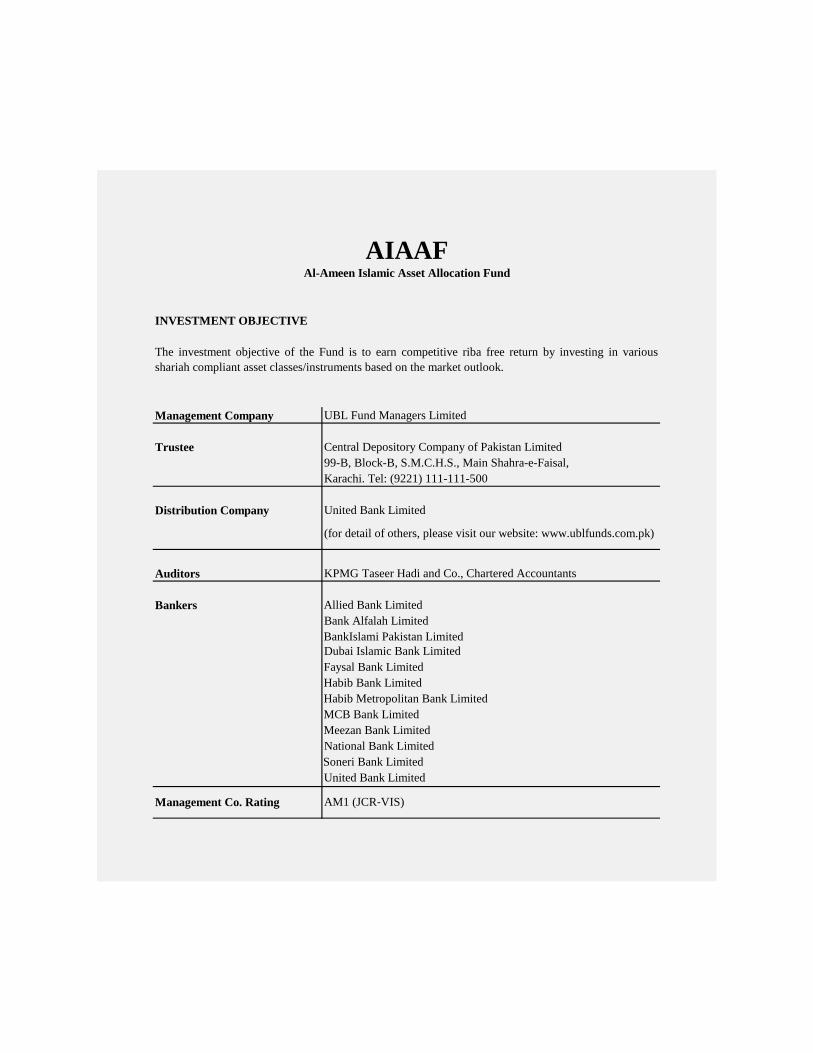
INVESTMENT OBJECTIVE
Management Company UBL Fund Managers Limited
Trustee Central Depository Company of Pakistan Limited
99-B, Block-B, S.M.C.H.S., Main Shahra-e-Faisal,
Karachi. Tel: (9221) 111-111-500
Distribution Company United Bank Limited
Auditors KPMG Taseer Hadi and Co., Chartered Accountants
Bankers Allied Bank Limited
Bank Alfalah Limited
BankIslami Pakistan Limited
Faysal Bank Limited
Habib Bank Limited
Habib Metropolitan Bank Limited
MCB Bank Limited
Meezan Bank Limited
National Bank Limited
Soneri Bank Limited
United Bank Limited
AIAAFAl-Ameen Islamic Asset Allocation Fund
The investment objective of the Fund is to earn competitive riba free return by investing in various
shariah compliant asset classes/instruments based on the market outlook.
(for detail of others, please visit our website: www.ublfunds.com.pk)
Management Co. Rating AM1 (JCR‐VIS)
Dubai Islamic Bank Limited
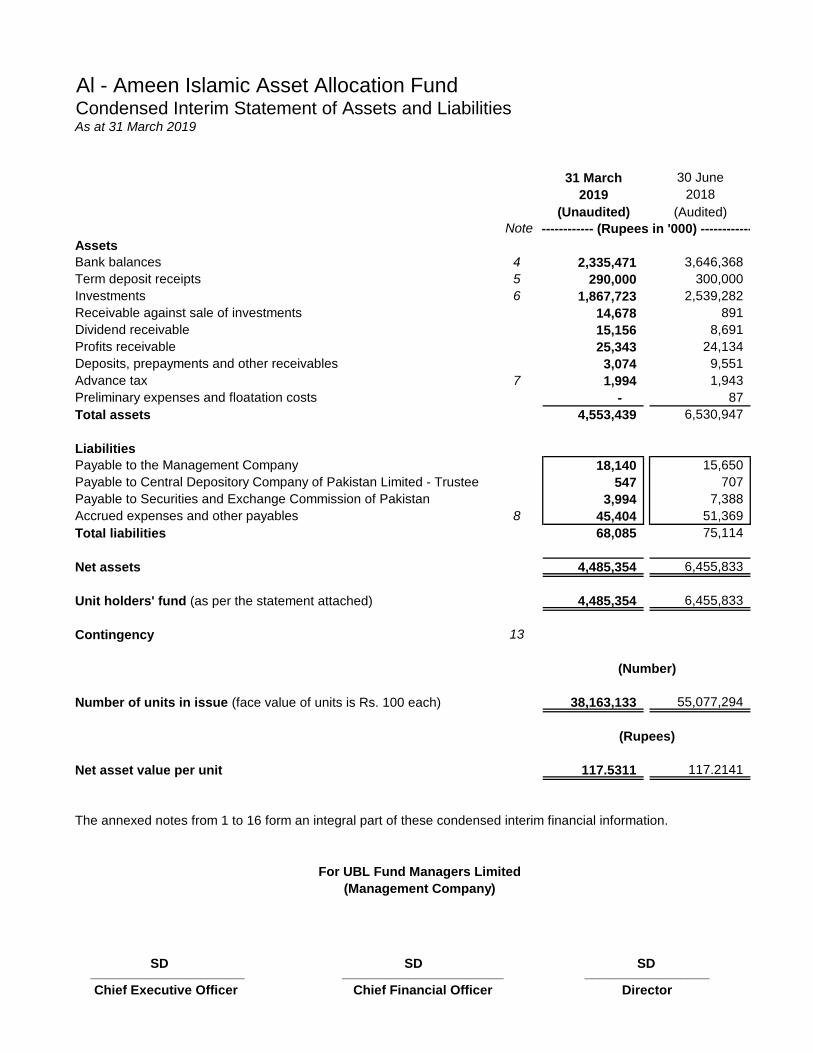
Al - Ameen Islamic Asset Allocation FundCondensed Interim Statement of Assets and LiabilitiesAs at 31 March 2019
31 March 30 June
2019 2018
(Unaudited) (Audited)
Note
Assets
Bank balances 4 2,335,471 3,646,368
Term deposit receipts 5 290,000 300,000
Investments 6 1,867,723 2,539,282
Receivable against sale of investments 14,678 891
Dividend receivable 15,156 8,691
Profits receivable 25,343 24,134
Deposits, prepayments and other receivables 3,074 9,551
Advance tax 7 1,994 1,943
Preliminary expenses and floatation costs - 87
Total assets 4,553,439 6,530,947
Liabilities
Payable to the Management Company 18,140 15,650
Payable to Central Depository Company of Pakistan Limited - Trustee 547 707
Payable to Securities and Exchange Commission of Pakistan 3,994 7,388
Accrued expenses and other payables 8 45,404 51,369
Total liabilities 68,085 75,114
Net assets 4,485,354 6,455,833
Unit holders' fund (as per the statement attached) 4,485,354 6,455,833
Contingency 13
Number of units in issue (face value of units is Rs. 100 each) 38,163,133 55,077,294
Net asset value per unit 117.5311 117.2141
The annexed notes from 1 to 16 form an integral part of these condensed interim financial information.
_____________________ _________________
Chief Executive Officer Director
______________________
Chief Financial Officer
---------------- (Rupees in '000) ----------------
(Number)
(Rupees)
For UBL Fund Managers Limited
(Management Company)
SD SD SD
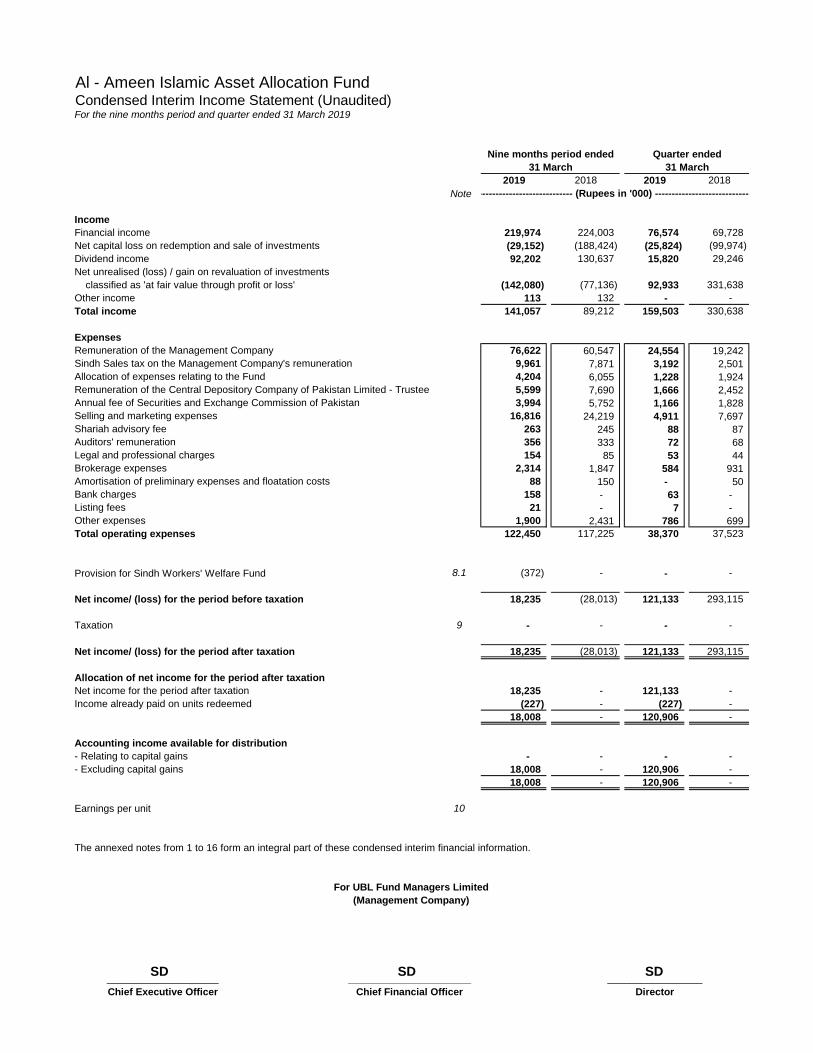
Al - Ameen Islamic Asset Allocation FundCondensed Interim Income Statement (Unaudited)For the nine months period and quarter ended 31 March 2019
2019 2018 2019 2018
Note
Income
Financial income 219,974 224,003 76,574 69,728
Net capital loss on redemption and sale of investments (29,152) (188,424) (25,824) (99,974)
Dividend income 92,202 130,637 15,820 29,246
Net unrealised (loss) / gain on revaluation of investments
classified as 'at fair value through profit or loss' (142,080) (77,136) 92,933 331,638
Other income 113 132 - -
Total income 141,057 89,212 159,503 330,638
Expenses
Remuneration of the Management Company 76,622 60,547 24,554 19,242
Sindh Sales tax on the Management Company's remuneration 9,961 7,871 3,192 2,501
Allocation of expenses relating to the Fund 4,204 6,055 1,228 1,924
Remuneration of the Central Depository Company of Pakistan Limited - Trustee 5,599 7,690 1,666 2,452
Annual fee of Securities and Exchange Commission of Pakistan 3,994 5,752 1,166 1,828
Selling and marketing expenses 16,816 24,219 4,911 7,697
Shariah advisory fee 263 245 88 87
Auditors' remuneration 356 333 72 68
Legal and professional charges 154 85 53 44
Brokerage expenses 2,314 1,847 584 931
Amortisation of preliminary expenses and floatation costs 88 150 - 50
Bank charges 158 - 63 -
Listing fees 21 - 7 -
Other expenses 1,900 2,431 786 699
Total operating expenses 122,450 117,225 38,370 37,523
Provision for Sindh Workers' Welfare Fund 8.1 (372) - - -
Net income/ (loss) for the period before taxation 18,235 (28,013) 121,133 293,115
Taxation 9 - - - -
Net income/ (loss) for the period after taxation 18,235 (28,013) 121,133 293,115
Allocation of net income for the period after taxation
Net income for the period after taxation 18,235 - 121,133 -
Income already paid on units redeemed (227) - (227) -
18,008 - 120,906 -
Accounting income available for distribution
- Relating to capital gains - - - -
- Excluding capital gains 18,008 - 120,906 -
18,008 - 120,906 -
Earnings per unit 10
The annexed notes from 1 to 16 form an integral part of these condensed interim financial information.
____________________ _________________
Chief Executive Officer Director
For UBL Fund Managers Limited
(Management Company)
______________________
Chief Financial Officer
Nine months period ended Quarter ended
31 March 31 March
------------------------------------- (Rupees in '000) --------------------------------------
SD SD SD
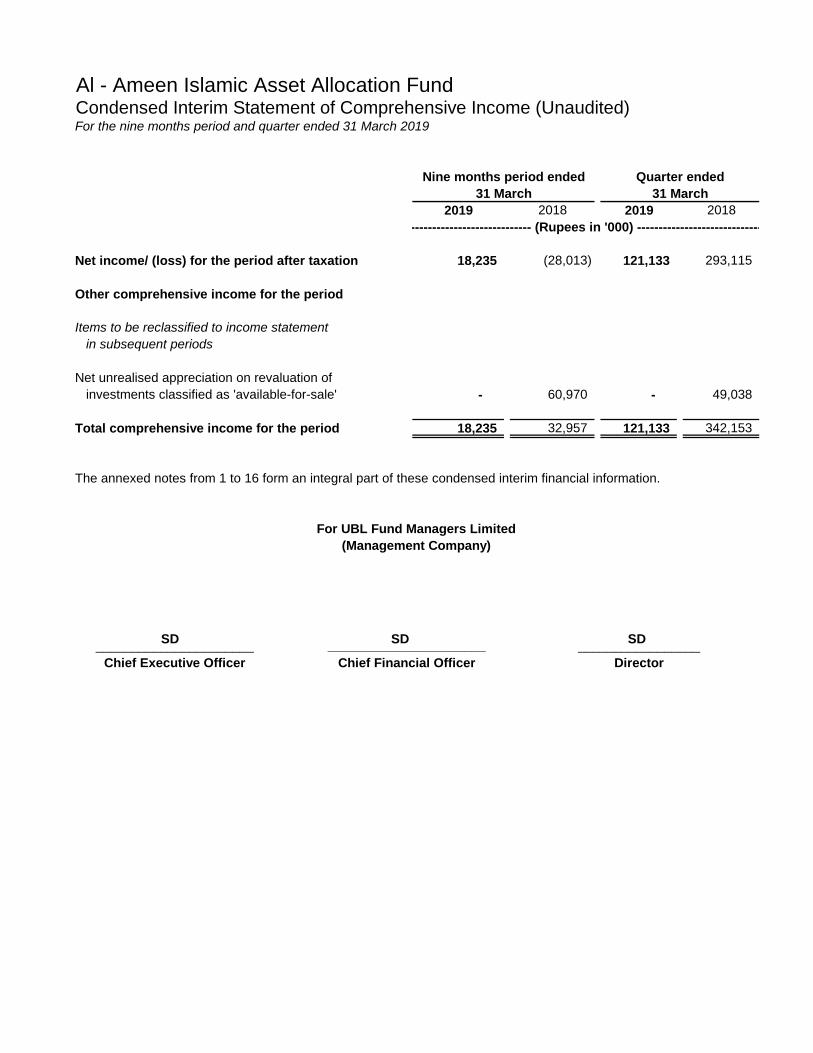
Al - Ameen Islamic Asset Allocation FundCondensed Interim Statement of Comprehensive Income (Unaudited)For the nine months period and quarter ended 31 March 2019
2019 2018 2019 2018
Net income/ (loss) for the period after taxation 18,235 (28,013) 121,133 293,115
Other comprehensive income for the period
Items to be reclassified to income statement
in subsequent periods
Net unrealised appreciation on revaluation of
investments classified as 'available-for-sale' - 60,970 - 49,038
Total comprehensive income for the period 18,235 32,957 121,133 342,153
The annexed notes from 1 to 16 form an integral part of these condensed interim financial information.
______________________ _________________
Chief Financial Officer DirectorChief Executive Officer
______________________
Nine months period ended Quarter ended
31 March 31 March
------------------------------------- (Rupees in '000) --------------------------------------
For UBL Fund Managers Limited
(Management Company)
SD SD SD
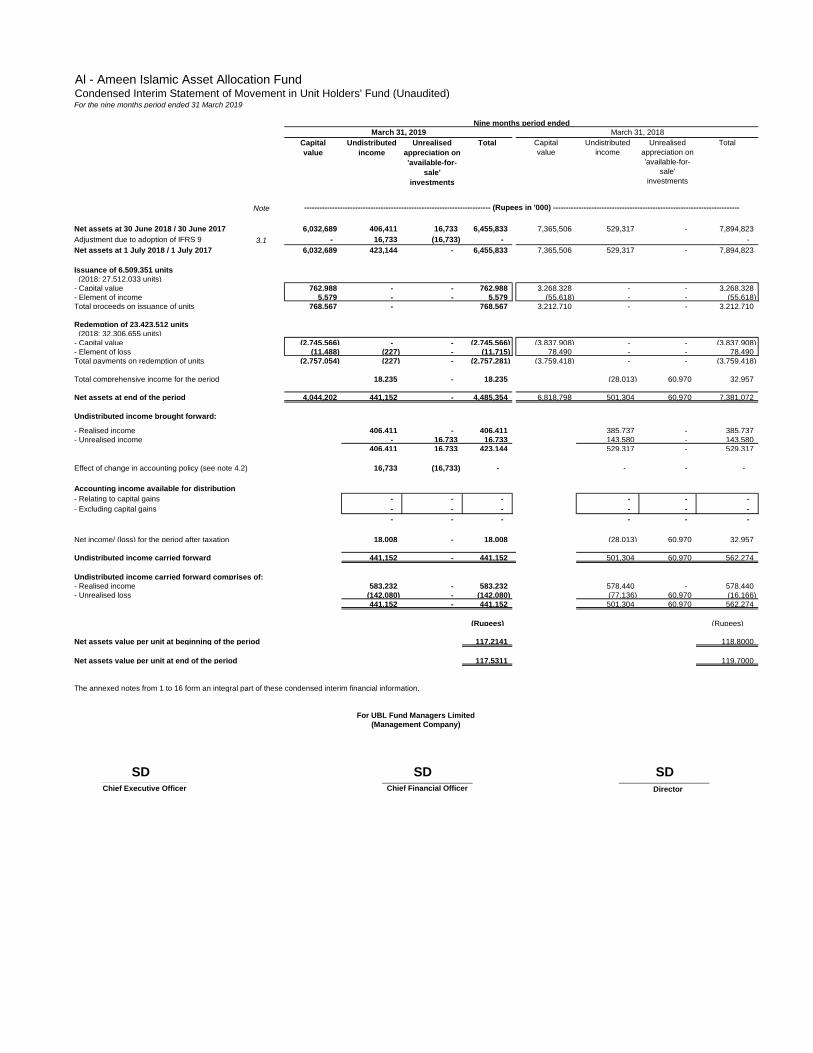
Al - Ameen Islamic Asset Allocation FundCondensed Interim Statement of Movement in Unit Holders' Fund (Unaudited)For the nine months period ended 31 March 2019
Capital
value
Undistributed
income
Unrealised
appreciation on
'available-for-
sale'
investments
Total Capital
value
Undistributed
income
Unrealised
appreciation on
'available-for-
sale'
investments
Total
Note
Net assets at 30 June 2018 / 30 June 2017 6,032,689 406,411 16,733 6,455,833 7,365,506 529,317 - 7,894,823
Adjustment due to adoption of IFRS 9 3.1 - 16,733 (16,733) - -
Net assets at 1 July 2018 / 1 July 2017 6,032,689 423,144 - 6,455,833 7,365,506 529,317 - 7,894,823
Issuance of 6,509,351 units
(2018: 27,512,033 units)
- Capital value 762,988 - - 762,988 3,268,328 - - 3,268,328
- Element of income 5,579 - - 5,579 (55,618) - - (55,618)
Total proceeds on issuance of units 768,567 - 768,567 3,212,710 - - 3,212,710
Redemption of 23,423,512 units
(2018: 32,306,655 units)
- Capital value (2,745,566) - - (2,745,566) (3,837,908) - - (3,837,908)
- Element of loss (11,488) (227) - (11,715) 78,490 - - 78,490
Total payments on redemption of units (2,757,054) (227) - (2,757,281) (3,759,418) - - (3,759,418)
Total comprehensive income for the period 18,235 - 18,235 (28,013) 60,970 32,957
Net assets at end of the period 4,044,202 441,152 - 4,485,354 6,818,798 501,304 60,970 7,381,072
Undistributed income brought forward:
- Realised income 406,411 - 406,411 385,737 - 385,737
- Unrealised income - 16,733 16,733 143,580 - 143,580
406,411 16,733 423,144 529,317 - 529,317
Effect of change in accounting policy (see note 4.2) 16,733 (16,733) - - - -
Accounting income available for distribution
- Relating to capital gains - - - - - -
- Excluding capital gains - - - - - -
- - - - - -
Net income/ (loss) for the period after taxation 18,008 - 18,008 (28,013) 60,970 32,957
Undistributed income carried forward 441,152 - 441,152 501,304 60,970 562,274
Undistributed income carried forward comprises of:
- Realised income 583,232 - 583,232 578,440 - 578,440
- Unrealised loss (142,080) - (142,080) (77,136) 60,970 (16,166)
441,152 - 441,152 501,304 60,970 562,274
(Rupees) (Rupees)
Net assets value per unit at beginning of the period 117.2141 118.8000
Net assets value per unit at end of the period 117.5311 119.7000
The annexed notes from 1 to 16 form an integral part of these condensed interim financial information.
____________________ _________________Chief Executive Officer Director
_____________________Chief Financial Officer
(Management Company)
March 31, 2019
------------------------------------------------------------------------- (Rupees in '000) -------------------------------------------------------------------------
For UBL Fund Managers Limited
Nine months period ended
March 31, 2018
SD SD SD_____________________
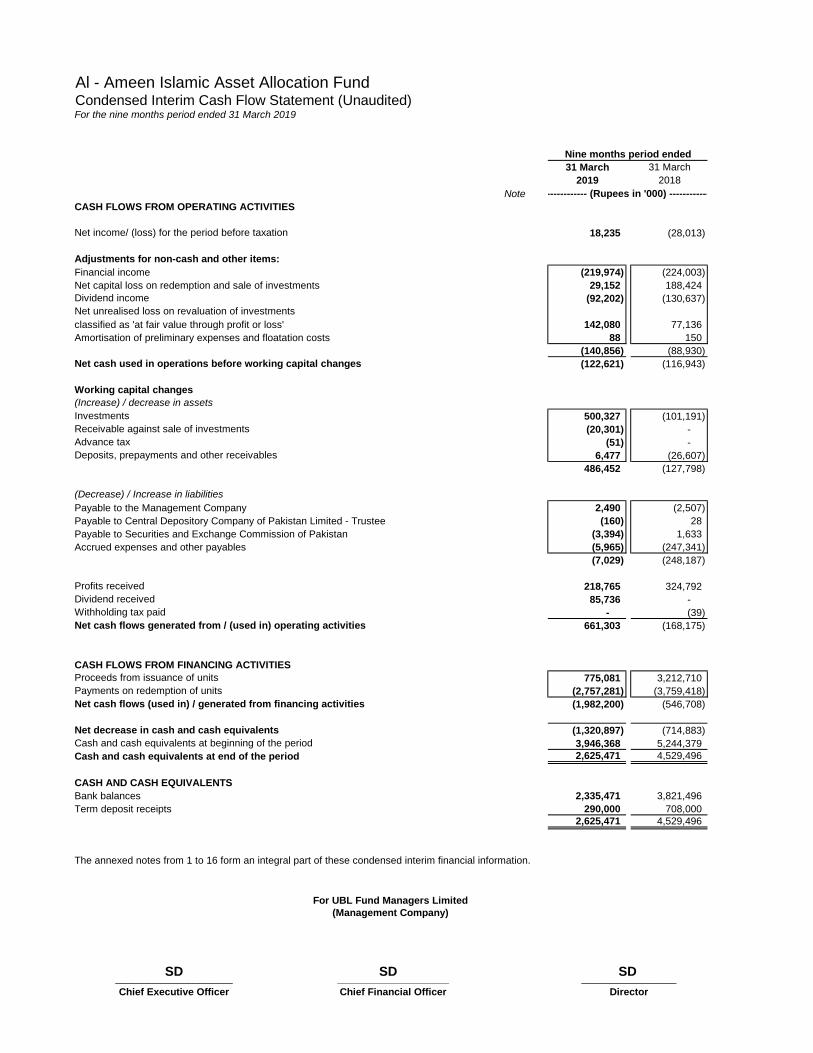
Al - Ameen Islamic Asset Allocation FundCondensed Interim Cash Flow Statement (Unaudited)For the nine months period ended 31 March 2019
31 March 31 March
2019 2018
Note
CASH FLOWS FROM OPERATING ACTIVITIES
Net income/ (loss) for the period before taxation 18,235 (28,013)
Adjustments for non-cash and other items:
Financial income (219,974) (224,003)
Net capital loss on redemption and sale of investments 29,152 188,424
Dividend income (92,202) (130,637)
Net unrealised loss on revaluation of investments
classified as 'at fair value through profit or loss' 142,080 77,136
Amortisation of preliminary expenses and floatation costs 88 150
(140,856) (88,930)
Net cash used in operations before working capital changes (122,621) (116,943)
Working capital changes
(Increase) / decrease in assets
Investments 500,327 (101,191)
Receivable against sale of investments (20,301) -
Advance tax (51) -
Deposits, prepayments and other receivables 6,477 (26,607)
486,452 (127,798)
(Decrease) / Increase in liabilities
Payable to the Management Company 2,490 (2,507)
Payable to Central Depository Company of Pakistan Limited - Trustee (160) 28
Payable to Securities and Exchange Commission of Pakistan (3,394) 1,633
Accrued expenses and other payables (5,965) (247,341)
(7,029) (248,187)
Profits received 218,765 324,792
Dividend received 85,736 -
Withholding tax paid - (39)
Net cash flows generated from / (used in) operating activities 661,303 (168,175)
CASH FLOWS FROM FINANCING ACTIVITIES
Proceeds from issuance of units 775,081 3,212,710
Payments on redemption of units (2,757,281) (3,759,418)
Net cash flows (used in) / generated from financing activities (1,982,200) (546,708)
Net decrease in cash and cash equivalents (1,320,897) (714,883)
Cash and cash equivalents at beginning of the period 3,946,368 5,244,379
Cash and cash equivalents at end of the period 2,625,471 4,529,496
CASH AND CASH EQUIVALENTS
Bank balances 2,335,471 3,821,496
Term deposit receipts 290,000 708,000
2,625,471 4,529,496
The annexed notes from 1 to 16 form an integral part of these condensed interim financial information.
_____________________ ____________________ _________________
Chief Executive Officer Chief Financial Officer Director
For UBL Fund Managers Limited
(Management Company)
Nine months period ended
------------ (Rupees in '000) ------------
SD SD SD
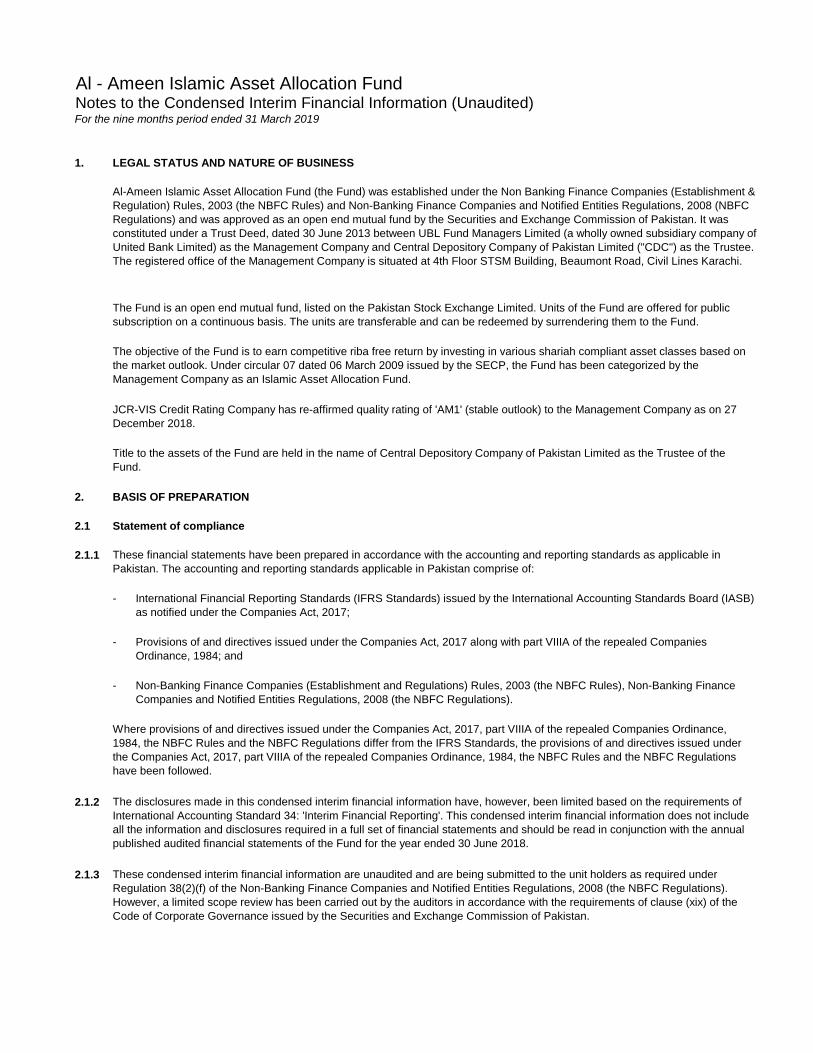
Al - Ameen Islamic Asset Allocation FundNotes to the Condensed Interim Financial Information (Unaudited)For the nine months period ended 31 March 2019
1. LEGAL STATUS AND NATURE OF BUSINESS
2. BASIS OF PREPARATION
2.1 Statement of compliance
2.1.1
-
-
-
2.1.2
2.1.3
The Fund is an open end mutual fund, listed on the Pakistan Stock Exchange Limited. Units of the Fund are offered for public
subscription on a continuous basis. The units are transferable and can be redeemed by surrendering them to the Fund.
The objective of the Fund is to earn competitive riba free return by investing in various shariah compliant asset classes based on
the market outlook. Under circular 07 dated 06 March 2009 issued by the SECP, the Fund has been categorized by the
Management Company as an Islamic Asset Allocation Fund.
JCR-VIS Credit Rating Company has re-affirmed quality rating of 'AM1' (stable outlook) to the Management Company as on 27
December 2018.
The disclosures made in this condensed interim financial information have, however, been limited based on the requirements of
International Accounting Standard 34: 'Interim Financial Reporting'. This condensed interim financial information does not include
all the information and disclosures required in a full set of financial statements and should be read in conjunction with the annual
published audited financial statements of the Fund for the year ended 30 June 2018.
These condensed interim financial information are unaudited and are being submitted to the unit holders as required under
Regulation 38(2)(f) of the Non-Banking Finance Companies and Notified Entities Regulations, 2008 (the NBFC Regulations).
However, a limited scope review has been carried out by the auditors in accordance with the requirements of clause (xix) of the
Code of Corporate Governance issued by the Securities and Exchange Commission of Pakistan.
Al-Ameen Islamic Asset Allocation Fund (the Fund) was established under the Non Banking Finance Companies (Establishment &
Regulation) Rules, 2003 (the NBFC Rules) and Non-Banking Finance Companies and Notified Entities Regulations, 2008 (NBFC
Regulations) and was approved as an open end mutual fund by the Securities and Exchange Commission of Pakistan. It was
constituted under a Trust Deed, dated 30 June 2013 between UBL Fund Managers Limited (a wholly owned subsidiary company of
United Bank Limited) as the Management Company and Central Depository Company of Pakistan Limited ("CDC") as the Trustee.
The registered office of the Management Company is situated at 4th Floor STSM Building, Beaumont Road, Civil Lines Karachi.
These financial statements have been prepared in accordance with the accounting and reporting standards as applicable in
Pakistan. The accounting and reporting standards applicable in Pakistan comprise of:
International Financial Reporting Standards (IFRS Standards) issued by the International Accounting Standards Board (IASB)
as notified under the Companies Act, 2017;
Non-Banking Finance Companies (Establishment and Regulations) Rules, 2003 (the NBFC Rules), Non-Banking Finance
Companies and Notified Entities Regulations, 2008 (the NBFC Regulations).
Where provisions of and directives issued under the Companies Act, 2017, part VIIIA of the repealed Companies Ordinance,
1984, the NBFC Rules and the NBFC Regulations differ from the IFRS Standards, the provisions of and directives issued under
the Companies Act, 2017, part VIIIA of the repealed Companies Ordinance, 1984, the NBFC Rules and the NBFC Regulations
have been followed.
Title to the assets of the Fund are held in the name of Central Depository Company of Pakistan Limited as the Trustee of the
Fund.
Provisions of and directives issued under the Companies Act, 2017 along with part VIIIA of the repealed Companies
Ordinance, 1984; and
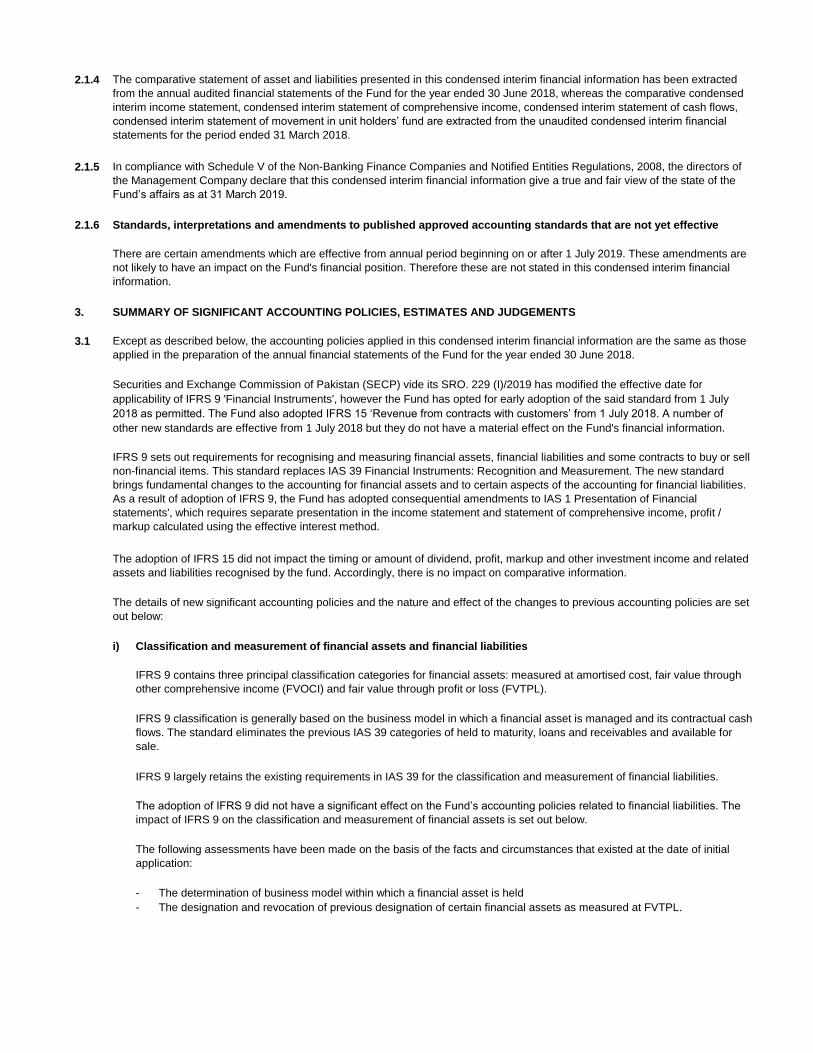
2.1.4
2.1.5
2.1.6 Standards, interpretations and amendments to published approved accounting standards that are not yet effective
3. SUMMARY OF SIGNIFICANT ACCOUNTING POLICIES, ESTIMATES AND JUDGEMENTS
3.1
Securities and Exchange Commission of Pakistan (SECP) vide its SRO. 229 (I)/2019 has modified the effective date for
applicability of IFRS 9 'Financial Instruments', however the Fund has opted for early adoption of the said standard from 1 July
2018 as permitted. The Fund also adopted IFRS 15 „Revenue from contracts with customers‟ from 1 July 2018. A number of
other new standards are effective from 1 July 2018 but they do not have a material effect on the Fund's financial information.
i) Classification and measurement of financial assets and financial liabilities
IFRS 9 largely retains the existing requirements in IAS 39 for the classification and measurement of financial liabilities.
- The determination of business model within which a financial asset is held
- The designation and revocation of previous designation of certain financial assets as measured at FVTPL.
The comparative statement of asset and liabilities presented in this condensed interim financial information has been extracted
from the annual audited financial statements of the Fund for the year ended 30 June 2018, whereas the comparative condensed
interim income statement, condensed interim statement of comprehensive income, condensed interim statement of cash flows,
condensed interim statement of movement in unit holders‟ fund are extracted from the unaudited condensed interim financial
statements for the period ended 31 March 2018.
In compliance with Schedule V of the Non-Banking Finance Companies and Notified Entities Regulations, 2008, the directors of
the Management Company declare that this condensed interim financial information give a true and fair view of the state of the
Fund‟s affairs as at 31 March 2019.
There are certain amendments which are effective from annual period beginning on or after 1 July 2019. These amendments are
not likely to have an impact on the Fund's financial position. Therefore these are not stated in this condensed interim financial
information.
Except as described below, the accounting policies applied in this condensed interim financial information are the same as those
applied in the preparation of the annual financial statements of the Fund for the year ended 30 June 2018.
IFRS 9 sets out requirements for recognising and measuring financial assets, financial liabilities and some contracts to buy or sell
non-financial items. This standard replaces IAS 39 Financial Instruments: Recognition and Measurement. The new standard
brings fundamental changes to the accounting for financial assets and to certain aspects of the accounting for financial liabilities.
As a result of adoption of IFRS 9, the Fund has adopted consequential amendments to IAS 1 Presentation of Financial
statements', which requires separate presentation in the income statement and statement of comprehensive income, profit /
markup calculated using the effective interest method.
The adoption of IFRS 15 did not impact the timing or amount of dividend, profit, markup and other investment income and related
assets and liabilities recognised by the fund. Accordingly, there is no impact on comparative information.
IFRS 9 contains three principal classification categories for financial assets: measured at amortised cost, fair value through
other comprehensive income (FVOCI) and fair value through profit or loss (FVTPL).
IFRS 9 classification is generally based on the business model in which a financial asset is managed and its contractual cash
flows. The standard eliminates the previous IAS 39 categories of held to maturity, loans and receivables and available for
sale.
The adoption of IFRS 9 did not have a significant effect on the Fund‟s accounting policies related to financial liabilities. The
impact of IFRS 9 on the classification and measurement of financial assets is set out below.
The details of new significant accounting policies and the nature and effect of the changes to previous accounting policies are set
out below:
The following assessments have been made on the basis of the facts and circumstances that existed at the date of initial
application:
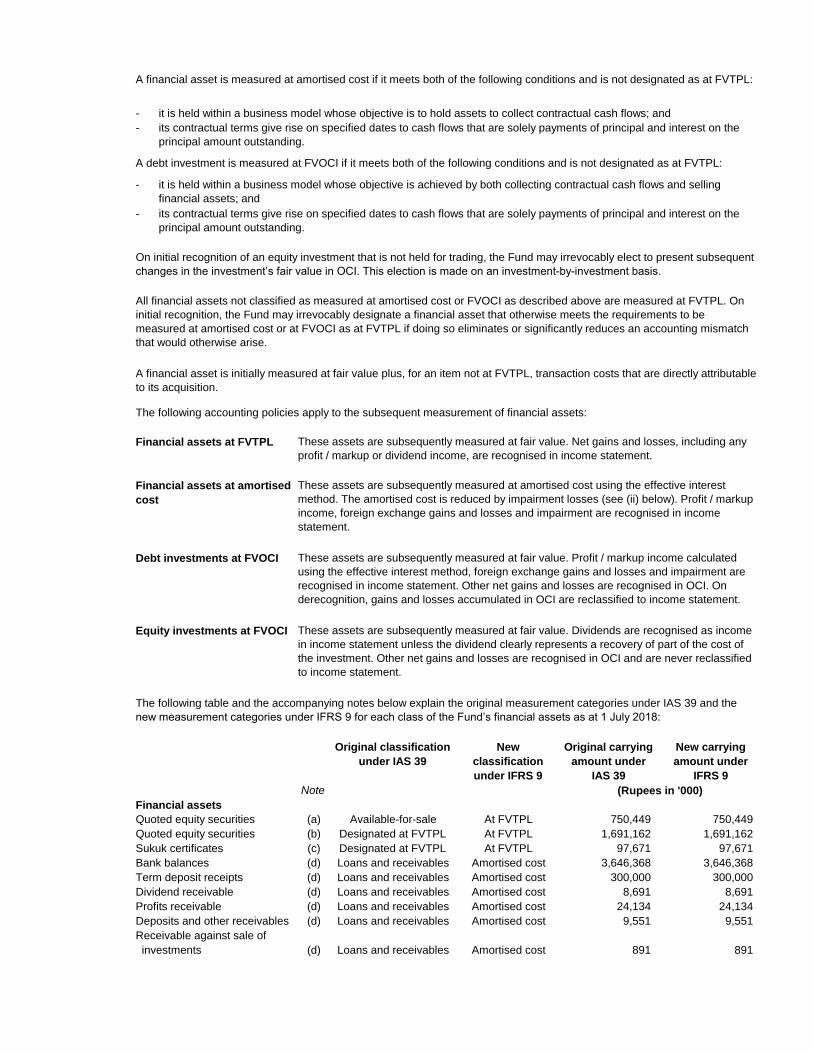
- it is held within a business model whose objective is to hold assets to collect contractual cash flows; and
-
A debt investment is measured at FVOCI if it meets both of the following conditions and is not designated as at FVTPL:
-
-
The following accounting policies apply to the subsequent measurement of financial assets:
Note (Rupees in '000)
Financial assets
Quoted equity securities (a) Available-for-sale At FVTPL 750,449 750,449
Quoted equity securities (b) Designated at FVTPL At FVTPL 1,691,162 1,691,162
Sukuk certificates (c) Designated at FVTPL At FVTPL 97,671 97,671
Bank balances (d) Loans and receivables Amortised cost 3,646,368 3,646,368
Term deposit receipts (d) Loans and receivables Amortised cost 300,000 300,000
Dividend receivable (d) Loans and receivables Amortised cost 8,691 8,691
Profits receivable (d) Loans and receivables Amortised cost 24,134 24,134
Deposits and other receivables (d) Loans and receivables Amortised cost 9,551 9,551
Receivable against sale of
investments (d) Loans and receivables Amortised cost 891 891
Original classification
under IAS 39
New
classification
under IFRS 9
Original carrying
amount under
IAS 39
New carrying
amount under
IFRS 9
its contractual terms give rise on specified dates to cash flows that are solely payments of principal and interest on the
principal amount outstanding.
it is held within a business model whose objective is achieved by both collecting contractual cash flows and selling
financial assets; and
its contractual terms give rise on specified dates to cash flows that are solely payments of principal and interest on the
principal amount outstanding.
On initial recognition of an equity investment that is not held for trading, the Fund may irrevocably elect to present subsequent
changes in the investment‟s fair value in OCI. This election is made on an investment-by-investment basis.
The following table and the accompanying notes below explain the original measurement categories under IAS 39 and the
new measurement categories under IFRS 9 for each class of the Fund‟s financial assets as at 1 July 2018:
All financial assets not classified as measured at amortised cost or FVOCI as described above are measured at FVTPL. On
initial recognition, the Fund may irrevocably designate a financial asset that otherwise meets the requirements to be
measured at amortised cost or at FVOCI as at FVTPL if doing so eliminates or significantly reduces an accounting mismatch
that would otherwise arise.
These assets are subsequently measured at fair value. Net gains and losses, including any
profit / markup or dividend income, are recognised in income statement.
These assets are subsequently measured at amortised cost using the effective interest
method. The amortised cost is reduced by impairment losses (see (ii) below). Profit / markup
income, foreign exchange gains and losses and impairment are recognised in income
statement.
A financial asset is initially measured at fair value plus, for an item not at FVTPL, transaction costs that are directly attributable
to its acquisition.
These assets are subsequently measured at fair value. Profit / markup income calculated
using the effective interest method, foreign exchange gains and losses and impairment are
recognised in income statement. Other net gains and losses are recognised in OCI. On
derecognition, gains and losses accumulated in OCI are reclassified to income statement.
Equity investments at FVOCI
Debt investments at FVOCI
Financial assets at amortised
cost
Financial assets at FVTPL
A financial asset is measured at amortised cost if it meets both of the following conditions and is not designated as at FVTPL:
These assets are subsequently measured at fair value. Dividends are recognised as income
in income statement unless the dividend clearly represents a recovery of part of the cost of
the investment. Other net gains and losses are recognised in OCI and are never reclassified
to income statement.
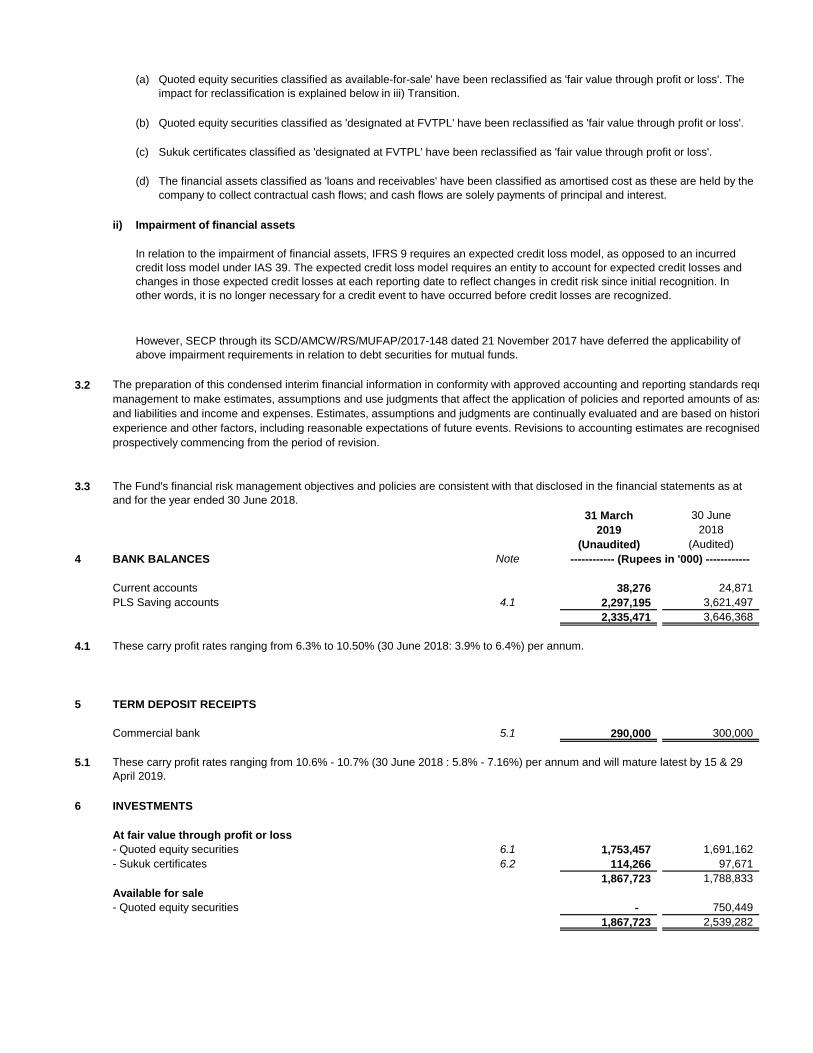
(a)
(b) Quoted equity securities classified as 'designated at FVTPL' have been reclassified as 'fair value through profit or loss'.
(c) Sukuk certificates classified as 'designated at FVTPL' have been reclassified as 'fair value through profit or loss'.
(d)
ii) Impairment of financial assets
3.2 The preparation of this condensed interim financial information in conformity with approved accounting and reporting standards requires
management to make estimates, assumptions and use judgments that affect the application of policies and reported amounts of assets
and liabilities and income and expenses. Estimates, assumptions and judgments are continually evaluated and are based on historical
experience and other factors, including reasonable expectations of future events. Revisions to accounting estimates are recognised
prospectively commencing from the period of revision.
3.3
31 March 30 June
2019 2018
(Unaudited) (Audited)
4 BANK BALANCES 5.1 Note
Current accounts 38,276 24,871
PLS Saving accounts 4.1 2,297,195 3,621,497
2,335,471 3,646,368
4.1
5 TERM DEPOSIT RECEIPTS
Commercial bank 5.1 290,000 300,000
5.1
6 INVESTMENTS
At fair value through profit or loss
- Quoted equity securities 6.1 1,753,457 1,691,162
- Sukuk certificates 6.2 114,266 97,671
1,867,723 1,788,833
Available for sale
- Quoted equity securities - 750,449
1,867,723 2,539,282
------------ (Rupees in '000) ------------
Quoted equity securities classified as available-for-sale' have been reclassified as 'fair value through profit or loss'. The
impact for reclassification is explained below in iii) Transition.
The financial assets classified as 'loans and receivables' have been classified as amortised cost as these are held by the
company to collect contractual cash flows; and cash flows are solely payments of principal and interest.
In relation to the impairment of financial assets, IFRS 9 requires an expected credit loss model, as opposed to an incurred
credit loss model under IAS 39. The expected credit loss model requires an entity to account for expected credit losses and
changes in those expected credit losses at each reporting date to reflect changes in credit risk since initial recognition. In
other words, it is no longer necessary for a credit event to have occurred before credit losses are recognized.
These carry profit rates ranging from 10.6% - 10.7% (30 June 2018 : 5.8% - 7.16%) per annum and will mature latest by 15 & 29
April 2019.
These carry profit rates ranging from 6.3% to 10.50% (30 June 2018: 3.9% to 6.4%) per annum.
However, SECP through its SCD/AMCW/RS/MUFAP/2017-148 dated 21 November 2017 have deferred the applicability of
above impairment requirements in relation to debt securities for mutual funds.
The Fund's financial risk management objectives and policies are consistent with that disclosed in the financial statements as at
and for the year ended 30 June 2018.
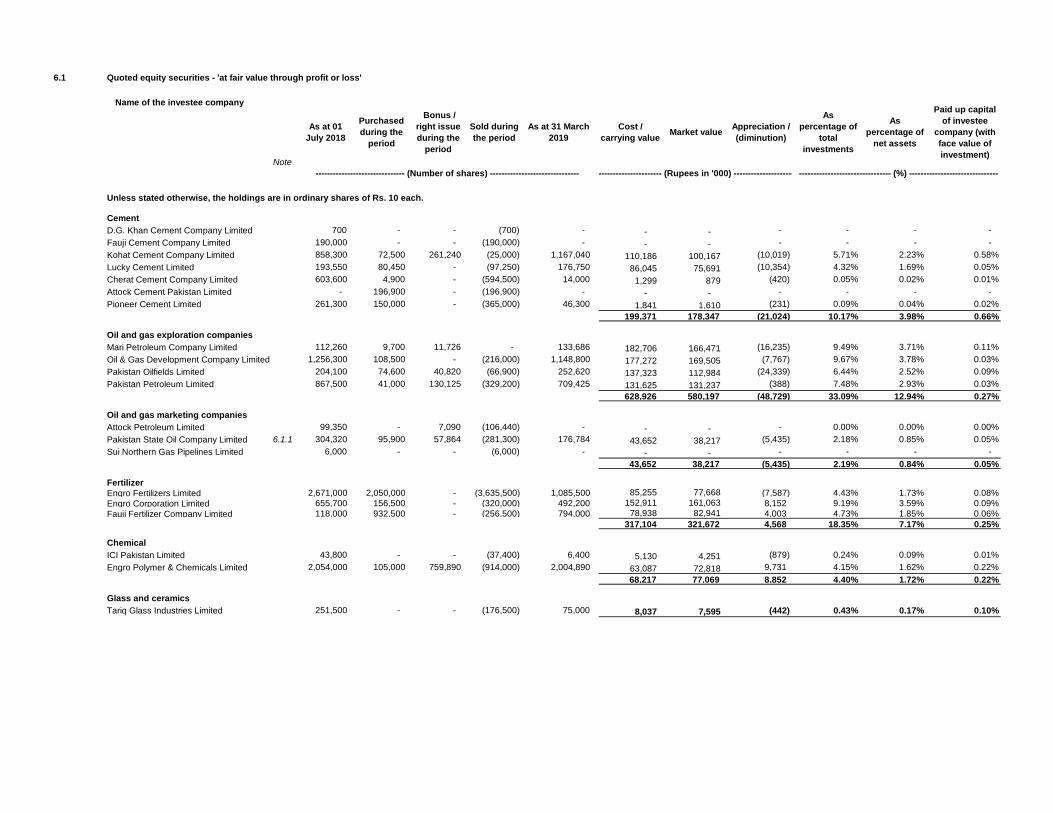
6.1 Quoted equity securities - 'at fair value through profit or loss'
Name of the investee company
Note
As at 01
July 2018
Purchased
during the
period
Bonus /
right issue
during the
period
Sold during
the period
As at 31 March
2019
Cost /
carrying valueMarket value
Appreciation /
(diminution)
As
percentage of
total
investments
As
percentage of
net assets
Paid up capital
of investee
company (with
face value of
investment)
Unless stated otherwise, the holdings are in ordinary shares of Rs. 10 each.
Cement
D.G. Khan Cement Company Limited 700 - - (700) - - - - - - -
Fauji Cement Company Limited 190,000 - - (190,000) - - - - - - -
Kohat Cement Company Limited 858,300 72,500 261,240 (25,000) 1,167,040 110,186 100,167 (10,019) 5.71% 2.23% 0.58%
Lucky Cement Limited 193,550 80,450 - (97,250) 176,750 86,045 75,691 (10,354) 4.32% 1.69% 0.05%
Cherat Cement Company Limited 603,600 4,900 - (594,500) 14,000 1,299 879 (420) 0.05% 0.02% 0.01%
Attock Cement Pakistan Limited - 196,900 - (196,900) - - - - - - -
Pioneer Cement Limited 261,300 150,000 - (365,000) 46,300 1,841 1,610 (231) 0.09% 0.04% 0.02%
199,371 178,347 (21,024) 10.17% 3.98% 0.66%
Oil and gas exploration companies
Mari Petroleum Company Limited 112,260 9,700 11,726 - 133,686 182,706 166,471 (16,235) 9.49% 3.71% 0.11%
Oil & Gas Development Company Limited 1,256,300 108,500 - (216,000) 1,148,800 177,272 169,505 (7,767) 9.67% 3.78% 0.03%
Pakistan Oilfields Limited 204,100 74,600 40,820 (66,900) 252,620 137,323 112,984 (24,339) 6.44% 2.52% 0.09%
Pakistan Petroleum Limited 867,500 41,000 130,125 (329,200) 709,425 131,625 131,237 (388) 7.48% 2.93% 0.03%
628,926 580,197 (48,729) 33.09% 12.94% 0.27%
Oil and gas marketing companies
Attock Petroleum Limited 99,350 - 7,090 (106,440) - - - - 0.00% 0.00% 0.00%
Pakistan State Oil Company Limited 6.1.1 304,320 95,900 57,864 (281,300) 176,784 43,652 38,217 (5,435) 2.18% 0.85% 0.05%
Sui Northern Gas Pipelines Limited 6,000 - - (6,000) - - - - - - -
43,652 38,217 (5,435) 2.19% 0.84% 0.05%
Fertilizer
Engro Fertilizers Limited 2,671,000 2,050,000 - (3,635,500) 1,085,500 85,255 77,668 (7,587) 4.43% 1.73% 0.08%
Engro Corporation Limited 655,700 156,500 - (320,000) 492,200 152,911 161,063 8,152 9.19% 3.59% 0.09%
Fauji Fertilizer Company Limited 118,000 932,500 - (256,500) 794,000 78,938 82,941 4,003 4.73% 1.85% 0.06%
317,104 321,672 4,568 18.35% 7.17% 0.25%
Chemical
ICI Pakistan Limited 43,800 - - (37,400) 6,400 5,130 4,251 (879) 0.24% 0.09% 0.01%
Engro Polymer & Chemicals Limited 2,054,000 105,000 759,890 (914,000) 2,004,890 63,087 72,818 9,731 4.15% 1.62% 0.22%
68,217 77,069 8,852 4.40% 1.72% 0.22%
Glass and ceramics
Tariq Glass Industries Limited 251,500 - - (176,500) 75,000 8,037 7,595 (442) 0.43% 0.17% 0.10%
-------------------------------- (%) -------------------------------------------------------------- (Number of shares) ------------------------------- ----------------------- (Rupees in '000) ----------------------
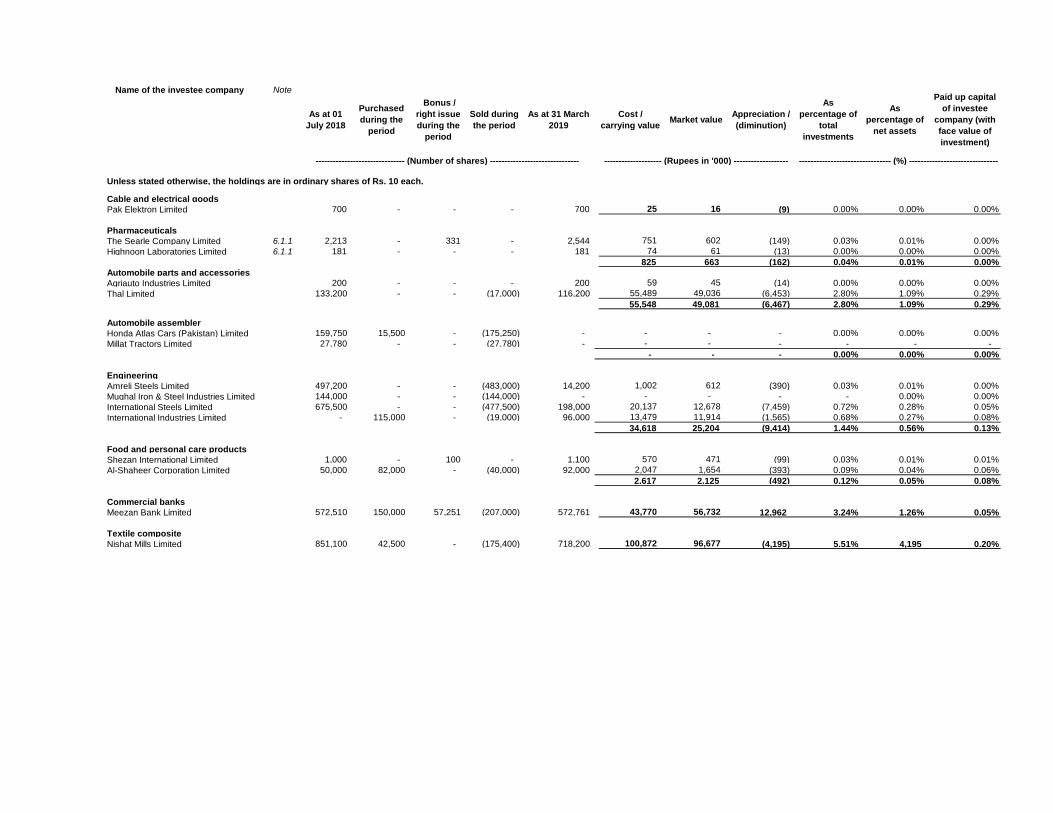
Name of the investee company Note
As at 01
July 2018
Purchased
during the
period
Bonus /
right issue
during the
period
Sold during
the period
As at 31 March
2019
Cost /
carrying valueMarket value
Appreciation /
(diminution)
As
percentage of
total
investments
As
percentage of
net assets
Paid up capital
of investee
company (with
face value of
investment)
Unless stated otherwise, the holdings are in ordinary shares of Rs. 10 each.
Cable and electrical goods
Pak Elektron Limited 700 - - - 700 25 16 (9) 0.00% 0.00% 0.00%
Pharmaceuticals
The Searle Company Limited 6.1.1 2,213 - 331 - 2,544 751 602 (149) 0.03% 0.01% 0.00%
Highnoon Laboratories Limited 6.1.1 181 - - - 181 74 61 (13) 0.00% 0.00% 0.00%
825 663 (162) 0.04% 0.01% 0.00%
Automobile parts and accessories
Agriauto Industries Limited 200 - - - 200 59 45 (14) 0.00% 0.00% 0.00%
Thal Limited 133,200 - - (17,000) 116,200 55,489 49,036 (6,453) 2.80% 1.09% 0.29%
55,548 49,081 (6,467) 2.80% 1.09% 0.29%
Automobile assembler
Honda Atlas Cars (Pakistan) Limited 159,750 15,500 - (175,250) - - - - 0.00% 0.00% 0.00%
Millat Tractors Limited 27,780 - - (27,780) - - - - - - -
- - - 0.00% 0.00% 0.00%
Engineering
Amreli Steels Limited 497,200 - - (483,000) 14,200 1,002 612 (390) 0.03% 0.01% 0.00%
Mughal Iron & Steel Industries Limited 144,000 - - (144,000) - - - - - 0.00% 0.00%
International Steels Limited 675,500 - - (477,500) 198,000 20,137 12,678 (7,459) 0.72% 0.28% 0.05%
International Industries Limited - 115,000 - (19,000) 96,000 13,479 11,914 (1,565) 0.68% 0.27% 0.08%
34,618 25,204 (9,414) 1.44% 0.56% 0.13%
Food and personal care products
Shezan International Limited 1,000 - 100 - 1,100 570 471 (99) 0.03% 0.01% 0.01%
Al-Shaheer Corporation Limited 50,000 82,000 - (40,000) 92,000 2,047 1,654 (393) 0.09% 0.04% 0.06%
2,617 2,125 (492) 0.12% 0.05% 0.08%
Commercial banks
Meezan Bank Limited 572,510 150,000 57,251 (207,000) 572,761 43,770 56,732 12,962 3.24% 1.26% 0.05%
Textile composite
Nishat Mills Limited 851,100 42,500 - (175,400) 718,200 100,872 96,677 (4,195) 5.51% 4,195 0.20%
-------------------------------- (%) -------------------------------------------------------------- (Number of shares) ------------------------------- -------------------- (Rupees in '000) -------------------
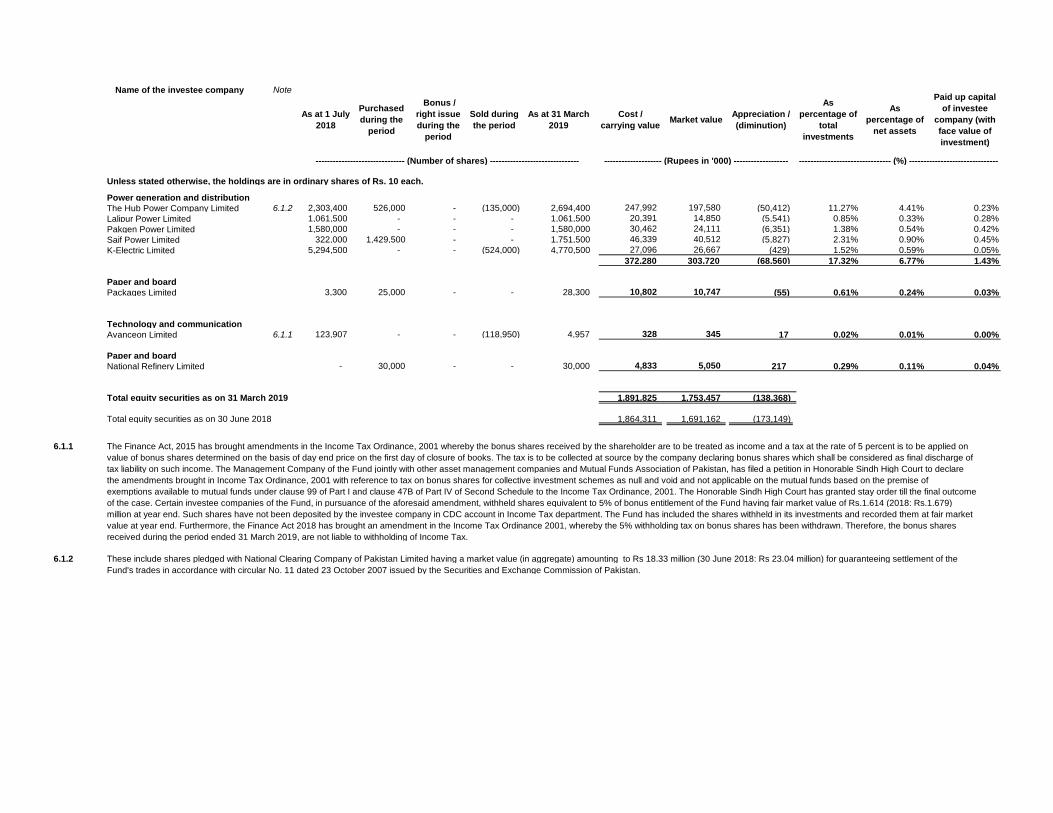
Name of the investee company Note
As at 1 July
2018
Purchased
during the
period
Bonus /
right issue
during the
period
Sold during
the period
As at 31 March
2019
Cost /
carrying valueMarket value
Appreciation /
(diminution)
As
percentage of
total
investments
As
percentage of
net assets
Paid up capital
of investee
company (with
face value of
investment)
Unless stated otherwise, the holdings are in ordinary shares of Rs. 10 each.
Power generation and distribution
The Hub Power Company Limited 6.1.2 2,303,400 526,000 - (135,000) 2,694,400 247,992 197,580 (50,412) 11.27% 4.41% 0.23%
Lalipur Power Limited 1,061,500 - - - 1,061,500 20,391 14,850 (5,541) 0.85% 0.33% 0.28%
Pakgen Power Limited 1,580,000 - - - 1,580,000 30,462 24,111 (6,351) 1.38% 0.54% 0.42%
Saif Power Limited 322,000 1,429,500 - - 1,751,500 46,339 40,512 (5,827) 2.31% 0.90% 0.45%
K-Electric Limited 5,294,500 - - (524,000) 4,770,500 27,096 26,667 (429) 1.52% 0.59% 0.05%
372,280 303,720 (68,560) 17.32% 6.77% 1.43%
Paper and board
Packages Limited 3,300 25,000 - - 28,300 10,802 10,747 (55) 0.61% 0.24% 0.03%
Technology and communication
Avanceon Limited 6.1.1 123,907 - - (118,950) 4,957 328 345 17 0.02% 0.01% 0.00%
Paper and board
National Refinery Limited - 30,000 - - 30,000 4,833 5,050 217 0.29% 0.11% 0.04%
Total equity securities as on 31 March 2019 1,891,825 1,753,457 (138,368)
Total equity securities as on 30 June 2018 1,864,311 1,691,162 (173,149)
6.1.1 The Finance Act, 2015 has brought amendments in the Income Tax Ordinance, 2001 whereby the bonus shares received by the shareholder are to be treated as income and a tax at the rate of 5 percent is to be applied on
value of bonus shares determined on the basis of day end price on the first day of closure of books. The tax is to be collected at source by the company declaring bonus shares which shall be considered as final discharge of
tax liability on such income. The Management Company of the Fund jointly with other asset management companies and Mutual Funds Association of Pakistan, has filed a petition in Honorable Sindh High Court to declare
the amendments brought in Income Tax Ordinance, 2001 with reference to tax on bonus shares for collective investment schemes as null and void and not applicable on the mutual funds based on the premise of
exemptions available to mutual funds under clause 99 of Part I and clause 47B of Part IV of Second Schedule to the Income Tax Ordinance, 2001. The Honorable Sindh High Court has granted stay order till the final outcome
of the case. Certain investee companies of the Fund, in pursuance of the aforesaid amendment, withheld shares equivalent to 5% of bonus entitlement of the Fund having fair market value of Rs.1.614 (2018: Rs.1.679)
million at year end. Such shares have not been deposited by the investee company in CDC account in Income Tax department. The Fund has included the shares withheld in its investments and recorded them at fair market
value at year end. Furthermore, the Finance Act 2018 has brought an amendment in the Income Tax Ordinance 2001, whereby the 5% withholding tax on bonus shares has been withdrawn. Therefore, the bonus shares
received during the period ended 31 March 2019, are not liable to withholding of Income Tax.
6.1.2 These include shares pledged with National Clearing Company of Pakistan Limited having a market value (in aggregate) amounting to Rs 18.33 million (30 June 2018: Rs 23.04 million) for guaranteeing settlement of the
Fund's trades in accordance with circular No. 11 dated 23 October 2007 issued by the Securities and Exchange Commission of Pakistan.
-------------------------------- (%) -------------------------------------------------------------- (Number of shares) ------------------------------- -------------------- (Rupees in '000) -------------------
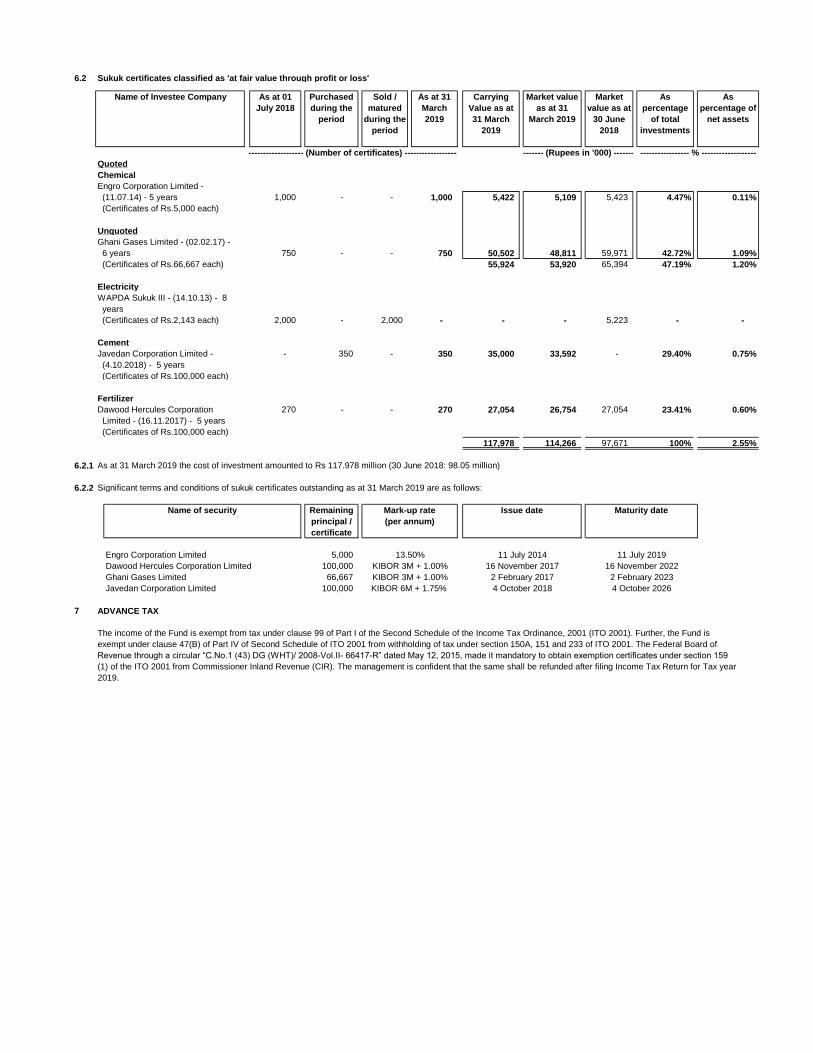
6.2 Sukuk certificates classified as 'at fair value through profit or loss'
As at 01
July 2018
Purchased
during the
period
Sold /
matured
during the
period
As at 31
March
2019
Carrying
Value as at
31 March
2019
Market value
as at 31
March 2019
Market
value as at
30 June
2018
As
percentage
of total
investments
As
percentage of
net assets
Quoted
Chemical
Engro Corporation Limited -
(11.07.14) - 5 years 1,000 - - 1,000 5,422 5,109 5,423 4.47% 0.11%
(Certificates of Rs.5,000 each)
Unquoted
Ghani Gases Limited - (02.02.17) -
6 years 750 - - 750 50,502 48,811 59,971 42.72% 1.09%
(Certificates of Rs.66,667 each) 55,924 53,920 65,394 47.19% 1.20%
Electricity
WAPDA Sukuk III - (14.10.13) - 8
years
(Certificates of Rs.2,143 each) 2,000 - 2,000 - - - 5,223 - -
Cement
Javedan Corporation Limited - - 350 - 350 35,000 33,592 - 29.40% 0.75%
(4.10.2018) - 5 years
(Certificates of Rs.100,000 each)
Fertilizer
Dawood Hercules Corporation 270 - - 270 27,054 26,754 27,054 23.41% 0.60%
Limited - (16.11.2017) - 5 years
(Certificates of Rs.100,000 each)
117,978 114,266 97,671 100% 2.55%
6.2.1 As at 31 March 2019 the cost of investment amounted to Rs 117.978 million (30 June 2018: 98.05 million)
6.2.2 Significant terms and conditions of sukuk certificates outstanding as at 31 March 2019 are as follows:
Engro Corporation Limited 5,000
Dawood Hercules Corporation Limited 100,000
Ghani Gases Limited 66,667
Javedan Corporation Limited 100,000
7 ADVANCE TAX
The income of the Fund is exempt from tax under clause 99 of Part I of the Second Schedule of the Income Tax Ordinance, 2001 (ITO 2001). Further, the Fund is
exempt under clause 47(B) of Part IV of Second Schedule of ITO 2001 from withholding of tax under section 150A, 151 and 233 of ITO 2001. The Federal Board of
Revenue through a circular “C.No.1 (43) DG (WHT)/ 2008-Vol.II- 66417-R” dated May 12, 2015, made it mandatory to obtain exemption certificates under section 159
(1) of the ITO 2001 from Commissioner Inland Revenue (CIR). The management is confident that the same shall be refunded after filing Income Tax Return for Tax year
2019.
KIBOR 6M + 1.75%
13.50%
KIBOR 3M + 1.00%
11 July 2019
16 November 2022
2 February 2023
4 October 2026
KIBOR 3M + 1.00%
16 November 2017
Name of Investee Company
---------------------- (Number of certificates) ---------------------- --------- (Rupees in '000) ---------
2 February 2017
4 October 2018
Remaining
principal /
certificate
11 July 2014
----------------- % -------------------
Name of security Mark-up rate
(per annum)
Issue date Maturity date
8 ACCRUED EXPENSES AND OTHER PAYABLES
8.1 Provision for Workers' Welfare Fund (WWF)
8.2 Provision for indirect taxes and duties
9 TAXATION
The Fund's income is exempt from Income Tax as per clause (99) of part I of the Second Schedule to the Income Tax Ordinance,
2001 subject to the condition that not less than 90% of the accounting income for the year as reduced by capital gains whether
realised or unrealised is distributed amongst the unit holders. Provided that for the purpose of determining distribution of at least
90% of accounting income, the income distributed through bonus shares, units or certificates as the case may be, shall not be
taken into account. Furthermore, as per regulation 63 of the Non-Banking Finance Companies and Notified Entities Regulations,
2008, the Fund is required to distribute 90% of the net accounting income other than capital gains to the unit holders. The Fund has
incurred net loss during the period and therefore no provision has been made in these condensed interim financial information.
10 EARNINGS PER UNIT
Earnings per unit (EPU) for respective Fund has not been disclosed in this condensed interim financial information as in the opinion
of the Management Company, the determination of the cumulative weighted average number of outstanding units is not practicable.
11 TOTAL EXPENSE RATIO
12 TRANSACTIONS WITH CONNECTED PERSONS / RELATED PARTIES
Connected persons / related parties comprise of United Bank Limited (Holding Company of Management Company), UBL Fund
Managers Limited (Management Company), Al - Ameen Islamic Financial Services (Private) Limited (Subsidiary of the Management
Company), entities under the common management or directorship, Central Depository Company of Pakistan Limited as trustee and
custodian of the Fund, the directors and officers of the Management Company and unit holders holding 10% or more of the Fund's
net assets.
Remuneration payable to the Management Company and the Trustee is determined in accordance with the provisions of the NBFC
Rules, NBFC Regulations and the Trust Deed respectively.
All other transactions with related parties / connected persons are in the normal course of business, at contracted rates and terms
determined in accordance with the market rates.
As per Directive 23 of 2016 dated July 20, 2016 issued by SECP, the Total Expense Ratio of the Fund is 2.19% as on March 31, 2019
and this includes 0.27% representing government levy, worker's welfare fund and SECP fee.
Had the SWWF not been provided for, the net assets value per unit would have been higher by Rs. 0.65 per unit (30 June 2018: Rs.
0.44 per unit).
There is no change in the status of the legal proceeding on this matter, which has been fully disclosed in note 18.2 to the annual
audited financial statements for the year ended 30 June 2018. As a matter of abundant caution, the Management Company has
maintained full provision for Federal Excise Duty (FED) till 30 June 2016. Had the provision not been provided for, the net assets value
per unit would have been higher by Rs. 0.12 per unit (30 June 2018: Rs. 0.08 per unit).
There is no change in the status of the legal proceeding on this matter, which has been fully disclosed in note 18.1 to the annual
audited financial statements for the year ended 30 June 2018. The Management Company, based on an opinion obtained by Mutual
Fund Association of Pakistan (MUFAP), believes that Mutual Funds are not liable to pay SIndh Workers' Welfare Fund (SWWF) under
the said law, for the reason that the Mutual Funds are not financial institutions and rather an investment vehicle. However, the Sindh
Revenue Board (SRB) has not accepted the said position of MUFAP and as a result, MUFAP has taken up this matter with the Sindh
Finance Ministry for resolution. Despite this, MUFAP recommended its members to make provision for SWWF on prudence basis.
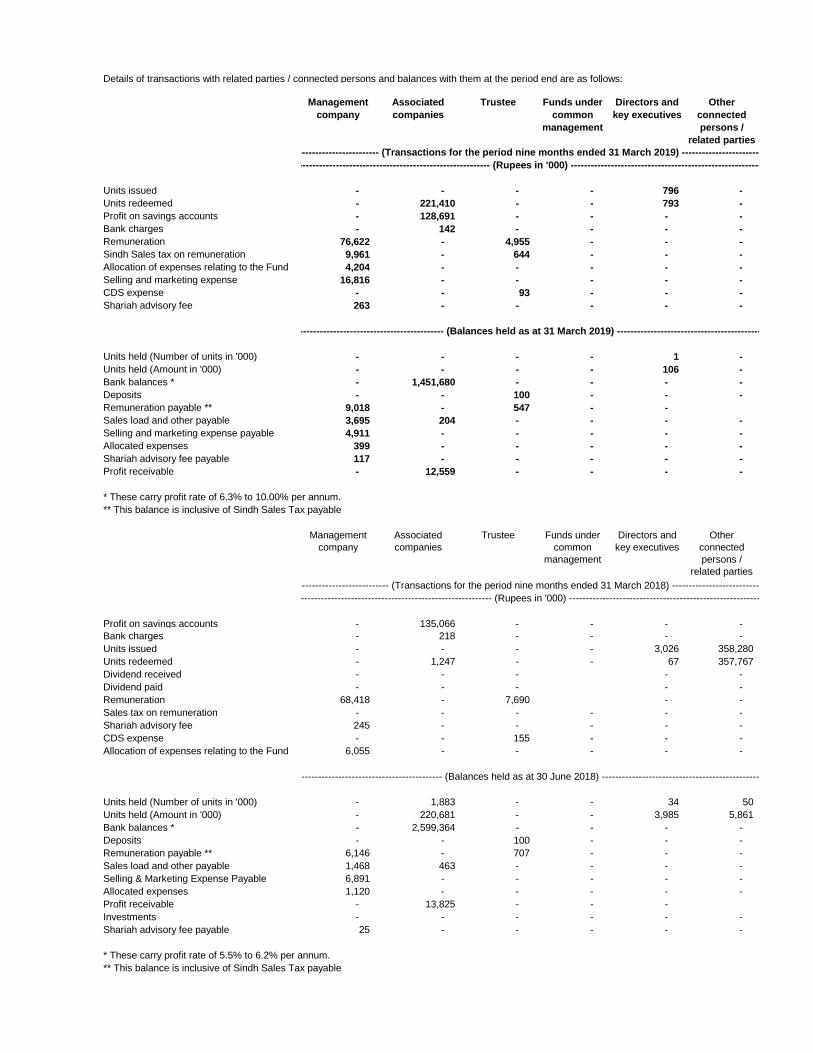
Details of transactions with related parties / connected persons and balances with them at the period end are as follows:
Management
company
Associated
companies
Trustee Funds under
common
management
Directors and
key executives
Other
connected
persons /
related parties
Units issued - - - - 796 -
Units redeemed - 221,410 - - 793 -
Profit on savings accounts - 128,691 - - - -
Bank charges - 142 - - - -
Remuneration 76,622 - 4,955 - - -
Sindh Sales tax on remuneration 9,961 - 644 - - -
Allocation of expenses relating to the Fund 4,204 - - - - -
Selling and marketing expense 16,816 - - - - -
CDS expense - - 93 - - -
Shariah advisory fee 263 - - - - -
Units held (Number of units in '000) - - - - 1 -
Units held (Amount in '000) - - - - 106 -
Bank balances * - 1,451,680 - - - -
Deposits - - 100 - - -
Remuneration payable ** 9,018 - 547 - -
Sales load and other payable 3,695 204 - - - -
Selling and marketing expense payable 4,911 - - - - -
Allocated expenses 399 - - - - -
Shariah advisory fee payable 117 - - - - -
Profit receivable - 12,559 - - - -
* These carry profit rate of 6.3% to 10.00% per annum.
** This balance is inclusive of Sindh Sales Tax payable
Management
company
Associated
companies
Trustee Funds under
common
management
Directors and
key executives
Other
connected
persons /
related parties
Profit on savings accounts - 135,066 - - - -
Bank charges - 218 - - - -
Units issued - - - - 3,026 358,280
Units redeemed - 1,247 - - 67 357,767
Dividend received - - - - -
Dividend paid - - - - -
Remuneration 68,418 - 7,690 - -
Sales tax on remuneration - - - - - -
Shariah advisory fee 245 - - - - -
CDS expense - - 155 - - -
Allocation of expenses relating to the Fund 6,055 - - - - -
Units held (Number of units in '000) - 1,883 - - 34 50
Units held (Amount in '000) - 220,681 - - 3,985 5,861
Bank balances * - 2,599,364 - - - -
Deposits - - 100 - - -
Remuneration payable ** 6,146 - 707 - - -
Sales load and other payable 1,468 463 - - - -
Selling & Marketing Expense Payable 6,891 - - - - -
Allocated expenses 1,120 - - - - -
Profit receivable - 13,825 - - -
Investments - - - - - -
Shariah advisory fee payable 25 - - - - -
* These carry profit rate of 5.5% to 6.2% per annum.
** This balance is inclusive of Sindh Sales Tax payable
------------------------------------------------ (Balances held as at 30 June 2018) -----------------------------------------------------
--------------------------------------------------------------------- (Rupees in '000) ---------------------------------------------------------------------
--------------------------------------------------------------------- (Rupees in '000) ---------------------------------------------------------------------
------------------------------------- (Transactions for the period nine months ended 31 March 2019) -------------------------------------
------------------------------------- (Transactions for the period nine months ended 31 March 2018) -------------------------------------
---------------------------------------------- (Balances held as at 31 March 2019) ----------------------------------------------
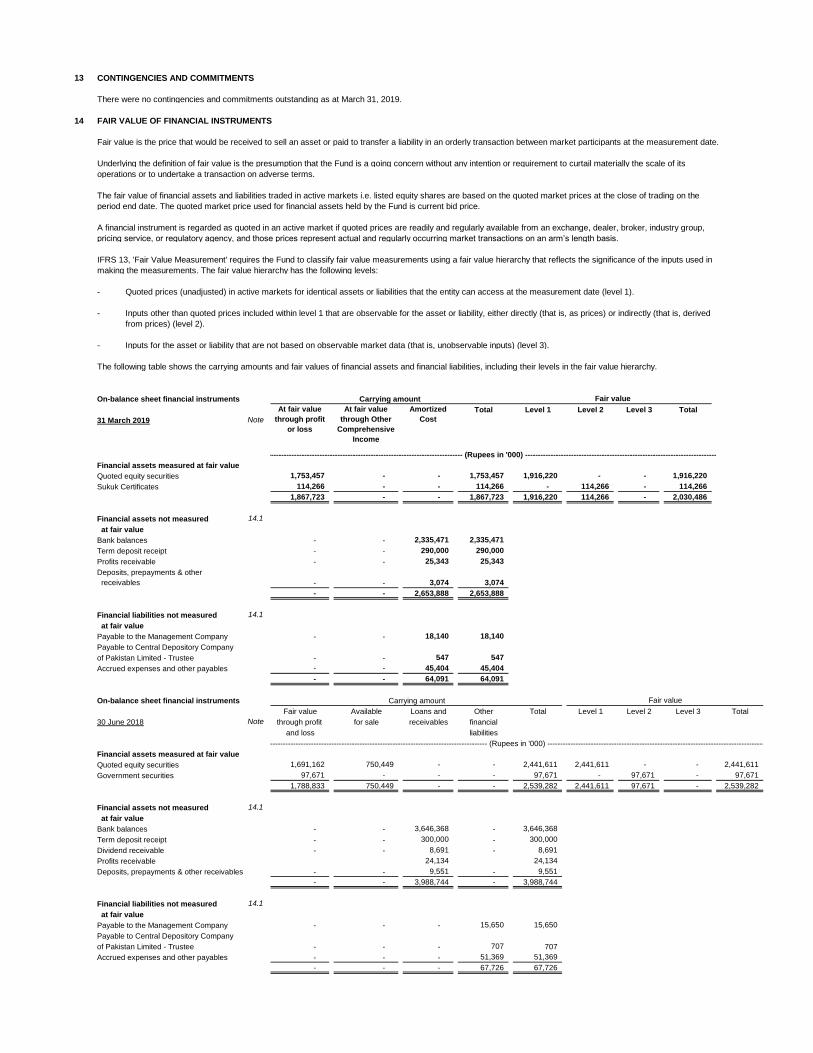
13 CONTINGENCIES AND COMMITMENTS
There were no contingencies and commitments outstanding as at March 31, 2019.
14 FAIR VALUE OF FINANCIAL INSTRUMENTS
Fair value is the price that would be received to sell an asset or paid to transfer a liability in an orderly transaction between market participants at the measurement date.
Underlying the definition of fair value is the presumption that the Fund is a going concern without any intention or requirement to curtail materially the scale of its
operations or to undertake a transaction on adverse terms.
The fair value of financial assets and liabilities traded in active markets i.e. listed equity shares are based on the quoted market prices at the close of trading on the
period end date. The quoted market price used for financial assets held by the Fund is current bid price.
A financial instrument is regarded as quoted in an active market if quoted prices are readily and regularly available from an exchange, dealer, broker, industry group,
pricing service, or regulatory agency, and those prices represent actual and regularly occurring market transactions on an arm‟s length basis.
IFRS 13, 'Fair Value Measurement' requires the Fund to classify fair value measurements using a fair value hierarchy that reflects the significance of the inputs used in
making the measurements. The fair value hierarchy has the following levels:
- Quoted prices (unadjusted) in active markets for identical assets or liabilities that the entity can access at the measurement date (level 1).
- Inputs other than quoted prices included within level 1 that are observable for the asset or liability, either directly (that is, as prices) or indirectly (that is, derived
from prices) (level 2).
- Inputs for the asset or liability that are not based on observable market data (that is, unobservable inputs) (level 3).
The following table shows the carrying amounts and fair values of financial assets and financial liabilities, including their levels in the fair value hierarchy.
On-balance sheet financial instruments
Total Level 1 Level 2 Level 3 Total
31 March 2019 Note
Financial assets measured at fair value
Quoted equity securities 1,753,457 - - 1,753,457 1,916,220 - - 1,916,220
Sukuk Certificates 114,266 - - 114,266 - 114,266 - 114,266
1,867,723 - - 1,867,723 1,916,220 114,266 - 2,030,486
Financial assets not measured 14.1
at fair value
Bank balances - - 2,335,471 2,335,471
Term deposit receipt - - 290,000 290,000
Profits receivable - - 25,343 25,343
Deposits, prepayments & other
receivables - - 3,074 3,074
- - 2,653,888 2,653,888
Financial liabilities not measured 14.1
at fair value
Payable to the Management Company - - 18,140 18,140
Payable to Central Depository Company
of Pakistan Limited - Trustee - - 547 547
Accrued expenses and other payables - - 45,404 45,404
- - 64,091 64,091
On-balance sheet financial instruments
Fair value Available Loans and Other Total Level 1 Level 2 Level 3 Total
30 June 2018 Note through profit for sale receivables financial
and loss liabilities
Financial assets measured at fair value
Quoted equity securities 1,691,162 750,449 - - 2,441,611 2,441,611 - - 2,441,611
Government securities 97,671 - - - 97,671 - 97,671 - 97,671
1,788,833 750,449 - - 2,539,282 2,441,611 97,671 - 2,539,282
Financial assets not measured 14.1
at fair value
Bank balances - - 3,646,368 - 3,646,368
Term deposit receipt - - 300,000 - 300,000
Dividend receivable - - 8,691 - 8,691
Profits receivable 24,134 24,134
Deposits, prepayments & other receivables - - 9,551 - 9,551
- - 3,988,744 - 3,988,744
Financial liabilities not measured 14.1
at fair value
Payable to the Management Company - - - 15,650 15,650
Payable to Central Depository Company
of Pakistan Limited - Trustee - - - 707 707
Accrued expenses and other payables - - - 51,369 51,369
- - - 67,726 67,726
Carrying amount Fair value
------------------------------------------------------------------------------------------------- (Rupees in '000) -------------------------------------------------------------------------------------------------
Carrying amount Fair value
At fair value
through profit
or loss
At fair value
through Other
Comprehensive
Income
Amortized
Cost
------------------------------------------------------------------------------------------------- (Rupees in '000) -------------------------------------------------------------------------------------------------
14.1 The Fund has not disclosed the fair values for these financial assets and financial liabilities, as these are either
short term in nature or reprice periodically. Therefore, their carrying amounts are reasonable approximation of
fair value.
15 GENERAL
15.1
16 DATE OF AUTHORISATION FOR ISSUE
16.1 This condensed interim financial information was authorized for issue by Board of Directors of the Management
Company on April 29, 2019.
____________________ ____________________ _________________
Chief Executive Officer Chief Financial Officer Director
For UBL Fund Managers Limited
(Management Company)
Figures have been rounded off to the nearest thousand of rupees unless otherwise stated.
SD SD SD
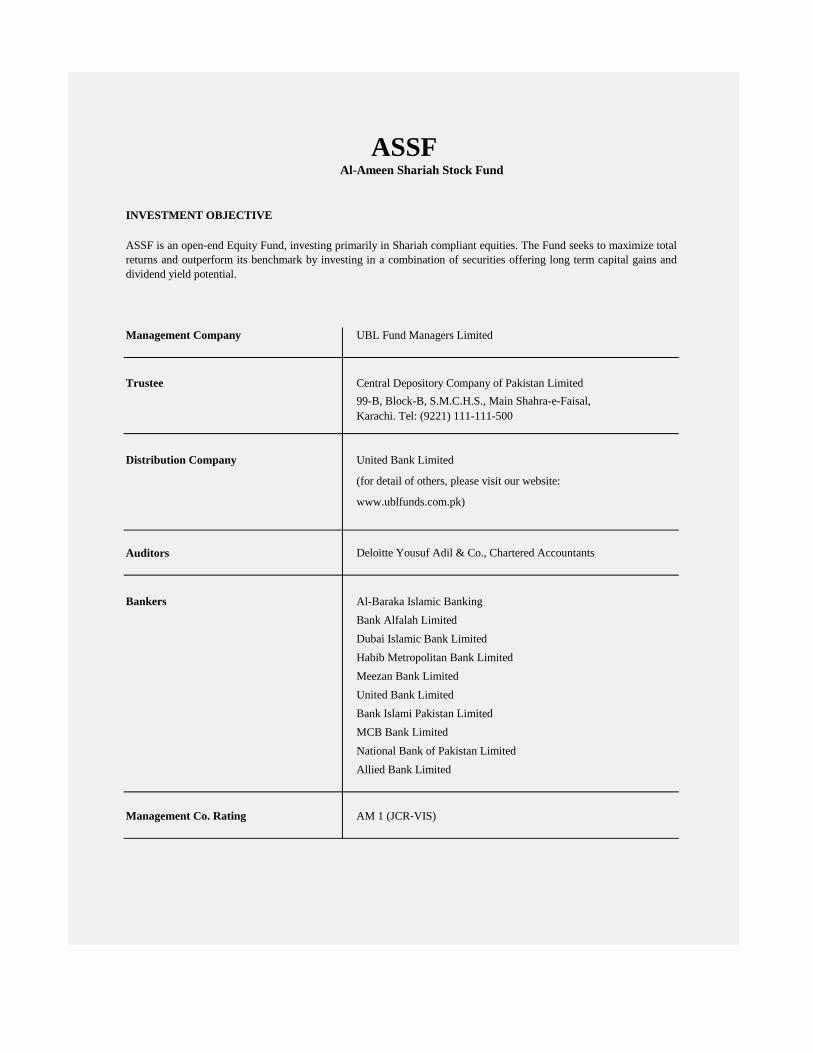
Management Company UBL Fund Managers Limited
Trustee Central Depository Company of Pakistan Limited
99-B, Block-B, S.M.C.H.S., Main Shahra-e-Faisal,
Karachi. Tel: (9221) 111-111-500
Distribution Company United Bank Limited
(for detail of others, please visit our website:
www.ublfunds.com.pk)
Auditors
Bankers Al-Baraka Islamic Banking
Bank Alfalah Limited
Dubai Islamic Bank Limited
Habib Metropolitan Bank Limited
Meezan Bank Limited
United Bank Limited
Bank Islami Pakistan Limited
MCB Bank Limited
National Bank of Pakistan Limited
Allied Bank Limited
Management Co. Rating AM 1 (JCR‐VIS)
Deloitte Yousuf Adil & Co., Chartered Accountants
ASSF Al-Ameen Shariah Stock Fund
INVESTMENT OBJECTIVE
ASSF is an open‐end Equity Fund, investing primarily in Shariah compliant equities. The Fund seeks to maximize total
returns and outperform its benchmark by investing in a combination of securities offering long term capital gains and
dividend yield potential.
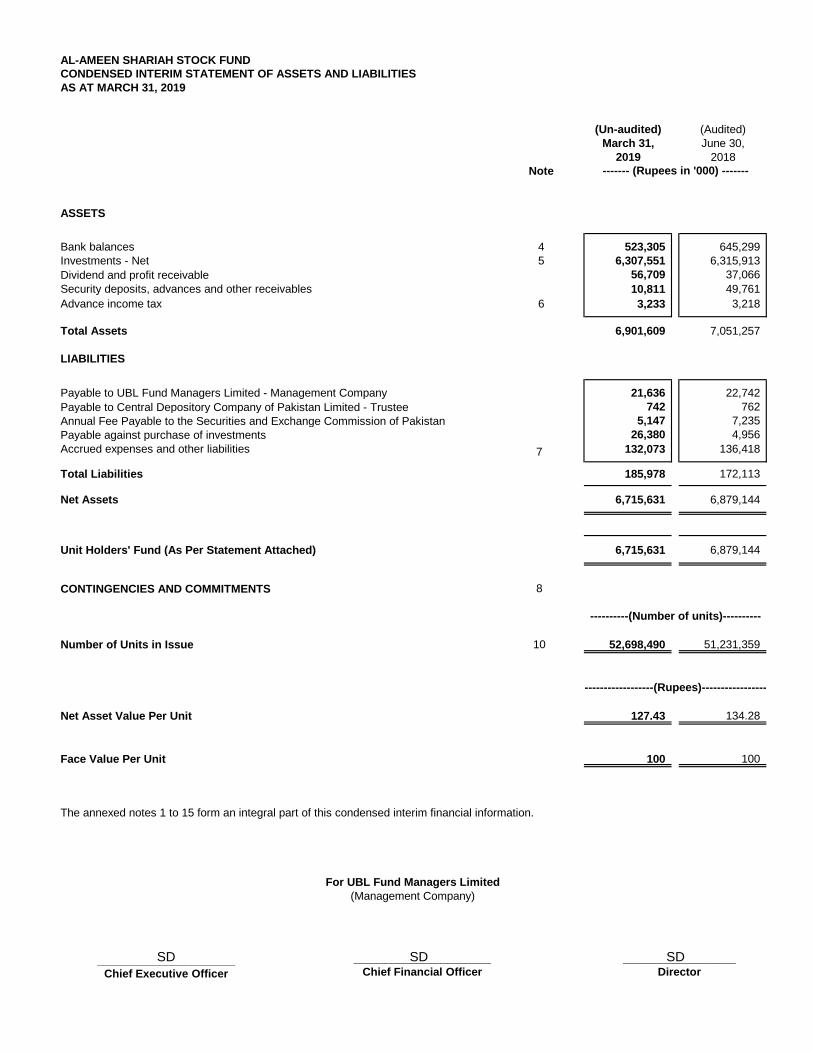
AL-AMEEN SHARIAH STOCK FUND
CONDENSED INTERIM STATEMENT OF ASSETS AND LIABILITIES
AS AT MARCH 31, 2019
(Un-audited) (Audited)
March 31, June 30,
2019 2018
Note
ASSETS
Bank balances 4 523,305 645,299
Investments - Net 5 6,307,551 6,315,913
Dividend and profit receivable 56,709 37,066
Security deposits, advances and other receivables 10,811 49,761
Advance income tax 6 3,233 3,218
Total Assets 6,901,609 7,051,257
LIABILITIES
Payable to UBL Fund Managers Limited - Management Company 21,636 22,742
Payable to Central Depository Company of Pakistan Limited - Trustee 742 762
Annual Fee Payable to the Securities and Exchange Commission of Pakistan 5,147 7,235
Payable against purchase of investments 26,380 4,956
Accrued expenses and other liabilities 7 132,073 136,418
Total Liabilities 185,978 172,113
Net Assets 6,715,631 6,879,144
Unit Holders' Fund (As Per Statement Attached) 6,715,631 6,879,144
CONTINGENCIES AND COMMITMENTS 8
Number of Units in Issue 10 52,698,490 51,231,359
Net Asset Value Per Unit 127.43 134.28
Face Value Per Unit 100 100
The annexed notes 1 to 15 form an integral part of this condensed interim financial information.
------- (Rupees in '000) -------
For UBL Fund Managers Limited
(Management Company)
----------(Number of units)----------
----------------------(Rupees)---------------------
______________________ Chief Executive Officer
______________________ Chief Financial Officer
__________________ Director
SD SD SD
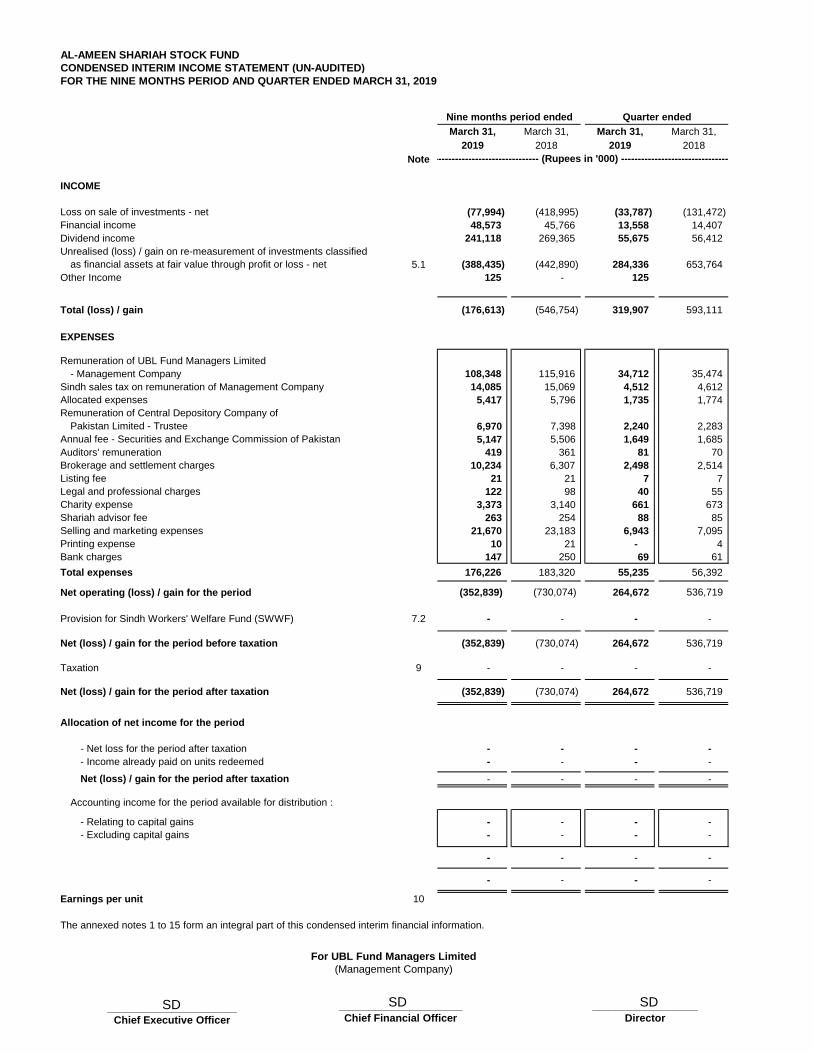
AL-AMEEN SHARIAH STOCK FUND
CONDENSED INTERIM INCOME STATEMENT (UN-AUDITED)
FOR THE NINE MONTHS PERIOD AND QUARTER ENDED MARCH 31, 2019
March 31, March 31, March 31, March 31,
2019 2018 2019 2018
Note
INCOME
Loss on sale of investments - net (77,994) (418,995) (33,787) (131,472)
Financial income 48,573 45,766 13,558 14,407
Dividend income 241,118 269,365 55,675 56,412
Unrealised (loss) / gain on re-measurement of investments classified
as financial assets at fair value through profit or loss - net 5.1 (388,435) (442,890) 284,336 653,764
Other Income 125 - 125
Total (loss) / gain (176,613) (546,754) 319,907 593,111
EXPENSES
Remuneration of UBL Fund Managers Limited
- Management Company 108,348 115,916 34,712 35,474
Sindh sales tax on remuneration of Management Company 14,085 15,069 4,512 4,612
Allocated expenses 5,417 5,796 1,735 1,774
Remuneration of Central Depository Company of
Pakistan Limited - Trustee 6,970 7,398 2,240 2,283
Annual fee - Securities and Exchange Commission of Pakistan 5,147 5,506 1,649 1,685
Auditors' remuneration 419 361 81 70
Brokerage and settlement charges 10,234 6,307 2,498 2,514
Listing fee 21 21 7 7
Legal and professional charges 122 98 40 55
Charity expense 3,373 3,140 661 673
Shariah advisor fee 263 254 88 85
Selling and marketing expenses 21,670 23,183 6,943 7,095
Printing expense 10 21 - 4
Bank charges 147 250 69 61
Total expenses 176,226 183,320 55,235 56,392
Net operating (loss) / gain for the period (352,839) (730,074) 264,672 536,719
Provision for Sindh Workers' Welfare Fund (SWWF) 7.2 - - - -
Net (loss) / gain for the period before taxation (352,839) (730,074) 264,672 536,719
Taxation 9 - - - -
Net (loss) / gain for the period after taxation (352,839) (730,074) 264,672 536,719
Allocation of net income for the period
- Net loss for the period after taxation - - - -
- Income already paid on units redeemed - - - -
Net (loss) / gain for the period after taxation - - - -
Accounting income for the period available for distribution :
- Relating to capital gains - - - -
- Excluding capital gains - - - -
- - - -
- - - -
Earnings per unit 10
The annexed notes 1 to 15 form an integral part of this condensed interim financial information.
Quarter endedNine months period ended
For UBL Fund Managers Limited
(Management Company)
------------------------------------ (Rupees in '000) --------------------------------------
______________________ Chief Executive Officer
_____________________ Chief Financial Officer
__________________ Director
SD SD SD
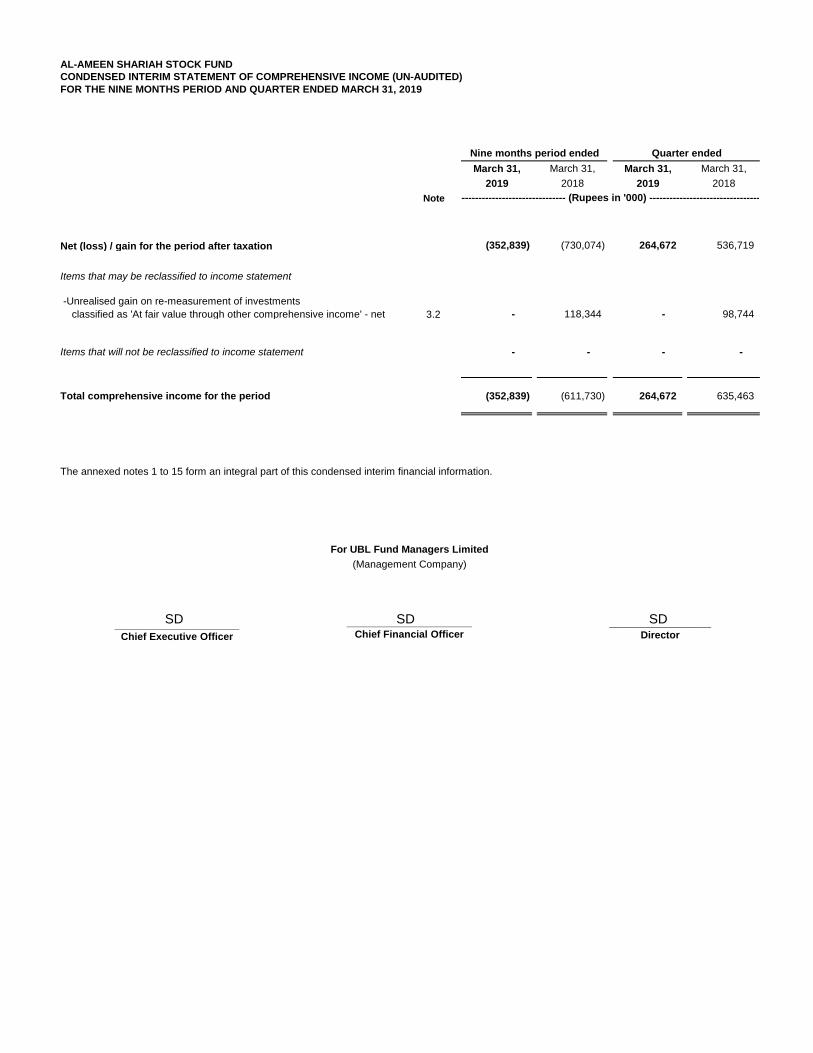
AL-AMEEN SHARIAH STOCK FUND
CONDENSED INTERIM STATEMENT OF COMPREHENSIVE INCOME (UN-AUDITED)
FOR THE NINE MONTHS PERIOD AND QUARTER ENDED MARCH 31, 2019
March 31, March 31, March 31, March 31,
2019 2018 2019 2018
Note
Net (loss) / gain for the period after taxation (352,839) (730,074) 264,672 536,719
Items that may be reclassified to income statement
classified as 'At fair value through other comprehensive income' - net 3.2 - 118,344 - 98,744
Items that will not be reclassified to income statement - - - -
Total comprehensive income for the period (352,839) (611,730) 264,672 635,463
The annexed notes 1 to 15 form an integral part of this condensed interim financial information.
For UBL Fund Managers Limited
(Management Company)
Quarter endedNine months period ended
-Unrealised gain on re-measurement of investments
------------------------------------ (Rupees in '000) --------------------------------------
______________________ Chief Executive Officer
______________________ Chief Financial Officer
__________________ Director
SD SD SD
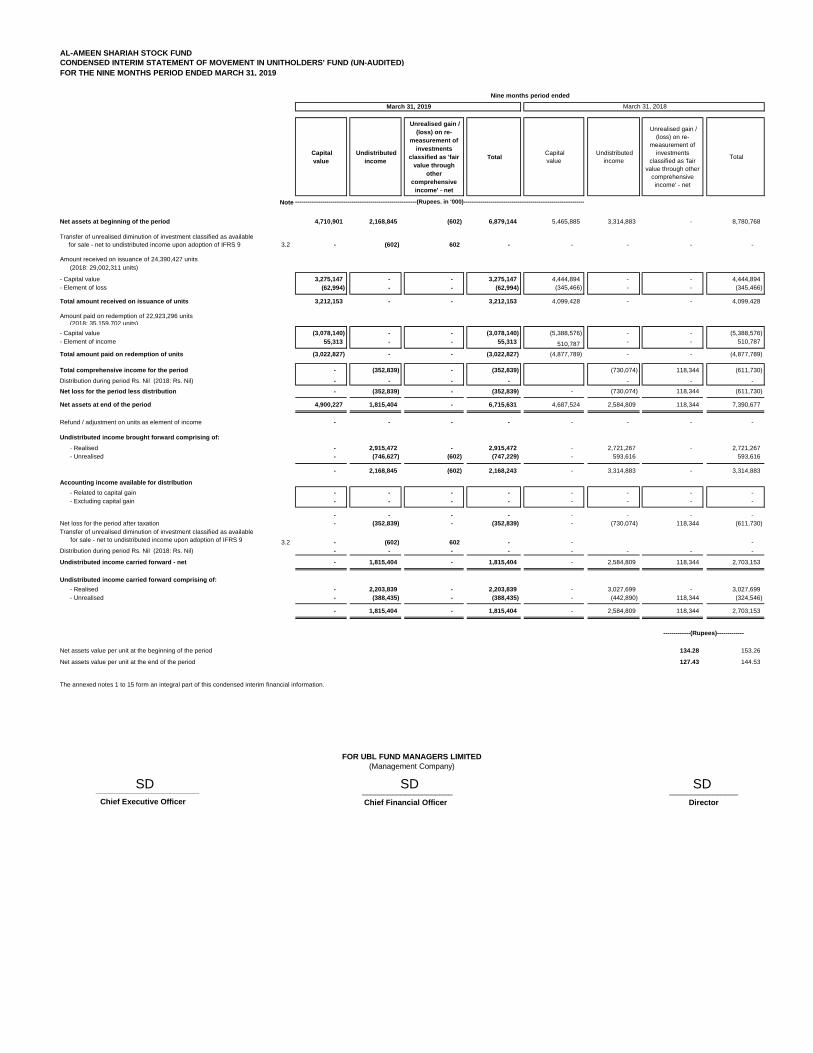
AL-AMEEN SHARIAH STOCK FUND
CONDENSED INTERIM STATEMENT OF MOVEMENT IN UNITHOLDERS' FUND (UN-AUDITED)
FOR THE NINE MONTHS PERIOD ENDED MARCH 31, 2019
Capital
value
Undistributed
income
Unrealised gain /
(loss) on re-
measurement of
investments
classified as 'fair
value through
other
comprehensive
income' - net
Total Capital
value
Undistributed
income
Unrealised gain /
(loss) on re-
measurement of
investments
classified as 'fair
value through other
comprehensive
income' - net
Total
Note
Net assets at beginning of the period 4,710,901 2,168,845 (602) 6,879,144 5,465,885 3,314,883 - 8,780,768
3.2 - (602) 602 - - - - -
Amount received on issuance of 24,390,427 units
(2018: 29,002,311 units)
- Capital value 3,275,147 - - 3,275,147 4,444,894 - - 4,444,894
- Element of loss (62,994) - - (62,994) (345,466) - - (345,466)
Total amount received on issuance of units 3,212,153 - - 3,212,153 4,099,428 - - 4,099,428
Amount paid on redemption of 22,923,296 units
(2018: 35,159,702 units)
- Capital value (3,078,140) - - (3,078,140) (5,388,576) - - (5,388,576)
- Element of income 55,313 - - 55,313 510,787 - - 510,787
Total amount paid on redemption of units (3,022,827) - - (3,022,827) (4,877,789) - - (4,877,789)
Total comprehensive income for the period - (352,839) - (352,839) (730,074) 118,344 (611,730)
- - - - - - -
Net loss for the period less distribution - (352,839) - (352,839) - (730,074) 118,344 (611,730)
Net assets at end of the period 4,900,227 1,815,404 - 6,715,631 4,687,524 2,584,809 118,344 7,390,677
Refund / adjustment on units as element of income - - - - - - - -
Undistributed income brought forward comprising of:
- Realised - 2,915,472 - 2,915,472 - 2,721,267 - 2,721,267
- Unrealised - (746,627) (602) (747,229) - 593,616 593,616
- 2,168,845 (602) 2,168,243 - 3,314,883 - 3,314,883
Accounting income available for distribution
- Related to capital gain - - - - - - - -
- Excluding capital gain - - - - - - - -
- - - - - - - -
- (352,839) - (352,839) - (730,074) 118,344 (611,730)
3.2 - (602) 602 - - -
- - - - - - - -
Undistributed income carried forward - net - 1,815,404 - 1,815,404 - 2,584,809 118,344 2,703,153
Undistributed income carried forward comprising of:
- Realised - 2,203,839 - 2,203,839 - 3,027,699 - 3,027,699
- Unrealised - (388,435) - (388,435) - (442,890) 118,344 (324,546)
- 1,815,404 - 1,815,404 - 2,584,809 118,344 2,703,153
Net assets value per unit at the beginning of the period 134.28 153.26
Net assets value per unit at the end of the period 127.43 144.53
The annexed notes 1 to 15 form an integral part of this condensed interim financial information.
________________________
Chief Executive Officer
Nine months period ended
FOR UBL FUND MANAGERS LIMITED
(Management Company)
_____________________
Chief Financial Officer Director
March 31, 2019
-----------------------------------------------------------------(Rupees. in '000)-----------------------------------------------------------------
Distribution during period Rs. Nil (2018: Rs. Nil)
________________
-------------(Rupees)-------------
Net loss for the period after taxation
Transfer of unrealised diminution of investment classified as available
for sale - net to undistributed income upon adoption of IFRS 9
Transfer of unrealised diminution of investment classified as available
for sale - net to undistributed income upon adoption of IFRS 9
Distribution during period Rs. Nil (2018: Rs. Nil)
March 31, 2018
SD SD SD
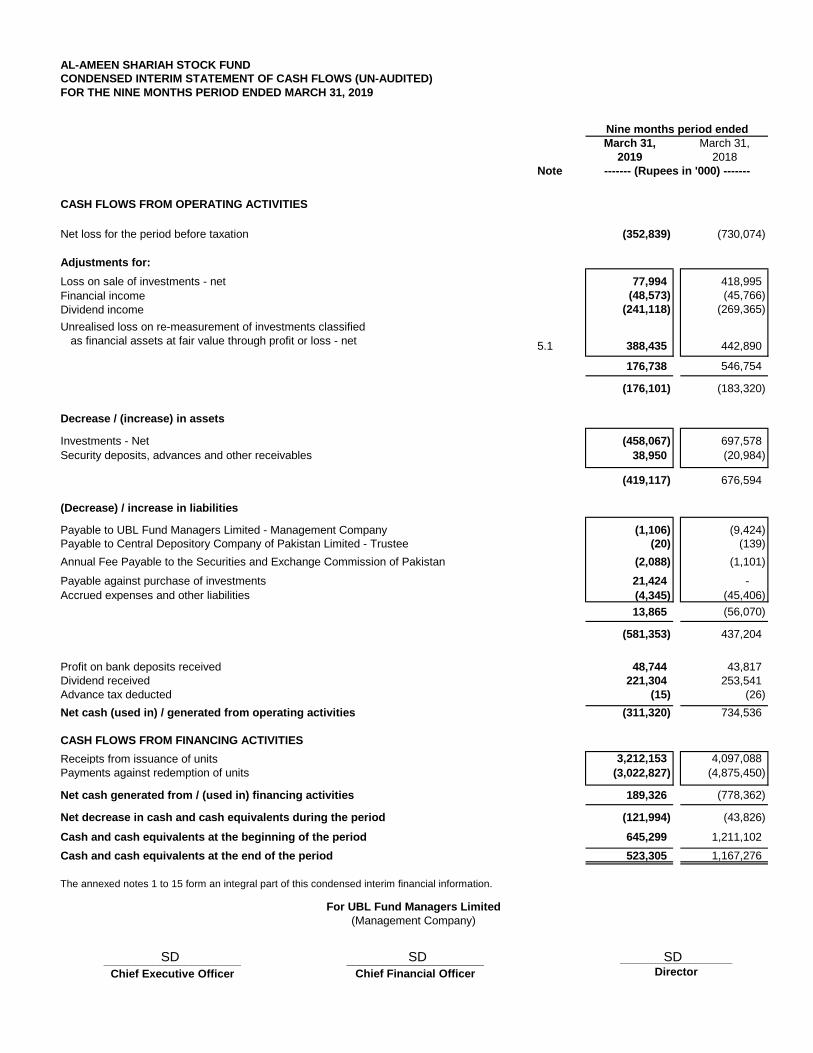
AL-AMEEN SHARIAH STOCK FUND
CONDENSED INTERIM STATEMENT OF CASH FLOWS (UN-AUDITED)
FOR THE NINE MONTHS PERIOD ENDED MARCH 31, 2019
March 31, March 31,
2019 2018
Note
CASH FLOWS FROM OPERATING ACTIVITIES
Net loss for the period before taxation (352,839) (730,074)
Adjustments for:
Loss on sale of investments - net 77,994 418,995
Financial income (48,573) (45,766)
Dividend income (241,118) (269,365)
Unrealised loss on re-measurement of investments classified
as financial assets at fair value through profit or loss - net 5.1 388,435 442,890
176,738 546,754
(176,101) (183,320)
Decrease / (increase) in assets
Investments - Net (458,067) 697,578
Security deposits, advances and other receivables 38,950 (20,984)
(419,117) 676,594
(Decrease) / increase in liabilities
Payable to UBL Fund Managers Limited - Management Company (1,106) (9,424)
Payable to Central Depository Company of Pakistan Limited - Trustee (20) (139)
Annual Fee Payable to the Securities and Exchange Commission of Pakistan (2,088) (1,101)
Payable against purchase of investments 21,424 -
Accrued expenses and other liabilities (4,345) (45,406)
13,865 (56,070)
(581,353) 437,204
Profit on bank deposits received 48,744 43,817
Dividend received 221,304 253,541
Advance tax deducted (15) (26)
Net cash (used in) / generated from operating activities (311,320) 734,536
CASH FLOWS FROM FINANCING ACTIVITIES
Receipts from issuance of units 3,212,153 4,097,088
Payments against redemption of units (3,022,827) (4,875,450)
Net cash generated from / (used in) financing activities 189,326 (778,362)
Net decrease in cash and cash equivalents during the period (121,994) (43,826)
Cash and cash equivalents at the beginning of the period 645,299 1,211,102
Cash and cash equivalents at the end of the period 523,305 1,167,276
Nine months period ended
------- (Rupees in '000) -------
For UBL Fund Managers Limited
(Management Company)
______________________ Chief Executive Officer
______________________ Chief Financial Officer
__________________ Director
The annexed notes 1 to 15 form an integral part of this condensed interim financial information.
SD SD SD
AL-AMEEN SHARIAH STOCK FUND
NOTES TO THE CONDENSED INTERIM FINANCIAL INFORMATION (UN-AUDITED)
FOR THE NINE MONTHS PERIOD ENDED MARCH 31, 2019
1. LEGAL STATUS AND NATURE OF BUSINESS
2. BASIS OF PREPARATION
2.1 Statement of compliance
2.1.1
2.1.2
2.1.3
2.1.4
Al-Ameen Shariah Stock Fund (the "Fund"), was established under the Trust Deed executed between UBL Fund Managers Limited
(the Management Company - a wholly owned subsidiary company of United Bank Limited), as the Management Company, and the
Central Depository Company of Pakistan Limited (CDC) as the Trustee. The Trust Deed was executed on September 11, 2006
and was approved by the Securities and Exchange Commission of Pakistan (SECP) on November 16, 2006 in accordance with the
requirements of the Non-Banking Finance Companies (Establishment and Regulation) Rules, 2003 (NBFC Rules). The Fund
commenced its operations from November 16, 2006.
Title to the assets of the Fund is held in the name of the Central Depository Company of Pakistan Limited as the Trustee of the
Fund.
The disclosures made in this condensed interim financial information have, however, been limited based on the requirements of
International Accounting Standard 34: 'Interim Financial Reporting'. This condensed interim financial information does not include
all the information and disclosures required in a full set of financial statements and should be read in conjunction with the annual
published audited financial statements of the Fund for the year ended June 30, 2018.
In compliance with Schedule V of the NBFC Regulations the directors of the Management Company hereby declare that this
condensed interim financial information gives a true and fair view of the state of the Fund’s affairs as at March 31, 2019.
The Fund is an open ended mutual fund categorised as Shariah Compliant Equity Fund and is listed on the Pakistan Stock
Exchange Limited. Units are offered for public subscription on a continuous basis. The units are transferable and can be
redeemed by surrendering them to the Fund at the option of the unitholders.
The Management Company of the Fund is registered with the SECP as a Non-Banking Finance Company under the NBFC Rules,
2003. The registered office of the Management Company is situated at 4th Floor, STSM Building, Beaumount Road, Civil Lines,
Karachi.
The investment objective of the Fund is to achieve long term capital growth by investing primarily in shariah compliant equity
securities. The Fund seeks to maximize total returns and outperform its benchmark by investing in a combination of securities
offering long term capital gains and dividend yield potential. The Fund invests in securities approved by the Shariah Advisory
Board.
JCR - VIS Credit Rating Company has re-affirmed management quality rating of AM1 (stable outlook) to the management
company as on December 27, 2018.
The comparative statement of asset and liabilities presented in this condensed interim financial information has been extracted
from the annual audited financial statements of the Fund for the year ended June 30, 2018, whereas the comparative condensed
interim income statement, condensed interim statement of comprehensive income, condensed interim distribution statement,
condensed interim statement of cash flows, condensed interim statement of movement in unit holders’ fund are extracted from the
unaudited condensed interim financial statements for the period ended March 31, 2018.
This condensed interim financial information has been prepared in accordance with the approved accounting standards as
applicable in Pakistan for interim financial reporting. The approved accounting standards comprise of such International Financial
Reporting Standards ("IFRSs") issued by the International Accounting Standards Boardas are notified under the Companies Act
2017, the requirements of the Trust Deed, the NBFC Rules, the Non-Banking Finance Companies and Notified Entities
Regulations, 2008 (the "NBFC Regulations") and the directives issued by the SECP. Wherever the requirements of the Trust
Deed, the NBFC Rules, the NBFC Regulations or the directives issued by the SECP differ with the requirements of the IFRS, the
requirements of theTrust Deed, the NBFC Rules, the NBFC Regulations or the directives issued by the SECP prevail.
2.2 Basis of measurement
2.3 Functional and presentation currency
3.
3.1
3.2 Impact of initial application of IFRS 9 Financial Instruments
Classification and measurement of financial assets and financial liabilities
-
-
-
-
In the current year, the Fund has applied IFRS 9 Financial Instruments (as revised in July 2014) and the related consequential
amendments to other IFRS Standards that are effective for an annual period that begins on or after July 01, 2018. The transition
provisions of IFRS 9 allow an entity not to restate comparatives. The Fund has elected not to restate comparatives in respect of
the classification and measurement of financial instruments.
IFRS 9 introduced new requirements for:
1) The classification and measurement of financial assets and financial liabilities;
2) Impairment of financial assets; and
3) General hedge accounting
Details of these new requirements as well as their impact on the Fund's financial statements are described below except the
General Hedge Accounting which the Fund does not apply. The Fund has applied IFRS 9 in accordance with the transition
provisions set out in IFRS 9.
it is held within a business model whose objective is to hold assets to collect contractual cash flows; and
its contractual terms give rise on specified dates to cash flows that are solely payments of principal and interest on the
principal amount outstanding.
A debt investment is measured at FVOCI if it meets both of the following conditions and is not designated as at FVTPL:
it is held within a business model whose objective is achieved by both collecting contractual cash flows and selling financial
'assets; and
its contractual terms give rise on specified dates to cash flows that are solely payments of principal and interest on the
principal amount outstanding.
The significant estimates, judgments and assumptions made by the management in applying the accounting policies and the key
sources of estimation uncertainty are the same as those applied to the annual published audited financial statements as at and for
the year ended June 30, 2018.
SIGNIFICANT ACCOUNTING AND RISK MANAGEMENT POLICIES, ACCOUNTING ESTIMATES, JUDGEMENT AND
CHANGES THEREIN
Under IFRS 9 'Financial Instruments', on initial recognition, a financial asset is classified as measured at: amortised cost; fair value
through other comprehensive income (FVOCI) – debt investment; FVOCI – equity investment; or fair value through profit and loss
(FVTPL). The classification of financial assets under IFRS 9 is generally based on the business model in which a financial asset is
managed and its contractual cash flow characteristics.
IFRS 9 largely retains the existing requirements in IAS 39 'Financial Instruments' for the classification and measurement of
financial liabilities. The adoption of IFRS 9 did not have a significant effect on the Fund’s accounting policies related to financial
liabilities. The impact of IFRS 9 on the classification and measurement of financial assets is set out below:
A financial asset is measured at amortised cost if it meets both of the following conditions and is not designated as at FVTPL:
The preparation of this condensed interim financial information in conformity with approved accounting standards requires
management to make estimates, assumptions and use judgements that affect the application of accounting policies and reported
amounts of assets, liabilities, income and expenses. Estimates, assumptions and judgments are continually evaluated and are
based on historical experience and other factors, including reasonable expectations of future events. Revisions to accounting
estimates are recognised prospectively commencing from the period of revision.
The accounting policies applied in the preparation of these condensed interim financial information are the same as those applied
in the preparation of the audited financial statements of the Fund for the year ended June 30, 2018 except as disclosed in note 3.2
.
Items included in the condensed interim financial information are measured using the currency of the primary economic
environment in which the Fund operates. This condensed interim financial information is presented in Pakistani Rupees which is
the Fund's functional and presentation currency.
This condensed interim financial information has been prepared under the historical cost convention, except that certain financial
assets are stated at fair value.
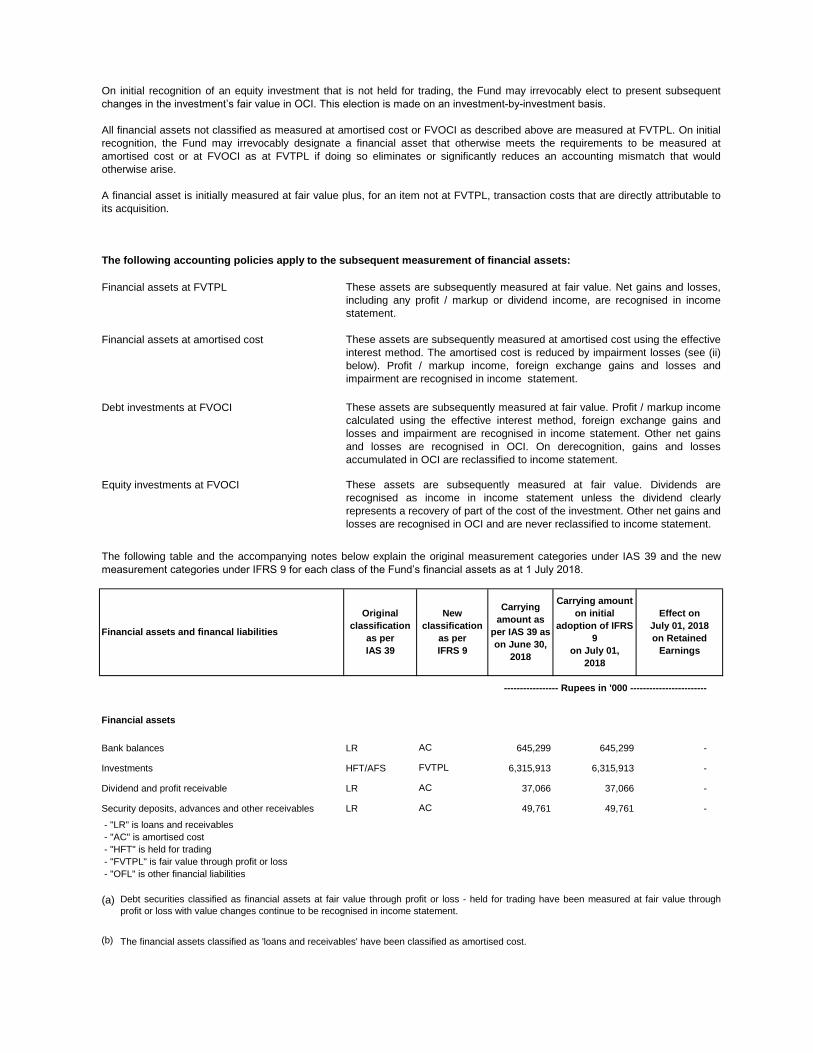
Financial assets at FVTPL
Financial assets at amortised cost
Debt investments at FVOCI
Equity investments at FVOCI
Financial assets
Bank balances LR 645,299 645,299 -
Investments HFT/AFS 6,315,913 6,315,913 -
Dividend and profit receivable LR 37,066 37,066 -
Security deposits, advances and other receivables LR 49,761 49,761 -
- "LR" is loans and receivables
- "AC" is amortised cost
- "HFT" is held for trading
- "FVTPL" is fair value through profit or loss
- "OFL" is other financial liabilities
(a)
(b) The financial assets classified as 'loans and receivables' have been classified as amortised cost.
On initial recognition of an equity investment that is not held for trading, the Fund may irrevocably elect to present subsequent
changes in the investment’s fair value in OCI. This election is made on an investment-by-investment basis.
These assets are subsequently measured at fair value. Profit / markup income
calculated using the effective interest method, foreign exchange gains and
losses and impairment are recognised in income statement. Other net gains
and losses are recognised in OCI. On derecognition, gains and losses
accumulated in OCI are reclassified to income statement.
These assets are subsequently measured at fair value. Dividends are
recognised as income in income statement unless the dividend clearly
represents a recovery of part of the cost of the investment. Other net gains and
losses are recognised in OCI and are never reclassified to income statement.
The following table and the accompanying notes below explain the original measurement categories under IAS 39 and the new
measurement categories under IFRS 9 for each class of the Fund’s financial assets as at 1 July 2018.
The following accounting policies apply to the subsequent measurement of financial assets:
These assets are subsequently measured at fair value. Net gains and losses,
including any profit / markup or dividend income, are recognised in income
statement.
All financial assets not classified as measured at amortised cost or FVOCI as described above are measured at FVTPL. On initial
recognition, the Fund may irrevocably designate a financial asset that otherwise meets the requirements to be measured at
amortised cost or at FVOCI as at FVTPL if doing so eliminates or significantly reduces an accounting mismatch that would
otherwise arise.
Effect on
July 01, 2018
on Retained
Earnings
AC
----------------- Rupees in '000 ------------------------
AC
FVTPL
AC
Financial assets and financal liabilities
Original
classification
as per
IAS 39
New
classification
as per
IFRS 9
Carrying
amount as
per IAS 39 as
on June 30,
2018
Carrying amount
on initial
adoption of IFRS
9
on July 01,
2018
Debt securities classified as financial assets at fair value through profit or loss - held for trading have been measured at fair value through
profit or loss with value changes continue to be recognised in income statement.
A financial asset is initially measured at fair value plus, for an item not at FVTPL, transaction costs that are directly attributable to
its acquisition.
These assets are subsequently measured at amortised cost using the effective
interest method. The amortised cost is reduced by impairment losses (see (ii)
below). Profit / markup income, foreign exchange gains and losses and
impairment are recognised in income statement.
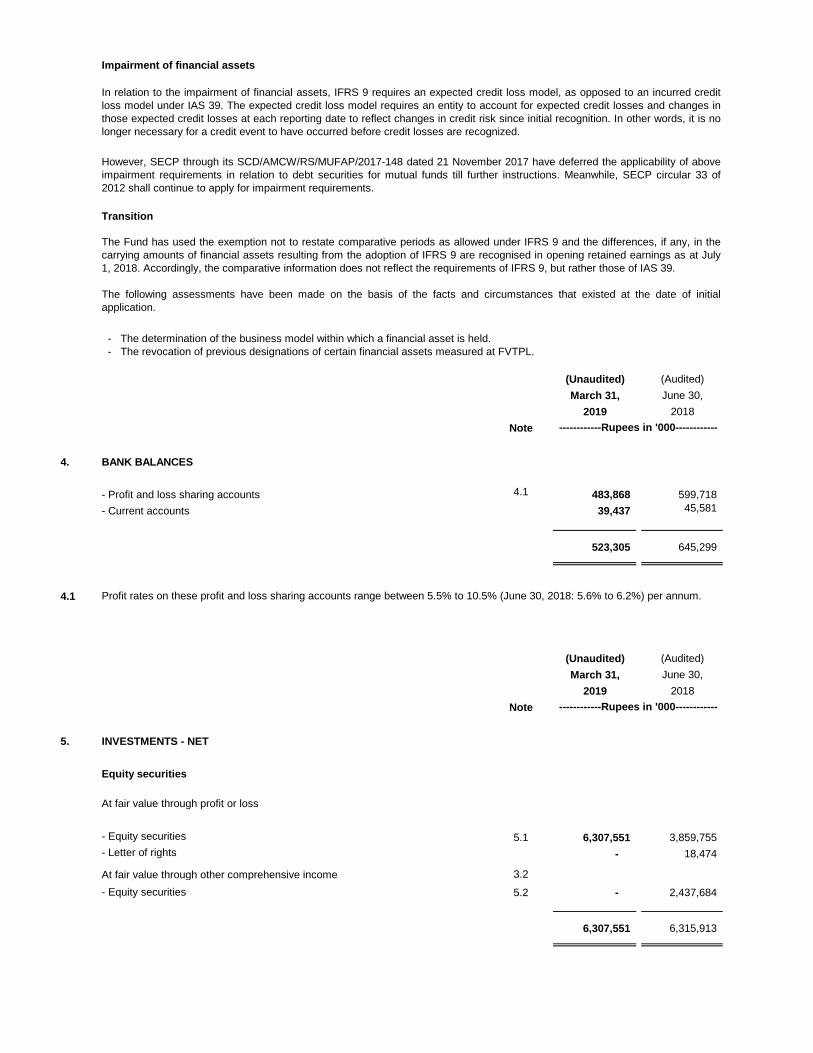
Impairment of financial assets
Transition
- The determination of the business model within which a financial asset is held.
- The revocation of previous designations of certain financial assets measured at FVTPL.
(Unaudited) (Audited)
March 31, June 30,
2019 2018
Note
4. BANK BALANCES
- Profit and loss sharing accounts 4.1 483,868 599,718
- Current accounts 39,437 45,581
523,305 645,299
(Unaudited) (Audited)
March 31, June 30,
2019 2018
Note
5. INVESTMENTS - NET
Equity securities
- Equity securities 5.1 6,307,551 3,859,755
- Letter of rights - 18,474
3.2
- Equity securities 5.2 - 2,437,684
6,307,551 6,315,913
4.1
------------Rupees in '000------------
------------Rupees in '000------------
Profit rates on these profit and loss sharing accounts range between 5.5% to 10.5% (June 30, 2018: 5.6% to 6.2%) per annum.
In relation to the impairment of financial assets, IFRS 9 requires an expected credit loss model, as opposed to an incurred credit
loss model under IAS 39. The expected credit loss model requires an entity to account for expected credit losses and changes in
those expected credit losses at each reporting date to reflect changes in credit risk since initial recognition. In other words, it is no
longer necessary for a credit event to have occurred before credit losses are recognized.
At fair value through profit or loss
At fair value through other comprehensive income
However, SECP through its SCD/AMCW/RS/MUFAP/2017-148 dated 21 November 2017 have deferred the applicability of above
impairment requirements in relation to debt securities for mutual funds till further instructions. Meanwhile, SECP circular 33 of
2012 shall continue to apply for impairment requirements.
The Fund has used the exemption not to restate comparative periods as allowed under IFRS 9 and the differences, if any, in the
carrying amounts of financial assets resulting from the adoption of IFRS 9 are recognised in opening retained earnings as at July
1, 2018. Accordingly, the comparative information does not reflect the requirements of IFRS 9, but rather those of IAS 39.
The following assessments have been made on the basis of the facts and circumstances that existed at the date of initial
application.
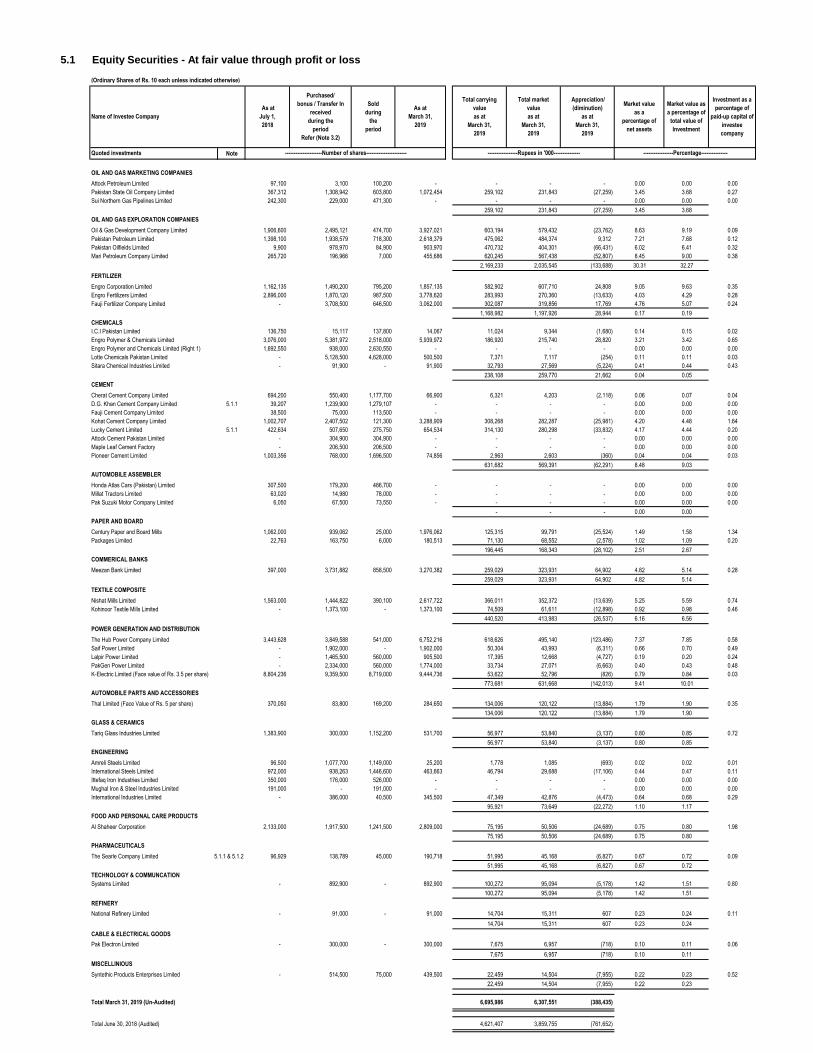
5.1 Equity Securities - At fair value through profit or loss
(Ordinary Shares of Rs. 10 each unless indicated otherwise)
Note
OIL AND GAS MARKETING COMPANIES
APL Attock Petroleum Limited 97,100 3,100 100,200 - - - - 0.00 0.00 0.00
PSO Pakistan State Oil Company Limited 367,312 1,308,942 603,800 1,072,454 259,102 231,843 (27,259) 3.45 3.68 0.27
SNGP Sui Northern Gas Pipelines Limited 242,300 229,000 471,300 - - - - 0.00 0.00 0.00
259,102 231,843 (27,259) 3.45 3.68
OIL AND GAS EXPLORATION COMPANIES
OGDC Oil & Gas Development Company Limited 1,906,600 2,495,121 474,700 3,927,021 603,194 579,432 (23,762) 8.63 9.19 0.09
PPL Pakistan Petroleum Limited 1,398,100 1,938,579 718,300 2,618,379 475,062 484,374 9,312 7.21 7.68 0.12
POL Pakistan Oilfields Limited 9,900 978,970 84,900 903,970 470,732 404,301 (66,431) 6.02 6.41 0.32
MARI Mari Petroleum Company Limited 265,720 196,966 7,000 455,686 620,245 567,438 (52,807) 8.45 9.00 0.38
2,169,233 2,035,545 (133,688) 30.31 32.27
FERTILIZER
ENGRO Engro Corporation Limited 1,162,135 1,490,200 795,200 1,857,135 582,902 607,710 24,808 9.05 9.63 0.35
EFERT Engro Fertilizers Limited 2,896,000 1,870,120 987,500 3,778,620 283,993 270,360 (13,633) 4.03 4.29 0.28
FFC Fauji Fertilizer Company Limited - 3,708,500 646,500 3,062,000 302,087 319,856 17,769 4.76 5.07 0.24
1,168,982 1,197,926 28,944 0.17 0.19
CHEMICALS
ICI I.C.I Pakistan Limited 136,750 15,117 137,800 14,067 11,024 9,344 (1,680) 0.14 0.15 0.02
EPCL Engro Polymer & Chemicals Limited 3,076,000 5,381,972 2,518,000 5,939,972 186,920 215,740 28,820 3.21 3.42 0.65
Engro Polymer and Chemicals Limited (Right 1) 1,692,550 938,000 2,630,550 - - - - 0.00 0.00 0.00
Lotchem Lotte Chemicals Pakistan Limited - 5,128,500 4,628,000 500,500 7,371 7,117 (254) 0.11 0.11 0.03
sitc Sitara Chemical Industries Limited - 91,900 - 91,900 32,793 27,569 (5,224) 0.41 0.44 0.43
238,108 259,770 21,662 0.04 0.05
CEMENT
CHCC Cherat Cement Company Limited 694,200 550,400 1,177,700 66,900 6,321 4,203 (2,118) 0.06 0.07 0.04
DGKC D.G. Khan Cement Company Limited 5.1.1 39,207 1,239,900 1,279,107 - - - - 0.00 0.00 0.00
FCCL Fauji Cement Company Limited 38,500 75,000 113,500 - - - - 0.00 0.00 0.00
KOHC Kohat Cement Company Limited 1,002,707 2,407,502 121,300 3,288,909 308,268 282,287 (25,981) 4.20 4.48 1.64
LUCK Lucky Cement Limited 5.1.1 422,634 507,650 275,750 654,534 314,130 280,298 (33,832) 4.17 4.44 0.20
acpl Attock Cement Pakistan Limited - 304,900 304,900 - - - - 0.00 0.00 0.00
MLCF Maple Leaf Cement Factory - 206,500 206,500 - - - - 0.00 0.00 0.00
PIOC Pioneer Cement Limited 1,003,356 768,000 1,696,500 74,856 2,963 2,603 (360) 0.04 0.04 0.03
631,682 569,391 (62,291) 8.48 9.03
AUTOMOBILE ASSEMBLER
HCAR Honda Atlas Cars (Pakistan) Limited 307,500 179,200 486,700 - - - - 0.00 0.00 0.00
MTL Millat Tractors Limited 63,020 14,980 78,000 - - - - 0.00 0.00 0.00
PSMC Pak Suzuki Motor Company Limited 6,050 67,500 73,550 - - - - 0.00 0.00 0.00
- - - 0.00 0.00
PAPER AND BOARD
CEPB Century Paper and Board Mills 1,062,000 939,062 25,000 1,976,062 125,315 99,791 (25,524) 1.49 1.58 1.34
PKGS Packages Limited 22,763 163,750 6,000 180,513 71,130 68,552 (2,578) 1.02 1.09 0.20
196,445 168,343 (28,102) 2.51 2.67
COMMERICAL BANKS
MEBL Meezan Bank Limited 397,000 3,731,882 858,500 3,270,382 259,029 323,931 64,902 4.82 5.14 0.28
259,029 323,931 64,902 4.82 5.14
TEXTILE COMPOSITE
NML Nishat Mills Limited 1,563,000 1,444,822 390,100 2,617,722 366,011 352,372 (13,639) 5.25 5.59 0.74
KTML Kohinoor Textile Mills Limited - 1,373,100 - 1,373,100 74,509 61,611 (12,898) 0.92 0.98 0.46
440,520 413,983 (26,537) 6.16 6.56
POWER GENERATION AND DISTRIBUTION
HUBC The Hub Power Company Limited 3,443,628 3,849,588 541,000 6,752,216 618,626 495,140 (123,486) 7.37 7.85 0.58
SPWL Saif Power Limited - 1,902,000 - 1,902,000 50,304 43,993 (6,311) 0.66 0.70 0.49
LPL Lalpir Power Limited - 1,465,500 560,000 905,500 17,395 12,668 (4,727) 0.19 0.20 0.24
PKGP PakGen Power Limited - 2,334,000 560,000 1,774,000 33,734 27,071 (6,663) 0.40 0.43 0.48
KEL K-Electric Limited (Face value of Rs. 3.5 per share) 8,804,236 9,359,500 8,719,000 9,444,736 53,622 52,796 (826) 0.79 0.84 0.03
773,681 631,668 (142,013) 9.41 10.01
AUTOMOBILE PARTS AND ACCESSORIES
Thall Thal Limited (Face Value of Rs. 5 per share) 370,050 83,800 169,200 284,650 134,006 120,122 (13,884) 1.79 1.90 0.35
134,006 120,122 (13,884) 1.79 1.90
GLASS & CERAMICS
TGL Tariq Glass Industries Limited 1,383,900 300,000 1,152,200 531,700 56,977 53,840 (3,137) 0.80 0.85 0.72
56,977 53,840 (3,137) 0.80 0.85
ENGINEERING
ASTL Amreli Steels Limited 96,500 1,077,700 1,149,000 25,200 1,778 1,085 (693) 0.02 0.02 0.01
ISL International Steels Limited 972,000 938,263 1,446,600 463,663 46,794 29,688 (17,106) 0.44 0.47 0.11
ITTEFAQ Ittefaq Iron Industries Limited 350,000 176,000 526,000 - - - - 0.00 0.00 0.00
MUGHAL Mughal Iron & Steel Industries Limited 191,000 - 191,000 - - - - 0.00 0.00 0.00
INIL International Industries Limited - 386,000 40,500 345,500 47,349 42,876 (4,473) 0.64 0.68 0.29
95,921 73,649 (22,272) 1.10 1.17
FOOD AND PERSONAL CARE PRODUCTS
ASC Al Shaheer Corporation 2,133,000 1,917,500 1,241,500 2,809,000 75,195 50,506 (24,689) 0.75 0.80 1.98
75,195 50,506 (24,689) 0.75 0.80
PHARMACEUTICALS
SEARL The Searle Company Limited 5.1.1 & 5.1.2 96,929 138,789 45,000 190,718 51,995 45,168 (6,827) 0.67 0.72 0.09
51,995 45,168 (6,827) 0.67 0.72
TECHNOLOGY & COMMUNCATION
SYS Systems Limited - 892,900 - 892,900 100,272 95,094 (5,178) 1.42 1.51 0.80
100,272 95,094 (5,178) 1.42 1.51
REFINERY
NRL National Refinery Limited - 91,000 - 91,000 14,704 15,311 607 0.23 0.24 0.11
14,704 15,311 607 0.23 0.24
CABLE & ELECTRICAL GOODS
PAEL Pak Electron Limited - 300,000 - 300,000 7,675 6,957 (718) 0.10 0.11 0.06
7,675 6,957 (718) 0.10 0.11
MISCELLINIOUS
SPEL Syntethic Products Enterprises Limited - 514,500 75,000 439,500 22,459 14,504 (7,955) 0.22 0.23 0.52
22,459 14,504 (7,955) 0.22 0.23
Total March 31, 2019 (Un-Audited) 6,695,986 6,307,551 (388,435)
Total June 30, 2018 (Audited) 4,621,407 3,859,755 (761,652)
Investment as a
percentage of
paid-up capital of
investee
company
-----------------Rupees in '000--------------- -----------------Percentage---------------
Total carrying
value
as at
March 31,
2019
Total market
value
as at
March 31,
2019
Appreciation/
(diminution)
as at
March 31,
2019
Market value
as a
percentage of
net assets
Market value as
a percentage of
total value of
Investment
Quoted investments ---------------------Number of shares-----------------------
Name of Investee Company
As at
July 1,
2018
Purchased/
bonus / Transfer In
received
during the
period
Refer (Note 3.2)
Sold
during
the
period
As at
March 31,
2019
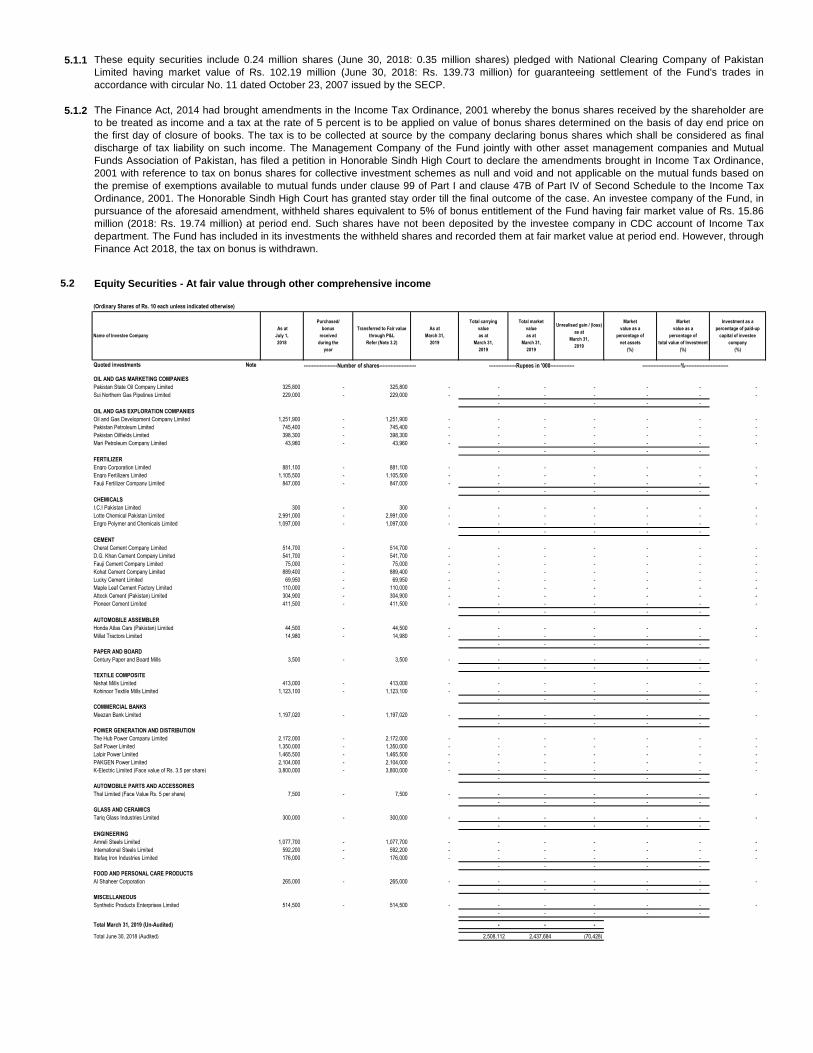
5.1.2
5.2 Equity Securities - At fair value through other comprehensive income
(Ordinary Shares of Rs. 10 each unless indicated otherwise)
Quoted investments Note
OIL AND GAS MARKETING COMPANIES
SNGP Pakistan State Oil Company Limited 325,800 - 325,800 - - - - - - -
Sui Northern Gas Pipelines Limited 229,000 - 229,000 - - - - - - -
- - - - -
OGDC OIL AND GAS EXPLORATION COMPANIES
PPL Oil and Gas Development Company Limited 1,251,900 - 1,251,900 - - - - - - -
POL Pakistan Petroleum Limited 745,400 - 745,400 - - - - - - -
MARI Pakistan Oilfields Limited 398,300 - 398,300 - - - - - - -
Mari Petroleum Company Limited 43,960 - 43,960 - - - - - - -
- - - - -
FERTILIZER
EFERT Engro Corporation Limited 881,100 - 881,100 - - - - - - -
FFC Engro Fertilizers Limited 1,105,500 - 1,105,500 - - - - - - -
Fauji Fertilizer Company Limited 847,000 - 847,000 - - - - - - -
- - - - -
CHEMICALS
LOTCHEM I.C.I Pakistan Limited 300 - 300 - - - - - - -
EPCL Lotte Chemical Pakistan Limited 2,991,000 - 2,991,000 - - - - - - -
Engro Polymer and Chemicals Limited 1,097,000 - 1,097,000 - - - - - - -
- - - - -
CEMENT
DGKC Cherat Cement Company Limited 514,700 - 514,700 - - - - - - -
FCCL D.G. Khan Cement Company Limited 541,700 - 541,700 - - - - - - -
KOHC Fauji Cement Company Limited 75,000 - 75,000 - - - - - - -
LUCK Kohat Cement Company Limited 889,400 - 889,400 - - - - - - -
MLCF Lucky Cement Limited 69,950 - 69,950 - - - - - - -
ACPL Maple Leaf Cement Factory Limited 110,000 - 110,000 - - - - - - -
PIOC Attock Cement (Pakistan) Limited 304,900 - 304,900 - - - - - - -
Pioneer Cement Limited 411,500 - 411,500 - - - - - - -
- - - - -
AUTOMOBILE ASSEMBLER
MTL Honda Atlas Cars (Pakistan) Limited 44,500 - 44,500 - - - - - - -
Millat Tractors Limited 14,980 - 14,980 - - - - - - -
- - - - -
PAPER AND BOARD
Century Paper and Board Mills 3,500 - 3,500 - - - - - - -
- - - - -
TEXTILE COMPOSITE
KTML Nishat Mills Limited 413,000 - 413,000 - - - - - - -
Kohinoor Textile Mills Limited 1,123,100 - 1,123,100 - - - - - - -
- - - - -
COMMERCIAL BANKS
Meezan Bank Limited 1,197,020 - 1,197,020 - - - - - - -
- - - - -
POWER GENERATION AND DISTRIBUTION
SPWL The Hub Power Company Limited 2,172,000 - 2,172,000 - - - - - - -
LPL Saif Power Limited 1,350,000 - 1,350,000 - - - - - - -
PKGP Lalpir Power Limited 1,465,500 - 1,465,500 - - - - - - -
KEL PAKGEN Power Limited 2,104,000 - 2,104,000 - - - - - - -
K-Electric Limited (Face value of Rs. 3.5 per share) 3,800,000 - 3,800,000 - - - - - - -
- - - - -
AUTOMOBILE PARTS AND ACCESSORIES
Thal Limited (Face Value Rs. 5 per share) 7,500 - 7,500 - - - - - - -
- - - - -
GLASS AND CERAMICS
Tariq Glass Industries Limited 300,000 - 300,000 - - - - - - -
- - - - -
ENGINEERING
Amreli Steels Limited 1,077,700 - 1,077,700 - - - - - - -
ITTEFAQ International Steels Limited 592,200 - 592,200 - - - - - - -
Ittefaq Iron Industries Limited 176,000 - 176,000 - - - - - - -
- - - - -
FOOD AND PERSONAL CARE PRODUCTS
Al Shaheer Corporation 265,000 - 265,000 - - - - - - -
- - - - -
MISCELLANEOUS
Synthetic Products Enterprises Limited 514,500 - 514,500 - - - - - - -
- - - - -
Total March 31, 2019 (Un-Audited) - - -
Total June 30, 2018 (Audited) 2,508,112 2,437,684 (70,428)
As at
March 31,
2019
Total carrying
value
as at
March 31,
2019
5.1.1 These equity securities include 0.24 million shares (June 30, 2018: 0.35 million shares) pledged with National Clearing Company of Pakistan
Limited having market value of Rs. 102.19 million (June 30, 2018: Rs. 139.73 million) for guaranteeing settlement of the Fund's trades in
accordance with circular No. 11 dated October 23, 2007 issued by the SECP.
The Finance Act, 2014 had brought amendments in the Income Tax Ordinance, 2001 whereby the bonus shares received by the shareholder are
to be treated as income and a tax at the rate of 5 percent is to be applied on value of bonus shares determined on the basis of day end price on
the first day of closure of books. The tax is to be collected at source by the company declaring bonus shares which shall be considered as final
discharge of tax liability on such income. The Management Company of the Fund jointly with other asset management companies and Mutual
Funds Association of Pakistan, has filed a petition in Honorable Sindh High Court to declare the amendments brought in Income Tax Ordinance,
2001 with reference to tax on bonus shares for collective investment schemes as null and void and not applicable on the mutual funds based on
the premise of exemptions available to mutual funds under clause 99 of Part I and clause 47B of Part IV of Second Schedule to the Income Tax
Ordinance, 2001. The Honorable Sindh High Court has granted stay order till the final outcome of the case. An investee company of the Fund, in
pursuance of the aforesaid amendment, withheld shares equivalent to 5% of bonus entitlement of the Fund having fair market value of Rs. 15.86
million (2018: Rs. 19.74 million) at period end. Such shares have not been deposited by the investee company in CDC account of Income Tax
department. The Fund has included in its investments the withheld shares and recorded them at fair market value at period end. However, through
Finance Act 2018, the tax on bonus is withdrawn.
Total market
value
as at
March 31,
2019
Unrealised gain / (loss)
as at
March 31,
2019
Market
value as a
percentage of
net assets
(%)
Market
value as a
percentage of
total value of Investment
(%)
Investment as a
percentage of paid-up
capital of investee
company
(%)
---------------------Number of shares----------------------- -----------------Rupees in '000--------------- ------------------------%---------------------------
Name of Investee Company
As at
July 1,
2018
Purchased/
bonus
received
during the
year
Transferred to Fair value
through P&L
Refer (Note 3.2)
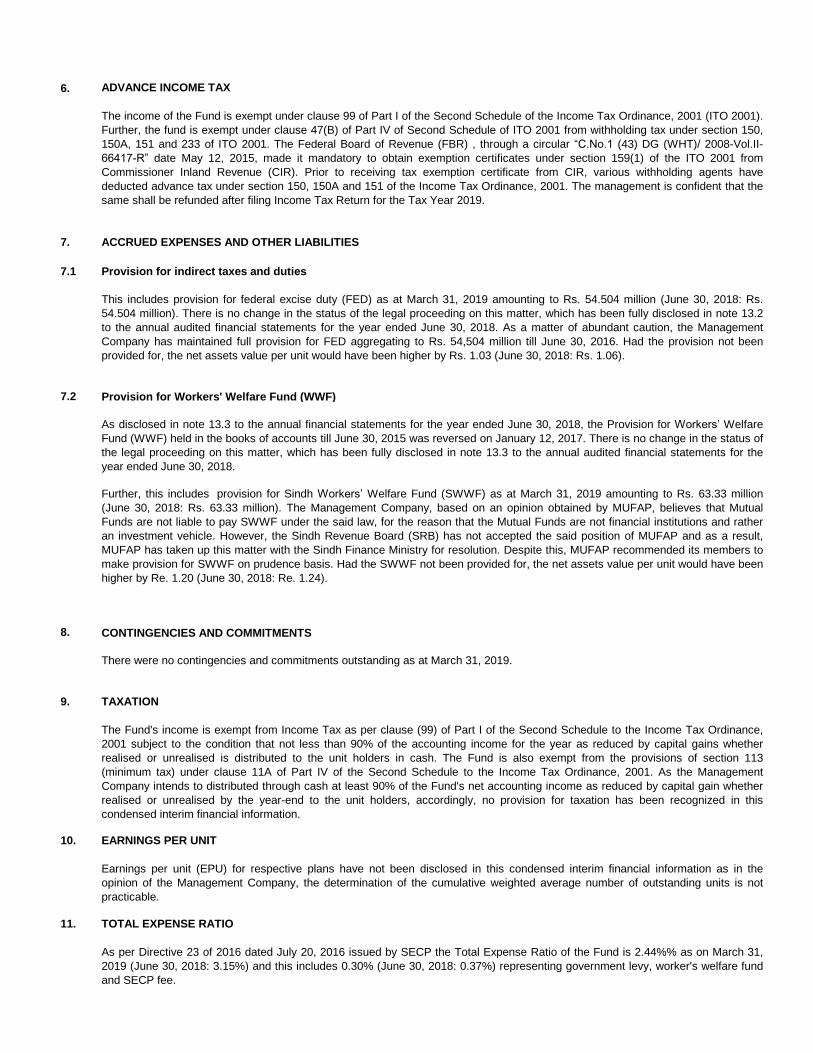
6.
7.
7.1 Provision for indirect taxes and duties
7.2 Provision for Workers' Welfare Fund (WWF)
8.
9. TAXATION
10. EARNINGS PER UNIT
11. TOTAL EXPENSE RATIO
As disclosed in note 13.3 to the annual financial statements for the year ended June 30, 2018, the Provision for Workers’ Welfare
Fund (WWF) held in the books of accounts till June 30, 2015 was reversed on January 12, 2017. There is no change in the status of
the legal proceeding on this matter, which has been fully disclosed in note 13.3 to the annual audited financial statements for the
year ended June 30, 2018.
Further, this includes provision for Sindh Workers’ Welfare Fund (SWWF) as at March 31, 2019 amounting to Rs. 63.33 million
(June 30, 2018: Rs. 63.33 million). The Management Company, based on an opinion obtained by MUFAP, believes that Mutual
Funds are not liable to pay SWWF under the said law, for the reason that the Mutual Funds are not financial institutions and rather
an investment vehicle. However, the Sindh Revenue Board (SRB) has not accepted the said position of MUFAP and as a result,
MUFAP has taken up this matter with the Sindh Finance Ministry for resolution. Despite this, MUFAP recommended its members to
make provision for SWWF on prudence basis. Had the SWWF not been provided for, the net assets value per unit would have been
higher by Re. 1.20 (June 30, 2018: Re. 1.24).
As per Directive 23 of 2016 dated July 20, 2016 issued by SECP the Total Expense Ratio of the Fund is 2.44%% as on March 31,
2019 (June 30, 2018: 3.15%) and this includes 0.30% (June 30, 2018: 0.37%) representing government levy, worker's welfare fund
and SECP fee.
The Fund's income is exempt from Income Tax as per clause (99) of Part I of the Second Schedule to the Income Tax Ordinance,
2001 subject to the condition that not less than 90% of the accounting income for the year as reduced by capital gains whether
realised or unrealised is distributed to the unit holders in cash. The Fund is also exempt from the provisions of section 113
(minimum tax) under clause 11A of Part IV of the Second Schedule to the Income Tax Ordinance, 2001. As the Management
Company intends to distributed through cash at least 90% of the Fund's net accounting income as reduced by capital gain whether
realised or unrealised by the year-end to the unit holders, accordingly, no provision for taxation has been recognized in this
condensed interim financial information.
Earnings per unit (EPU) for respective plans have not been disclosed in this condensed interim financial information as in the
opinion of the Management Company, the determination of the cumulative weighted average number of outstanding units is not
practicable.
CONTINGENCIES AND COMMITMENTS
There were no contingencies and commitments outstanding as at March 31, 2019.
ADVANCE INCOME TAX
The income of the Fund is exempt under clause 99 of Part I of the Second Schedule of the Income Tax Ordinance, 2001 (ITO 2001).
Further, the fund is exempt under clause 47(B) of Part IV of Second Schedule of ITO 2001 from withholding tax under section 150,
150A, 151 and 233 of ITO 2001. The Federal Board of Revenue (FBR) , through a circular “C.No.1 (43) DG (WHT)/ 2008-Vol.II-
66417-R” date May 12, 2015, made it mandatory to obtain exemption certificates under section 159(1) of the ITO 2001 from
Commissioner Inland Revenue (CIR). Prior to receiving tax exemption certificate from CIR, various withholding agents have
deducted advance tax under section 150, 150A and 151 of the Income Tax Ordinance, 2001. The management is confident that the
same shall be refunded after filing Income Tax Return for the Tax Year 2019.
This includes provision for federal excise duty (FED) as at March 31, 2019 amounting to Rs. 54.504 million (June 30, 2018: Rs.
54.504 million). There is no change in the status of the legal proceeding on this matter, which has been fully disclosed in note 13.2
to the annual audited financial statements for the year ended June 30, 2018. As a matter of abundant caution, the Management
Company has maintained full provision for FED aggregating to Rs. 54,504 million till June 30, 2016. Had the provision not been
provided for, the net assets value per unit would have been higher by Rs. 1.03 (June 30, 2018: Rs. 1.06).
ACCRUED EXPENSES AND OTHER LIABILITIES
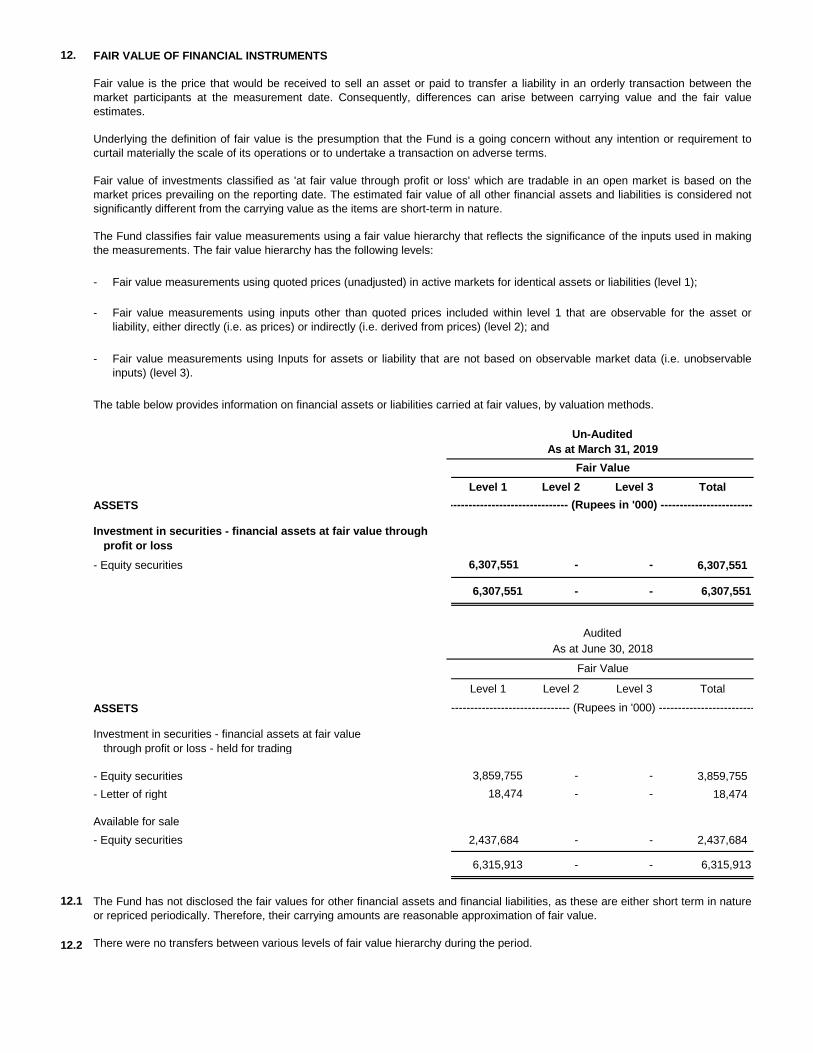
12. FAIR VALUE OF FINANCIAL INSTRUMENTS
-
-
-
Level 1 Level 2 Level 3 Total
ASSETS
Investment in securities - financial assets at fair value through
profit or loss
- Equity securities 6,307,551 - - 6,307,551
6,307,551 - - 6,307,551
Level 1 Level 2 Level 3 Total
ASSETS
Investment in securities - financial assets at fair value
through profit or loss - held for trading
- Equity securities 3,859,755 - - 3,859,755
- Letter of right 18,474 - - 18,474
Available for sale
- Equity securities 2,437,684 - - 2,437,684
6,315,913 - - 6,315,913
12.1
12.2
Fair value measurements using Inputs for assets or liability that are not based on observable market data (i.e. unobservable
inputs) (level 3).
Un-Audited
Audited
The Fund classifies fair value measurements using a fair value hierarchy that reflects the significance of the inputs used in making
the measurements. The fair value hierarchy has the following levels:
The table below provides information on financial assets or liabilities carried at fair values, by valuation methods.
Fair value measurements using quoted prices (unadjusted) in active markets for identical assets or liabilities (level 1);
Fair value measurements using inputs other than quoted prices included within level 1 that are observable for the asset or
liability, either directly (i.e. as prices) or indirectly (i.e. derived from prices) (level 2); and
Fair value is the price that would be received to sell an asset or paid to transfer a liability in an orderly transaction between the
market participants at the measurement date. Consequently, differences can arise between carrying value and the fair value
estimates.
Underlying the definition of fair value is the presumption that the Fund is a going concern without any intention or requirement to
curtail materially the scale of its operations or to undertake a transaction on adverse terms.
Fair value of investments classified as 'at fair value through profit or loss' which are tradable in an open market is based on the
market prices prevailing on the reporting date. The estimated fair value of all other financial assets and liabilities is considered not
significantly different from the carrying value as the items are short-term in nature.
There were no transfers between various levels of fair value hierarchy during the period.
As at March 31, 2019
As at June 30, 2018
----------------------------------------------- (Rupees in '000) -----------------------------------------
----------------------------------------------- (Rupees in '000) -----------------------------------------
The Fund has not disclosed the fair values for other financial assets and financial liabilities, as these are either short term in nature
or repriced periodically. Therefore, their carrying amounts are reasonable approximation of fair value.
Fair Value
Fair Value
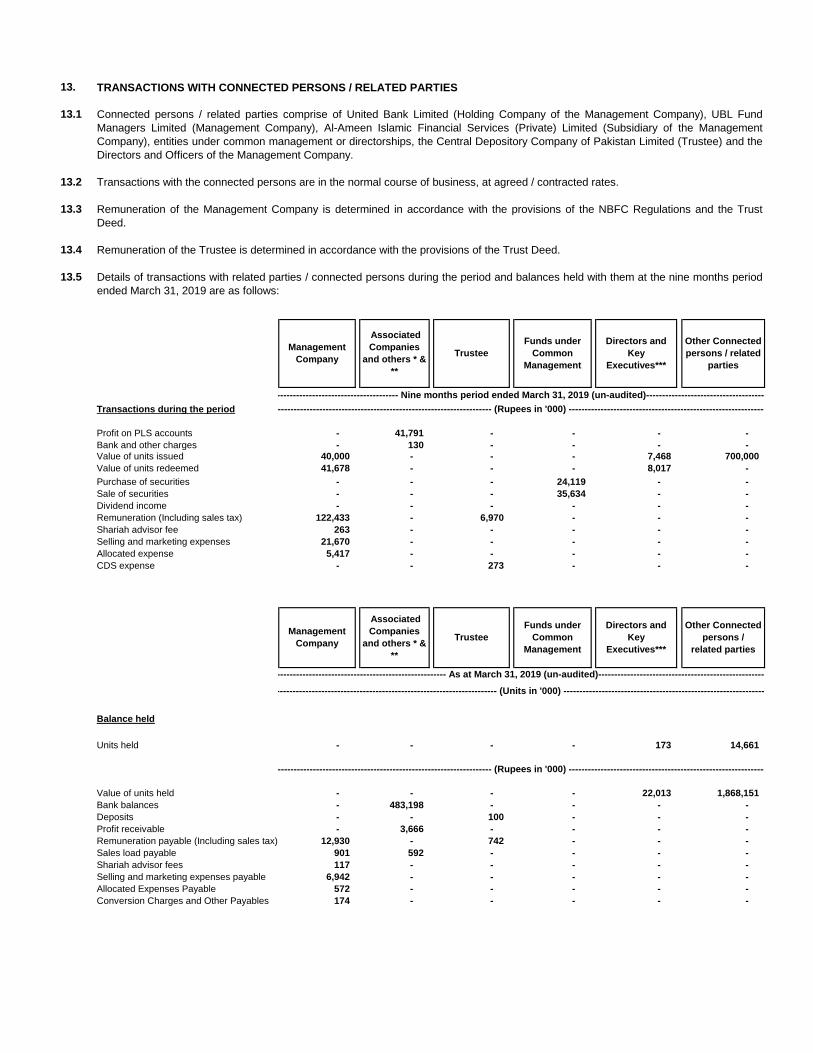
13.
13.1
13.2
13.3
13.4
13.5
Transactions during the period
Profit on PLS accounts - 41,791 - - - -
Bank and other charges - 130 - - - -
Value of units issued 40,000 - - - 7,468 700,000
Value of units redeemed 41,678 - - - 8,017 -
Purchase of securities - - - 24,119 - -
Sale of securities - - - 35,634 - -
Dividend income - - - - - -
Remuneration (Including sales tax) 122,433 - 6,970 - - -
Shariah advisor fee 263 - - - - -
Selling and marketing expenses 21,670 - - - - -
Allocated expense 5,417 - - - - -
CDS expense - - 273 - - -
Balance held
Units held - - - - 173 14,661
Value of units held - - - - 22,013 1,868,151
Bank balances - 483,198 - - - -
Deposits - - 100 - - -
Profit receivable - 3,666 - - - -
Remuneration payable (Including sales tax) 12,930 - 742 - - -
Sales load payable 901 592 - - - -
Shariah advisor fees 117 - - - - -
Selling and marketing expenses payable 6,942 - - - - -
Allocated Expenses Payable 572 - - - - -
Conversion Charges and Other Payables 174 - - - - -
Details of transactions with related parties / connected persons during the period and balances held with them at the nine months period
ended March 31, 2019 are as follows:
Trustee
Funds under
Common
Management
Funds under
Common
Management
----------------------------------------------------- As at March 31, 2019 (un-audited)-----------------------------------------------------
Associated
Companies
and others * &
**
---------------------------------------------------------------------- (Units in '000) -----------------------------------------------------------------
---------------------------------------------------------------------- (Rupees in '000) -----------------------------------------------------------------
Directors and
Key
Executives***
Directors and
Key
Executives***
Other Connected
persons /
related parties
Management
Company
Trustee
---------------------------------------------------------------------- (Rupees in '000) -----------------------------------------------------------------
Associated
Companies
and others * &
**
----------------------------------------------------- Nine months period ended March 31, 2019 (un-audited)-----------------------------------------------------
Other Connected
persons / related
parties
Management
Company
TRANSACTIONS WITH CONNECTED PERSONS / RELATED PARTIES
Remuneration of the Trustee is determined in accordance with the provisions of the Trust Deed.
Remuneration of the Management Company is determined in accordance with the provisions of the NBFC Regulations and the Trust
Deed.
Transactions with the connected persons are in the normal course of business, at agreed / contracted rates.
Connected persons / related parties comprise of United Bank Limited (Holding Company of the Management Company), UBL Fund
Managers Limited (Management Company), Al-Ameen Islamic Financial Services (Private) Limited (Subsidiary of the Management
Company), entities under common management or directorships, the Central Depository Company of Pakistan Limited (Trustee) and the
Directors and Officers of the Management Company.
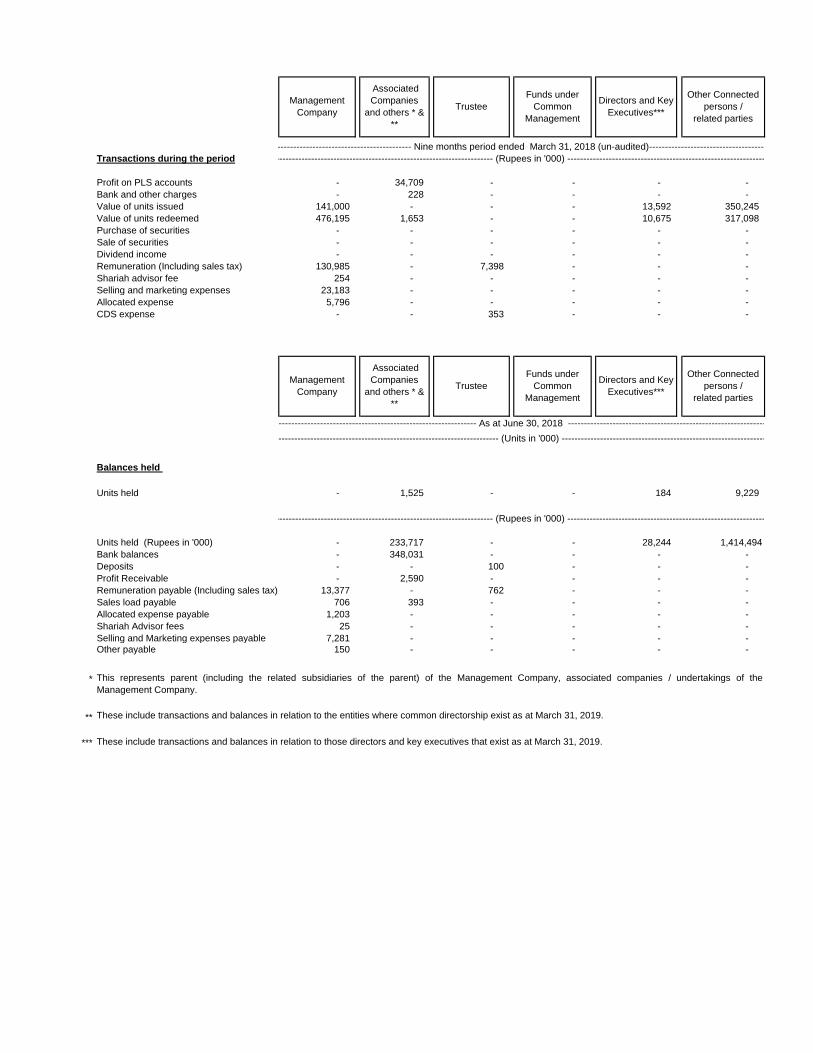
Transactions during the period
Profit on PLS accounts - 34,709 - - - -
Bank and other charges - 228 - - - -
Value of units issued 141,000 - - - 13,592 350,245
Value of units redeemed 476,195 1,653 - - 10,675 317,098
Purchase of securities - - - - - -
Sale of securities - - - - - -
Dividend income - - - - - -
Remuneration (Including sales tax) 130,985 - 7,398 - - -
Shariah advisor fee 254 - - - - -
Selling and marketing expenses 23,183 - - - - -
Allocated expense 5,796 - - - - -
CDS expense - - 353 - - -
Balances held
Units held - 1,525 - - 184 9,229
Units held (Rupees in '000) - 233,717 - - 28,244 1,414,494
Bank balances - 348,031 - - - -
Deposits - - 100 - - -
Profit Receivable - 2,590 - - - -
Remuneration payable (Including sales tax) 13,377 - 762 - - -
Sales load payable 706 393 - - - -
Allocated expense payable 1,203 - - - - -
Shariah Advisor fees 25 - - - - -
Selling and Marketing expenses payable 7,281 - - - - -
Other payable 150 - - - - -
*
**
***
-------------------------------------------------------------------------- (Rupees in '000) ---------------------------------------------------------------------
These include transactions and balances in relation to those directors and key executives that exist as at March 31, 2019.
Management
Company Trustee
Funds under
Common
Management
-------------------------------------------------------------------- As at June 30, 2018 --------------------------------------------------------------------
----------------------------------------------------------------------- (Rupees in '000) ------------------------------------------------------------------
Associated
Companies
and others * &
**
Other Connected
persons /
related parties
These include transactions and balances in relation to the entities where common directorship exist as at March 31, 2019.
This represents parent (including the related subsidiaries of the parent) of the Management Company, associated companies / undertakings of the
Management Company.
------------------------------------------------------------------------- (Units in '000) --------------------------------------------------------------------
Directors and Key
Executives***
------------------------------------------------------------------- Nine months period ended March 31, 2018 (un-audited)--------------------------------------------------------------
Other Connected
persons /
related parties
Funds under
Common
Management
Directors and Key
Executives***
Management
Company Trustee
Associated
Companies
and others * &
**
14. GENERAL
14.1
15. DATE OF AUTHORISATION FOR ISSUE
15.1
For UBL Fund Managers Limited
(Management Company)
This condensed interim financial information were authorised for issue on ___________________ by the Board of Directors of the
Management Company.
Figures have been rounded off to the nearest thousand of rupees unless otherwise stated.
______________________ Chief Executive Officer
______________________ Chief Financial Officer
__________________ Director
SD
SD SD SD
April 29, 2019
Management Company UBL Fund Managers Limited
Trustee Central Depository Company of Pakistan Limited
99-B, Block-B, S.M.C.H.S., Main Shahra-e-Faisal,
Karachi. Tel: (9221) 111-111-500
Distribution Company United Bank Limited
Auditors Deloitte Yousuf Adil & Co., Chartered Accountants
Bankers Bank Alfalah Limited
Faysal Bank Limited
Bank Islami Pakistan Limited
Allied Bank Limited
Habib Metropolitan Bank Limited
National Bank of Pakistan
United Bank Limited
Dubai Islamic Bank
Management Co. Rating AM 1 (JCR‐VIS)
(for detail of others, please visit our website: www.ublfunds.com.pk)
Al-Ameen Islamic Dedicated Equity Fund
AIDEF
INVESTMENT OBJECTIVE
The investment objective of the Fund is to provide other ‘Fund of Funds’ schemes an avenue for investing in Shariah
compliant Equities.
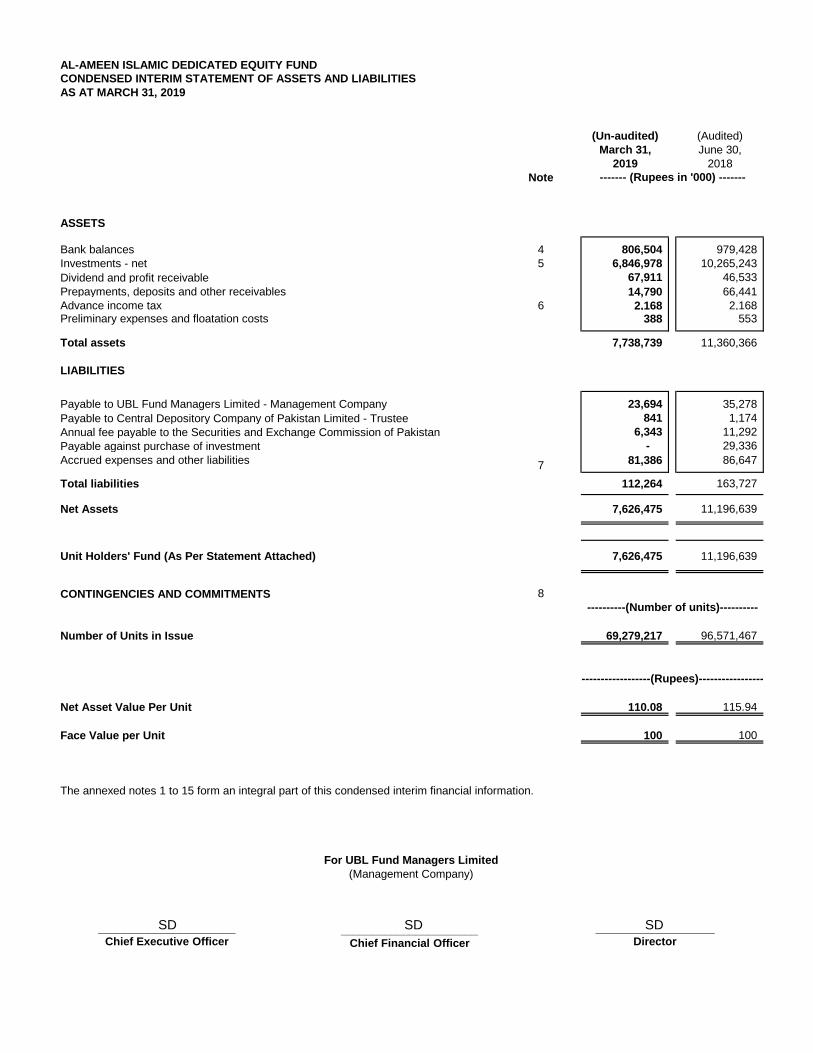
AL-AMEEN ISLAMIC DEDICATED EQUITY FUND
CONDENSED INTERIM STATEMENT OF ASSETS AND LIABILITIES
AS AT MARCH 31, 2019
(Un-audited) (Audited)
March 31, June 30,
2019 2018
Note
ASSETS
Bank balances 4 806,504 979,428
Investments - net 5 6,846,978 10,265,243
Dividend and profit receivable 67,911 46,533
Prepayments, deposits and other receivables 14,790 66,441
Advance income tax 6 2,168 2,168 Preliminary expenses and floatation costs 388 553
Total assets 7,738,739 11,360,366
LIABILITIES
Payable to UBL Fund Managers Limited - Management Company 23,694 35,278
Payable to Central Depository Company of Pakistan Limited - Trustee 841 1,174
Annual fee payable to the Securities and Exchange Commission of Pakistan 6,343 11,292
Payable against purchase of investment - 29,336
Accrued expenses and other liabilities 7 81,386 86,647
Total liabilities 112,264 163,727
Net Assets 7,626,475 11,196,639
Unit Holders' Fund (As Per Statement Attached) 7,626,475 11,196,639
CONTINGENCIES AND COMMITMENTS 8
Number of Units in Issue 69,279,217 96,571,467
Net Asset Value Per Unit 110.08 115.94
Face Value per Unit 100 100
The annexed notes 1 to 15 form an integral part of this condensed interim financial information.
------- (Rupees in '000) -------
For UBL Fund Managers Limited
(Management Company)
----------(Number of units)----------
----------------------(Rupees)---------------------
___________________ Director
______________________ Chief Executive Officer
______________________ Chief Financial Officer
SD SD SD
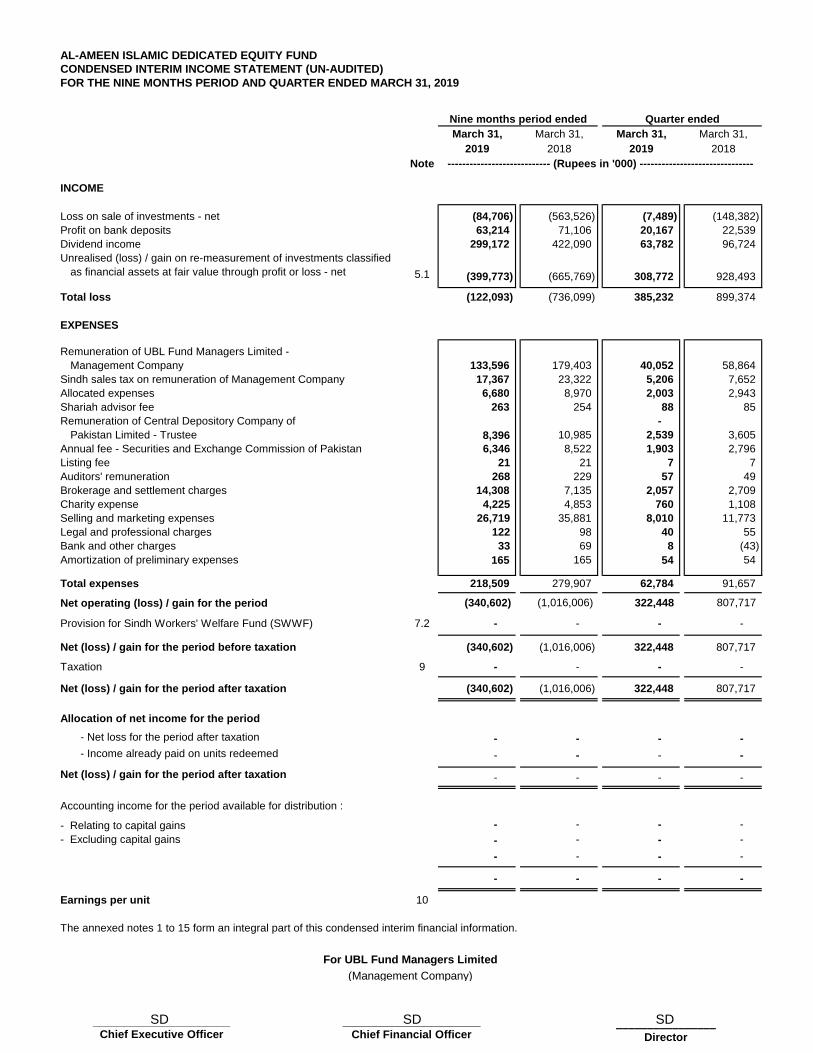
AL-AMEEN ISLAMIC DEDICATED EQUITY FUND
CONDENSED INTERIM INCOME STATEMENT (UN-AUDITED)
FOR THE NINE MONTHS PERIOD AND QUARTER ENDED MARCH 31, 2019
March 31, March 31, March 31, March 31,
2019 2018 2019 2018
Note
INCOME
Loss on sale of investments - net (84,706) (563,526) (7,489) (148,382)
Profit on bank deposits 63,214 71,106 20,167 22,539
Dividend income 299,172 422,090 63,782 96,724
Unrealised (loss) / gain on re-measurement of investments classified
as financial assets at fair value through profit or loss - net 5.1 (399,773) (665,769) 308,772 928,493
Total loss (122,093) (736,099) 385,232 899,374
EXPENSES
Remuneration of UBL Fund Managers Limited -
Management Company 133,596 179,403 40,052 58,864
Sindh sales tax on remuneration of Management Company 17,367 23,322 5,206 7,652
Allocated expenses 6,680 8,970 2,003 2,943
Shariah advisor fee 263 254 88 85
Remuneration of Central Depository Company of -
Pakistan Limited - Trustee 8,396 10,985 2,539 3,605
Annual fee - Securities and Exchange Commission of Pakistan 6,346 8,522 1,903 2,796
Listing fee 21 21 7 7
Auditors' remuneration 268 229 57 49
Brokerage and settlement charges 14,308 7,135 2,057 2,709
Charity expense 4,225 4,853 760 1,108
Selling and marketing expenses 26,719 35,881 8,010 11,773
Legal and professional charges 122 98 40 55
Bank and other charges 33 69 8 (43)
Amortization of preliminary expenses 165 165 54 54
Total expenses 218,509 279,907 62,784 91,657
Net operating (loss) / gain for the period (340,602) (1,016,006) 322,448 807,717
Provision for Sindh Workers' Welfare Fund (SWWF) 7.2 - - - -
Net (loss) / gain for the period before taxation (340,602) (1,016,006) 322,448 807,717
Taxation 9 - - - -
Net (loss) / gain for the period after taxation (340,602) (1,016,006) 322,448 807,717
Allocation of net income for the period
- Net loss for the period after taxation - - - -
- Income already paid on units redeemed - - - -
Net (loss) / gain for the period after taxation - - - -
Accounting income for the period available for distribution :
- Relating to capital gains - - - -
- Excluding capital gains - - - -
- - - -
- - - -
Earnings per unit 10
The annexed notes 1 to 15 form an integral part of this condensed interim financial information.
For UBL Fund Managers Limited
(Management Company)
Nine months period ended Quarter ended
---------------------------- (Rupees in '000) -------------------------------
________________ Director
______________________ Chief Executive Officer
______________________ Chief Financial Officer
SD SD SD
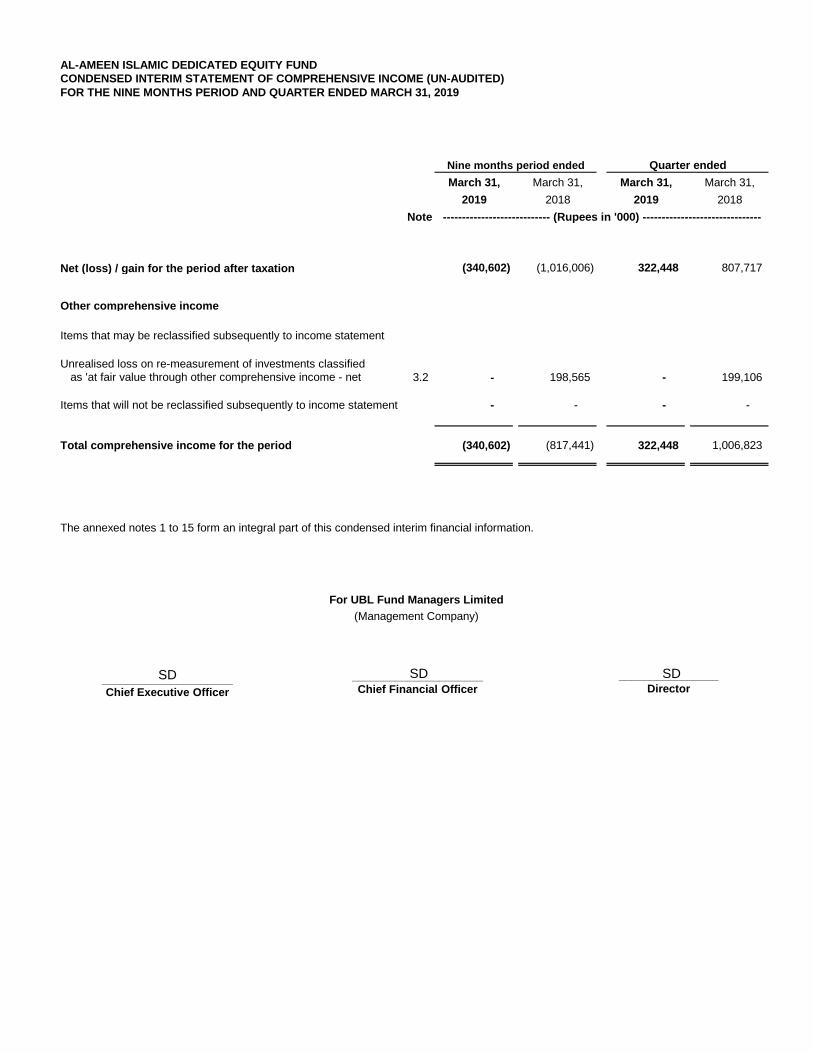
AL-AMEEN ISLAMIC DEDICATED EQUITY FUND
CONDENSED INTERIM STATEMENT OF COMPREHENSIVE INCOME (UN-AUDITED)
FOR THE NINE MONTHS PERIOD AND QUARTER ENDED MARCH 31, 2019
March 31, March 31, March 31, March 31,
2019 2018 2019 2018
Note
Net (loss) / gain for the period after taxation (340,602) (1,016,006) 322,448 807,717
Other comprehensive income
Items that may be reclassified subsequently to income statement
3.2 - 198,565 - 199,106
Items that will not be reclassified subsequently to income statement - - - -
Total comprehensive income for the period (340,602) (817,441) 322,448 1,006,823
The annexed notes 1 to 15 form an integral part of this condensed interim financial information.
(Management Company)
For UBL Fund Managers Limited
Quarter endedNine months period ended
Unrealised loss on re-measurement of investments classified as 'at fair value through other comprehensive income - net
---------------------------- (Rupees in '000) -------------------------------
________________ Director
_____________________ Chief Executive Officer
_____________________ Chief Financial Officer
SD SD SD
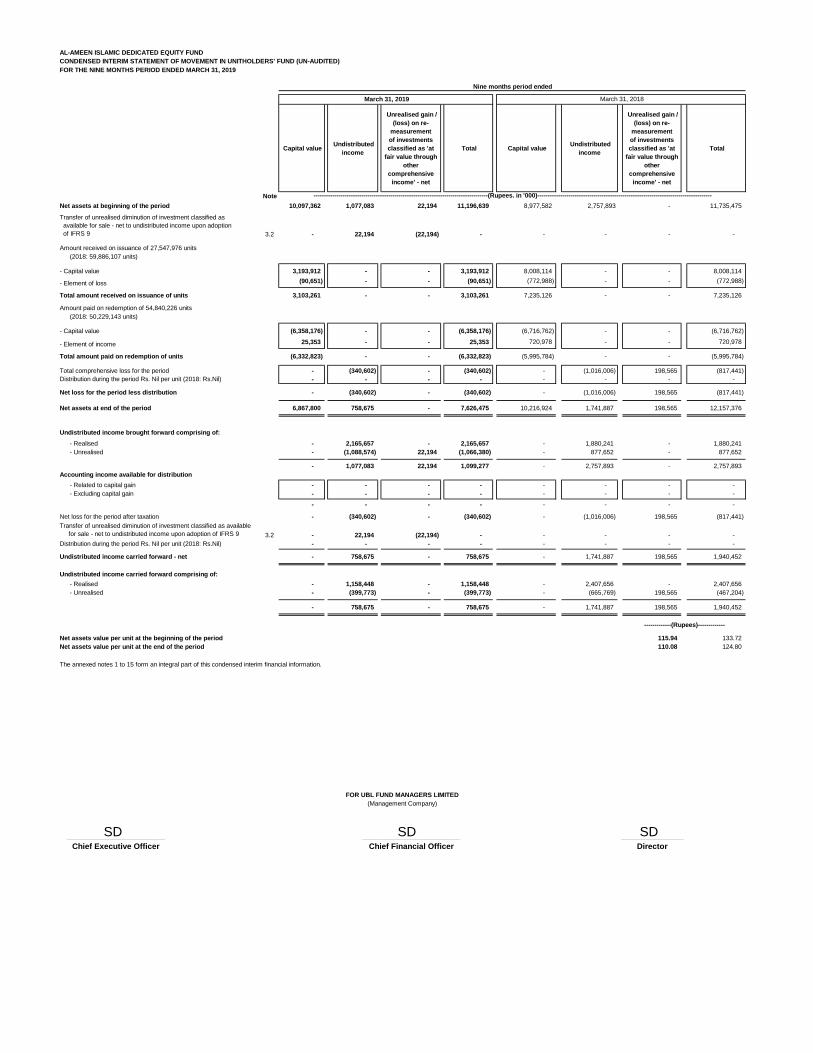
AL-AMEEN ISLAMIC DEDICATED EQUITY FUND
CONDENSED INTERIM STATEMENT OF MOVEMENT IN UNITHOLDERS' FUND (UN-AUDITED)
FOR THE NINE MONTHS PERIOD ENDED MARCH 31, 2019
Capital value Undistributed
income
Unrealised gain /
(loss) on re-
measurement
of investments
classified as 'at
fair value through
other
comprehensive
income' - net
Total Capital value Undistributed
income
Unrealised gain /
(loss) on re-
measurement
of investments
classified as 'at
fair value through
other
comprehensive
income' - net
Total
Note
Net assets at beginning of the period 10,097,362 1,077,083 22,194 11,196,639 8,977,582 2,757,893 - 11,735,475
3.2 - 22,194 (22,194) - - - - -
Amount received on issuance of 27,547,976 units
(2018: 59,886,107 units)
- Capital value 3,193,912 - - 3,193,912 8,008,114 - - 8,008,114
- Element of loss (90,651) - - (90,651) (772,988) - - (772,988)
Total amount received on issuance of units 3,103,261 - - 3,103,261 7,235,126 - - 7,235,126
Amount paid on redemption of 54,840,226 units
(2018: 50,229,143 units)
- Capital value (6,358,176) - - (6,358,176) (6,716,762) - - (6,716,762)
- Element of income 25,353 - - 25,353 720,978 - - 720,978
Total amount paid on redemption of units (6,332,823) - - (6,332,823) (5,995,784) - - (5,995,784)
Total comprehensive loss for the period - (340,602) - (340,602) - (1,016,006) 198,565 (817,441)
- - - - - - - -
Net loss for the period less distribution - (340,602) - (340,602) - (1,016,006) 198,565 (817,441)
Net assets at end of the period 6,867,800 758,675 - 7,626,475 10,216,924 1,741,887 198,565 12,157,376
Undistributed income brought forward comprising of:
- Realised - 2,165,657 - 2,165,657 - 1,880,241 - 1,880,241
- Unrealised - (1,088,574) 22,194 (1,066,380) - 877,652 - 877,652
- 1,077,083 22,194 1,099,277 - 2,757,893 - 2,757,893
Accounting income available for distribution
- Related to capital gain - - - - - - - -
- Excluding capital gain - - - - - - - -
- - - - - - - -
Net loss for the period after taxation - (340,602) - (340,602) - (1,016,006) 198,565 (817,441)
3.2 - 22,194 (22,194) - - - - -
Distribution during the period Rs. Nil per unit (2018: Rs.Nil) - - - - - - - -
Undistributed income carried forward - net - 758,675 - 758,675 - 1,741,887 198,565 1,940,452
Undistributed income carried forward comprising of:
- Realised - 1,158,448 - 1,158,448 - 2,407,656 - 2,407,656
- Unrealised - (399,773) - (399,773) - (665,769) 198,565 (467,204)
- 758,675 - 758,675 - 1,741,887 198,565 1,940,452
Net assets value per unit at the beginning of the period 115.94 133.72
Net assets value per unit at the end of the period 110.08 124.80
The annexed notes 1 to 15 form an integral part of this condensed interim financial information.
______________________ ______________________ ______________
Chief Executive Officer Chief Financial Officer Director
-------------(Rupees)-------------
Nine months period ended
------------------------------------------------------------------------------------(Rupees. in '000)------------------------------------------------------------------------------------
FOR UBL FUND MANAGERS LIMITED
(Management Company)
Transfer of unrealised diminution of investment classified as available
for sale - net to undistributed income upon adoption of IFRS 9
March 31, 2019
Transfer of unrealised diminution of investment classified as
available for sale - net to undistributed income upon adoption
of IFRS 9
Distribution during the period Rs. Nil per unit (2018: Rs.Nil)
March 31, 2018
SD SD SD
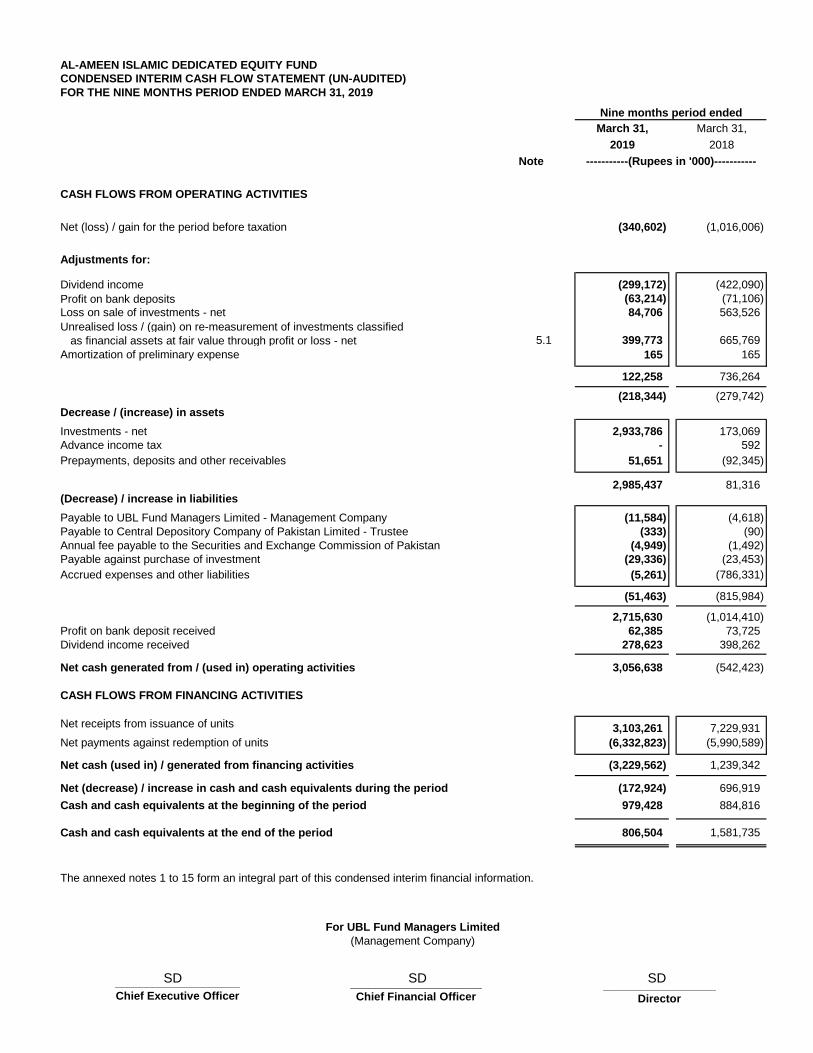
AL-AMEEN ISLAMIC DEDICATED EQUITY FUND
CONDENSED INTERIM CASH FLOW STATEMENT (UN-AUDITED)
FOR THE NINE MONTHS PERIOD ENDED MARCH 31, 2019
March 31, March 31,
2019 2018
Note
CASH FLOWS FROM OPERATING ACTIVITIES
Net (loss) / gain for the period before taxation (340,602) (1,016,006)
Adjustments for:
Dividend income (299,172) (422,090)
Profit on bank deposits (63,214) (71,106)
Loss on sale of investments - net 84,706 563,526
Unrealised loss / (gain) on re-measurement of investments classified
as financial assets at fair value through profit or loss - net 5.1 399,773 665,769
Amortization of preliminary expense 165 165
122,258 736,264
(218,344) (279,742)
Decrease / (increase) in assets
Investments - net 2,933,786 173,069
Advance income tax - 592
Prepayments, deposits and other receivables 51,651 (92,345)
2,985,437 81,316
(Decrease) / increase in liabilities
Payable to UBL Fund Managers Limited - Management Company (11,584) (4,618)
Payable to Central Depository Company of Pakistan Limited - Trustee (333) (90)
Annual fee payable to the Securities and Exchange Commission of Pakistan (4,949) (1,492)
Payable against purchase of investment (29,336) (23,453)
Accrued expenses and other liabilities (5,261) (786,331)
(51,463) (815,984)
2,715,630 (1,014,410)
Profit on bank deposit received 62,385 73,725
Dividend income received 278,623 398,262
Net cash generated from / (used in) operating activities 3,056,638 (542,423)
CASH FLOWS FROM FINANCING ACTIVITIES
Net receipts from issuance of units 3,103,261 7,229,931
Net payments against redemption of units (6,332,823) (5,990,589)
Net cash (used in) / generated from financing activities (3,229,562) 1,239,342
Net (decrease) / increase in cash and cash equivalents during the period (172,924) 696,919
Cash and cash equivalents at the beginning of the period 979,428 884,816
Cash and cash equivalents at the end of the period 806,504 1,581,735
The annexed notes 1 to 15 form an integral part of this condensed interim financial information.
Nine months period ended
-----------(Rupees in '000)-----------
For UBL Fund Managers Limited
(Management Company)
__________________ Director
____________________ Chief Executive Officer
_____________________ Chief Financial Officer
SD SD SD
AL-AMEEN ISLAMIC DEDICATED EQUITY FUND
NOTES TO THE CONDENSED INTERIM FINANCIAL INFORMATION (UN-AUDITED)
FOR THE NINE MONTHS PERIOD ENDED MARCH 31, 2019
1. LEGAL STATUS AND NATURE OF BUSINESS
2. BASIS OF PREPARATION
2.1 Statement of compliance
2.1.1
2.1.2
2.1.3
2.1.4
2.2 Basis of measurement
2.3 Functional and presentation currency
This condensed interim financial information has been prepared in accordance with the approved accounting standards as
applicable in Pakistan for interim financial reporting. The approved accounting standards comprise of such International Financial
Reporting Standards ("IFRSs") issued by the International Accounting Standards Boardas are notified under the Companies Act
2017, the requirements of the Trust Deed, the NBFC Rules, the Non-Banking Finance Companies and Notified Entities
Regulations, 2008 (the "NBFC Regulations") and the directives issued by the SECP. Wherever the requirements of the Trust
Deed, the NBFC Rules, the NBFC Regulations or the directives issued by the SECP differ with the requirements of the IFRS, the
requirements of theTrust Deed, the NBFC Rules, the NBFC Regulations or the directives issued by the SECP prevail.
The disclosures made in this condensed interim financial information have, however, been limited based on the requirements of
International Accounting Standard 34: 'Interim Financial Reporting'. This condensed interim financial information does not include
all the information and disclosures required in a full set of financial statements and should be read in conjunction with the annual
published audited financial statements of the Fund for the year ended June 30, 2018.
The comparative statement of asset and liabilities presented in this condensed interim financial information has been extracted
from the annual audited financial statements of the Fund for the year ended June 30, 2018, whereas the comparative condensed
interim income statement, condensed interim statement of comprehensive income, condensed interim distribution statement,
condensed interim statement of cash flows, condensed interim statement of movement in unit holders’ fund are extracted from the
unaudited condensed interim financial statements for the period ended March 31, 2018.
In compliance with Schedule V of the NBFC Regulations the directors of the Management Company hereby declare that this
condensed interim financial information gives a true and fair view of the state of the Fund’s affairs as at March 31, 2019.
Al-Ameen Islamic Dedicated Equity Fund (the "Fund"), was established under the Trust Deed executed between UBL Fund
Managers Limited (the Management Company - a wholly owned subsidiary company of United Bank Limited), as the Management
Company, and the Central Depository Company of Pakistan Limited (CDC) as the Trustee. The Trust Deed was executed on
October 10, 2015 and was approved by the Securities and Exchange Commission of Pakistan (SECP) on November 20, 2015 in
accordance with the requirements of the Non-Banking Finance Companies (Establishment and Regulation) Rules, 2003 (NBFC
Rules). The Fund commenced its operations from January 5, 2016.
The Fund is an open ended mutual fund categorised as Shariah Compliant Equity Fund and is listed on the Pakistan Stock
Exchange Limited. Units are offered for public subscription on a continuous basis. The units are transferable and can be
redeemed by surrendering them to the Fund at the option of the unitholders.
The investment objective of the Fund is to provide other 'Fund of Funds' schemes an avenue for investing in Shariah Compliant
Equities. The Fund seeks to maximize total returns and outperform its benchmark by investing in a combination of securities
offering superior risk adjusted returns. The Fund invests in securities approved by the Shariah Advisory Board.
JCR - VIS Credit Rating Company has reaffirmed management quality rating of AM1 (stable outlook) to the management company
as on December 27, 2018.
Title to the assets of the Fund is held in the name of the Central Depository Company of Pakistan Limited as the Trustee of the
Fund.
The Management Company of the Fund is registered with the SECP as a Non-Banking Finance Company under the NBFC Rules,
2003. The registered office of the Management Company is situated at 4th Floor, STSM Building, Beaumont Road, Civil Lines,
Karachi.
This condensed interim financial information has been prepared under the historical cost convention, except that certain financial
assets are stated at fair value.
Items included in the condensed interim financial information are measured using the currency of the primary economic
environment in which the Fund operates. This condensed interim financial information is presented in Pakistani Rupees which is
the Fund's functional and presentation currency.
3. SIGNIFICANT ACCOUNTING AND RISK MANAGEMENT POLICIES, ACCOUNTING ESTIMATES, JUDGEMENT
AND CHANGES THEREIN
3.1
3.2 Impact of initial application of IFRS 9 Financial Instruments
1) The classification and measurement of financial assets and financial liabilities;
2) Impairment of financial assets; and
3) General hedge accounting
Classification and measurement of financial assets and financial liabilities
-
-
-
-
IFRS 9 introduced new requirements for:
The accounting policies applied in the preparation of these condensed interim financial information are the same as those applied
in the preparation of the audited financial statements of the Fund for the year ended June 30, 2018 except as disclosed in note 3.2
.
The preparation of this condensed interim financial information in conformity with approved accounting standards requires
management to make estimates, assumptions and use judgements that affect the application of accounting policies and reported
amounts of assets, liabilities, income and expenses. Estimates, assumptions and judgments are continually evaluated and are
based on historical experience and other factors, including reasonable expectations of future events. Revisions to accounting
estimates are recognised prospectively commencing from the period of revision.
In the current year, the Fund has applied IFRS 9 Financial Instruments (as revised in July 2014) and the related consequential
amendments to other IFRS Standards that are effective for an annual period that begins on or after July 01, 2018. The transition
provisions of IFRS 9 allow an entity not to restate comparatives. The Fund has elected not to restate comparatives in respect of
the classification and measurement of financial instruments.
its contractual terms give rise on specified dates to cash flows that are solely payments of principal and interest on the
principal amount outstanding.
it is held within a business model whose objective is to hold assets to collect contractual cash flows; and
its contractual terms give rise on specified dates to cash flows that are solely payments of principal and interest on the
principal amount outstanding.
Details of these new requirements as well as their impact on the Fund's financial statements are described below except the
General Hedge Accounting which the Fund does not apply. The Fund has applied IFRS 9 in accordance with the transition
provisions set out in IFRS 9.
A debt investment is measured at FVOCI if it meets both of the following conditions and is not designated as at FVTPL:
it is held within a business model whose objective is achieved by both collecting contractual cash flows and selling financial
'assets; and
On initial recognition of an equity investment that is not held for trading, the Fund may irrevocably elect to present subsequent
changes in the investment’s fair value in OCI. This election is made on an investment-by-investment basis.
Under IFRS 9 'Financial Instruments', on initial recognition, a financial asset is classified as measured at: amortised cost; fair
value through other comprehensive income (FVOCI) – debt investment; FVOCI – equity investment; or fair value through profit
and loss (FVTPL). The classification of financial assets under IFRS 9 is generally based on the business model in which a
financial asset is managed and its contractual cash flow characteristics.
IFRS 9 largely retains the existing requirements in IAS 39 'Financial Instruments' for the classification and measurement of
financial liabilities. The adoption of IFRS 9 did not have a significant effect on the Fund’s accounting policies related to financial
liabilities. The impact of IFRS 9 on the classification and measurement of financial assets is set out below:
A financial asset is measured at amortised cost if it meets both of the following conditions and is not designated as at FVTPL:
All financial assets not classified as measured at amortised cost or FVOCI as described above are measured at FVTPL. On initial
recognition, the Fund may irrevocably designate a financial asset that otherwise meets the requirements to be measured at
amortised cost or at FVOCI as at FVTPL if doing so eliminates or significantly reduces an accounting mismatch that would
otherwise arise.
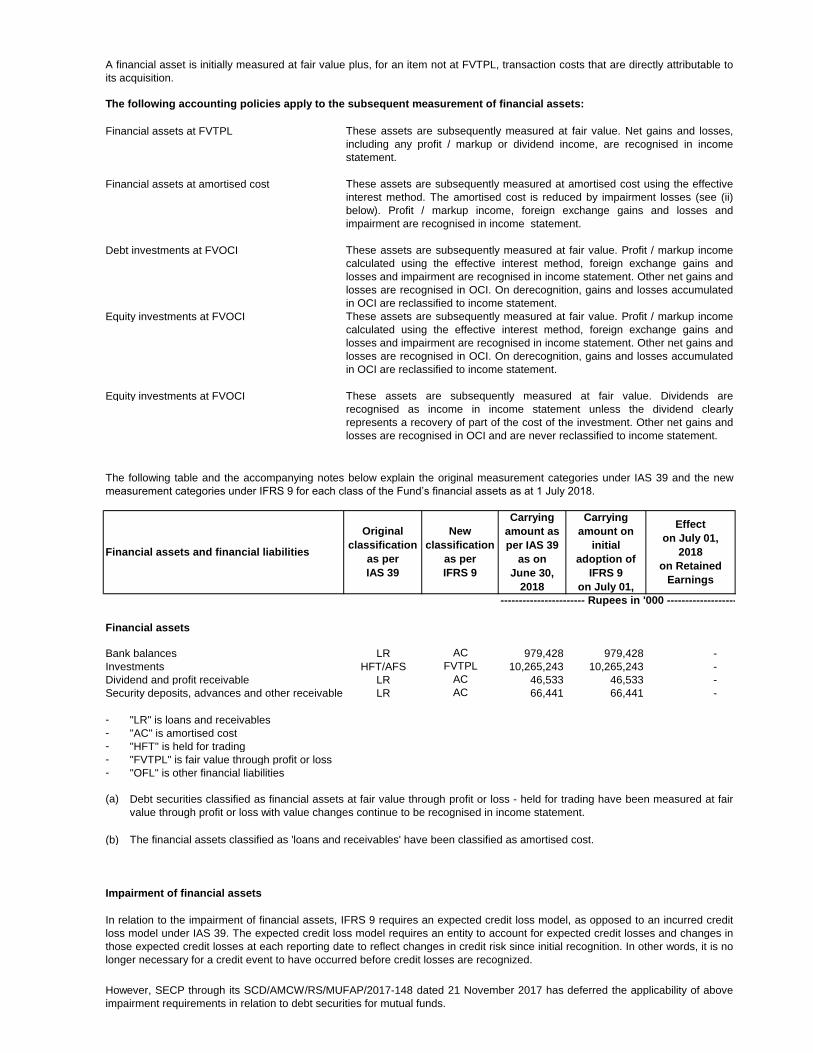
Financial assets at FVTPL
Financial assets at amortised cost
Debt investments at FVOCI
Equity investments at FVOCI
Equity investments at FVOCI
Financial assets
Bank balances LR 979,428 979,428 -
Investments HFT/AFS 10,265,243 10,265,243 -
Dividend and profit receivable LR 46,533 46,533 -
Security deposits, advances and other receivables LR 66,441 66,441 -
- "LR" is loans and receivables
- "AC" is amortised cost
- "HFT" is held for trading
- "FVTPL" is fair value through profit or loss
- "OFL" is other financial liabilities
(a)
(b)
Impairment of financial assets
Debt securities classified as financial assets at fair value through profit or loss - held for trading have been measured at fair
value through profit or loss with value changes continue to be recognised in income statement.
AC
FVTPL
AC
New
classification
as per
IFRS 9
Carrying
amount as
per IAS 39
as on
June 30,
2018
Carrying
amount on
initial
adoption of
IFRS 9
on July 01,
Effect
on July 01,
2018
on Retained
Earnings
AC
In relation to the impairment of financial assets, IFRS 9 requires an expected credit loss model, as opposed to an incurred credit
loss model under IAS 39. The expected credit loss model requires an entity to account for expected credit losses and changes in
those expected credit losses at each reporting date to reflect changes in credit risk since initial recognition. In other words, it is no
longer necessary for a credit event to have occurred before credit losses are recognized.
However, SECP through its SCD/AMCW/RS/MUFAP/2017-148 dated 21 November 2017 has deferred the applicability of above
impairment requirements in relation to debt securities for mutual funds.
The financial assets classified as 'loans and receivables' have been classified as amortised cost.
These assets are subsequently measured at fair value. Dividends are
recognised as income in income statement unless the dividend clearly
represents a recovery of part of the cost of the investment. Other net gains and
losses are recognised in OCI and are never reclassified to income statement.
----------------------- Rupees in '000 -------------------
The following table and the accompanying notes below explain the original measurement categories under IAS 39 and the new
measurement categories under IFRS 9 for each class of the Fund’s financial assets as at 1 July 2018.
Financial assets and financial liabilities
Original
classification
as per
IAS 39
These assets are subsequently measured at fair value. Profit / markup income
calculated using the effective interest method, foreign exchange gains and
losses and impairment are recognised in income statement. Other net gains and
losses are recognised in OCI. On derecognition, gains and losses accumulated
in OCI are reclassified to income statement.
A financial asset is initially measured at fair value plus, for an item not at FVTPL, transaction costs that are directly attributable to
its acquisition.
The following accounting policies apply to the subsequent measurement of financial assets:
These assets are subsequently measured at fair value. Net gains and losses,
including any profit / markup or dividend income, are recognised in income
statement.
These assets are subsequently measured at amortised cost using the effective
interest method. The amortised cost is reduced by impairment losses (see (ii)
below). Profit / markup income, foreign exchange gains and losses and
impairment are recognised in income statement.
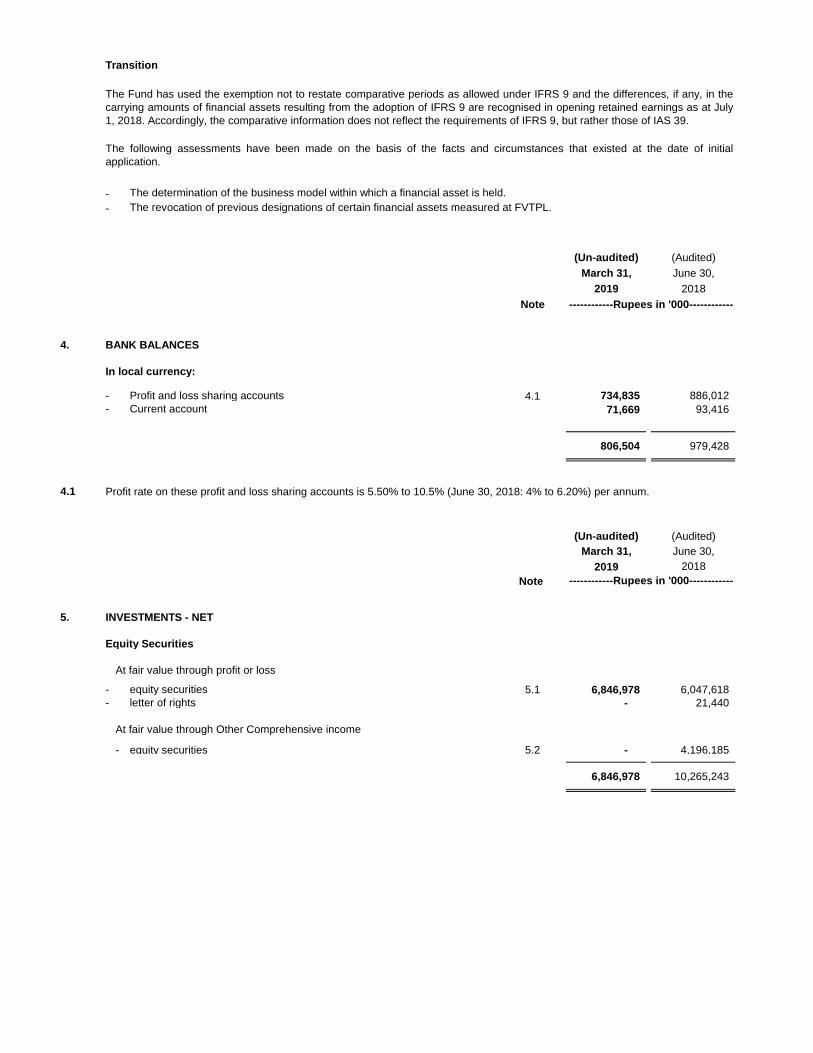
Transition
- The determination of the business model within which a financial asset is held.
- The revocation of previous designations of certain financial assets measured at FVTPL.
(Un-audited) (Audited)
March 31, June 30,
2019 2018
Note
4. BANK BALANCES
In local currency:
- Profit and loss sharing accounts 4.1 734,835 886,012
- Current account 71,669 93,416
806,504 979,428
4.1
(Un-audited) (Audited)
March 31, June 30,
2019 2018
Note
5. INVESTMENTS - NET
Equity Securities
At fair value through profit or loss
- equity securities 5.1 6,846,978 6,047,618
- letter of rights - 21,440
At fair value through Other Comprehensive income
- equity securities 5.2 - 4,196,185
6,846,978 10,265,243
------------Rupees in '000------------
------------Rupees in '000------------
Profit rate on these profit and loss sharing accounts is 5.50% to 10.5% (June 30, 2018: 4% to 6.20%) per annum.
The following assessments have been made on the basis of the facts and circumstances that existed at the date of initial
application.
The Fund has used the exemption not to restate comparative periods as allowed under IFRS 9 and the differences, if any, in the
carrying amounts of financial assets resulting from the adoption of IFRS 9 are recognised in opening retained earnings as at July
1, 2018. Accordingly, the comparative information does not reflect the requirements of IFRS 9, but rather those of IAS 39.
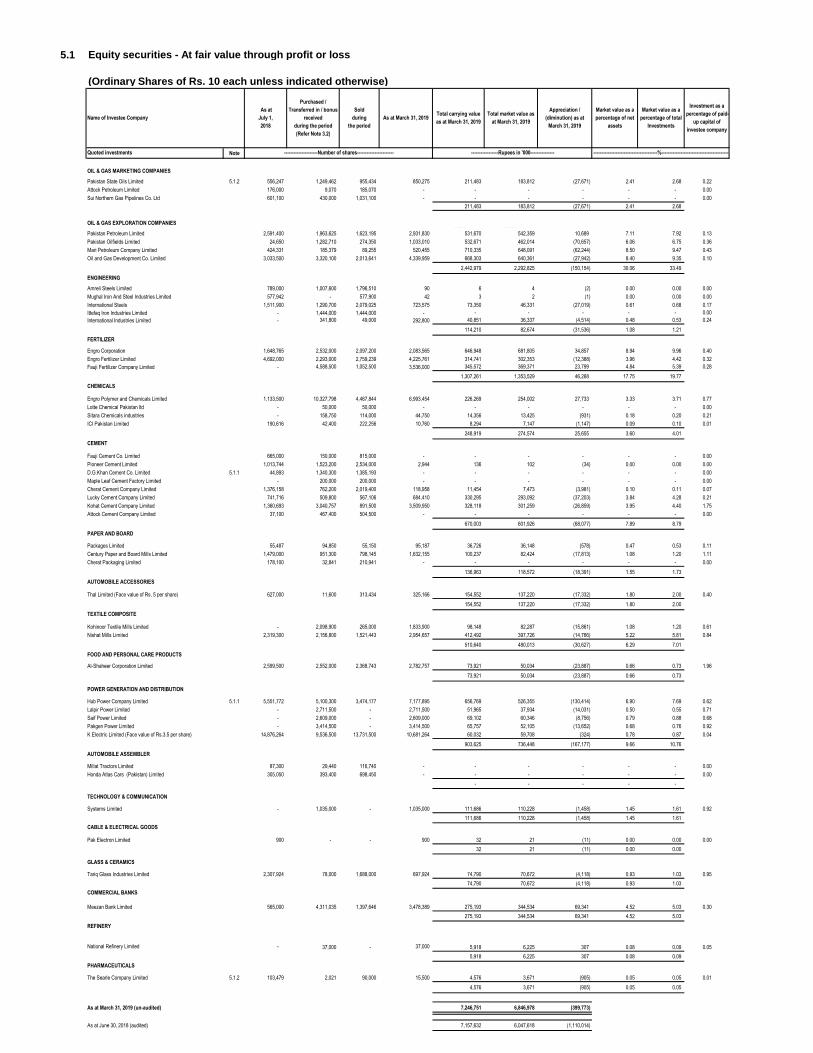
5.1 Equity securities - At fair value through profit or loss
(Ordinary Shares of Rs. 10 each unless indicated otherwise)
Note
OIL & GAS MARKETING COMPANIES
PSO Pakistan State Oils Limited 5.1.2 556,247 1,249,462 955,434 850,275 211,483 183,812 (27,671) 2.41 2.68 0.22
APL Attock Petroleum Limited 176,000 9,070 185,070 - - - - - - 0.00
SNGP Sui Northern Gas Pipelines Co. Ltd 601,100 430,000 1,031,100 - - - - - - 0.00
211,483 183,812 (27,671) 2.41 2.68
OIL & GAS EXPLORATION COMPANIES #N/A #N/A
PPL Pakistan Petroleum Limited 2,591,400 1,963,625 1,623,195 2,931,830 531,670 542,359 10,689 7.11 7.92 0.13
POL Pakistan Oilfields Limited 24,650 1,282,710 274,350 1,033,010 532,671 462,014 (70,657) 6.06 6.75 0.36
Mari Mari Petroleum Company Limited 424,331 185,379 89,255 520,455 710,335 648,091 (62,244) 8.50 9.47 0.43
OGDC Oil and Gas Development Co. Limited 3,033,500 3,320,100 2,013,641 4,339,959 668,303 640,361 (27,942) 8.40 9.35 0.10
2,442,979 2,292,825 (150,154) 30.06 33.49
ENGINEERING
ASTL Amreli Steels Limited 789,000 1,007,600 1,796,510 90 6 4 (2) 0.00 0.00 0.00
MUGHAL Mughal Iron And Steel Industries Limited 577,942 - 577,900 42 3 2 (1) 0.00 0.00 0.00
ISL International Steels 1,511,900 1,290,700 2,079,025 723,575 73,350 46,331 (27,019) 0.61 0.68 0.17
ITTEFAQ Ittefaq Iron Industries Limited - 1,444,000 1,444,000 - - - - - - 0.00
INIL International Industries Limited - 341,800 49,000 292,800 40,851 36,337 (4,514) 0.48 0.53 0.24
114,210 82,674 (31,536) 1.08 1.21
FERTILIZER
ENGRO Engro Corporation 1,648,765 2,532,000 2,097,200 2,083,565 646,948 681,805 34,857 8.94 9.96 0.40
EFERT Engro Fertilizer Limited 4,692,000 2,293,000 2,759,239 4,225,761 314,741 302,353 (12,388) 3.96 4.42 0.32
FFC Fauji Fertilizer Company Limited - 4,588,500 1,052,500 3,536,000 345,572 369,371 23,799 4.84 5.39 0.28
1,307,261 1,353,529 46,268 17.75 19.77
CHEMICALS
EPCL Engro Polymer and Chemicals Limited 1,133,500 10,327,798 4,467,844 6,993,454 226,269 254,002 27,733 3.33 3.71 0.77
LOTCHEM Lotte Chemical Pakistan ltd - 50,000 50,000 - - - - - - 0.00
SITC Sitara Chemicals industries - 158,750 114,000 44,750 14,356 13,425 (931) 0.18 0.20 0.21
ICI ICI Pakistan Limited 190,616 42,400 222,256 10,760 8,294 7,147 (1,147) 0.09 0.10 0.01
248,919 274,574 25,655 3.60 4.01
CEMENT
FFC Fauji Cement Co. Limited 665,000 150,000 815,000 - - - - - - 0.00
PIOC Pioneer Cement Limited 1,013,744 1,523,200 2,534,000 2,944 136 102 (34) 0.00 0.00 0.00
DGKC D.G.Khan Cement Co. Limited 5.1.1 44,893 1,340,300 1,385,193 - - - - - - 0.00
MLCF Maple Leaf Cement Factory Limited - 200,000 200,000 - - - - - - 0.00
CHCC Cherat Cement Company Limited 1,376,158 762,200 2,019,400 118,958 11,454 7,473 (3,981) 0.10 0.11 0.07
LUCK Lucky Cement Company Limited 741,716 509,800 567,106 684,410 330,295 293,092 (37,203) 3.84 4.28 0.21
KOHC Kohat Cement Company Limited 1,360,693 3,040,757 891,500 3,509,950 328,118 301,259 (26,859) 3.95 4.40 1.75
ACPL Attock Cement Company Limited 37,100 467,400 504,500 - - - - - - 0.00
670,003 601,926 (68,077) 7.89 8.79
PAPER AND BOARD
PKGS Packages Limited 55,487 94,850 55,150 95,187 36,726 36,148 (578) 0.47 0.53 0.11
CEPB Century Paper and Board Mills Limited 1,479,000 951,300 798,145 1,632,155 100,237 82,424 (17,813) 1.08 1.20 1.11
CPPL Cherat Packaging Limited 178,100 32,841 210,941 - - - - - - 0.00
136,963 118,572 (18,391) 1.55 1.73
AUTOMOBILE ACCESSORIES
THALL Thal Limited (Face value of Rs. 5 per share) 627,000 11,600 313,434 325,166 154,552 137,220 (17,332) 1.80 2.00 0.40
154,552 137,220 (17,332) 1.80 2.00
TEXTILE COMPOSITE
KTML Kohinoor Textile Mills Limited - 2,098,900 265,000 1,833,900 98,148 82,287 (15,861) 1.08 1.20 0.61
NML Nishat Mills Limited 2,319,300 2,156,800 1,521,443 2,954,657 412,492 397,726 (14,766) 5.22 5.81 0.84
510,640 480,013 (30,627) 6.29 7.01
FOOD AND PERSONAL CARE PRODUCTS
ASC Al-Shaheer Corporation Limited 2,599,500 2,552,000 2,368,743 2,782,757 73,921 50,034 (23,887) 0.66 0.73 1.96
73,921 50,034 (23,887) 0.66 0.73
POWER GENERATION AND DISTRIBUTION
HUBC Hub Power Company Limited 5.1.1 5,551,772 5,100,300 3,474,177 7,177,895 656,769 526,355 (130,414) 6.90 7.69 0.62
LPL Lalpir Power Limited - 2,711,500 - 2,711,500 51,965 37,934 (14,031) 0.50 0.55 0.71
SPWL Saif Power Limited - 2,609,000 - 2,609,000 69,102 60,346 (8,756) 0.79 0.88 0.68
PKGP Pakgen Power Limited - 3,414,500 - 3,414,500 65,757 52,105 (13,652) 0.68 0.76 0.92
KEL K Electric Limited (Face value of Rs.3.5 per share) 14,876,264 9,536,500 13,731,500 10,681,264 60,032 59,708 (324) 0.78 0.87 0.04
903,625 736,448 (167,177) 9.66 10.76
AUTOMOBILE ASSEMBLER
MTL Millat Tractors Limited 87,300 29,440 116,740 - - - - - - 0.00
HCAR Honda Atlas Cars (Pakistan) Limited 305,050 393,400 698,450 - - - - - - 0.00
- - - - -
TECHNOLOGY & COMMUNICATION
SYS Systems Limited - 1,035,000 - 1,035,000 111,686 110,228 (1,458) 1.45 1.61 0.92
111,686 110,228 (1,458) 1.45 1.61
CABLE & ELECTRICAL GOODS
PAEL Pak Electron Limited 900 - - 900 32 21 (11) 0.00 0.00 0.00
32 21 (11) 0.00 0.00
GLASS & CERAMICS
TGL Tariq Glass Industries Limited 2,307,924 78,000 1,688,000 697,924 74,790 70,672 (4,118) 0.93 1.03 0.95
74,790 70,672 (4,118) 0.93 1.03
COMMERCIAL BANKS
MEBL Meezan Bank Limited 565,000 4,311,035 1,397,646 3,478,389 275,193 344,534 69,341 4.52 5.03 0.30
275,193 344,534 69,341 4.52 5.03
REFINERY
NRL National Refinery Limited - 37,000 - 37,000 5,918 6,225 307 0.08 0.09 0.05
5,918 6,225 307 0.08 0.09
PHARMACEUTICALS
SEARL The Searle Company Limited 5.1.2 103,479 2,021 90,000 15,500 4,576 3,671 (905) 0.05 0.05 0.01
4,576 3,671 (905) 0.05 0.05
As at March 31, 2019 (un-audited) 7,246,751 6,846,978 (399,773)
As at June 30, 2018 (audited) 7,157,632 6,047,618 (1,110,014)
Total market value as
at March 31, 2019
Appreciation /
(diminution) as at
March 31, 2019
Market value as a
percentage of net
assets
Market value as a
percentage of total
Investments
Investment as a
percentage of paid-
up capital of
investee company
Quoted investments ---------------------Number of shares----------------------- -----------------Rupees in '000--------------- ----------------------------------------%------------------------------------------
Name of Investee Company
As at
July 1,
2018
Purchased /
Transferred in / bonus
received
during the period
(Refer Note 3.2)
Sold
during
the period
As at March 31, 2019Total carrying value
as at March 31, 2019
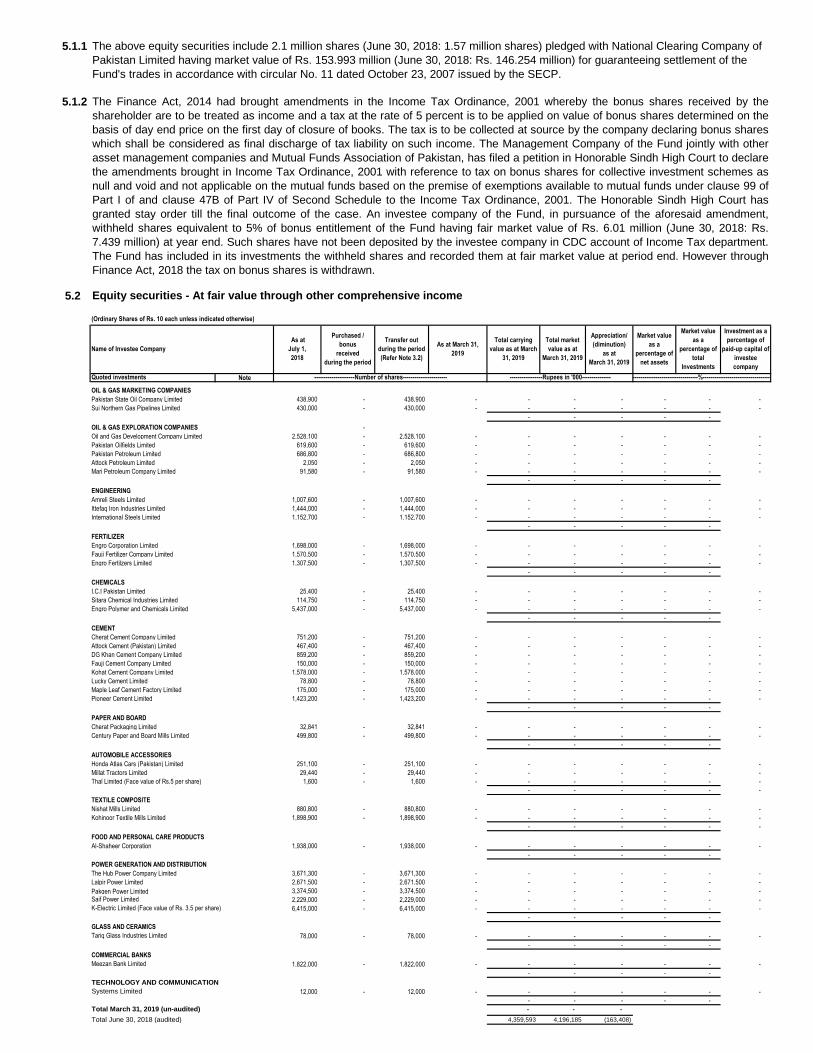
5.1.1
5.1.2
5.2 Equity securities - At fair value through other comprehensive income
(Ordinary Shares of Rs. 10 each unless indicated otherwise)
Note
OIL & GAS MARKETING COMPANIES
Pakistan State Oil Company Limited 438,900 - 438,900 - - - - - - -
Sui Northern Gas Pipelines Limited 430,000 - 430,000 - - - - - - -
- - - - -
OIL & GAS EXPLORATION COMPANIES -
Oil and Gas Development Company Limited 2,528,100 - 2,528,100 - - - - - - -
Pakistan Oilfields Limited 619,600 - 619,600 - - - - - - -
Pakistan Petroleum Limited 686,800 - 686,800 - - - - - - -
Attock Petroleum Limited 2,050 - 2,050 - - - - - - -
Mari Petroleum Company Limited 91,580 - 91,580 - - - - - - -
- - - - -
ENGINEERING
Amreli Steels Limited 1,007,600 - 1,007,600 - - - - - - -
Ittefaq Iron Industries Limited 1,444,000 - 1,444,000 - - - - - - -
International Steels Limited 1,152,700 - 1,152,700 - - - - - - -
- - - - -
FERTILIZER
Engro Corporation Limited 1,698,000 - 1,698,000 - - - - - - -
Fauji Fertilizer Company Limited 1,570,500 - 1,570,500 - - - - - - -
Engro Fertilzers Limited 1,307,500 - 1,307,500 - - - - - - -
- - - - -
CHEMICALS
I.C.I Pakistan Limited 25,400 - 25,400 - - - - - - -
Sitara Chemical Industries Limited 114,750 - 114,750 - - - - - - -
Engro Polymer and Chemicals Limited 5,437,000 - 5,437,000 - - - - - - -
- - - - -
CEMENT
Cherat Cement Company Limited 751,200 - 751,200 - - - - - - -
Attock Cement (Pakistan) Limited 467,400 - 467,400 - - - - - - -
DG Khan Cement Company Limited 859,200 - 859,200 - - - - - - -
Fauji Cement Company Limited 150,000 - 150,000 - - - - - - -
Kohat Cement Company Limited 1,578,000 - 1,578,000 - - - - - - -
Lucky Cement Limited 78,800 - 78,800 - - - - - - -
Maple Leaf Cement Factory Limited 175,000 - 175,000 - - - - - - -
Pioneer Cement Limited 1,423,200 - 1,423,200 - - - - - - -
- - - - -
PAPER AND BOARD
Cherat Packaging Limited 32,841 - 32,841 - - - - - - -
Century Paper and Board Mills Limited 499,800 - 499,800 - - - - - - -
- - - - -
AUTOMOBILE ACCESSORIES
Honda Atlas Cars (Pakistan) Limited 251,100 - 251,100 - - - - - - -
Millat Tractors Limited 29,440 - 29,440 - - - - - - -
Thal Limited (Face value of Rs.5 per share) 1,600 - 1,600 - - - - - - -
- - - - - -
TEXTILE COMPOSITE
Nishat Mills Limited 880,800 - 880,800 - - - - - - -
Kohinoor Textile Mills Limited 1,898,900 - 1,898,900 - - - - - - -
- - - - - -
FOOD AND PERSONAL CARE PRODUCTS
Al-Shaheer Corporation 1,938,000 - 1,938,000 - - - - - - -
- - - - -
POWER GENERATION AND DISTRIBUTION
The Hub Power Company Limited 3,671,300 - 3,671,300 - - - - - - -
Lalpir Power Limited 2,671,500 - 2,671,500 - - - - - - -
Pakgen Power Limited 3,374,500 - 3,374,500 - - - - - - -
Saif Power Limited 2,229,000 - 2,229,000 - - - - - - -
K-Electric Limited (Face value of Rs. 3.5 per share) 6,415,000 - 6,415,000 - - - - - - -
- - - - -
GLASS AND CERAMICS
Tariq Glass Industries Limited 78,000 - 78,000 - - - - - - -
- - - - -
COMMERCIAL BANKS
Meezan Bank Limited 1,822,000 - 1,822,000 - - - - - - -
- - - - -
TECHNOLOGY AND COMMUNICATION
Systems Limited 12,000 - 12,000 - - - - - - -
- - - - -
Total March 31, 2019 (un-audited) 6,035,297 - - -
Total June 30, 2018 (audited) 4,359,593 4,196,185 (163,408)
Transfer out
during the period
(Refer Note 3.2)
The Finance Act, 2014 had brought amendments in the Income Tax Ordinance, 2001 whereby the bonus shares received by the
shareholder are to be treated as income and a tax at the rate of 5 percent is to be applied on value of bonus shares determined on the
basis of day end price on the first day of closure of books. The tax is to be collected at source by the company declaring bonus shares
which shall be considered as final discharge of tax liability on such income. The Management Company of the Fund jointly with other
asset management companies and Mutual Funds Association of Pakistan, has filed a petition in Honorable Sindh High Court to declare
the amendments brought in Income Tax Ordinance, 2001 with reference to tax on bonus shares for collective investment schemes as
null and void and not applicable on the mutual funds based on the premise of exemptions available to mutual funds under clause 99 of
Part I of and clause 47B of Part IV of Second Schedule to the Income Tax Ordinance, 2001. The Honorable Sindh High Court has
granted stay order till the final outcome of the case. An investee company of the Fund, in pursuance of the aforesaid amendment,
withheld shares equivalent to 5% of bonus entitlement of the Fund having fair market value of Rs. 6.01 million (June 30, 2018: Rs.
7.439 million) at year end. Such shares have not been deposited by the investee company in CDC account of Income Tax department.
The Fund has included in its investments the withheld shares and recorded them at fair market value at period end. However through
Finance Act, 2018 the tax on bonus shares is withdrawn.
Market value
as a
percentage of
total
Investments
The above equity securities include 2.1 million shares (June 30, 2018: 1.57 million shares) pledged with National Clearing Company of
Pakistan Limited having market value of Rs. 153.993 million (June 30, 2018: Rs. 146.254 million) for guaranteeing settlement of the
Fund's trades in accordance with circular No. 11 dated October 23, 2007 issued by the SECP.
Investment as a
percentage of
paid-up capital of
investee
company
Quoted investments ---------------------Number of shares----------------------- -----------------Rupees in '000--------------- ----------------------------------------%------------------------------------------
Name of Investee Company
As at
July 1,
2018
Purchased /
bonus
received
during the period
As at March 31,
2019
Total carrying
value as at March
31, 2019
Total market
value as at
March 31, 2019
Appreciation/
(diminution)
as at
March 31, 2019
Market value
as a
percentage of
net assets

6.
7.
7.1 Provision for indirect taxes and duties
7.2 Provision for Workers' Welfare Fund (WWF)
8. CONTINGENCIES AND COMMITMENTS
9. TAXATION
10. EARNINGS PER UNIT
11.
As disclosed in note 14.3 to the annual financial statements for the year ended June 30, 2018, the Provision for Workers’ Welfare
Fund (WWF) held in the books of accounts till June 30, 2015 was reversed on January 12, 2017. There is no change in the status of
the legal proceeding on this matter, which has been fully disclosed in note 14.3 to the annual audited financial statements for the year
ended June 30, 2018.
TOTAL EXPENSE RATIO
ACCRUED EXPENSES AND OTHER LIABILITIES
Further, this includes provision for Sindh Workers’ Welfare Fund (SWWF) as at March 31, 2019 amounting to Rs. 64.137 million
(June 30, 2018: Rs.64.137 million). The Management Company, based on an opinion obtained by MUFAP, believes that Mutual
Funds are not liable to pay SWWF under the said law, for the reason that the Mutual Funds are not financial institutions and rather an
investment vehicle. However, the Sindh Revenue Board (SRB) has not accepted the said position of MUFAP and as a result, MUFAP
has taken up this matter with the Sindh Finance Ministry for resolution. Despite this, MUFAP recommended its members to make
provision for SWWF on prudence basis. Had the SWWF not been provided for, the net assets value per unit would have been higher
by Re. 0.93 (June 30, 2018: Re. 0.66).
This includes provision for federal excise duty (FED) as at March 31, 2019 amounting to Rs. 10.650 million (June 30, 2018: Rs.
10.650 million). There is no change in the status of the legal proceeding on this matter, which has been fully disclosed in note 14.2 to
the annual audited financial statements for the year ended June 30, 2018. As a matter of abundant caution, the Management
Company has maintained full provision for FED aggregating to Rs. 10.650 million till June 30, 2016. Had the provision not been
provided for, the net assets value per unit would have been higher by Re.0.15 (June 30, 2018: Re.0.11).
There were no contingencies and commitments outstanding as at March 31, 2019.
As per Directive 23 of 2016 dated July 20, 2016 issued by SECP, the Total Expense Ratio of the Fund is 2.46% as on March 31, 2019
and this includes 0.30% representing government levy, worker's welfare fund and SECP fee.
Earnings per unit (EPU) for respective plans have not been disclosed in this condensed interim financial information as in the opinion
of the Management Company, the determination of the cumulative weighted average number of outstanding units is not practicable.
The Fund's income is exempt from Income Tax as per clause (99) of Part I of the Second Schedule to the Income Tax Ordinance,
2001 subject to the condition that not less than 90% of the accounting income for the year as reduced by capital gains whether
realised or unrealised is distributed to the unit holders in cash. The Fund is also exempt from the provisions of section 113 (minimum
tax) under clause 11A of Part IV of the Second Schedule to the Income Tax Ordinance, 2001. As the Management Company intends
to distributed through cash at least 90% of the Fund's net accounting income as reduced by capital gain whether realised or
unrealised by the year-end to the unit holders, accordingly, no provision for taxation has been recognized in this condensed interim
financial information.
ADVANCE INCOME TAX
The income of the Fund is exempt under clause 99 of Part I of the Second Schedule of the Income Tax Ordinance, 2001 (ITO 2001).
Further, the fund is exempt under clause 47(B) of Part IV of Second Schedule of ITO 2001 from withholding tax under section 150,
150A, 151 and 233 of ITO 2001. The Federal Board of Revenue (FBR) , through a circular “C.No.1 (43) DG (WHT)/ 2008-Vol.II-
66417-R” date May 12, 2015, made it mandatory to obtain exemption certificates under section 159(1) of the ITO 2001 from
Commissioner Inland Revenue (CIR). Prior to receiving tax exemption certificate from CIR, various withholding agents have deducted
advance tax under section 150, 150A and 151 of the Income Tax Ordinance, 2001. The management is confident that the same shall
be refunded after filing Income Tax Return for the Tax Year 2019.
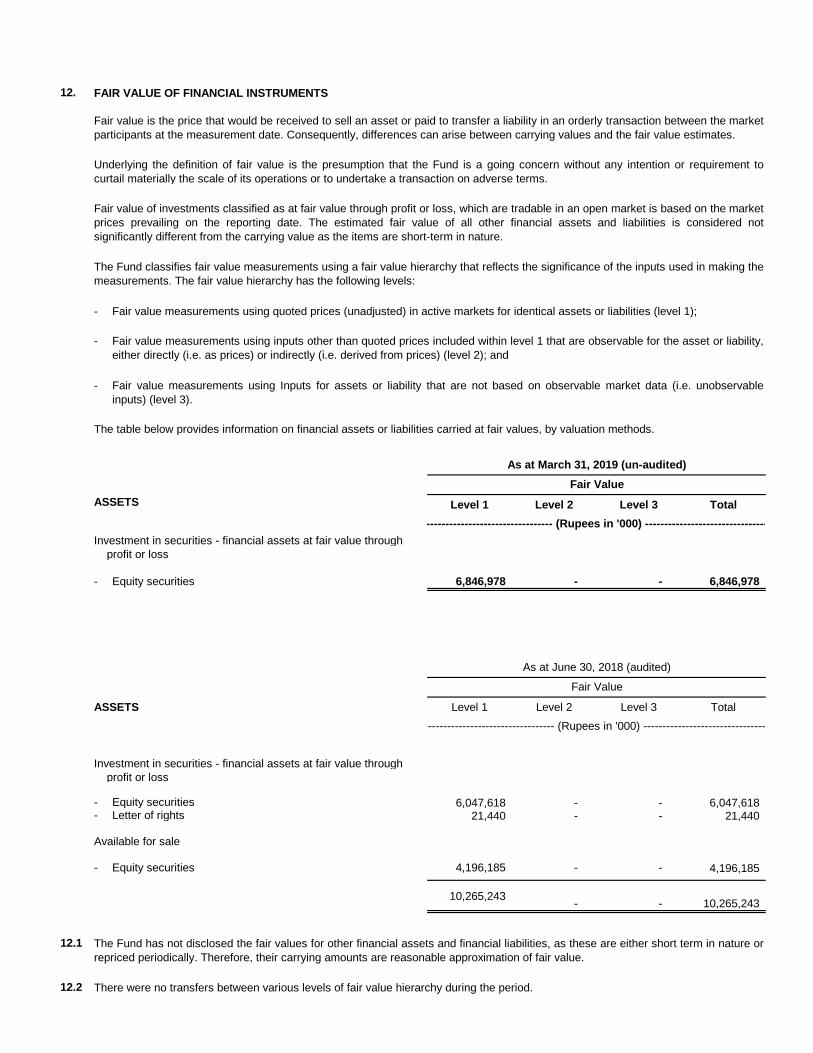
12. FAIR VALUE OF FINANCIAL INSTRUMENTS
-
-
-
ASSETS Level 1 Level 2 Level 3 Total
Investment in securities - financial assets at fair value through
profit or loss
- Equity securities 6,846,978 - - 6,846,978
ASSETS Level 1 Level 2 Level 3 Total
Investment in securities - financial assets at fair value through
profit or loss
- Equity securities 6,047,618 - - 6,047,618 - Letter of rights 21,440 - - 21,440
Available for sale
- Equity securities 4,196,185 - - 4,196,185
10,265,243 - - 10,265,243
12.1
12.2
Fair value is the price that would be received to sell an asset or paid to transfer a liability in an orderly transaction between the market
participants at the measurement date. Consequently, differences can arise between carrying values and the fair value estimates.
Underlying the definition of fair value is the presumption that the Fund is a going concern without any intention or requirement to
curtail materially the scale of its operations or to undertake a transaction on adverse terms.
The Fund has not disclosed the fair values for other financial assets and financial liabilities, as these are either short term in nature or
repriced periodically. Therefore, their carrying amounts are reasonable approximation of fair value.
Fair value of investments classified as at fair value through profit or loss, which are tradable in an open market is based on the market
prices prevailing on the reporting date. The estimated fair value of all other financial assets and liabilities is considered not
significantly different from the carrying value as the items are short-term in nature.
The Fund classifies fair value measurements using a fair value hierarchy that reflects the significance of the inputs used in making the
measurements. The fair value hierarchy has the following levels:
There were no transfers between various levels of fair value hierarchy during the period.
Fair Value
Fair value measurements using inputs other than quoted prices included within level 1 that are observable for the asset or liability,
either directly (i.e. as prices) or indirectly (i.e. derived from prices) (level 2); and
Fair value measurements using Inputs for assets or liability that are not based on observable market data (i.e. unobservable
inputs) (level 3).
Fair value measurements using quoted prices (unadjusted) in active markets for identical assets or liabilities (level 1);
As at March 31, 2019 (un-audited)
---------------------------------- (Rupees in '000) ---------------------------------
As at June 30, 2018 (audited)
---------------------------------- (Rupees in '000) ---------------------------------
The table below provides information on financial assets or liabilities carried at fair values, by valuation methods.
Fair Value
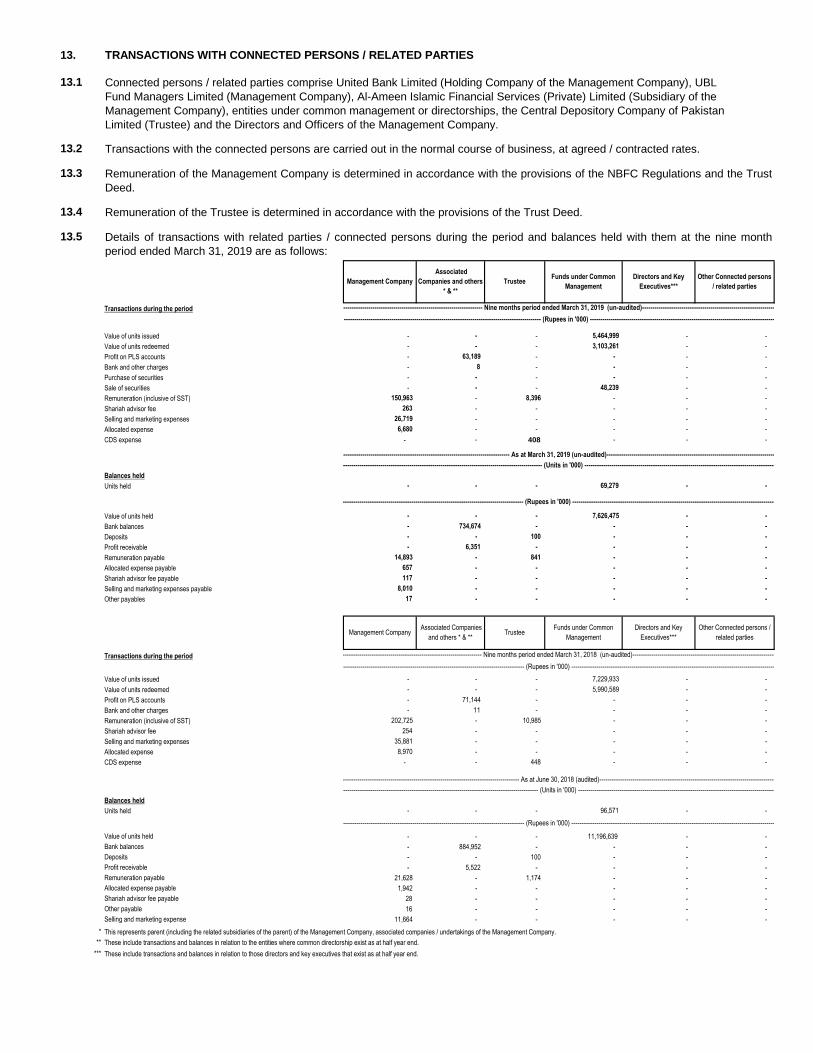
13. TRANSACTIONS WITH CONNECTED PERSONS / RELATED PARTIES
13.1
13.2
13.3
13.4
13.5
Transactions during the period
Value of units issued - - - 5,464,999 - -
Value of units redeemed - - - 3,103,261 - -
Profit on PLS accounts - 63,189 - - - -
Bank and other charges - 8 - - - -
Purchase of securities - - - - - -
Sale of securities - - - 48,239 - -
Remuneration (inclusive of SST) 150,963 - 8,396 - - -
Shariah advisor fee 263 - - - - -
Selling and marketing expenses 26,719 - - - - -
Allocated expense 6,680 - - - - -
CDS expense - - 408 - - -
Balances held
Units held - - - 69,279 - -
Value of units held - - - 7,626,475 - -
Bank balances - 734,674 - - - -
Deposits - - 100 - - -
Profit receivable - 6,351 - - - -
Remuneration payable 14,893 - 841 - - -
Allocated expense payable 657 - - - - -
Shariah advisor fee payable 117 - - - - -
Selling and marketing expenses payable 8,010 - - - - -
Other payables 17 - - - - -
Transactions during the period
Value of units issued - - - 7,229,933 - -
Value of units redeemed - - - 5,990,589 - -
Profit on PLS accounts - 71,144 - - - -
Bank and other charges - 11 - - - -
Remuneration (inclusive of SST) 202,725 - 10,985 - - -
Shariah advisor fee 254 - - - - -
Selling and marketing expenses 35,881 - - - - -
Allocated expense 8,970 - - - - -
CDS expense - - 448 - - -
Balances held
Units held - - - 96,571 - -
Value of units held - - - 11,196,639 - -
Bank balances - 884,952 - - - -
Deposits - - 100 - - -
Profit receivable - 5,522 - - - -
Remuneration payable 21,628 - 1,174 - - -
Allocated expense payable 1,942 - - - - -
Shariah advisor fee payable 28 - - - - -
Other payable 16 - - - - -
Selling and marketing expense 11,664 - - - - -
*
**
***
----------------------------------------------------------------------------------------------------- (Units in '000) ------------------------------------------------------------------------------------------------------
----------------------------------------------------------------------------------------- (Rupees in '000) ----------------------------------------------------------------------------------------------------
Remuneration of the Management Company is determined in accordance with the provisions of the NBFC Regulations and the Trust
Deed.
Remuneration of the Trustee is determined in accordance with the provisions of the Trust Deed.
Directors and Key
Executives***
Other Connected persons
/ related partiesTrustee Management Company
Associated
Companies and others
* & **
-------------------------------------------------------------------------------------------- As at June 30, 2018 (audited)--------------------------------------------------------------------------------------------
----------------------------------------------------------------------------------------------- (Rupees in '000) -----------------------------------------------------------------------------------------
----------------------------------------------------------------------------------------- (Rupees in '000) ----------------------------------------------------------------------------------------------------
Transactions with the connected persons are carried out in the normal course of business, at agreed / contracted rates.
Connected persons / related parties comprise United Bank Limited (Holding Company of the Management Company), UBL
Fund Managers Limited (Management Company), Al-Ameen Islamic Financial Services (Private) Limited (Subsidiary of the
Management Company), entities under common management or directorships, the Central Depository Company of Pakistan
Limited (Trustee) and the Directors and Officers of the Management Company.
--------------------------------------------------------------------------------------- Nine months period ended March 31, 2018 (un-audited)-----------------------------------------------------------------------------------------
------------------------------------------------------------------------------- Nine months period ended March 31, 2019 (un-audited)----------------------------------------------------------------------------
--------------------------------------------------------------------------------------- As at March 31, 2019 (un-audited)----------------------------------------------------------------------------------------
Trustee
----------------------------------------------------------------------------------------- (Rupees in '000) ----------------------------------------------------------------------------------------------------
Other Connected persons /
related partiesManagement Company
Associated Companies
and others * & **
Details of transactions with related parties / connected persons during the period and balances held with them at the nine month
period ended March 31, 2019 are as follows:
Funds under Common
Management
Directors and Key
Executives***
-------------------------------------------------------------------------------------------------- (Units in '000) ----------------------------------------------------------------------------------------------
Funds under Common
Management
These include transactions and balances in relation to those directors and key executives that exist as at half year end.
These include transactions and balances in relation to the entities where common directorship exist as at half year end.
This represents parent (including the related subsidiaries of the parent) of the Management Company, associated companies / undertakings of the Management Company.
14. GENERAL
14.1
15. DATE OF AUTHORISATION FOR ISSUE
Figures have been rounded off to the nearest thousand of rupees unless otherwise stated.
This condensed interim financial information were authorised for issue on ___________________ by the Board of Directors of the
Management Company.
(Management Company)
For UBL Fund Managers Limited
__________________ Director
_____________________ Chief Executive Officer
_____________________ Chief Financial Officer
SD SD SD
April 29, 2019
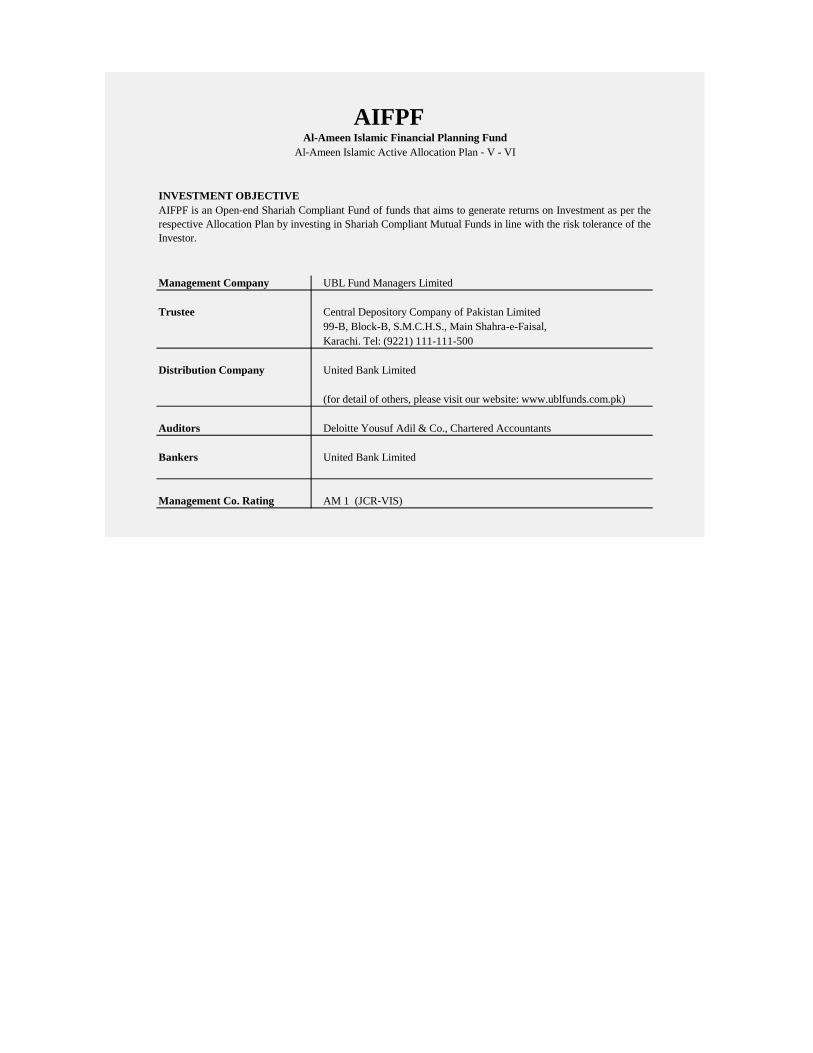
Management Company UBL Fund Managers Limited
Trustee Central Depository Company of Pakistan Limited
99-B, Block-B, S.M.C.H.S., Main Shahra-e-Faisal,
Karachi. Tel: (9221) 111-111-500
Distribution Company United Bank Limited
Auditors Deloitte Yousuf Adil & Co., Chartered Accountants
Bankers United Bank Limited
Management Co. Rating AM 1 (JCR‐VIS)
AIFPF is an Open‐end Shariah Compliant Fund of funds that aims to generate returns on Investment as per the
respective Allocation Plan by investing in Shariah Compliant Mutual Funds in line with the risk tolerance of the
Investor.
(for detail of others, please visit our website: www.ublfunds.com.pk)
AIFPFAl-Ameen Islamic Financial Planning Fund
Al‐Ameen Islamic Active Allocation Plan ‐ V - VI
INVESTMENT OBJECTIVE
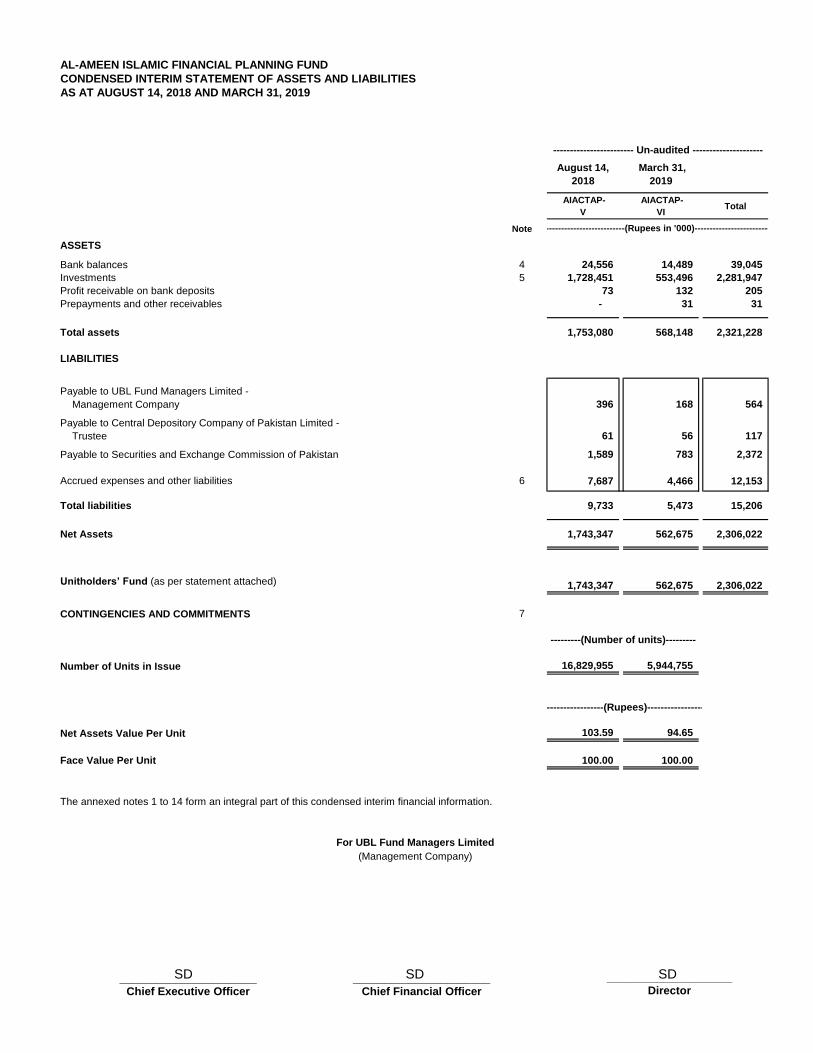
AL-AMEEN ISLAMIC FINANCIAL PLANNING FUND
CONDENSED INTERIM STATEMENT OF ASSETS AND LIABILITIES
AS AT AUGUST 14, 2018 AND MARCH 31, 2019
AIACTAP-
V
AIACTAP-
VI Total
Note
ASSETS
Bank balances 4 24,556 14,489 39,045
Investments 5 1,728,451 553,496 2,281,947
Profit receivable on bank deposits 73 132 205
Prepayments and other receivables - 31 31
Total assets 1,753,080 568,148 2,321,228
LIABILITIES
Payable to UBL Fund Managers Limited -
Management Company 396 168 564
Payable to Central Depository Company of Pakistan Limited -
Trustee 61 56 117
Payable to Securities and Exchange Commission of Pakistan 1,589 783 2,372
Accrued expenses and other liabilities 6 7,687 4,466 12,153
Total liabilities 9,733 5,473 15,206
Net Assets 1,743,347 562,675 2,306,022
Unitholders’ Fund (as per statement attached) 1,743,347 562,675 2,306,022
CONTINGENCIES AND COMMITMENTS 7
Number of Units in Issue 16,829,955 5,944,755
Net Assets Value Per Unit 103.59 94.65
Face Value Per Unit 100.00 100.00
The annexed notes 1 to 14 form an integral part of this condensed interim financial information.
(Management Company)
----------------------------------------------------------------------(Rupees in '000)----------------------------------------------------------------------
For UBL Fund Managers Limited
------------------------ Un-audited ---------------------
---------(Number of units)---------
August 14,
2018
March 31,
2019
-----------------------------------------------------------------------------(Rupees)-----------------------------------------------------------------------------
______________________ Chief Executive Officer
____________________ Director
______________________ Chief Financial Officer
SD SD SD
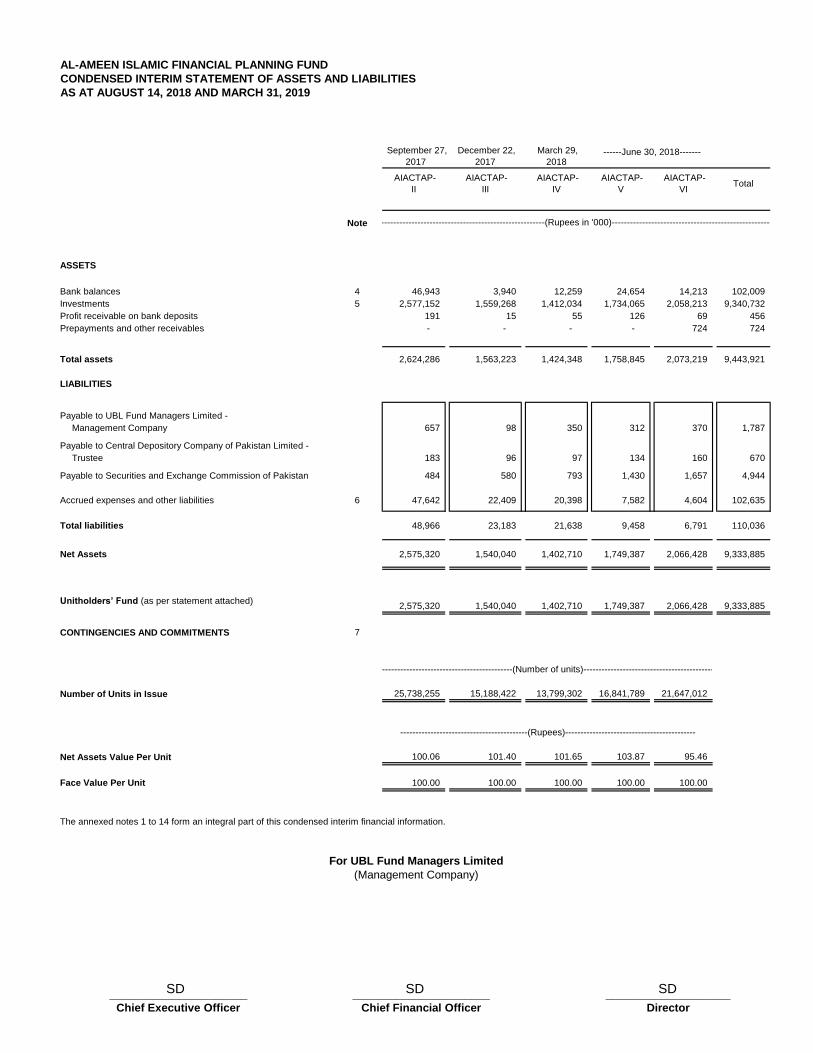
AL-AMEEN ISLAMIC FINANCIAL PLANNING FUND
CONDENSED INTERIM STATEMENT OF ASSETS AND LIABILITIES
AS AT AUGUST 14, 2018 AND MARCH 31, 2019
AIACTAP-
II
AIACTAP-
III
AIACTAP-
IV
AIACTAP-
V
AIACTAP-
VI Total
Note
ASSETS
Bank balances 4 46,943 3,940 12,259 24,654 14,213 102,009
Investments 5 2,577,152 1,559,268 1,412,034 1,734,065 2,058,213 9,340,732
Profit receivable on bank deposits 191 15 55 126 69 456
Prepayments and other receivables - - - - 724 724
Total assets 2,624,286 1,563,223 1,424,348 1,758,845 2,073,219 9,443,921
LIABILITIES
Payable to UBL Fund Managers Limited -
Management Company 657 98 350 312 370 1,787
Payable to Central Depository Company of Pakistan Limited -
Trustee 183 96 97 134 160 670
Payable to Securities and Exchange Commission of Pakistan 484 580 793 1,430 1,657 4,944
Accrued expenses and other liabilities 6 47,642 22,409 20,398 7,582 4,604 102,635
Total liabilities 48,966 23,183 21,638 9,458 6,791 110,036
Net Assets 2,575,320 1,540,040 1,402,710 1,749,387 2,066,428 9,333,885
Unitholders’ Fund (as per statement attached)2,575,320 1,540,040 1,402,710 1,749,387 2,066,428 9,333,885
CONTINGENCIES AND COMMITMENTS 7
Number of Units in Issue 25,738,255 15,188,422 13,799,302 16,841,789 21,647,012
Net Assets Value Per Unit 100.06 101.40 101.65 103.87 95.46
Face Value Per Unit 100.00 100.00 100.00 100.00 100.00
The annexed notes 1 to 14 form an integral part of this condensed interim financial information.
-----------------------------------------------------------------(Number of units)-----------------------------------------------------------------
For UBL Fund Managers Limited
(Management Company)
------------------------------------------(Rupees)-------------------------------------------
----------------------------------------------------------------------(Rupees in '000)----------------------------------------------------------------------
March 29,
2018 ------June 30, 2018------- September 27,
2017
December 22,
2017
______________________ Chief Executive Officer
____________________ Director
______________________ Chief Financial Officer
SDSDSD
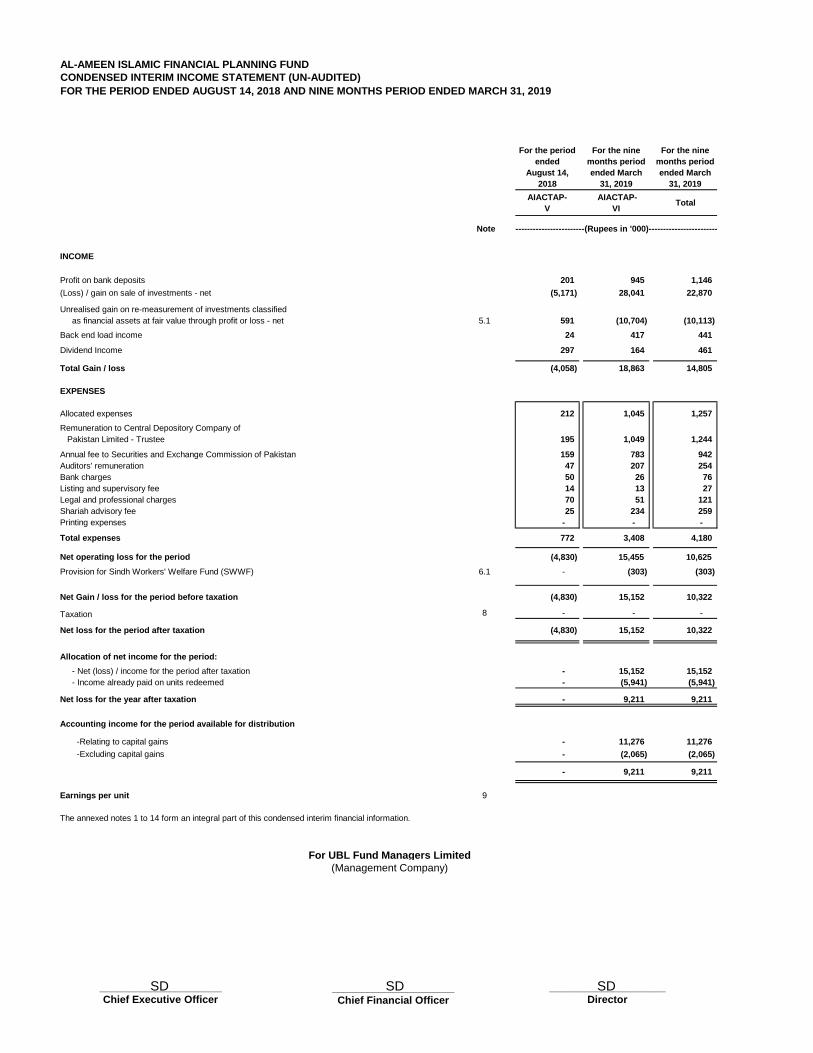
AL-AMEEN ISLAMIC FINANCIAL PLANNING FUND
CONDENSED INTERIM INCOME STATEMENT (UN-AUDITED)
FOR THE PERIOD ENDED AUGUST 14, 2018 AND NINE MONTHS PERIOD ENDED MARCH 31, 2019
For the period
ended
August 14,
2018
For the nine
months period
ended March
31, 2019
For the nine
months period
ended March
31, 2019
AIACTAP-
V
AIACTAP-
VI Total
Note
INCOME
Profit on bank deposits 201 945 1,146
(Loss) / gain on sale of investments - net (5,171) 28,041 22,870
Unrealised gain on re-measurement of investments classified
as financial assets at fair value through profit or loss - net 5.1 591 (10,704) (10,113)
Back end load income 24 417 441
Dividend Income 297 164 461
Total Gain / loss (4,058) 18,863 14,805
EXPENSES
Allocated expenses 212 1,045 1,257
Remuneration to Central Depository Company of
Pakistan Limited - Trustee 195 1,049 1,244
Annual fee to Securities and Exchange Commission of Pakistan 159 783 942
Auditors' remuneration 47 207 254
Bank charges 50 26 76
Listing and supervisory fee 14 13 27
Legal and professional charges 70 51 121
Shariah advisory fee 25 234 259
Printing expenses - - -
Total expenses 772 3,408 4,180
Net operating loss for the period (4,830) 15,455 10,625
Provision for Sindh Workers' Welfare Fund (SWWF) 6.1 - (303) (303)
Net Gain / loss for the period before taxation (4,830) 15,152 10,322
Taxation 8 - - -
Net loss for the period after taxation (4,830) 15,152 10,322
Allocation of net income for the period:
- Net (loss) / income for the period after taxation - 15,152 15,152
- Income already paid on units redeemed - (5,941) (5,941)
Net loss for the year after taxation - 9,211 9,211
Accounting income for the period available for distribution
-Relating to capital gains - 11,276 11,276
-Excluding capital gains - (2,065) (2,065)
- 9,211 9,211
Earnings per unit 9
The annexed notes 1 to 14 form an integral part of this condensed interim financial information.
For UBL Fund Managers Limited
(Management Company)
----------------------------------------------------------------------(Rupees in '000)----------------------------------------------------------------------
_____________________ Chief Executive Officer
_____________________ Chief Financial Officer
____________________ Director
SD SD SD
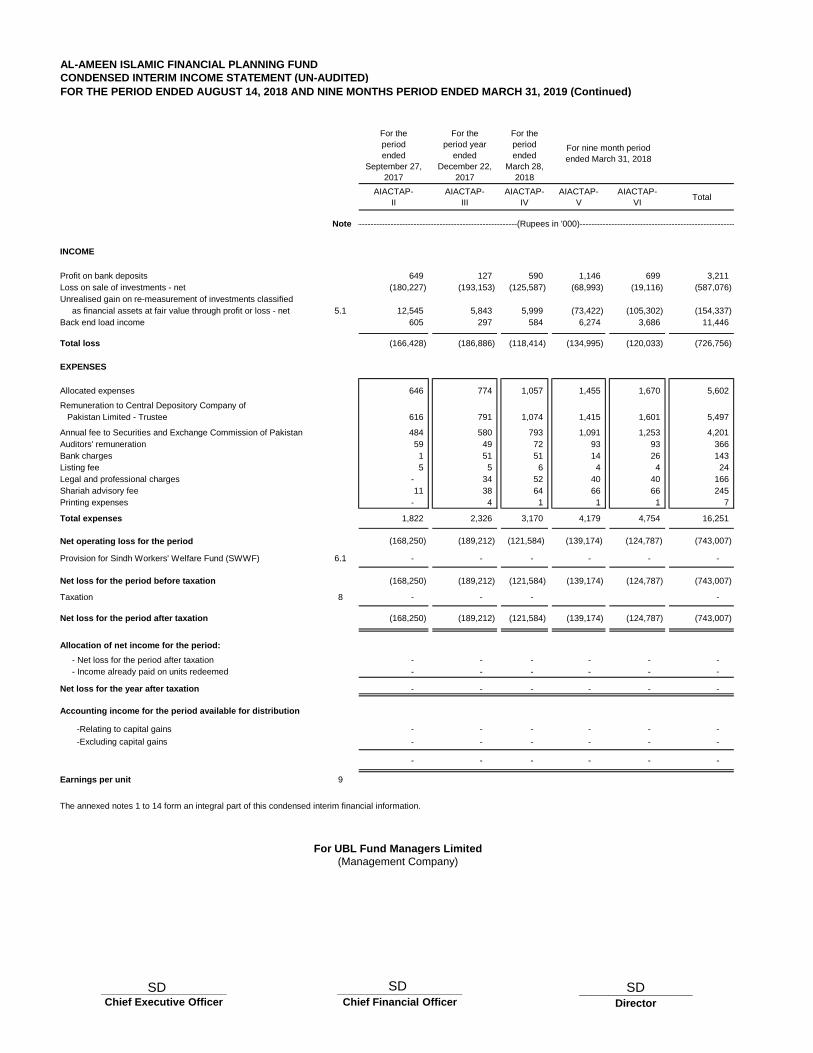
AL-AMEEN ISLAMIC FINANCIAL PLANNING FUND
CONDENSED INTERIM INCOME STATEMENT (UN-AUDITED)
FOR THE PERIOD ENDED AUGUST 14, 2018 AND NINE MONTHS PERIOD ENDED MARCH 31, 2019 (Continued)
For the
period
ended
September 27,
2017
For the
period year
ended
December 22,
2017
For the
period
ended
March 28,
2018
AIACTAP-
II
AIACTAP-
III
AIACTAP-
IV
AIACTAP-
V
AIACTAP-
VITotal
Note
INCOME
Profit on bank deposits 649 127 590 1,146 699 3,211
Loss on sale of investments - net (180,227) (193,153) (125,587) (68,993) (19,116) (587,076)
Unrealised gain on re-measurement of investments classified
as financial assets at fair value through profit or loss - net 5.1 12,545 5,843 5,999 (73,422) (105,302) (154,337)
Back end load income 605 297 584 6,274 3,686 11,446
Total loss (166,428) (186,886) (118,414) (134,995) (120,033) (726,756)
EXPENSES
Allocated expenses 646 774 1,057 1,455 1,670 5,602
Remuneration to Central Depository Company of
Pakistan Limited - Trustee 616 791 1,074 1,415 1,601 5,497
Annual fee to Securities and Exchange Commission of Pakistan 484 580 793 1,091 1,253 4,201
Auditors' remuneration 59 49 72 93 93 366
Bank charges 1 51 51 14 26 143
Listing fee 5 5 6 4 4 24
Legal and professional charges - 34 52 40 40 166
Shariah advisory fee 11 38 64 66 66 245
Printing expenses - 4 1 1 1 7
Total expenses 1,822 2,326 3,170 4,179 4,754 16,251
Net operating loss for the period (168,250) (189,212) (121,584) (139,174) (124,787) (743,007)
Provision for Sindh Workers' Welfare Fund (SWWF) 6.1 - - - - - -
Net loss for the period before taxation (168,250) (189,212) (121,584) (139,174) (124,787) (743,007)
Taxation 8 - - - -
Net loss for the period after taxation (168,250) (189,212) (121,584) (139,174) (124,787) (743,007)
Allocation of net income for the period:
- Net loss for the period after taxation - - - - - -
- Income already paid on units redeemed - - - - - -
Net loss for the year after taxation - - - - - -
Accounting income for the period available for distribution
-Relating to capital gains - - - - - -
-Excluding capital gains - - - - - -
- - - - - -
Earnings per unit 9
The annexed notes 1 to 14 form an integral part of this condensed interim financial information.
For UBL Fund Managers Limited
(Management Company)
----------------------------------------------------------------------(Rupees in '000)----------------------------------------------------------------------
For nine month period
ended March 31, 2018
_____________________ Chief Executive Officer
___________________ Director
_____________________ Chief Financial Officer
SD SDSD
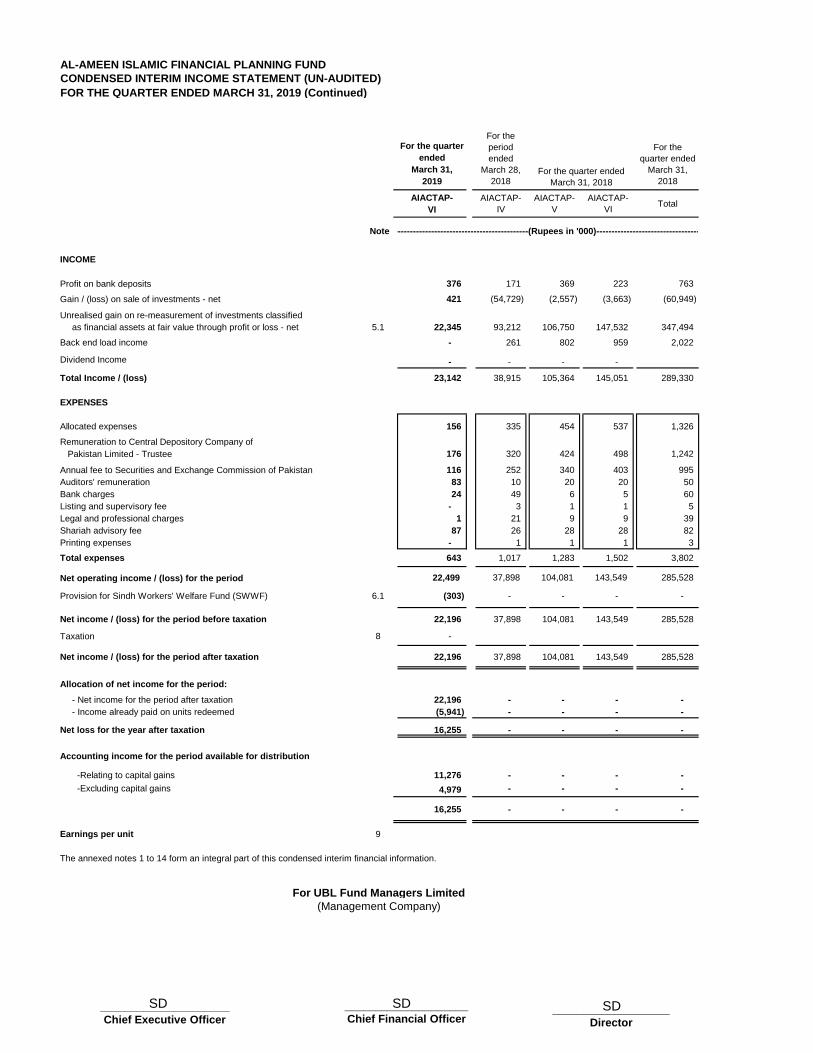
AL-AMEEN ISLAMIC FINANCIAL PLANNING FUND
CONDENSED INTERIM INCOME STATEMENT (UN-AUDITED)
FOR THE QUARTER ENDED MARCH 31, 2019 (Continued)
For the quarter
ended
March 31,
2019
For the
period
ended
March 28,
2018
For the
quarter ended
March 31,
2018
AIACTAP-
VI
AIACTAP-
IV
AIACTAP-
V
AIACTAP-
VITotal
Note
INCOME
Profit on bank deposits 376 171 369 223 763
Gain / (loss) on sale of investments - net 421 (54,729) (2,557) (3,663) (60,949)
Unrealised gain on re-measurement of investments classified
as financial assets at fair value through profit or loss - net 5.1 22,345 93,212 106,750 147,532 347,494
Back end load income - 261 802 959 2,022
Dividend Income - - - -
Total Income / (loss) 23,142 38,915 105,364 145,051 289,330
EXPENSES
Allocated expenses 156 335 454 537 1,326
Remuneration to Central Depository Company of
Pakistan Limited - Trustee 176 320 424 498 1,242
Annual fee to Securities and Exchange Commission of Pakistan 116 252 340 403 995
Auditors' remuneration 83 10 20 20 50
Bank charges 24 49 6 5 60
Listing and supervisory fee - 3 1 1 5
Legal and professional charges 1 21 9 9 39
Shariah advisory fee 87 26 28 28 82
Printing expenses - 1 1 1 3
Total expenses 643 1,017 1,283 1,502 3,802
Net operating income / (loss) for the period 22,499 37,898 104,081 143,549 285,528
Provision for Sindh Workers' Welfare Fund (SWWF) 6.1 (303) - - - -
Net income / (loss) for the period before taxation 22,196 37,898 104,081 143,549 285,528
Taxation 8 -
Net income / (loss) for the period after taxation 22,196 37,898 104,081 143,549 285,528
Allocation of net income for the period:
- Net income for the period after taxation 22,196 - - - -
- Income already paid on units redeemed (5,941) - - - -
Net loss for the year after taxation 16,255 - - - -
Accounting income for the period available for distribution
-Relating to capital gains 11,276 - - - -
-Excluding capital gains 4,979 - - - -
16,255 - - - -
Earnings per unit 9
The annexed notes 1 to 14 form an integral part of this condensed interim financial information.
For UBL Fund Managers Limited
(Management Company)
---------------------------------------------------------------------(Rupees in '000)------------------------------------------------------------
For the quarter ended
March 31, 2018
_____________________ Chief Executive Officer
___________________ Director
____________________ Chief Financial Officer
SD SD SD
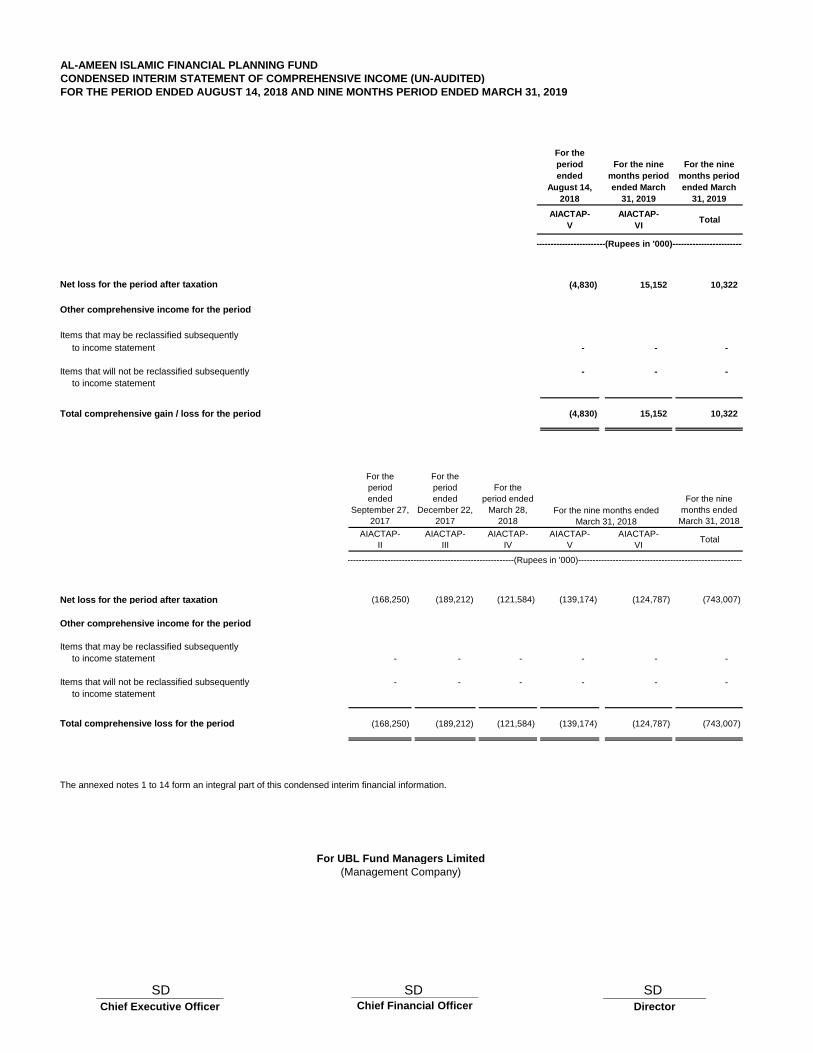
AL-AMEEN ISLAMIC FINANCIAL PLANNING FUND
CONDENSED INTERIM STATEMENT OF COMPREHENSIVE INCOME (UN-AUDITED)
FOR THE PERIOD ENDED AUGUST 14, 2018 AND NINE MONTHS PERIOD ENDED MARCH 31, 2019
For the
period
ended
August 14,
2018
For the nine
months period
ended March
31, 2019
For the nine
months period
ended March
31, 2019
AIACTAP-
V
AIACTAP-
VITotal
Net loss for the period after taxation (4,830) 15,152 10,322
Other comprehensive income for the period
Items that may be reclassified subsequently
to income statement - - -
Items that will not be reclassified subsequently - - -
to income statement
Total comprehensive gain / loss for the period (4,830) 15,152 10,322
For the
period
ended
September 27,
2017
For the
period
ended
December 22,
2017
For the
period ended
March 28,
2018
For the nine
months ended
March 31, 2018
AIACTAP-
II
AIACTAP-
III
AIACTAP-
IV
AIACTAP-
V
AIACTAP-
VITotal
Net loss for the period after taxation (168,250) (189,212) (121,584) (139,174) (124,787) (743,007)
Other comprehensive income for the period
Items that may be reclassified subsequently
to income statement - - - - - -
Items that will not be reclassified subsequently - - - - - -
to income statement
Total comprehensive loss for the period (168,250) (189,212) (121,584) (139,174) (124,787) (743,007)
The annexed notes 1 to 14 form an integral part of this condensed interim financial information.
For UBL Fund Managers Limited
(Management Company)
----------------------------------------------------------------------(Rupees in '000)----------------------------------------------------------------------
------------------------(Rupees in '000)-------------------------
For the nine months ended
March 31, 2018
_____________________ Chief Executive Officer
_________________ Director
_____________________Chief Financial Officer
SDSDSD
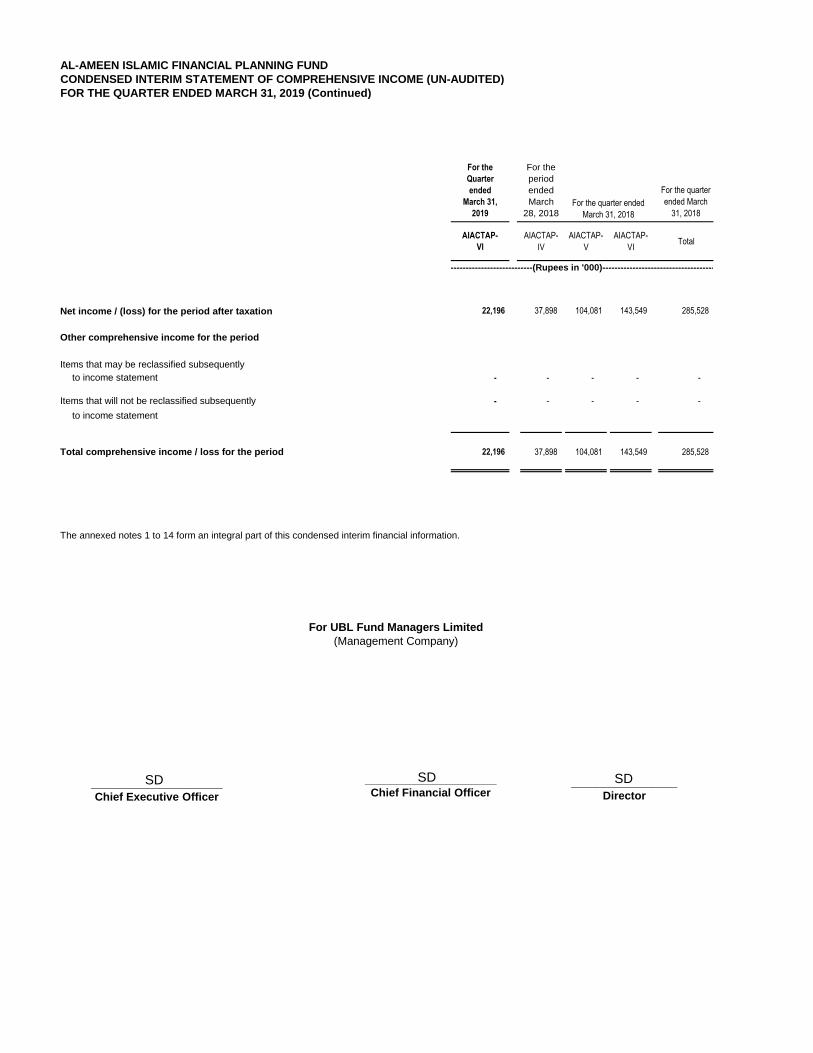
AL-AMEEN ISLAMIC FINANCIAL PLANNING FUND
CONDENSED INTERIM STATEMENT OF COMPREHENSIVE INCOME (UN-AUDITED)
FOR THE QUARTER ENDED MARCH 31, 2019 (Continued)
For the
Quarter
ended
March 31,
2019
For the
period
ended
March
28, 2018
For the quarter
ended March
31, 2018
AIACTAP-
VI
AIACTAP-
IV
AIACTAP-
V
AIACTAP-
VITotal
Net income / (loss) for the period after taxation 22,196 37,898 104,081 143,549 285,528
Other comprehensive income for the period
Items that may be reclassified subsequently
to income statement - - - - -
Items that will not be reclassified subsequently - - - - -
to income statement
Total comprehensive income / loss for the period 22,196 37,898 104,081 143,549 285,528
The annexed notes 1 to 14 form an integral part of this condensed interim financial information.
For UBL Fund Managers Limited
(Management Company)
-------------------------------------------------(Rupees in '000)-----------------------------------------------------------
For the quarter ended
March 31, 2018
_____________________ Chief Executive Officer
_________________ Director
_____________________Chief Financial Officer
SD SD SD
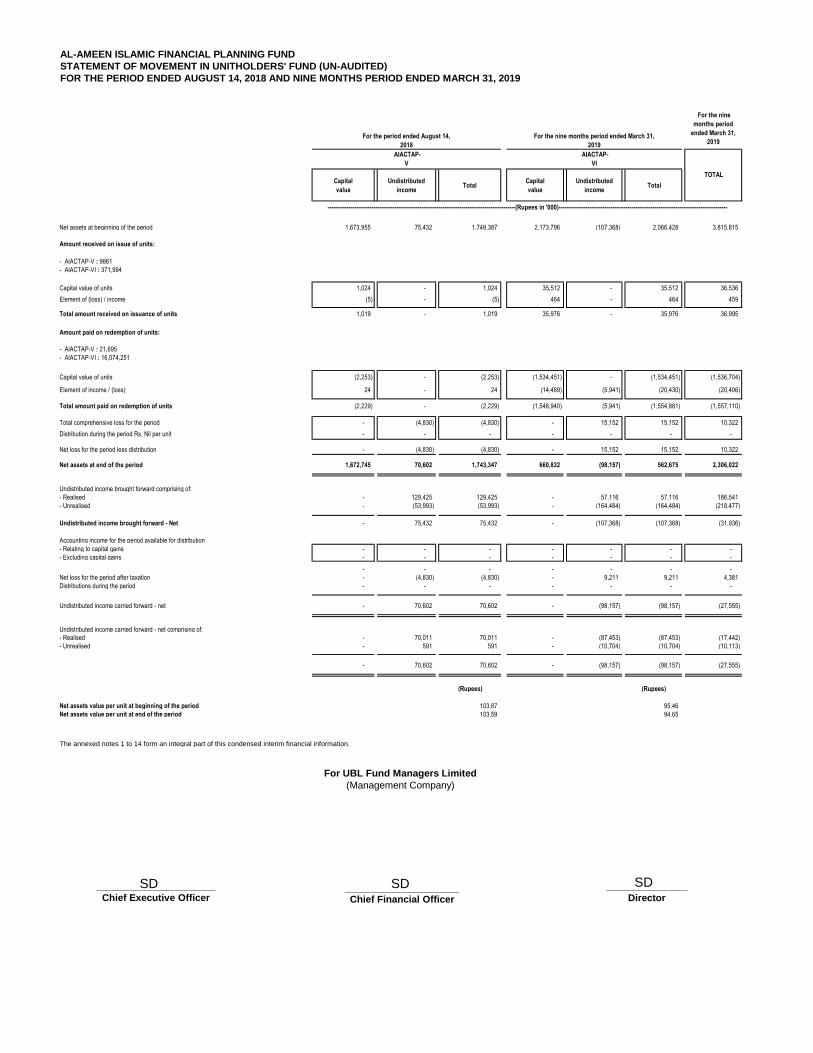
AL-AMEEN ISLAMIC FINANCIAL PLANNING FUND
STATEMENT OF MOVEMENT IN UNITHOLDERS' FUND (UN-AUDITED)
FOR THE PERIOD ENDED AUGUST 14, 2018 AND NINE MONTHS PERIOD ENDED MARCH 31, 2019
For the nine
months period
ended March 31,
2019
Capital
value
Undistributed
incomeTotal
Capital
value
Undistributed
income Total
Net assets at beginning of the period 1,673,955 75,432 1,749,387 2,173,796 (107,368) 2,066,428 3,815,815
Amount received on issue of units:
- AlACTAP-V : 9861
- AlACTAP-VI : 371,994
Capital value of units 1,024 - 1,024 35,512 - 35,512 36,536
Element of (loss) / income (5) - (5) 464 - 464 459
Total amount received on issuance of units 1,019 - 1,019 35,976 - 35,976 36,995
Amount paid on redemption of units:
- AlACTAP-V : 21,695
- AlACTAP-VI : 16,074,251
Capital value of units (2,253) - (2,253) (1,534,451) - (1,534,451) (1,536,704)
Element of income / (loss) 24 - 24 (14,489) (5,941) (20,430) (20,406)
Total amount paid on redemption of units (2,229) - (2,229) (1,548,940) (5,941) (1,554,881) (1,557,110)
Total comprehensive loss for the period - (4,830) (4,830) - 15,152 15,152 10,322
Distribution during the period Rs. Nil per unit - - - - - - -
Net loss for the period less distribution - (4,830) (4,830) - 15,152 15,152 10,322
Net assets at end of the period 1,672,745 70,602 1,743,347 660,832 (98,157) 562,675 2,306,022
Undistributed income brought forward comprising of:
- Realised - 129,425 129,425 - 57,116 57,116 186,541
- Unrealised - (53,993) (53,993) - (164,484) (164,484) (218,477)
Undistributed income brought forward - Net - 75,432 75,432 - (107,368) (107,368) (31,936)
Accounting income for the period available for distribution
- Relating to capital gains - - - - - - -
- Excluding capital gains - - - - - - -
- - - - - - -
Net loss for the period after taxation - (4,830) (4,830) - 9,211 9,211 4,381
Distributions during the period - - - - - - -
Undistributed income carried forward - net - 70,602 70,602 - (98,157) (98,157) (27,555)
Undistributed income carried forward - net comprising of:
- Realised - 70,011 70,011 - (87,453) (87,453) (17,442)
- Unrealised - 591 591 - (10,704) (10,704) (10,113)
- 70,602 70,602 - (98,157) (98,157) (27,555)
(Rupees) (Rupees)
Net assets value per unit at beginning of the period 103.87 95.46
Net assets value per unit at end of the period 103.59 94.65
The annexed notes 1 to 14 form an integral part of this condensed interim financial information.
For UBL Fund Managers Limited
(Management Company)
--------------------------------------------------------------------------------------------------(Rupees in '000)----------------------------------------------------------------------------------------
For the period ended August 14,
2018
For the nine months period ended March 31,
2019
AIACTAP-
V
AIACTAP-
VI
TOTAL
______________________ Chief Executive Officer
_______________ Director
_____________________ Chief Financial Officer
SDSDSD
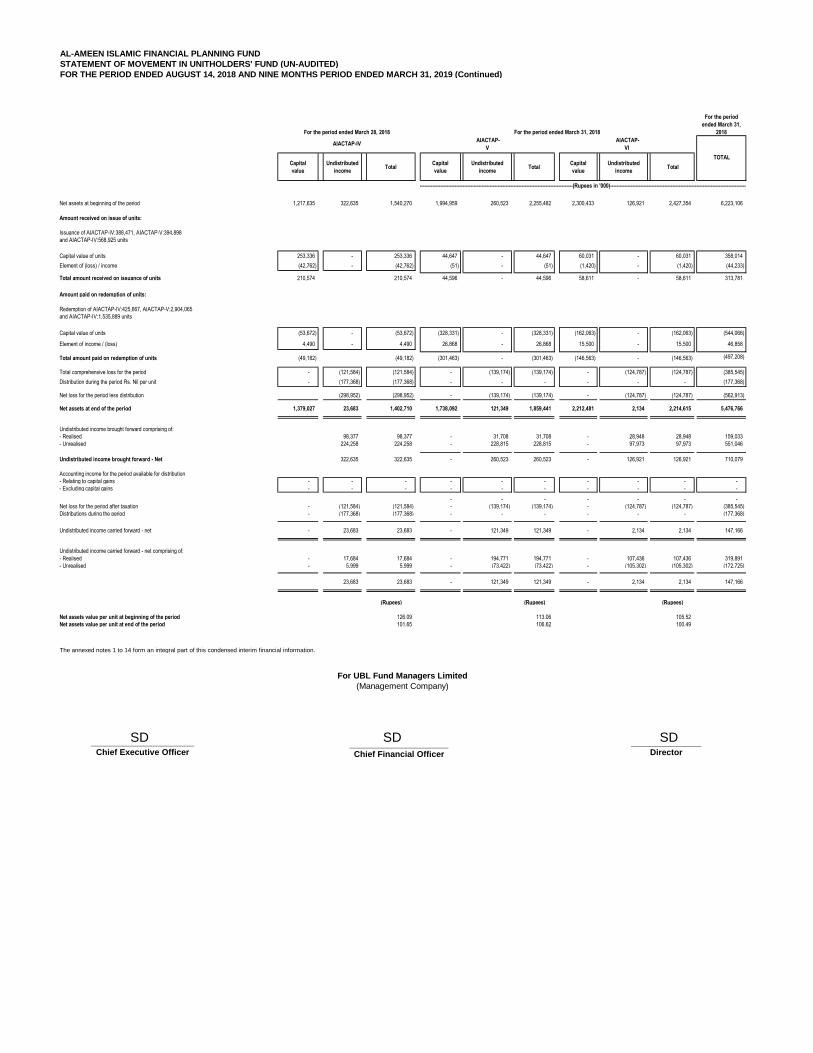
AL-AMEEN ISLAMIC FINANCIAL PLANNING FUND
STATEMENT OF MOVEMENT IN UNITHOLDERS' FUND (UN-AUDITED)
FOR THE PERIOD ENDED AUGUST 14, 2018 AND NINE MONTHS PERIOD ENDED MARCH 31, 2019 (Continued)
For the period
ended March 31,
2018
Capital
value
Undistributed
incomeTotal
Capital
value
Undistributed
incomeTotal
Capital
value
Undistributed
income Total
Net assets at beginning of the period 1,217,635 322,635 1,540,270 1,994,959 260,523 2,255,482 2,300,433 126,921 2,427,354 6,223,106
Amount received on issue of units:
Issuance of AIACTAP-IV:388,471, AIACTAP-V:394,898
and AIACTAP-IV:568,925 units
Capital value of units 253,336 - 253,336 44,647 - 44,647 60,031 - 60,031 358,014
Element of (loss) / income (42,762) - (42,762) (51) - (51) (1,420) - (1,420) (44,233)
Total amount received on issuance of units 210,574 210,574 44,596 - 44,596 58,611 - 58,611 313,781
Amount paid on redemption of units:
Redemption of AIACTAP-IV:425,667, AIACTAP-V:2,904,065
and AIACTAP-IV:1,535,889 units
Capital value of units (53,672) - (53,672) (328,331) - (328,331) (162,063) - (162,063) (544,066)
Element of income / (loss) 4,490 - 4,490 26,868 - 26,868 15,500 - 15,500 46,858
Total amount paid on redemption of units (49,182) (49,182) (301,463) - (301,463) (146,563) - (146,563) (497,208)
Total comprehensive loss for the period - (121,584) (121,584) - (139,174) (139,174) - (124,787) (124,787) (385,545)
Distribution during the period Rs. Nil per unit - (177,368) (177,368) - - - - - - (177,368)
Net loss for the period less distribution (298,952) (298,952) - (139,174) (139,174) - (124,787) (124,787) (562,913)
Net assets at end of the period 1,379,027 23,683 1,402,710 1,738,092 121,349 1,859,441 2,212,481 2,134 2,214,615 5,476,766
Undistributed income brought forward comprising of:
- Realised 98,377 98,377 - 31,708 31,708 - 28,948 28,948 159,033
- Unrealised 224,258 224,258 - 228,815 228,815 - 97,973 97,973 551,046
Undistributed income brought forward - Net 322,635 322,635 - 260,523 260,523 - 126,921 126,921 710,079
Accounting income for the period available for distribution
- Relating to capital gains - - - - - - - - - -
- Excluding capital gains - - - - - - - - - -
- - - - - - -
Net loss for the period after taxation - (121,584) (121,584) - (139,174) (139,174) - (124,787) (124,787) (385,545)
Distributions during the period - (177,368) (177,368) - - - - - - (177,368)
Undistributed income carried forward - net - 23,683 23,683 - 121,349 121,349 - 2,134 2,134 147,166
Undistributed income carried forward - net comprising of:
- Realised - 17,684 17,684 - 194,771 194,771 - 107,436 107,436 319,891
- Unrealised - 5,999 5,999 - (73,422) (73,422) - (105,302) (105,302) (172,725)
23,683 23,683 - 121,349 121,349 - 2,134 2,134 147,166
(Rupees) (Rupees) (Rupees)
Net assets value per unit at beginning of the period 126.09 113.06 105.52
Net assets value per unit at end of the period 101.65 106.62 100.49
The annexed notes 1 to 14 form an integral part of this condensed interim financial information.
TOTAL
--------------------------------------------------------------------------------------------------(Rupees in '000)----------------------------------------------------------------------------------------
For UBL Fund Managers Limited
(Management Company)
For the period ended March 31, 2018
AIACTAP-IV
For the period ended March 28, 2018
AIACTAP-
V
AIACTAP-
VI
______________________ Chief Executive Officer
_______________ Director
_____________________ Chief Financial Officer
SD SD SD
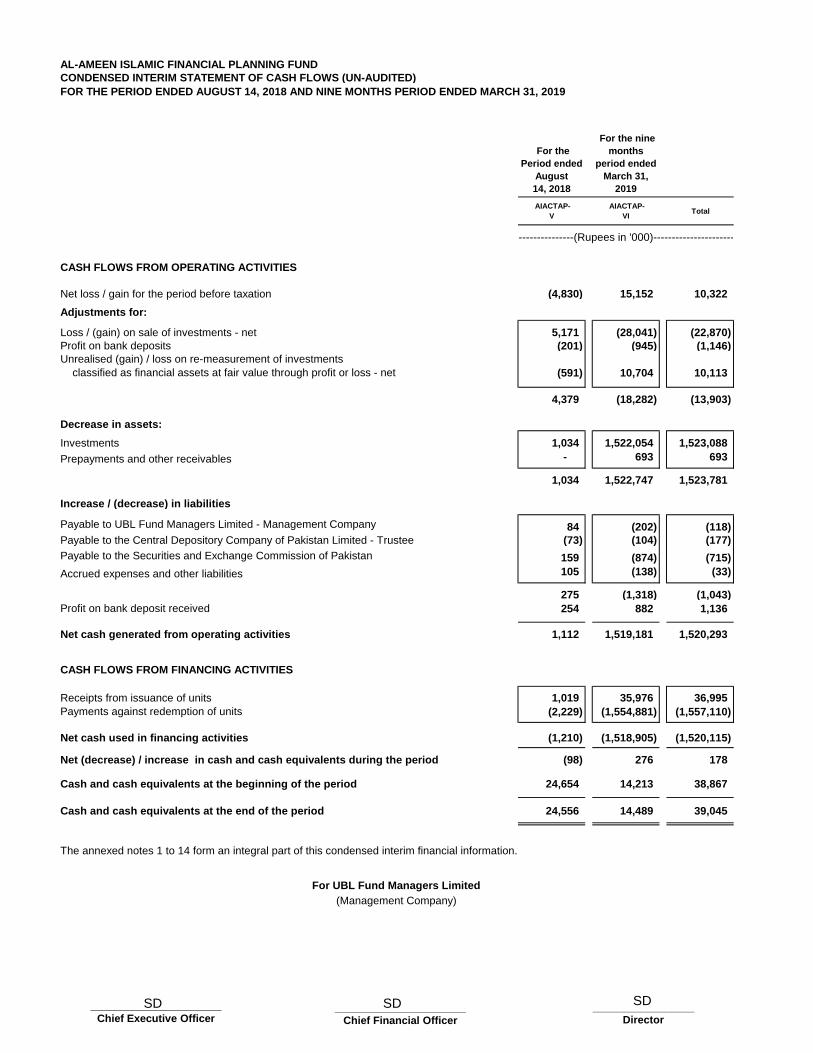
AL-AMEEN ISLAMIC FINANCIAL PLANNING FUND
CONDENSED INTERIM STATEMENT OF CASH FLOWS (UN-AUDITED)
FOR THE PERIOD ENDED AUGUST 14, 2018 AND NINE MONTHS PERIOD ENDED MARCH 31, 2019
For the
Period ended
August
14, 2018
For the nine
months
period ended
March 31,
2019
AIACTAP-
V
AIACTAP-
VI Total
CASH FLOWS FROM OPERATING ACTIVITIES
Net loss / gain for the period before taxation (4,830) 15,152 10,322
Adjustments for:
Loss / (gain) on sale of investments - net 5,171 (28,041) (22,870)
Profit on bank deposits (201) (945) (1,146)
Unrealised (gain) / loss on re-measurement of investments
classified as financial assets at fair value through profit or loss - net (591) 10,704 10,113
4,379 (18,282) (13,903)
Decrease in assets:
Investments 1,034 1,522,054 1,523,088
Prepayments and other receivables - 693 693
1,034 1,522,747 1,523,781
Increase / (decrease) in liabilities
Payable to UBL Fund Managers Limited - Management Company 84 (202) (118)
Payable to the Central Depository Company of Pakistan Limited - Trustee (73) (104) (177)
Payable to the Securities and Exchange Commission of Pakistan 159 (874) (715)
Accrued expenses and other liabilities 105 (138) (33)
275 (1,318) (1,043)
Profit on bank deposit received 254 882 1,136
Net cash generated from operating activities 1,112 1,519,181 1,520,293
CASH FLOWS FROM FINANCING ACTIVITIES
Receipts from issuance of units 1,019 35,976 36,995
Payments against redemption of units (2,229) (1,554,881) (1,557,110)
Net cash used in financing activities (1,210) (1,518,905) (1,520,115)
Net (decrease) / increase in cash and cash equivalents during the period (98) 276 178
Cash and cash equivalents at the beginning of the period 24,654 14,213 38,867
Cash and cash equivalents at the end of the period 24,556 14,489 39,045
The annexed notes 1 to 14 form an integral part of this condensed interim financial information.
For UBL Fund Managers Limited
(Management Company)
-------------------------------------------------------(Rupees in '000)--------------------------------------------------------------
______________________ Chief Executive Officer
_________________ Director
______________________ Chief Financial Officer
SDSDSD
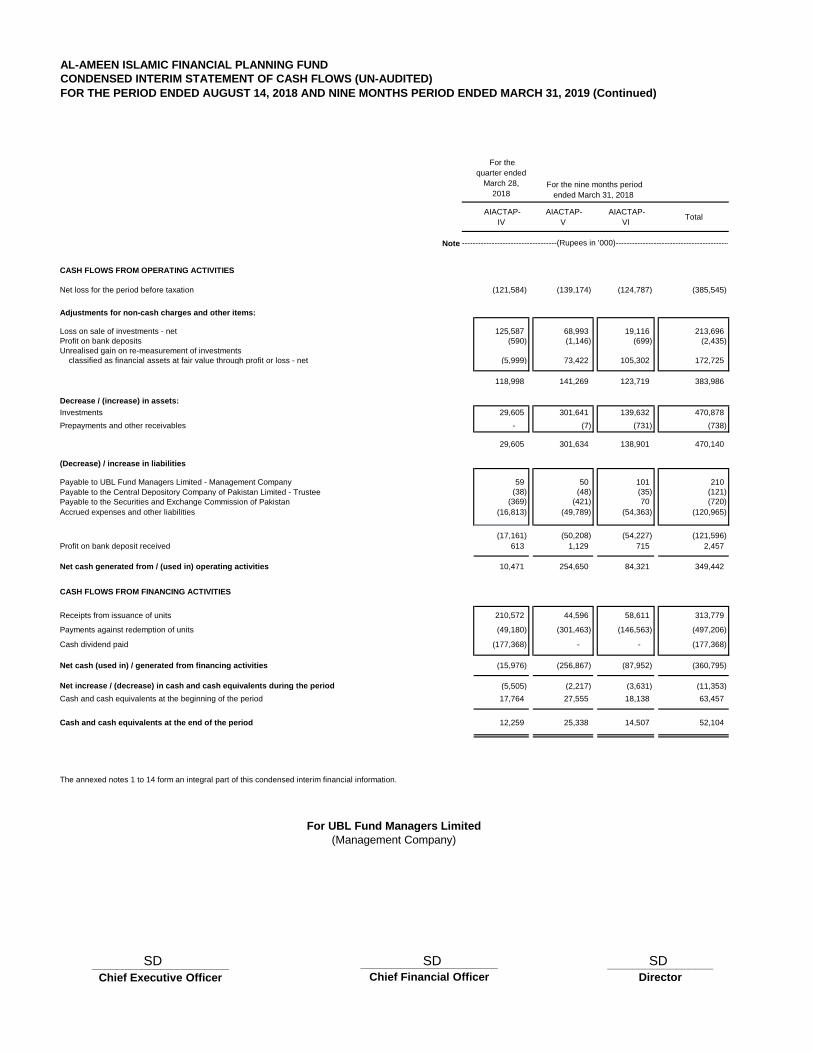
AL-AMEEN ISLAMIC FINANCIAL PLANNING FUND
CONDENSED INTERIM STATEMENT OF CASH FLOWS (UN-AUDITED)
FOR THE PERIOD ENDED AUGUST 14, 2018 AND NINE MONTHS PERIOD ENDED MARCH 31, 2019 (Continued)
For the
quarter ended
March 28,
2018
AIACTAP-
IV
AIACTAP-
V
AIACTAP-
VI Total
Note
CASH FLOWS FROM OPERATING ACTIVITIES
Net loss for the period before taxation (121,584) (139,174) (124,787) (385,545)
Adjustments for non-cash charges and other items:
Loss on sale of investments - net 125,587 68,993 19,116 213,696
Profit on bank deposits (590) (1,146) (699) (2,435)
Unrealised gain on re-measurement of investments
classified as financial assets at fair value through profit or loss - net (5,999) 73,422 105,302 172,725
118,998 141,269 123,719 383,986
Decrease / (increase) in assets:
Investments 29,605 301,641 139,632 470,878
Prepayments and other receivables - (7) (731) (738)
29,605 301,634 138,901 470,140
(Decrease) / increase in liabilities
Payable to UBL Fund Managers Limited - Management Company 59 50 101 210
Payable to the Central Depository Company of Pakistan Limited - Trustee (38) (48) (35) (121)
Payable to the Securities and Exchange Commission of Pakistan (369) (421) 70 (720)
Accrued expenses and other liabilities (16,813) (49,789) (54,363) (120,965)
(17,161) (50,208) (54,227) (121,596)
Profit on bank deposit received 613 1,129 715 2,457
Net cash generated from / (used in) operating activities 10,471 254,650 84,321 349,442
CASH FLOWS FROM FINANCING ACTIVITIES
Receipts from issuance of units 210,572 44,596 58,611 313,779
Payments against redemption of units (49,180) (301,463) (146,563) (497,206)
Cash dividend paid (177,368) - - (177,368)
Net cash (used in) / generated from financing activities (15,976) (256,867) (87,952) (360,795)
Net increase / (decrease) in cash and cash equivalents during the period (5,505) (2,217) (3,631) (11,353)
Cash and cash equivalents at the beginning of the period 17,764 27,555 18,138 63,457
Cash and cash equivalents at the end of the period 12,259 25,338 14,507 52,104
The annexed notes 1 to 14 form an integral part of this condensed interim financial information.
For UBL Fund Managers Limited
(Management Company)
-------------------------------------------------------(Rupees in '000)--------------------------------------------------------------
For the nine months period
ended March 31, 2018
______________________ Chief Executive Officer
_________________ Director
______________________ Chief Financial Officer
SD SD SD
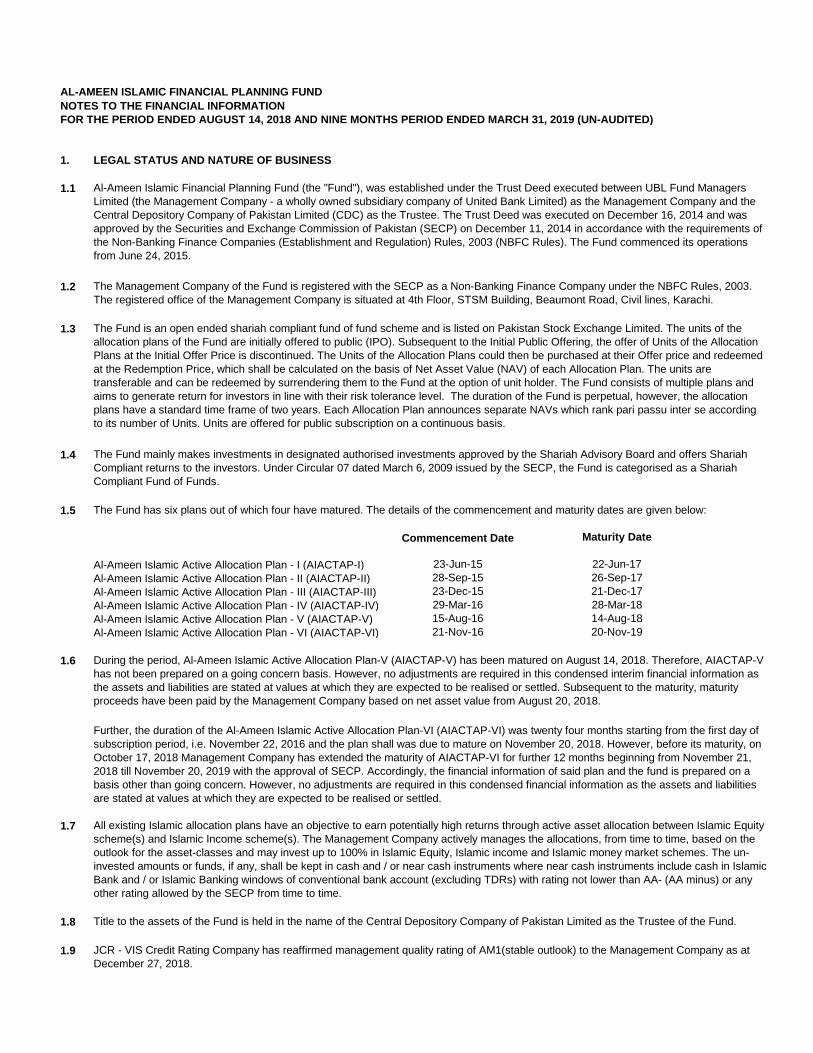
AL-AMEEN ISLAMIC FINANCIAL PLANNING FUND
NOTES TO THE FINANCIAL INFORMATION
FOR THE PERIOD ENDED AUGUST 14, 2018 AND NINE MONTHS PERIOD ENDED MARCH 31, 2019 (UN-AUDITED)
1. LEGAL STATUS AND NATURE OF BUSINESS
1.1
1.2
1.3
1.4
1.5
Al-Ameen Islamic Active Allocation Plan - I (AIACTAP-I)
Al-Ameen Islamic Active Allocation Plan - II (AIACTAP-II)
Al-Ameen Islamic Active Allocation Plan - III (AIACTAP-III)
Al-Ameen Islamic Active Allocation Plan - IV (AIACTAP-IV)
Al-Ameen Islamic Active Allocation Plan - V (AIACTAP-V)
Al-Ameen Islamic Active Allocation Plan - VI (AIACTAP-VI)
1.6
1.7
1.8
1.9
22-Jun-17
26-Sep-17
20-Nov-19
Further, the duration of the Al-Ameen Islamic Active Allocation Plan-VI (AIACTAP-VI) was twenty four months starting from the first day of
subscription period, i.e. November 22, 2016 and the plan shall was due to mature on November 20, 2018. However, before its maturity, on
October 17, 2018 Management Company has extended the maturity of AIACTAP-VI for further 12 months beginning from November 21,
2018 till November 20, 2019 with the approval of SECP. Accordingly, the financial information of said plan and the fund is prepared on a
basis other than going concern. However, no adjustments are required in this condensed financial information as the assets and liabilities
are stated at values at which they are expected to be realised or settled.
All existing Islamic allocation plans have an objective to earn potentially high returns through active asset allocation between Islamic Equity
scheme(s) and Islamic Income scheme(s). The Management Company actively manages the allocations, from time to time, based on the
outlook for the asset-classes and may invest up to 100% in Islamic Equity, Islamic income and Islamic money market schemes. The un-
invested amounts or funds, if any, shall be kept in cash and / or near cash instruments where near cash instruments include cash in Islamic
Bank and / or Islamic Banking windows of conventional bank account (excluding TDRs) with rating not lower than AA- (AA minus) or any
other rating allowed by the SECP from time to time.
Title to the assets of the Fund is held in the name of the Central Depository Company of Pakistan Limited as the Trustee of the Fund.
The Fund has six plans out of which four have matured. The details of the commencement and maturity dates are given below:
28-Mar-18
14-Aug-18
Commencement Date
JCR - VIS Credit Rating Company has reaffirmed management quality rating of AM1(stable outlook) to the Management Company as at
December 27, 2018.
Al-Ameen Islamic Financial Planning Fund (the "Fund"), was established under the Trust Deed executed between UBL Fund Managers
Limited (the Management Company - a wholly owned subsidiary company of United Bank Limited) as the Management Company and the
Central Depository Company of Pakistan Limited (CDC) as the Trustee. The Trust Deed was executed on December 16, 2014 and was
approved by the Securities and Exchange Commission of Pakistan (SECP) on December 11, 2014 in accordance with the requirements of
the Non-Banking Finance Companies (Establishment and Regulation) Rules, 2003 (NBFC Rules). The Fund commenced its operations
from June 24, 2015.
The Management Company of the Fund is registered with the SECP as a Non-Banking Finance Company under the NBFC Rules, 2003.
The registered office of the Management Company is situated at 4th Floor, STSM Building, Beaumont Road, Civil lines, Karachi.
The Fund is an open ended shariah compliant fund of fund scheme and is listed on Pakistan Stock Exchange Limited. The units of the
allocation plans of the Fund are initially offered to public (IPO). Subsequent to the Initial Public Offering, the offer of Units of the Allocation
Plans at the Initial Offer Price is discontinued. The Units of the Allocation Plans could then be purchased at their Offer price and redeemed
at the Redemption Price, which shall be calculated on the basis of Net Asset Value (NAV) of each Allocation Plan. The units are
transferable and can be redeemed by surrendering them to the Fund at the option of unit holder. The Fund consists of multiple plans and
aims to generate return for investors in line with their risk tolerance level. The duration of the Fund is perpetual, however, the allocation
plans have a standard time frame of two years. Each Allocation Plan announces separate NAVs which rank pari passu inter se according
to its number of Units. Units are offered for public subscription on a continuous basis.
The Fund mainly makes investments in designated authorised investments approved by the Shariah Advisory Board and offers Shariah
Compliant returns to the investors. Under Circular 07 dated March 6, 2009 issued by the SECP, the Fund is categorised as a Shariah
Compliant Fund of Funds.
During the period, Al-Ameen Islamic Active Allocation Plan-V (AIACTAP-V) has been matured on August 14, 2018. Therefore, AIACTAP-V
has not been prepared on a going concern basis. However, no adjustments are required in this condensed interim financial information as
the assets and liabilities are stated at values at which they are expected to be realised or settled. Subsequent to the maturity, maturity
proceeds have been paid by the Management Company based on net asset value from August 20, 2018.
Maturity Date
29-Mar-16
15-Aug-16
21-Nov-16
23-Dec-15
28-Sep-15
23-Jun-15
21-Dec-17
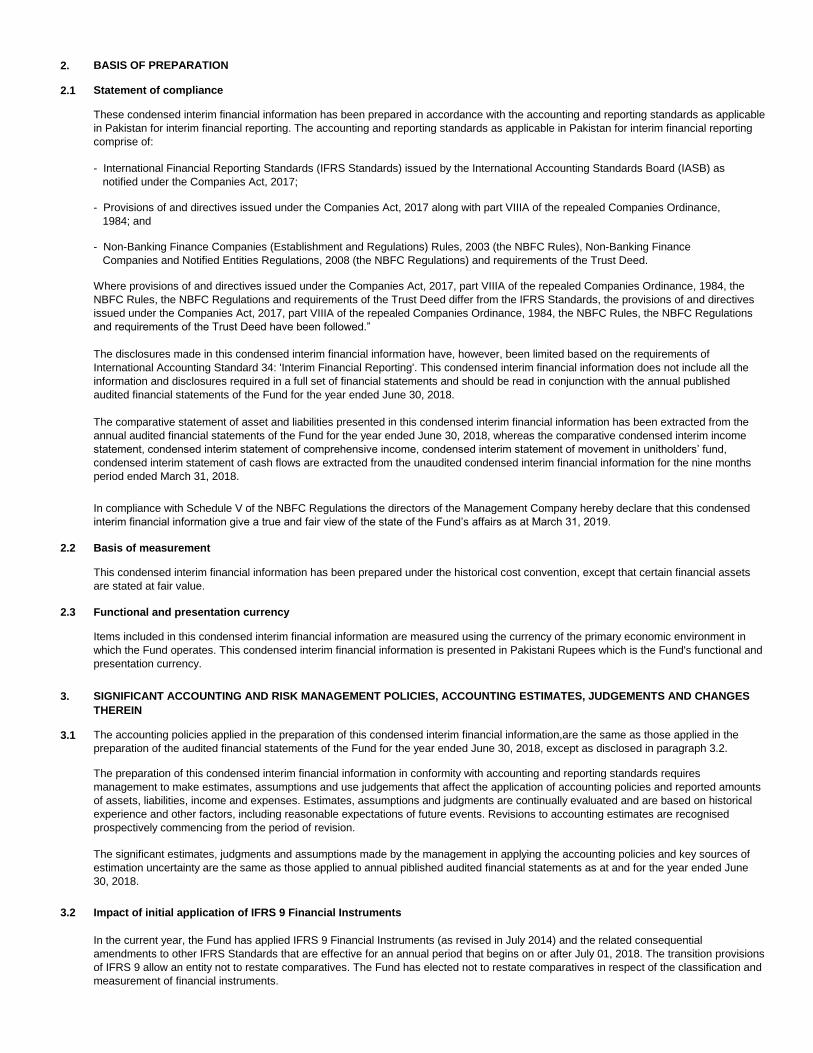
2. BASIS OF PREPARATION
2.1 Statement of compliance
2.2 Basis of measurement
2.3 Functional and presentation currency
3.
3.1
3.2 Impact of initial application of IFRS 9 Financial Instruments
Where provisions of and directives issued under the Companies Act, 2017, part VIIIA of the repealed Companies Ordinance, 1984, the
NBFC Rules, the NBFC Regulations and requirements of the Trust Deed differ from the IFRS Standards, the provisions of and directives
issued under the Companies Act, 2017, part VIIIA of the repealed Companies Ordinance, 1984, the NBFC Rules, the NBFC Regulations
and requirements of the Trust Deed have been followed.”
In the current year, the Fund has applied IFRS 9 Financial Instruments (as revised in July 2014) and the related consequential
amendments to other IFRS Standards that are effective for an annual period that begins on or after July 01, 2018. The transition provisions
of IFRS 9 allow an entity not to restate comparatives. The Fund has elected not to restate comparatives in respect of the classification and
measurement of financial instruments.
The accounting policies applied in the preparation of this condensed interim financial information,are the same as those applied in the
preparation of the audited financial statements of the Fund for the year ended June 30, 2018, except as disclosed in paragraph 3.2.
SIGNIFICANT ACCOUNTING AND RISK MANAGEMENT POLICIES, ACCOUNTING ESTIMATES, JUDGEMENTS AND CHANGES
THEREIN
In compliance with Schedule V of the NBFC Regulations the directors of the Management Company hereby declare that this condensed
interim financial information give a true and fair view of the state of the Fund’s affairs as at March 31, 2019.
These condensed interim financial information has been prepared in accordance with the accounting and reporting standards as applicable
in Pakistan for interim financial reporting. The accounting and reporting standards as applicable in Pakistan for interim financial reporting
comprise of:
- International Financial Reporting Standards (IFRS Standards) issued by the International Accounting Standards Board (IASB) as
notified under the Companies Act, 2017;
- Non-Banking Finance Companies (Establishment and Regulations) Rules, 2003 (the NBFC Rules), Non-Banking Finance
Companies and Notified Entities Regulations, 2008 (the NBFC Regulations) and requirements of the Trust Deed.
The disclosures made in this condensed interim financial information have, however, been limited based on the requirements of
International Accounting Standard 34: 'Interim Financial Reporting'. This condensed interim financial information does not include all the
information and disclosures required in a full set of financial statements and should be read in conjunction with the annual published
audited financial statements of the Fund for the year ended June 30, 2018.
The significant estimates, judgments and assumptions made by the management in applying the accounting policies and key sources of
estimation uncertainty are the same as those applied to annual piblished audited financial statements as at and for the year ended June
30, 2018.
- Provisions of and directives issued under the Companies Act, 2017 along with part VIIIA of the repealed Companies Ordinance,
1984; and
The comparative statement of asset and liabilities presented in this condensed interim financial information has been extracted from the
annual audited financial statements of the Fund for the year ended June 30, 2018, whereas the comparative condensed interim income
statement, condensed interim statement of comprehensive income, condensed interim statement of movement in unitholders’ fund,
condensed interim statement of cash flows are extracted from the unaudited condensed interim financial information for the nine months
period ended March 31, 2018.
Items included in this condensed interim financial information are measured using the currency of the primary economic environment in
which the Fund operates. This condensed interim financial information is presented in Pakistani Rupees which is the Fund's functional and
presentation currency.
This condensed interim financial information has been prepared under the historical cost convention, except that certain financial assets
are stated at fair value.
The preparation of this condensed interim financial information in conformity with accounting and reporting standards requires
management to make estimates, assumptions and use judgements that affect the application of accounting policies and reported amounts
of assets, liabilities, income and expenses. Estimates, assumptions and judgments are continually evaluated and are based on historical
experience and other factors, including reasonable expectations of future events. Revisions to accounting estimates are recognised
prospectively commencing from the period of revision.
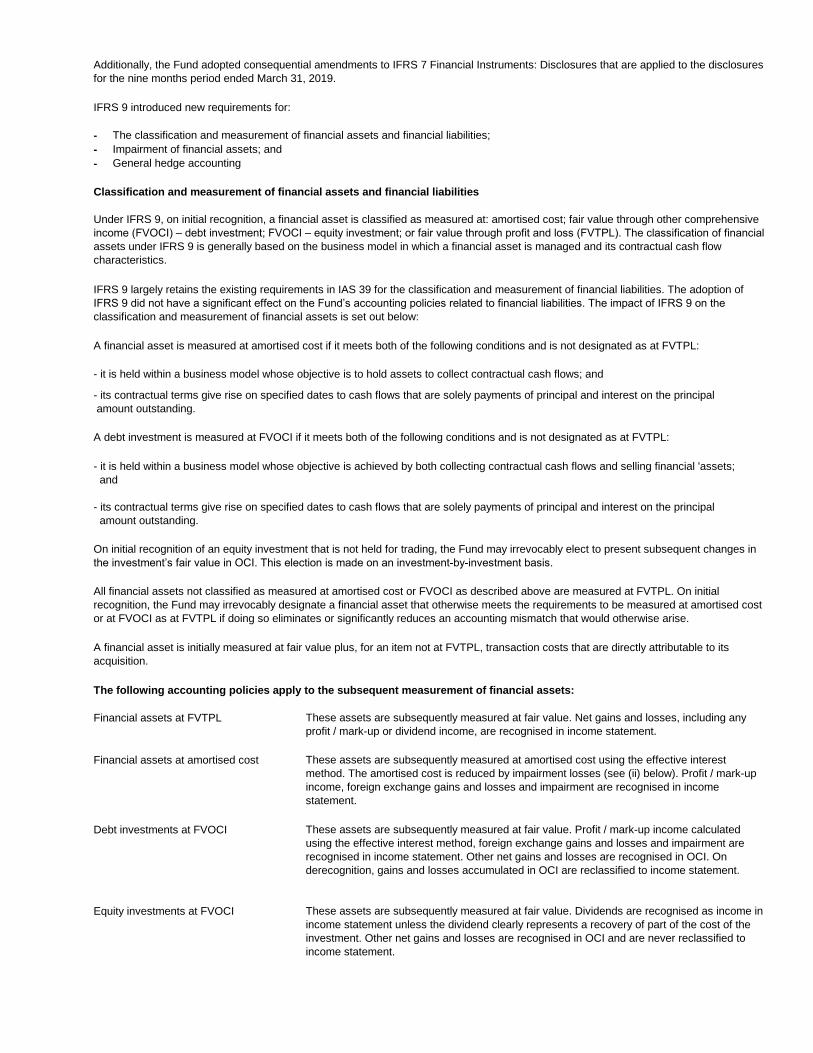
IFRS 9 introduced new requirements for:
- The classification and measurement of financial assets and financial liabilities;
- Impairment of financial assets; and
- General hedge accounting
Financial assets at FVTPL
Financial assets at amortised cost
Debt investments at FVOCI
Equity investments at FVOCI
Additionally, the Fund adopted consequential amendments to IFRS 7 Financial Instruments: Disclosures that are applied to the disclosures
for the nine months period ended March 31, 2019.
All financial assets not classified as measured at amortised cost or FVOCI as described above are measured at FVTPL. On initial
recognition, the Fund may irrevocably designate a financial asset that otherwise meets the requirements to be measured at amortised cost
or at FVOCI as at FVTPL if doing so eliminates or significantly reduces an accounting mismatch that would otherwise arise.
IFRS 9 largely retains the existing requirements in IAS 39 for the classification and measurement of financial liabilities. The adoption of
IFRS 9 did not have a significant effect on the Fund’s accounting policies related to financial liabilities. The impact of IFRS 9 on the
classification and measurement of financial assets is set out below:
The following accounting policies apply to the subsequent measurement of financial assets:
- its contractual terms give rise on specified dates to cash flows that are solely payments of principal and interest on the principal
amount outstanding.
These assets are subsequently measured at amortised cost using the effective interest
method. The amortised cost is reduced by impairment losses (see (ii) below). Profit / mark-up
income, foreign exchange gains and losses and impairment are recognised in income
statement.
These assets are subsequently measured at fair value. Profit / mark-up income calculated
using the effective interest method, foreign exchange gains and losses and impairment are
recognised in income statement. Other net gains and losses are recognised in OCI. On
derecognition, gains and losses accumulated in OCI are reclassified to income statement.
These assets are subsequently measured at fair value. Dividends are recognised as income in
income statement unless the dividend clearly represents a recovery of part of the cost of the
investment. Other net gains and losses are recognised in OCI and are never reclassified to
income statement.
Under IFRS 9, on initial recognition, a financial asset is classified as measured at: amortised cost; fair value through other comprehensive
income (FVOCI) – debt investment; FVOCI – equity investment; or fair value through profit and loss (FVTPL). The classification of financial
assets under IFRS 9 is generally based on the business model in which a financial asset is managed and its contractual cash flow
characteristics.
Classification and measurement of financial assets and financial liabilities
These assets are subsequently measured at fair value. Net gains and losses, including any
profit / mark-up or dividend income, are recognised in income statement.
- its contractual terms give rise on specified dates to cash flows that are solely payments of principal and interest on the principal
amount outstanding.
A financial asset is initially measured at fair value plus, for an item not at FVTPL, transaction costs that are directly attributable to its
acquisition.
A financial asset is measured at amortised cost if it meets both of the following conditions and is not designated as at FVTPL:
- it is held within a business model whose objective is to hold assets to collect contractual cash flows; and
A debt investment is measured at FVOCI if it meets both of the following conditions and is not designated as at FVTPL:
- it is held within a business model whose objective is achieved by both collecting contractual cash flows and selling financial 'assets;
and
On initial recognition of an equity investment that is not held for trading, the Fund may irrevocably elect to present subsequent changes in
the investment’s fair value in OCI. This election is made on an investment-by-investment basis.
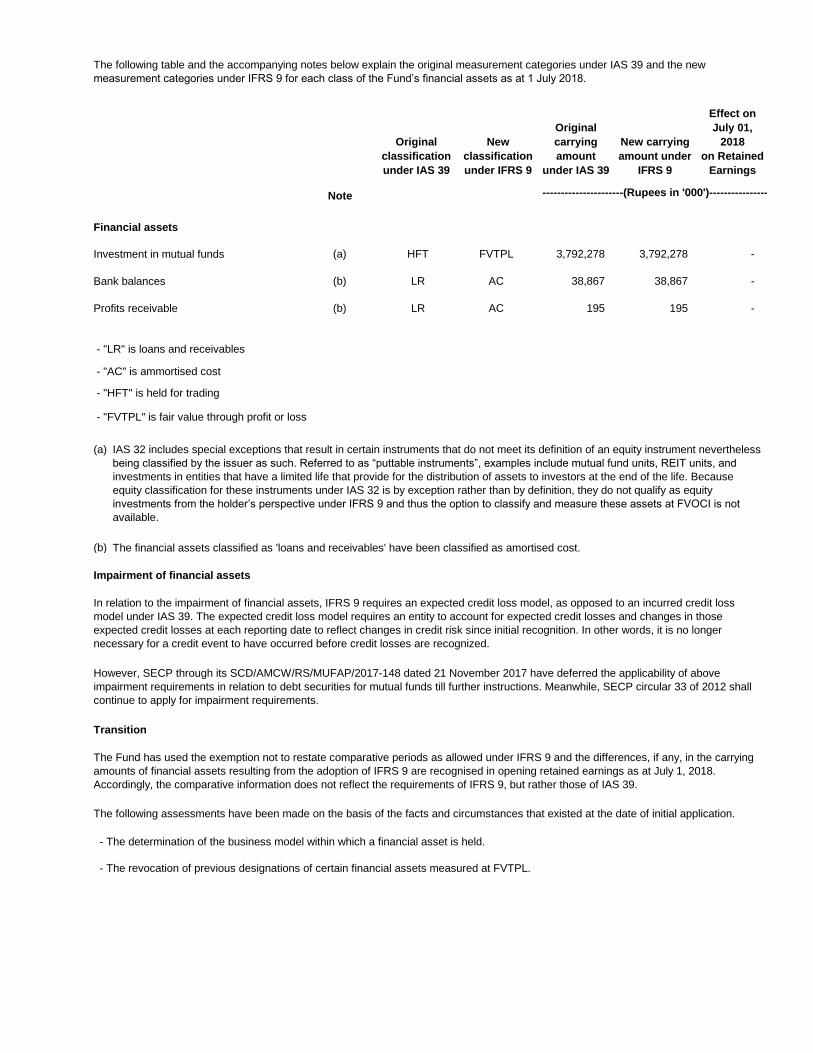
Note
Financial assets
Investment in mutual funds (a) FVTPL 3,792,278 3,792,278 -
Bank balances (b) AC 38,867 38,867 -
Profits receivable (b) AC 195 195 -
- "LR" is loans and receivables
- "AC" is ammortised cost
- "HFT" is held for trading
- "FVTPL" is fair value through profit or loss
(a)
(b)
Impairment of financial assets
Transition
LR
LR
The following table and the accompanying notes below explain the original measurement categories under IAS 39 and the new
measurement categories under IFRS 9 for each class of the Fund’s financial assets as at 1 July 2018.
Original
classification
under IAS 39
Original
carrying
amount
under IAS 39
New carrying
amount under
IFRS 9
Effect on
July 01,
2018
on Retained
Earnings
However, SECP through its SCD/AMCW/RS/MUFAP/2017-148 dated 21 November 2017 have deferred the applicability of above
impairment requirements in relation to debt securities for mutual funds till further instructions. Meanwhile, SECP circular 33 of 2012 shall
continue to apply for impairment requirements.
New
classification
under IFRS 9
----------------------(Rupees in '000')----------------
--------------
In relation to the impairment of financial assets, IFRS 9 requires an expected credit loss model, as opposed to an incurred credit loss
model under IAS 39. The expected credit loss model requires an entity to account for expected credit losses and changes in those
expected credit losses at each reporting date to reflect changes in credit risk since initial recognition. In other words, it is no longer
necessary for a credit event to have occurred before credit losses are recognized.
The Fund has used the exemption not to restate comparative periods as allowed under IFRS 9 and the differences, if any, in the carrying
amounts of financial assets resulting from the adoption of IFRS 9 are recognised in opening retained earnings as at July 1, 2018.
Accordingly, the comparative information does not reflect the requirements of IFRS 9, but rather those of IAS 39.
The following assessments have been made on the basis of the facts and circumstances that existed at the date of initial application.
- The determination of the business model within which a financial asset is held.
- The revocation of previous designations of certain financial assets measured at FVTPL.
The financial assets classified as 'loans and receivables' have been classified as amortised cost.
HFT
IAS 32 includes special exceptions that result in certain instruments that do not meet its definition of an equity instrument nevertheless
being classified by the issuer as such. Referred to as “puttable instruments”, examples include mutual fund units, REIT units, and
investments in entities that have a limited life that provide for the distribution of assets to investors at the end of the life. Because
equity classification for these instruments under IAS 32 is by exception rather than by definition, they do not qualify as equity
investments from the holder’s perspective under IFRS 9 and thus the option to classify and measure these assets at FVOCI is not
available.
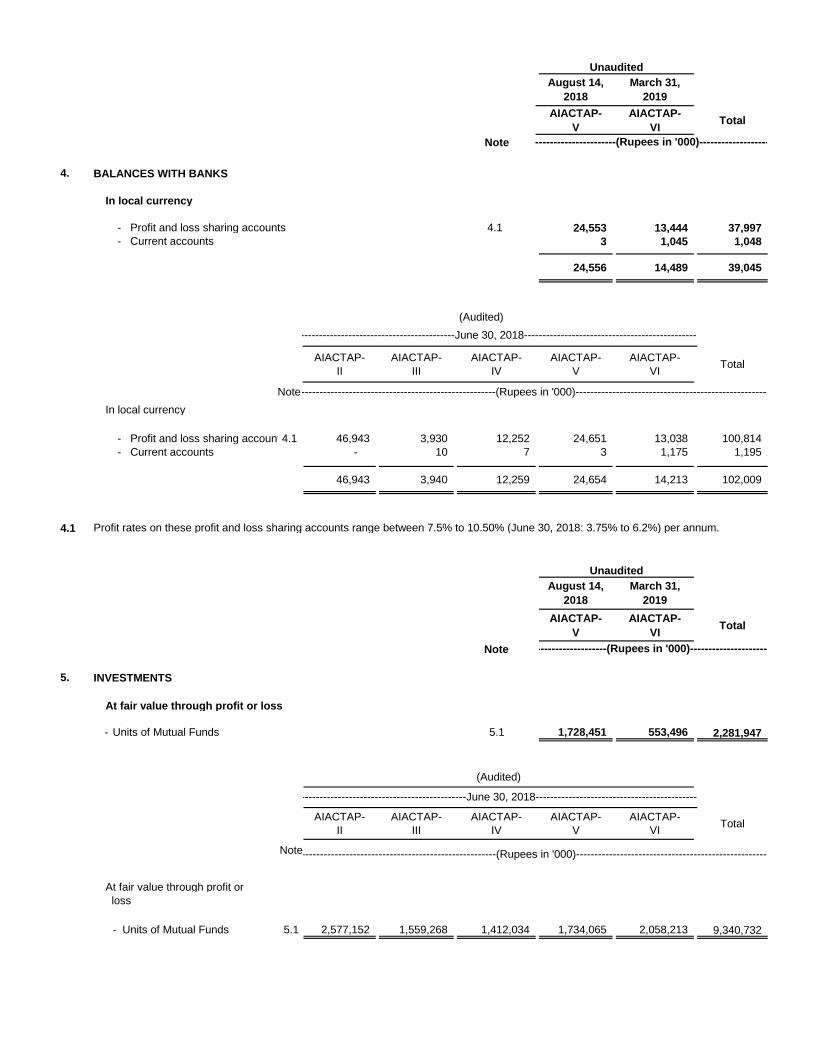
AIACTAP-
V
AIACTAP-
VITotal
Note
4. BALANCES WITH BANKS
In local currency
- Profit and loss sharing accounts 4.1 24,553 13,444 37,997
- Current accounts 3 1,045 1,048
24,556 14,489 39,045
(Audited)
AIACTAP-
II
AIACTAP-
III
AIACTAP-
IV
AIACTAP-
V
AIACTAP-
VITotal
In local currency
- Profit and loss sharing accounts4.1 46,943 3,930 12,252 24,651 13,038 100,814
- Current accounts - 10 7 3 1,175 1,195
46,943 3,940 12,259 24,654 14,213 102,009
4.1 Profit rates on these profit and loss sharing accounts range between 7.5% to 10.50% (June 30, 2018: 3.75% to 6.2%) per annum.
AIACTAP-
V
AIACTAP-
VITotal
Note
5. INVESTMENTS
At fair value through profit or loss
- Units of Mutual Funds 5.1 1,728,451 553,496 2,281,947
AIACTAP-
II
AIACTAP-
III
AIACTAP-
IV
AIACTAP-
V
AIACTAP-
VITotal
Note
At fair value through profit or
loss
- Units of Mutual Funds 5.1 2,577,152 1,559,268 1,412,034 1,734,065 2,058,213 9,340,732
----------------------------(Rupees in '000)-------------------------
Note
---------------------------------------------------June 30, 2018---------------------------------------------------------
March 31,
2019
--------------------------------------------------June 30, 2018--------------------------------------------------
(Audited)
Unaudited
August 14,
2018
----------------------------------------------------------------------(Rupees in '000)----------------------------------------------------------------------
----------------------------------------------------------------------(Rupees in '000)----------------------------------------------------------------------
----------------------------------------------------------------------(Rupees in '000)-------------------------------------------------------------------------
August 14,
2018
Unaudited
March 31,
2019
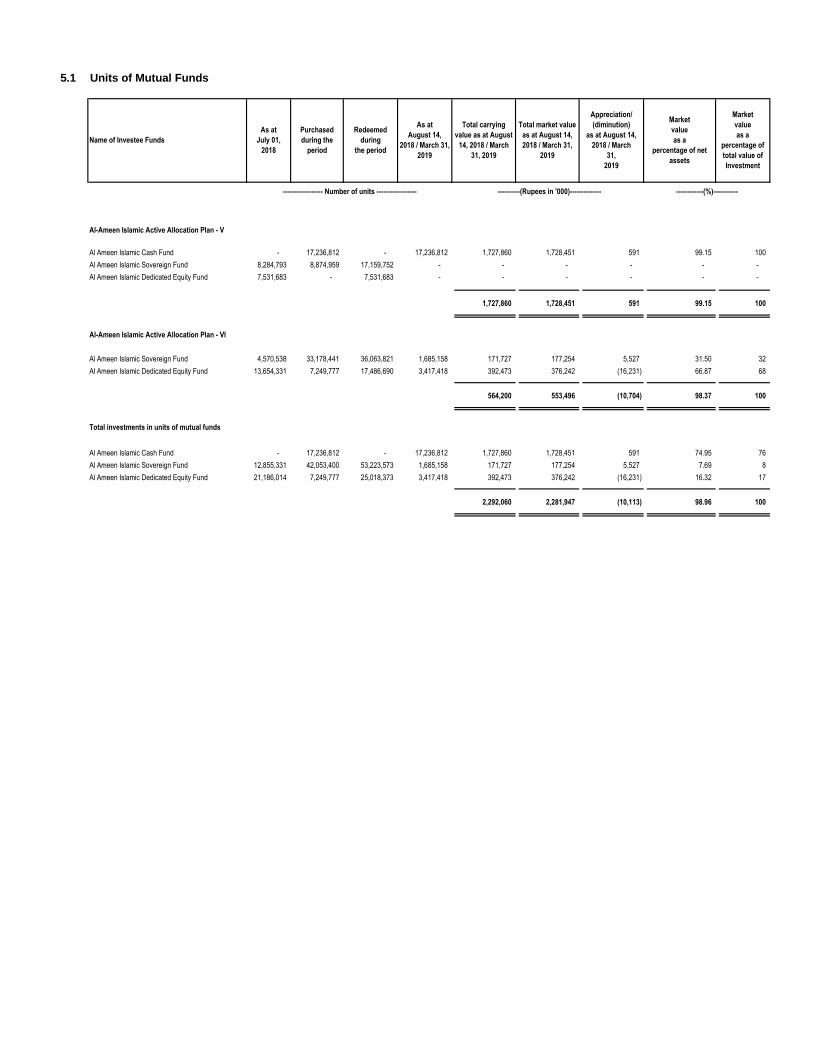
5.1 Units of Mutual Funds
Al-Ameen Islamic Active Allocation Plan - V
Al Ameen Islamic Cash Fund - 17,236,812 - 17,236,812 1,727,860 1,728,451 591 99.15 100
Al Ameen Islamic Sovereign Fund 8,284,793 8,874,959 17,159,752 - - - - - -
Al Ameen Islamic Dedicated Equity Fund 7,531,683 - 7,531,683 - - - - - -
1,727,860 1,728,451 591 99.15 100
Al-Ameen Islamic Active Allocation Plan - VI
Al Ameen Islamic Sovereign Fund 4,570,538 33,178,441 36,063,821 1,685,158 171,727 177,254 5,527 31.50 32
Al Ameen Islamic Dedicated Equity Fund 13,654,331 7,249,777 17,486,690 3,417,418 392,473 376,242 (16,231) 66.87 68
564,200 553,496 (10,704) 98.37 100
Total investments in units of mutual funds
Al Ameen Islamic Cash Fund - 17,236,812 - 17,236,812 1,727,860 1,728,451 591 74.95 76
Al Ameen Islamic Sovereign Fund 12,855,331 42,053,400 53,223,573 1,685,158 171,727 177,254 5,527 7.69 8
Al Ameen Islamic Dedicated Equity Fund 21,186,014 7,249,777 25,018,373 3,417,418 392,473 376,242 (16,231) 16.32 17
2,292,060 2,281,947 (10,113) 98.96 100
------------(%)-----------
Name of Investee Funds
Market
value
as a
percentage of net
assets
Market
value
as a
percentage of
total value of
Investment
----------(Rupees in '000)--------------
As at
August 14,
2018 / March 31,
2019
------------------ Number of units ------------------
Total market value
as at August 14,
2018 / March 31,
2019
Appreciation/
(diminution)
as at August 14,
2018 / March
31,
2019
Purchased
during the
period
Redeemed
during
the period
As at
July 01,
2018
Total carrying
value as at August
14, 2018 / March
31, 2019
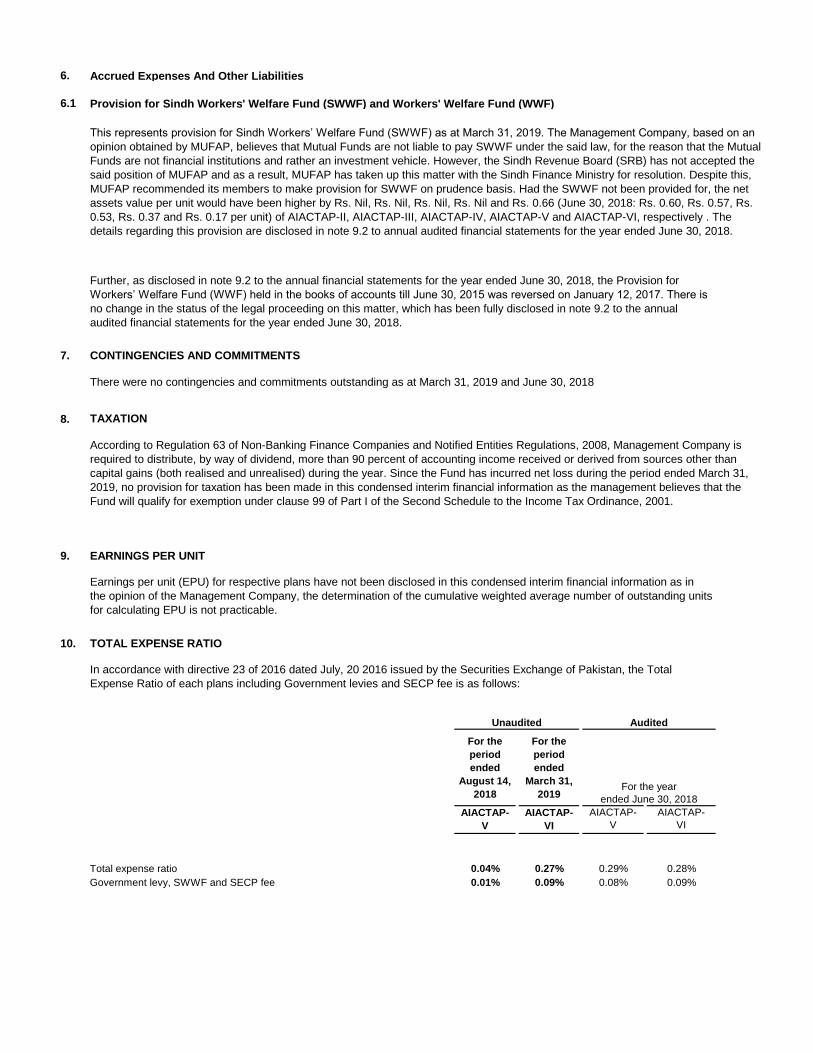
6. Accrued Expenses And Other Liabilities
6.1 Provision for Sindh Workers' Welfare Fund (SWWF) and Workers' Welfare Fund (WWF)
7. CONTINGENCIES AND COMMITMENTS
8. TAXATION
9. EARNINGS PER UNIT
10. TOTAL EXPENSE RATIO
For the
period
ended
August 14,
2018
For the
period
ended
March 31,
2019
Total expense ratio 0.04% 0.27% 0.29% 0.28%
Government levy, SWWF and SECP fee 0.01% 0.09% 0.08% 0.09%
Unaudited Audited
For the year
ended June 30, 2018
AIACTAP-
V
AIACTAP-
VI
AIACTAP-
V
AIACTAP-
VI
Earnings per unit (EPU) for respective plans have not been disclosed in this condensed interim financial information as in
the opinion of the Management Company, the determination of the cumulative weighted average number of outstanding units
for calculating EPU is not practicable.
In accordance with directive 23 of 2016 dated July, 20 2016 issued by the Securities Exchange of Pakistan, the Total
Expense Ratio of each plans including Government levies and SECP fee is as follows:
Further, as disclosed in note 9.2 to the annual financial statements for the year ended June 30, 2018, the Provision for
Workers’ Welfare Fund (WWF) held in the books of accounts till June 30, 2015 was reversed on January 12, 2017. There is
no change in the status of the legal proceeding on this matter, which has been fully disclosed in note 9.2 to the annual
audited financial statements for the year ended June 30, 2018.
There were no contingencies and commitments outstanding as at March 31, 2019 and June 30, 2018
According to Regulation 63 of Non-Banking Finance Companies and Notified Entities Regulations, 2008, Management Company is
required to distribute, by way of dividend, more than 90 percent of accounting income received or derived from sources other than
capital gains (both realised and unrealised) during the year. Since the Fund has incurred net loss during the period ended March 31,
2019, no provision for taxation has been made in this condensed interim financial information as the management believes that the
Fund will qualify for exemption under clause 99 of Part I of the Second Schedule to the Income Tax Ordinance, 2001.
This represents provision for Sindh Workers’ Welfare Fund (SWWF) as at March 31, 2019. The Management Company, based on an
opinion obtained by MUFAP, believes that Mutual Funds are not liable to pay SWWF under the said law, for the reason that the Mutual
Funds are not financial institutions and rather an investment vehicle. However, the Sindh Revenue Board (SRB) has not accepted the
said position of MUFAP and as a result, MUFAP has taken up this matter with the Sindh Finance Ministry for resolution. Despite this,
MUFAP recommended its members to make provision for SWWF on prudence basis. Had the SWWF not been provided for, the net
assets value per unit would have been higher by Rs. Nil, Rs. Nil, Rs. Nil, Rs. Nil and Rs. 0.66 (June 30, 2018: Rs. 0.60, Rs. 0.57, Rs.
0.53, Rs. 0.37 and Rs. 0.17 per unit) of AIACTAP-II, AIACTAP-III, AIACTAP-IV, AIACTAP-V and AIACTAP-VI, respectively . The
details regarding this provision are disclosed in note 9.2 to annual audited financial statements for the year ended June 30, 2018.
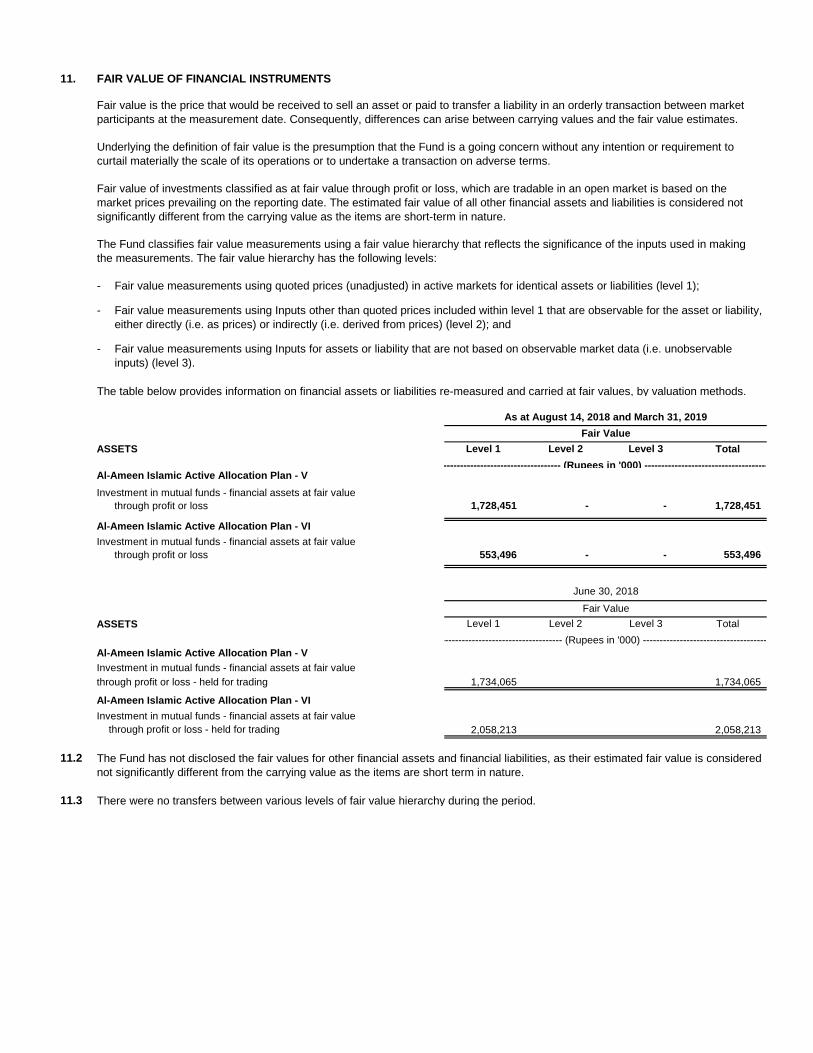
11. FAIR VALUE OF FINANCIAL INSTRUMENTS
-
-
-
ASSETS Level 1 Level 2 Level 3 Total
Al-Ameen Islamic Active Allocation Plan - V
Investment in mutual funds - financial assets at fair value
through profit or loss 1,728,451 - - 1,728,451
Al-Ameen Islamic Active Allocation Plan - VI
Investment in mutual funds - financial assets at fair value
through profit or loss 553,496 - - 553,496
ASSETS Level 1 Level 2 Level 3 Total
Al-Ameen Islamic Active Allocation Plan - V
Investment in mutual funds - financial assets at fair value
through profit or loss - held for trading 1,734,065 1,734,065
Al-Ameen Islamic Active Allocation Plan - VI
Investment in mutual funds - financial assets at fair value
through profit or loss - held for trading 2,058,213 2,058,213
11.2
11.3 There were no transfers between various levels of fair value hierarchy during the period.
June 30, 2018
The Fund classifies fair value measurements using a fair value hierarchy that reflects the significance of the inputs used in making
the measurements. The fair value hierarchy has the following levels:
Fair value measurements using quoted prices (unadjusted) in active markets for identical assets or liabilities (level 1);
Fair value measurements using Inputs other than quoted prices included within level 1 that are observable for the asset or liability,
either directly (i.e. as prices) or indirectly (i.e. derived from prices) (level 2); and
The table below provides information on financial assets or liabilities re-measured and carried at fair values, by valuation methods.
The Fund has not disclosed the fair values for other financial assets and financial liabilities, as their estimated fair value is considered
not significantly different from the carrying value as the items are short term in nature.
Fair Value
------------------------------------ (Rupees in '000) --------------------------------------
Fair value is the price that would be received to sell an asset or paid to transfer a liability in an orderly transaction between market
participants at the measurement date. Consequently, differences can arise between carrying values and the fair value estimates.
Underlying the definition of fair value is the presumption that the Fund is a going concern without any intention or requirement to
curtail materially the scale of its operations or to undertake a transaction on adverse terms.
Fair value of investments classified as at fair value through profit or loss, which are tradable in an open market is based on the
market prices prevailing on the reporting date. The estimated fair value of all other financial assets and liabilities is considered not
significantly different from the carrying value as the items are short-term in nature.
Fair Value
------------------------------------ (Rupees in '000) --------------------------------------
Fair value measurements using Inputs for assets or liability that are not based on observable market data (i.e. unobservable
inputs) (level 3).
As at August 14, 2018 and March 31, 2019
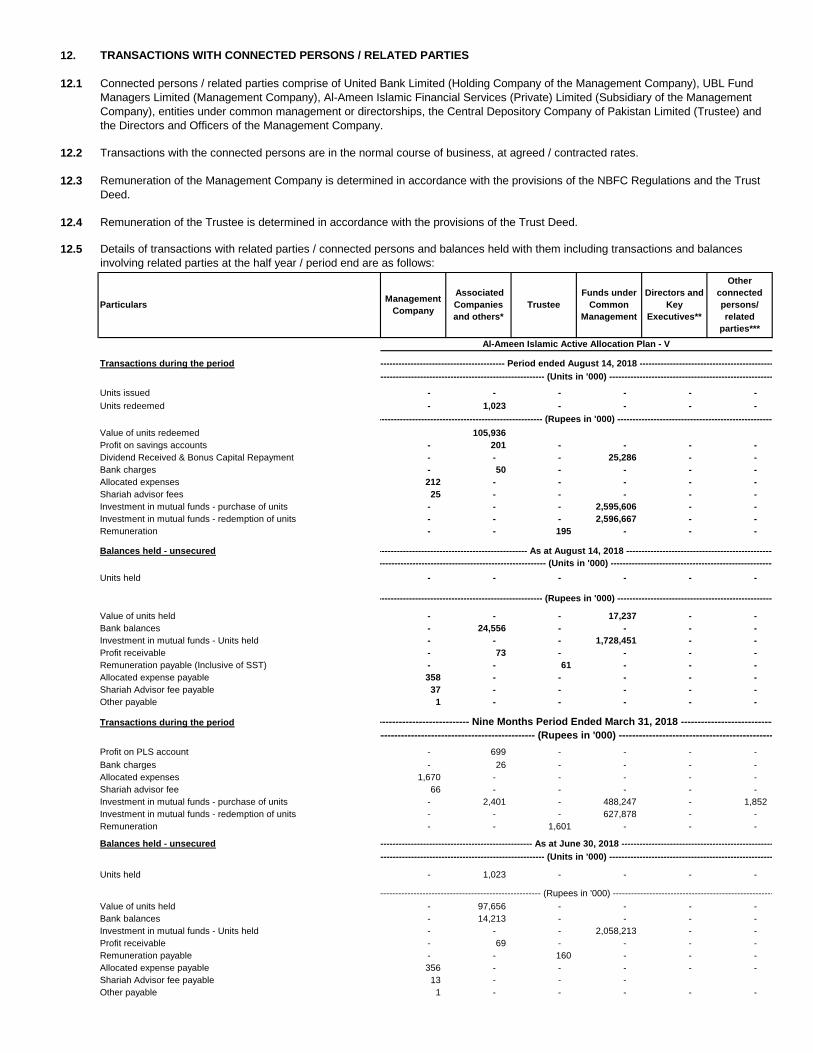
12. TRANSACTIONS WITH CONNECTED PERSONS / RELATED PARTIES
12.1
12.2
12.3
12.4
12.5
Transactions during the period
Units issued - - - - - -
Units redeemed - 1,023 - - - -
Value of units redeemed 105,936
Profit on savings accounts - 201 - - - -
Dividend Received & Bonus Capital Repayment - - - 25,286 - -
Bank charges - 50 - - - -
Allocated expenses 212 - - - - -
Shariah advisor fees 25 - - - - -
Investment in mutual funds - purchase of units - - - 2,595,606 - -
Investment in mutual funds - redemption of units - - - 2,596,667 - -
Remuneration - - 195 - - -
Balances held - unsecured
Units held - - - - - -
Value of units held - - - 17,237 - -
Bank balances - 24,556 - - - -
Investment in mutual funds - Units held - - - 1,728,451 - -
Profit receivable - 73 - - - -
Remuneration payable (Inclusive of SST) - - 61 - - -
Allocated expense payable 358 - - - - -
Shariah Advisor fee payable 37 - - - - -
Other payable 1 - - - - -
Transactions during the period
Profit on PLS account - 699 - - - -
Bank charges - 26 - - - -
Allocated expenses 1,670 - - - - -
Shariah advisor fee 66 - - - - -
Investment in mutual funds - purchase of units - 2,401 - 488,247 - 1,852
Investment in mutual funds - redemption of units - - - 627,878 - -
Remuneration - - 1,601 - - -
Balances held - unsecured
Units held - 1,023 - - - -
Value of units held - 97,656 - - - -
Bank balances - 14,213 - - - -
Investment in mutual funds - Units held - - - 2,058,213 - -
Profit receivable - 69 - - - -
Remuneration payable - - 160 - - -
Allocated expense payable 356 - - - - -
Shariah Advisor fee payable 13 - - -
Other payable 1 - - - - -
Remuneration of the Trustee is determined in accordance with the provisions of the Trust Deed.
Connected persons / related parties comprise of United Bank Limited (Holding Company of the Management Company), UBL Fund
Managers Limited (Management Company), Al-Ameen Islamic Financial Services (Private) Limited (Subsidiary of the Management
Company), entities under common management or directorships, the Central Depository Company of Pakistan Limited (Trustee) and
the Directors and Officers of the Management Company.
Transactions with the connected persons are in the normal course of business, at agreed / contracted rates.
Remuneration of the Management Company is determined in accordance with the provisions of the NBFC Regulations and the Trust
Deed.
Details of transactions with related parties / connected persons and balances held with them including transactions and balances
involving related parties at the half year / period end are as follows:
---------------------------------------------------------------------------------------------- (Units in '000) ----------------------------------------------------------------------------------------------
----------------------------------------------------------------- (Rupees in '000) -----------------------------------------------------------------
------------------------------------------------------------------------ (Units in '000) -----------------------------------------------------------------------
--------------------------------------------------------------------------- (Rupees in '000) -------------------------------------------------------------------------
------------------------------------------ Nine Months Period Ended March 31, 2018 -------------------------------------------
----------------------------------------------- (Rupees in '000) -----------------------------------------------
----------------------------------------------------------------- As at June 30, 2018 -----------------------------------------------------------------
----------------------------------------------------------------- As at August 14, 2018 -----------------------------------------------------------------
ParticularsManagement
Company
Associated
Companies
and others*
Trustee
Funds under
Common
Management
Directors and
Key
Executives**
Other
connected
persons/
related
parties***
Al-Ameen Islamic Active Allocation Plan - V
----------------------------------------------------------- Period ended August 14, 2018 --------------------------------------------------------------
---------------------------------------------------------------------------------------------- (Units in '000) ----------------------------------------------------------------------------------------------
--------------------------------------------------------------------------- (Rupees in '000) -------------------------------------------------------------------------
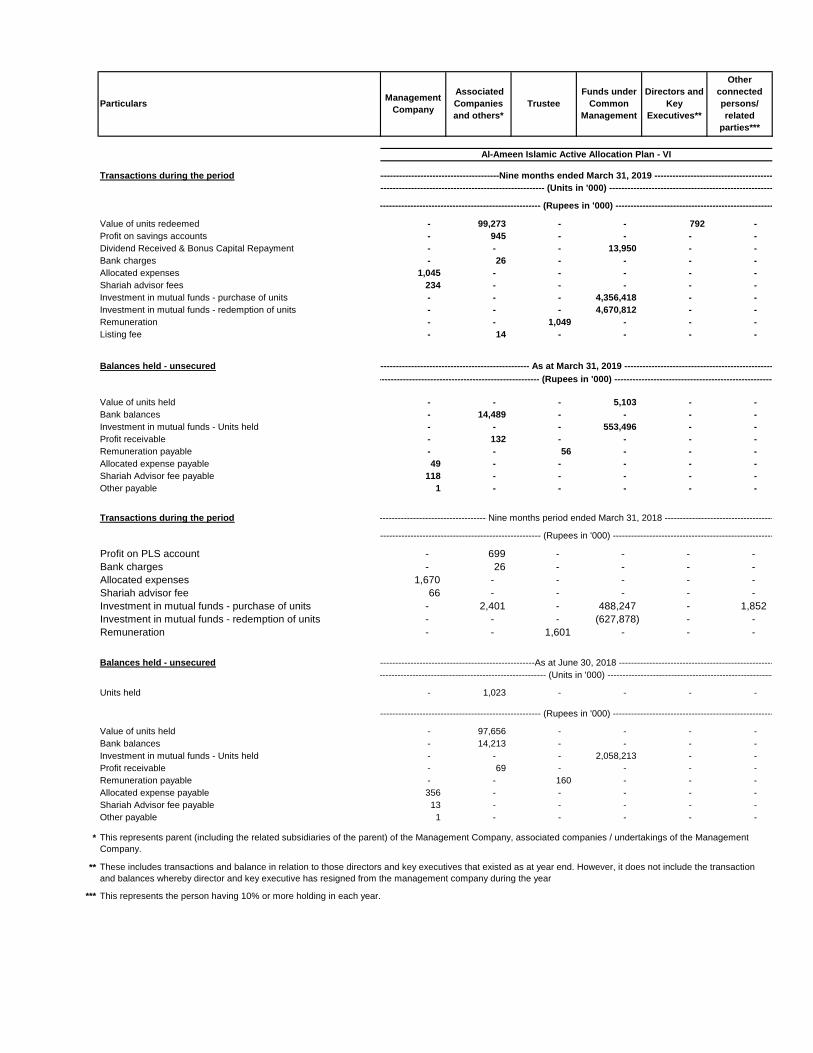
Transactions during the period
Value of units redeemed - 99,273 - - 792 -
Profit on savings accounts - 945 - - - -
Dividend Received & Bonus Capital Repayment - - - 13,950 - -
Bank charges - 26 - - - -
Allocated expenses 1,045 - - - - -
Shariah advisor fees 234 - - - - -
Investment in mutual funds - purchase of units - - - 4,356,418 - -
Investment in mutual funds - redemption of units - - - 4,670,812 - -
Remuneration - - 1,049 - - -
Listing fee - 14 - - - -
Balances held - unsecured
Value of units held - - - 5,103 - -
Bank balances - 14,489 - - - -
Investment in mutual funds - Units held - - - 553,496 - -
Profit receivable - 132 - - - -
Remuneration payable - - 56 - - -
Allocated expense payable 49 - - - - -
Shariah Advisor fee payable 118 - - - - -
Other payable 1 - - - - -
Transactions during the period
Profit on PLS account - 699 - - - -
Bank charges - 26 - - - -
Allocated expenses 1,670 - - - - -
Shariah advisor fee 66 - - - - -
Investment in mutual funds - purchase of units - 2,401 - 488,247 - 1,852
Investment in mutual funds - redemption of units - - - (627,878) - -
Remuneration - - 1,601 - - -
Balances held - unsecured
Units held - 1,023 - - - -
Value of units held - 97,656 - - - -
Bank balances - 14,213 - - - -
Investment in mutual funds - Units held - - - 2,058,213 - -
Profit receivable - 69 - - - -
Remuneration payable - - 160 - - -
Allocated expense payable 356 - - - - -
Shariah Advisor fee payable 13 - - - - -
Other payable 1 - - - - -
*
**
*** This represents the person having 10% or more holding in each year.
---------------------------------------------------------------------------------------------- (Units in '000) ----------------------------------------------------------------------------------------------
---------------------------------------------------------- (Rupees in '000) ----------------------------------------------------------
This represents parent (including the related subsidiaries of the parent) of the Management Company, associated companies / undertakings of the Management
Company.
These includes transactions and balance in relation to those directors and key executives that existed as at year end. However, it does not include the transaction
and balances whereby director and key executive has resigned from the management company during the year
---------------------------------------------------------- (Rupees in '000) ----------------------------------------------------------
------------------------------------------ Nine months period ended March 31, 2018 -------------------------------------------
---------------------------------------------------------- (Rupees in '000) ----------------------------------------------------------
---------------------------------------------------------As at June 30, 2018 ---------------------------------------------------------
----------------------------------------------------------------- As at March 31, 2019 -----------------------------------------------------------------
ParticularsManagement
Company
Associated
Companies
and others*
Trustee
Funds under
Common
Management
Directors and
Key
Executives**
Other
connected
persons/
related
parties***
Al-Ameen Islamic Active Allocation Plan - VI
----------------------------------------------Nine months ended March 31, 2019 ----------------------------------------------
---------------------------------------------------------------------------------------------- (Units in '000) ----------------------------------------------------------------------------------------------
-------------------------------------------------------- (Rupees in '000) --------------------------------------------------------
13. GENERAL
13.1
13.2
14. DATE OF AUTHORISATION FOR ISSUE
FOR UBL FUND MANAGERS LIMITED
(Management Company)
This condensed interim financial information were authorised for issue on ___________________ by the Board of Directors of the
Management Company.
Figures have been rounded off to the nearest thousand rupees unless otherwise stated.
Corresponding figures have been rearranged and reclassified, wherever necessary for the purpose of comparison and for better
presentation. However, no significant reclassification has been made during the period.
______________________ Chief Executive Officer
_________________ Director
_____________________ Chief Financial Officer
SDSDSD
29 April 2019
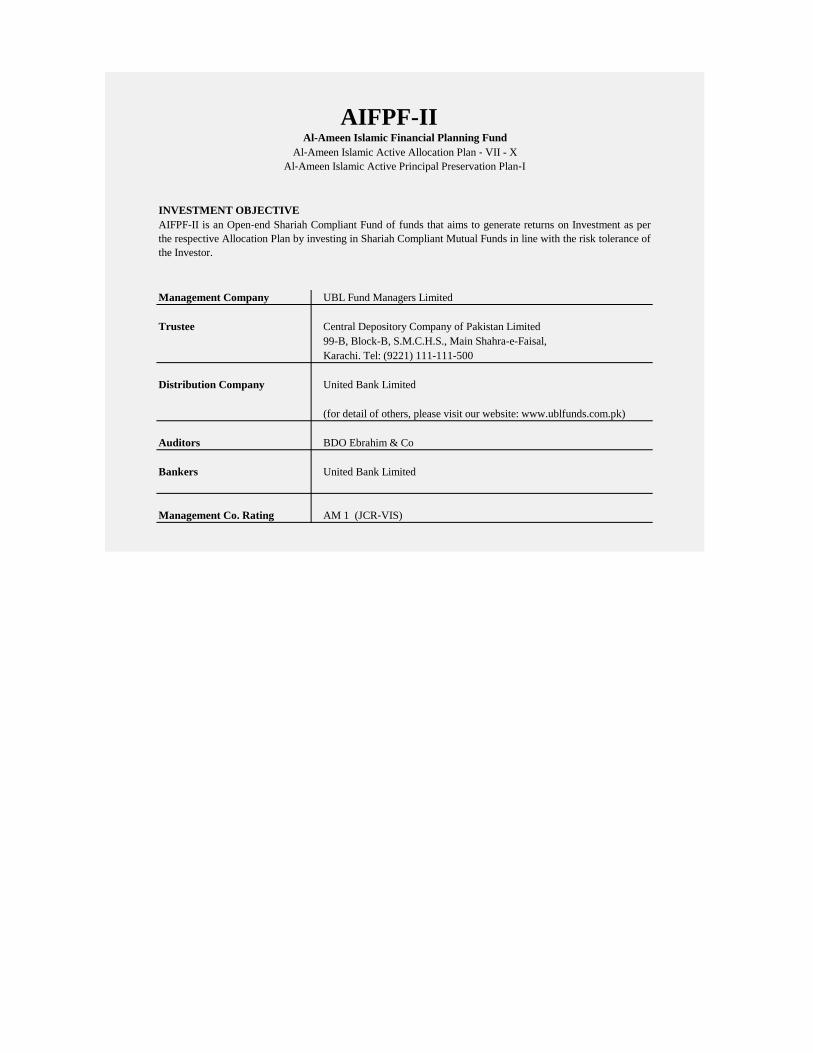
Management Company UBL Fund Managers Limited
Trustee Central Depository Company of Pakistan Limited
99-B, Block-B, S.M.C.H.S., Main Shahra-e-Faisal,
Karachi. Tel: (9221) 111-111-500
Distribution Company United Bank Limited
Auditors BDO Ebrahim & Co
Bankers United Bank Limited
Management Co. Rating AM 1 (JCR‐VIS)
AIFPF-II is an Open‐end Shariah Compliant Fund of funds that aims to generate returns on Investment as per
the respective Allocation Plan by investing in Shariah Compliant Mutual Funds in line with the risk tolerance of
the Investor.
(for detail of others, please visit our website: www.ublfunds.com.pk)
AIFPF-IIAl-Ameen Islamic Financial Planning Fund
Al‐Ameen Islamic Active Allocation Plan ‐ VII - X
Al‐Ameen Islamic Active Principal Preservation Plan‐I
INVESTMENT OBJECTIVE
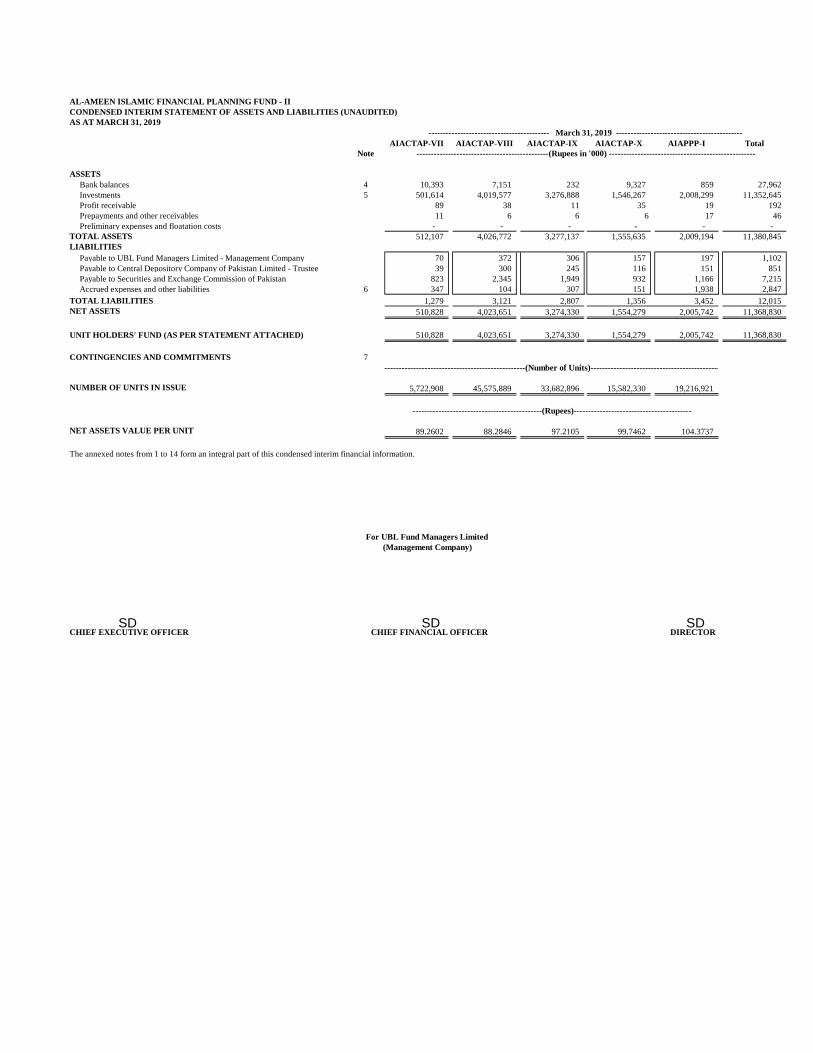
AL-AMEEN ISLAMIC FINANCIAL PLANNING FUND - II
CONDENSED INTERIM STATEMENT OF ASSETS AND LIABILITIES (UNAUDITED)
AS AT MARCH 31, 2019
AIACTAP-VII AIACTAP-VIII AIACTAP-IX AIACTAP-X AIAPPP-I Total
Note
ASSETS
Bank balances 4 10,393 7,151 232 9,327 859 27,962
Investments 5 501,614 4,019,577 3,276,888 1,546,267 2,008,299 11,352,645
Profit receivable 89 38 11 35 19 192
Prepayments and other receivables 11 6 6 6 17 46
Preliminary expenses and floatation costs - - - - - -
TOTAL ASSETS 512,107 4,026,772 3,277,137 1,555,635 2,009,194 11,380,845
LIABILITIES
Payable to UBL Fund Managers Limited - Management Company 70 372 306 157 197 1,102
Payable to Central Depository Company of Pakistan Limited - Trustee 39 300 245 116 151 851
Payable to Securities and Exchange Commission of Pakistan 823 2,345 1,949 932 1,166 7,215
Accrued expenses and other liabilities 6 347 104 307 151 1,938 2,847
TOTAL LIABILITIES 1,279 3,121 2,807 1,356 3,452 12,015
NET ASSETS 510,828 4,023,651 3,274,330 1,554,279 2,005,742 11,368,830
510,828 4,023,651 3,274,330 1,554,279 2,005,742 11,368,830
CONTINGENCIES AND COMMITMENTS 7
NUMBER OF UNITS IN ISSUE 5,722,908 45,575,889 33,682,896 15,582,330 19,216,921
NET ASSETS VALUE PER UNIT 89.2602 88.2846 97.2105 99.7462 104.3737
The annexed notes from 1 to 14 form an integral part of this condensed interim financial information.
For UBL Fund Managers Limited
(Management Company)
CHIEF EXECUTIVE OFFICER CHIEF FINANCIAL OFFICER DIRECTOR
------------------------------------------ March 31, 2019 --------------------------------------------
----------------------------------------------(Rupees in '000) ---------------------------------------------------
UNIT HOLDERS' FUND (AS PER STATEMENT ATTACHED)
------------------------------------------------------(Number of Units)--------------------------------------------------
---------------------------------------------(Rupees)-----------------------------------------
SD SD SD
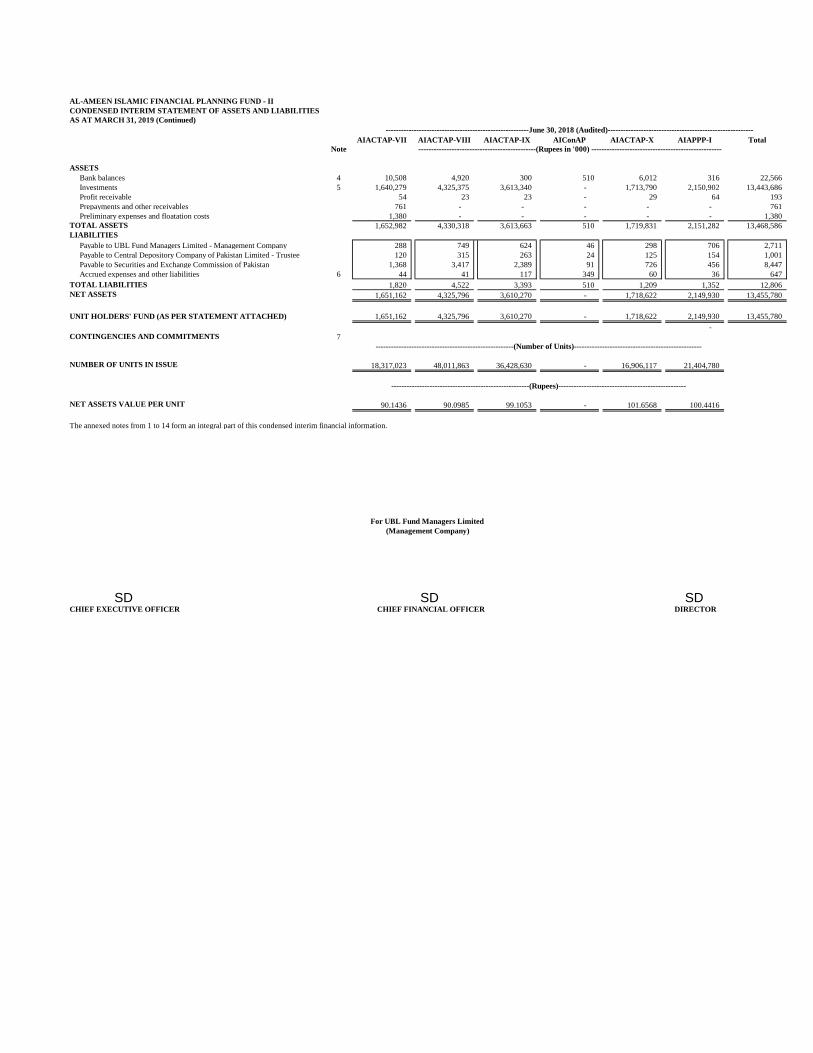
AL-AMEEN ISLAMIC FINANCIAL PLANNING FUND - II
CONDENSED INTERIM STATEMENT OF ASSETS AND LIABILITIES
AS AT MARCH 31, 2019 (Continued)
AIACTAP-VII AIACTAP-VIII AIACTAP-IX AIConAP AIACTAP-X AIAPPP-I Total
Note
ASSETS
Bank balances 4 10,508 4,920 300 510 6,012 316 22,566
Investments 5 1,640,279 4,325,375 3,613,340 - 1,713,790 2,150,902 13,443,686
Profit receivable 54 23 23 - 29 64 193
Prepayments and other receivables 761 - - - - - 761
Preliminary expenses and floatation costs 1,380 - - - - - 1,380
TOTAL ASSETS 1,652,982 4,330,318 3,613,663 510 1,719,831 2,151,282 13,468,586
LIABILITIES
Payable to UBL Fund Managers Limited - Management Company 288 749 624 46 298 706 2,711
Payable to Central Depository Company of Pakistan Limited - Trustee 120 315 263 24 125 154 1,001
Payable to Securities and Exchange Commission of Pakistan 1,368 3,417 2,389 91 726 456 8,447
Accrued expenses and other liabilities 6 44 41 117 349 60 36 647
TOTAL LIABILITIES 1,820 4,522 3,393 510 1,209 1,352 12,806
NET ASSETS 1,651,162 4,325,796 3,610,270 - 1,718,622 2,149,930 13,455,780
1,651,162 4,325,796 3,610,270 - 1,718,622 2,149,930 13,455,780
-
CONTINGENCIES AND COMMITMENTS 7
NUMBER OF UNITS IN ISSUE 18,317,023 48,011,863 36,428,630 - 16,906,117 21,404,780
NET ASSETS VALUE PER UNIT 90.1436 90.0985 99.1053 - 101.6568 100.4416
The annexed notes from 1 to 14 form an integral part of this condensed interim financial information.
For UBL Fund Managers Limited
(Management Company)
CHIEF EXECUTIVE OFFICER CHIEF FINANCIAL OFFICER DIRECTOR
--------------------------------------------------------June 30, 2018 (Audited)---------------------------------------------------------
----------------------------------------------(Rupees in '000) ---------------------------------------------------
UNIT HOLDERS' FUND (AS PER STATEMENT ATTACHED)
------------------------------------------------------(Number of Units)--------------------------------------------------
------------------------------------------------------(Rupees)--------------------------------------------------
SDSDSD
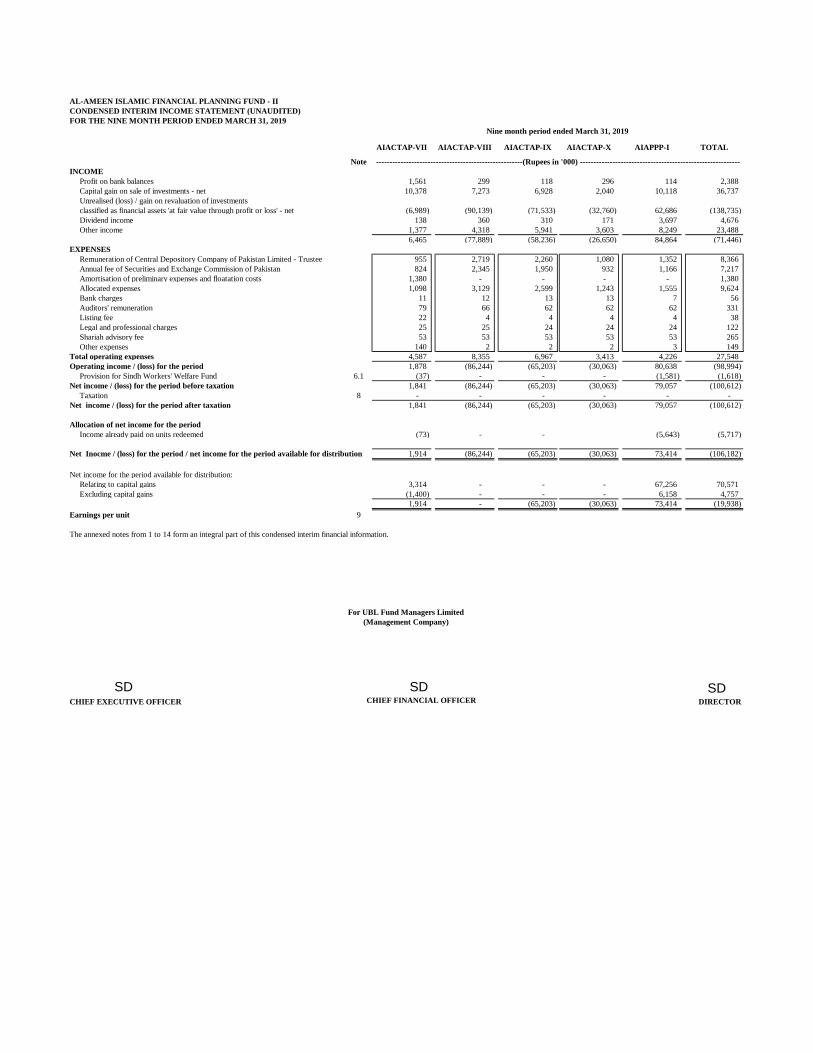
AL-AMEEN ISLAMIC FINANCIAL PLANNING FUND - II
FOR THE NINE MONTH PERIOD ENDED MARCH 31, 2019
AIACTAP-VII AIACTAP-VIII AIACTAP-IX AIACTAP-X AIAPPP-I TOTAL
Note
INCOME
Profit on bank balances 1,561 299 118 296 114 2,388
Capital gain on sale of investments - net 10,378 7,273 6,928 2,040 10,118 36,737
Unrealised (loss) / gain on revaluation of investments
classified as financial assets 'at fair value through profit or loss' - net (6,989) (90,139) (71,533) (32,760) 62,686 (138,735)
Dividend income 138 360 310 171 3,697 4,676
Other income 1,377 4,318 5,941 3,603 8,249 23,488
6,465 (77,889) (58,236) (26,650) 84,864 (71,446)
EXPENSES
Remuneration of Central Depository Company of Pakistan Limited - Trustee 955 2,719 2,260 1,080 1,352 8,366
Annual fee of Securities and Exchange Commission of Pakistan 824 2,345 1,950 932 1,166 7,217
Amortisation of preliminary expenses and floatation costs 1,380 - - - - 1,380
Allocated expenses 1,098 3,129 2,599 1,243 1,555 9,624
Bank charges 11 12 13 13 7 56
Auditors' remuneration 79 66 62 62 62 331
Listing fee 22 4 4 4 4 38
Legal and professional charges 25 25 24 24 24 122
Shariah advisory fee 53 53 53 53 53 265
Other expenses 140 2 2 2 3 149
Total operating expenses 4,587 8,355 6,967 3,413 4,226 27,548
Operating income / (loss) for the period 1,878 (86,244) (65,203) (30,063) 80,638 (98,994)
Provision for Sindh Workers' Welfare Fund 6.1 (37) - - - (1,581) (1,618)
Net income / (loss) for the period before taxation 1,841 (86,244) (65,203) (30,063) 79,057 (100,612)
Taxation 8 - - - - - -
Net income / (loss) for the period after taxation 1,841 (86,244) (65,203) (30,063) 79,057 (100,612)
Allocation of net income for the period
Income already paid on units redeemed (73) - - (5,643) (5,717)
Net Inocme / (loss) for the period / net income for the period available for distribution 1,914 (86,244) (65,203) (30,063) 73,414 (106,182)
Net income for the period available for distribution:
Relating to capital gains 3,314 - - - 67,256 70,571
Excluding capital gains (1,400) - - - 6,158 4,757
1,914 - (65,203) (30,063) 73,414 (19,938)
Earnings per unit 9
CHIEF EXECUTIVE OFFICER DIRECTORCHIEF FINANCIAL OFFICER
CONDENSED INTERIM INCOME STATEMENT (UNAUDITED)
For UBL Fund Managers Limited
(Management Company)
The annexed notes from 1 to 14 form an integral part of this condensed interim financial information.
------------------------------------------------------(Rupees in '000) -----------------------------------------------------------
Nine month period ended March 31, 2019
SD SD SD
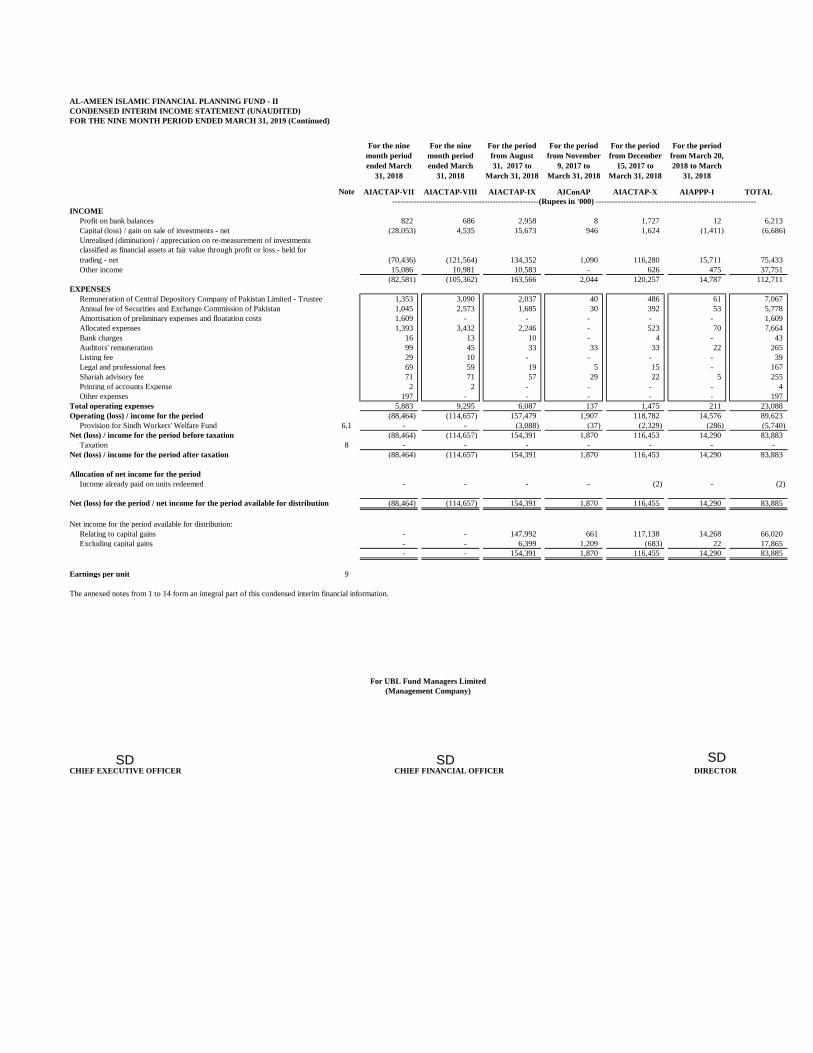
AL-AMEEN ISLAMIC FINANCIAL PLANNING FUND - II
CONDENSED INTERIM INCOME STATEMENT (UNAUDITED)
FOR THE NINE MONTH PERIOD ENDED MARCH 31, 2019 (Continued)
Note AIACTAP-VII AIACTAP-VIII AIACTAP-IX AIConAP AIACTAP-X AIAPPP-I TOTAL
INCOME
Profit on bank balances 822 686 2,958 8 1,727 12 6,213
Capital (loss) / gain on sale of investments - net (28,053) 4,535 15,673 946 1,624 (1,411) (6,686)
Unrealised (diminution) / appreciation on re-measurement of investments
classified as financial assets at fair value through profit or loss - held for
trading - net (70,436) (121,564) 134,352 1,090 116,280 15,711 75,433
Other income 15,086 10,981 10,583 - 626 475 37,751
(82,581) (105,362) 163,566 2,044 120,257 14,787 112,711
EXPENSES
Remuneration of Central Depository Company of Pakistan Limited - Trustee 1,353 3,090 2,037 40 486 61 7,067
Annual fee of Securities and Exchange Commission of Pakistan 1,045 2,573 1,685 30 392 53 5,778
Amortisation of preliminary expenses and floatation costs 1,609 - - - - - 1,609
Allocated expenses 1,393 3,432 2,246 - 523 70 7,664
Bank charges 16 13 10 - 4 - 43
Auditors' remuneration 99 45 33 33 33 22 265
Listing fee 29 10 - - - - 39
Legal and professional fees 69 59 19 5 15 - 167
Shariah advisory fee 71 71 57 29 22 5 255
Printing of accounts Expense 2 2 - - - - 4
Other expenses 197 - - - - - 197
Total operating expenses 5,883 9,295 6,087 137 1,475 211 23,088
Operating (loss) / income for the period (88,464) (114,657) 157,479 1,907 118,782 14,576 89,623
Provision for Sindh Workers' Welfare Fund 6.1 - - (3,088) (37) (2,329) (286) (5,740)
Net (loss) / income for the period before taxation (88,464) (114,657) 154,391 1,870 116,453 14,290 83,883
Taxation 8 - - - - - - -
Net (loss) / income for the period after taxation (88,464) (114,657) 154,391 1,870 116,453 14,290 83,883
Allocation of net income for the period
Income already paid on units redeemed - - - - (2) - (2)
Net (loss) for the period / net income for the period available for distribution (88,464) (114,657) 154,391 1,870 116,455 14,290 83,885
Net income for the period available for distribution:
Relating to capital gains - - 147,992 661 117,138 14,268 66,020
Excluding capital gains - - 6,399 1,209 (683) 22 17,865
- - 154,391 1,870 116,455 14,290 83,885
Earnings per unit 9
The annexed notes from 1 to 14 form an integral part of this condensed interim financial information.
For UBL Fund Managers Limited
(Management Company)
CHIEF EXECUTIVE OFFICER CHIEF FINANCIAL OFFICER DIRECTOR
For the nine
month period
ended March
31, 2018
For the nine
month period
ended March
31, 2018
For the period
from August
31, 2017 to
March 31, 2018
For the period
from November
9, 2017 to
March 31, 2018
For the period
from December
15, 2017 to
March 31, 2018
------------------------------------------------------(Rupees in '000) -----------------------------------------------------------
For the period
from March 20,
2018 to March
31, 2018
SDSDSD
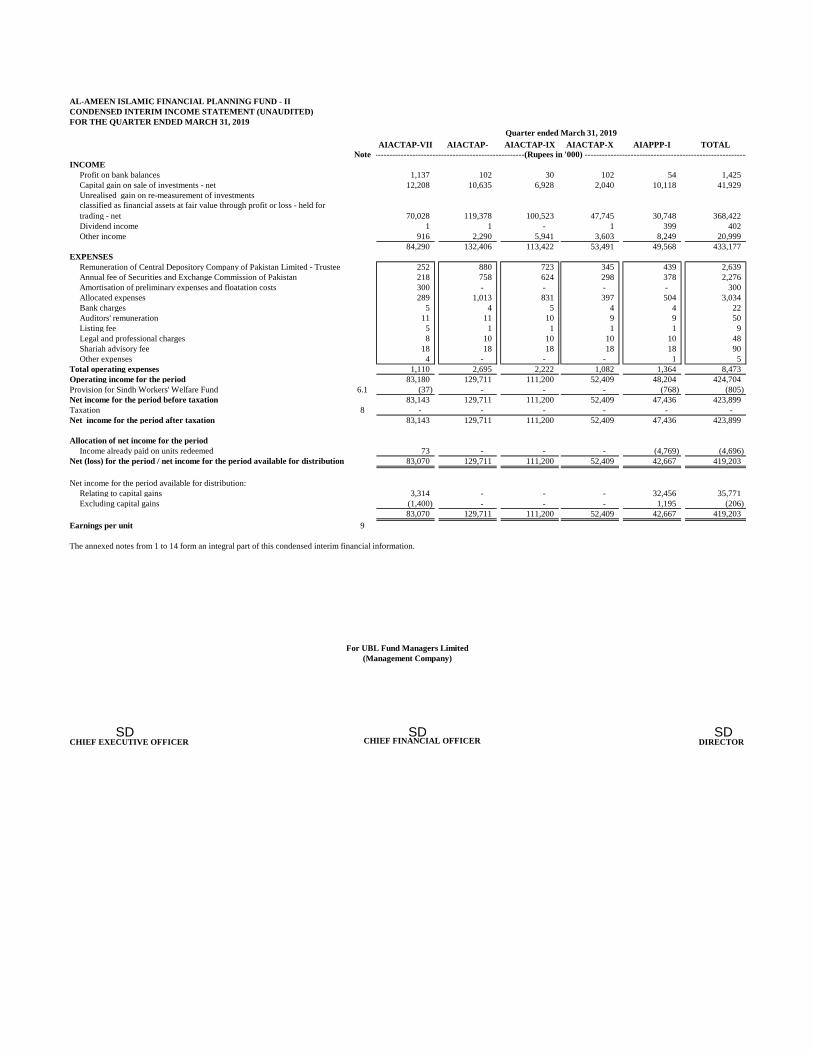
AL-AMEEN ISLAMIC FINANCIAL PLANNING FUND - II
FOR THE QUARTER ENDED MARCH 31, 2019
AIACTAP-VII AIACTAP- AIACTAP-IX AIACTAP-X AIAPPP-I TOTAL
Note
INCOME
Profit on bank balances 1,137 102 30 102 54 1,425
Capital gain on sale of investments - net 12,208 10,635 6,928 2,040 10,118 41,929
Unrealised gain on re-measurement of investments
classified as financial assets at fair value through profit or loss - held for
trading - net 70,028 119,378 100,523 47,745 30,748 368,422
Dividend income 1 1 - 1 399 402
Other income 916 2,290 5,941 3,603 8,249 20,999
84,290 132,406 113,422 53,491 49,568 433,177
EXPENSES
Remuneration of Central Depository Company of Pakistan Limited - Trustee 252 880 723 345 439 2,639
Annual fee of Securities and Exchange Commission of Pakistan 218 758 624 298 378 2,276
Amortisation of preliminary expenses and floatation costs 300 - - - - 300
Allocated expenses 289 1,013 831 397 504 3,034
Bank charges 5 4 5 4 4 22
Auditors' remuneration 11 11 10 9 9 50
Listing fee 5 1 1 1 1 9
Legal and professional charges 8 10 10 10 10 48
Shariah advisory fee 18 18 18 18 18 90
Other expenses 4 - - - 1 5
Total operating expenses 1,110 2,695 2,222 1,082 1,364 8,473
Operating income for the period 83,180 129,711 111,200 52,409 48,204 424,704
Provision for Sindh Workers' Welfare Fund 6.1 (37) - - - (768) (805)
Net income for the period before taxation 83,143 129,711 111,200 52,409 47,436 423,899
Taxation 8 - - - - - -
Net income for the period after taxation 83,143 129,711 111,200 52,409 47,436 423,899
Allocation of net income for the period
Income already paid on units redeemed 73 - - - (4,769) (4,696)
Net (loss) for the period / net income for the period available for distribution 83,070 129,711 111,200 52,409 42,667 419,203
Net income for the period available for distribution:
Relating to capital gains 3,314 - - - 32,456 35,771
Excluding capital gains (1,400) - - - 1,195 (206)
83,070 129,711 111,200 52,409 42,667 419,203
Earnings per unit 9
CHIEF EXECUTIVE OFFICER DIRECTORCHIEF FINANCIAL OFFICER
CONDENSED INTERIM INCOME STATEMENT (UNAUDITED)
------------------------------------------------------(Rupees in '000) -----------------------------------------------------------
The annexed notes from 1 to 14 form an integral part of this condensed interim financial information.
For UBL Fund Managers Limited
(Management Company)
Quarter ended March 31, 2019
SD SD SD
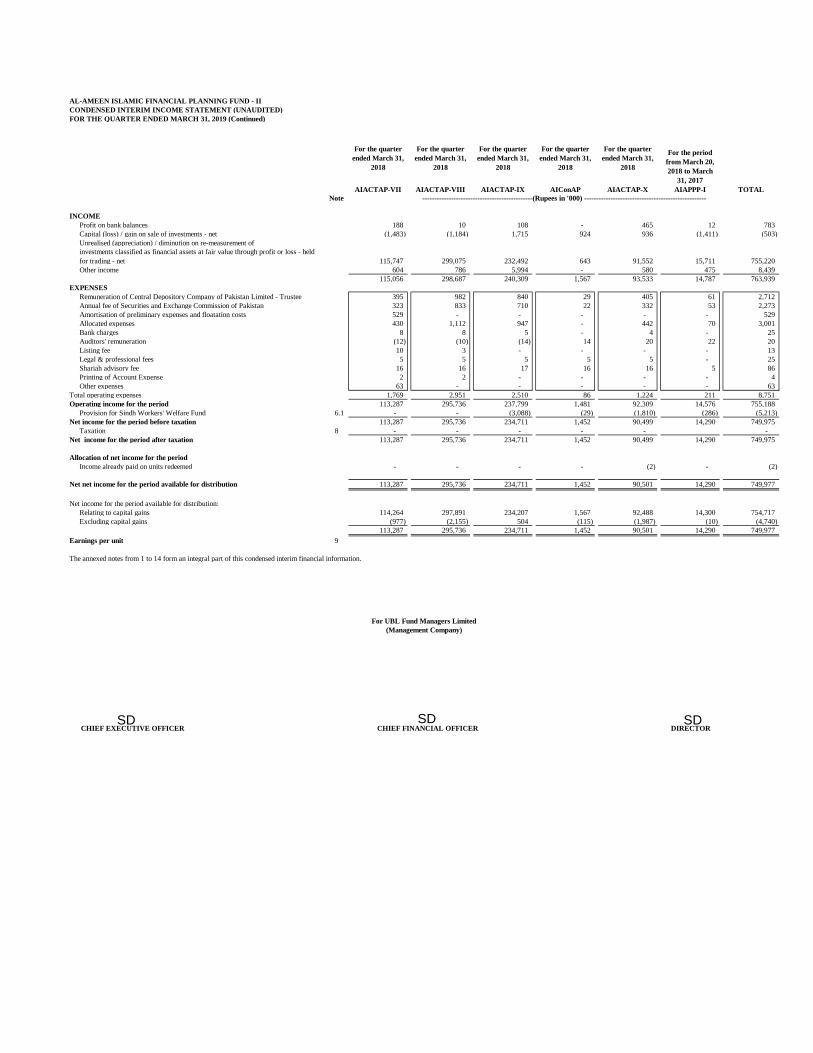
AL-AMEEN ISLAMIC FINANCIAL PLANNING FUND - II
CONDENSED INTERIM INCOME STATEMENT (UNAUDITED)
FOR THE QUARTER ENDED MARCH 31, 2019 (Continued)
AIACTAP-VII AIACTAP-VIII AIACTAP-IX AIConAP AIACTAP-X AIAPPP-I TOTAL
Note
INCOME
Profit on bank balances 188 10 108 - 465 12 783
Capital (loss) / gain on sale of investments - net (1,483) (1,184) 1,715 924 936 (1,411) (503)
Unrealised (appreciation) / diminution on re-measurement of
investments classified as financial assets at fair value through profit or loss - held
for trading - net 115,747 299,075 232,492 643 91,552 15,711 755,220
Other income 604 786 5,994 - 580 475 8,439
115,056 298,687 240,309 1,567 93,533 14,787 763,939
EXPENSES
Remuneration of Central Depository Company of Pakistan Limited - Trustee 395 982 840 29 405 61 2,712
Annual fee of Securities and Exchange Commission of Pakistan 323 833 710 22 332 53 2,273
Amortisation of preliminary expenses and floatation costs 529 - - - - - 529
Allocated expenses 430 1,112 947 - 442 70 3,001
Bank charges 8 8 5 - 4 - 25
Auditors' remuneration (12) (10) (14) 14 20 22 20
Listing fee 10 3 - - - - 13
Legal & professional fees 5 5 5 5 5 - 25
Shariah advisory fee 16 16 17 16 16 5 86
Printing of Account Expense 2 2 - - - - 4
Other expenses 63 - - - - - 63
Total operating expenses 1,769 2,951 2,510 86 1,224 211 8,751
Operating income for the period 113,287 295,736 237,799 1,481 92,309 14,576 755,188
Provision for Sindh Workers' Welfare Fund 6.1 - - (3,088) (29) (1,810) (286) (5,213)
Net income for the period before taxation 113,287 295,736 234,711 1,452 90,499 14,290 749,975
Taxation 8 - - - - - -
Net income for the period after taxation 113,287 295,736 234,711 1,452 90,499 14,290 749,975
Allocation of net income for the period
Income already paid on units redeemed - - - - (2) - (2)
Net net income for the period available for distribution 113,287 295,736 234,711 1,452 90,501 14,290 749,977
Net income for the period available for distribution:
Relating to capital gains 114,264 297,891 234,207 1,567 92,488 14,300 754,717
Excluding capital gains (977) (2,155) 504 (115) (1,987) (10) (4,740)
113,287 295,736 234,711 1,452 90,501 14,290 749,977
Earnings per unit 9
The annexed notes from 1 to 14 form an integral part of this condensed interim financial information.
For UBL Fund Managers Limited
(Management Company)
CHIEF EXECUTIVE OFFICER CHIEF FINANCIAL OFFICER DIRECTOR
For the quarter
ended March 31,
2018
For the quarter
ended March 31,
2018
For the quarter
ended March 31,
2018
For the quarter
ended March 31,
2018
For the quarter
ended March 31,
2018
----------------------------------------------(Rupees in '000) ---------------------------------------------------
For the period
from March 20,
2018 to March
31, 2017
SDSDSD
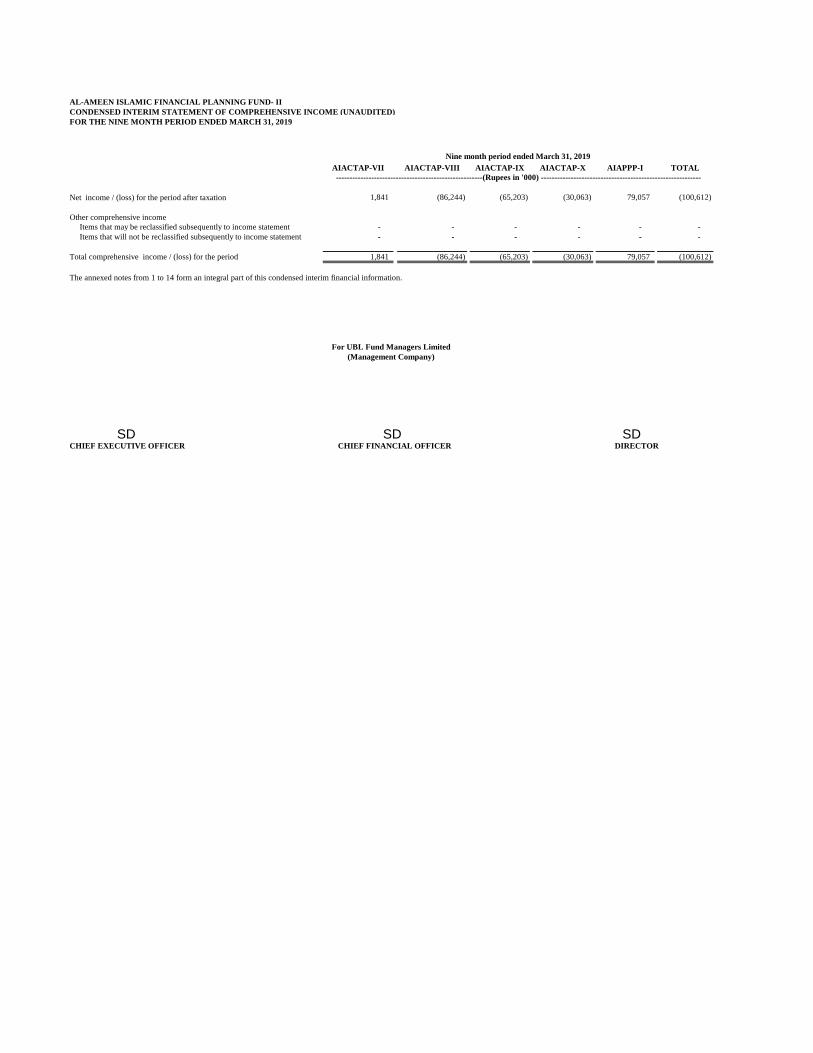
AL-AMEEN ISLAMIC FINANCIAL PLANNING FUND- II
CONDENSED INTERIM STATEMENT OF COMPREHENSIVE INCOME (UNAUDITED)
FOR THE NINE MONTH PERIOD ENDED MARCH 31, 2019
AIACTAP-VII AIACTAP-VIII AIACTAP-IX AIACTAP-X AIAPPP-I TOTAL
Net income / (loss) for the period after taxation 1,841 (86,244) (65,203) (30,063) 79,057 (100,612)
Other comprehensive income
Items that may be reclassified subsequently to income statement - - - - - -
Items that will not be reclassified subsequently to income statement - - - - - -
Total comprehensive income / (loss) for the period 1,841 (86,244) (65,203) (30,063) 79,057 (100,612)
The annexed notes from 1 to 14 form an integral part of this condensed interim financial information.
CHIEF EXECUTIVE OFFICER CHIEF FINANCIAL OFFICER DIRECTOR
For UBL Fund Managers Limited
(Management Company)
------------------------------------------------------(Rupees in '000) -----------------------------------------------------------
Nine month period ended March 31, 2019
SD SDSD
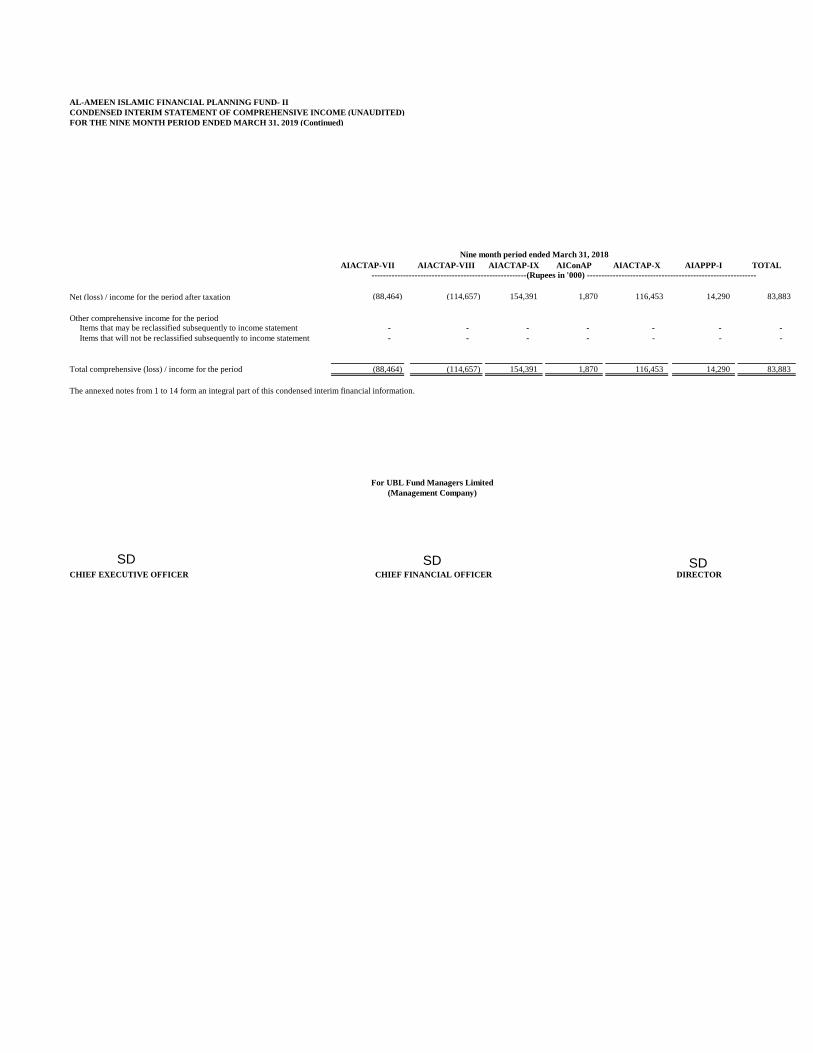
AL-AMEEN ISLAMIC FINANCIAL PLANNING FUND- II
CONDENSED INTERIM STATEMENT OF COMPREHENSIVE INCOME (UNAUDITED)
FOR THE NINE MONTH PERIOD ENDED MARCH 31, 2019 (Continued)
AIACTAP-VII AIACTAP-VIII AIACTAP-IX AIConAP AIACTAP-X AIAPPP-I TOTAL
Net (loss) / income for the period after taxation (88,464) (114,657) 154,391 1,870 116,453 14,290 83,883
Other comprehensive income for the periodItems that may be reclassified subsequently to income statement - - - - - - -
Items that will not be reclassified subsequently to income statement - - - - - - -
Total comprehensive (loss) / income for the period (88,464) (114,657) 154,391 1,870 116,453 14,290 83,883
The annexed notes from 1 to 14 form an integral part of this condensed interim financial information.
Nine month period ended March 31, 2018
For UBL Fund Managers Limited
(Management Company)
CHIEF EXECUTIVE OFFICER CHIEF FINANCIAL OFFICER DIRECTOR
------------------------------------------------------(Rupees in '000) -----------------------------------------------------------
SD SD SD
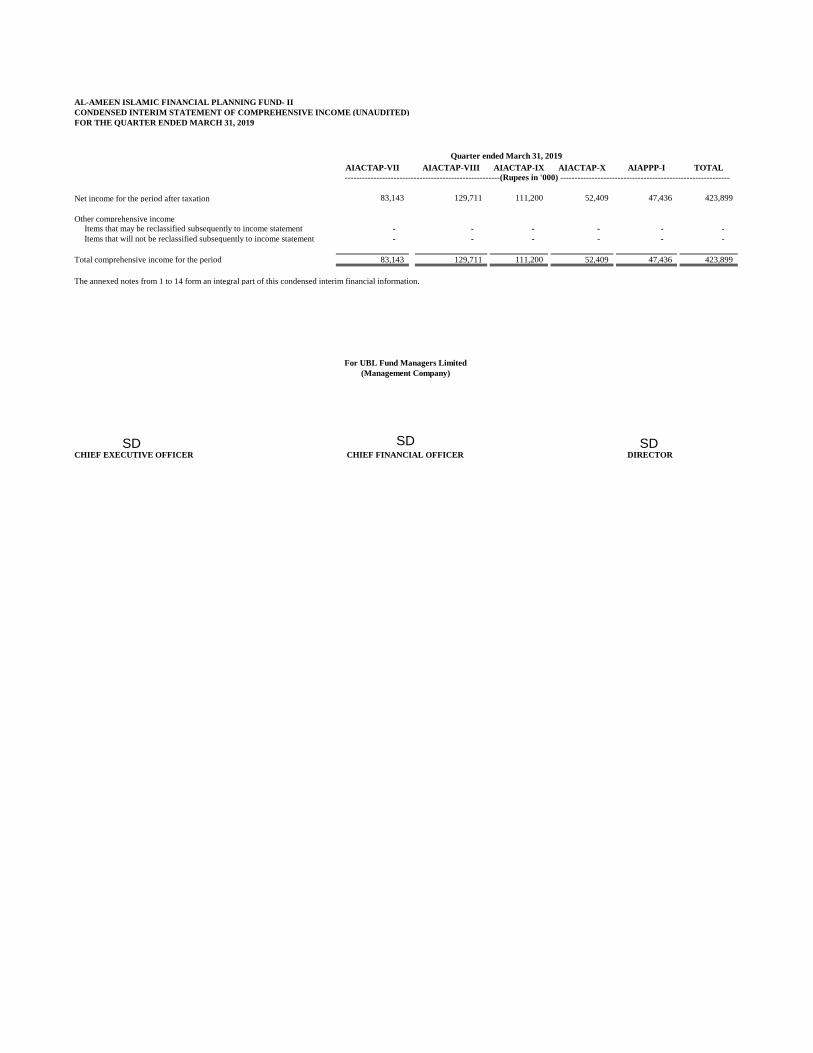
AL-AMEEN ISLAMIC FINANCIAL PLANNING FUND- II
CONDENSED INTERIM STATEMENT OF COMPREHENSIVE INCOME (UNAUDITED)
FOR THE QUARTER ENDED MARCH 31, 2019
AIACTAP-VII AIACTAP-VIII AIACTAP-IX AIACTAP-X AIAPPP-I TOTAL
Net income for the period after taxation 83,143 129,711 111,200 52,409 47,436 423,899
Other comprehensive incomeItems that may be reclassified subsequently to income statement - - - - - -
Items that will not be reclassified subsequently to income statement - - - - - -
Total comprehensive income for the period 83,143 129,711 111,200 52,409 47,436 423,899
The annexed notes from 1 to 14 form an integral part of this condensed interim financial information.
------------------------------------------------------(Rupees in '000) -----------------------------------------------------------
For UBL Fund Managers Limited
(Management Company)
CHIEF EXECUTIVE OFFICER CHIEF FINANCIAL OFFICER DIRECTOR
Quarter ended March 31, 2019
SD SDSD
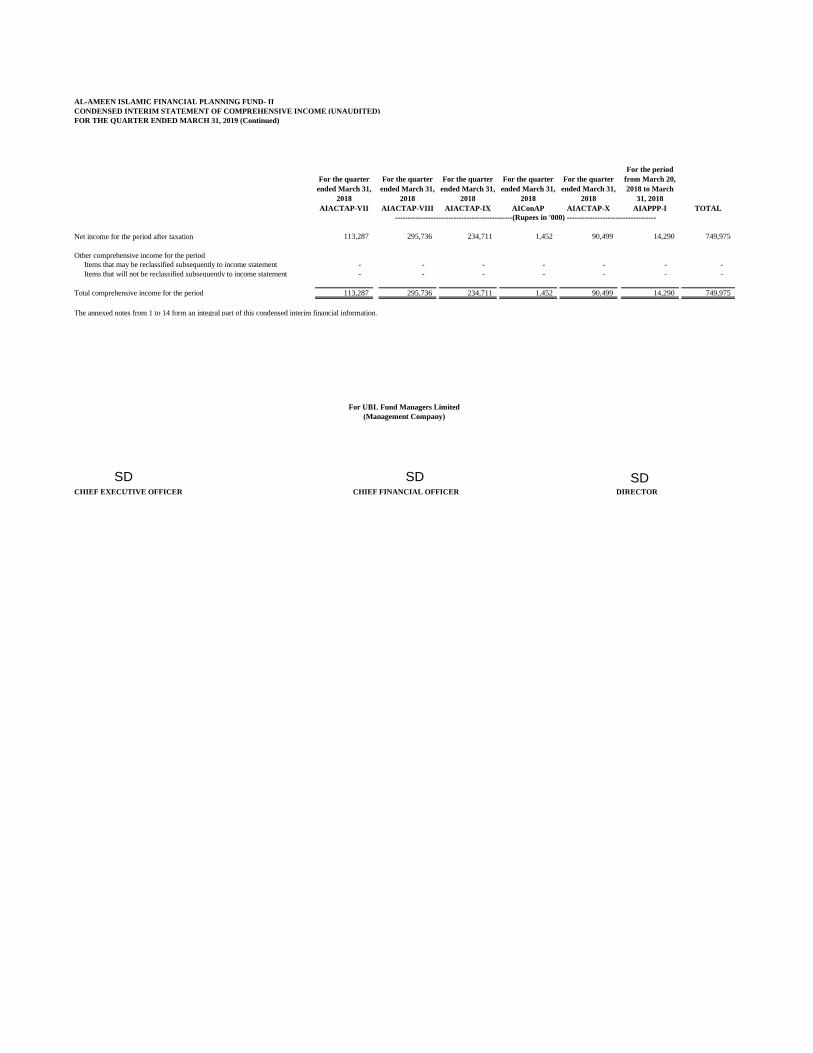
AL-AMEEN ISLAMIC FINANCIAL PLANNING FUND- II
CONDENSED INTERIM STATEMENT OF COMPREHENSIVE INCOME (UNAUDITED)
FOR THE QUARTER ENDED MARCH 31, 2019 (Continued)
AIACTAP-VII AIACTAP-VIII AIACTAP-IX AIConAP AIACTAP-X AIAPPP-I TOTAL
Net income for the period after taxation 113,287 295,736 234,711 1,452 90,499 14,290 749,975
Other comprehensive income for the period
Items that may be reclassified subsequently to income statement - - - - - - -
Items that will not be reclassified subsequently to income statement - - - - - - -
Total comprehensive income for the period 113,287 295,736 234,711 1,452 90,499 14,290 749,975
The annexed notes from 1 to 14 form an integral part of this condensed interim financial information.
For UBL Fund Managers Limited
(Management Company)
CHIEF EXECUTIVE OFFICER CHIEF FINANCIAL OFFICER DIRECTOR
For the quarter
ended March 31,
2018
For the quarter
ended March 31,
2018
For the quarter
ended March 31,
2018
For the quarter
ended March 31,
2018
For the quarter
ended March 31,
2018
----------------------------------------------(Rupees in '000) -----------------------------------
For the period
from March 20,
2018 to March
31, 2018
SD SD SD
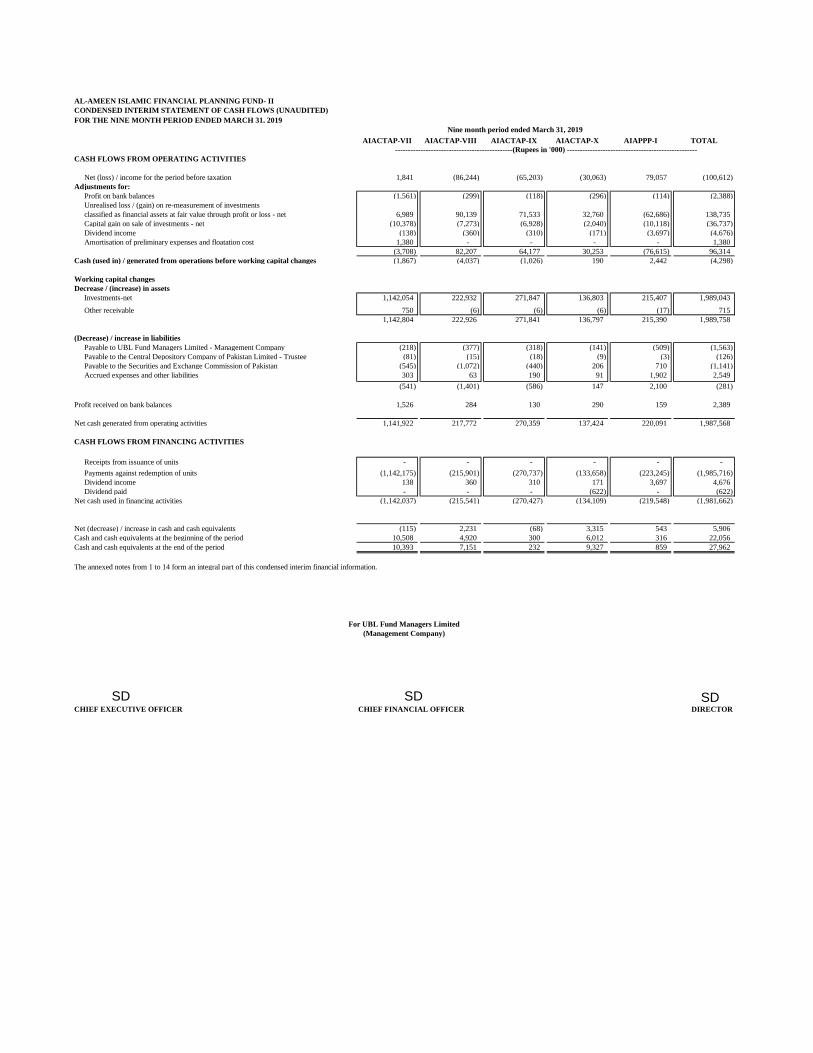
AL-AMEEN ISLAMIC FINANCIAL PLANNING FUND- II
CONDENSED INTERIM STATEMENT OF CASH FLOWS (UNAUDITED)
FOR THE NINE MONTH PERIOD ENDED MARCH 31, 2019
AIACTAP-VII AIACTAP-VIII AIACTAP-IX AIACTAP-X AIAPPP-I TOTAL
CASH FLOWS FROM OPERATING ACTIVITIES
Net (loss) / income for the period before taxation 1,841 (86,244) (65,203) (30,063) 79,057 (100,612)
Adjustments for:
Profit on bank balances (1,561) (299) (118) (296) (114) (2,388)
Unrealised loss / (gain) on re-measurement of investments
classified as financial assets at fair value through profit or loss - net 6,989 90,139 71,533 32,760 (62,686) 138,735
Capital gain on sale of investments - net (10,378) (7,273) (6,928) (2,040) (10,118) (36,737)
Dividend income (138) (360) (310) (171) (3,697) (4,676)
Amortisation of preliminary expenses and floatation cost 1,380 - - - - 1,380
(3,708) 82,207 64,177 30,253 (76,615) 96,314
Cash (used in) / generated from operations before working capital changes (1,867) (4,037) (1,026) 190 2,442 (4,298)
Working capital changes
Decrease / (increase) in assets
Investments-net 1,142,054 222,932 271,847 136,803 215,407 1,989,043
Other receivable 750 (6) (6) (6) (17) 715
1,142,804 222,926 271,841 136,797 215,390 1,989,758
(Decrease) / increase in liabilities
Payable to UBL Fund Managers Limited - Management Company (218) (377) (318) (141) (509) (1,563)
Payable to the Central Depository Company of Pakistan Limited - Trustee (81) (15) (18) (9) (3) (126)
Payable to the Securities and Exchange Commission of Pakistan (545) (1,072) (440) 206 710 (1,141)
Accrued expenses and other liabilities 303 63 190 91 1,902 2,549
(541) (1,401) (586) 147 2,100 (281)
Profit received on bank balances 1,526 284 130 290 159 2,389
Net cash generated from operating activities 1,141,922 217,772 270,359 137,424 220,091 1,987,568
CASH FLOWS FROM FINANCING ACTIVITIES
Receipts from issuance of units - - - - - -
Payments against redemption of units (1,142,175) (215,901) (270,737) (133,658) (223,245) (1,985,716)
Dividend income 138 360 310 171 3,697 4,676
Dividend paid - - - (622) - (622)
Net cash used in financing activities (1,142,037) (215,541) (270,427) (134,109) (219,548) (1,981,662)
Net (decrease) / increase in cash and cash equivalents (115) 2,231 (68) 3,315 543 5,906
Cash and cash equivalents at the beginning of the period 10,508 4,920 300 6,012 316 22,056
Cash and cash equivalents at the end of the period 10,393 7,151 232 9,327 859 27,962
The annexed notes from 1 to 14 form an integral part of this condensed interim financial information.
CHIEF EXECUTIVE OFFICER CHIEF FINANCIAL OFFICER DIRECTOR
For UBL Fund Managers Limited
(Management Company)
----------------------------------------------(Rupees in '000) ---------------------------------------------------
Nine month period ended March 31, 2019
SDSD SD
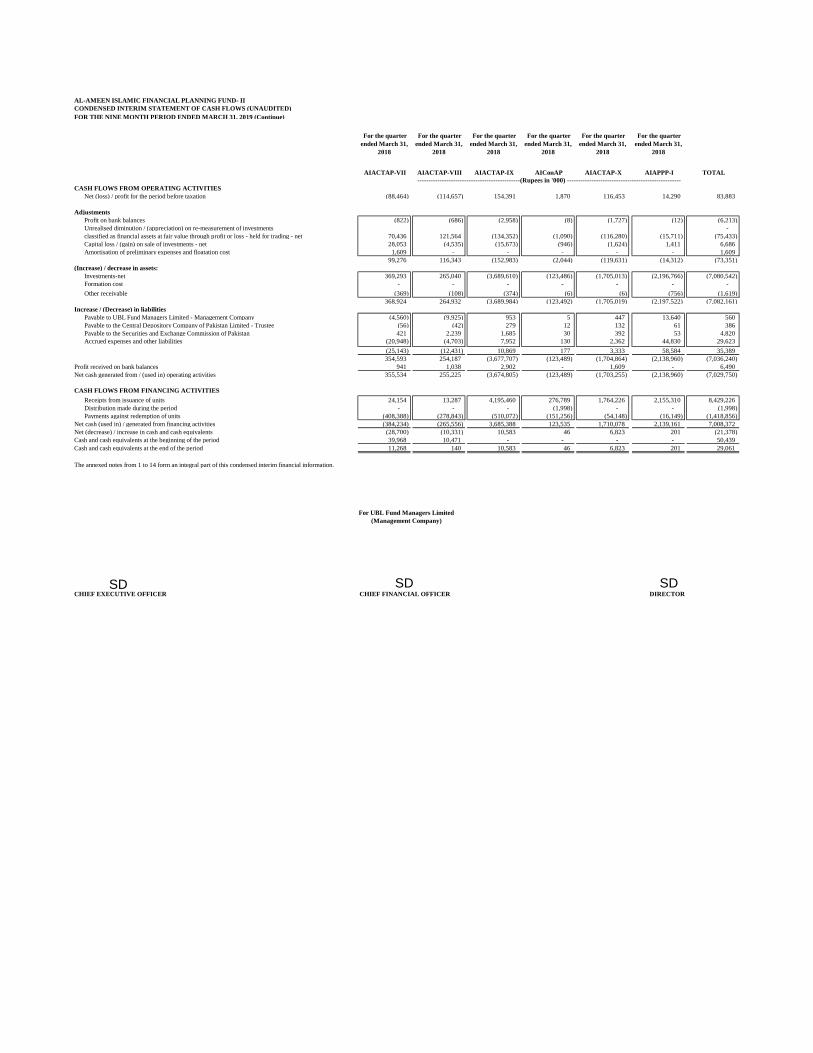
AL-AMEEN ISLAMIC FINANCIAL PLANNING FUND- II
CONDENSED INTERIM STATEMENT OF CASH FLOWS (UNAUDITED)
FOR THE NINE MONTH PERIOD ENDED MARCH 31, 2019 (Continue)
AIACTAP-VII AIACTAP-VIII AIACTAP-IX AIConAP AIACTAP-X AIAPPP-I TOTAL
CASH FLOWS FROM OPERATING ACTIVITIES
Net (loss) / profit for the period before taxation (88,464) (114,657) 154,391 1,870 116,453 14,290 83,883
Adjustments
Profit on bank balances (822) (686) (2,958) (8) (1,727) (12) (6,213)
Unrealised diminution / (appreciation) on re-measurement of investments -
classified as financial assets at fair value through profit or loss - held for trading - net 70,436 121,564 (134,352) (1,090) (116,280) (15,711) (75,433)
Capital loss / (gain) on sale of investments - net 28,053 (4,535) (15,673) (946) (1,624) 1,411 6,686
Amortisation of preliminary expenses and floatation cost 1,609 - - - - - 1,609
99,276 116,343 (152,983) (2,044) (119,631) (14,312) (73,351)
(Increase) / decrease in assets:
Investments-net 369,293 265,040 (3,689,610) (123,486) (1,705,013) (2,196,766) (7,080,542)
Formation cost - - - - - - -
Other receivable (369) (108) (374) (6) (6) (756) (1,619)
368,924 264,932 (3,689,984) (123,492) (1,705,019) (2,197,522) (7,082,161)
Increase / (Decrease) in liabilities
Payable to UBL Fund Managers Limited - Management Company (4,560) (9,925) 953 5 447 13,640 560
Payable to the Central Depository Company of Pakistan Limited - Trustee (56) (42) 279 12 132 61 386
Payable to the Securities and Exchange Commission of Pakistan 421 2,239 1,685 30 392 53 4,820
Accrued expenses and other liabilities (20,948) (4,703) 7,952 130 2,362 44,830 29,623
(25,143) (12,431) 10,869 177 3,333 58,584 35,389
354,593 254,187 (3,677,707) (123,489) (1,704,864) (2,138,960) (7,036,240)
Profit received on bank balances 941 1,038 2,902 - 1,609 - 6,490
Net cash generated from / (used in) operating activities 355,534 255,225 (3,674,805) (123,489) (1,703,255) (2,138,960) (7,029,750)
CASH FLOWS FROM FINANCING ACTIVITIES
Receipts from issuance of units 24,154 13,287 4,195,460 276,789 1,764,226 2,155,310 8,429,226
Distribution made during the period - - - (1,998) - - (1,998)
Payments against redemption of units (408,388) (278,843) (510,072) (151,256) (54,148) (16,149) (1,418,856)
Net cash (used in) / generated from financing activities (384,234) (265,556) 3,685,388 123,535 1,710,078 2,139,161 7,008,372
Net (decrease) / increase in cash and cash equivalents (28,700) (10,331) 10,583 46 6,823 201 (21,378)
Cash and cash equivalents at the beginning of the period 39,968 10,471 - - - - 50,439
Cash and cash equivalents at the end of the period 11,268 140 10,583 46 6,823 201 29,061
The annexed notes from 1 to 14 form an integral part of this condensed interim financial information.
CHIEF EXECUTIVE OFFICER CHIEF FINANCIAL OFFICER DIRECTOR
For UBL Fund Managers Limited
(Management Company)
For the quarter
ended March 31,
2018
For the quarter
ended March 31,
2018
For the quarter
ended March 31,
2018
For the quarter
ended March 31,
2018
For the quarter
ended March 31,
2018
----------------------------------------------(Rupees in '000) ---------------------------------------------------
For the quarter
ended March 31,
2018
SD SDSD
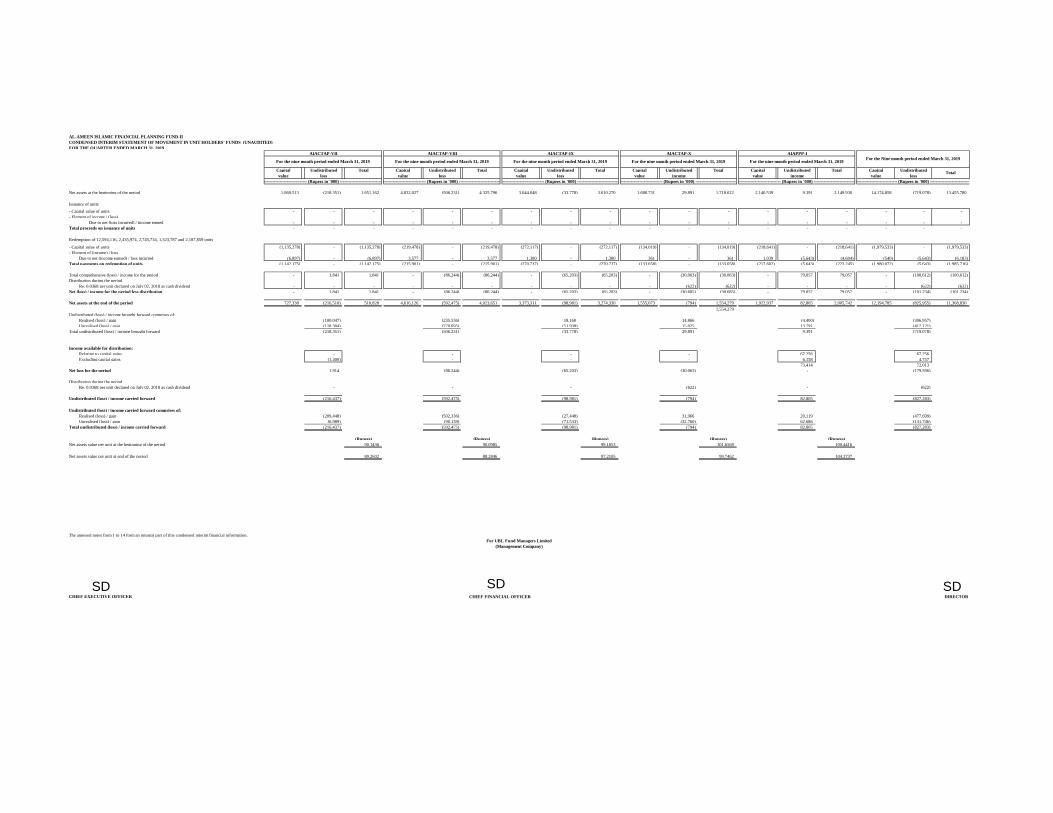
AL-AMEEN ISLAMIC FINANCIAL PLANNING FUND-II
CONDENSED INTERIM STATEMENT OF MOVEMENT IN UNIT HOLDERS' FUNDS (UNAUDITED)
FOR THE QUARTER ENDED MARCH 31, 2019
Capital Undistributed Total Capital Undistributed Total Capital Undistributed Total Capital Undistributed Total Capital Undistributed Total Capital Undistributed
value loss value loss value loss value income value income value loss
Net assets at the beginning of the period 1,869,513 (218,351) 1,651,162 4,832,027 (506,231) 4,325,796 3,644,048 (33,778) 3,610,270 1,688,731 29,891 1,718,622 2,140,539 9,391 2,149,930 14,174,858 (719,078) 13,455,780
Issuance of units
- Capital value of units - - - - - - - - - - - - - - - - - -
- Element of income / (loss)
Due to net (loss incurred) / income earned - - - - - - - - - - - - - - - - - -
Total proceeds on issuance of units - - - - - - - - - - - - - - - - - -
Redemption of 12,594,116, 2,435,974, 2,745,734, 1,323,787 and 2,187,859 units
- Capital value of units (1,135,278) - (1,135,278) (219,478) - (219,478) (272,117) - (272,117) (134,019) - (134,019) (218,641) - (218,641) (1,979,533) - (1,979,533)
- Element of (income) / loss
Due to net (income earned) / loss incurred (6,897) - (6,897) 3,577 - 3,577 1,380 - 1,380 361 - 361 1,039 (5,643) (4,604) (540) (5,643) (6,183)
Total payments on redemption of units (1,142,175) - (1,142,175) (215,901) - (215,901) (270,737) - (270,737) (133,658) - (133,658) (217,602) (5,643) (223,245) (1,980,072) (5,643) (1,985,716)
Total comprehensive (loss) / income for the period - 1,841 1,841 - (86,244) (86,244) - (65,203) (65,203) - (30,063) (30,063) - 79,057 79,057 - (100,612) (100,612)
Distribution during the period
Re. 0.0368 per unit declared on July 02, 2018 as cash dividend - - - - - - - - - - (622) (622) - - - - (622) (622)
Net (loss) / income for the period less distribution - 1,841 1,841 - (86,244) (86,244) - (65,203) (65,203) - (30,685) (30,685) - 79,057 79,057 - (101,234) (101,234)
Net assets at the end of the period 727,338 (216,510) 510,828 4,616,126 (592,475) 4,023,651 3,373,311 (98,981) 3,274,330 1,555,073 (794) 1,554,279 1,922,937 82,805 2,005,742 12,194,785 (825,955) 11,368,830
1,554,279
Undistributed (loss) / income brought forward comprises of:
Realised (loss) / gain (100,047) (235,536) 18,160 14,866 (4,400) (306,957)
Unrealised (loss) / gain (118,304) (270,695) (51,938) 15,025 13,791 (412,121)
Total undistributed (loss) / income brought forward (218,351) (506,231) (33,778) 29,891 9,391 (719,078)
Income available for distribution:
Relating to capital gains - - - - 67,256 67,256
Excluding capital gains (1,400) - - - 6,158 4,757
73,414 72,013
Net loss for the period 1,914 (86,244) (65,203) (30,063) - (179,596)
Distribution during the period
Re. 0.0368 per unit declared on July 02, 2018 as cash dividend - - - (622) - (622)
Undistributed (loss) / income carried forward (216,437) (592,475) (98,981) (794) 82,805 (827,283)
Undistributed (loss) / income carried forward comprises of:
Realised (loss) / gain (209,448) (502,336) (27,448) 31,966 20,119 (477,699)
Unrealised (loss) / gain (6,989) (90,139) (71,533) (32,760) 62,686 (131,746)
Total undistributed (loss) / income carried forward (216,437) (592,475) (98,981) (794) 82,805 (827,283)
(Rupees) (Rupees) (Rupees) (Rupees) (Rupees)
Net assets value per unit at the beginning of the period 90.1436 90.0985 99.1053 101.6568 100.4416
Net assets value per unit at end of the period 89.2602 88.2846 97.2105 99.7462 104.3737
The annexed notes from 1 to 14 form an integral part of this condensed interim financial information.
CHIEF EXECUTIVE OFFICER
AIACTAP-X
For the nine month period ended March 31, 2019 For the nine month period ended March 31, 2019 For the nine month period ended March 31, 2019
AIACTAP-VII AIACTAP-VIII AIACTAP-IX
CHIEF FINANCIAL OFFICER
------------------------------------------------- (Rupees in '000) -------------------------------------------------
DIRECTOR
For the nine month period ended March 31, 2019 For the nine month period ended March 31, 2019
Total
For the Nine month period ended March 31, 2019
For UBL Fund Managers Limited
(Management Company)
------------------------------------------------- (Rupees in '000) -------------------------------------------------------------------------------------------------- (Rupees in '000) -------------------------------------------------------------------------------------------------- (Rupees in '000) -------------------------------------------------------------------------------------------------- (Rupees in '000) -------------------------------------------------------------------------------------------------- (Rupees in '000) -------------------------------------------------
AIAPPP-I
SD SDSD
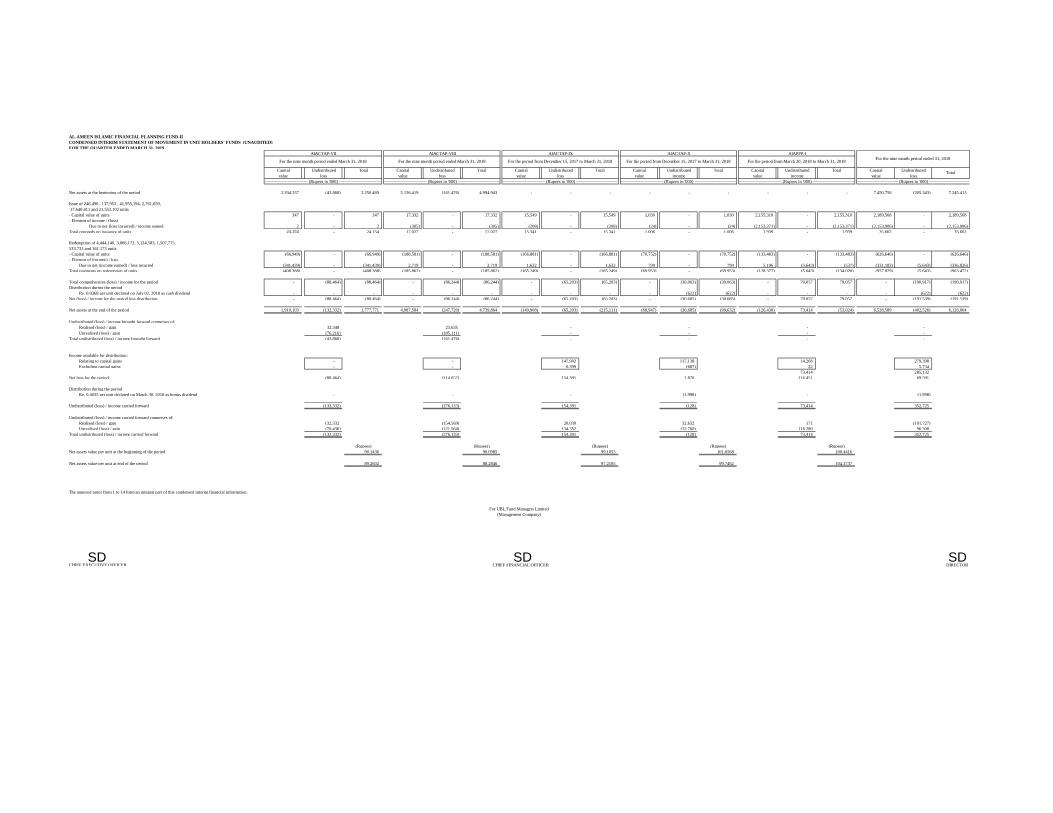
AL-AMEEN ISLAMIC FINANCIAL PLANNING FUND-II
CONDENSED INTERIM STATEMENT OF MOVEMENT IN UNIT HOLDERS' FUNDS (UNAUDITED)
FOR THE QUARTER ENDED MARCH 31, 2019
Capital Undistributed Total Capital Undistributed Total Capital Undistributed Total Capital Undistributed Total Capital Undistributed Total Capital Undistributed
value loss value loss value loss value income value income value loss
Net assets at the beginning of the period 2,294,337 (43,868) 2,250,469 5,156,419 (161,476) 4,994,943 - - - - - - - - - 7,450,756 (205,343) 7,245,413
Issue of 246,490 , 137,953 , 41,955,194, 2,761,659,
17,640,411 and 21,553,102 units
- Capital value of units 347 - 347 17,332 - 17,332 15,549 - 15,549 1,030 - 1,030 2,155,310 - 2,155,310 2,189,568 - 2,189,568
- Element of income / (loss)
Due to net (loss incurred) / income earned 2 - 2 (305) - (305) (208) - (208) (24) - (24) (2,153,371) - (2,153,371) (2,153,906) - (2,153,906)
Total proceeds on issuance of units 24,154 - 24,154 17,027 - 17,027 15,341 - 15,341 1,006 - 1,006 1,939 - 1,939 35,662 - 35,662
Redemption of 4,444,140, 3,066,172, 5,124,583, 1,507,775,
533,733 and 161,173 units
- Capital value of units (66,949) - (66,949) (188,581) - (188,581) (166,881) - (166,881) (70,752) - (70,752) (133,483) - (133,483) (626,646) - (626,646)
- Element of (income) / loss
Due to net (income earned) / loss incurred (341,439) - (341,439) 2,719 - 2,719 1,632 - 1,632 799 - 799 5,106 (5,643) (537) (331,183) (5,643) (336,826)
Total payments on redemption of units (408,388) - (408,388) (185,862) - (185,862) (165,249) - (165,249) (69,953) - (69,953) (128,377) (5,643) (134,020) (957,829) (5,643) (963,472)
Total comprehensive (loss) / income for the period - (88,464) (88,464) - (86,244) (86,244) - (65,203) (65,203) - (30,063) (30,063) - 79,057 79,057 - (190,917) (190,917)
Distribution during the period
Re. 0.0368 per unit declared on July 02, 2018 as cash dividend - - - - - - - - - - (622) (622) - - - - (622) (622)
Net (loss) / income for the period less distribution - (88,464) (88,464) - (86,244) (86,244) - (65,203) (65,203) - (30,685) (30,685) - 79,057 79,057 - (191,539) (191,539)
Net assets at the end of the period 1,910,103 (132,332) 1,777,771 4,987,584 (247,720) 4,739,864 (149,908) (65,203) (215,111) (68,947) (30,685) (99,632) (126,438) 73,414 (53,024) 6,528,589 (402,526) 6,126,064
Undistributed (loss) / income brought forward comprises of:
Realised (loss) / gain 32,348 23,635 - - - -
Unrealised (loss) / gain (76,216) (185,111) - - - -
Total undistributed (loss) / income brought forward (43,868) (161,476) - - - -
Income available for distribution:
Relating to capital gains - - 147,992 117,138 14,268 279,398
Excluding capital gains - - 6,399 (687) 22 5,734
73,414 285,132
Net loss for the period (88,464) (114,657) 154,391 1,870 116,451 69,591
Distribution during the period
Re. 0.4035 per unit declared on March 30, 2018 as bonus dividend - - - (1,998) - (1,998)
Undistributed (loss) / income carried forward (132,332) (276,133) 154,391 (128) 73,414 352,725
Undistributed (loss) / income carried forward comprises of:
Realised (loss) / gain 132,332 (154,569) 20,039 32,632 171 (101,727)
Unrealised (loss) / gain (70,436) (121,564) 134,352 (32,760) 116,280 96,308
Total undistributed (loss) / income carried forward (132,332) (276,133) 154,391 (128) 73,414 352,725
(Rupees) (Rupees) (Rupees) (Rupees) (Rupees)
Net assets value per unit at the beginning of the period 90.1436 90.0985 99.1053 101.6568 100.4416
Net assets value per unit at end of the period 89.2602 88.2846 97.2105 99.7462 104.3737
The annexed notes from 1 to 14 form an integral part of this condensed interim financial information.
CHIEF EXECUTIVE OFFICER
For the nine month period ended 31, 2018For the nine month period ended March 31, 2018 For the nine month period ended March 31, 2018 For the period from December 15, 2017 to March 31, 2018 For the period from December 15, 2017 to March 31, 2018 For the period from March 20, 2018 to March 31, 2018
AIACTAP-VII AIACTAP-VIII AIACTAP-IX AIACTAP-X AIAPPP-I
For UBL Fund Managers Limited
(Management Company)
DIRECTOR
Total
------------------------------------------------- (Rupees in '000) -------------------------------------------------------------------------------------------------- (Rupees in '000) -------------------------------------------------------------------------------------------------- (Rupees in '000) -------------------------------------------------------------------------------------------------- (Rupees in '000) -------------------------------------------------------------------------------------------------- (Rupees in '000) -------------------------------------------------------------------------------------------------- (Rupees in '000) -------------------------------------------------
CHIEF FINANCIAL OFFICERSD SD SD
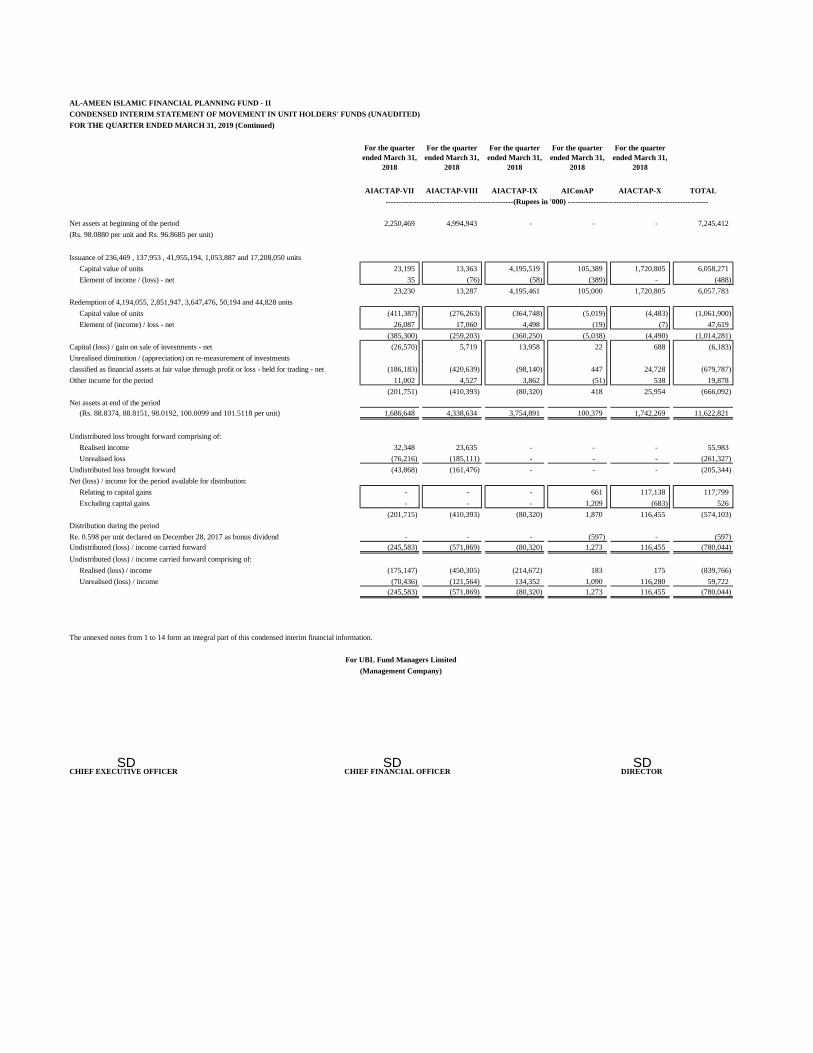
AL-AMEEN ISLAMIC FINANCIAL PLANNING FUND - II
CONDENSED INTERIM STATEMENT OF MOVEMENT IN UNIT HOLDERS' FUNDS (UNAUDITED)
FOR THE QUARTER ENDED MARCH 31, 2019 (Continued)
AIACTAP-VII AIACTAP-VIII AIACTAP-IX AIConAP AIACTAP-X TOTAL
Net assets at beginning of the period 2,250,469 4,994,943 - - - 7,245,412
(Rs. 98.0880 per unit and Rs. 96.8685 per unit)
Issuance of 236,469 , 137,953 , 41,955,194, 1,053,887 and 17,208,050 units
Capital value of units 23,195 13,363 4,195,519 105,389 1,720,805 6,058,271
Element of income / (loss) - net 35 (76) (58) (389) - (488)
23,230 13,287 4,195,461 105,000 1,720,805 6,057,783
Redemption of 4,194,055, 2,851,947, 3,647,476, 50,194 and 44,828 units
Capital value of units (411,387) (276,263) (364,748) (5,019) (4,483) (1,061,900)
Element of (income) / loss - net 26,087 17,060 4,498 (19) (7) 47,619
(385,300) (259,203) (360,250) (5,038) (4,490) (1,014,281)
Capital (loss) / gain on sale of investments - net (26,570) 5,719 13,958 22 688 (6,183)
Unrealised diminution / (appreciation) on re-measurement of investments
classified as financial assets at fair value through profit or loss - held for trading - net (186,183) (420,639) (98,140) 447 24,728 (679,787)
Other income for the period 11,002 4,527 3,862 (51) 538 19,878
(201,751) (410,393) (80,320) 418 25,954 (666,092)
Net assets at end of the period
(Rs. 88.8374, 88.8151, 98.0192, 100.0099 and 101.5118 per unit) 1,686,648 4,338,634 3,754,891 100,379 1,742,269 11,622,821
Undistributed loss brought forward comprising of:
Realised income 32,348 23,635 - - - 55,983
Unrealised loss (76,216) (185,111) - - - (261,327)
Undistributed loss brought forward (43,868) (161,476) - - - (205,344)
Net (loss) / income for the period available for distribution:
Relating to capital gains - - - 661 117,138 117,799
Excluding capital gains - - - 1,209 (683) 526
(201,715) (410,393) (80,320) 1,870 116,455 (574,103)
Distribution during the period
Re. 0.598 per unit declared on December 28, 2017 as bonus dividend - - - (597) - (597)
Undistributed (loss) / income carried forward (245,583) (571,869) (80,320) 1,273 116,455 (780,044)
Undistributed (loss) / income carried forward comprising of:
Realised (loss) / income (175,147) (450,305) (214,672) 183 175 (839,766)
Unrealised (loss) / income (70,436) (121,564) 134,352 1,090 116,280 59,722
(245,583) (571,869) (80,320) 1,273 116,455 (780,044)
The annexed notes from 1 to 14 form an integral part of this condensed interim financial information.
For UBL Fund Managers Limited
(Management Company)
CHIEF EXECUTIVE OFFICER CHIEF FINANCIAL OFFICER DIRECTOR
For the quarter
ended March 31,
2018
For the quarter
ended March 31,
2018
For the quarter
ended March 31,
2018
For the quarter
ended March 31,
2018
For the quarter
ended March 31,
2018
--------------------------------------------------(Rupees in '000) -------------------------------------------------------
SDSDSD
SDSD SD
NOTES TO AND FORMING PART OF CONDENSED INTERIM FINANCIAL INFORMATION (UNAUDITED)
FOR THE NINE MONTH PERIOD ENDED MARCH 31, 2019
1. LEGAL STATUS AND NATURE OF BUSINESS
1.1
1.2
1.3
1.4
1.5
1.6
1.7
AL-AMEEN ISLAMIC FINANCIAL PLANNING FUND- II
The Fund mainly makes investments in designated authorised investments approved by the Shariah Advisory Board and offers Shariah
Compliant returns to the investors. Under Circular 07 dated March 6, 2009 issued by the SECP, the Fund is categorised as Shariah
Compliant Fund of Funds.
Title to the assets of the Fund are held in the name of the CDC as the Trustee of the Fund.
The Management Company of the Fund is registered with the SECP as a Non-Banking Finance Company under the NBFC Rules.
Al Ameen Islamic Financial Planning Fund - II (the Fund) was established under the Non-Banking Finance Companies (Establishment
and Regulation) Rules, 2003 (the NBFC Rules) as an open-end mutual fund. It was constituted under the Trust Deed, dated August 29,
2016 between UBL Fund Managers Limited (a wholly owned subsidiary company of United Bank Limited) as the Management
Company, a company incorporated under repealed Companies Ordinance, 1984 (now Companies Act, 2017) and Central Depository
Company of Pakistan Limited (CDC) as the Trustee. The Trust Deed has also been approved by the Securities and Exchange
Commission of Pakistan (SECP). The registered office of the Management Company is situated at 4th floor, STSM Building,
Beaumont Road, Civil Lines, Karachi.
The brief description of the plans is as follows:
Al-Ameen Islamic Active Allocation Plan - VII (AIACTAP-VII) was due to mature on February 20, 2019. However, subsequent to the
period end, the Management Company of the Fund, vide 10th supplement to the offering document of the Fund issued on January 28,
2019, has extended the duration of AIACTAP-VII by one year till February 20, 2020. Al-Ameen Islamic Active Allocation Plan - VIII
(AIACTAP-VIII) is due to mature on May 29, 2019 unless the Management Company decides otherwise.
The Fund is an open ended shariah compliant fund of fund scheme and is listed on the Pakistan Stock Exchange Limited. The units of
Al-Ameen Islamic Active Allocation Plan - VII, Al-Ameen Islamic Active Allocation Plan - VIII, Al-Ameen Islamic Active Allocation
Plan - IX, Al-Ameen Islamic Active Allocation Plan - X and Al-Ameen Islamic Principal Preservation Plan-I of the Fund were initially
offered to public on February 14, 2017, May 19, 2017, August 25, 2017, December 8, 2017, November 8, 2017 and March 19, 2018
respectively. Subsequent to the Initial Public Offering, the offer of Units of the Allocation Plans at the Initial Offer Price is
discontinued. The Units of the Allocation Plans could then be purchased at their Offer price and redeemed at the Redemption Price,
which shall be calculated on the basis of Net Asset Value (NAV) of each Allocation Plan. The units are transferable and can be
redeemed by surrendering them to the Fund at the option of unit holder. The Fund consists of multiple plans and aims to generate return
for investors in line with their risk tolerance level. The duration of the Fund is perpetual however the allocation plans have a standard
time frame of two years except Al-Ameen Islamic Principal Preservation Plan-I (AIAPPP-I) having duration of two and a half years.
Each Allocation Plan announces separate NAVs which rank pari passu inter se according to its number of Units. Units are offered for
public subscription on a continuous basis.
1.8
Al-Ameen Islamic Active Allocation Plan - VII (AIACTAP-VII)
Al-Ameen Islamic Principal Preservation Plan-I (AIAPPP-I)
JCR-VIS Credit Rating Company has re-affirmed an asset manager quality rating of 'AM1' (stable outlook) to the Management
Company as on December 27, 2018.
An Islamic Principal Preservation plan with an objective to earn a potentially high return through dynamic asset allocation between
Islamic Equity, Islamic Sovereign Income and Islamic Money Market based collective investment schemes, while providing principal
preservation of the initial investment value including front end load at completion of twenty four months and beyond till maturity of the
plan. Investment segment of the Plan may invest upto 50% in Islamic Equity Scheme(s) category, 100% in Islamic Money
Marker/Sovereign Income Scheme(s) and 10% in Cash in Islamic Windows Account.
An Islamic allocation plan with an objective to earn potentially high returns through active asset allocation between Islamic Equity
scheme(s) and Islamic Income scheme(s). The Management Company actively manages the allocations, from time to time, based on the
outlook for the asset-classes and may invest up to 100% in Islamic Equity, Islamic Income and Islamic Money Market schemes. The un-
invested amounts or funds, if any, shall be kept in cash and/ or near cash instruments where near cash instruments include cash in
Islamic Bank and/ or Islamic Banking windows of conventional bank account (excluding TDRs) with rating not lower than AA- (AA
minus) or any other rating allowed by the SECP from time to time.
An Islamic allocation plan with an objective to earn potentially high returns through active asset allocation between Islamic Equity
scheme(s) and Islamic Income scheme(s). The Management Company actively manages the allocations, from time to time, based on the
outlook for the asset-classes and may invest up to 95% in Islamic Equity, 95% in Islamic Income and 5% to 100% in Islamic Money
Market schemes. The un-invested amounts or funds, if any, shall be kept in cash and/ or near cash instruments where near cash
instruments include cash in Islamic Bank and/ or Islamic Banking windows of conventional bank account (excluding TDRs) with
rating not lower than AA- (AA minus) or any other rating allowed by the SECP from time to time.
Al-Ameen Islamic Active Allocation Plan - VIII (AIACTAP-VIII)
Al-Ameen Islamic Active Allocation Plan - IX (AIACTAP-IX)
Al-Ameen Islamic Active Allocation Plan - X (AIACTAP-X)
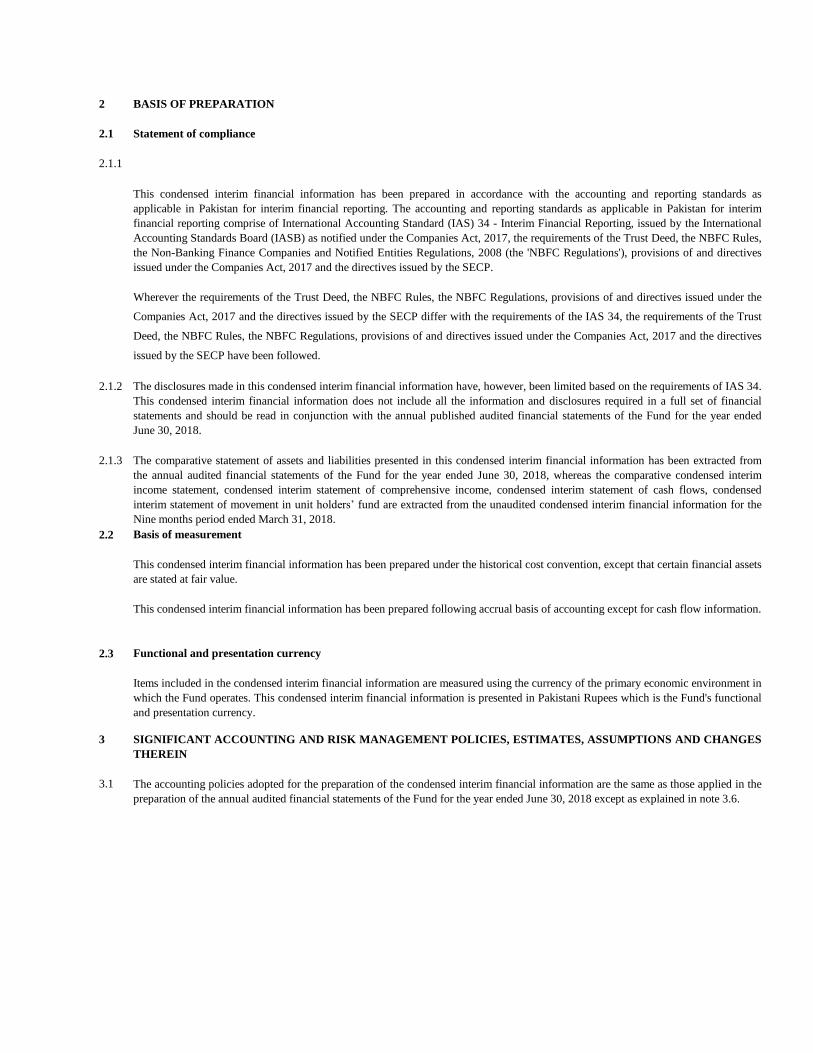
2 BASIS OF PREPARATION
2.1 Statement of compliance
2.1.1
2.1.2
2.1.3
2.2 Basis of measurement
2.3 Functional and presentation currency
3
3.1
This condensed interim financial information has been prepared in accordance with the accounting and reporting standards as
applicable in Pakistan for interim financial reporting. The accounting and reporting standards as applicable in Pakistan for interim
financial reporting comprise of International Accounting Standard (IAS) 34 - Interim Financial Reporting, issued by the International
Accounting Standards Board (IASB) as notified under the Companies Act, 2017, the requirements of the Trust Deed, the NBFC Rules,
the Non-Banking Finance Companies and Notified Entities Regulations, 2008 (the 'NBFC Regulations'), provisions of and directives
issued under the Companies Act, 2017 and the directives issued by the SECP.
The disclosures made in this condensed interim financial information have, however, been limited based on the requirements of IAS 34.
This condensed interim financial information does not include all the information and disclosures required in a full set of financial
statements and should be read in conjunction with the annual published audited financial statements of the Fund for the year ended
June 30, 2018.
Wherever the requirements of the Trust Deed, the NBFC Rules, the NBFC Regulations, provisions of and directives issued under the
Companies Act, 2017 and the directives issued by the SECP differ with the requirements of the IAS 34, the requirements of the Trust
Deed, the NBFC Rules, the NBFC Regulations, provisions of and directives issued under the Companies Act, 2017 and the directives
issued by the SECP have been followed.
SIGNIFICANT ACCOUNTING AND RISK MANAGEMENT POLICIES, ESTIMATES, ASSUMPTIONS AND CHANGES
THEREIN
The accounting policies adopted for the preparation of the condensed interim financial information are the same as those applied in the
preparation of the annual audited financial statements of the Fund for the year ended June 30, 2018 except as explained in note 3.6.
Items included in the condensed interim financial information are measured using the currency of the primary economic environment in
which the Fund operates. This condensed interim financial information is presented in Pakistani Rupees which is the Fund's functional
and presentation currency.
This condensed interim financial information has been prepared under the historical cost convention, except that certain financial assets
are stated at fair value.
This condensed interim financial information has been prepared following accrual basis of accounting except for cash flow information.
The comparative statement of assets and liabilities presented in this condensed interim financial information has been extracted from
the annual audited financial statements of the Fund for the year ended June 30, 2018, whereas the comparative condensed interim
income statement, condensed interim statement of comprehensive income, condensed interim statement of cash flows, condensed
interim statement of movement in unit holders’ fund are extracted from the unaudited condensed interim financial information for the
Nine months period ended March 31, 2018.
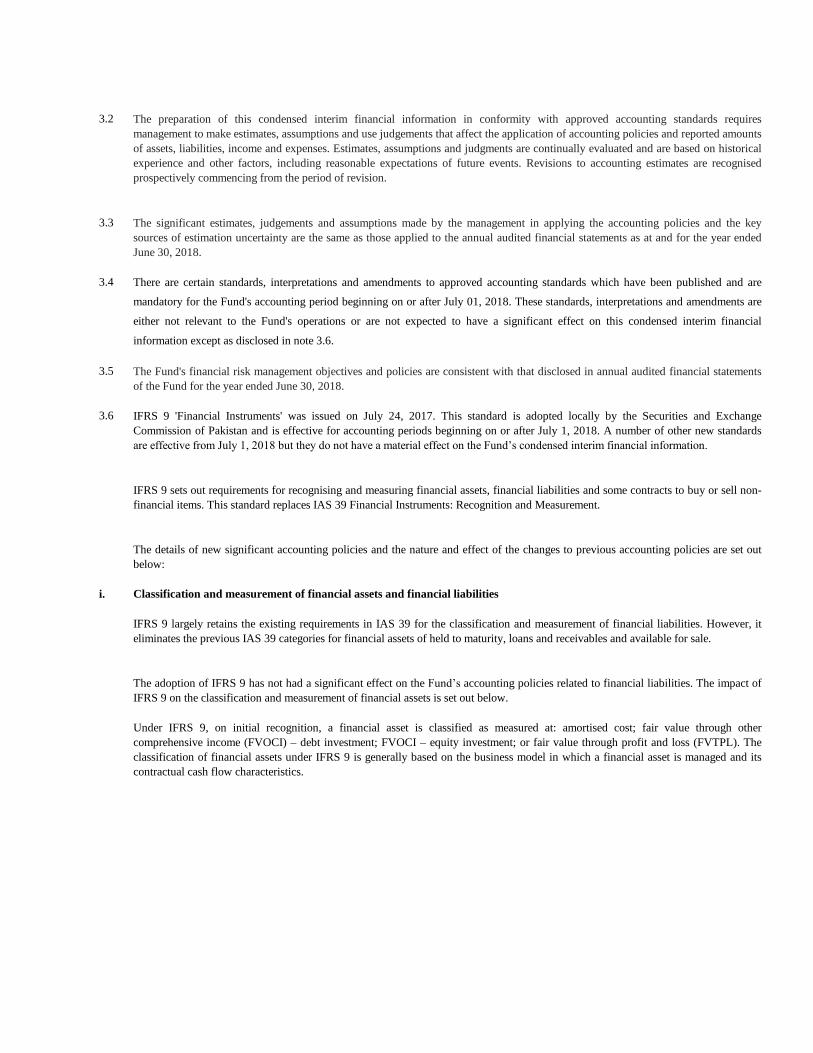
3.2
3.3
3.4
3.5
3.6
i. Classification and measurement of financial assets and financial liabilities
IFRS 9 'Financial Instruments' was issued on July 24, 2017. This standard is adopted locally by the Securities and Exchange
Commission of Pakistan and is effective for accounting periods beginning on or after July 1, 2018. A number of other new standards
are effective from July 1, 2018 but they do not have a material effect on the Fund’s condensed interim financial information.
There are certain standards, interpretations and amendments to approved accounting standards which have been published and are
mandatory for the Fund's accounting period beginning on or after July 01, 2018. These standards, interpretations and amendments are
either not relevant to the Fund's operations or are not expected to have a significant effect on this condensed interim financial
information except as disclosed in note 3.6.
The Fund's financial risk management objectives and policies are consistent with that disclosed in annual audited financial statements
of the Fund for the year ended June 30, 2018.
IFRS 9 largely retains the existing requirements in IAS 39 for the classification and measurement of financial liabilities. However, it
eliminates the previous IAS 39 categories for financial assets of held to maturity, loans and receivables and available for sale.
The preparation of this condensed interim financial information in conformity with approved accounting standards requires
management to make estimates, assumptions and use judgements that affect the application of accounting policies and reported amounts
of assets, liabilities, income and expenses. Estimates, assumptions and judgments are continually evaluated and are based on historical
experience and other factors, including reasonable expectations of future events. Revisions to accounting estimates are recognised
prospectively commencing from the period of revision.
The significant estimates, judgements and assumptions made by the management in applying the accounting policies and the key
sources of estimation uncertainty are the same as those applied to the annual audited financial statements as at and for the year ended
June 30, 2018.
The adoption of IFRS 9 has not had a significant effect on the Fund’s accounting policies related to financial liabilities. The impact of
IFRS 9 on the classification and measurement of financial assets is set out below.
Under IFRS 9, on initial recognition, a financial asset is classified as measured at: amortised cost; fair value through other
comprehensive income (FVOCI) – debt investment; FVOCI – equity investment; or fair value through profit and loss (FVTPL). The
classification of financial assets under IFRS 9 is generally based on the business model in which a financial asset is managed and its
contractual cash flow characteristics.
IFRS 9 sets out requirements for recognising and measuring financial assets, financial liabilities and some contracts to buy or sell non-
financial items. This standard replaces IAS 39 Financial Instruments: Recognition and Measurement.
The details of new significant accounting policies and the nature and effect of the changes to previous accounting policies are set out
below:
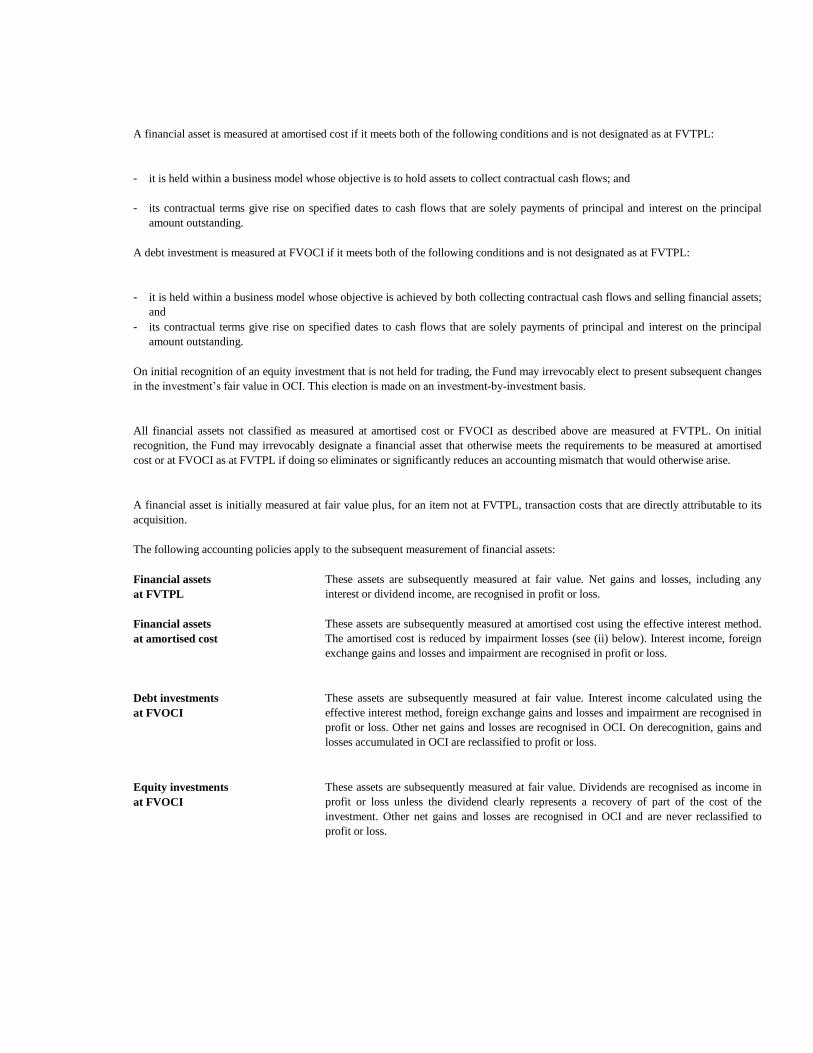
-
-
-
-
The following accounting policies apply to the subsequent measurement of financial assets:
Financial assets
at FVTPL
Financial assets
at amortised cost
Debt investments
at FVOCI
Equity investments
at FVOCI
it is held within a business model whose objective is to hold assets to collect contractual cash flows; and
its contractual terms give rise on specified dates to cash flows that are solely payments of principal and interest on the principal
amount outstanding.
A debt investment is measured at FVOCI if it meets both of the following conditions and is not designated as at FVTPL:
On initial recognition of an equity investment that is not held for trading, the Fund may irrevocably elect to present subsequent changes
in the investment’s fair value in OCI. This election is made on an investment-by-investment basis.
All financial assets not classified as measured at amortised cost or FVOCI as described above are measured at FVTPL. On initial
recognition, the Fund may irrevocably designate a financial asset that otherwise meets the requirements to be measured at amortised
cost or at FVOCI as at FVTPL if doing so eliminates or significantly reduces an accounting mismatch that would otherwise arise.
A financial asset is initially measured at fair value plus, for an item not at FVTPL, transaction costs that are directly attributable to its
acquisition.
These assets are subsequently measured at fair value. Net gains and losses, including any
interest or dividend income, are recognised in profit or loss.
These assets are subsequently measured at amortised cost using the effective interest method.
The amortised cost is reduced by impairment losses (see (ii) below). Interest income, foreign
exchange gains and losses and impairment are recognised in profit or loss.
it is held within a business model whose objective is achieved by both collecting contractual cash flows and selling financial assets;
and
its contractual terms give rise on specified dates to cash flows that are solely payments of principal and interest on the principal
amount outstanding.
Under IFRS 9, on initial recognition, a financial asset is classified as measured at: amortised cost; fair value through other
comprehensive income (FVOCI) – debt investment; FVOCI – equity investment; or fair value through profit and loss (FVTPL). The
classification of financial assets under IFRS 9 is generally based on the business model in which a financial asset is managed and its
contractual cash flow characteristics.
A financial asset is measured at amortised cost if it meets both of the following conditions and is not designated as at FVTPL:
These assets are subsequently measured at fair value. Interest income calculated using the
effective interest method, foreign exchange gains and losses and impairment are recognised in
profit or loss. Other net gains and losses are recognised in OCI. On derecognition, gains and
losses accumulated in OCI are reclassified to profit or loss.
These assets are subsequently measured at fair value. Dividends are recognised as income in
profit or loss unless the dividend clearly represents a recovery of part of the cost of the
investment. Other net gains and losses are recognised in OCI and are never reclassified to
profit or loss.
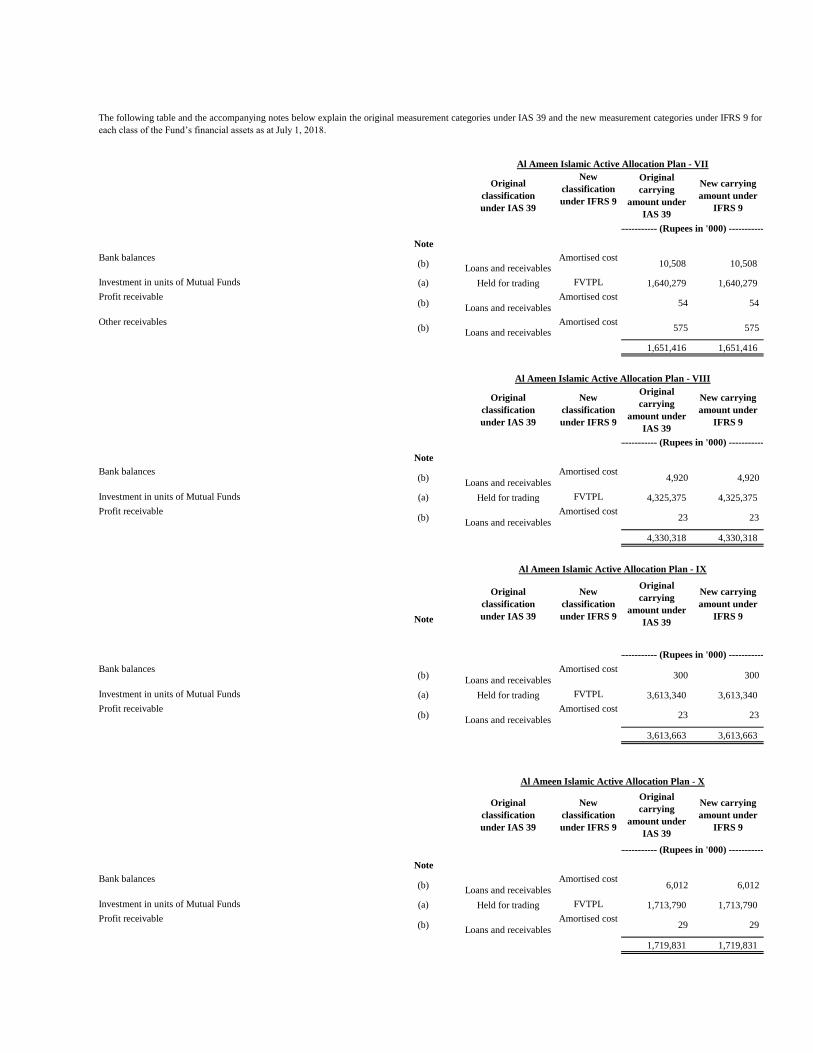
New
classification
under IFRS 9
Note
Bank balances(b)
Loans and receivablesAmortised cost
10,508 10,508
Investment in units of Mutual Funds (a) Held for trading FVTPL 1,640,279 1,640,279
Profit receivable(b)
Loans and receivables
Amortised cost 54 54
Other receivables(b)
Loans and receivablesAmortised cost
575 575
1,651,416 1,651,416
Note
Bank balances(b)
Loans and receivables
Amortised cost 4,920 4,920
Investment in units of Mutual Funds (a) Held for trading FVTPL 4,325,375 4,325,375
Profit receivable(b)
Loans and receivables
Amortised cost 23 23
4,330,318 4,330,318
Note
Bank balances(b)
Loans and receivables
Amortised cost 300 300
Investment in units of Mutual Funds (a) Held for trading FVTPL 3,613,340 3,613,340
Profit receivable(b)
Loans and receivables
Amortised cost 23 23
3,613,663 3,613,663
Note
Bank balances(b)
Loans and receivables
Amortised cost 6,012 6,012
Investment in units of Mutual Funds (a) Held for trading FVTPL 1,713,790 1,713,790
Profit receivable(b)
Loans and receivables
Amortised cost 29 29
1,719,831 1,719,831
The following table and the accompanying notes below explain the original measurement categories under IAS 39 and the new measurement categories under IFRS 9 for
each class of the Fund’s financial assets as at July 1, 2018.
Al Ameen Islamic Active Allocation Plan - IX
---------------------------------------------------------- (Rupees in '000) ----------------------------------------------------------
New carrying
amount under
IFRS 9
Original
classification
under IAS 39
Original
carrying
amount under
IAS 39
---------------------------------------------------------- (Rupees in '000) ----------------------------------------------------------
Al Ameen Islamic Active Allocation Plan - VII
Original
classification
under IAS 39
New
classification
under IFRS 9
---------------------------------------------------------- (Rupees in '000) ----------------------------------------------------------
Original
carrying
amount under
IAS 39
New carrying
amount under
IFRS 9
Al Ameen Islamic Active Allocation Plan - VIII
Original
classification
under IAS 39
New
classification
under IFRS 9
Original
carrying
amount under
IAS 39
New carrying
amount under
IFRS 9
---------------------------------------------------------- (Rupees in '000) ----------------------------------------------------------
Al Ameen Islamic Active Allocation Plan - X
Original
classification
under IAS 39
New carrying
amount under
IFRS 9
New
classification
under IFRS 9
Original
carrying
amount under
IAS 39
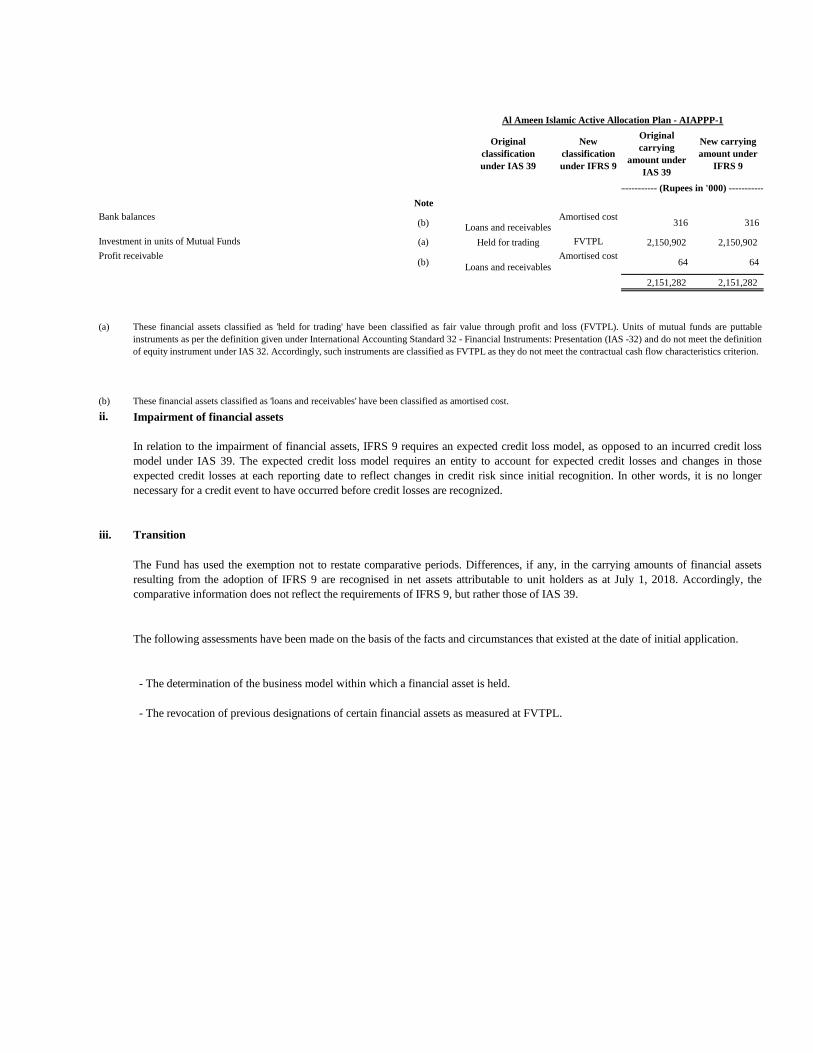
Note
Bank balances(b)
Loans and receivablesAmortised cost
316 316
Investment in units of Mutual Funds (a) Held for trading FVTPL 2,150,902 2,150,902
Profit receivable(b)
Loans and receivables
Amortised cost 64 64
2,151,282 2,151,282
(a)
(b)
ii.
iii. Transition
- The determination of the business model within which a financial asset is held.
- The revocation of previous designations of certain financial assets as measured at FVTPL.
The Fund has used the exemption not to restate comparative periods. Differences, if any, in the carrying amounts of financial assets
resulting from the adoption of IFRS 9 are recognised in net assets attributable to unit holders as at July 1, 2018. Accordingly, the
comparative information does not reflect the requirements of IFRS 9, but rather those of IAS 39.
The following assessments have been made on the basis of the facts and circumstances that existed at the date of initial application.
Impairment of financial assets
In relation to the impairment of financial assets, IFRS 9 requires an expected credit loss model, as opposed to an incurred credit loss
model under IAS 39. The expected credit loss model requires an entity to account for expected credit losses and changes in those
expected credit losses at each reporting date to reflect changes in credit risk since initial recognition. In other words, it is no longer
necessary for a credit event to have occurred before credit losses are recognized.
Al Ameen Islamic Active Allocation Plan - AIAPPP-1
These financial assets classified as 'held for trading' have been classified as fair value through profit and loss (FVTPL). Units of mutual funds are puttable
instruments as per the definition given under International Accounting Standard 32 - Financial Instruments: Presentation (IAS -32) and do not meet the definition
of equity instrument under IAS 32. Accordingly, such instruments are classified as FVTPL as they do not meet the contractual cash flow characteristics criterion.
These financial assets classified as 'loans and receivables' have been classified as amortised cost.
Original
classification
under IAS 39
New
classification
under IFRS 9
Original
carrying
amount under
IAS 39
New carrying
amount under
IFRS 9
---------------------------------------------------------- (Rupees in '000) ----------------------------------------------------------
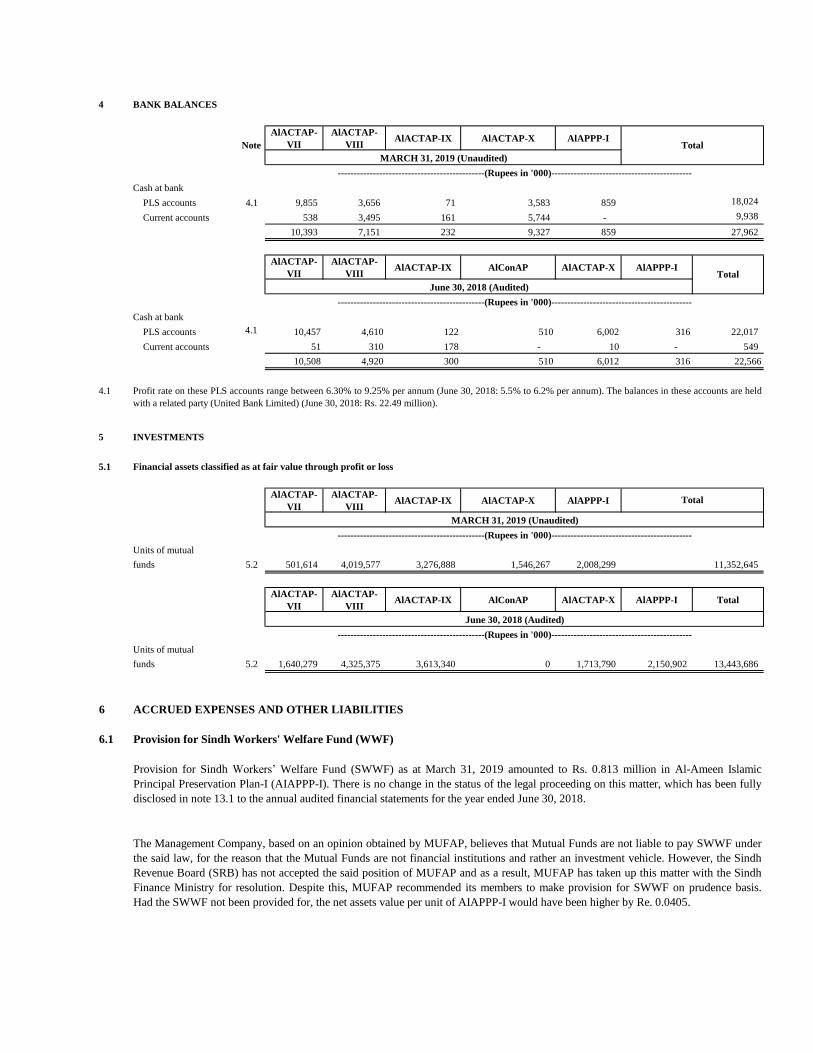
4 BANK BALANCES
AlACTAP-
VII
AlACTAP-
VIIIAlACTAP-IX AlACTAP-X AlAPPP-I
Cash at bank
PLS accounts 4.1 9,855 3,656 71 3,583 859
Current accounts 538 3,495 161 5,744 -
10,393 7,151 232 9,327 859
AlACTAP-
VII
AlACTAP-
VIIIAlACTAP-IX AlConAP AlACTAP-X AlAPPP-I
Cash at bank
PLS accounts 4.1 10,457 4,610 122 510 6,002 316 22,017
Current accounts 51 310 178 - 10 - 549
10,508 4,920 300 510 6,012 316 22,566
4.1
5 INVESTMENTS
5.1 Financial assets classified as at fair value through profit or loss
AlACTAP-
VII
AlACTAP-
VIIIAlACTAP-IX AlACTAP-X AlAPPP-I
Units of mutual
funds 5.2 501,614 4,019,577 3,276,888 1,546,267 2,008,299
AlACTAP-
VII
AlACTAP-
VIIIAlACTAP-IX AlConAP AlACTAP-X AlAPPP-I Total
Units of mutual
funds 5.2 1,640,279 4,325,375 3,613,340 0 1,713,790 2,150,902 13,443,686
6 ACCRUED EXPENSES AND OTHER LIABILITIES
6.1 Provision for Sindh Workers' Welfare Fund (WWF)
The Management Company, based on an opinion obtained by MUFAP, believes that Mutual Funds are not liable to pay SWWF under
the said law, for the reason that the Mutual Funds are not financial institutions and rather an investment vehicle. However, the Sindh
Revenue Board (SRB) has not accepted the said position of MUFAP and as a result, MUFAP has taken up this matter with the Sindh
Finance Ministry for resolution. Despite this, MUFAP recommended its members to make provision for SWWF on prudence basis.
Had the SWWF not been provided for, the net assets value per unit of AIAPPP-I would have been higher by Re. 0.0405.
Provision for Sindh Workers’ Welfare Fund (SWWF) as at March 31, 2019 amounted to Rs. 0.813 million in Al-Ameen Islamic
Principal Preservation Plan-I (AIAPPP-I). There is no change in the status of the legal proceeding on this matter, which has been fully
disclosed in note 13.1 to the annual audited financial statements for the year ended June 30, 2018.
Total
MARCH 31, 2019 (Unaudited)
Note
----------------------------------------------(Rupees in '000)--------------------------------------------
Profit rate on these PLS accounts range between 6.30% to 9.25% per annum (June 30, 2018: 5.5% to 6.2% per annum). The balances in these accounts are held
with a related party (United Bank Limited) (June 30, 2018: Rs. 22.49 million).
27,962
Total
June 30, 2018 (Audited)
11,352,645
June 30, 2018 (Audited)
----------------------------------------------(Rupees in '000)--------------------------------------------
Total
MARCH 31, 2019 (Unaudited)
----------------------------------------------(Rupees in '000)--------------------------------------------
----------------------------------------------(Rupees in '000)--------------------------------------------
18,024
9,938
7 CONTINGENCIES AND COMMITMENTS
8 TAXATION
9 EARNINGS PER UNIT
10 TOTAL EXPENSE RATIO
11 TRANSACTIONS WITH RELATED PARTIES / CONNECTED PERSONS
The Fund's income is exempt from Income Tax as per clause (99) of Part I of the Second Schedule to the Income Tax Ordinance, 2001
subject to the condition that not less than 90% of the accounting income for the year as reduced by capital gains whether realised or
unrealised is distributed to the unit holders in the form of cash. The Fund is also exempt from the provisions of section 113 (minimum
tax) under clause 11A of Part IV of the Second Schedule to the Income Tax Ordinance, 2001.The Management Company intends to
distribute by way of cash dividend at least 90% of the Fund's accounting income as reduced by capital gains (whether realised or
unrealised) for the year ending June 30, 2019 to its unit holders, accordingly, no provision for taxation has been recognized in this
condensed interim financial information.
As per Directive 23 of 2016 dated July 20, 2016 issued by Securities and Exchange Commission of Pakistan, the total expense ratio as
on March 31, 2019 of AlACTAP-VII, AlACTAP-VIII, AlACTAP-IX, AlACTAP-X and AIAPPP-I is 0.32%, 0.20%, 0.20%, 0.21%
and 0.28% respectively and this includes 0.07%, 0.06%, 0.06%, 0.06% and 0.14% respectively representing Government levy, Sindh
Workers' Welfare Fund and SECP fee.
Connected persons / related parties comprise of United Bank Limited (holding Company of Management Company), UBL Fund
Managers Limited (Management Company), Al-Ameen Islamic Financial Services (Private) Limited (Subsidiary of the Management
Company), entities under common management or directorships, Central Depository Company of Pakistan Limited (Trustee) and the
Directors and Officers of Management Company.
Remuneration to the Management Company and the trustee is determined in accordance with the provision of NBFC Rules, NBFC
Regulations and the Trust Deed respectively. Other transactions with the related parties / connected persons have been carried out at
agreed / commercial terms.
There were no contingencies and commitments outstanding as at March 31, 2019 and June 30, 2018.
Earnings per unit (EPU) has not been disclosed in this condensed interim financial information as in the opinion of the Management
Company the determination of the cumulative weighted average number of outstanding units is not practicable.
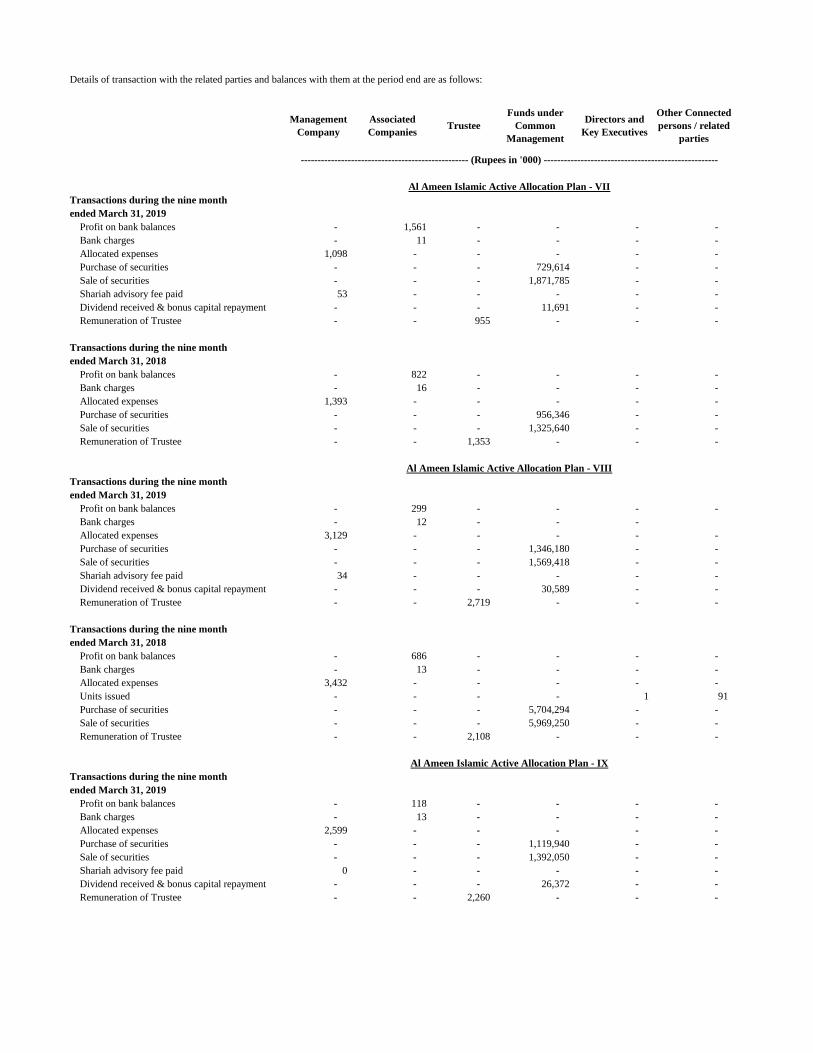
Details of transaction with the related parties and balances with them at the period end are as follows:
Transactions during the nine month
ended March 31, 2019
Profit on bank balances - 1,561 - - - -
Bank charges - 11 - - - -
Allocated expenses 1,098 - - - - -
Purchase of securities - - - 729,614 - -
Sale of securities - - - 1,871,785 - -
Shariah advisory fee paid 53 - - - - -
Dividend received & bonus capital repayment - - - 11,691 - -
Remuneration of Trustee - - 955 - - -
Transactions during the nine month
ended March 31, 2018
Profit on bank balances - 822 - - - -
Bank charges - 16 - - - -
Allocated expenses 1,393 - - - - -
Purchase of securities - - - 956,346 - -
Sale of securities - - - 1,325,640 - -
Remuneration of Trustee - - 1,353 - - -
Transactions during the nine month
ended March 31, 2019
Profit on bank balances - 299 - - - -
Bank charges - 12 - - -
Allocated expenses 3,129 - - - - -
Purchase of securities - - - 1,346,180 - -
Sale of securities - - - 1,569,418 - -
Shariah advisory fee paid 34 - - - - -
Dividend received & bonus capital repayment - - - 30,589 - -
Remuneration of Trustee - - 2,719 - - -
Transactions during the nine month
ended March 31, 2018
Profit on bank balances - 686 - - - -
Bank charges - 13 - - - -
Allocated expenses 3,432 - - - - -
Units issued - - - - 1 91
Purchase of securities - - - 5,704,294 - -
Sale of securities - - - 5,969,250 - -
Remuneration of Trustee - - 2,108 - - -
Transactions during the nine month
ended March 31, 2019
Profit on bank balances - 118 - - - -
Bank charges - 13 - - - -
Allocated expenses 2,599 - - - - -
Purchase of securities - - - 1,119,940 - -
Sale of securities - - - 1,392,050 - -
Shariah advisory fee paid 0 - - - - -
Dividend received & bonus capital repayment - - - 26,372 - -
Remuneration of Trustee - - 2,260 - - -
Other Connected
persons / related
parties
Management
Company
Associated
Companies Trustee
Funds under
Common
Management
Directors and
Key Executives
-------------------------------------------------- (Rupees in '000) ----------------------------------------------------
Al Ameen Islamic Active Allocation Plan - VIII
Al Ameen Islamic Active Allocation Plan - VII
Al Ameen Islamic Active Allocation Plan - IX
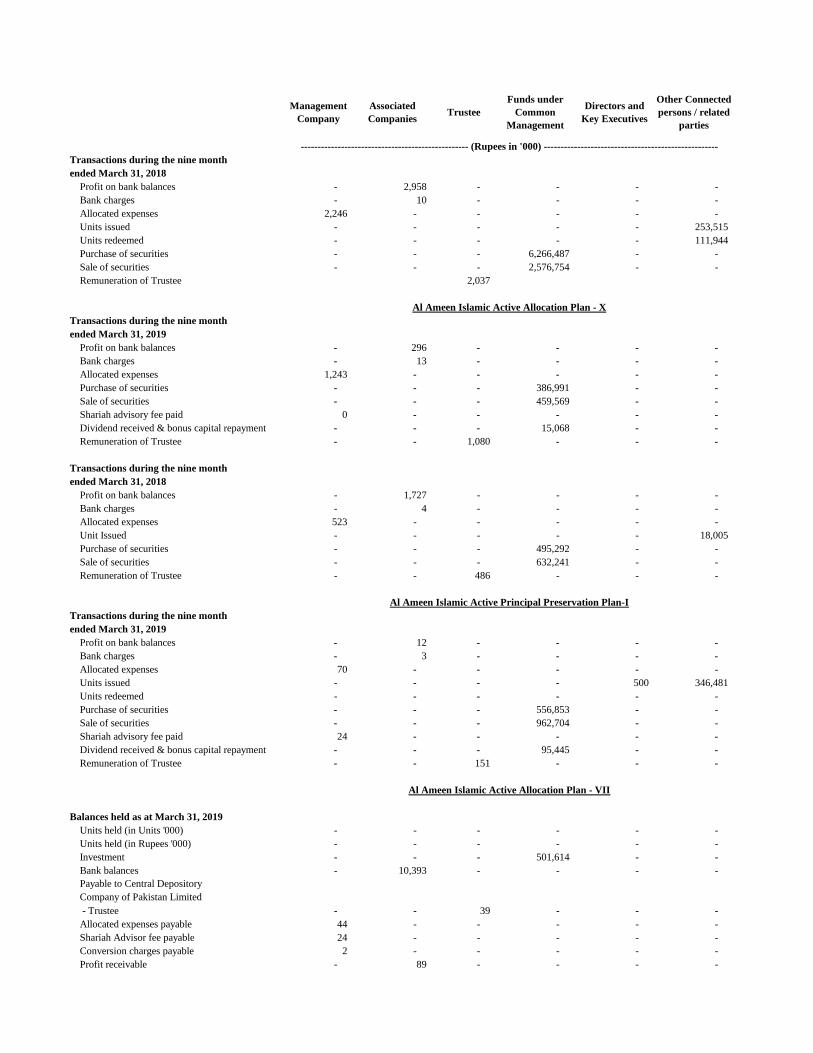
Transactions during the nine month
ended March 31, 2018
Profit on bank balances - 2,958 - - - -
Bank charges - 10 - - - -
Allocated expenses 2,246 - - - - -
Units issued - - - - - 253,515
Units redeemed - - - - - 111,944
Purchase of securities - - - 6,266,487 - -
Sale of securities - - - 2,576,754 - -
Remuneration of Trustee 2,037
Transactions during the nine month
ended March 31, 2019
Profit on bank balances - 296 - - - -
Bank charges - 13 - - - -
Allocated expenses 1,243 - - - - -
Purchase of securities - - - 386,991 - -
Sale of securities - - - 459,569 - -
Shariah advisory fee paid 0 - - - - -
Dividend received & bonus capital repayment - - - 15,068 - -
Remuneration of Trustee - - 1,080 - - -
Transactions during the nine month
ended March 31, 2018
Profit on bank balances - 1,727 - - - -
Bank charges - 4 - - - -
Allocated expenses 523 - - - - -
Unit Issued - - - - - 18,005
Purchase of securities - - - 495,292 - -
Sale of securities - - - 632,241 - -
Remuneration of Trustee - - 486 - - -
Transactions during the nine month
ended March 31, 2019
Profit on bank balances - 12 - - - -
Bank charges - 3 - - - -
Allocated expenses 70 - - - - -
Units issued - - - - 500 346,481
Units redeemed - - - - - -
Purchase of securities - - - 556,853 - -
Sale of securities - - - 962,704 - -
Shariah advisory fee paid 24 - - - - -
Dividend received & bonus capital repayment - - - 95,445 - -
Remuneration of Trustee - - 151 - - -
Balances held as at March 31, 2019
Units held (in Units '000) - - - - - -
Units held (in Rupees '000) - - - - - -
Investment - - - 501,614 - -
Bank balances - 10,393 - - - -
- Trustee - - 39 - - -
Allocated expenses payable 44 - - - - -
Shariah Advisor fee payable 24 - - - - -
Conversion charges payable 2 - - - - -
Profit receivable - 89 - - - -
Al Ameen Islamic Active Principal Preservation Plan-I
Al Ameen Islamic Active Allocation Plan - VII
Payable to Central Depository
Company of Pakistan Limited
Al Ameen Islamic Active Allocation Plan - X
Management
Company
Associated
Companies Trustee
Funds under
Common
Management
Directors and
Key Executives
Other Connected
persons / related
parties
-------------------------------------------------- (Rupees in '000) ----------------------------------------------------
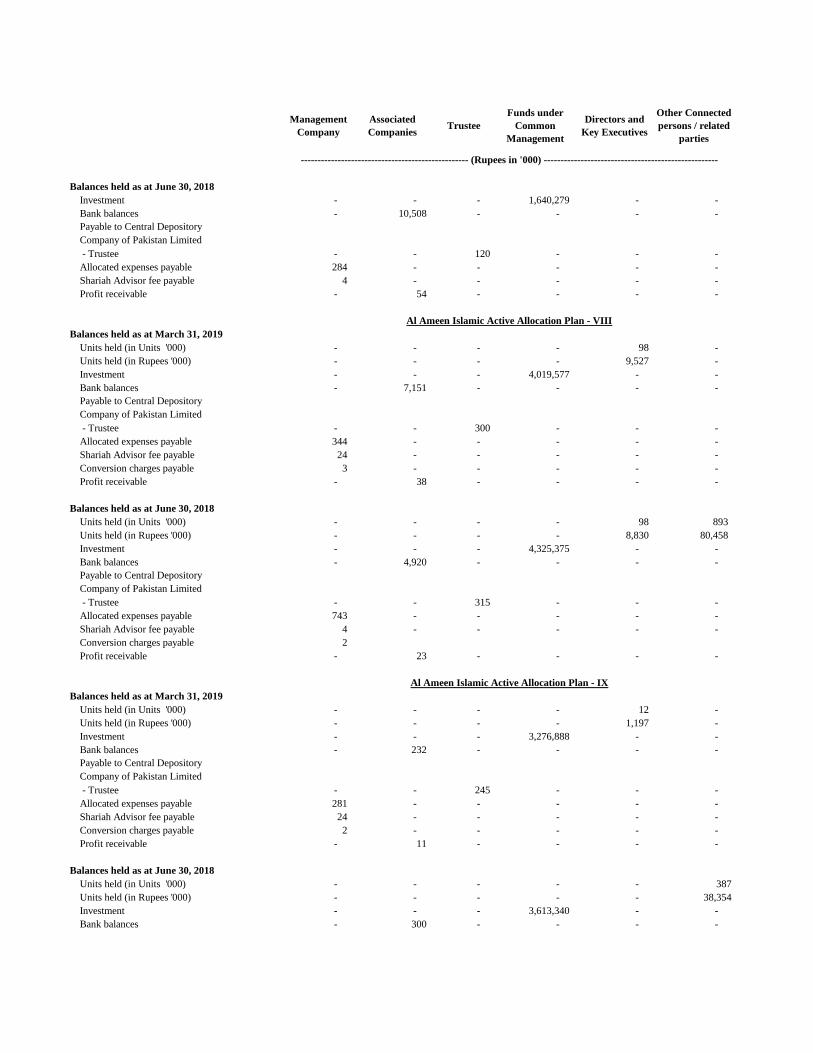
Balances held as at June 30, 2018
Investment - - - 1,640,279 - -
Bank balances - 10,508 - - - -
- Trustee - - 120 - - -
Allocated expenses payable 284 - - - - -
Shariah Advisor fee payable 4 - - - - -
Profit receivable - 54 - - - -
Balances held as at March 31, 2019
Units held (in Units '000) - - - - 98 -
Units held (in Rupees '000) - - - - 9,527 -
Investment - - - 4,019,577 - -
Bank balances - 7,151 - - - -
- Trustee - - 300 - - -
Allocated expenses payable 344 - - - - -
Shariah Advisor fee payable 24 - - - - -
Conversion charges payable 3 - - - - -
Profit receivable - 38 - - - -
Balances held as at June 30, 2018
Units held (in Units '000) - - - - 98 893
Units held (in Rupees '000) - - - - 8,830 80,458
Investment - - - 4,325,375 - -
Bank balances - 4,920 - - - -
- Trustee - - 315 - - -
Allocated expenses payable 743 - - - - -
Shariah Advisor fee payable 4 - - - - -
Conversion charges payable 2
Profit receivable - 23 - - - -
Balances held as at March 31, 2019
Units held (in Units '000) - - - - 12 -
Units held (in Rupees '000) - - - - 1,197 -
Investment - - - 3,276,888 - -
Bank balances - 232 - - - -
- Trustee - - 245 - - -
Allocated expenses payable 281 - - - - -
Shariah Advisor fee payable 24 - - - - -
Conversion charges payable 2 - - - - -
Profit receivable - 11 - - - -
Balances held as at June 30, 2018
Units held (in Units '000) - - - - - 387
Units held (in Rupees '000) - - - - - 38,354
Investment - - - 3,613,340 - -
Bank balances - 300 - - - -
Company of Pakistan Limited
Payable to Central Depository
Al Ameen Islamic Active Allocation Plan - VIII
Management
Company
Associated
Companies Trustee
Funds under
Common
Management
Directors and
Key Executives
Other Connected
persons / related
parties
-------------------------------------------------- (Rupees in '000) ----------------------------------------------------
Company of Pakistan Limited
Payable to Central Depository
Company of Pakistan Limited
Payable to Central Depository
Company of Pakistan Limited
Al Ameen Islamic Active Allocation Plan - IX
Payable to Central Depository
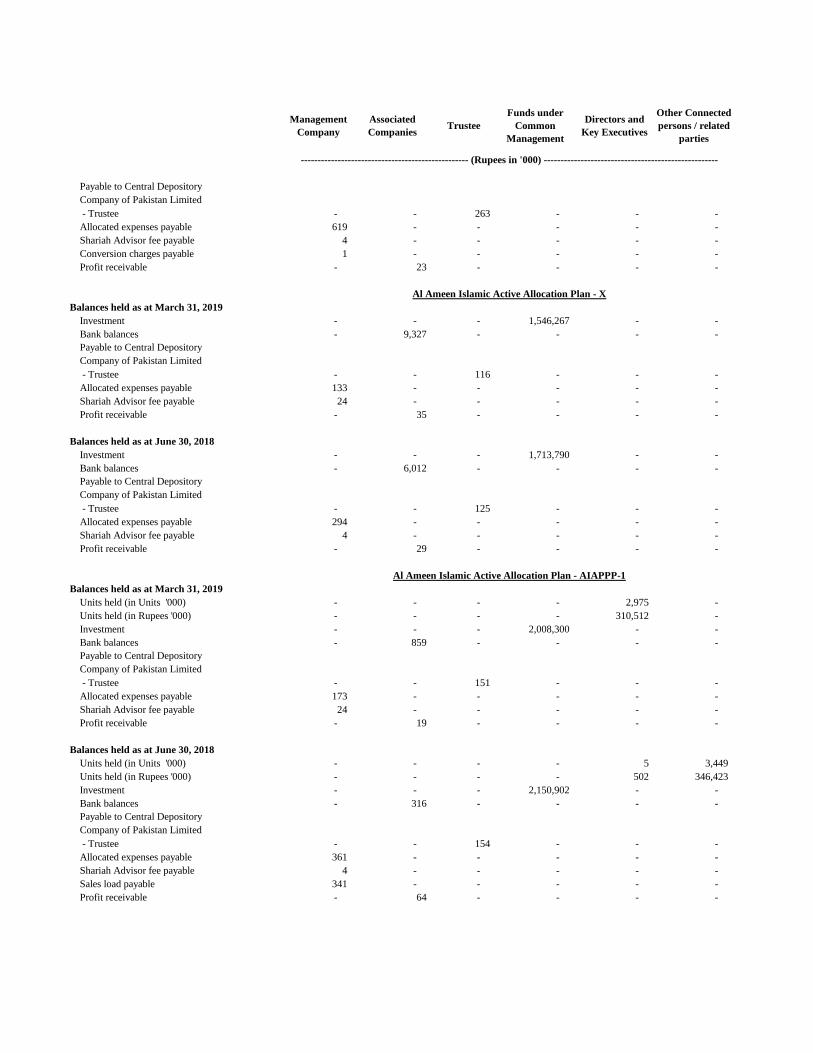
- Trustee - - 263 - - -
Allocated expenses payable 619 - - - - -
Shariah Advisor fee payable 4 - - - - -
Conversion charges payable 1 - - - - -
Profit receivable - 23 - - - -
Balances held as at March 31, 2019
Investment - - - 1,546,267 - -
Bank balances - 9,327 - - - -
- Trustee - - 116 - - -
Allocated expenses payable 133 - - - - -
Shariah Advisor fee payable 24 - - - - -
Profit receivable - 35 - - - -
Balances held as at June 30, 2018
Investment - - - 1,713,790 - -
Bank balances - 6,012 - - - -
- Trustee - - 125 - - -
Allocated expenses payable 294 - - - - -
Shariah Advisor fee payable 4 - - - - -
Profit receivable - 29 - - - -
Balances held as at March 31, 2019
Units held (in Units '000) - - - - 2,975 -
Units held (in Rupees '000) - - - - 310,512 -
Investment - - - 2,008,300 - -
Bank balances - 859 - - - -
- Trustee - - 151 - - -
Allocated expenses payable 173 - - - - -
Shariah Advisor fee payable 24 - - - - -
Profit receivable - 19 - - - -
Balances held as at June 30, 2018
Units held (in Units '000) - - - - 5 3,449
Units held (in Rupees '000) - - - - 502 346,423
Investment - - - 2,150,902 - -
Bank balances - 316 - - - -
- Trustee - - 154 - - -
Allocated expenses payable 361 - - - - -
Shariah Advisor fee payable 4 - - - - -
Sales load payable 341 - - - - -
Profit receivable - 64 - - - -
Directors and
Key Executives
Other Connected
persons / related
parties
Company of Pakistan Limited
Payable to Central Depository
Management
Company
Associated
Companies Trustee
-------------------------------------------------- (Rupees in '000) ----------------------------------------------------
Al Ameen Islamic Active Allocation Plan - X
Payable to Central Depository
Company of Pakistan Limited
Company of Pakistan Limited
Payable to Central Depository
Funds under
Common
Management
Company of Pakistan Limited
Payable to Central Depository
Company of Pakistan Limited
Payable to Central Depository
Al Ameen Islamic Active Allocation Plan - AIAPPP-1
12 FAIR VALUE OF FINANCIAL INSTRUMENTS
-
-
-
12.1
12.2 Transfers during the period
Inputs for the asset or liability that are not based on observable market data (that is, unobservable inputs) (level 3).
The Fund has not disclosed the fair values for financial assets and financial liabilities that are not carried at fair value, as these are either
short term in nature or repriced periodically. Therefore, their carrying amounts are reasonable approximation of fair value.
Inputs other than quoted prices included within level 1 that are observable for the asset or liability, either directly (that is, as prices)
or indirectly (that is, derived from prices) (level 2).
Fair value is the price that would be received to sell an asset or paid or transfer a liability in an orderly transaction between market
participants and measurement date. Consequently, differences can arise between carrying values and the fair value estimates.
The fair value of financial assets and liabilities traded in active markets i.e. listed equity shares are based on the quoted market prices at
the close of trading on the reporting date. The quoted market price used for financial assets held by the Fund is current bid price.
A financial instrument is regarded as quoted in an active market if quoted prices are readily and regularly available from an exchange,
dealer, broker, industry group, pricing service, or regulatory agency, and those prices represent actual and regularly occurring market
transactions on an arm’s length basis.
No transfers were made between various levels of fair value hierarchy during the period.
International Financial Reporting Standard (IFRS) 13, "Fair Value Measurement" requires the Fund to classify fair value measurements
using a fair value hierarchy that reflects the significance of the inputs used in making the measurements. The fair value hierarchy has
the following levels:
Quoted prices (unadjusted) in active markets for identical assets or liabilities (level 1).
Underlying the definition of fair value is the presumption that the Fund is a going concern without any intention or requirement to
curtail materially the scale of its operations or to undertake a transaction on adverse terms.
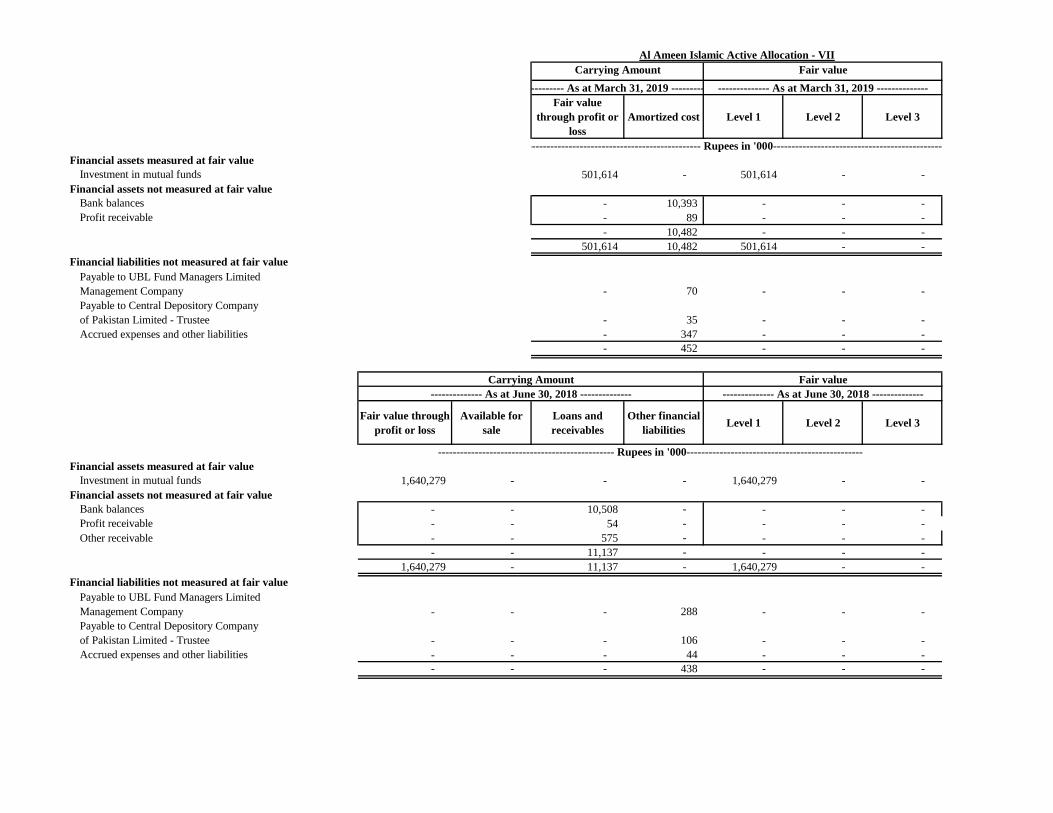
Fair value
through profit or
loss
Amortized cost Level 1 Level 2 Level 3
Financial assets measured at fair value
Investment in mutual funds 501,614 - 501,614 - -
Financial assets not measured at fair value
Bank balances - 10,393 - - -
Profit receivable - 89 - - -
- 10,482 - - -
501,614 10,482 501,614 - -
Financial liabilities not measured at fair value
Payable to UBL Fund Managers Limited
Management Company - 70 - - -
Payable to Central Depository Company
of Pakistan Limited - Trustee - 35 - - -
Accrued expenses and other liabilities - 347 - - -
- 452 - - -
Fair value through
profit or loss
Available for
sale
Loans and
receivables
Other financial
liabilitiesLevel 1 Level 2 Level 3
Financial assets measured at fair value
Investment in mutual funds 1,640,279 - - - 1,640,279 - -
Financial assets not measured at fair value
Bank balances - - 10,508 - - - -
Profit receivable - - 54 - - - -
Other receivable - - 575 - - - -
- - 11,137 - - - -
1,640,279 - 11,137 - 1,640,279 - -
Financial liabilities not measured at fair value
Payable to UBL Fund Managers Limited
Management Company - - - 288 - - -
Payable to Central Depository Company
of Pakistan Limited - Trustee - - - 106 - - -
Accrued expenses and other liabilities - - - 44 - - -
- - - 438 - - -
Fair value
Al Ameen Islamic Active Allocation - VII
-------------- As at March 31, 2019 --------------
Fair value
-------------- As at June 30, 2018 --------------
Carrying Amount
-------------- As at June 30, 2018 --------------
------------------------------------------------ Rupees in '000------------------------------------------------
-------------- As at March 31, 2019 --------------
Carrying Amount
------------------------------------------------ Rupees in '000------------------------------------------------
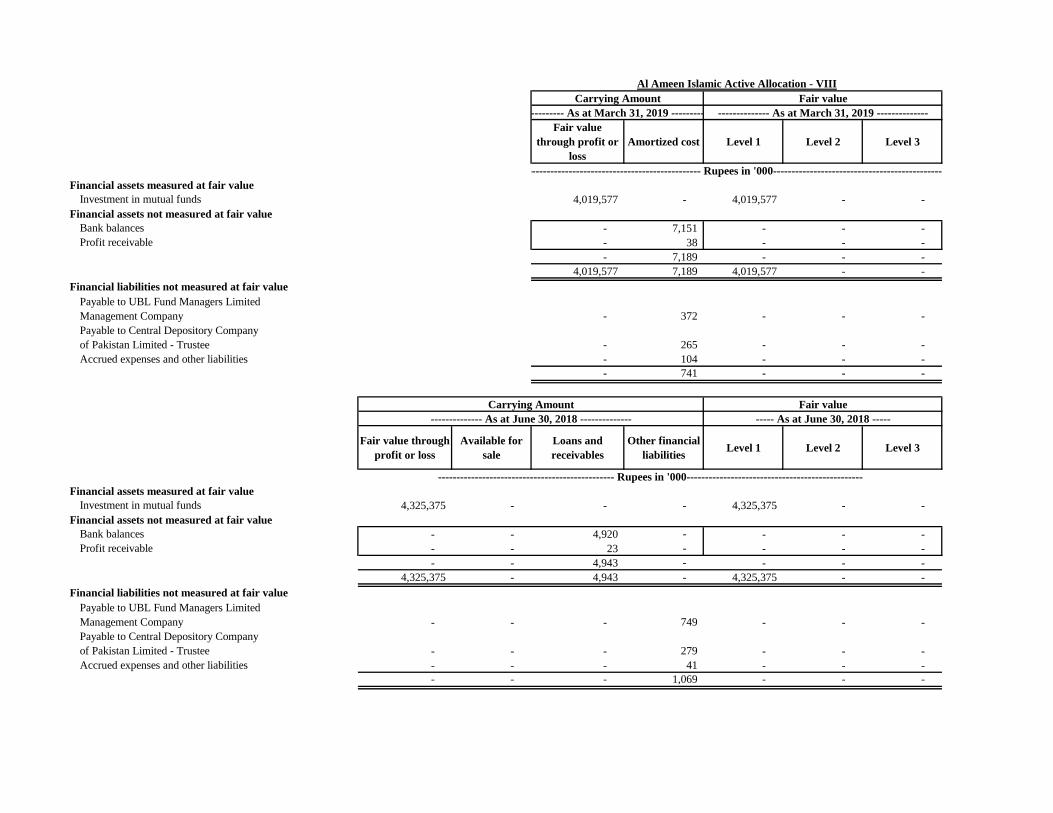
Fair value
through profit or
loss
Amortized cost Level 1 Level 2 Level 3
Financial assets measured at fair value
Investment in mutual funds 4,019,577 - 4,019,577 - -
Financial assets not measured at fair value
Bank balances - 7,151 - - -
Profit receivable - 38 - - -
- 7,189 - - -
4,019,577 7,189 4,019,577 - -
Financial liabilities not measured at fair value
Payable to UBL Fund Managers Limited
Management Company - 372 - - -
Payable to Central Depository Company
of Pakistan Limited - Trustee - 265 - - -
Accrued expenses and other liabilities - 104 - - -
- 741 - - -
Fair value through
profit or loss
Available for
sale
Loans and
receivables
Other financial
liabilitiesLevel 1 Level 2 Level 3
Financial assets measured at fair value
Investment in mutual funds 4,325,375 - - - 4,325,375 - -
Financial assets not measured at fair value
Bank balances - - 4,920 - - - -
Profit receivable - - 23 - - - -
- - 4,943 - - - -
4,325,375 - 4,943 - 4,325,375 - -
Financial liabilities not measured at fair value
Payable to UBL Fund Managers Limited
Management Company - - - 749 - - -
Payable to Central Depository Company
of Pakistan Limited - Trustee - - - 279 - - -
Accrued expenses and other liabilities - - - 41 - - -
- - - 1,069 - - -
Carrying Amount
-------------- As at June 30, 2018 --------------
------------------------------------------------ Rupees in '000------------------------------------------------
-------------- As at March 31, 2019 --------------
Fair value
----- As at June 30, 2018 -----
Al Ameen Islamic Active Allocation - VIII
Carrying Amount
-------------- As at March 31, 2019 --------------
------------------------------------------------ Rupees in '000------------------------------------------------
Fair value

Fair value
through profit or
loss
Amortized cost Level 1 Level 2 Level 3
Financial assets measured at fair value
Investment in mutual funds 3,276,888 - 3,276,888 - -
Financial assets not measured at fair value
Bank balances - 232 - - -
Profit receivable - 11 - - -
- 243 - - -
3,276,888 243 3,276,888 - -
Financial liabilities not measured at fair value
Payable to UBL Fund Managers Limited
Management Company - 306 - - -
Payable to Central Depository Company
of Pakistan Limited - Trustee - 217 - - -
Accrued expenses and other liabilities - 307 - - -
- 830 - - -
Fair value through
profit or loss
Available for
sale
Loans and
receivables
Other financial
liabilitiesLevel 1 Level 2 Level 3
Financial assets measured at fair value
Investment in mutual funds 3,613,340 - - - 3,613,340 - -
Financial assets not measured at fair value
Bank balances - - 300 - - - -
Profit receivable - - 23 - - - -
- - 323 - - - -
3,613,340 - 323 - 3,613,340 - -
Financial liabilities not measured at fair value
Payable to UBL Fund Managers Limited
Management Company - - - 624 - - -
Payable to Central Depository Company
of Pakistan Limited - Trustee - - - 233 - - -
Accrued expenses and other liabilities - - - 117 - - -
- - - 974 - - -
Fair value
----- As at June 30, 2018 -----
Carrying Amount
------------------------------------------------ Rupees in '000------------------------------------------------
Al Ameen Islamic Active Allocation - IX
Carrying Amount
-------------- As at March 31, 2019 --------------
Fair value
-------------- As at March 31, 2019 --------------
-------------- As at June 30, 2018 --------------
------------------------------------------------ Rupees in '000------------------------------------------------
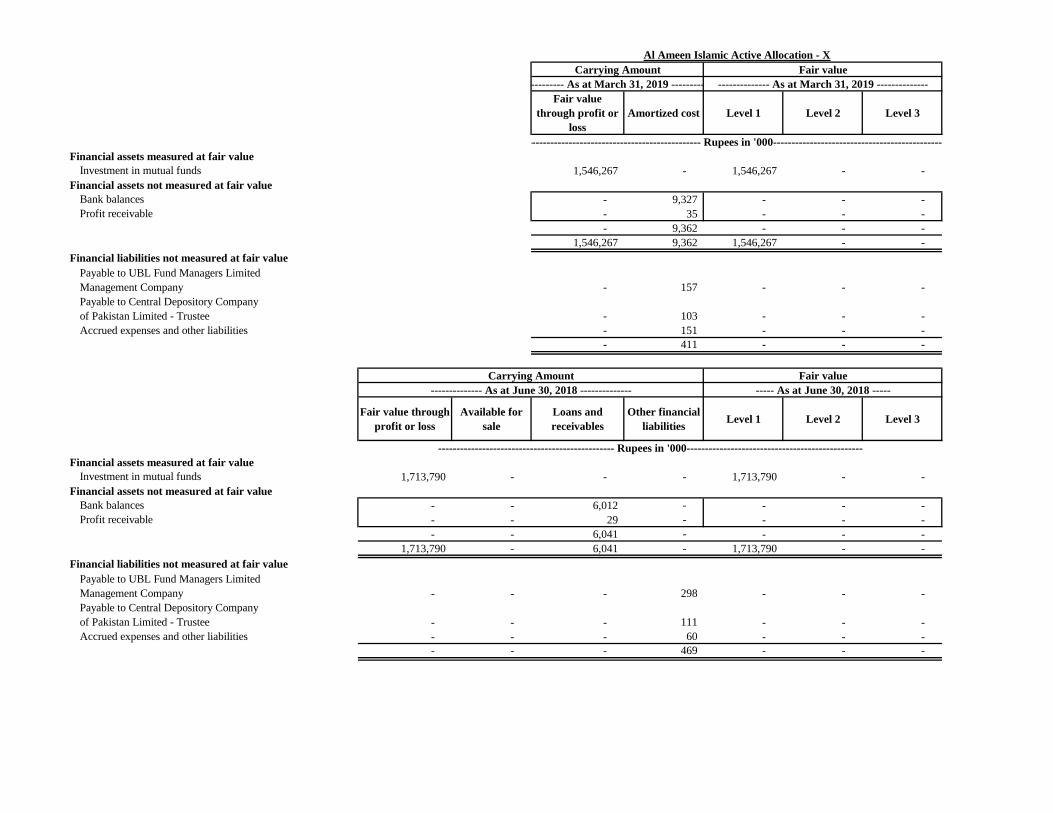
Fair value
through profit or
loss
Amortized cost Level 1 Level 2 Level 3
Financial assets measured at fair value
Investment in mutual funds 1,546,267 - 1,546,267 - -
Financial assets not measured at fair value
Bank balances - 9,327 - - -
Profit receivable - 35 - - -
- 9,362 - - -
1,546,267 9,362 1,546,267 - -
Financial liabilities not measured at fair value
Payable to UBL Fund Managers Limited
Management Company - 157 - - -
Payable to Central Depository Company
of Pakistan Limited - Trustee - 103 - - -
Accrued expenses and other liabilities - 151 - - -
- 411 - - -
Fair value through
profit or loss
Available for
sale
Loans and
receivables
Other financial
liabilitiesLevel 1 Level 2 Level 3
Financial assets measured at fair value
Investment in mutual funds 1,713,790 - - - 1,713,790 - -
Financial assets not measured at fair value
Bank balances - - 6,012 - - - -
Profit receivable - - 29 - - - -
- - 6,041 - - - -
1,713,790 - 6,041 - 1,713,790 - -
Financial liabilities not measured at fair value
Payable to UBL Fund Managers Limited
Management Company - - - 298 - - -
Payable to Central Depository Company
of Pakistan Limited - Trustee - - - 111 - - -
Accrued expenses and other liabilities - - - 60 - - -
- - - 469 - - -
Fair value
------------------------------------------------ Rupees in '000------------------------------------------------
-------------- As at June 30, 2018 --------------
Carrying Amount
------------------------------------------------ Rupees in '000------------------------------------------------
-------------- As at March 31, 2019 --------------
Carrying Amount
Al Ameen Islamic Active Allocation - X
-------------- As at March 31, 2019 --------------
Fair value
----- As at June 30, 2018 -----

Fair value
through profit or
loss
Amortized cost Level 1 Level 2 Level 3
Financial assets measured at fair value
Investment in mutual funds 2,008,299 - 2,008,299 - -
Financial assets not measured at fair value
Bank balances - 859 - - -
Profit receivable - 19 - - -
- 878 - - -
2,008,299 878 2,008,299 - -
Financial liabilities not measured at fair value
Payable to UBL Fund Managers Limited
Management Company - 197 - - -
Payable to Central Depository Company
of Pakistan Limited - Trustee - 134 - - -
Accrued expenses and other liabilities - 1,938 - - -
- 2,269 - - -
Fair value through
profit or loss
Available for
sale
Loans and
receivables
Other financial
liabilitiesLevel 1 Level 2 Level 3
Financial assets measured at fair value
Investment in mutual funds 2,150,902 - - - 2,150,902 - -
Financial assets not measured at fair value
Bank balances - - 316 - - - -
Profit receivable - - 64 - - - -
- - 380 - - - -
2,150,902 - 380 - 2,150,902 - -
Financial liabilities not measured at fair value
Payable to UBL Fund Managers Limited
Management Company - - - 706 - - -
Payable to Central Depository Company
of Pakistan Limited - Trustee - - - 136 - - -
Accrued expenses and other liabilities - - - 36 - - -
- - - 878 - - -
Fair value
----- As at June 30, 2018 -----
------------------------------------------------ Rupees in '000------------------------------------------------
Al-Ameen Islamic Active Principal Preservation Plan-I
Carrying Amount
-------------- As at March 31, 2019 --------------
Carrying Amount
-------------- As at June 30, 2018 --------------
------------------------------------------------ Rupees in '000------------------------------------------------
Fair value
-------------- As at March 31, 2019 --------------

13 CORRESPONDING FIGURES
14 GENERAL
14.1
14.2
CHIEF EXECUTIVE OFFICER CHIEF FINANCIAL OFFICER DIRECTOR
Figures have been rounded off to the nearest thousand rupees.
For UBL Fund Managers Limited
(Management Company)
This condensed interim financial information was authorized for issue by Board of Directors of the Management Company on
_______________.
No transfers were made between various levels of fair value hierarchy during the period.
Corresponding figures have been rearranged and reclassified, wherever necessary for the purpose of comparison and for better
presentation. However, no significant reclassification has been made during the period.
SDSDSD
29 April 2019
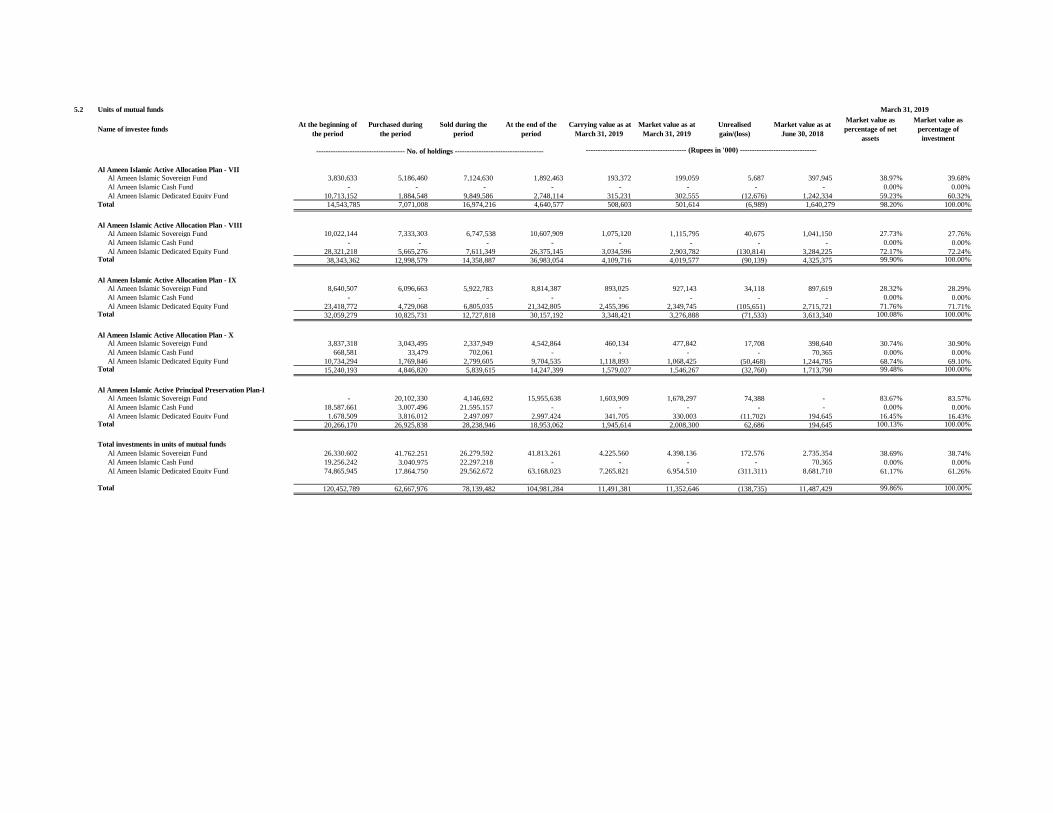
5.2 Units of mutual funds
Al Ameen Islamic Active Allocation Plan - VII
Al Ameen Islamic Sovereign Fund 3,830,633 5,186,460 7,124,630 1,892,463 193,372 199,059 5,687 397,945 38.97% 39.68%
Al Ameen Islamic Cash Fund - - - - - - - - 0.00% 0.00%
Al Ameen Islamic Dedicated Equity Fund 10,713,152 1,884,548 9,849,586 2,748,114 315,231 302,555 (12,676) 1,242,334 59.23% 60.32%
Total 14,543,785 7,071,008 16,974,216 4,640,577 508,603 501,614 (6,989) 1,640,279 98.20% 100.00%
Al Ameen Islamic Active Allocation Plan - VIII
Al Ameen Islamic Sovereign Fund 10,022,144 7,333,303 6,747,538 10,607,909 1,075,120 1,115,795 40,675 1,041,150 27.73% 27.76%
Al Ameen Islamic Cash Fund - - - - - - - - 0.00% 0.00%
Al Ameen Islamic Dedicated Equity Fund 28,321,218 5,665,276 7,611,349 26,375,145 3,034,596 2,903,782 (130,814) 3,284,225 72.17% 72.24%Total 38,343,362 12,998,579 14,358,887 36,983,054 4,109,716 4,019,577 (90,139) 4,325,375 99.90% 100.00%
Al Ameen Islamic Active Allocation Plan - IX
Al Ameen Islamic Sovereign Fund 8,640,507 6,096,663 5,922,783 8,814,387 893,025 927,143 34,118 897,619 28.32% 28.29%
Al Ameen Islamic Cash Fund - - - - - - - - 0.00% 0.00%
Al Ameen Islamic Dedicated Equity Fund 23,418,772 4,729,068 6,805,035 21,342,805 2,455,396 2,349,745 (105,651) 2,715,721 71.76% 71.71%Total 32,059,279 10,825,731 12,727,818 30,157,192 3,348,421 3,276,888 (71,533) 3,613,340 100.08% 100.00%
Al Ameen Islamic Active Allocation Plan - X
Al Ameen Islamic Sovereign Fund 3,837,318 3,043,495 2,337,949 4,542,864 460,134 477,842 17,708 398,640 30.74% 30.90%
Al Ameen Islamic Cash Fund 668,581 33,479 702,061 - - - - 70,365 0.00% 0.00%
Al Ameen Islamic Dedicated Equity Fund 10,734,294 1,769,846 2,799,605 9,704,535 1,118,893 1,068,425 (50,468) 1,244,785 68.74% 69.10%Total 15,240,193 4,846,820 5,839,615 14,247,399 1,579,027 1,546,267 (32,760) 1,713,790 99.48% 100.00%
Al Ameen Islamic Active Principal Preservation Plan-I
Al Ameen Islamic Sovereign Fund - 20,102,330 4,146,692 15,955,638 1,603,909 1,678,297 74,388 - 83.67% 83.57%
Al Ameen Islamic Cash Fund 18,587,661 3,007,496 21,595,157 - - - - - 0.00% 0.00%
Al Ameen Islamic Dedicated Equity Fund 1,678,509 3,816,012 2,497,097 2,997,424 341,705 330,003 (11,702) 194,645 16.45% 16.43%Total 20,266,170 26,925,838 28,238,946 18,953,062 1,945,614 2,008,300 62,686 194,645 100.13% 100.00%
Total investments in units of mutual funds
Al Ameen Islamic Sovereign Fund 26,330,602 41,762,251 26,279,592 41,813,261 4,225,560 4,398,136 172,576 2,735,354 38.69% 38.74%
Al Ameen Islamic Cash Fund 19,256,242 3,040,975 22,297,218 - - - - 70,365 0.00% 0.00%
Al Ameen Islamic Dedicated Equity Fund 74,865,945 17,864,750 29,562,672 63,168,023 7,265,821 6,954,510 (311,311) 8,681,710 61.17% 61.26%
Total 120,452,789 62,667,976 78,139,482 104,981,284 11,491,381 11,352,646 (138,735) 11,487,429 99.86% 100.00%
March 31, 2019
Market value as
percentage of
investment
Market value as
percentage of net
assets
------------------------------------- No. of holdings -------------------------------------
Name of investee funds Carrying value as at
March 31, 2019
At the beginning of
the period
Purchased during
the period
Sold during the
period
At the end of the
period
Market value as at
March 31, 2019
Unrealised
gain/(loss)
Market value as at
June 30, 2018
------------------------------------------ (Rupees in '000) --------------------------------
Management Company UBL Fund Managers Limited
Trustee Central Depository Company of Pakistan Limited
99-B, Block-B, S.M.C.H.S., Main Shahra-e-Faisal,
Karachi. Tel: (9221) 111-111-500
Distribution Company United Bank Limited
Auditors KPMG Taseer Hadi and Co., Chartered Accountants
Bankers United Bank Limited
Management Co. Rating AM1 (JCR‐VIS)
AIFPF-III is an Open‐end Shariah Compliant Fund of funds that aims to generate returns on Investment as per
the respective Allocation Plan by investing in Shariah Compliant Mutual Funds in line with the risk tolerance
of the Investor.
(for detail of others, please visit our website: www.ublfunds.com.pk)
AIFPF-IIIAl-Ameen Islamic Financial Planning Fund
Al‐Ameen Islamic Active Principal Preservation Plan‐III
INVESTMENT OBJECTIVE
Al‐Ameen Islamic Active Principal Preservation Plan‐II
Al Ameen Islamic Active Principal Preservation Plan IV‐
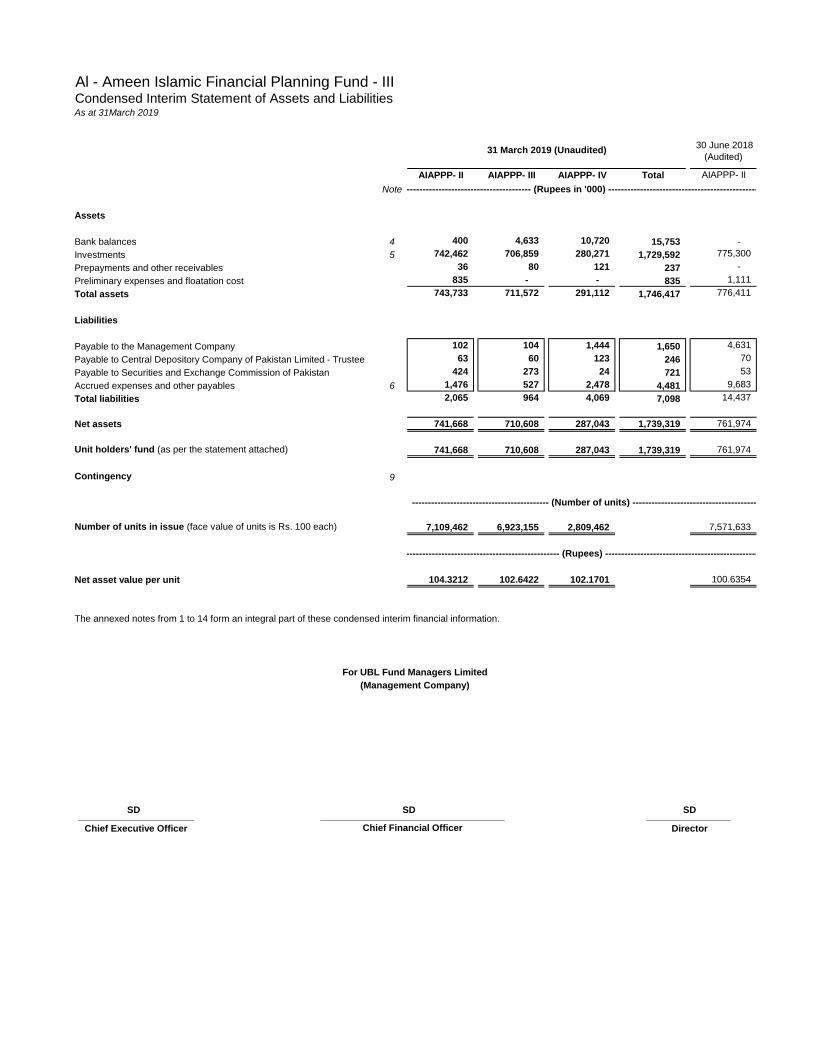
Al - Ameen Islamic Financial Planning Fund - IIICondensed Interim Statement of Assets and LiabilitiesAs at 31March 2019
30 June 2018
(Audited)
AIAPPP- II AIAPPP- III AIAPPP- IV Total AIAPPP- II
Note
Assets
Bank balances 4 400 4,633 10,720 15,753 -
Investments 5 742,462 706,859 280,271 1,729,592 775,300
Prepayments and other receivables 36 80 121 237 -
Preliminary expenses and floatation cost 835 - - 835 1,111
Total assets 743,733 711,572 291,112 1,746,417 776,411
Liabilities
Payable to the Management Company 102 104 1,444 1,650 4,631
Payable to Central Depository Company of Pakistan Limited - Trustee 63 60 123 246 70
Payable to Securities and Exchange Commission of Pakistan 424 273 24 721 53
Accrued expenses and other payables 6 1,476 527 2,478 4,481 9,683
Total liabilities 2,065 964 4,069 7,098 14,437
Net assets 741,668 710,608 287,043 1,739,319 761,974
Unit holders' fund (as per the statement attached) 741,668 710,608 287,043 1,739,319 761,974
Contingency 9
Number of units in issue (face value of units is Rs. 100 each) 7,109,462 6,923,155 2,809,462 7,571,633
Net asset value per unit 104.3212 102.6422 102.1701 100.6354
The annexed notes from 1 to 14 form an integral part of these condensed interim financial information.
______________________ ________________
Chief Executive Officer DirectorChief Financial Officer
___________________________________
31 March 2019 (Unaudited)
------------------------------------------ (Rupees in '000) --------------------------------------------------
(Management Company)
For UBL Fund Managers Limited
------------------------------------------- (Number of units) ---------------------------------------
----------------------------------------------------- (Rupees) -----------------------------------------------------
SD SD SD
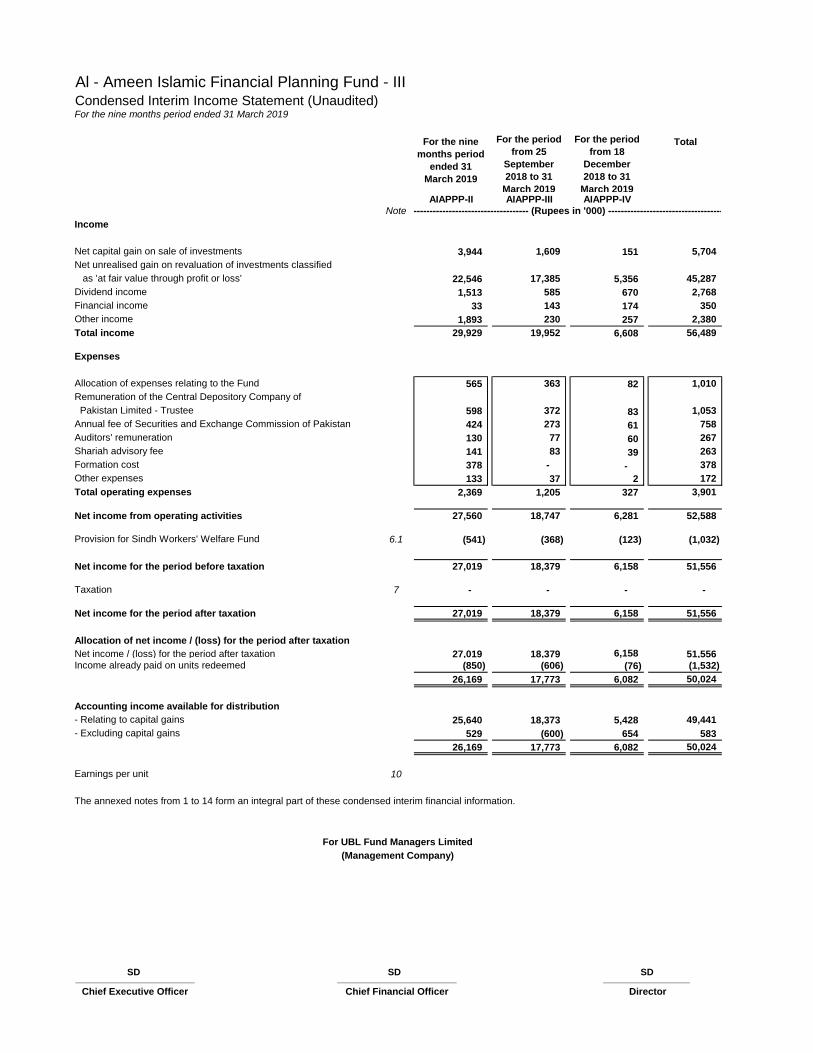
Al - Ameen Islamic Financial Planning Fund - IIICondensed Interim Income Statement (Unaudited)For the nine months period ended 31 March 2019
For the nine
months period
ended 31
March 2019
For the period
from 25
September
2018 to 31
March 2019
For the period
from 18
December
2018 to 31
March 2019
Total
AIAPPP-II AIAPPP-III AIAPPP-IV
Note
Income
Net capital gain on sale of investments 3,944 1,609 151 5,704
Net unrealised gain on revaluation of investments classified
as 'at fair value through profit or loss' 22,546 17,385 5,356 45,287
Dividend income 1,513 585 670 2,768
Financial income 33 143 174 350
Other income 1,893 230 257 2,380
Total income 29,929 19,952 6,608 56,489
Expenses
Allocation of expenses relating to the Fund 565 363 82 1,010
Remuneration of the Central Depository Company of
Pakistan Limited - Trustee 598 372 83 1,053
Annual fee of Securities and Exchange Commission of Pakistan 424 273 61 758
Auditors' remuneration 130 77 60 267
Shariah advisory fee 141 83 39 263
Formation cost 378 - - 378
Other expenses 133 37 2 172
Total operating expenses 2,369 1,205 327 3,901
Net income from operating activities 27,560 18,747 6,281 52,588
Provision for Sindh Workers' Welfare Fund 6.1 (541) (368) (123) (1,032)
Net income for the period before taxation 27,019 18,379 6,158 51,556
Taxation 7 - - - -
Net income for the period after taxation 27,019 18,379 6,158 51,556
Allocation of net income / (loss) for the period after taxation
Net income / (loss) for the period after taxation 27,019 18,379 6,158 51,556 Income already paid on units redeemed (850) (606) (76) (1,532)
26,169 17,773 6,082 50,024
Accounting income available for distribution
- Relating to capital gains 25,640 18,373 5,428 49,441
- Excluding capital gains 529 (600) 654 583
26,169 17,773 6,082 50,024
Earnings per unit 10
The annexed notes from 1 to 14 form an integral part of these condensed interim financial information.
______________________ ______________________ ________________
Chief Executive Officer Chief Financial Officer Director
--------------------------------------- (Rupees in '000) ---------------------------------------
For UBL Fund Managers Limited
(Management Company)
SD SD SD
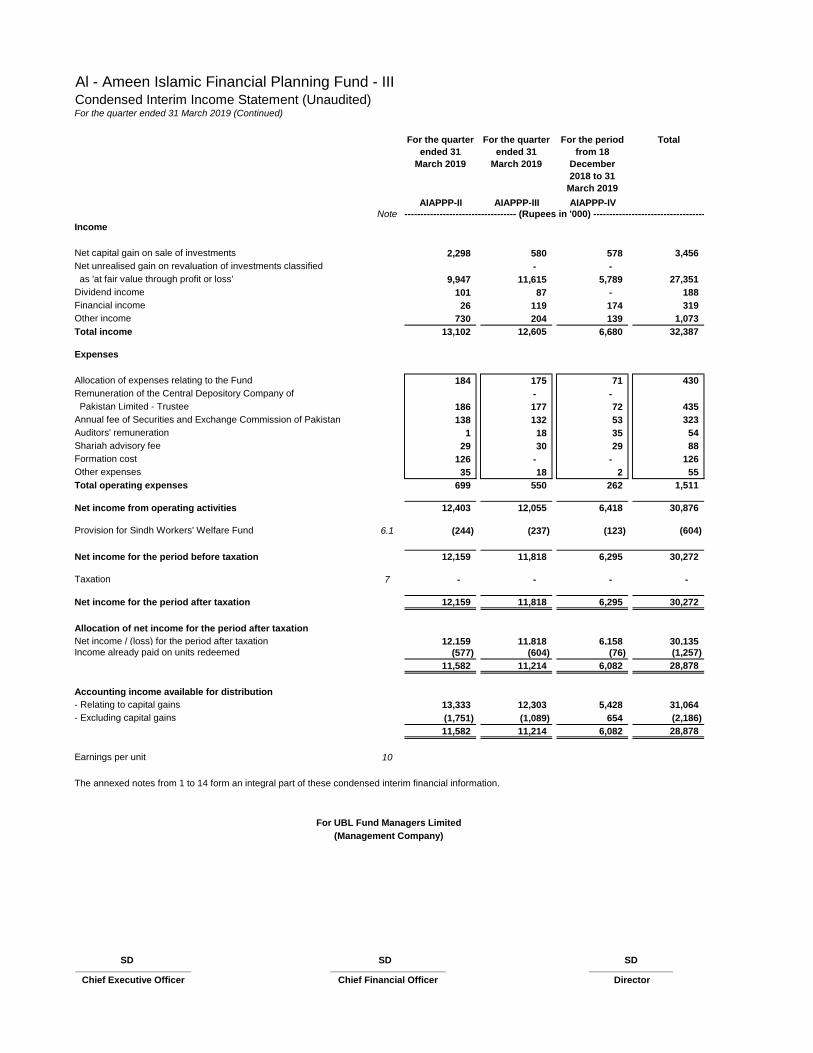
Al - Ameen Islamic Financial Planning Fund - IIICondensed Interim Income Statement (Unaudited)For the quarter ended 31 March 2019 (Continued)
For the quarter
ended 31
March 2019
For the quarter
ended 31
March 2019
For the period
from 18
December
2018 to 31
March 2019
Total
AIAPPP-II AIAPPP-III AIAPPP-IV
Note
Income
Net capital gain on sale of investments 2,298 580 578 3,456
Net unrealised gain on revaluation of investments classified - -
as 'at fair value through profit or loss' 9,947 11,615 5,789 27,351
Dividend income 101 87 - 188
Financial income 26 119 174 319
Other income 730 204 139 1,073
Total income 13,102 12,605 6,680 32,387
Expenses
Allocation of expenses relating to the Fund 184 175 71 430
Remuneration of the Central Depository Company of - -
Pakistan Limited - Trustee 186 177 72 435
Annual fee of Securities and Exchange Commission of Pakistan 138 132 53 323
Auditors' remuneration 1 18 35 54
Shariah advisory fee 29 30 29 88
Formation cost 126 - - 126
Other expenses 35 18 2 55
Total operating expenses 699 550 262 1,511
Net income from operating activities 12,403 12,055 6,418 30,876
Provision for Sindh Workers' Welfare Fund 6.1 (244) (237) (123) (604)
Net income for the period before taxation 12,159 11,818 6,295 30,272
Taxation 7 - - - -
Net income for the period after taxation 12,159 11,818 6,295 30,272
Allocation of net income for the period after taxation
Net income / (loss) for the period after taxation 12,159 11,818 6,158 30,135Income already paid on units redeemed (577) (604) (76) (1,257)
11,582 11,214 6,082 28,878
Accounting income available for distribution
- Relating to capital gains 13,333 12,303 5,428 31,064
- Excluding capital gains (1,751) (1,089) 654 (2,186)
11,582 11,214 6,082 28,878
Earnings per unit 10
The annexed notes from 1 to 14 form an integral part of these condensed interim financial information.
______________________ ______________________ ________________
Chief Executive Officer Chief Financial Officer Director
--------------------------------------- (Rupees in '000) ---------------------------------------
For UBL Fund Managers Limited
(Management Company)
SD SD SD
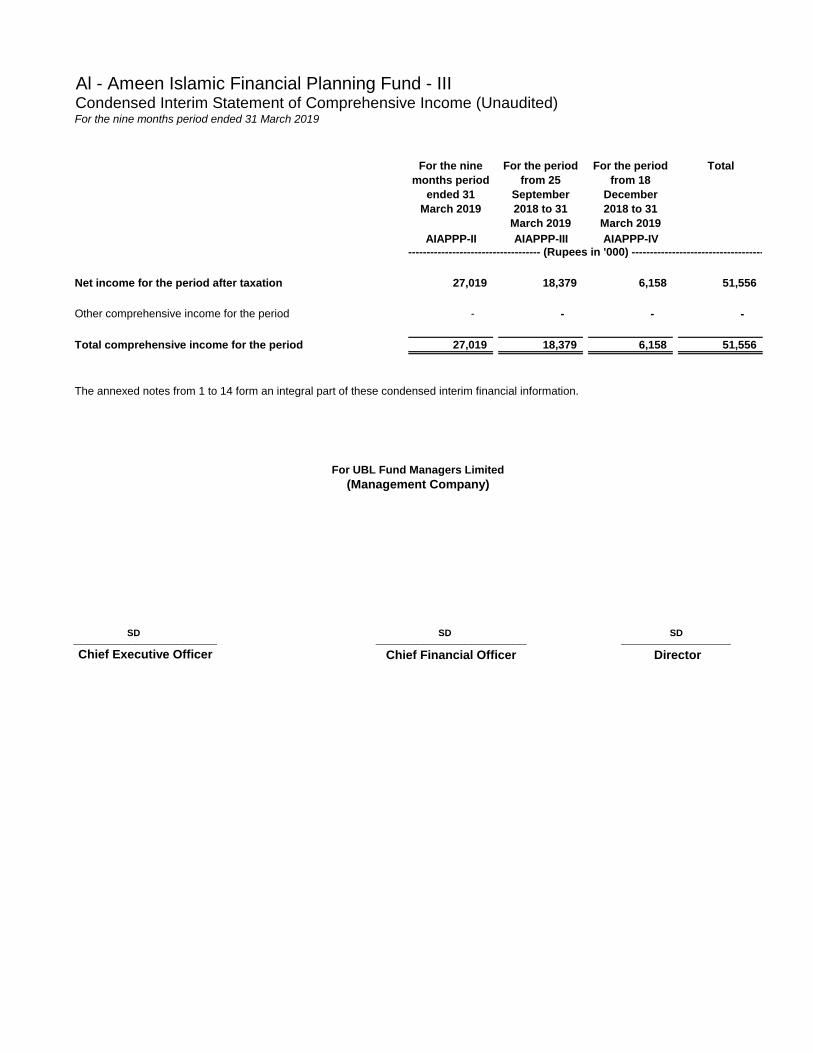
Al - Ameen Islamic Financial Planning Fund - IIICondensed Interim Statement of Comprehensive Income (Unaudited)For the nine months period ended 31 March 2019
For the nine
months period
ended 31
March 2019
For the period
from 25
September
2018 to 31
March 2019
For the period
from 18
December
2018 to 31
March 2019
Total
AIAPPP-II AIAPPP-III AIAPPP-IV
Net income for the period after taxation 27,019 18,379 6,158 51,556
Other comprehensive income for the period - - - -
Total comprehensive income for the period 27,019 18,379 6,158 51,556
The annexed notes from 1 to 14 form an integral part of these condensed interim financial information.
______________________ ________________
Chief Financial Officer Director
--------------------------------------- (Rupees in '000) ---------------------------------------
_____________________
Chief Executive Officer
For UBL Fund Managers Limited
(Management Company)
SD SD SD
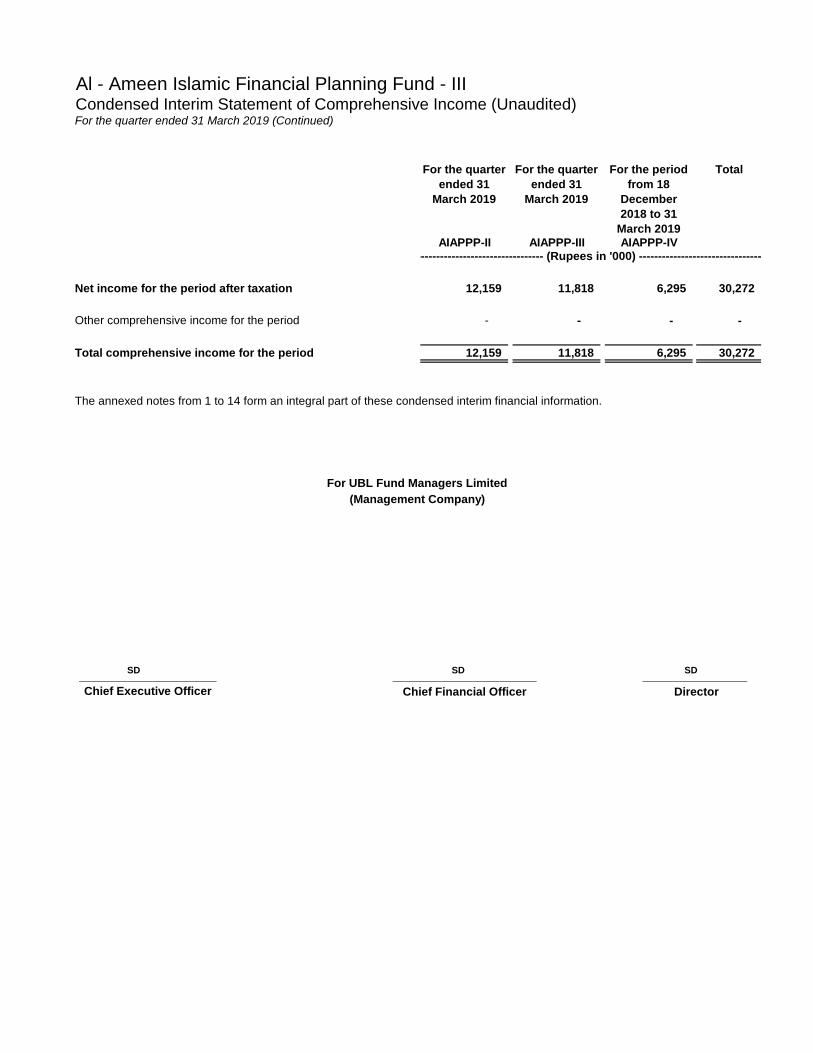
Al - Ameen Islamic Financial Planning Fund - IIICondensed Interim Statement of Comprehensive Income (Unaudited)For the quarter ended 31 March 2019 (Continued)
For the quarter
ended 31
March 2019
For the quarter
ended 31
March 2019
For the period
from 18
December
2018 to 31
March 2019
Total
AIAPPP-II AIAPPP-III AIAPPP-IV
Net income for the period after taxation 12,159 11,818 6,295 30,272
Other comprehensive income for the period - - - -
Total comprehensive income for the period 12,159 11,818 6,295 30,272
The annexed notes from 1 to 14 form an integral part of these condensed interim financial information.
______________________ ________________
Chief Financial Officer Director
--------------------------------------- (Rupees in '000) ---------------------------------------
Chief Executive Officer
_____________________
For UBL Fund Managers Limited
(Management Company)
SD SD SD
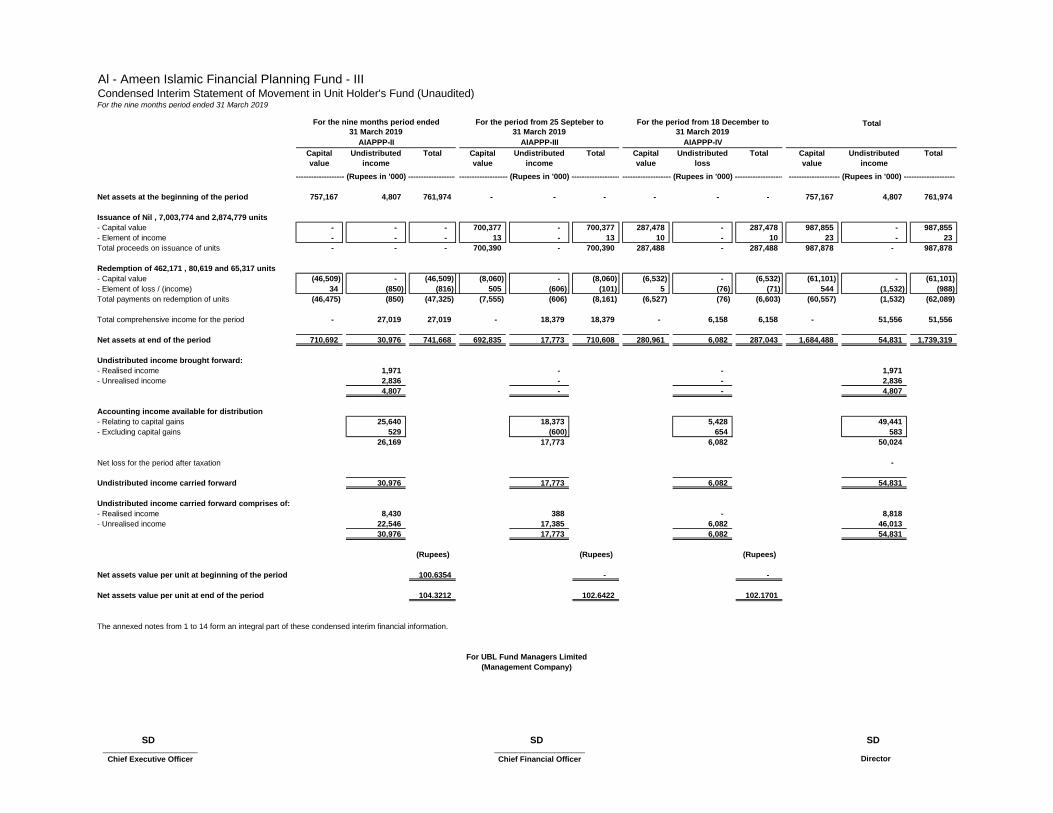
Al - Ameen Islamic Financial Planning Fund - IIICondensed Interim Statement of Movement in Unit Holder's Fund (Unaudited)For the nine months period ended 31 March 2019
Capital
value
Undistributed
income
Total Capital
value
Undistributed
income
Total Capital
value
Undistributed
loss
Total Capital
value
Undistributed
income
Total
Net assets at the beginning of the period 757,167 4,807 761,974 - - - - - - 757,167 4,807 761,974
Issuance of Nil , 7,003,774 and 2,874,779 units
- Capital value - - - 700,377 - 700,377 287,478 - 287,478 987,855 - 987,855
- Element of income - - - 13 - 13 10 - 10 23 - 23
Total proceeds on issuance of units - - - 700,390 - 700,390 287,488 - 287,488 987,878 - 987,878
Redemption of 462,171 , 80,619 and 65,317 units
- Capital value (46,509) - (46,509) (8,060) - (8,060) (6,532) - (6,532) (61,101) - (61,101)
- Element of loss / (income) 34 (850) (816) 505 (606) (101) 5 (76) (71) 544 (1,532) (988)
Total payments on redemption of units (46,475) (850) (47,325) (7,555) (606) (8,161) (6,527) (76) (6,603) (60,557) (1,532) (62,089)
Total comprehensive income for the period - 27,019 27,019 - 18,379 18,379 - 6,158 6,158 - 51,556 51,556
Net assets at end of the period 710,692 30,976 741,668 692,835 17,773 710,608 280,961 6,082 287,043 1,684,488 54,831 1,739,319
Undistributed income brought forward:
- Realised income 1,971 - - 1,971
- Unrealised income 2,836 - - 2,836
4,807 - - 4,807
Accounting income available for distribution
- Relating to capital gains 25,640 18,373 5,428 49,441
- Excluding capital gains 529 (600) 654 583
26,169 17,773 6,082 50,024
Net loss for the period after taxation -
Undistributed income carried forward 30,976 17,773 6,082 54,831
Undistributed income carried forward comprises of:
- Realised income 8,430 388 - 8,818
- Unrealised income 22,546 17,385 6,082 46,013
30,976 17,773 6,082 54,831
(Rupees) (Rupees) (Rupees)
Net assets value per unit at beginning of the period 100.6354 - -
Net assets value per unit at end of the period 104.3212 102.6422 102.1701
The annexed notes from 1 to 14 form an integral part of these condensed interim financial information.
______________________ _____________________ ________________
Chief Executive Officer Chief Financial Officer Director
For UBL Fund Managers Limited
(Management Company)
31 March 2019
AIAPPP-II
For the nine months period ended For the period from 25 Septeber to For the period from 18 December to
31 March 2019
AIAPPP-III
31 March 2019
AIAPPP-IV
-------------------- (Rupees in '000) ---------------------------------------- (Rupees in '000) ---------------------------------------- (Rupees in '000) --------------------
Total
-------------------- (Rupees in '000) --------------------
SD SD SD
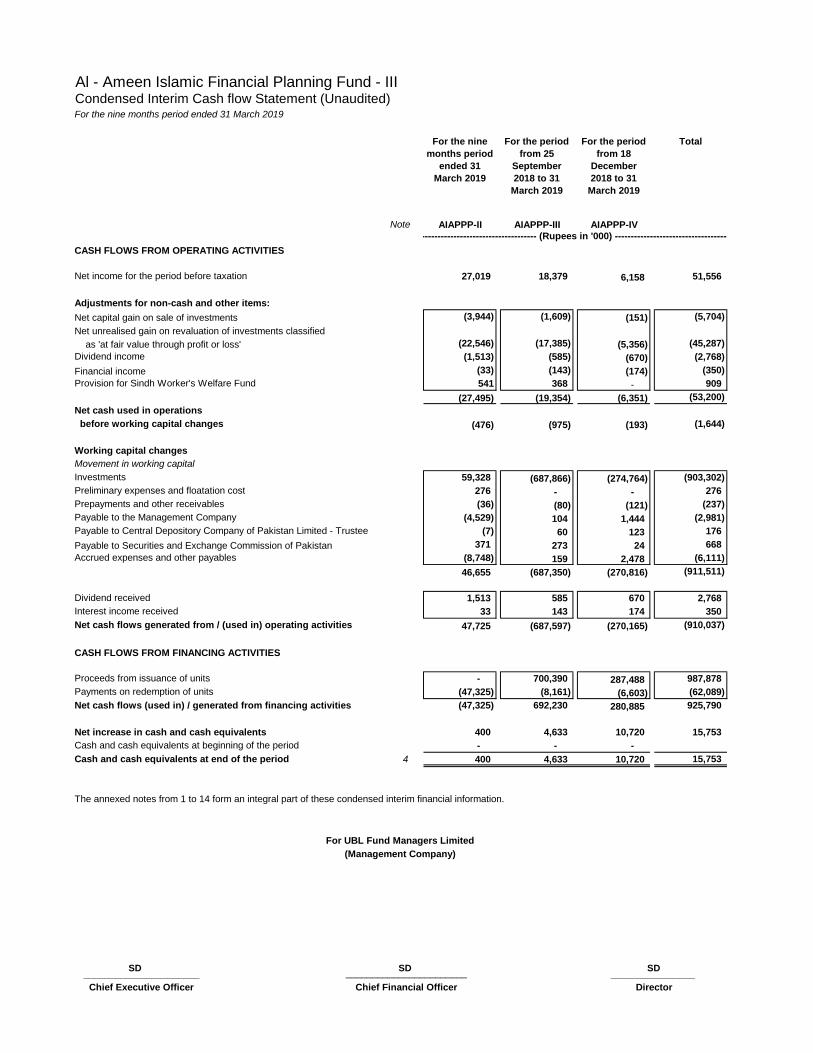
Al - Ameen Islamic Financial Planning Fund - IIICondensed Interim Cash flow Statement (Unaudited)For the nine months period ended 31 March 2019
For the nine
months period
ended 31
March 2019
For the period
from 25
September
2018 to 31
March 2019
For the period
from 18
December
2018 to 31
March 2019
Total
Note AIAPPP-II AIAPPP-III AIAPPP-IV
CASH FLOWS FROM OPERATING ACTIVITIES
Net income for the period before taxation 27,019 18,379 6,158 51,556
Adjustments for non-cash and other items:
Net capital gain on sale of investments (3,944) (1,609) (151) (5,704)
Net unrealised gain on revaluation of investments classified
as 'at fair value through profit or loss' (22,546) (17,385) (5,356) (45,287)
Dividend income (1,513) (585) (670) (2,768)
Financial income (33) (143) (174) (350)
Provision for Sindh Worker's Welfare Fund 541 368 - 909
(27,495) (19,354) (6,351) (53,200)
Net cash used in operations
before working capital changes (476) (975) (193) (1,644)
Working capital changes
Movement in working capital
Investments 59,328 (687,866) (274,764) (903,302)
Preliminary expenses and floatation cost 276 - - 276
Prepayments and other receivables (36) (80) (121) (237)
Payable to the Management Company (4,529) 104 1,444 (2,981)
Payable to Central Depository Company of Pakistan Limited - Trustee (7) 60 123 176
Payable to Securities and Exchange Commission of Pakistan 371 273 24 668
Accrued expenses and other payables (8,748) 159 2,478 (6,111)
46,655 (687,350) (270,816) (911,511)
Dividend received 1,513 585 670 2,768
Interest income received 33 143 174 350
Net cash flows generated from / (used in) operating activities 47,725 (687,597) (270,165) (910,037)
CASH FLOWS FROM FINANCING ACTIVITIES
Proceeds from issuance of units - 700,390 287,488 987,878
Payments on redemption of units (47,325) (8,161) (6,603) (62,089)
Net cash flows (used in) / generated from financing activities (47,325) 692,230 280,885 925,790
Net increase in cash and cash equivalents 400 4,633 10,720 15,753
Cash and cash equivalents at beginning of the period - - -
Cash and cash equivalents at end of the period 4 400 4,633 10,720 15,753
The annexed notes from 1 to 14 form an integral part of these condensed interim financial information.
______________________ _______________________ ________________
Chief Executive Officer Chief Financial Officer Director
--------------------------------------- (Rupees in '000) ---------------------------------------
For UBL Fund Managers Limited
(Management Company)
SD SD SD
Al - Ameen Islamic Financial Planning Fund - IIINotes to the Condensed Interim Financial Information (Unaudited)For the nine months period ended 31 March 2019
1 LEGAL STATUS AND NATURE OF BUSINESS
1.1 Al-Ameen Islamic Asset Allocation Fund (the Fund) was established under the Non Banking Finance Companies (Establishment &
Regulation) Rules, 2003 (the NBFC Rules) and Non-Banking Finance Companies and Notified Entities Regulations, 2008 (NBFC
Regulations) and was approved as an open end mutual fund by the Securities and Exchange Commission of Pakistan. It was constituted
under a Trust Deed, dated 3 January 2018 between UBL Fund Managers Limited (a wholly owned subsidiary company of United Bank
Limited) as the Management Company and Central Depository Company of Pakistan Limited ("CDC") as the Trustee.The registered office of
the Management Company is situated at 4th Floor STSM Building, Beaumont Road, Civil Lines, Karachi.
JCR-VIS Credit Rating Company has re-affirmed quality rating of 'AM1' (stable outlook) to the Management Company as on 27 December
2018.
Title to the assets of the Fund are held in the name of the Central Depository Company of Pakistan Limited as the Trustee of the Fund.
1.2 The Fund is an Open-end Shariah Compliant Fund of funds Scheme that aims to generate returns on Investment as per the respective
Allocation Plan by investing via underlying mutual funds. These comprises the following:
1.2.1 Al-Ameen Islamic Active Principal Preservation Plan – II
AIAPPP-II is an Islamic Principal Preservation Plan under “Al-Ameen Islamic Financial Planning Fund - III” with an objective to earn
potentially high return through dynamic asset allocation between Islamic Dedicated Equity, Islamic Sovereign Income and Islamic Money
Market based Collective Investment Schemes, PLS and term deposit receipts while providing principal preservation of the Initial Investment
Value including Front end load at completion of twenty four months and beyond till maturity of the plan.
1.2.2 Al-Ameen Islamic Active Principal Preservation Plan – III
AIAPPP-III is an Islamic Principal Preservation Plan under “Al-Ameen Islamic Financial Planning Fund - III” with an objective to earn
potentially high return through dynamic asset allocation between Islamic Dedicated Equity, Islamic Sovereign Income and Islamic Money
Market based Collective Investment Schemes, PLS and term deposit receipts while providing principal preservation of the Initial Investment
Value including Front end load at completion of twenty four months and beyond till maturity of the plan.
1.2.3 Al-Ameen Islamic Active Principal Preservation Plan – IV
AIAPPP-IV is an Islamic Principal Preservation Plan under “Al-Ameen Islamic Financial Planning Fund - III” with an objective to earn
potentially high return through dynamic asset allocation between Islamic Dedicated Equity, Islamic Sovereign Income and Islamic Money
Market based Collective Investment Schemes, PLS and term deposit receipts while providing principal preservation of the Initial Investment
Value including Front end load at completion of twenty four months and beyond till maturity of the plan.
2 BASIS OF PRESENTATION
2.1 Statement of compliance
2.1.1 These condensed interim financial information have been prepared in accordance with the accounting and reporting standards as
applicable in Pakistan. The accounting and reporting standards applicable in Pakistan comprise of:
- International Financial Reporting Standards (IFRS Standards) issued by the International Accounting Standards Board (IASB) as notified
under the Companies Act, 2017;
- Provisions of and directives issued under the Companies Act, 2017 along with part VIIIA of the repealed Companies Ordinance, 1984;
- Non-Banking Finance Companies (Establishment and Regulations) Rules, 2003 (the NBFC Rules), Non-Banking Finance Companies
and Notified Entities Regulations, 2008 (the NBFC Regulations).
Where provisions of and directives issued under the Companies Act, 2017, part VIIIA of the repealed Companies Ordinance, 1984, the
NBFC Rules and the NBFC Regulations differ from the IFRS Standards, the provisions of and directives issued under the Companies
Act, 2017, part VIIIA of the repealed Companies Ordinance, 1984, the NBFC Rules and the NBFC Regulations have been followed.
2.1.2 The disclosures made in this condensed interim financial information have, however, been limited based on the requirements of
International Accounting Standard 34: 'Interim Financial Reporting'. This condensed interim financial information does not include all the
information and disclosures required in a full set of financial statements and should be read in conjunction with the annual published audited
financial statements of the Fund for the year ended 30 June 2018.
The Fund is an open end mutual fund, listed on the Pakistan Stock Exchange Limited. Units of the Fund are offered for public subscription on
a continuous basis. The units are transferable and can be redeemed by surrendering them to the Fund.
2.1.3 These condensed interim financial information are unaudited and are being submitted to the unit holders as required under Regulation
38(2)(f) of the Non-Banking Finance Companies and Notified Entities Regulations, 2008 (the NBFC Regulations). However, a limited scope
review has been carried out by the auditors in accordance with the requirements of clause (xix) of the Code of Corporate Governance
issued by the Securities and Exchange Commission of Pakistan.
2.1.4 The comparative statement of asset and liabilities presented in this condensed interim financial information has been extracted from the
annual audited financial statements of the Fund for the year ended 30 June 2018.
2.1.5 In compliance with Schedule V of the Non-Banking Finance Companies and Notified Entities Regulations, 2008, the directors of the
Management Company declare that this condensed interim financial information give a true and fair view of the state of the Fund‟s affairs
as at 31 March 2019.
3. SUMMARY OF SIGNIFICANT ACCOUNTING POLICIES, ESTIMATES AND JUDGEMENTS
3.1 Except as described below, the accounting policies applied in this condensed interim financial information are the same as those applied in
the preparation of the annual financial statements of the Fund for the year ended 30 June 2018.
Securities and Exchange Commission of Pakistan (SECP) vide its SRO. 229 (I)/2019 has modified the effective date for applicability of IFRS 9
'Financial Instruments', however the Fund has opted for early adoption of the said standard from 1 July 2018 as permitted. The Fund also
adopted IFRS 15 „Revenue from contracts with customers‟ from 1 July 2018. A number of other new standards are effective from 1 July 2018 but
they do not have a material effect on the Fund's financial information.
IFRS 9 sets out requirements for recognising and measuring financial assets, financial liabilities and some contracts to buy or sell
non-financial items. This standard replaces IAS 39 Financial Instruments: Recognition and Measurement. The new standard brings
fundamental changes to the accounting for financial assets and to certain aspects of the accounting for financial liabilities. As a result of
adoption of IFRS 9, the Fund has adopted consequential amendments to IAS 1 Presentation of Financial statements', which requires
separate presentation in the income statement and statement of comprehensive income, profit / markup calculated using the effective
interest method.
The adoption of IFRS 15 did not impact the timing or amount of dividend, profit, markup and other investment income and related assets
and liabilities recognised by the fund. Accordingly, there is no impact on comparative information.
The details of new significant accounting policies and the nature and effect of the changes to previous accounting policies are set out
below.
i. Classification and measurement of financial assets and financial liabilities
IFRS 9 contains three principal classification categories for financial assets: measured at amortised cost, fair value through other
comprehensive income (FVOCI) and fair value through profit or loss (FVTPL).
IFRS 9 classification is generally based on the business model in which a financial asset is managed and its contractual cash flows. The
standard eliminates the previous IAS 39 categories of held to maturity, loans and receivables and available for sale.
IFRS 9 largely retains the existing requirements in IAS 39 for the classification and measurement of financial liabilities.
The adoption of IFRS 9 did not have a significant effect on the Fund‟s accounting policies related to financial liabilities. The impact of IFRS
9 on the classification and measurement of financial assets is set out below:
The following assessments have been made on the basis of the facts and circumstances that existed at the date of initial application:
- The determination of business model within which a financial asset is held.
- The designation and revocation of previous designation of certain financial assets as measured at FVTPL.
A financial asset is measured at amortised cost if it meets both of the following conditions and is not designated as at FVTPL:
- it is held within a business model whose objective is to hold assets to collect contractual cash flows; and
- its contractual terms give rise on specified dates to cash flows that are solely payments of principal and interest on the principal
amount outstanding.
A debt investment is measured at FVOCI if it meets both of the following conditions and is not designated as at FVTPL:
- it is held within a business model whose objective is achieved by both collecting contractual cash flows and selling financial assets; and
- its contractual terms give rise on specified dates to cash flows that are solely payments of principal and interest on the principal
amount outstanding.
All financial assets not classified as measured at amortised cost or FVOCI as described above are measured at FVTPL. On initial
recognition, the Fund may irrevocably designate a financial asset that otherwise meets the requirements to be measured at amortised cost
or at FVOCI as at FVTPL if doing so eliminates or significantly reduces an accounting mismatch that would otherwise arise.
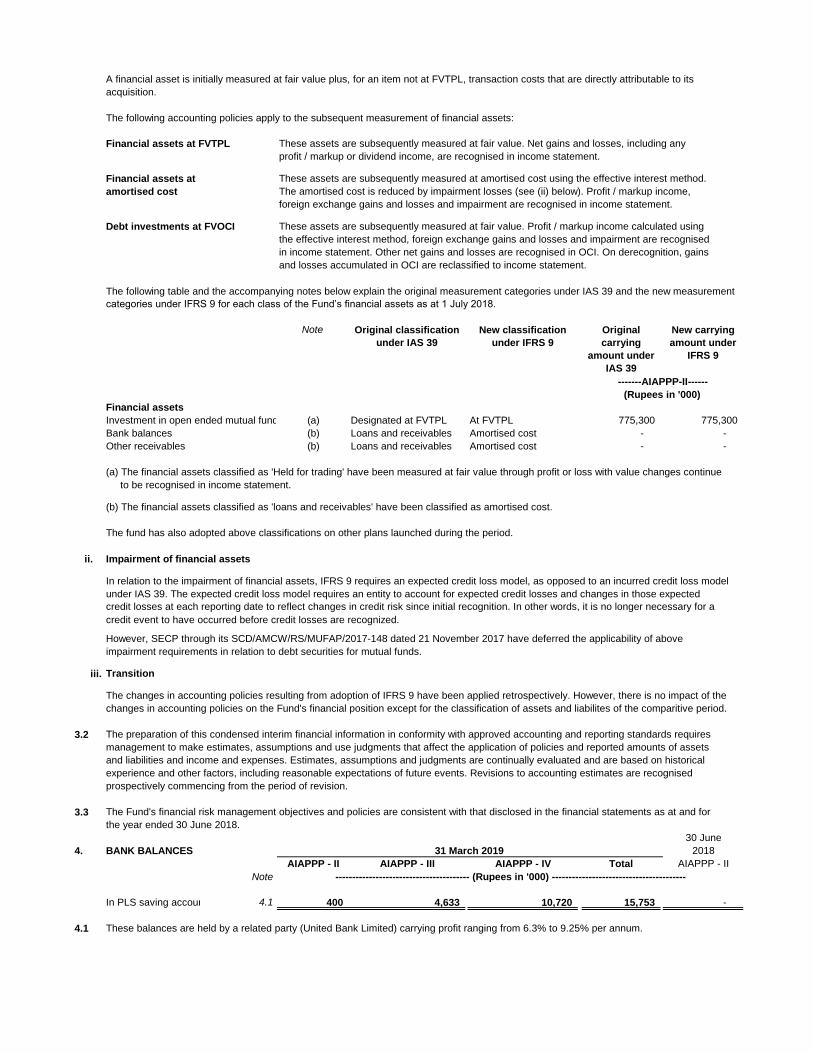
A financial asset is initially measured at fair value plus, for an item not at FVTPL, transaction costs that are directly attributable to its
acquisition.
The following accounting policies apply to the subsequent measurement of financial assets:
Financial assets at FVTPL These assets are subsequently measured at fair value. Net gains and losses, including any
profit / markup or dividend income, are recognised in income statement.
Financial assets at These assets are subsequently measured at amortised cost using the effective interest method.
amortised cost The amortised cost is reduced by impairment losses (see (ii) below). Profit / markup income,
foreign exchange gains and losses and impairment are recognised in income statement.
Debt investments at FVOCI These assets are subsequently measured at fair value. Profit / markup income calculated using
the effective interest method, foreign exchange gains and losses and impairment are recognised
in income statement. Other net gains and losses are recognised in OCI. On derecognition, gains
and losses accumulated in OCI are reclassified to income statement.
The following table and the accompanying notes below explain the original measurement categories under IAS 39 and the new measurement
categories under IFRS 9 for each class of the Fund‟s financial assets as at 1 July 2018.
Note
(Rupees in '000)
Financial assets
Investment in open ended mutual funds (a) Designated at FVTPL At FVTPL 775,300 775,300
Bank balances (b) Loans and receivables Amortised cost - -
Other receivables (b) Loans and receivables Amortised cost - -
(a) The financial assets classified as 'Held for trading' have been measured at fair value through profit or loss with value changes continue
to be recognised in income statement.
(b) The financial assets classified as 'loans and receivables' have been classified as amortised cost.
The fund has also adopted above classifications on other plans launched during the period.
ii. Impairment of financial assets
In relation to the impairment of financial assets, IFRS 9 requires an expected credit loss model, as opposed to an incurred credit loss model
under IAS 39. The expected credit loss model requires an entity to account for expected credit losses and changes in those expected
credit losses at each reporting date to reflect changes in credit risk since initial recognition. In other words, it is no longer necessary for a
credit event to have occurred before credit losses are recognized.
However, SECP through its SCD/AMCW/RS/MUFAP/2017-148 dated 21 November 2017 have deferred the applicability of above
impairment requirements in relation to debt securities for mutual funds.
iii. Transition
The changes in accounting policies resulting from adoption of IFRS 9 have been applied retrospectively. However, there is no impact of the
changes in accounting policies on the Fund's financial position except for the classification of assets and liabilites of the comparitive period.
3.2 The preparation of this condensed interim financial information in conformity with approved accounting and reporting standards requires
management to make estimates, assumptions and use judgments that affect the application of policies and reported amounts of assets
and liabilities and income and expenses. Estimates, assumptions and judgments are continually evaluated and are based on historical
experience and other factors, including reasonable expectations of future events. Revisions to accounting estimates are recognised
prospectively commencing from the period of revision.
3.3 The Fund's financial risk management objectives and policies are consistent with that disclosed in the financial statements as at and for
the year ended 30 June 2018.
30 June
4. BANK BALANCES 2018
AIAPPP - II AIAPPP - III AIAPPP - IV Total AIAPPP - II
Note
In PLS saving accounts 4.1 400 4,633 10,720 15,753 -
4.1 These balances are held by a related party (United Bank Limited) carrying profit ranging from 6.3% to 9.25% per annum.
---------------------------------------- (Rupees in '000) ----------------------------------------
Original classification
under IAS 39
New classification
under IFRS 9
Original
carrying
amount under
IAS 39
New carrying
amount under
IFRS 9
-------AIAPPP-II------
31 March 2019
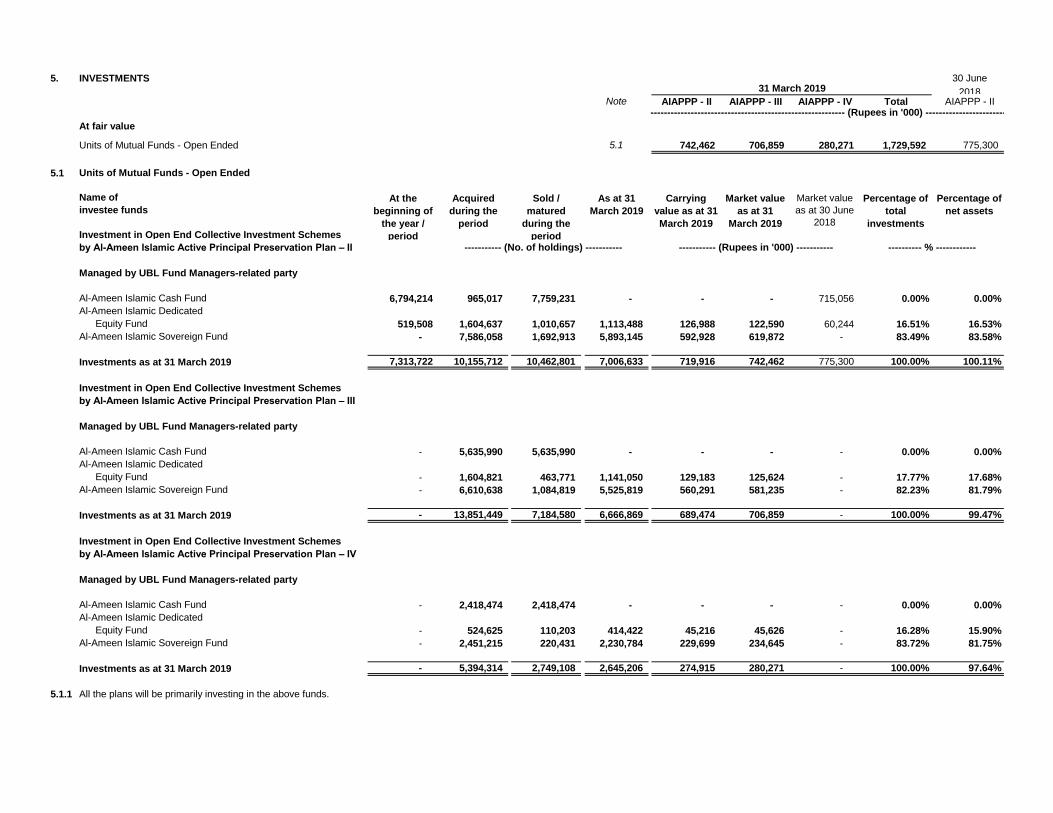
5. INVESTMENTS 30 June
2018Note AIAPPP - II AIAPPP - III AIAPPP - IV Total AIAPPP - II
---------------------------------------------------------- (Rupees in '000) ----------------------------------------------------------
At fair value
through profit Units of Mutual Funds - Open Ended 5.1 742,462 706,859 280,271 1,729,592 775,300
5.1 Units of Mutual Funds - Open Ended
Investment in Open End Collective Investment Schemes
by Al-Ameen Islamic Active Principal Preservation Plan – II
Managed by UBL Fund Managers-related party
Al-Ameen Islamic Cash Fund 6,794,214 965,017 7,759,231 - - - 715,056 0.00% 0.00%
Al-Ameen Islamic Dedicated
Equity Fund 519,508 1,604,637 1,010,657 1,113,488 126,988 122,590 60,244 16.51% 16.53%
Al-Ameen Islamic Sovereign Fund - 7,586,058 1,692,913 5,893,145 592,928 619,872 - 83.49% 83.58%
Investments as at 31 March 2019 7,313,722 10,155,712 10,462,801 7,006,633 719,916 742,462 775,300 100.00% 100.11%
Investment in Open End Collective Investment Schemes
by Al-Ameen Islamic Active Principal Preservation Plan – III
Managed by UBL Fund Managers-related party
Al-Ameen Islamic Cash Fund - 5,635,990 5,635,990 - - - - 0.00% 0.00%
Al-Ameen Islamic Dedicated
Equity Fund - 1,604,821 463,771 1,141,050 129,183 125,624 - 17.77% 17.68%
Al-Ameen Islamic Sovereign Fund - 6,610,638 1,084,819 5,525,819 560,291 581,235 - 82.23% 81.79%
Investments as at 31 March 2019 - 13,851,449 7,184,580 6,666,869 689,474 706,859 - 100.00% 99.47%
Investment in Open End Collective Investment Schemes
by Al-Ameen Islamic Active Principal Preservation Plan – IV
Managed by UBL Fund Managers-related party
Al-Ameen Islamic Cash Fund - 2,418,474 2,418,474 - - - - 0.00% 0.00%
Al-Ameen Islamic Dedicated
Equity Fund - 524,625 110,203 414,422 45,216 45,626 - 16.28% 15.90%
Al-Ameen Islamic Sovereign Fund - 2,451,215 220,431 2,230,784 229,699 234,645 - 83.72% 81.75%
Investments as at 31 March 2019 - 5,394,314 2,749,108 2,645,206 274,915 280,271 - 100.00% 97.64%
5.1.1 All the plans will be primarily investing in the above funds.
31 March 2019
----------- (No. of holdings) ----------- ---------- % ------------
Acquired
during the
period
Sold /
matured
during the
period
As at 31
March 2019
Carrying
value as at 31
March 2019
Market value
as at 31
March 2019
----------- (Rupees in '000) -----------
Name of
investee funds
At the
beginning of
the year /
period
Percentage of
total
investments
Percentage of
net assets
Market value
as at 30 June
2018
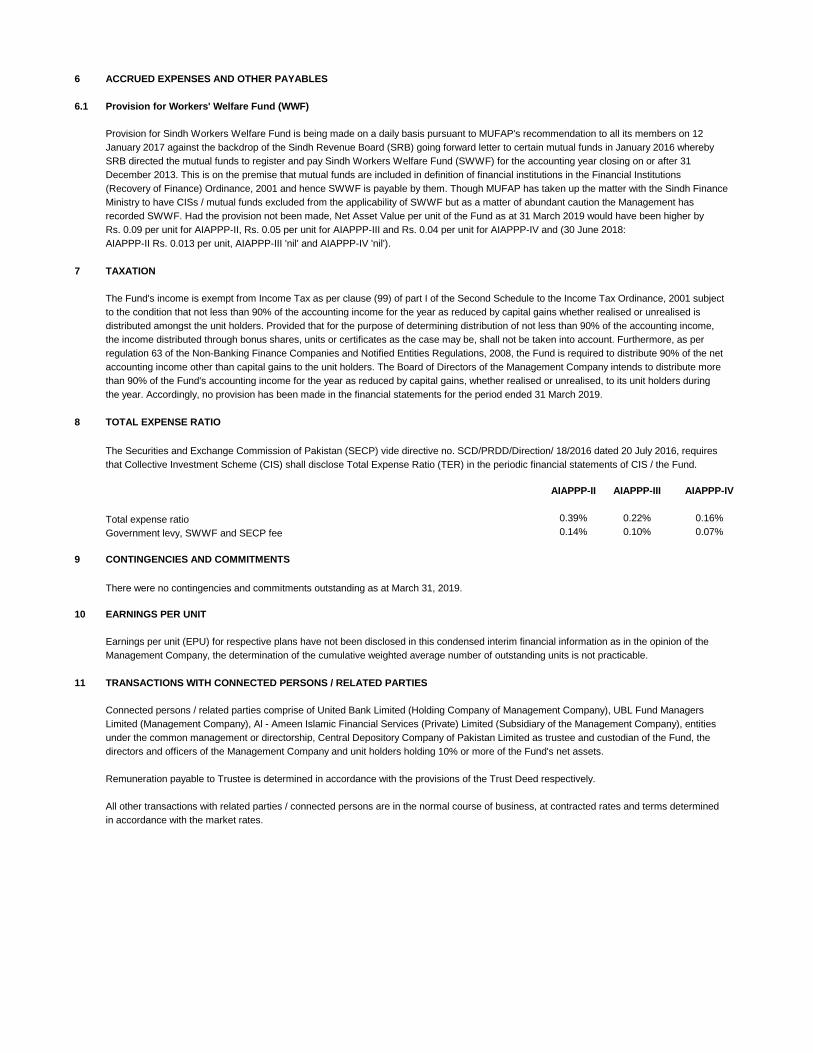
6 ACCRUED EXPENSES AND OTHER PAYABLES
6.1 Provision for Workers' Welfare Fund (WWF)
Provision for Sindh Workers Welfare Fund is being made on a daily basis pursuant to MUFAP's recommendation to all its members on 12
January 2017 against the backdrop of the Sindh Revenue Board (SRB) going forward letter to certain mutual funds in January 2016 whereby
SRB directed the mutual funds to register and pay Sindh Workers Welfare Fund (SWWF) for the accounting year closing on or after 31
December 2013. This is on the premise that mutual funds are included in definition of financial institutions in the Financial Institutions
(Recovery of Finance) Ordinance, 2001 and hence SWWF is payable by them. Though MUFAP has taken up the matter with the Sindh Finance
Ministry to have CISs / mutual funds excluded from the applicability of SWWF but as a matter of abundant caution the Management has
recorded SWWF. Had the provision not been made, Net Asset Value per unit of the Fund as at 31 March 2019 would have been higher by
Rs. 0.09 per unit for AIAPPP-II, Rs. 0.05 per unit for AIAPPP-III and Rs. 0.04 per unit for AIAPPP-IV and (30 June 2018:
AIAPPP-II Rs. 0.013 per unit, AIAPPP-III 'nil' and AIAPPP-IV 'nil').
7 TAXATION
The Fund's income is exempt from Income Tax as per clause (99) of part I of the Second Schedule to the Income Tax Ordinance, 2001 subject
to the condition that not less than 90% of the accounting income for the year as reduced by capital gains whether realised or unrealised is
distributed amongst the unit holders. Provided that for the purpose of determining distribution of not less than 90% of the accounting income,
the income distributed through bonus shares, units or certificates as the case may be, shall not be taken into account. Furthermore, as per
regulation 63 of the Non-Banking Finance Companies and Notified Entities Regulations, 2008, the Fund is required to distribute 90% of the net
accounting income other than capital gains to the unit holders. The Board of Directors of the Management Company intends to distribute more
than 90% of the Fund's accounting income for the year as reduced by capital gains, whether realised or unrealised, to its unit holders during
the year. Accordingly, no provision has been made in the financial statements for the period ended 31 March 2019.
8 TOTAL EXPENSE RATIO
The Securities and Exchange Commission of Pakistan (SECP) vide directive no. SCD/PRDD/Direction/ 18/2016 dated 20 July 2016, requires
that Collective Investment Scheme (CIS) shall disclose Total Expense Ratio (TER) in the periodic financial statements of CIS / the Fund.
AIAPPP-II AIAPPP-III AIAPPP-IV
Total expense ratio 0.39% 0.22% 0.16%
Government levy, SWWF and SECP fee 0.14% 0.10% 0.07%
9 CONTINGENCIES AND COMMITMENTS
There were no contingencies and commitments outstanding as at March 31, 2019.
10 EARNINGS PER UNIT
Earnings per unit (EPU) for respective plans have not been disclosed in this condensed interim financial information as in the opinion of the
Management Company, the determination of the cumulative weighted average number of outstanding units is not practicable.
11 TRANSACTIONS WITH CONNECTED PERSONS / RELATED PARTIES
Connected persons / related parties comprise of United Bank Limited (Holding Company of Management Company), UBL Fund Managers
Limited (Management Company), Al - Ameen Islamic Financial Services (Private) Limited (Subsidiary of the Management Company), entities
under the common management or directorship, Central Depository Company of Pakistan Limited as trustee and custodian of the Fund, the
directors and officers of the Management Company and unit holders holding 10% or more of the Fund's net assets.
Remuneration payable to Trustee is determined in accordance with the provisions of the Trust Deed respectively.
All other transactions with related parties / connected persons are in the normal course of business, at contracted rates and terms determined
in accordance with the market rates.
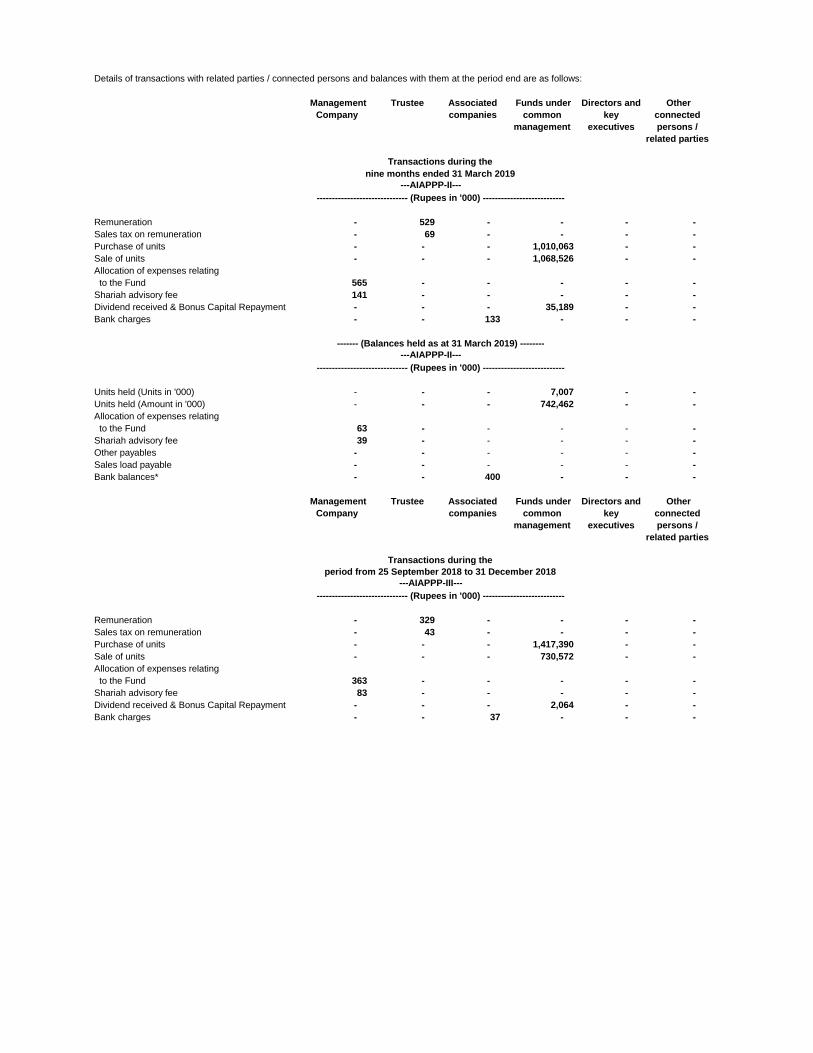
Details of transactions with related parties / connected persons and balances with them at the period end are as follows:
Remuneration - 529 - - - -
Sales tax on remuneration - 69 - - - -
Purchase of units - - - 1,010,063 - -
Sale of units - - - 1,068,526 - -
Allocation of expenses relating
to the Fund 565 - - - - -
Shariah advisory fee 141 - - - - -
Dividend received & Bonus Capital Repayment - - - 35,189 - -
Bank charges - - 133 - - -
Units held (Units in '000) - - - 7,007 - -
Units held (Amount in '000) - - - 742,462 - -
Allocation of expenses relating
to the Fund 63 - - - - -
Shariah advisory fee 39 - - - - -
Other payables - - - - - -
Sales load payable - - - - - -
Bank balances* - - 400 - - -
Remuneration - 329 - - - -
Sales tax on remuneration - 43 - - - -
Purchase of units - - - 1,417,390 - -
Sale of units - - - 730,572 - -
Allocation of expenses relating
to the Fund 363 - - - - -
Shariah advisory fee 83 - - - - -
Dividend received & Bonus Capital Repayment - - - 2,064 - -
Bank charges - - 37 - - -
Other
connected
persons /
related parties
Other
connected
persons /
related parties
Associated
companies
Transactions during the
period from 25 September 2018 to 31 December 2018
---AIAPPP-III---
------------------------------ (Rupees in '000) ---------------------------
Management
Company
Trustee
Management
Company
Trustee Funds under
common
management
------------------------------ (Rupees in '000) ---------------------------
Directors and
key
executives
Directors and
key
executives
nine months ended 31 March 2019
Transactions during the
------- (Balances held as at 31 March 2019) --------
---AIAPPP-II---
------------------------------ (Rupees in '000) ---------------------------
Funds under
common
management
Associated
companies
---AIAPPP-II---
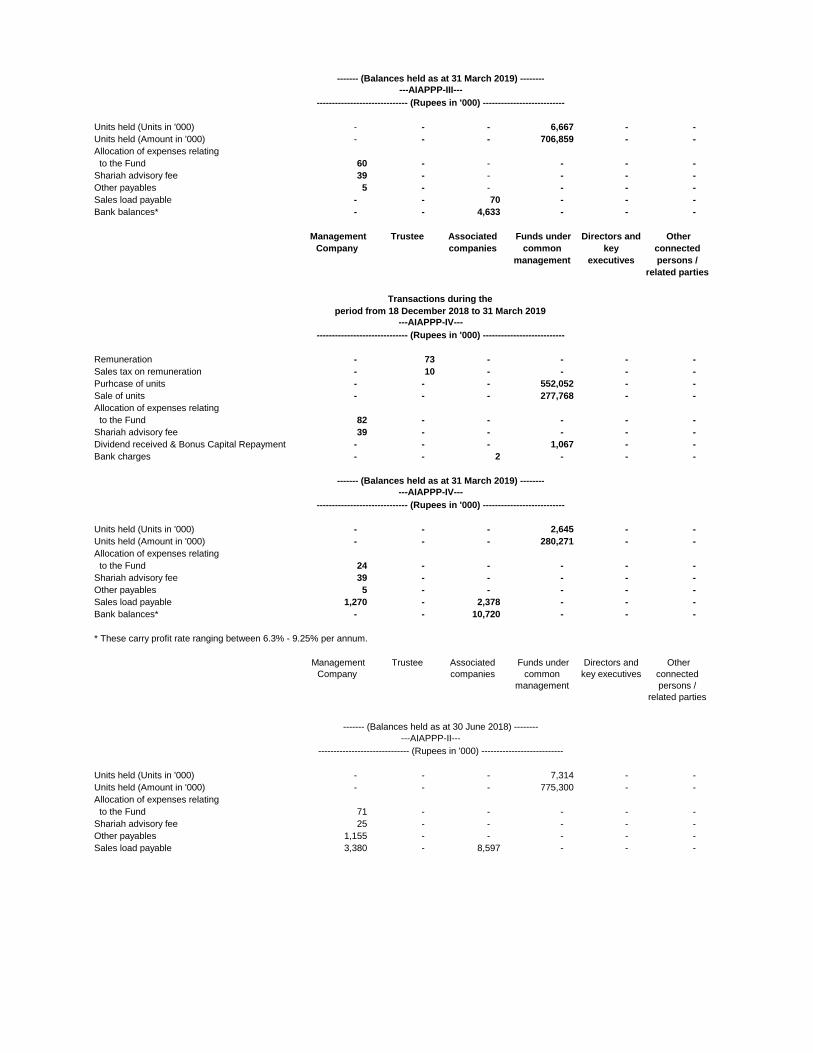
Units held (Units in '000) - - - 6,667 - -
Units held (Amount in '000) - - - 706,859 - -
Allocation of expenses relating
to the Fund 60 - - - - -
Shariah advisory fee 39 - - - - -
Other payables 5 - - - - -
Sales load payable - - 70 - - -
Bank balances* - - 4,633 - - -
Remuneration - 73 - - - -
Sales tax on remuneration - 10 - - - -
Purhcase of units - - - 552,052 - -
Sale of units - - - 277,768 - -
Allocation of expenses relating
to the Fund 82 - - - - -
Shariah advisory fee 39 - - - - -
Dividend received & Bonus Capital Repayment - - - 1,067 - -
Bank charges - - 2 - - -
Units held (Units in '000) - - - 2,645 - -
Units held (Amount in '000) - - - 280,271 - -
Allocation of expenses relating
to the Fund 24 - - - - -
Shariah advisory fee 39 - - - - -
Other payables 5 - - - - -
Sales load payable 1,270 - 2,378 - - -
Bank balances* - - 10,720 - - -
* These carry profit rate ranging between 6.3% - 9.25% per annum.
Units held (Units in '000) - - - 7,314 - -
Units held (Amount in '000) - - - 775,300 - -
Allocation of expenses relating
to the Fund 71 - - - - -
Shariah advisory fee 25 - - - - -
Other payables 1,155 - - - - -
Sales load payable 3,380 - 8,597 - - -
Other
connected
persons /
related parties
Trustee
Other
connected
persons /
related parties
Directors and
key
executives
Directors and
key executives
------------------------------ (Rupees in '000) ---------------------------
---AIAPPP-II---
Associated
companies
---AIAPPP-III---
------------------------------ (Rupees in '000) ---------------------------
------- (Balances held as at 30 June 2018) --------
------- (Balances held as at 31 March 2019) --------
---AIAPPP-IV---
------------------------------ (Rupees in '000) ---------------------------
Management
Company
Funds under
common
management
Trustee
------------------------------ (Rupees in '000) ---------------------------
period from 18 December 2018 to 31 March 2019
------- (Balances held as at 31 March 2019) --------
Funds under
common
management
Associated
companies
---AIAPPP-IV---
Management
Company
Transactions during the
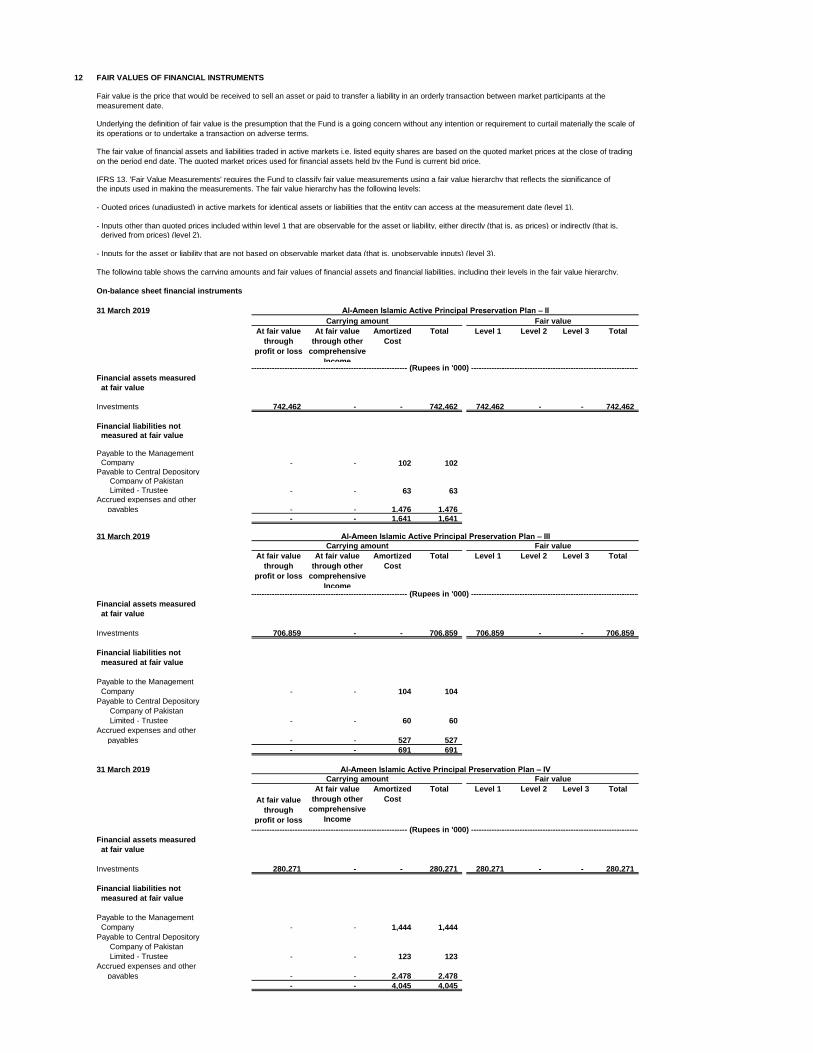
12 FAIR VALUES OF FINANCIAL INSTRUMENTS
IFRS 13, 'Fair Value Measurements' requires the Fund to classify fair value measurements using a fair value hierarchy that reflects the significance of
the inputs used in making the measurements. The fair value hierarchy has the following levels:
- Quoted prices (unadjusted) in active markets for identical assets or liabilities that the entity can access at the measurement date (level 1).
- Inputs other than quoted prices included within level 1 that are observable for the asset or liability, either directly (that is, as prices) or indirectly (that is,
derived from prices) (level 2).
- Inputs for the asset or liability that are not based on observable market data (that is, unobservable inputs) (level 3).
The following table shows the carrying amounts and fair values of financial assets and financial liabilities, including their levels in the fair value hierarchy.
On-balance sheet financial instruments
31 March 2019
At fair value
through
profit or loss
At fair value
through other
comprehensive
Income
Amortized
Cost
Total Level 1 Level 2 Level 3 Total
Financial assets measured
at fair value
Investments 742,462 - - 742,462 742,462 - - 742,462
Financial liabilities not
measured at fair value
Payable to the Management
Company - - 102 102 Payable to Central Depository
Company of Pakistan
Limited - Trustee - - 63 63 Accrued expenses and other
payables - - 1,476 1,476
- - 1,641 1,641
31 March 2019
At fair value
through
profit or loss
At fair value
through other
comprehensive
Income
Amortized
Cost
Total Level 1 Level 2 Level 3 Total
Financial assets measured
at fair value
Investments 706,859 - - 706,859 706,859 - - 706,859
Financial liabilities not
measured at fair value
Payable to the Management
Company - - 104 104
Payable to Central Depository
Company of Pakistan
Limited - Trustee - - 60 60
Accrued expenses and other
payables - - 527 527
- - 691 691
31 March 2019
At fair value
through
profit or loss
At fair value
through other
comprehensive
Income
Amortized
Cost
Total Level 1 Level 2 Level 3 Total
Financial assets measured
at fair value
Investments 280,271 - - 280,271 280,271 - - 280,271
Financial liabilities not
measured at fair value
Payable to the Management
Company - - 1,444 1,444
Payable to Central Depository
Company of Pakistan
Limited - Trustee - - 123 123
Accrued expenses and other
payables - - 2,478 2,478
- - 4,045 4,045
----------------------------------------------------------------- (Rupees in '000) ----------------------------------------------------------------------
Carrying amount Fair value
----------------------------------------------------------------- (Rupees in '000) ----------------------------------------------------------------------
Al-Ameen Islamic Active Principal Preservation Plan – IV
Fair value is the price that would be received to sell an asset or paid to transfer a liability in an orderly transaction between market participants at the
measurement date.
Underlying the definition of fair value is the presumption that the Fund is a going concern without any intention or requirement to curtail materially the scale of
its operations or to undertake a transaction on adverse terms.
The fair value of financial assets and liabilities traded in active markets i.e. listed equity shares are based on the quoted market prices at the close of trading
on the period end date. The quoted market prices used for financial assets held by the Fund is current bid price.
Carrying amount
Carrying amount
Fair value
Al-Ameen Islamic Active Principal Preservation Plan – II
Fair value
Al-Ameen Islamic Active Principal Preservation Plan – III
----------------------------------------------------------------- (Rupees in '000) ----------------------------------------------------------------------
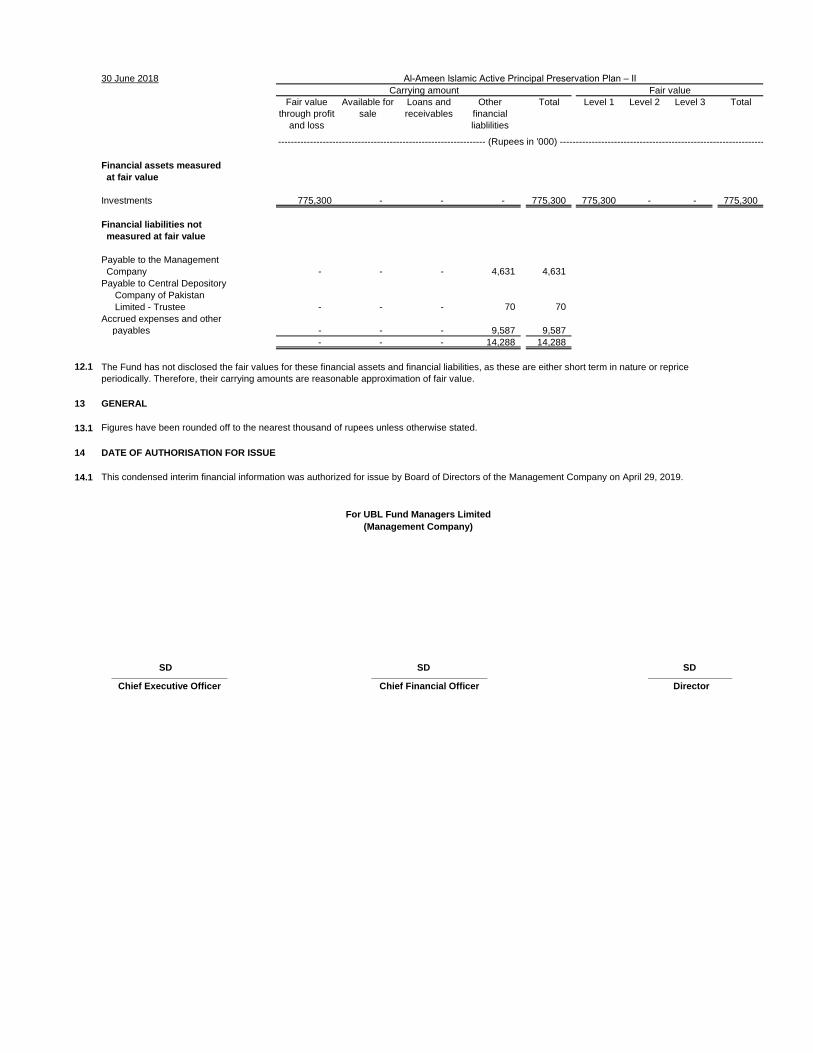
30 June 2018
Fair value
through profit
and loss
Available for
sale
Loans and
receivables
Other
financial
liablilities
Total Level 1 Level 2 Level 3 Total
----------------------------------------------------------------- (Rupees in '000) ----------------------------------------------------------------------
Financial assets measured
at fair value
Investments 775,300 - - - 775,300 775,300 - - 775,300
Financial liabilities not
measured at fair value
Payable to the Management
Company - - - 4,631 4,631
Payable to Central Depository
Company of Pakistan
Limited - Trustee - - - 70 70
Accrued expenses and other
payables - - - 9,587 9,587
- - - 14,288 14,288
12.1 The Fund has not disclosed the fair values for these financial assets and financial liabilities, as these are either short term in nature or reprice
periodically. Therefore, their carrying amounts are reasonable approximation of fair value.
13 GENERAL
13.1
14 DATE OF AUTHORISATION FOR ISSUE
14.1 This condensed interim financial information was authorized for issue by Board of Directors of the Management Company on April 29, 2019.
______________________ ______________________ ________________
Chief Executive Officer Chief Financial Officer Director
For UBL Fund Managers Limited
(Management Company)
Al-Ameen Islamic Active Principal Preservation Plan – II
Carrying amount Fair value
Figures have been rounded off to the nearest thousand of rupees unless otherwise stated.
SD SD SD