Embed Size (px)
Citation preview
Financial Report2021
Financial Report 2021
In 2020, the impact of COVID-19 has accelerated many trends we already recognized within our society and our industry. Our clients’ needs and consumer behavior have also evolved. The long-term effect of the pandemic will be to further boost digital use and innovation across the world. This fits precisely with our competitive advantage as one of the very few integrated global communication, data and marketing innovators. The strategy of Integrated Growth Solutions will deliver top-line growth for our clients by combining our diverse capabilities across the Dentsu Group. The Group occupies a unique market position with expertise across Content & Sports Marketing, Media Activation, Creative, Marketing Technology, CXM, and Systems Integration — all underpinned by our deep expertise in consumer intelligence. This in turn implies that the competitive environment surrounding our Group is becoming increasingly diverse. Our competitors are no longer limited to those companies in the advertising industry; new competitors include consulting firms and system integrators. In addition, the question facing the management of every company is how to integrate the creation of social value with the growth of the business. Consumers require companies to provide social value through both corporate behavior and products. To respond swiftly to these changes, in August 2020 the Group announced a Comprehensive Review to accelerate the structural reform and business transformation required to return the Group to growth and deliver margin improvement. Ultimately, the issue was how to address improving value for our shareholders, our employees and our clients. We announced in February 2021, the “Dentsu Group Medium-term Management Plan — Sustainable Growth through Transformation —” for the four-year period from FY2021 to FY2024. This includes our plan to transform our business in response to the changing new business environment, to accurately capture business opportunities and to realize business growth in the future. We will accelerate the structural reforms that we have already initiated and
focus on the following four pillars to realize the path from business recovery to growth through business transformation so that we can achieve continued improvement in corporate value.
1. Transformation & Growth2. Operations & Margin3. Capital allocation & Shareholder returns4. Social impact & ESG
As we look forward into 2021, uncertainties remain, but the Board remains confident that the medium- and long-term growth drivers for our business are strong. With greater cost and balance sheet efficiency, we believe that our strategy will deliver future value for all of our stakeholders.
Management Targets and Policies from Medium-term Management Plan
Transformation & Growth• Organic growth of 3-4% CAGR 2021: 2024• Customer Transformation & Technology to reach 50%
of Group revenue less cost of sales over time
Operations & Margin• Progressive year-on-year improvement in underlying
operating margin: 17%+ by 2024 (DJN: 20%, DI:15% by 2022)
Capital allocation & Shareholder returns• Medium-term average of 1.5x Net Debt / EBITDA (non
IFRS 16 basis)• Dividend payout ratio to reach 35% of underlying
basic EPS over the next few years
Social impact & ESG• 46% absolute reduction in CO2 & 100% renewable energy
(in markets where available) by 2030• Improvement in employee engagement score• Diverse & inclusive workforce
Management Policies, Management Environment and Issues to be Addressed, etc.
Any forward-looking statements in the following discussion and analysis are based on the judgment of management as of the date that Dentsu Group Inc. (hereinafter “the Company”) filed its securities report for the fiscal year ended December 31, 2020 with regulatory authorities.
Dentsu Group Integrated Report 20211
In 2020, the global economy deteriorated rapidly due to the spread of COVID-19. It also began to affect the Group’s Japan and international businesses particularly after March 2020. Under such circumstances, for the business results during FY2020 (from January 1 to December 31, 2020), the Group posted ¥ 939,243 million in revenue (down 10.4% year on year), ¥ 835,042 million in revenue less cost of sales (down 11.1% year on year), and the revenue less cost of sales organic growth rate (internal growth rate factoring out the effects of foreign exchange rates and acquisitions) was down 11.1%. As a result of cost- control efforts to combat economic deterioration, underlying operating profit was ¥ 123,979 million (down 11.9% year on year), operating margin (underlying operating profit divided by revenue less cost of sales) was 14.8% (15.0% in the previous fiscal year), and underlying net profit attributable to owners of the parent was ¥ 69,890 million (down 8.2% year on year). The percentage of consolidated revenue less cost of sales generated by the digital domain grew to 53.9% (47.5% in the previous fiscal year), indicating the progress of the Group’s business model shift to high-growth domains. Meanwhile, in terms of standard profit items, due to the recording of an impairment loss on goodwill in Dentsu International, and restructuring costs in Japan and overseas, operating loss was ¥ 140,625 million (operating loss was ¥ 3,358 million in the previous fiscal year) and loss attributable to owners of the parent was ¥ 159,596 million (loss attributable to owners of the parent was ¥ 80,893 million in the previous fiscal year). At the Ordinary General Meeting of Shareholders held in March 2021, we proposed Wendy Clark, Global CEO of Dentsu International Limited, as a new candidate for Director, and she was duly appointed by the General Meeting of Shareholders.
Notes
Underlying operating profit: a profit indicator to measure recurring business performance which is calculated as operating profit added with M&A related items and one-off items. M&A related items: amortization of purchased intangible assets, acquisition costs, share-based compensation expenses related to acquired companies, share-based compensation expense issued following the acquisition of 100% ownership of a subsidiary. One-off items: items such as restructuring costs, impairment loss and gain/loss on sales of non-current assets. Underlying net profit attributable to owners of the parent: an indicator to measure recurring net profit attributable to owners of the parent which is calculated as net profit (attributable to owners of the parent) added with adjustment items related to operating profit, change in fair value of contingent considerations (gain/loss on revaluation of earnout liabilities), remeasurements of share purchase liabilities (gain/loss on revaluation of M&A related put-option liabilities), tax-related, NCI profit-related and other one-off items.
Comprehensive Business Overview
Dentsu Group Integrated Report 20212
Financial Report 2021
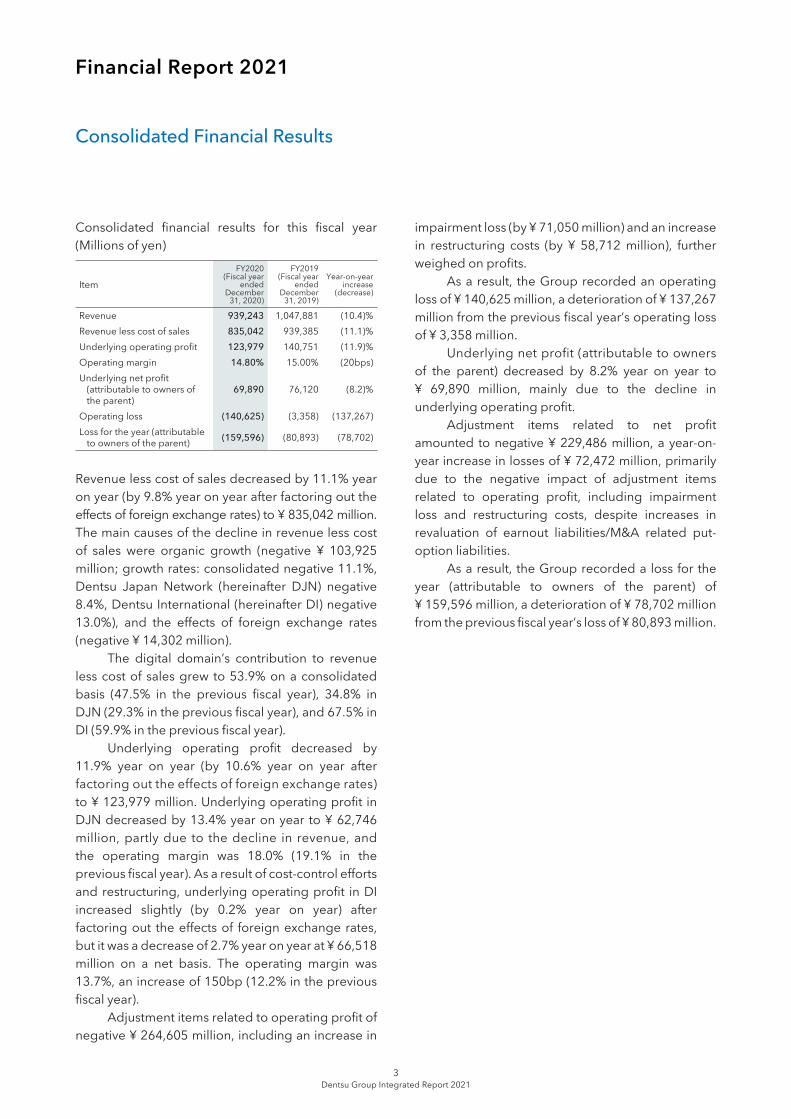
Consolidated financial results for this fiscal year (Millions of yen)
Revenue less cost of sales decreased by 11.1% year on year (by 9.8% year on year after factoring out the effects of foreign exchange rates) to ¥ 835,042 million. The main causes of the decline in revenue less cost of sales were organic growth (negative ¥ 103,925 million; growth rates: consolidated negative 11.1%, Dentsu Japan Network (hereinafter DJN) negative 8.4%, Dentsu International (hereinafter DI) negative 13.0%), and the effects of foreign exchange rates (negative ¥ 14,302 million). The digital domain’s contribution to revenue less cost of sales grew to 53.9% on a consolidated basis (47.5% in the previous fiscal year), 34.8% in DJN (29.3% in the previous fiscal year), and 67.5% in DI (59.9% in the previous fiscal year). Underlying operating profit decreased by 11.9% year on year (by 10.6% year on year after factoring out the effects of foreign exchange rates) to ¥ 123,979 million. Underlying operating profit in DJN decreased by 13.4% year on year to ¥ 62,746 million, partly due to the decline in revenue, and the operating margin was 18.0% (19.1% in the previous fiscal year). As a result of cost-control efforts and restructuring, underlying operating profit in DI increased slightly (by 0.2% year on year) after factoring out the effects of foreign exchange rates, but it was a decrease of 2.7% year on year at ¥ 66,518 million on a net basis. The operating margin was 13.7%, an increase of 150bp (12.2% in the previous fiscal year). Adjustment items related to operating profit of negative ¥ 264,605 million, including an increase in
ItemFY2020
(Fiscal year ended
December 31, 2020)
FY2019 (Fiscal year
ended December
31, 2019)
Year-on-year increase
(decrease)
Revenue 939,243 1,047,881 (10.4)%Revenue less cost of sales 835,042 939,385 (11.1)%Underlying operating profit 123,979 140,751 (11.9)%Operating margin 14.80% 15.00% (20bps)Underlying net profit
(attributable to owners of the parent)
69,890 76,120 (8.2)%
Operating loss (140,625) (3,358) (137,267)Loss for the year (attributable
to owners of the parent) (159,596) (80,893) (78,702)
impairment loss (by ¥ 71,050 million) and an increase in restructuring costs (by ¥ 58,712 million), further weighed on profits. As a result, the Group recorded an operating loss of ¥ 140,625 million, a deterioration of ¥ 137,267 million from the previous fiscal year’s operating loss of ¥ 3,358 million. Underlying net profit (attributable to owners of the parent) decreased by 8.2% year on year to ¥ 69,890 million, mainly due to the decline in underlying operating profit. Adjustment items related to net profit amounted to negative ¥ 229,486 million, a year-on- year increase in losses of ¥ 72,472 million, primarily due to the negative impact of adjustment items related to operating profit, including impairment loss and restructuring costs, despite increases in revaluation of earnout liabilities/M&A related put- option liabilities. As a result, the Group recorded a loss for the year (attributable to owners of the parent) of ¥ 159,596 million, a deterioration of ¥ 78,702 million from the previous fiscal year’s loss of ¥ 80,893 million.
Consolidated Financial Results
Dentsu Group Integrated Report 20213
Dentsu Japan Network
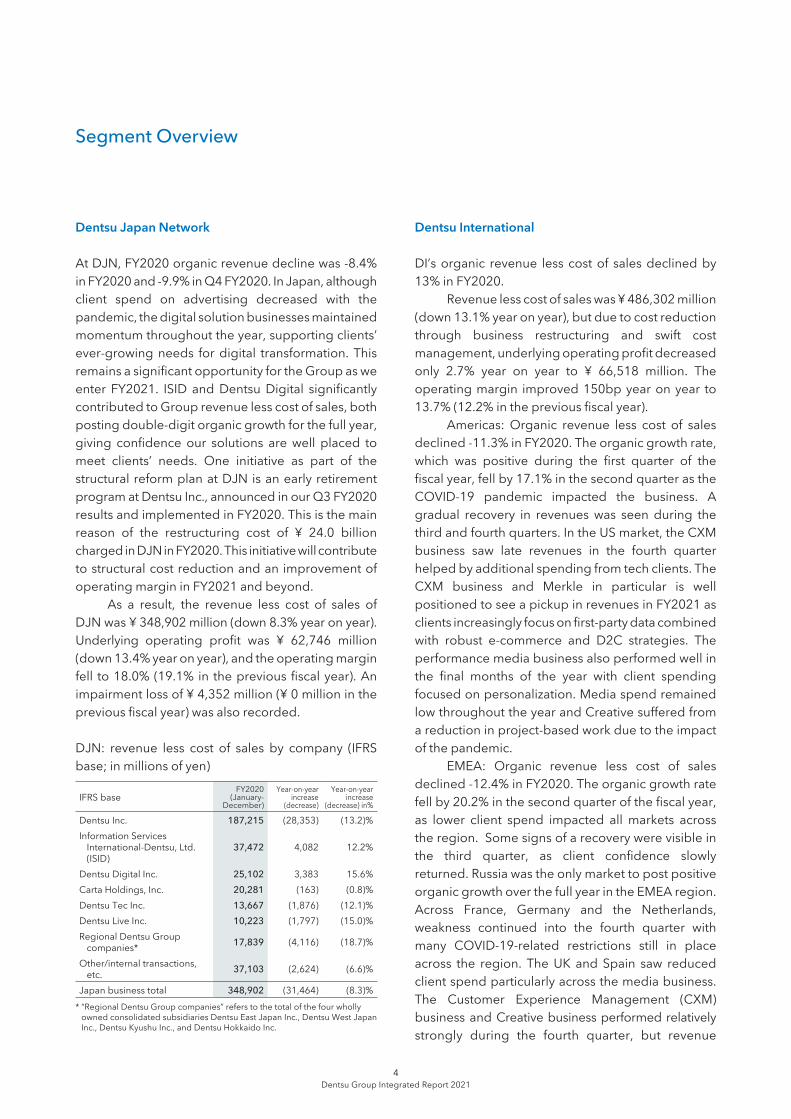
At DJN, FY2020 organic revenue decline was -8.4% in FY2020 and -9.9% in Q4 FY2020. In Japan, although client spend on advertising decreased with the pandemic, the digital solution businesses maintained momentum throughout the year, supporting clients’ ever-growing needs for digital transformation. This remains a significant opportunity for the Group as we enter FY2021. ISID and Dentsu Digital significantly contributed to Group revenue less cost of sales, both posting double-digit organic growth for the full year, giving confidence our solutions are well placed to meet clients’ needs. One initiative as part of the structural reform plan at DJN is an early retirement program at Dentsu Inc., announced in our Q3 FY2020 results and implemented in FY2020. This is the main reason of the restructuring cost of ¥ 24.0 billion charged in DJN in FY2020. This initiative will contribute to structural cost reduction and an improvement of operating margin in FY2021 and beyond. As a result, the revenue less cost of sales of DJN was ¥ 348,902 million (down 8.3% year on year). Underlying operating profit was ¥ 62,746 million (down 13.4% year on year), and the operating margin fell to 18.0% (19.1% in the previous fiscal year). An impairment loss of ¥ 4,352 million (¥ 0 million in the previous fiscal year) was also recorded.
DJN: revenue less cost of sales by company (IFRS base; in millions of yen)
IFRS baseFY2020
(January-December)
Year-on-year increase
(decrease)
Year-on-year increase
(decrease) in%
Dentsu Inc. 187,215 (28,353) (13.2)%Information Services
International-Dentsu, Ltd.(ISID)
37,472 4,082 12.2%
Dentsu Digital Inc. 25,102 3,383 15.6%Carta Holdings, Inc. 20,281 (163) (0.8)%Dentsu Tec Inc. 13,667 (1,876) (12.1)%Dentsu Live Inc. 10,223 (1,797) (15.0)%Regional Dentsu Group
companies* 17,839 (4,116) (18.7)%
Other/internal transactions, etc. 37,103 (2,624) (6.6)%
Japan business total 348,902 (31,464) (8.3)%* “Regional Dentsu Group companies” refers to the total of the four wholly
owned consolidated subsidiaries Dentsu East Japan Inc., Dentsu West Japan Inc., Dentsu Kyushu Inc., and Dentsu Hokkaido Inc.
Dentsu International
DI’s organic revenue less cost of sales declined by 13% in FY2020. Revenue less cost of sales was ¥ 486,302 million (down 13.1% year on year), but due to cost reduction through business restructuring and swift cost management, underlying operating profit decreased only 2.7% year on year to ¥ 66,518 million. The operating margin improved 150bp year on year to 13.7% (12.2% in the previous fiscal year). Americas: Organic revenue less cost of sales declined -11.3% in FY2020. The organic growth rate, which was positive during the first quarter of the fiscal year, fell by 17.1% in the second quarter as the COVID-19 pandemic impacted the business. A gradual recovery in revenues was seen during the third and fourth quarters. In the US market, the CXM business saw late revenues in the fourth quarter helped by additional spending from tech clients. The CXM business and Merkle in particular is well positioned to see a pickup in revenues in FY2021 as clients increasingly focus on first-party data combined with robust e-commerce and D2C strategies. The performance media business also performed well in the final months of the year with client spending focused on personalization. Media spend remained low throughout the year and Creative suffered from a reduction in project-based work due to the impact of the pandemic. EMEA: Organic revenue less cost of sales declined -12.4% in FY2020. The organic growth rate fell by 20.2% in the second quarter of the fiscal year, as lower client spend impacted all markets across the region. Some signs of a recovery were visible in the third quarter, as client confidence slowly returned. Russia was the only market to post positive organic growth over the full year in the EMEA region. Across France, Germany and the Netherlands, weakness continued into the fourth quarter with many COVID-19-related restrictions still in place across the region. The UK and Spain saw reduced client spend particularly across the media business. The Customer Experience Management (CXM) business and Creative business performed relatively strongly during the fourth quarter, but revenue
Segment Overview
Dentsu Group Integrated Report 20214
Financial Report 2021
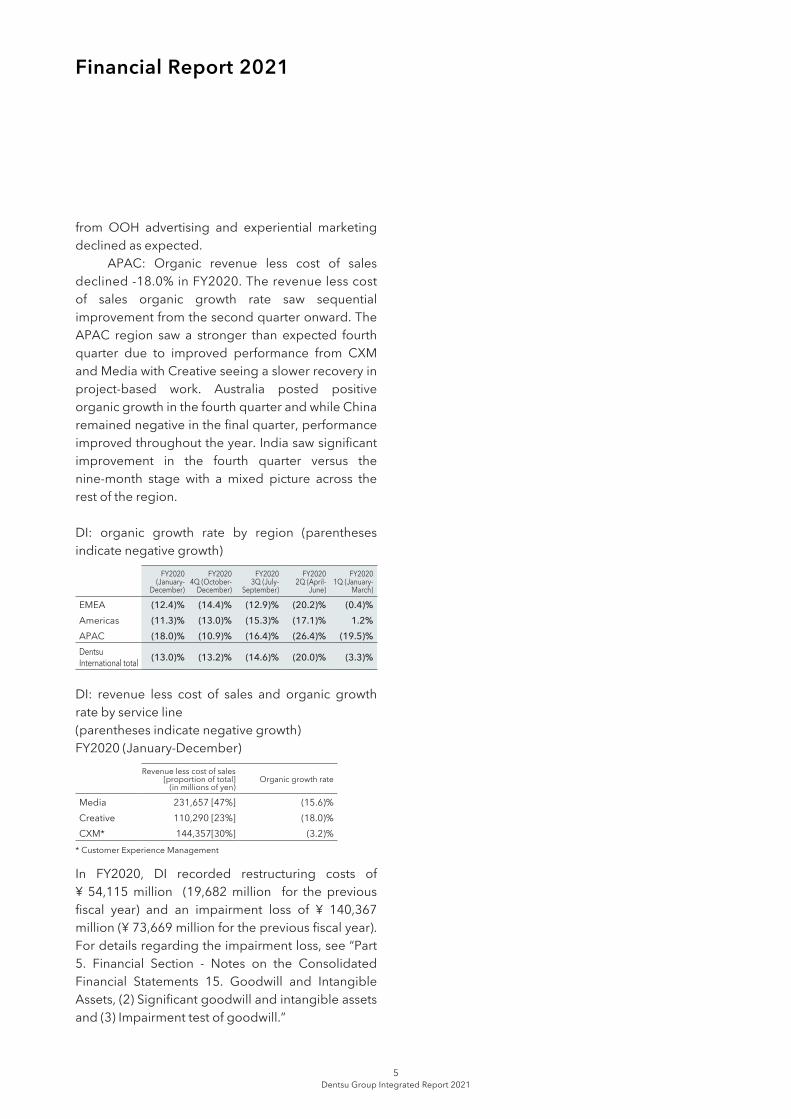
from OOH advertising and experiential marketing declined as expected. APAC: Organic revenue less cost of sales declined -18.0% in FY2020. The revenue less cost of sales organic growth rate saw sequential improvement from the second quarter onward. The APAC region saw a stronger than expected fourth quarter due to improved performance from CXM and Media with Creative seeing a slower recovery in project-based work. Australia posted positive organic growth in the fourth quarter and while China remained negative in the final quarter, performance improved throughout the year. India saw significant improvement in the fourth quarter versus the nine-month stage with a mixed picture across the rest of the region.
DI: organic growth rate by region (parentheses indicate negative growth)
DI: revenue less cost of sales and organic growth rate by service line(parentheses indicate negative growth)FY2020 (January-December)
In FY2020, DI recorded restructuring costs of ¥ 54,115 million (19,682 million for the previous fiscal year) and an impairment loss of ¥ 140,367 million (¥ 73,669 million for the previous fiscal year). For details regarding the impairment loss, see “Part 5. Financial Section - Notes on the Consolidated Financial Statements 15. Goodwill and Intangible Assets, (2) Significant goodwill and intangible assets and (3) Impairment test of goodwill.”
FY2020 (January-
December)
FY2020 4Q (October-
December)
FY2020 3Q (July-
September)
FY2020 2Q (April-
June)
FY2020 1Q (January-
March)
EMEA (12.4)% (14.4)% (12.9)% (20.2)% (0.4)%Americas (11.3)% (13.0)% (15.3)% (17.1)% 1.2%APAC (18.0)% (10.9)% (16.4)% (26.4)% (19.5)%Dentsu International total (13.0)% (13.2)% (14.6)% (20.0)% (3.3)%
Revenue less cost of sales[proportion of total]
(in millions of yen)Organic growth rate
Media 231,657 [47%] (15.6)%Creative 110,290 [23%] (18.0)%CXM* 144,357[30%] (3.2)%
* Customer Experience Management
Dentsu Group Integrated Report 20215
Financial position
As of December 31, 2020, total assets decreased by ¥ 415,316 million compared to December 31, 2019, primarily due to decreases in other financial assets in DJN, and goodwill in DI. Total liabilities decreased by ¥ 183,136 million, primarily due to a decrease in trade payables. Total equity decreased by ¥ 232,180 million, primarily due to the recording of a loss attributable to owners of the parent. Other financial assets in DJN decreased as a result of the Comprehensive Review as described in “Management Policies, Management Environment, and Issues to be Addressed, etc.” on page 1. The Group will ensure a disciplined approach to capital allocation with a priority to enhance shareholder value. It is the Group’s policy to manage Net Debt / EBITDA at 1.5x over the medium term (after factoring out the effects of applying IFRS 16;), as described in “Management Policies, Management Environment, and Issues to be Addressed, etc.” on page 1. In the short term, leverage may be managed at a lower level than 1.5x as the Group reviews ownership of non-trading assets in line with the aims of the Comprehensive Review.
Cash flows
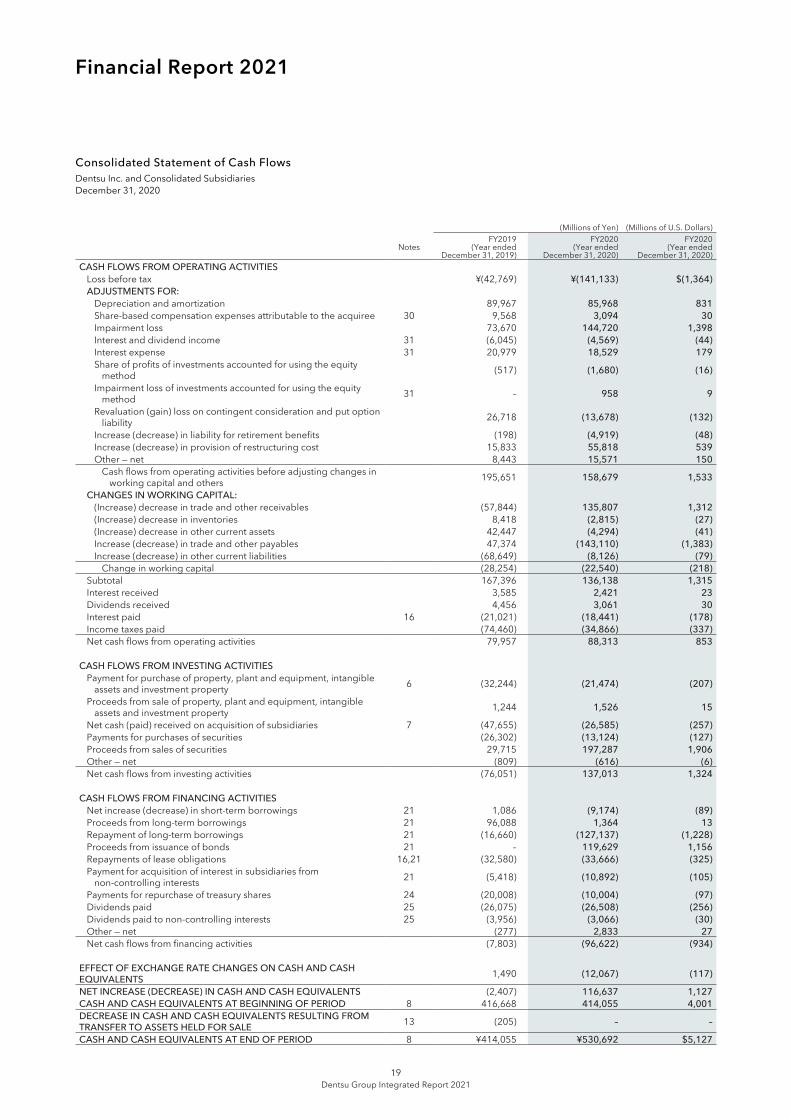
As of December 31, 2020, cash and cash equivalents (hereinafter “cash”) amounted to ¥ 530,692 million (compared to ¥ 414,055 million at the end of the previous fiscal year). This was an increase of ¥ 116,637 million from the end of the previous fiscal year, primarily due to cash provided by investing activities.
Net cash flow from operating activities
Net cash provided by operating activities increased by ¥ 8,356 million year on year to ¥ 88,313 million. Working capital decreased by ¥ 22,540 million, a smaller decrease than in the previous fiscal year, when it decreased by ¥ 28,254 million. In addition, the increase in net cash provided by operating activities was largely due to a year-on-year decrease in income taxes paid.
Net cash flow from investing activities
Net cash provided by investing activities increased by ¥ 213,064 million year on year to ¥ 137,013 million. This was primarily due to an increase in proceeds from sales of securities. Proceeds from sales of securities increased in line with the objectives of the Comprehensive Review of the Group, as described in “ Management Policies, Management Environment, and Issues to be Addressed, etc.” on page 1.
Net cash flow from financing activities
Net cash used in financing activities increased by ¥ 88,818 million year on year to ¥ 96,622 million. This was primarily due to a decrease in cash as a result of a decrease in proceeds from long-term borrowings and an increase in repayment of long-term borrowings using funds raised from the issuance of corporate bonds, despite an increase in proceeds from the issuance of these bonds. The Group paid ¥ 10,004 million for the repurchase of treasury shares during the fiscal year ended December 31, 2020 following the announcement to acquire its own shares up to a maximum value of 30.0 billion yen at the meeting of the Board of Directors held on August 7, 2019.
Furthermore, at the meeting of the Board of Directors held on February 15, 2021, the Company resolved to acquire its own shares up to a maximum value of ¥ 30.0 billion. (Acquisition period: February 16, 2021 to December 23, 2021)
Analysis and discussion of financial position
Forward-looking matters contained in this section are based on the judgment of the Group at the time when this annual securities report was submitted.
1) Basic approach to capital policy and financial strategy
During the period covered by the Medium-term Management Plan announced in February 2021, the Group seeks to provide solutions for social issues and enhance its enterprise and shareholders’ value
Financial Position and Cash Flows
Dentsu Group Integrated Report 20216
Financial Report 2021
by proactively capturing the changes in society and business opportunities brought by digitalization, being mindful of the stability of the Group’s business and financial position. Regarding financial soundness, the Group aims to maintain a high credit rating by keeping a medium-term average of 1.5x Net Debt / EBITDA (after factoring out the effects of applying IFRS 16). We ensure sufficient liquidity on hand through the use of internal reserves, loans from financial institutions, corporate bonds, commercial paper, receivables factoring, and commitment lines, among others. During FY2020, we also established additional, temporary loan commitments from financial institutions. In this way, we endeavor to maintain a high degree of resilience against risks, including dramatic changes in the business environment. We will maintain our investment in growth, including M&A and capital expenditures, across the Group as a whole, while taking care to ensure management stability and financial soundness. The Group aims at providing a return to shareholders by appropriately allocating the generated income and improving intrinsic enterprise value; and seeks to progressively enhance the dividend payout ratio, reaching 35% of underlying basic EPS over the next few years.
2) Main demands on funds
The Group’s main demands on working capital come from selling, general and administrative expenses, primarily the payment of media inventory and production expenses for advertising operations, and personnel expenses. During the period covered by the Medium-term Management Plan announced in February 2021, demand for funds is expected to relate to the development of new technologies and solutions, and investment in innovation, as well as M&A and investment activities focused on the growth areas of Customer Transformation & Technology.
3) Financing and liquidity
The Group flexibly selects the optimal source of
funds from among a diverse range of sources including internal reserves, loans from financial institutions, corporate bonds, commercial paper, receivables factoring, etc., based on a consideration of the market environment at each point in time, and the amount of long-term funds repayable each fiscal year. With our transition to a holding company structure in FY2020, as a rule, long-term funds for the Group are sourced centrally through the Company. In addition, the Company has established a commitment line of ¥ 50.0 billion through a syndicated bank facility, and Dentsu International Limited has established an undrawn 500 million pounds (approximately ¥ 69.9 billion) commitment line, in order to ensure liquidity, if required. Moreover, we have introduced a cash management system, where the parent company borrows funds from subsidiaries with excess cash and lends these to other subsidiaries in need of funds, for the purposes of centralizing financing within the Group, increasing the efficiency of funds operations and ensuring liquidity. The Group regards maintaining and enhancing its ability to secure stable external financing as an important management task. It has a long-term rating of AA- and a short-term rating of a-1+ from the credit rating agency Rating and Investment Information, Inc. (R&I). We consider it possible for the Group to maintain and expand its businesses, secure the necessary working capital, and raise funds to invest in growth, with no significant difficulty, based on the broad-reaching and strong relationships that we have built with major financial institutions in Japan and overseas over many years.
Dentsu Group Integrated Report 20217
The following is a list of major risks associated with the execution of the Group’s strategies, businesses, and other activities that may affect the decisions of investors. However, it is not an exhaustive list of all risks, and it may be affected in the future by risks that are not currently foreseen or considered significant. The Group is taking various measures and creating various mechanisms to minimize such management and business risks and take advantage of these risks as opportunities. Forward-looking statements in the discussion below are based on judgments made by the Group as of the date of filing of the annual securities report.
Our risk management structureUnder the corporate governance structure presented in the diagram below, the Group has established the Internal Control and Risk Committee, which oversees the management of risks as uncertain factors that may impede the achievement of management goals in the future. In 2020, the Internal Control and Risk Committee met three times to identify and assess risks that are important to the management of the Group and business activities, and will start utilizing the Enterprise Risk Management (ERM) approach. In order to prevent the materialization of identified risks and minimize the impact if they materialize, the Committee has selected risk sponsors, delegated the formulation and implementation of risk response plans to them, and regularly monitored the response status. In addition, an internal control and risk committee has been established in DJN, which is our Japan business, and a risk committee has been established in DI, which is our international business, and they perform similar risk management activities. In 2020, the DJN internal control and risk committee met six times and the DI risk committee met four times.
(1) Risks associated with cyclical changes in the global economy and social changes accelerated by the impact of COVID-19
The financial results of the Group tend to be susceptible to economic fluctuations as budgets of companies, which are our major clients, are often
increased or decreased in response to economic conditions. In particular, the continued slowdown in the macro economy resulting from the spread of COVID-19 may continue to negatively affect the financial results of the Group. The impact of COVID-19 will not only be in the economy, but will also accelerate changes in the consciousness and behavioral patterns of consumers, and companies will be forced to not only respond to these changes, but also to make essential changes in their corporate activities, such as remote work and digital transformation. The needs of customers are becoming more sophisticated and complex, going beyond the conventional advertising and communication fields, and if we are unable to respond appropriately, it may have a negative impact on medium- to long-term business growth.
(2) Risks associated with the development of new businesses from the medium- to long-term perspectives
The Group has formulated the “Medium-term Management Plan 2024: “Sustainable Growth through Transformation” which is designed to transform our business in order to promptly respond to the changes in the business environment described above and to accurately seize new business opportunities, and announced it in February. However, there is a possibility that due to various reasons such as technological innovation, misreading of consumer attitudes, overly optimistic business plans, and a stalemate in negotiations with joint venture partners, these business development projects cannot be monetized over the medium to long term, negatively affecting the financial results of the Group. Additionally, even when projects can be monetized over the medium to long term, if it takes a certain period of time to recover the capital invested in them, it may temporarily have a negative impact on the Group’s financial results.
(3) Risks related to securing human resources
The Group’s growth potential and competitiveness depend on attracting and retaining highly skilled
Business and Other Risks
Dentsu Group Integrated Report 20218
Financial Report 2021
talent. Therefore, if the Group is unable to secure the necessary personnel due to a shortage of human resources attributable to the tight labor market and other reasons, the Group’s delivery of services to clients could be negatively affected, which leads to negative impact on the Group’s financial results. In addition, employee engagement is imperative to achieve the goals of the Medium-term Management Plan. If we fail to implement the vision and values including diversity and inclusion within the Group and to maintain employee motivation in advancing the new working style based on remote and business transformation, there will be a risk that employee loyalty will diminish, and it will become difficult to attract and retain highly skilled talent. The Group adopted the new Dentsu vision and values with the tagline “an invitation to the never before.” as its long-term direction and “The 8 Ways” as its values. Under this vision, Dentsu Group companies and individuals around the world promote teaming with each other as well as with external partners for the creation of value. The aim is to build a culture of co-creation to widely permeate the corporate culture that connects diversity to competitiveness.
(4) Risk related to the business transformation
In order to respond to the rapid changes in the business and competitive environment, the Group has decided to implement an accelerated transformation. Over a two-year period, we will consolidate more than 160 agency brands into six global leadership brands within DI. For DJN, we will promote three structural reforms: “Business Formation” “Human Resources Formation” and “Working Environment Development.” With this restructuring, the Group aims to accelerate the introduction of new business models and provide quality services to clients, increase employee satisfaction, expand revenue, and improve operating margin. However, if the restructuring does not proceed as expected, the financial results of the Group could be negatively impacted.
(5) Risks associated with the competitive environment and structural changes in the existing advertising industry
(i) Risk of price competition with competitorsThe Group faces competition from competing advertising agency groups and digital agency groups at home and abroad. As clients look to drive efficiency within their marketing budgets this can lead to price competition, especially in the media planning and buying fields. The Group provides solutions that are integrated with consumer insights cultivated over many years of experience and believes that the continuous provision of such high added value will enable the Group to differentiate itself from competitors, maintain solid relationships with clients, and avoid excessive price competition.
(ii) Risk of loss of global clientsMany of the Group’s clients operate on a global scale. From the perspective of ensuring uniformity in advertising campaigns and efficient operation, in some cases these clients conduct a bidding process (global pitch) on a global level (or a regional level) to select advertising agencies that handle these campaigns. Global pitches tend to involve larger media spends. If the Company loses global pitches conducted by existing clients of the Group or loses once acquired clients, it may lead to a decrease in the Group’s revenue.
(iii) Risks associated with structural changes in the media environment
The media environment surrounding consumers is undergoing a major shift to digitalization against the backdrop of technological innovation in the internet and digital devices. Taking these structural changes in the media environment as business opportunities, the Group flexibly allocates and invests its resources in next-generation media and constantly provides client companies with marketing solutions tailored to the latest consumer behavior principles. In doing so, the Group has led these structural changes in the media environment to a revenue growth.
Dentsu Group Integrated Report 20219
However, if the Group fails to respond swiftly and appropriately to the structural changes in the media environment, it may result in loss of revenue from the media, deterioration of relationships with clients, etc., which may negatively affect the financial results of the Group. In addition, given that these structural changes in the media environment are progressing in different forms and timeframes in each country and region, there is a risk that the Group will be unable to follow this trend in some countries and regions.
(iv) Expanded competition with companies in other industries
In addition to competing with advertising agency groups and digital agency groups in the same industry, the Group has faced new competition with players in other industries in the past few years. With a growing client demand for more efficient and optimized advertising and marketing activities and a greater demand for marketing communication customized for each consumer, there are increasing cases where the Group competes with players in the domains of data analytics, customer experience (CX), and consulting. If the boundary between the advertising marketing domain, which is the Group’s existing core business and other domains gets increasing blurred, and in turn competition with players in other industries intensifies, some of the Group’s revenue may be lost to these competitors. Taking these changes in the industry structure as business opportunities, we will evolve the know-how we have cultivated in advertising and marketing by combining it with data and technology to establish a model for providing integrated solutions that leverage consumer intelligence.
(v) In-house trend overseasOver the past few years, there has been an increasing trend in overseas advertising markets, especially in the US, for client companies to implement some of their marketing activities, which had been traditionally outsourced to advertising agencies, within their organizations (in-house). As a result, demand for certain low-value services provided by
traditional advertising agencies may decline, while demand for consulting functions that support clients in their in-housing efforts has been increasing. Although the Group strives to enhance its consulting functions in response to this trend, some advertising agencies within the Group may be affected by this trend.
(6) Risks related to the content business
The Group is engaged in content businesses, such as investment in the production of movies and the purchase and sale of broadcasting rights for sports events, both in Japan and overseas. Many of these content businesses involve advance payments before income is earned, and their revenue and expenditure plans extend over many fiscal years. In addition, some of the projects to acquire sponsorship and broadcasting rights for large sports events require substantial amounts of financial commitments. Having long been engaged in these content businesses, the Group has the insight to formulate revenue and expenditure plans with a certain degree of accuracy and strives to diversify risks in the content business by managing many content business projects as a single portfolio. However, it is difficult to reliably predict consumer response, which determines revenue from the content business. If some projects do not progress in line with their revenue and expenditure plans, or if the Company is forced to sell sponsorship and broadcasting rights at a price lower than their purchase cost, the financial results of the Group could be adversely affected.
(7) Impairment risk of goodwill and intangible assets
In March 2013, the Company acquired Aegis Group plc (Aegis), a UK-based major advertising company, to integrate the Group’s international business promotion function into Aegis and reorganize it as the current Dentsu International Limited (former Dentsu Aegis Network Ltd.). With the acquisition of Aegis and the subsequent acquisitions of many companies, including Merkle, made by DI the Company recorded large
Dentsu Group Integrated Report 202110
Financial Report 2021
amounts of goodwill and intangible assets. In light of the softening business performance of its international business due to COVID-19, the Group conducted impairment tests every quarter. As a result, the Group recorded an impairment loss of approximately ¥ 140 billion on goodwill. If future impairment tests for each cash- generating unit result in additional impairment losses, the Group’s financial results and financial position could be adversely affected.
(8) Risks related to information security and cyber security
The Group frequently receives undisclosed information on products, services, and business strategies of client companies in the course of doing business. The Group takes all possible measures to ensure appropriate information management, such as obtaining certification to the international standard on information security management system. Nevertheless, in the event of an information leak or other incident, the Group’s credibility could be damaged, which in turn could adversely affect the financial results of the Group. In addition, unexpected external cyberattacks and actions of employees or suppliers may threaten the confidentiality, integrity, or availability of critical business systems and data, resulting in significant operational, regulatory, financial, or reputational impact, or impact on clients. The Group has established dedicated cyber security departments for the Japan and international businesses to ensure safety and respond to new threats.
(9) Risks related to laws and regulations, litigation, etc.
(i) Risks related to violations of labor laws and regulations
The Group works on establishing a work environment that enables individual employees to thrive both in and out of work as one of its top management priorities. However, if the Group is unable to sustain a supportive work environment, a decline in motivation
and performance of the Group’s employees, a brain drain of skilled employees, and difficulties in attracting diverse human resources may arise and adversely affect the financial results of the Group. In addition, Dentsu Inc., a wholly-owned subsidiary of the Company, has been continuously engaged in work environment reforms since FY2017. These reforms have steadily improved the work environment for Dentsu employees in Japan, nevertheless, in the event of recurrence of labor management problems, the reputation of the Group may deteriorate.
(ii) Risk related to personal and other informationThe Group receives the personal information of existing and prospective customers for client companies in the course of doing business. Additionally, with a growing client demand for marketing communication customized for each consumer, the Group is engaged in developing products and services using personal data and providing them to client companies. The Group complies with laws and regulations, both in Japan and abroad, including the Act on the Protection of Personal Information and the EU General Data Protection Regulation, and responds promptly to amendments to these laws and regulations. At present the Group does not anticipate that these laws or regulations will negatively affect the Group’s businesses. However, in the event of a personal information leak or other incident, the Group’s credibility could be damaged, which in turn could adversely affect the financial results of the Group. In addition, if these laws or regulations are amended and if any restrictions are imposed on the use of personal data by the Group from an ethical point of view, making it impossible to provide some of our products and services to client companies, the Group’s businesses could be negatively impacted.
(iii) Risks related to litigation, etc.At present the Group does not have any lawsuits or disputes that could have a material impact on its financial results. However, the businesses that the Group operates in a wide range of areas can involve the risk of litigation from clients, media companies, subcontractors, and other entities both in Japan and
Dentsu Group Integrated Report 202111
overseas.
(10) Risks related to unforeseen incidents, disasters, accidents, etc.
In the event of natural disasters, failures in electricity and other social infrastructure, communication and broadcasting disruptions, distribution disruptions, large-scale accidents, infectious diseases, war, terrorism, political or social unrest, or other incident in the areas where the Group operates or develops business, they could negatively affect the business activities of the Group or its clients and in turn the financial results of the Group. The Group regularly reviews crisis management and business continuity plans (BCP) at the risk committees of DJN and DI to address the above issues that are expected in each region and market.
Dentsu Group Integrated Report 202112
Financial Report 2021
Consolidated Financial Statements
Dentsu Inc. and Consolidated SubsidiariesDecember 31, 2020
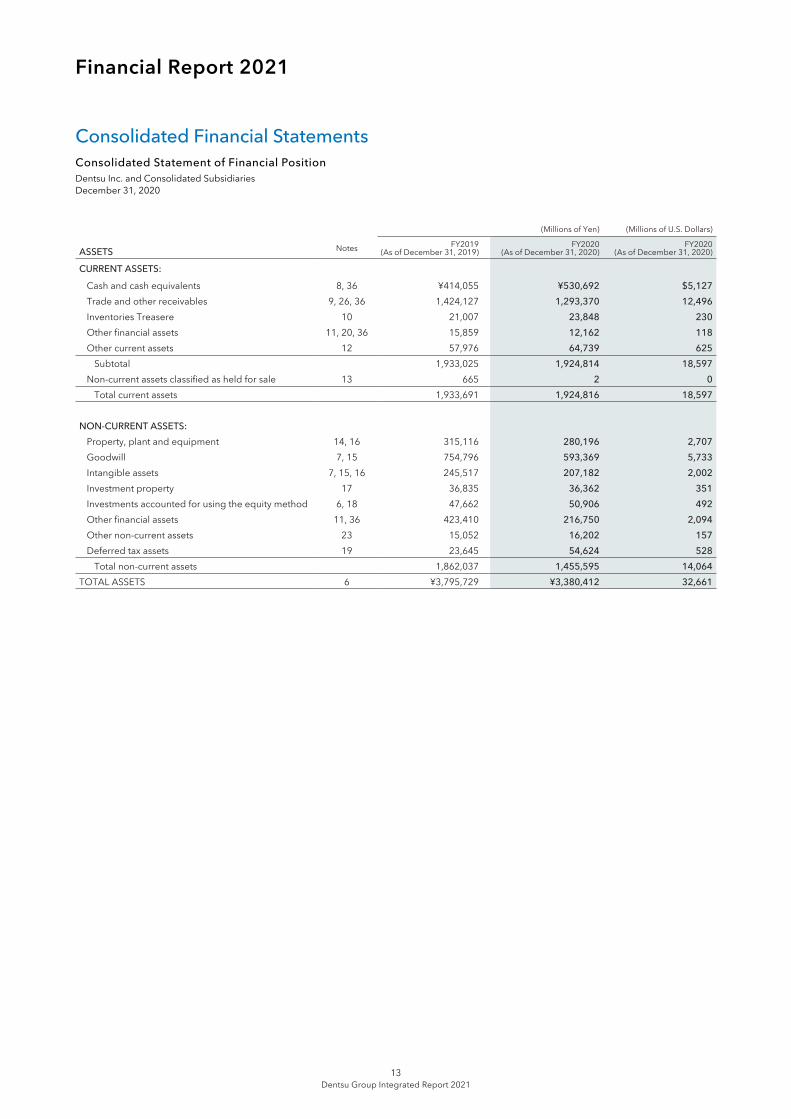
Consolidated Statement of Financial Position
(Millions of Yen) (Millions of U.S. Dollars)
ASSETS Notes FY2019(As of December 31, 2019)
FY2020(As of December 31, 2020)
FY2020(As of December 31, 2020)
CURRENT ASSETS:
Cash and cash equivalents 8, 36 ¥414,055 ¥530,692 $5,127Trade and other receivables 9, 26, 36 1,424,127 1,293,370 12,496Inventories Treasere 10 21,007 23,848 230Other financial assets 11, 20, 36 15,859 12,162 118Other current assets 12 57,976 64,739 625
Subtotal 1,933,025 1,924,814 18,597Non-current assets classified as held for sale 13 665 2 0
Total current assets 1,933,691 1,924,816 18,597
NON-CURRENT ASSETS:Property, plant and equipment 14, 16 315,116 280,196 2,707Goodwill 7, 15 754,796 593,369 5,733Intangible assets 7, 15, 16 245,517 207,182 2,002Investment property 17 36,835 36,362 351Investments accounted for using the equity method 6, 18 47,662 50,906 492Other financial assets 11, 36 423,410 216,750 2,094Other non-current assets 23 15,052 16,202 157Deferred tax assets 19 23,645 54,624 528
Total non-current assets 1,862,037 1,455,595 14,064TOTAL ASSETS 6 ¥3,795,729 ¥3,380,412 32,661
Dentsu Group Integrated Report 202113
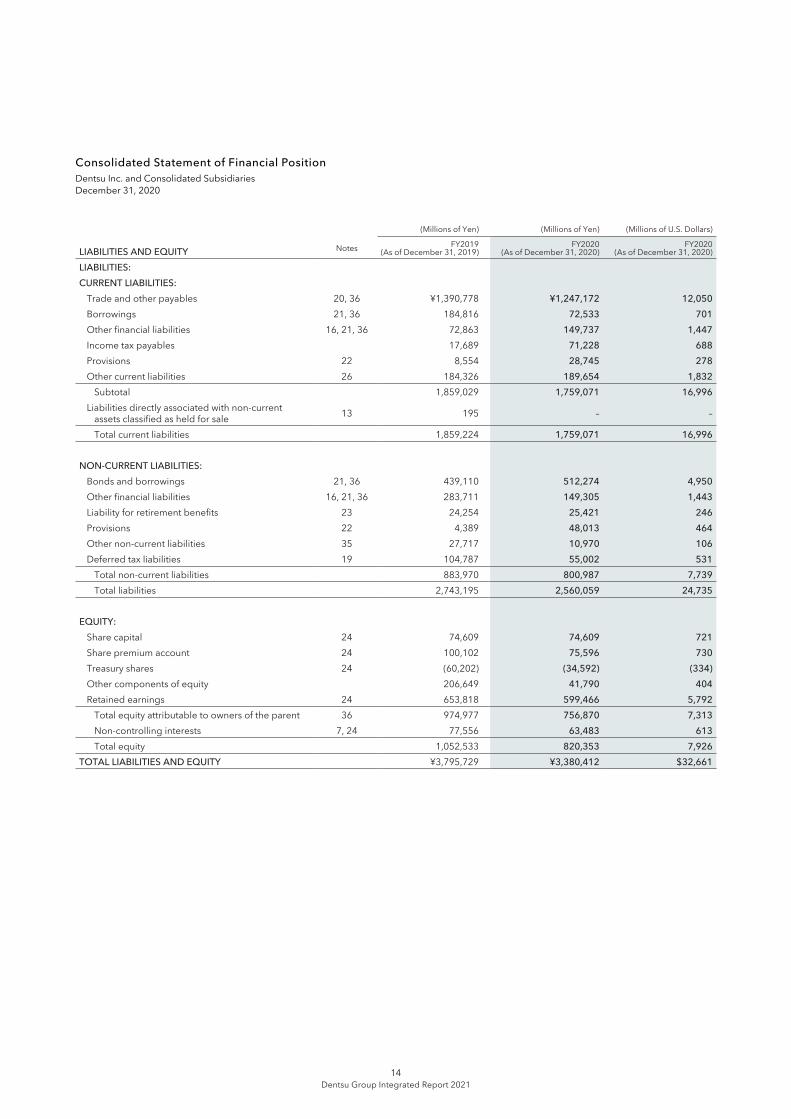
Dentsu Inc. and Consolidated SubsidiariesDecember 31, 2020
Consolidated Statement of Financial Position
(Millions of Yen) (Millions of Yen) (Millions of U.S. Dollars)
LIABILITIES AND EQUITY Notes FY2019(As of December 31, 2019)
FY2020(As of December 31, 2020)
FY2020(As of December 31, 2020)
LIABILITIES:CURRENT LIABILITIES:
Trade and other payables 20, 36 ¥1,390,778 ¥1,247,172 12,050Borrowings 21, 36 184,816 72,533 701Other financial liabilities 16, 21, 36 72,863 149,737 1,447Income tax payables 17,689 71,228 688Provisions 22 8,554 28,745 278Other current liabilities 26 184,326 189,654 1,832
Subtotal 1,859,029 1,759,071 16,996Liabilities directly associated with non-current
assets classified as held for sale 13 195 – –
Total current liabilities 1,859,224 1,759,071 16,996
NON-CURRENT LIABILITIES:Bonds and borrowings 21, 36 439,110 512,274 4,950Other financial liabilities 16, 21, 36 283,711 149,305 1,443Liability for retirement benefits 23 24,254 25,421 246Provisions 22 4,389 48,013 464Other non-current liabilities 35 27,717 10,970 106Deferred tax liabilities 19 104,787 55,002 531
Total non-current liabilities 883,970 800,987 7,739Total liabilities 2,743,195 2,560,059 24,735
EQUITY:Share capital 24 74,609 74,609 721Share premium account 24 100,102 75,596 730Treasury shares 24 (60,202) (34,592) (334)Other components of equity 206,649 41,790 404Retained earnings 24 653,818 599,466 5,792
Total equity attributable to owners of the parent 36 974,977 756,870 7,313Non-controlling interests 7, 24 77,556 63,483 613Total equity 1,052,533 820,353 7,926
TOTAL LIABILITIES AND EQUITY ¥3,795,729 ¥3,380,412 $32,661
Dentsu Group Integrated Report 202114
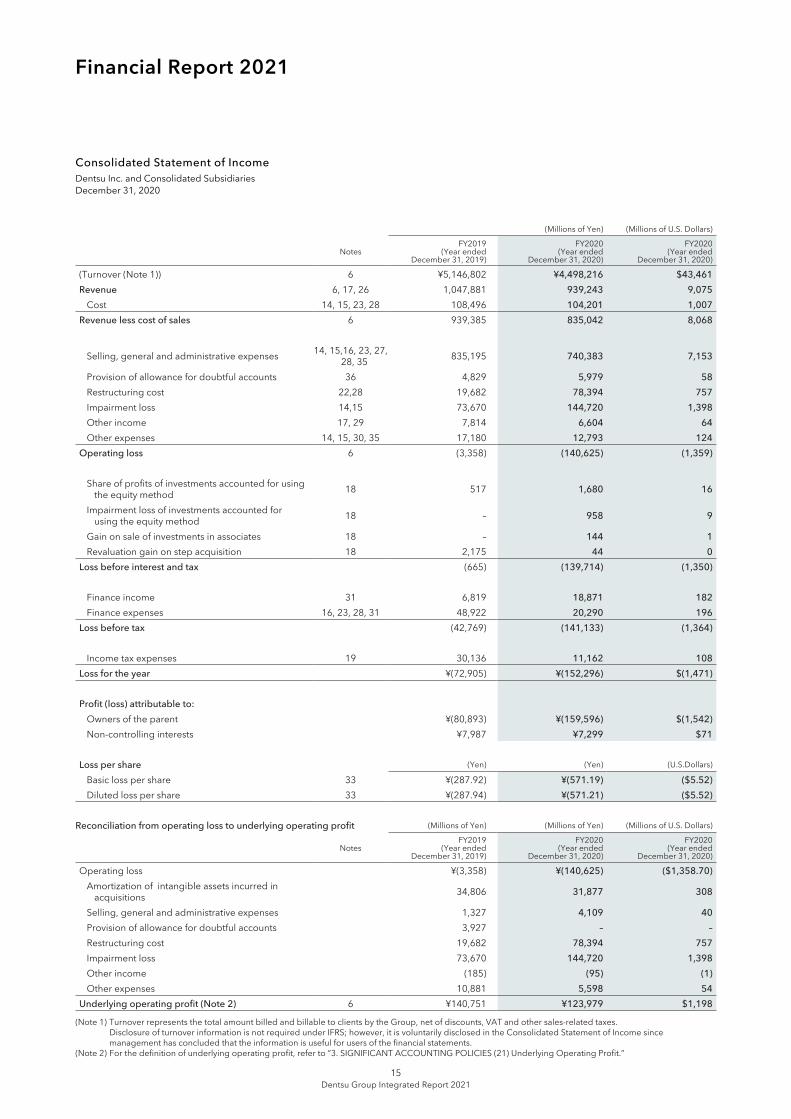
Financial Report 2021
(Millions of Yen) (Millions of U.S. Dollars)
NotesFY2019
(Year ended December 31, 2019)
FY2020(Year ended
December 31, 2020)
FY2020(Year ended
December 31, 2020)
(Turnover (Note 1)) 6 ¥5,146,802 ¥4,498,216 $43,461Revenue 6, 17, 26 1,047,881 939,243 9,075
Cost 14, 15, 23, 28 108,496 104,201 1,007Revenue less cost of sales 6 939,385 835,042 8,068
Selling, general and administrative expenses 14, 15,16, 23, 27, 28, 35 835,195 740,383 7,153
Provision of allowance for doubtful accounts 36 4,829 5,979 58Restructuring cost 22,28 19,682 78,394 757Impairment loss 14,15 73,670 144,720 1,398Other income 17, 29 7,814 6,604 64Other expenses 14, 15, 30, 35 17,180 12,793 124
Operating loss 6 (3,358) (140,625) (1,359)
Share of profits of investments accounted for using the equity method 18 517 1,680 16
Impairment loss of investments accounted for using the equity method 18 – 958 9
Gain on sale of investments in associates 18 – 144 1Revaluation gain on step acquisition 18 2,175 44 0
Loss before interest and tax (665) (139,714) (1,350)
Finance income 31 6,819 18,871 182Finance expenses 16, 23, 28, 31 48,922 20,290 196
Loss before tax (42,769) (141,133) (1,364)
Income tax expenses 19 30,136 11,162 108Loss for the year ¥(72,905) ¥(152,296) $(1,471)
Profit (loss) attributable to:Owners of the parent ¥(80,893) ¥(159,596) $(1,542)Non-controlling interests ¥7,987 ¥7,299 $71
Loss per share (Yen) (Yen) (U.S.Dollars)
Basic loss per share 33 ¥(287.92) ¥(571.19) ($5.52)Diluted loss per share 33 ¥(287.94) ¥(571.21) ($5.52)
Reconciliation from operating loss to underlying operating profit (Millions of Yen) (Millions of Yen) (Millions of U.S. Dollars)
Notes FY2019
(Year ended December 31, 2019)
FY2020(Year ended
December 31, 2020)
FY2020(Year ended
December 31, 2020)
Operating loss ¥(3,358) ¥(140,625) ($1,358.70)Amortization of intangible assets incurred in
acquisitions 34,806 31,877 308
Selling, general and administrative expenses 1,327 4,109 40Provision of allowance for doubtful accounts 3,927 – –Restructuring cost 19,682 78,394 757Impairment loss 73,670 144,720 1,398Other income (185) (95) (1)Other expenses 10,881 5,598 54
Underlying operating profit (Note 2) 6 ¥140,751 ¥123,979 $1,198
(Note 1) Turnover represents the total amount billed and billable to clients by the Group, net of discounts, VAT and other sales-related taxes. Disclosure of turnover information is not required under IFRS; however, it is voluntarily disclosed in the Consolidated Statement of Income since
management has concluded that the information is useful for users of the financial statements.(Note 2) For the definition of underlying operating profit, refer to ”3. SIGNIFICANT ACCOUNTING POLICIES (21) Underlying Operating Profit.”
Dentsu Inc. and Consolidated SubsidiariesDecember 31, 2020
Consolidated Statement of Income
Dentsu Group Integrated Report 202115
(Millions of Yen) (Millions of U.S. Dollars)
Notes FY2019
(Year ended December 31, 2019)
FY2020(Year ended
December 31, 2020)
FY2020(Year ended
December 31, 2020)
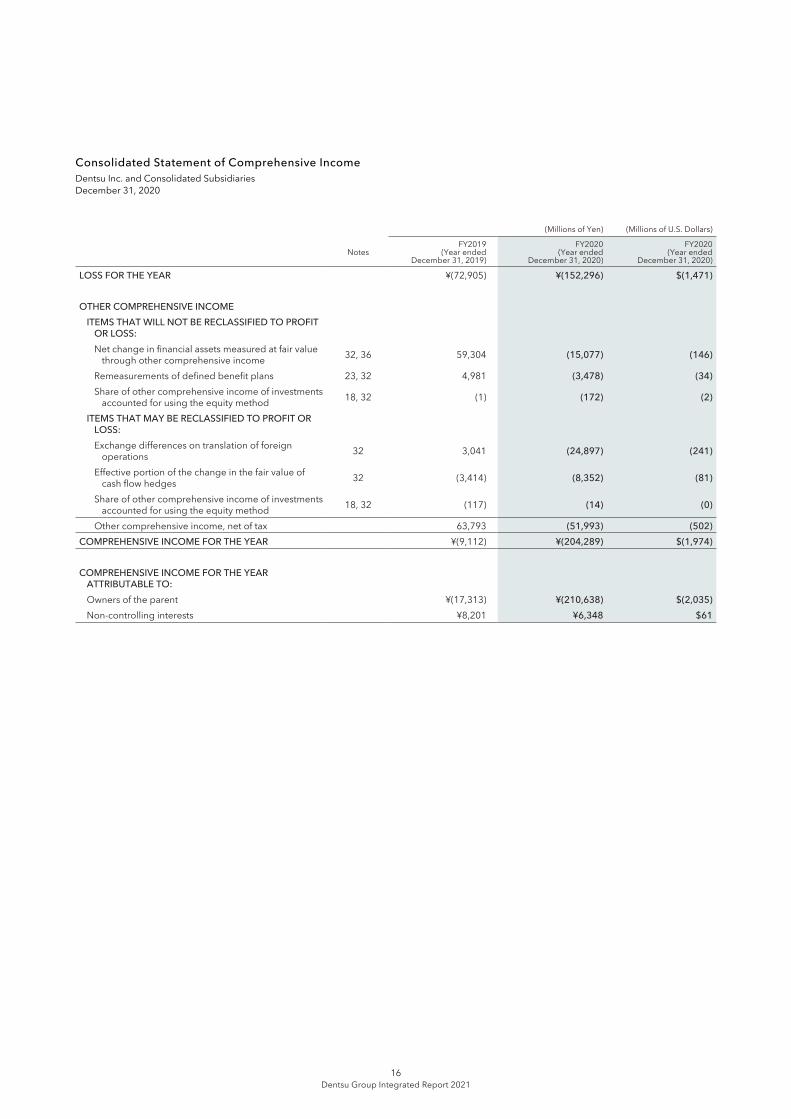
LOSS FOR THE YEAR ¥(72,905) ¥(152,296) $(1,471)
OTHER COMPREHENSIVE INCOMEITEMS THAT WILL NOT BE RECLASSIFIED TO PROFIT
OR LOSS:Net change in financial assets measured at fair value
through other comprehensive income 32, 36 59,304 (15,077) (146)
Remeasurements of defined benefit plans 23, 32 4,981 (3,478) (34)Share of other comprehensive income of investments
accounted for using the equity method 18, 32 (1) (172) (2)
ITEMS THAT MAY BE RECLASSIFIED TO PROFIT OR LOSS:Exchange differences on translation of foreign
operations 32 3,041 (24,897) (241)
Effective portion of the change in the fair value of cash flow hedges 32 (3,414) (8,352) (81)
Share of other comprehensive income of investments accounted for using the equity method 18, 32 (117) (14) (0)
Other comprehensive income, net of tax 63,793 (51,993) (502)COMPREHENSIVE INCOME FOR THE YEAR ¥(9,112) ¥(204,289) $(1,974)
COMPREHENSIVE INCOME FOR THE YEAR ATTRIBUTABLE TO:Owners of the parent ¥(17,313) ¥(210,638) $(2,035)Non-controlling interests ¥8,201 ¥6,348 $61
Dentsu Inc. and Consolidated SubsidiariesDecember 31, 2020
Consolidated Statement of Comprehensive Income
Dentsu Group Integrated Report 202116
Financial Report 2021
(Millions of Yen)
Total equity attributable to owners of the parent
Notes Share capital Share premium account Treasury shares
Exchange differences on translation of
foreign operations
Effective portion of the change in the fair value of cash
flow hedges
Net change in financial assets measured at fair
value through other comprehensive income
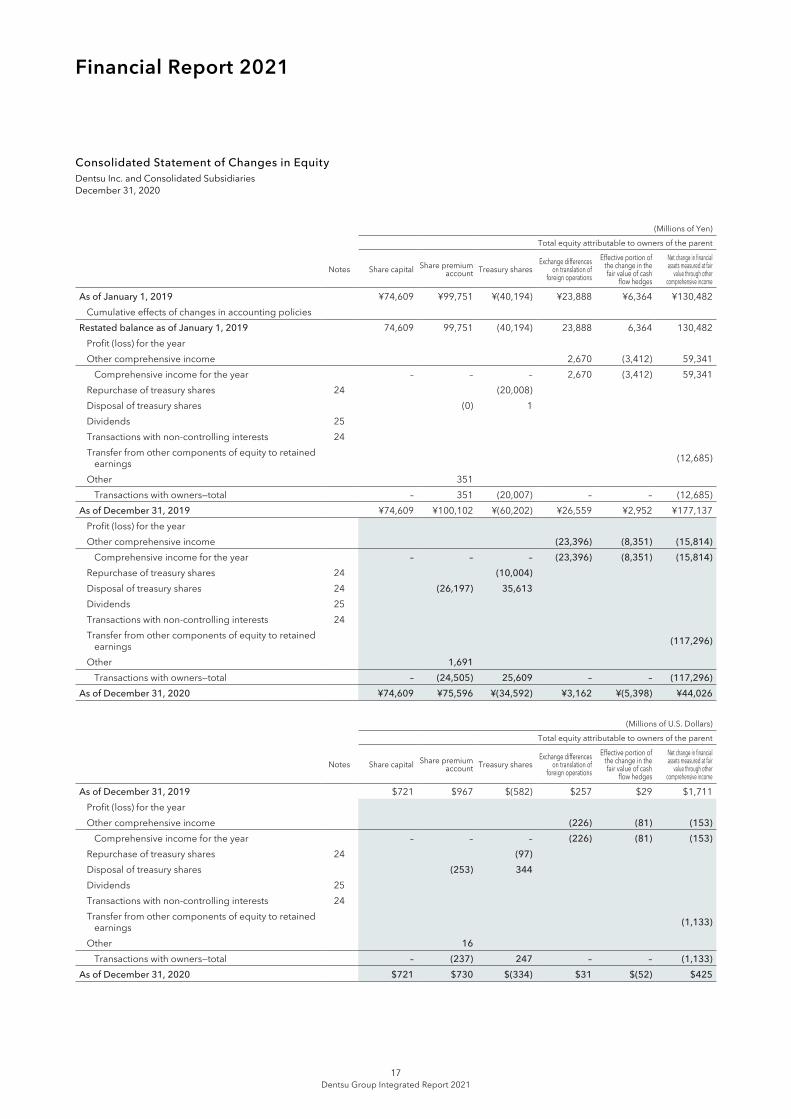
As of January 1, 2019 ¥74,609 ¥99,751 ¥(40,194) ¥23,888 ¥6,364 ¥130,482Cumulative effects of changes in accounting policies
Restated balance as of January 1, 2019 74,609 99,751 (40,194) 23,888 6,364 130,482Profit (loss) for the yearOther comprehensive income 2,670 (3,412) 59,341
Comprehensive income for the year – – – 2,670 (3,412) 59,341Repurchase of treasury shares 24 (20,008)Disposal of treasury shares (0) 1Dividends 25Transactions with non-controlling interests 24Transfer from other components of equity to retained
earnings (12,685)
Other 351Transactions with owners—total – 351 (20,007) – – (12,685)
As of December 31, 2019 ¥74,609 ¥100,102 ¥(60,202) ¥26,559 ¥2,952 ¥177,137Profit (loss) for the yearOther comprehensive income (23,396) (8,351) (15,814)
Comprehensive income for the year – – – (23,396) (8,351) (15,814)Repurchase of treasury shares 24 (10,004)Disposal of treasury shares 24 (26,197) 35,613Dividends 25Transactions with non-controlling interests 24Transfer from other components of equity to retained
earnings (117,296)
Other 1,691Transactions with owners—total – (24,505) 25,609 – – (117,296)
As of December 31, 2020 ¥74,609 ¥75,596 ¥(34,592) ¥3,162 ¥(5,398) ¥44,026
(Millions of U.S. Dollars)
Total equity attributable to owners of the parent
Notes Share capital Share premium account Treasury shares
Exchange differences on translation of
foreign operations
Effective portion of the change in the fair value of cash
flow hedges
Net change in financial assets measured at fair
value through other comprehensive income
As of December 31, 2019 $721 $967 $(582) $257 $29 $1,711Profit (loss) for the yearOther comprehensive income (226) (81) (153)
Comprehensive income for the year – – – (226) (81) (153)Repurchase of treasury shares 24 (97)Disposal of treasury shares (253) 344Dividends 25Transactions with non-controlling interests 24Transfer from other components of equity to retained
earnings (1,133)
Other 16Transactions with owners—total – (237) 247 – – (1,133)
As of December 31, 2020 $721 $730 $(334) $31 $(52) $425
Dentsu Inc. and Consolidated SubsidiariesDecember 31, 2020
Consolidated Statement of Changes in Equity
Dentsu Group Integrated Report 202117
(Millions of Yen)
Total equity attributable to owners of the parent
NotesRemeasurements
of defined benefit plans
Total Retained earnings Total Non-controlling
interests Total equity
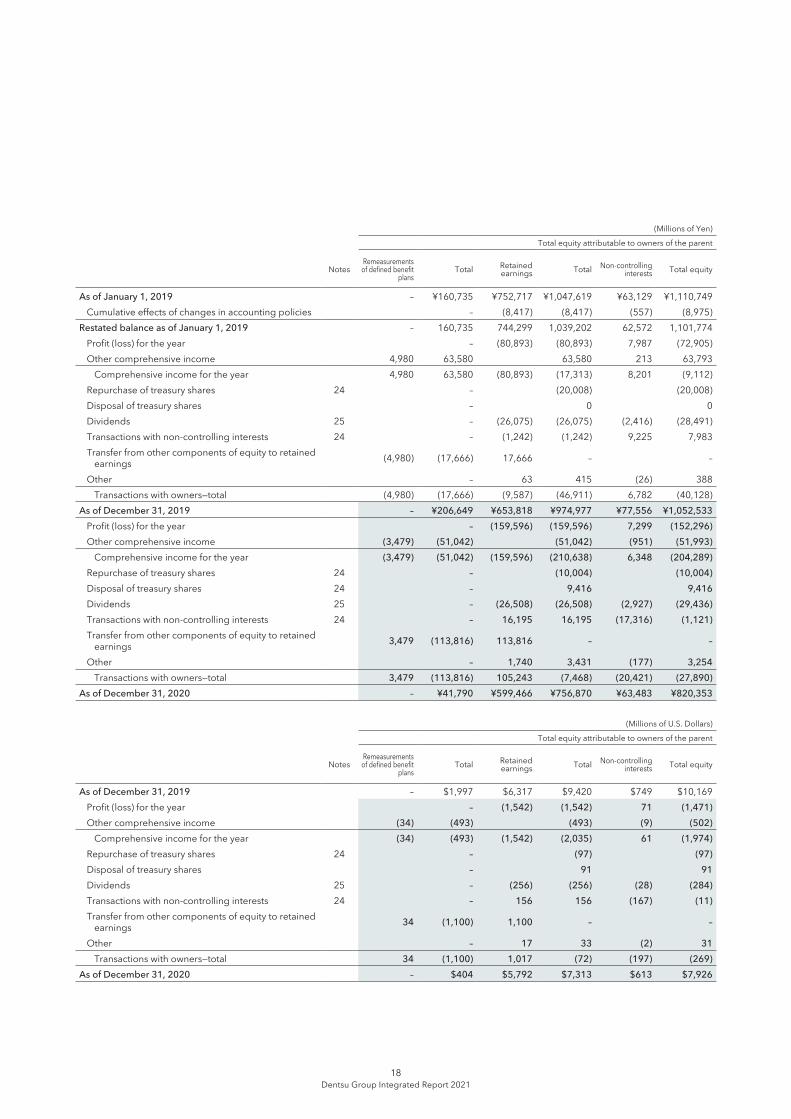
As of January 1, 2019 – ¥160,735 ¥752,717 ¥1,047,619 ¥63,129 ¥1,110,749 Cumulative effects of changes in accounting policies – (8,417) (8,417) (557) (8,975)
Restated balance as of January 1, 2019 – 160,735 744,299 1,039,202 62,572 1,101,774 Profit (loss) for the year – (80,893) (80,893) 7,987 (72,905)Other comprehensive income 4,980 63,580 63,580 213 63,793
Comprehensive income for the year 4,980 63,580 (80,893) (17,313) 8,201 (9,112)Repurchase of treasury shares 24 – (20,008) (20,008)Disposal of treasury shares – 0 0 Dividends 25 – (26,075) (26,075) (2,416) (28,491)Transactions with non-controlling interests 24 – (1,242) (1,242) 9,225 7,983 Transfer from other components of equity to retained
earnings (4,980) (17,666) 17,666 – –
Other – 63 415 (26) 388 Transactions with owners—total (4,980) (17,666) (9,587) (46,911) 6,782 (40,128)
As of December 31, 2019 – ¥206,649 ¥653,818 ¥974,977 ¥77,556 ¥1,052,533 Profit (loss) for the year – (159,596) (159,596) 7,299 (152,296)Other comprehensive income (3,479) (51,042) (51,042) (951) (51,993)
Comprehensive income for the year (3,479) (51,042) (159,596) (210,638) 6,348 (204,289)Repurchase of treasury shares 24 – (10,004) (10,004)Disposal of treasury shares 24 – 9,416 9,416 Dividends 25 – (26,508) (26,508) (2,927) (29,436)Transactions with non-controlling interests 24 – 16,195 16,195 (17,316) (1,121)Transfer from other components of equity to retained
earnings 3,479 (113,816) 113,816 – –
Other – 1,740 3,431 (177) 3,254 Transactions with owners—total 3,479 (113,816) 105,243 (7,468) (20,421) (27,890)
As of December 31, 2020 – ¥41,790 ¥599,466 ¥756,870 ¥63,483 ¥820,353
(Millions of U.S. Dollars)
Total equity attributable to owners of the parent
NotesRemeasurements
of defined benefit plans
Total Retained earnings Total Non-controlling
interests Total equity
As of December 31, 2019 – $1,997 $6,317 $9,420 $749 $10,169Profit (loss) for the year – (1,542) (1,542) 71 (1,471)Other comprehensive income (34) (493) (493) (9) (502)
Comprehensive income for the year (34) (493) (1,542) (2,035) 61 (1,974)Repurchase of treasury shares 24 – (97) (97)Disposal of treasury shares – 91 91Dividends 25 – (256) (256) (28) (284)Transactions with non-controlling interests 24 – 156 156 (167) (11)Transfer from other components of equity to retained
earnings 34 (1,100) 1,100 – –
Other – 17 33 (2) 31Transactions with owners—total 34 (1,100) 1,017 (72) (197) (269)
As of December 31, 2020 – $404 $5,792 $7,313 $613 $7,926
Dentsu Group Integrated Report 202118
Financial Report 2021
(Millions of Yen) (Millions of U.S. Dollars)
NotesFY2019
(Year ended December 31, 2019)
FY2020(Year ended
December 31, 2020)
FY2020(Year ended
December 31, 2020) CASH FLOWS FROM OPERATING ACTIVITIES
Loss before tax ¥(42,769) ¥(141,133) $(1,364)ADJUSTMENTS FOR:
Depreciation and amortization 89,967 85,968 831Share-based compensation expenses attributable to the acquiree 30 9,568 3,094 30Impairment loss 73,670 144,720 1,398Interest and dividend income 31 (6,045) (4,569) (44)Interest expense 31 20,979 18,529 179Share of profits of investments accounted for using the equity
method (517) (1,680) (16)
Impairment loss of investments accounted for using the equity method 31 – 958 9
Revaluation (gain) loss on contingent consideration and put option liability 26,718 (13,678) (132)
Increase (decrease) in liability for retirement benefits (198) (4,919) (48)Increase (decrease) in provision of restructuring cost 15,833 55,818 539Other — net 8,443 15,571 150
Cash flows from operating activities before adjusting changes in working capital and others 195,651 158,679 1,533
CHANGES IN WORKING CAPITAL:(Increase) decrease in trade and other receivables (57,844) 135,807 1,312(Increase) decrease in inventories 8,418 (2,815) (27)(Increase) decrease in other current assets 42,447 (4,294) (41)Increase (decrease) in trade and other payables 47,374 (143,110) (1,383)Increase (decrease) in other current liabilities (68,649) (8,126) (79)
Change in working capital (28,254) (22,540) (218)Subtotal 167,396 136,138 1,315Interest received 3,585 2,421 23Dividends received 4,456 3,061 30Interest paid 16 (21,021) (18,441) (178)Income taxes paid (74,460) (34,866) (337)Net cash flows from operating activities 79,957 88,313 853
CASH FLOWS FROM INVESTING ACTIVITIESPayment for purchase of property, plant and equipment, intangible
assets and investment property 6 (32,244) (21,474) (207)
Proceeds from sale of property, plant and equipment, intangible assets and investment property 1,244 1,526 15
Net cash (paid) received on acquisition of subsidiaries 7 (47,655) (26,585) (257)Payments for purchases of securities (26,302) (13,124) (127)Proceeds from sales of securities 29,715 197,287 1,906Other — net (809) (616) (6)Net cash flows from investing activities (76,051) 137,013 1,324
CASH FLOWS FROM FINANCING ACTIVITIESNet increase (decrease) in short-term borrowings 21 1,086 (9,174) (89)Proceeds from long-term borrowings 21 96,088 1,364 13Repayment of long-term borrowings 21 (16,660) (127,137) (1,228)Proceeds from issuance of bonds 21 – 119,629 1,156Repayments of lease obligations 16,21 (32,580) (33,666) (325)Payment for acquisition of interest in subsidiaries from
non-controlling interests 21 (5,418) (10,892) (105)
Payments for repurchase of treasury shares 24 (20,008) (10,004) (97)Dividends paid 25 (26,075) (26,508) (256)Dividends paid to non-controlling interests 25 (3,956) (3,066) (30)Other — net (277) 2,833 27Net cash flows from financing activities (7,803) (96,622) (934)
EFFECT OF EXCHANGE RATE CHANGES ON CASH AND CASH EQUIVALENTS 1,490 (12,067) (117)
NET INCREASE (DECREASE) IN CASH AND CASH EQUIVALENTS (2,407) 116,637 1,127CASH AND CASH EQUIVALENTS AT BEGINNING OF PERIOD 8 416,668 414,055 4,001DECREASE IN CASH AND CASH EQUIVALENTS RESULTING FROM TRANSFER TO ASSETS HELD FOR SALE 13 (205) – –
CASH AND CASH EQUIVALENTS AT END OF PERIOD 8 ¥414,055 ¥530,692 $5,127
Dentsu Inc. and Consolidated SubsidiariesDecember 31, 2020
Consolidated Statement of Cash Flows
Dentsu Group Integrated Report 202119
1. REPORTING ENTITYDentsu Group Inc. (hereinafter referred to as the “Company”) is a joint stock corporation under the Companies Act of Japan located in Japan. The address of the Company’s registered corporate headquarter is available on the Company’s website (https://www.group.dentsu.com/jp/). The details of businesses and principal business activities of the Company and its subsidiaries (hereinafter referred to as the “Group”) are stated in “6. SEGMENT INFORMATION”. The consolidated financial statements for the year ended December 31, 2020 were approved by Toshihiro Yamamoto, Representative Director and President & CEO, and Yushin Soga, Director, Executive Officer & CFO, on March 26, 2021.
2. BASIS OF PREPARATION(1) Compliance with the International Financial Reporting Standards (hereinafter referred to as “IFRS”) The Company’s consolidated financial statements meet all of the requirements of Article 1-2 “Designated IFRS Specified Company” stipulated in the Ordinance on Terminology, Forms and Preparation Methods of Consolidated Financial Statements (Ordinance of the Ministry of Finance No. 28 of 1976; (the “Ordinance on Consolidated Financial Statements”)) and are prepared in accordance with IFRS under the provisions of Article 93 of the Ordinance on Consolidated Financial Statements.
(2) Basis of MeasurementThe consolidated financial statements are prepared on the historical cost basis, except for financial instruments and others stated in “3. SIGNIFICANT ACCOUNTING POLICIES.”
(3) Functional Currency and Presentation CurrencyThe consolidated financial statements are presented in Japanese yen, which is the functional currency of the Company. For the convenience of readers outside Japan, the accompanying Consolidated Financial Statements are also presented in United States dollars by translating Japanese yen amounts at the exchange rate of ¥103.50 to U.S.$1, the approximate rate of exchange at the end of December 31, 2020. Such translations should not be construed as representations that the Japanese yen amounts could be converted into United States dollars at the above or any other rate. Amounts less than one million yen have been rounded down to the nearest million yen and those less than one million U.S. dollars have been rounded to the nearest million U.S. dollars in the presentation of the accompanying consolidated financial statements. As a result, the totals in yen and U.S. dollars do not necessarily agree with the sum of the individual amounts.
(4) Early adoption of New StandardsThere are no early adoption of standards.
(5) Change in presentation (Consolidated Statement of Income)
The “Provision (reversal) of allowance for doubtful accounts” under “Selling, general and administrative expenses” and “Impairment loss” under “Other expenses” in the previous fiscal year are presented separately in the current fiscal year, due to an increase in their quantitative materiality. Consolidated financial statements for the previous fiscal year have been reclassified to reflect this change in presentation. As a result, ¥820,058 million presented under “Selling, general and administrative expenses” and ¥12,151 million presented under “Other expenses” in the consolidated statement of income for the previous fiscal year, have been reclassified as ¥820,184 million under “Selling, general and administrative expenses” and ¥126 million (credit) under “Provision (reversal) of allowance for doubtful accounts” and ¥12,123 million under “Other expenses” and ¥27 million under “Impairment loss”, respectively.
(Consolidated Statement of Cash Flows)The “Stock-based compensation expenses attributable to the acquiree” and “Revaluation (gain) loss on deferred consideration and put option liabilities” under “Other-net” in cash flows from operating activities in the previous fiscal year are presented separately in the current fiscal year, due to an increase in their quantitative materiality. Consolidated financial statements for the previous fiscal year have been reclassified to reflect this change in presentation. As a result, ¥11,213 million presented under “Other-net” in cash flows from operating activities in the consolidated statement of income for the previous fiscal year, have been reclassified as ¥4,313 million under “Stock-based compensation expenses attributable to the acquiree”, ¥10,744 million under “Revaluation (gain) loss on contingent consideration and put option liabilities” and negative ¥3,844 million under “Other-net”, respectively.
3. SIGNIFICANT ACCOUNTING POLICIES(1) Basis of ConsolidationA. SubsidiariesA subsidiary is an entity controlled by the Group. An entity is treated as a subsidiary if the Group is deemed, in principle, to have control over that entity when it holds a majority of the voting rights of that entity. An entity is treated as a subsidiary even if the Group holds less than a majority of the voting rights of the entity, where control is deemed to be achieved when the Group is exposed, or has rights, to variable returns from its involvement with the entity and has the ability to affect those returns through its power over the entity. Consolidation of a subsidiary begins when the Group obtains control over the subsidiary and ceases when the Group loses control of the subsidiary. In cases where the accounting policies adopted by a subsidiary are different from those adopted by the Group, adjustments are made to the subsidiary’s financial statements, as necessary, to conform with the accounting policies adopted by the Group.
Dentsu Inc. and Consolidated SubsidiariesNotes to Consolidated Financial Statements
Dentsu Group Integrated Report 202120
Financial Report 2021
A change in the ownership interest in a subsidiary without a loss of control is accounted for as an equity transaction, and any difference between the amount by which the non-controlling interests are adjusted and the fair value of the consideration paid or received is recognized directly in equity as equity attributable to owners of the Company. When the Group loses control of a subsidiary, any resulting gain or loss is recognized in profit or loss.
B. Associates and Joint VenturesAn associate is an entity over which the Group has significant influence in respect to the financial and operating policies but does not have control. When the Group holds between 20% and 50% of the voting rights, the entity is, in principle, treated as an associate. When the Group holds less than 20% of the voting rights of the entity but is determined to have significant influence over the entity, such as through delegation of officers, the entity is treated as an associate. A joint venture is an entity in which two or more parties, including the Group, have contractually agreed to sharing of control of an arrangement and have rights to the net assets of the joint venture, and in which unanimous consent of the controlling parties is required to make decisions on relevant business activities. The Group’s investments in associates and joint ventures are accounted for using the equity method. The investments are measured as the carrying amount (including goodwill recognized upon acquisition) determined using the equity method less accumulated impairment losses. The consolidated financial statements include the Group’s share of changes in profit or loss and other comprehensive income of an associate and joint venture from the date of acquisition of significant influence or joint control until the date such influence or control is lost. In cases where the accounting policies adopted by an associate or joint venture are different from those adopted by the Group, adjustments are made to the associate or joint venture’s financial statements, as necessary, to conform with the accounting policies adopted by the Group. If application of the equity method ceases as a result of the loss of significant influence on associates or joint ventures, gain or loss on the sales of shares is recognized in profit or loss, and the valuation difference arising from remeasurement of the residual shares at fair value is recognized in profit or loss in the same period the significant influence is lost.
C. Transactions Eliminated Under ConsolidationAll intragroup balances, transactions, and unrealized gains resulting from intragroup transactions are eliminated on consolidation. Unrealized gains resulting from transactions with associates and joint ventures are deducted from investments, to the extent it does not exceed Company’s share in an investee.
(2) Business CombinationsBusiness combinations are accounted for using the acquisition
method. Consideration transferred in a business combination is measured as the sum of the acquisition-date fair value of the assets transferred, the liabilities assumed and equity instruments issued by the Company in exchange for control over an acquiree and includes contingent consideration when appropriate. At the acquisition date, the identifiable assets and liabilities are recognized at their fair value, except that:(i) Deferred tax assets or liabilities, and assets or liabilities, which
are related to employee benefit arrangements, are recognized and measured in accordance with International Accounting Standards (hereinafter referred to as “IAS”) 12 “Income Taxes” and IAS 19 “Employee Benefits,” respectively.
(ii) Assets or disposal groups that are classified as held-for-sale under IFRS 5 “Non-current Assets Held for Sale and Discontinued Operations” are measured in accordance with such standard.
Any excess of the consideration of acquisition over the fair value of identifiable assets and liabilities is recognized as goodwill. If the consideration of acquisition is lower than the fair value of the identifiable assets and liabilities, the difference is immediately recognized in profit. If the initial accounting for a business combination is incomplete by the end of the reporting period in which the combination occurs, provisional amounts of incomplete items are measured based on best estimates. Provisional amounts are adjusted retrospectively to reflect new information obtained during the measurement period, within one year from the date of acquisition, that, if known, would have affected the amounts recognized at that date. The contingent consideration is recognized at fair value at the time of acquisition and the change in fair value after acquisition is reflected as an adjustment to the consideration transferred when the change qualifies as adjustment during the measurement period, otherwise the change is recognized in profit or loss. The Group elects to measure non-controlling interests at either fair value or based on the proportionate share in the recognized identifiable net asset amounts for each business combination transaction. Acquisition-related costs incurred to achieve a business combination are recognized as expenses when incurred, with the exception of costs related to the issuance of debt instruments and equity instruments. The Group continuously accounts for all business combinations under common control based on carrying amounts. A business combination under common control is a business combination in which all of the combining companies or businesses are ultimately controlled by the same company, both before and after the combination, and the control is not temporary.
(3) Foreign Currency TranslationA. Translation of Foreign Currency TransactionsForeign currency transactions are translated into each functional currency of the group entity using the exchange rate at the date of the transaction.
Dentsu Group Integrated Report 202121
At the end of each reporting period, monetary assets and liabilities denominated in foreign currencies, and non-monetary assets and liabilities denominated in foreign currencies carried at fair value are translated into the functional currency at the closing rate, and the resulting translation differences are recognized in profit or loss. Non-monetary items denominated in foreign currencies are translated at the exchange rate at the date of transaction.
B. Translation of Foreign OperationsFor financial statements of foreign operations such as subsidiaries, assets and liabilities are translated into Japanese yen using the closing rate of the reporting period, and revenue and expenses are translated into Japanese yen using the average rate of the reporting period unless there are significant changes in the exchange rate. Resulting translation differences are recognized in other comprehensive income, and cumulative differences are recognized in other components of equity. When a foreign operation of the Group is disposed of, cumulative translation differences relating to that foreign operation are transferred to profit or loss.
(4) Financial InstrumentsA. Non-derivative Financial Assets(i) Initial Recognition and MeasurementThe Group initially recognizes trade and other receivables on the date of occurrence. All other financial assets are initially recognized on the transaction date when the Group became the contracting party for the financial asset. Trade and other receivables which do not include significant financial components are measured at transaction price upon initial recognition. Non-derivative financial assets are classified as financial assets measured at amortized cost if both of the following conditions are met at the time of initial recognition of financial assets. Otherwise, they are classified as financial assets measured at fair value.
• The asset is held within a business model whose objective is to hold assets in order to collect contractual cash flows.
• The contractual terms of the financial asset give rise on specified dates to cash flows that are solely payments of principal and interest on the principal amount outstanding.
Financial assets measured at fair value are classified as financial assets in which changes in fair value subsequent to initial recognition are recognized in profit or loss (hereinafter referred to as “financial assets measured at fair value through profit or loss”) and financial assets in which changes in fair value subsequent to initial recognition are recognized in other comprehensive income (hereinafter referred to as “financial assets measured at fair value through other comprehensive income”). At the time of initial recognition, debt financial instruments that do not satisfy amortized cost criteria are classified as financial assets measured at fair value through profit or loss. Equity financial instruments not held-for-sale, in principle, are
designated as financial assets measured at fair value through other comprehensive income at the time of initial recognition. All financial assets are measured at fair value plus transaction costs that are directly attributable to such financial assets, except for when they are classified as financial assets measured at fair value through profit or loss.
(ii) Subsequent MeasurementAfter initial recognition, financial assets are measured based on the classification as follows:(a) Financial Assets Measured at Amortized CostSubsequent to initial recognition, financial assets are measured at amortized cost using the effective interest rate method.(b) Financial Assets Measured at Fair Value through Profit or LossSubsequent to initial recognition, financial assets are remeasured at fair value at each reporting period end. Changes in fair value and income such as dividends are recognized in profit or loss.(c) Financial Assets Measured at Fair Value through Other Comprehensive IncomeChanges in fair value subsequent to initial recognition are recognized in other comprehensive income, and are transferred to retained earnings if a financial asset is derecognized or the fair value declined significantly. Dividends derived from these financial assets are recognized in profit or loss.
(iii) DerecognitionFinancial assets are derecognized when the contractual rights to receive cash flows expire, or when substantially all risks and rewards of ownership are transferred to another entity.
B. Impairment of Financial AssetsThe Group recognizes an allowance for doubtful accounts for expected credit losses on financial assets measured at amortized cost.
Determination of Significant Increase in Credit RiskAt each reporting date, the Group compares the risk of financial asset defaults as of the reporting date and the initial recognition date to assess whether the credit risk associated with the financial asset has increased significantly since the initial recognition. The Group assesses whether there has been a significant increase in credit risk based on changes in the risk of default since the initial recognition. In assessing whether there has been a change in the risk of default, the Group considers overdue information, as well as the following factors.
• Significant changes in external credit ratings of financial assets• Downgrade of internal credit ratings• Deterioration in borrowers’ operating results
Expected Credit Loss ApproachExpected credit losses are the present value of the difference between the contractual cash flows to be received by the Group under the contracts and the cash flows expected to be received.
Dentsu Group Integrated Report 202122
Financial Report 2021
If the credit risk associated with a financial asset has increased significantly since the initial recognition, the allowance for doubtful accounts related to the financial asset is measured at an amount equal to the expected credit loss for the entire period, and if it has not increased significantly, it is measured at an amount equal to the expected credit loss for the 12-month period. Notwithstanding the foregoing, for trade receivables that do not include significant financial components, the allowance for doubtful accounts is always measured at an amount equal to the expected credit losses for the entire period. In measuring expected credit losses, the Group uses reasonable and corroborating information available at the reporting date that is relevant to historical events, current conditions and projections of future economic conditions. For individually significant financial assets, the Group evaluates expected credit losses individually, and for other financial assets, the Group establishes a loss valuation allowance by grouping financial assets with similar credit risk characteristics based on location, number of days past due, security status, and external credit ratings. Defaults are recognized when the obligor is unable to recover all or part of the financial assets or is determined to be extremely difficult to recover, such as when the obligor fails to make payments within 90 days after the due date. In the event of default or significant financial difficulties of the issuer or the obligor, the Group determines that the credit impairment is deemed to exist. Provisions for doubtful accounts related to financial assets are recognized in profit or loss. Reversal of the allowance for doubtful accounts is recognized in profit or loss.
Financial assets are written off directly when collection is not reasonably expected, such as the debtor’s inability to execute the repayment plan agreed with the Group. This typically applies when the Group determines that the borrower does not have an asset or revenue source that generates sufficient cash flow to repay the amount directly written off. The Group continues to enforce performance against directly written-off financial assets so that past due receivables can be collected.
C. Non-derivative Financial Liabilities (Including put option liabilities. Refer to “(2) Business combination” for contingent consideration.)
(i) Initial Recognition and MeasurementThe Group initially recognizes debt securities on the date of issue. Contingent consideration arising from a business combination and put option liabilities to acquire interests from non-controlling interests are recognized on the date the Group acquires control of the acquired entity. All other financial liabilities are initially recognized on the transaction date when the Group becomes the contracting party for the financial liability. Non-derivative financial liabilities are classified as financial liabilities measured at fair value through profit or loss and financial liabilities measured at amortized cost at initial recognition.
All financial liabilities are measured at fair value at initial recognition. However, financial liabilities measured at amortized cost are measured at cost, net of transaction costs that are directly attributable to the financial liabilities. In addition, put option liabilities are measured based on the present value of future redemption amount.
(ii) Subsequent MeasurementAfter initial recognition, financial liabilities are measured based on the classification as follows. However, put option liabilities are measured at the present value of the redemption amount, with changes recognized as profit or loss.(a) Financial Liabilities Measured at Amortized CostSubsequent to initial recognition, financial liabilities measured at amortized cost are measured at amortized cost using the effective interest rate method.(b) Financial Liabilities Measured at Fair Value Through Profit or LossSubsequent to initial recognition, financial liabilities measured at fair value through profit or loss are remeasured at fair value at each reporting period end and changes in fair value are recognized in profit or loss.
(iii) DerecognitionA financial liability is derecognized when the obligation is fulfilled, discharged, or expired.
D. Derivative Financial Instruments and Hedge AccountingThe Group utilizes derivative financial instruments, such as foreign exchange contracts and interest rate swap contracts, to hedge its foreign currency risks and interest rate risks, respectively. At the inception of the hedge, the Group designates and documents the relationship to which hedge accounting is adopted, as well as the objectives and strategies of risk management for undertaking the hedge. The documentation includes hedging relationships, the risk management objective, strategies for undertaking the hedge and assessments of hedge effectiveness. These hedges are expected to be highly effective in offsetting changes in fair value or cash flows, however are assessed on an ongoing basis to determine whether hedge relationship have actually been highly effective throughout the hedging periods. Derivative financial instruments are initially recognized at fair value. In addition, derivatives are measured at fair value after initial recognition and changes in fair value are accounted for as follows: As for hedge accounting, the Group elected to apply IAS 39 in accordance with the transitional measure.(i) Cash Flow HedgeRegarding gains or losses on hedging instruments where hedges are effective, changes in fair value are recognized in other comprehensive income, and are reclassified from other comprehensive income to profit or loss when the cash flows from the hedged items affect profit or loss. Where hedges are ineffective, changes in fair value are recognized in profit or loss.
Dentsu Group Integrated Report 202123
Hedge accounting is discontinued when the hedging instrument is expired or sold, terminated or exercised, when the hedge no longer meets the criteria for hedge accounting, or when the hedging designation is revoked.
(ii) Hedge of Net Investment in Foreign OperationsTranslation differences resulting from the hedges of net investment in foreign operations are accounted for similarly to cash flow hedges. Gains or losses on the hedging instrument relating to the effective portion of the hedge are recognized in other comprehensive income while those for the ineffective portion are recognized in profit or loss. Cumulative gains or losses recognized in equity as other comprehensive income are reclassified to profit or loss upon disposal of foreign operations.
(iii) Derivative Financial Instruments not Designated as HedgesChanges in fair value of derivative financial instruments are recognized in profit or loss.
E. Offsetting of Financial InstrumentsFinancial assets and financial liabilities are offset and presented on a net basis if, and only if, there is a currently enforceable legal right to offset the recognized amounts, and if there is an intention to settle on a net basis or to realize the assets and settle the liabilities simultaneously.
(5) Cash and Cash EquivalentsCash and cash equivalents consist of cash on hand, demand deposits, and short-term investments that are readily convertible to known amounts of cash and subject to insignificant risk of change in value and due within three months from the date of acquisition.
(6) InventoriesInventories are mainly comprised of rights and contents related to sports and entertainment. Inventories are measured at the lower of cost or net realizable value. The cost of inventories is determined mainly by the specific identification method.
(7) Property, Plant and Equipment (Excluding right-of-use asset)Cost model is applied for subsequent measurement of property, plant and equipment, and is measured at acquisition cost less accumulated depreciation and accumulated impairment losses. Acquisition cost includes any costs directly attributable to the acquisition of the asset and dismantlement, removal and restoration costs. Except for assets such as land which are not depreciated, property, plant and equipment are depreciated mainly using the straight-line method over their estimated useful lives. The estimated useful lives of major property, plant and equipment items are as follows:
• Buildings and structures: 2 to 100 years
Depreciation methods, useful lives and residual values are reviewed at the end of each reporting period and changes are made as necessary.
(8) Goodwill and Intangible AssetsA. GoodwillGoodwill is not amortized and is measured at acquisition cost less accumulated impairment losses.
B. Intangible Assets (Excluding right-of-use asset)Cost model is applied for subsequent measurement of intangible assets, and are measured at acquisition cost less accumulated amortization and accumulated impairment losses. Intangible assets acquired separately are measured at acquisition cost for initial recognition, and the costs of intangible assets acquired in business combinations are recognized at fair value at the acquisition date. The acquisition cost for internally generated intangible assets is the sum of the expenditures incurred from the date when the intangible asset first meets all of the capitalization criteria. Intangible assets are amortized using the straight-line method over their estimated useful lives. The estimated useful lives of major intangible asset items are as follows:
• Software: 3 to 5 years• Customer relationships: Effective period (mainly 5 to 18 years)
Amortization methods and useful lives of intangible assets with finite useful lives are reviewed at the end of each reporting period and changes are made as necessary.
(9) LeasesThe Group determines upon inception of the contracts whether such contracts are leases or contain leases. If the contracts transfer the right to control the use of the identified asset over a period of time in exchange for consideration, the contracts are leases or contain leases. Right-of-use assets and a lease obligation are recognized at the beginning of the lease. Right-of-use assets are measured at cost the beginning of the lease. During the lease period, the cost model is applied and measured at cost less accumulated depreciation and accumulated impairment losses. After initial recognition, right-of-use asset is depreciated on a straight-line basis from the beginning of the lease period to the useful life of the right-of-use asset or to the end of the lease period, whichever occurs first. Lease obligations are measured at the present value of remaining lease payments of the beginning of the lease period. During the lease period, the carrying amount of the lease obligation is adjusted to reflect the interest rate on the lease obligation and the lease payments made. If the lease obligations are revised or the lease terms are changed, lease obligations is remeasured and right-of-use assets are adjusted. For short-term leases and leases of low-value assets, IFRS 16 Paragraph 6 is
Dentsu Group Integrated Report 202124
Financial Report 2021
applied, and lease payments are recognized as expenses over the lease period using the straight-line method.
(10) Investment PropertyInvestment property is property held to earn rental income, for capital appreciation or for both. Cost model is applied for subsequent measurement of investment property, and is measured at acquisition cost less accumulated depreciation and accumulated impairment losses. Except for assets that are not depreciated, such as land, investment property is depreciated mainly using the straight-line method over its estimated useful life. Estimated useful lives are between 6 and 50 years. Depreciation methods, useful lives and residual values of investment property are reviewed at the end of each reported period and changes are made as necessary.
(11) Impairment of Non-financial AssetsExcept for inventories and deferred tax assets, the Group assesses at the end of the reporting period whether there is any indication that a non-financial asset may be impaired. If such an indication exists, an impairment test is performed based on the recoverable amount of the asset. Goodwill is not amortized. Impairment tests for goodwill are performed once a year, irrespective of whether there is any indication that they may be impaired, or in cases where there is an indication of impairment. Refer to Note “15. GOODWILL AND INTANGIBLE ASSETS” for details of impairment testing of goodwill. Except for assets that generally do not generate independent cash flows from other assets or asset groups, the recoverable amount of an asset or a cash-generating unit is determined individually by asset at the higher of its fair value less costs of disposal or its value in use. Where the carrying amount of the asset or cash-generating unit exceeds its recoverable amount, the asset is written down to its recoverable amount and impairment losses are recognized. An impairment loss recognized for goodwill is not reversed in a subsequent period. For assets excluding goodwill, an assessment is made at reporting period end to determine whether there is any indication that previously recognized impairment losses may no longer exist or have decreased. If any such indication exists, the recoverable amount of the asset is estimated. In cases that the recoverable amount exceeds the carrying amount of the asset, a reversal of impairment losses is recognized. The amount of the reversal of the impairment loss shall not exceed the carrying amount that would have been determined (net of depreciation or amortization) if no impairment loss had been recognized. Because goodwill that forms part of the carrying amount of an investment in entities accounted for using the equity method is not separately recognized, it is not tested for impairment separately. If there is any indication that an investment in entities accounted for using the equity method may be impaired, the entire carrying amount of the investment is tested as a single asset.
(12) Non-current Assets Classified as Held for SaleA non-current asset or asset group whose carrying amount is expected to be recovered principally through a sale transaction rather than through continuing use is classified as held-for-sale if the non-current asset or asset group is available for immediate sale in its present condition, Group management is committed to a sales plan and its sale is expected to be completed within one year. The Group measures a non-current asset or asset group classified as held-for-sale at the lower of its carrying amount and fair value less costs to sell.
(13) Post-employment BenefitsThe Group has set up defined benefit plans and defined contribution plans as employee retirement benefit plans. For defined benefit plans, the Group recognizes the present value of defined benefit obligations less the fair value of any plan assets as liabilities or assets. For defined benefit plans, the Group determines the present value of defined benefit obligations, related current service cost and past service cost using the projected unit credit method. The discount rate is determined based on high quality corporate bond yield rates at fiscal year end for the corresponding discount period based on projected period until the expected benefit payment date. Service costs and interest costs of defined benefit plans are recognized in profit or loss, and net interest is determined using the discount rate described above. Remeasurements of defined benefit plans are recognized in other comprehensive income in the period when they are incurred and reclassified to retained earnings immediately. Past service costs are recognized in profit or loss in the period incurred. The cost for defined contribution plans is recognized in profit or loss in the period in which the employees render the related services.
(14) ProvisionsProvisions are recognized when the Group has a present obligation (legal or constructive) as a result of a past event, it is probable that the obligation will be required to be settled and a reliable estimate can be made for the amount of the obligation. Where the effect of the time value of money is material, provisions are measured based on the present value using a discount rate reflecting the risks specific to the liability.
(15) RevenueThe Group recognizes revenue under the five-step approach described below.
Step 1: Identify contracts with customersStep 2: Identify performance obligations in a contractStep 3: Calculate the transaction priceStep 4: Allocate the transaction price to the performance
obligations in the contractStep 5: Recognize revenue when the entity satisfies its
Dentsu Group Integrated Report 202125
performance obligations. The Group provides advertising, information services and other businesses to its customers. In the advertising business, the Group mainly provides services such as placement of advertising into various media, production of advertising including creative services, and various content-related services. With regards to placement of advertising into various media, revenue is recognized when the media is placed, mainly because control of the service is transferred to the customer when the advertisement is placed on the media and the performance obligations of the Group are satisfied. Regarding the provision of services such as advertising production and various content-related services, revenue is recognized in accordance with the fulfillment of the performance obligations, as the delivery of the work or the provision of services transfers control of the goods or services to the customer and satisfies the performance obligations of the Group. With regards to right-related business such as marketing rights for sports events, revenue is recognized at a point in time when such rights is transferred to the customer at a certain point in time, or is recognized over a period of time when such rights can be used by the customer over a period time, depending on the nature of the rights granted to the customer. With regards to revenue that are recognized over a period of time, performance obligation is primarily satisfied over the life of the contract, and the revenue is recorded on a pro rata basis over the contract period in which the performance obligation is satisfied. The Group determines that it primarily acts as an agent considering the primary responsibility for the performance of commitments, inventory risk, pricing discretion and other factors in the transaction. Transactions related to the advertising business are principally recorded based on the net amount of consideration received from customers, less related costs, or a certain amount of fee received as a commission, for services provided by the Group. For certain transactions which the Group determined that it is acting as a principal, consideration received from customers and costs are presented on a gross basis. Consideration for transactions in the advertising business is received primarily within one year of satisfying performance obligations and does not include significant financing components. In the information services business, the Group is mainly involved in sales of software products, development of systems, and outsourcing/operation/maintenance services. Regarding sales of software products and products, revenue is recognized at the time of delivery to the customer because control of the product is transferred to the customer and the Group’s performance obligations are satisfied. Regarding software development, the customer’s asset will enhance as the development progresses, and the customer will gain control of the asset, and the Group’s performance obligations are satisfied accordingly. Therefore, revenue is recognized based on the progress of development. Development progress is calculated
based on the ratio of inputs used to satisfy performance obligations (costs incurred) to total expected inputs until such performance obligations are fully satisfied. As for the operation and maintenance services, performance obligations are satisfied as the contract period elapses, and revenue is recorded on a pro rata basis over the contract period in which the performance obligations are satisfied. Revenues from the information service industry are calculated by deducting discounts, etc., from the consideration in sales contracts. Considering the primary responsibility for fulfilling the commitments, inventory risk, pricing discretion and other factors, the Group is deemed to have a strong basis as a principal, therefore revenues and costs are recorded on a gross basis. Consideration for transactions in the information services business is received mainly within one year after fulfillment of the performance obligation and does not include any significant financing components. Other businesses include office leasing, building services, and calculation services. Turnover represents the total amount billed and billable to customers by the Group, net of discounts, VAT and other sales-related taxes. Disclosure of turnover information is not in accordance with IFRS.
(16) Finance Income and Finance ExpensesFinance income mainly consists of interest and dividend income. Interest income is recognized as accrued using the effective interest rate method while dividend income is recognized when the shareholder’s right to receive payment is established. Finance expenses mainly consist of interest expenses on borrowings and bonds. Interest expenses are recognized as incurred using the effective interest rate method.
(17) Income TaxesIncome taxes consist of current income taxes and deferred income taxes. Income taxes are recognized in profit or loss, except for taxes arising from items that are recognized in other comprehensive income or directly in equity and taxes arising from business combinations. Current income taxes are measured at the amount which is expected to be paid to or refunded from the taxation authorities. The tax rates and tax laws used to calculate the amount are those that are enacted or substantively enacted, by the end of the reporting period. Deferred tax assets and liabilities are recognized for temporary differences between the carrying amount of assets and liabilities in the Consolidated Statement of Financial Position and their tax basis amount. Deferred tax assets or liabilities are not recognized for differences arising from the initial recognition of assets or liabilities in transactions that are not business combinations and affect neither accounting profit or loss nor taxable profit or loss. Deferred tax liabilities are also not recognized for taxable temporary differences arising from the initial recognition of goodwill. Deferred tax liabilities are recognized for taxable temporary
Dentsu Group Integrated Report 202126
Financial Report 2021
differences associated with investments in subsidiaries, associates and joint ventures. However, deferred tax liabilities are not recognized for taxable temporary differences associated with investments in subsidiaries, associates and joint ventures to the extent the Group controls the timing of the reversal of the temporary difference and it is probable the temporary difference will not reverse in the foreseeable future. Deferred tax assets are recognized for deductible temporary differences associated with investments in subsidiaries, associates and joint ventures only to the extent that it is probable that the temporary difference will reverse in the foreseeable future and there will be sufficient taxable profits against which the temporary differences can be utilized. Deferred tax assets and liabilities are measured at the tax rates that are expected to apply to the reporting period when the asset is realized or the liability is settled, based on tax rates that have been enacted or substantively enacted by the reporting period end. Deferred tax assets are recognized to the extent that it is probable that taxable profits will be available against which carryforwards of unused tax losses, tax credit carryforwards and deductible temporary differences can be utilized. Deferred tax assets are reassessed at the end of the fiscal year and reduced by the amount of any tax benefits that are not expected to be realized. Deferred tax assets and liabilities are offset if the Group has a legally enforceable right to set off current tax assets against current tax liabilities, and income taxes are levied by the same taxation authority on the same taxable entity.
(18) EquityA. Share Capital and Share Premium AccountEquity instruments issued by the Company are recorded in share capital and share premium account. Transaction costs directly attributable to the issuance of an equity instrument are deducted from equity.
B. Treasury SharesTreasury shares are recognized at cost and deducted from equity. No gain or loss is recognized on the purchase, sale or cancellation of treasury shares. When treasury shares are sold, any difference between their carrying amount and consideration received is recognized in the share premium account.
C. Put options written over non-controlling interestsNon-controlling interests are recognized when the Group writes a put option over equity shares held by non-controlling interests in a subsidiary, and are not included in the calculation of goodwill. In addition, the written put option is initially recognized at the present value of the redemption amount as other financial liabilities, and the same amount is deducted from retained earnings.
(19) Earnings per ShareBasic earnings per share are calculated by dividing profit for the year attributable to ordinary shareholders of the parent company
by the weighted-average number of ordinary shares outstanding during the year, adjusted by the number of treasury shares. Diluted earnings per share are calculated by adjusting the effects of all potential ordinary shares with dilutive effect.
(20) Share-based PaymentsThe Company and certain subsidiaries grant equity-settled and cash-settled share-based payment plans. For equity-settled share-based payments, services received and the corresponding increase in equity are measured at the fair value of the equity instruments at the date of grant and are recorded as an expense over the vesting period and recognized as an increase in equity. For cash-settled share-based payments, services received and the liability incurred are measured at the fair value of the liability. The Group recognizes expense and liability, as the employees render services during the vesting period. The fair value of the liability is remeasured at the end of each reporting period and at the date of settlement, with any changes in fair value recognized in profit or loss.
(21) Underlying Operating Profit The underlying operating profit is calculated by eliminating M&A related items and one-off items from operating profit, and is used by management for the purpose of measuring constant business performance. M&A related items: amotization of intangible assets incurred in acquisitions, acquisition costs, share-based compensation expenses attributable to the aquiree, share-based compensation expense issued following the acquisition of 100% ownership of a subsidiary One-off items: items such as restructuring costs, impairment loss and gain/loss on sales of non-current assets The underlying operating profit is not defined under IFRS; however, it is voluntarily disclosed in the Consolidated Statement of Income and Note “6. SEGMENT INFORMATION” since management has concluded that the information is useful for users of the financial statements.
(22) Change in significant accounting policies “Interest Rate Benchmark Reform—Amendments to IFRS 9 Financial Instruments, IAS 39 Financial Instruments: Recognition and Measurement and IFRS 7 Financial Instruments: Disclosures,” which was published in September 2019, modified specific hedge accounting requirements to provide relief from potential effects of the uncertainty caused by the IBOR reform. The amendments modify specific hedge accounting requirements, so that entities would apply those hedge accounting requirements assuming that the interest rate benchmark is not altered as a result of the interest rate benchmark reform. The Group has adopted the amendments in the year ended December 31, 2020, and the adoption of these amendments has no significant impact on the consolidated financial statements.
Dentsu Group Integrated Report 202127
4. SIGNIFICANT ACCOUNTING JUDGEMENTS, ESTIMATES AND ASSUMPTIONS
The preparation of the consolidated financial statements requires management to make judgments, estimates and assumptions that affect the adoption of accounting policies and the reported amounts of revenues, expenses, assets and liabilities. These estimates and assumptions are based on the best judgment of management in light of historical experience and various factors deemed to be reasonable as of the fiscal year end date. However, given their nature, actual results may differ from those estimates and assumptions. The estimate and underlying assumptions are continuously reviewed. The effects of a change in estimate are recognized in the period of the change and future periods. Information relating to judgments carried out in the process of the application of accounting policies that have a material impact on the consolidated financial statements, is mainly as follows:
• Scope of subsidiaries, associates and joint ventures (“3. SIGNIFICANT ACCOUNTING POLICIES (1) Basis of Consolidation”)
• Revenue recognition (“3. SIGNIFICANT ACCOUNTING POLICIES (15) Revenue”)
• Allocation of goodwill to cash-generating unit groups (“15. GOODWILL AND INTANGIBLE ASSETS”)
Estimates and assumptions that may have a material effect on the amounts recognized in the consolidated financial statements are as follows:
• Impairment of property, plant and equipment, goodwill, intangible assets and investment properties (“14. PROPERTY, PLANT AND EQUIPMENT,” “15. GOODWILL AND INTANGIBLE ASSETS,” and “17. INVESTMENT PROPERTY”)
• Valuation of financial instruments (“36. FINANCIAL INSTRUMENTS”)
• Valuation of defined benefit obligations (“23. POST-EMPLOYMENT BENEFITS”)
• Provisions (“22. PROVISIONS”)• Recoverability of deferred tax assets (“19. INCOME TAXES”)• Remeasurement of put option liabilities (“36. FINANCIAL
INSTRUMENTS”) (Additional information) Accounting estimates related to the spread of COVID-19
• Accounting estimates for the valuation of inventories, provisions, and contingent liabilities
The spread of COVID-19 has an extensive impact on the economy and corporate activities, and it is also affecting the Group’s business activities. The International Olympic Committee and the Tokyo 2020 Organising Committee announced in March 2020 to postpone the Tokyo 2020 Olympic and Paralympic Games to July 2021. Accounting estimates mainly for the valuation of inventories, provisions, and contingent liabilities represent best estimates based on the information available at the time the consolidated financial statements were prepared, assuming that the Games will
be held in July 2021.• Impairment loss on goodwill related to the international
business Based on the latest business plan compiled using the most recent results, the Group conducted an annual impairment test of goodwill related to international business operations during the year ended December 31, 2020. As a result, the Group recognized impairment loss on goodwill of ¥140,367 million($1,356 million) in the international business. The recoverable amount in the impairment test of goodwill is calculated using the value in use based on the budgets for the year ending December 31, 2021 approved by management and the results forecast for the subsequent four fiscal years. The budgets and results forecast for the international business segment and each cash-generating unit group are based on the assumption that the impact of the spread of COVID-19 is the greatest in the year ended December 31, 2020 and that a recovery trend will emerge in the year ending December 31, 2021 and continue thereafter. For details regarding the impairment test of goodwill, see “15. Goodwill and Intangible Assets, (2) Significant Goodwill and Intangible Assets and (3) Impairment Test of Goodwill.”
Dentsu Group Integrated Report 202128
Financial Report 2021
5. NEW ACCOUNTING STANDARDS NOT YET ADOPTED BY THE GROUPNew accounting standards, amended standards and new interpretations that have been issued by the date of approval of the consolidated financial statements, but have not been subject to early adoption by the Group are as follows: The impact of applying the new IFRS standards on the Group is currently being assessed and cannot be estimated at this time.
Standards Name of standardsMandatory adoption
(From the year beginning)
To be adopted by the Group Description of new standards and amendments
IFRS 16 Leases June 1, 2020 Fiscal year ending December 31, 2021
The amendment makes it easier for lessees to account for rent concessions related to COVID-19, such as rent holidays and temporary rent reductions.
IFRS 7IFRS 9IAS 39
Financial Instruments: Disclosure Financial Instruments Financial Instruments: Recognition and Measurement”
January 1, 2021 Fiscal year ending December 31, 2021
Interest Rate Benchmark Reform—Phase 2 (Amendments regarding the impact on financial reporting as a result of the replacement of an existing benchmark rate with an alternative benchmark rate)
IAS 1 Presentation of Financial Statements January 1, 2023 Fiscal year ending December 31, 2023
The amendment clarifies how to classify debt and other liabilities as current or non-current.
Dentsu Group Integrated Report 202129
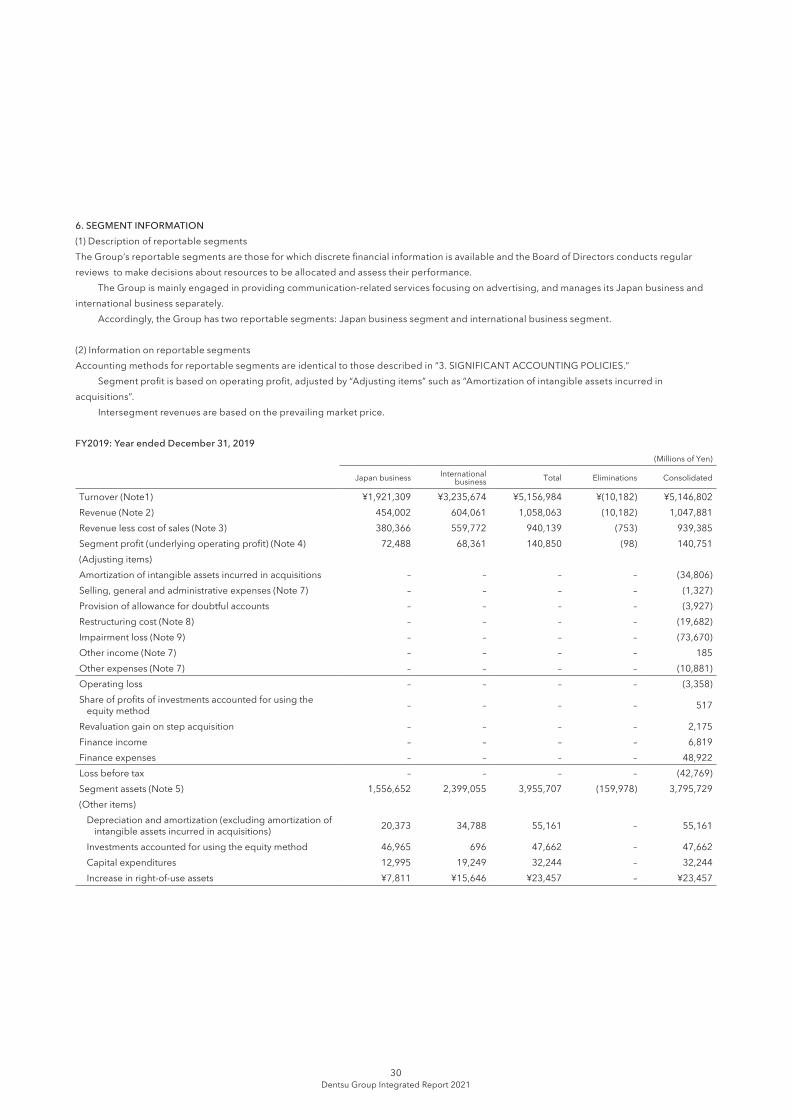
6. SEGMENT INFORMATION(1) Description of reportable segmentsThe Group’s reportable segments are those for which discrete financial information is available and the Board of Directors conducts regular reviews to make decisions about resources to be allocated and assess their performance. The Group is mainly engaged in providing communication-related services focusing on advertising, and manages its Japan business and international business separately. Accordingly, the Group has two reportable segments: Japan business segment and international business segment.
(2) Information on reportable segmentsAccounting methods for reportable segments are identical to those described in “3. SIGNIFICANT ACCOUNTING POLICIES.” Segment profit is based on operating profit, adjusted by “Adjusting items” such as “Amortization of intangible assets incurred in acquisitions”. Intersegment revenues are based on the prevailing market price.
FY2019: Year ended December 31, 2019(Millions of Yen)
Japan business International business Total Eliminations Consolidated
Turnover (Note1) ¥1,921,309 ¥3,235,674 ¥5,156,984 ¥(10,182) ¥5,146,802Revenue (Note 2) 454,002 604,061 1,058,063 (10,182) 1,047,881Revenue less cost of sales (Note 3) 380,366 559,772 940,139 (753) 939,385Segment profit (underlying operating profit) (Note 4) 72,488 68,361 140,850 (98) 140,751(Adjusting items)Amortization of intangible assets incurred in acquisitions – – – – (34,806)Selling, general and administrative expenses (Note 7) – – – – (1,327)Provision of allowance for doubtful accounts – – – – (3,927)Restructuring cost (Note 8) – – – – (19,682)Impairment loss (Note 9) – – – – (73,670)Other income (Note 7) – – – – 185Other expenses (Note 7) – – – – (10,881)Operating loss – – – – (3,358)Share of profits of investments accounted for using the
equity method – – – – 517
Revaluation gain on step acquisition – – – – 2,175Finance income – – – – 6,819Finance expenses – – – – 48,922Loss before tax – – – – (42,769)Segment assets (Note 5) 1,556,652 2,399,055 3,955,707 (159,978) 3,795,729(Other items)
Depreciation and amortization (excluding amortization of intangible assets incurred in acquisitions) 20,373 34,788 55,161 – 55,161
Investments accounted for using the equity method 46,965 696 47,662 – 47,662Capital expenditures 12,995 19,249 32,244 – 32,244Increase in right-of-use assets ¥7,811 ¥15,646 ¥23,457 – ¥23,457
Dentsu Group Integrated Report 202130
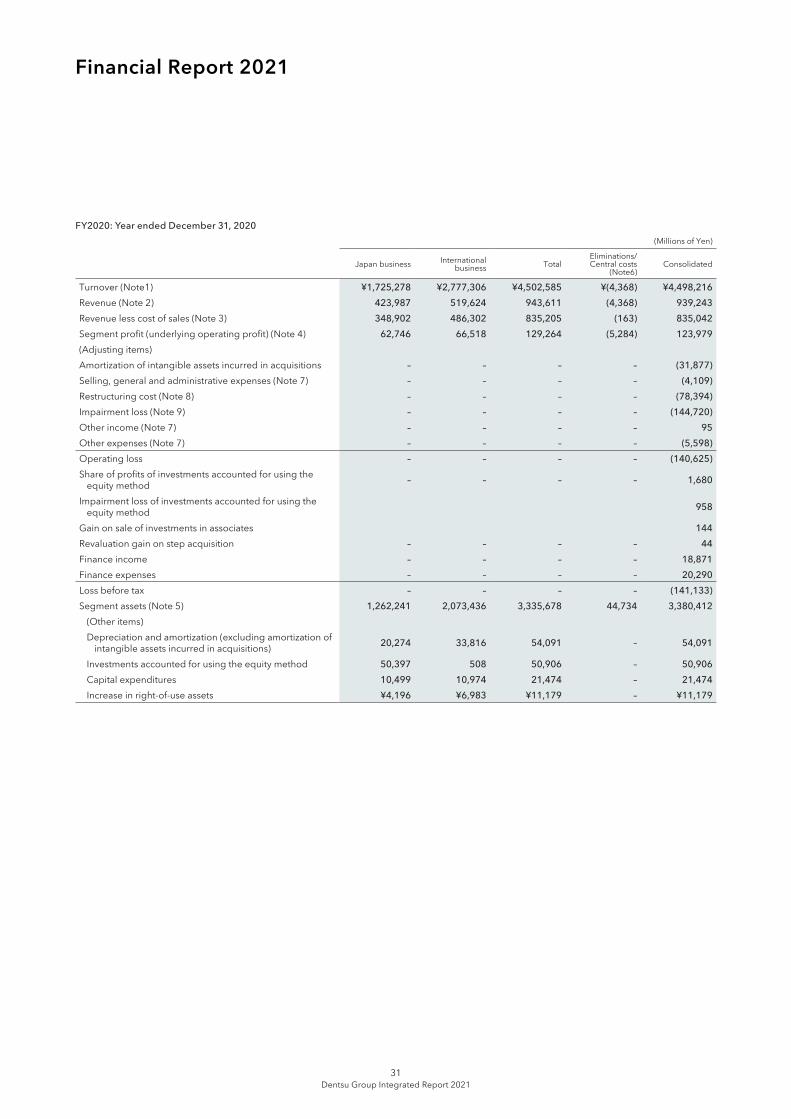
Financial Report 2021
FY2020: Year ended December 31, 2020(Millions of Yen)
Japan business International business Total
Eliminations/Central costs
(Note6)Consolidated
Turnover (Note1) ¥1,725,278 ¥2,777,306 ¥4,502,585 ¥(4,368) ¥4,498,216Revenue (Note 2) 423,987 519,624 943,611 (4,368) 939,243Revenue less cost of sales (Note 3) 348,902 486,302 835,205 (163) 835,042Segment profit (underlying operating profit) (Note 4) 62,746 66,518 129,264 (5,284) 123,979(Adjusting items)Amortization of intangible assets incurred in acquisitions – – – – (31,877)Selling, general and administrative expenses (Note 7) – – – – (4,109)Restructuring cost (Note 8) – – – – (78,394)Impairment loss (Note 9) – – – – (144,720)Other income (Note 7) – – – – 95Other expenses (Note 7) – – – – (5,598)Operating loss – – – – (140,625)Share of profits of investments accounted for using the
equity method – – – – 1,680
Impairment loss of investments accounted for using the equity method 958
Gain on sale of investments in associates 144Revaluation gain on step acquisition – – – – 44Finance income – – – – 18,871Finance expenses – – – – 20,290Loss before tax – – – – (141,133)Segment assets (Note 5) 1,262,241 2,073,436 3,335,678 44,734 3,380,412
(Other items)Depreciation and amortization (excluding amortization of
intangible assets incurred in acquisitions) 20,274 33,816 54,091 – 54,091
Investments accounted for using the equity method 50,397 508 50,906 – 50,906Capital expenditures 10,499 10,974 21,474 – 21,474Increase in right-of-use assets ¥4,196 ¥6,983 ¥11,179 – ¥11,179
Dentsu Group Integrated Report 202131
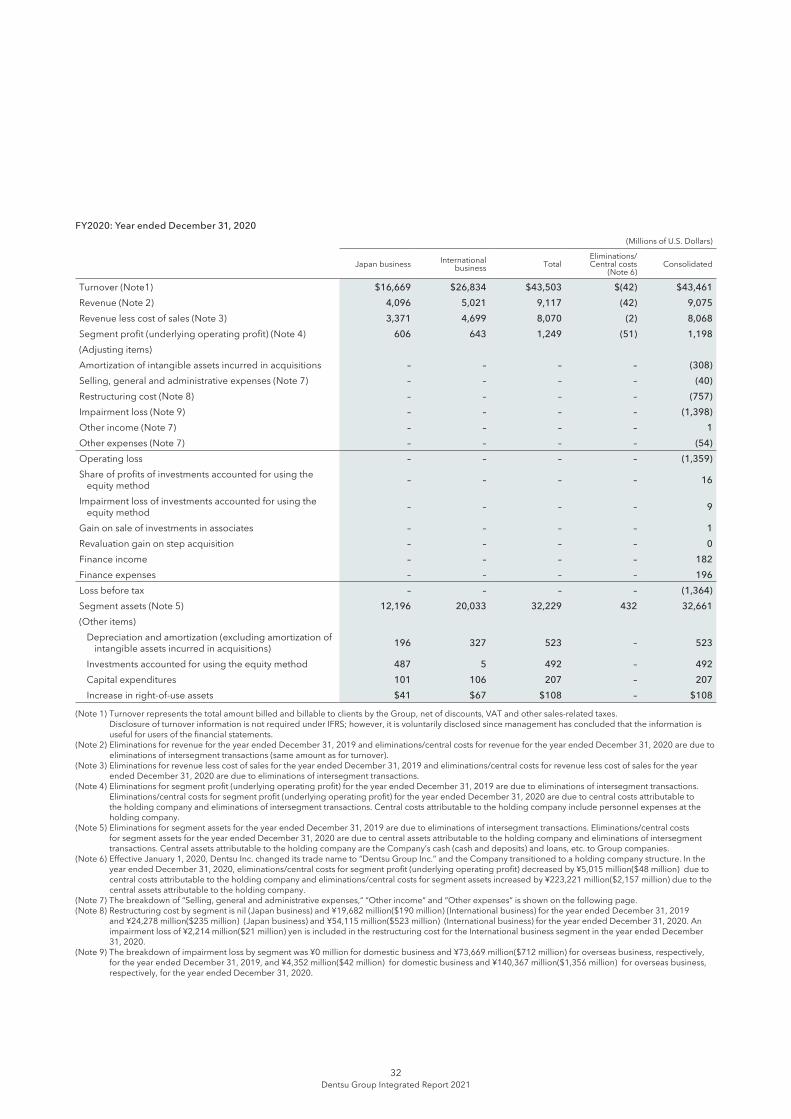
FY2020: Year ended December 31, 2020 (Millions of U.S. Dollars)
Japan business International business Total
Eliminations/Central costs
(Note 6)Consolidated
Turnover (Note1) $16,669 $26,834 $43,503 $(42) $43,461Revenue (Note 2) 4,096 5,021 9,117 (42) 9,075Revenue less cost of sales (Note 3) 3,371 4,699 8,070 (2) 8,068Segment profit (underlying operating profit) (Note 4) 606 643 1,249 (51) 1,198(Adjusting items)Amortization of intangible assets incurred in acquisitions – – – – (308)Selling, general and administrative expenses (Note 7) – – – – (40)Restructuring cost (Note 8) – – – – (757)Impairment loss (Note 9) – – – – (1,398)Other income (Note 7) – – – – 1Other expenses (Note 7) – – – – (54)Operating loss – – – – (1,359)Share of profits of investments accounted for using the
equity method – – – – 16
Impairment loss of investments accounted for using the equity method – – – – 9
Gain on sale of investments in associates – – – – 1Revaluation gain on step acquisition – – – – 0Finance income – – – – 182Finance expenses – – – – 196Loss before tax – – – – (1,364)Segment assets (Note 5) 12,196 20,033 32,229 432 32,661(Other items)
Depreciation and amortization (excluding amortization of intangible assets incurred in acquisitions) 196 327 523 – 523
Investments accounted for using the equity method 487 5 492 – 492Capital expenditures 101 106 207 – 207Increase in right-of-use assets $41 $67 $108 – $108
(Note 1) Turnover represents the total amount billed and billable to clients by the Group, net of discounts, VAT and other sales-related taxes. Disclosure of turnover information is not required under IFRS; however, it is voluntarily disclosed since management has concluded that the information is
useful for users of the financial statements. (Note 2) Eliminations for revenue for the year ended December 31, 2019 and eliminations/central costs for revenue for the year ended December 31, 2020 are due to
eliminations of intersegment transactions (same amount as for turnover).(Note 3) Eliminations for revenue less cost of sales for the year ended December 31, 2019 and eliminations/central costs for revenue less cost of sales for the year
ended December 31, 2020 are due to eliminations of intersegment transactions.(Note 4) Eliminations for segment profit (underlying operating profit) for the year ended December 31, 2019 are due to eliminations of intersegment transactions.
Eliminations/central costs for segment profit (underlying operating profit) for the year ended December 31, 2020 are due to central costs attributable to the holding company and eliminations of intersegment transactions. Central costs attributable to the holding company include personnel expenses at the holding company.
(Note 5) Eliminations for segment assets for the year ended December 31, 2019 are due to eliminations of intersegment transactions. Eliminations/central costs for segment assets for the year ended December 31, 2020 are due to central assets attributable to the holding company and eliminations of intersegment transactions. Central assets attributable to the holding company are the Company’s cash (cash and deposits) and loans, etc. to Group companies.
(Note 6) Effective January 1, 2020, Dentsu Inc. changed its trade name to “Dentsu Group Inc.” and the Company transitioned to a holding company structure. In the year ended December 31, 2020, eliminations/central costs for segment profit (underlying operating profit) decreased by ¥5,015 million($48 million) due to central costs attributable to the holding company and eliminations/central costs for segment assets increased by ¥223,221 million($2,157 million) due to the central assets attributable to the holding company.
(Note 7) The breakdown of “Selling, general and administrative expenses,“ “Other income“ and “Other expenses“ is shown on the following page.(Note 8) Restructuring cost by segment is nil (Japan business) and ¥19,682 million($190 million) (International business) for the year ended December 31, 2019
and ¥24,278 million($235 million) (Japan business) and ¥54,115 million($523 million) (International business) for the year ended December 31, 2020. An impairment loss of ¥2,214 million($21 million) yen is included in the restructuring cost for the International business segment in the year ended December 31, 2020.
(Note 9) The breakdown of impairment loss by segment was ¥0 million for domestic business and ¥73,669 million($712 million) for overseas business, respectively, for the year ended December 31, 2019, and ¥4,352 million($42 million) for domestic business and ¥140,367 million($1,356 million) for overseas business, respectively, for the year ended December 31, 2020.
Dentsu Group Integrated Report 202132
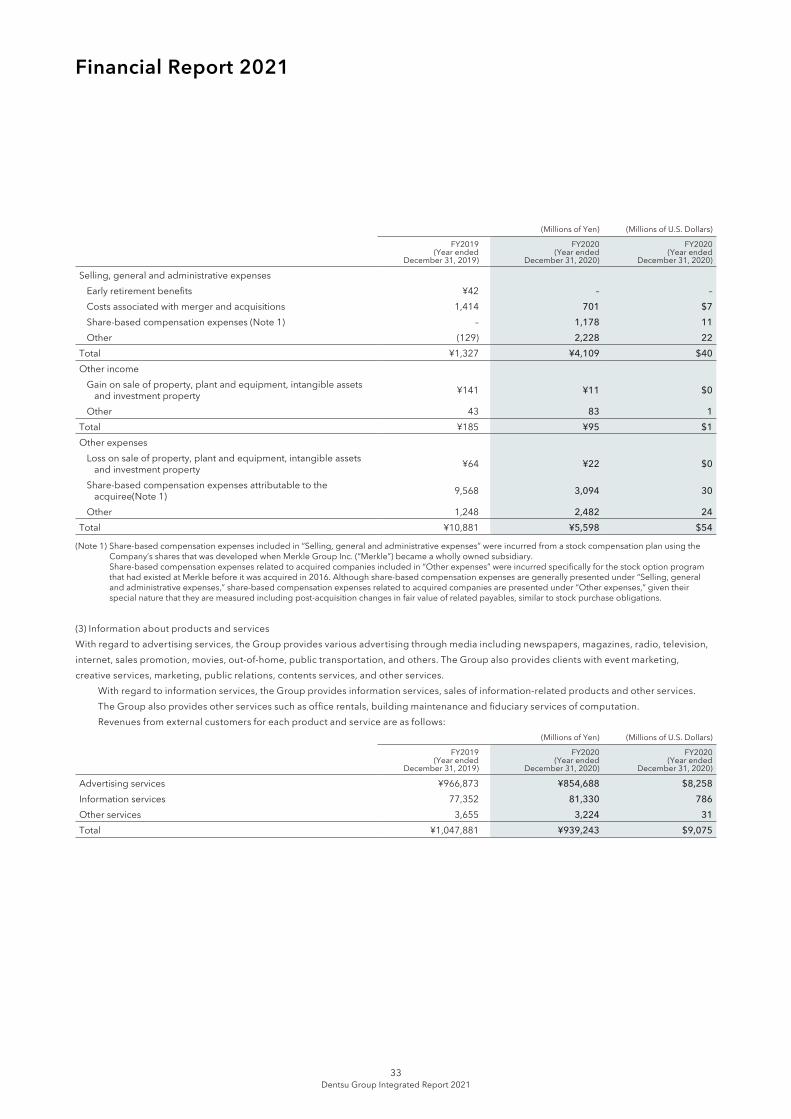
Financial Report 2021
(Millions of Yen) (Millions of U.S. Dollars)
FY2019(Year ended
December 31, 2019)
FY2020(Year ended
December 31, 2020)
FY2020(Year ended
December 31, 2020)
Selling, general and administrative expensesEarly retirement benefits ¥42 – –Costs associated with merger and acquisitions 1,414 701 $7Share-based compensation expenses (Note 1) – 1,178 11Other (129) 2,228 22
Total ¥1,327 ¥4,109 $40Other income
Gain on sale of property, plant and equipment, intangible assets and investment property ¥141 ¥11 $0
Other 43 83 1Total ¥185 ¥95 $1Other expenses
Loss on sale of property, plant and equipment, intangible assets and investment property ¥64 ¥22 $0
Share-based compensation expenses attributable to the acquiree(Note 1) 9,568 3,094 30
Other 1,248 2,482 24Total ¥10,881 ¥5,598 $54
(Note 1) Share-based compensation expenses included in “Selling, general and administrative expenses” were incurred from a stock compensation plan using the Company’s shares that was developed when Merkle Group Inc. (“Merkle”) became a wholly owned subsidiary.
Share-based compensation expenses related to acquired companies included in “Other expenses” were incurred specifically for the stock option program that had existed at Merkle before it was acquired in 2016. Although share-based compensation expenses are generally presented under “Selling, general and administrative expenses,” share-based compensation expenses related to acquired companies are presented under “Other expenses,” given their special nature that they are measured including post-acquisition changes in fair value of related payables, similar to stock purchase obligations.
(3) Information about products and servicesWith regard to advertising services, the Group provides various advertising through media including newspapers, magazines, radio, television, internet, sales promotion, movies, out-of-home, public transportation, and others. The Group also provides clients with event marketing, creative services, marketing, public relations, contents services, and other services. With regard to information services, the Group provides information services, sales of information-related products and other services. The Group also provides other services such as office rentals, building maintenance and fiduciary services of computation. Revenues from external customers for each product and service are as follows:
(Millions of Yen) (Millions of U.S. Dollars)
FY2019(Year ended
December 31, 2019)
FY2020(Year ended
December 31, 2020)
FY2020(Year ended
December 31, 2020)
Advertising services ¥966,873 ¥854,688 $8,258Information services 77,352 81,330 786Other services 3,655 3,224 31Total ¥1,047,881 ¥939,243 $9,075
Dentsu Group Integrated Report 202133
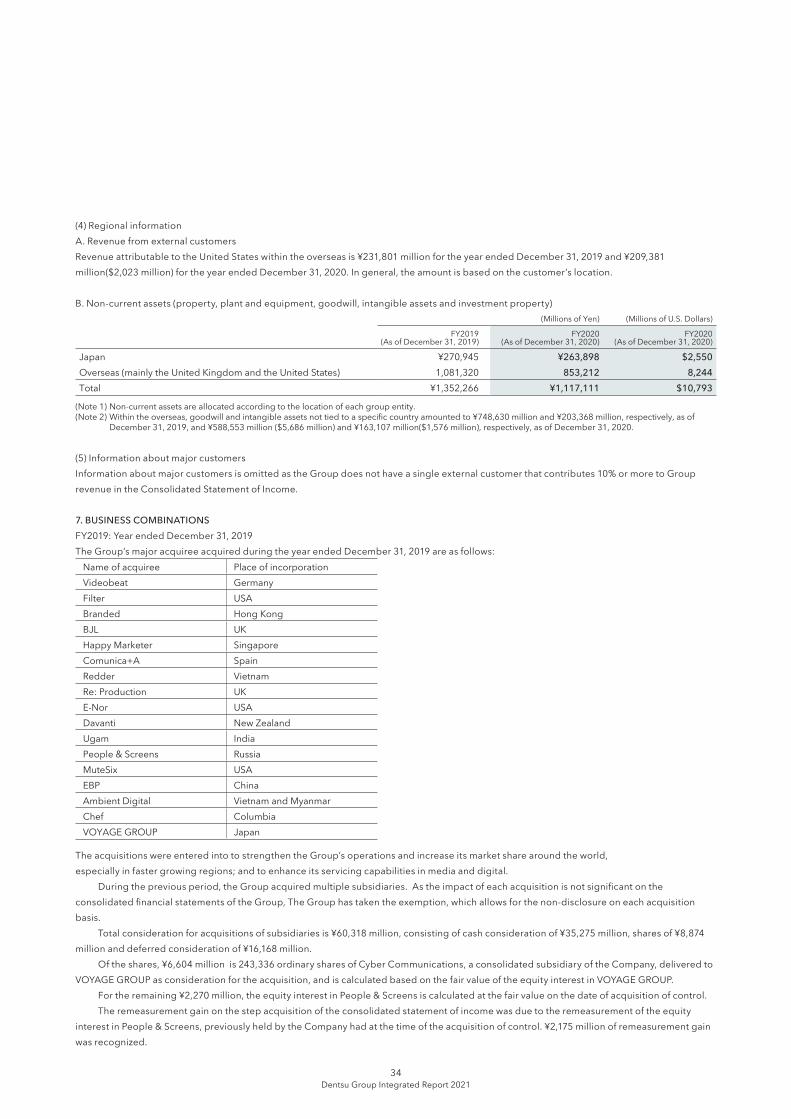
(4) Regional informationA. Revenue from external customersRevenue attributable to the United States within the overseas is ¥231,801 million for the year ended December 31, 2019 and ¥209,381 million($2,023 million) for the year ended December 31, 2020. In general, the amount is based on the customer’s location.
B. Non-current assets (property, plant and equipment, goodwill, intangible assets and investment property)(Millions of Yen) (Millions of U.S. Dollars)
FY2019(As of December 31, 2019)
FY2020(As of December 31, 2020)
FY2020(As of December 31, 2020)
Japan ¥270,945 ¥263,898 $2,550Overseas (mainly the United Kingdom and the United States) 1,081,320 853,212 8,244Total ¥1,352,266 ¥1,117,111 $10,793
(Note 1) Non-current assets are allocated according to the location of each group entity.(Note 2) Within the overseas, goodwill and intangible assets not tied to a specific country amounted to ¥748,630 million and ¥203,368 million, respectively, as of
December 31, 2019, and ¥588,553 million ($5,686 million) and ¥163,107 million($1,576 million), respectively, as of December 31, 2020.
(5) Information about major customersInformation about major customers is omitted as the Group does not have a single external customer that contributes 10% or more to Group revenue in the Consolidated Statement of Income.
7. BUSINESS COMBINATIONSFY2019: Year ended December 31, 2019The Group’s major acquiree acquired during the year ended December 31, 2019 are as follows:
Name of acquiree Place of incorporation Videobeat Germany Filter USA Branded Hong Kong BJL UK Happy Marketer Singapore Comunica+A Spain Redder Vietnam Re: Production UK E-Nor USA Davanti New Zealand Ugam India People & Screens Russia MuteSix USA EBP China Ambient Digital Vietnam and Myanmar Chef Columbia VOYAGE GROUP Japan
The acquisitions were entered into to strengthen the Group’s operations and increase its market share around the world, especially in faster growing regions; and to enhance its servicing capabilities in media and digital. During the previous period, the Group acquired multiple subsidiaries. As the impact of each acquisition is not significant on the consolidated financial statements of the Group, The Group has taken the exemption, which allows for the non-disclosure on each acquisition basis. Total consideration for acquisitions of subsidiaries is ¥60,318 million, consisting of cash consideration of ¥35,275 million, shares of ¥8,874 million and deferred consideration of ¥16,168 million. Of the shares, ¥6,604 million is 243,336 ordinary shares of Cyber Communications, a consolidated subsidiary of the Company, delivered to VOYAGE GROUP as consideration for the acquisition, and is calculated based on the fair value of the equity interest in VOYAGE GROUP. For the remaining ¥2,270 million, the equity interest in People & Screens is calculated at the fair value on the date of acquisition of control. The remeasurement gain on the step acquisition of the consolidated statement of income was due to the remeasurement of the equity interest in People & Screens, previously held by the Company had at the time of the acquisition of control. ¥2,175 million of remeasurement gain was recognized.
Dentsu Group Integrated Report 202134
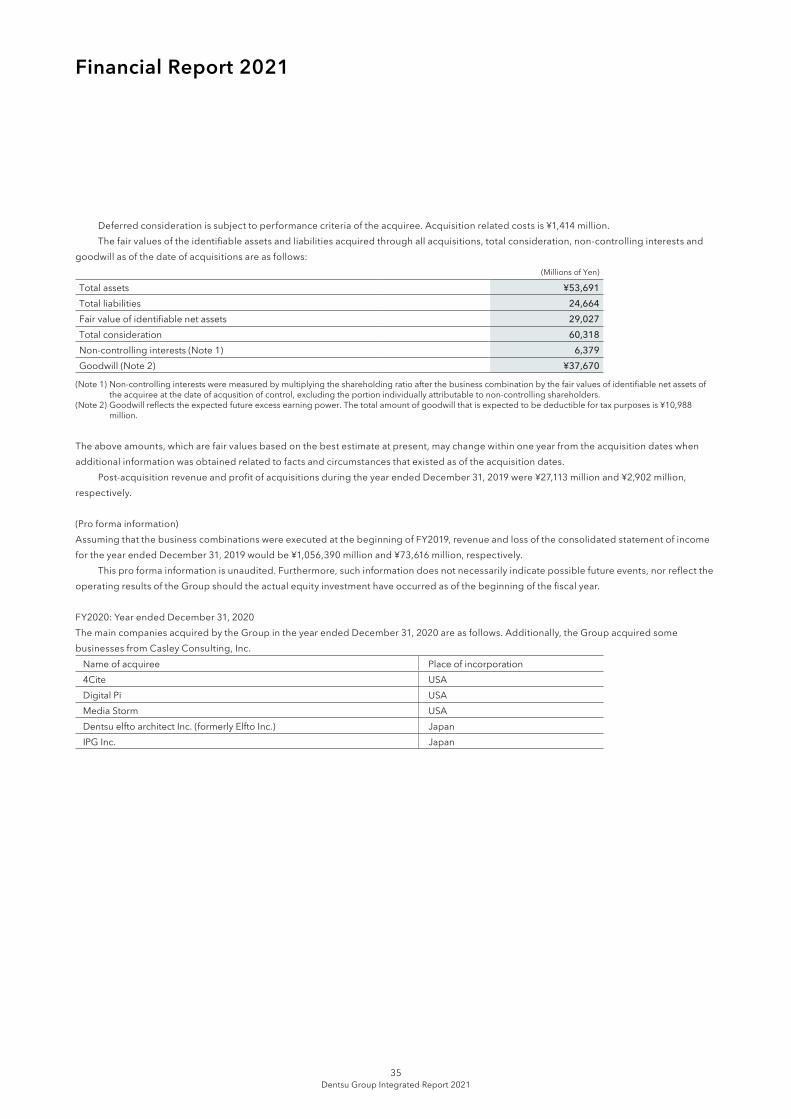
Financial Report 2021
Deferred consideration is subject to performance criteria of the acquiree. Acquisition related costs is ¥1,414 million. The fair values of the identifiable assets and liabilities acquired through all acquisitions, total consideration, non-controlling interests and goodwill as of the date of acquisitions are as follows:
(Millions of Yen)
Total assets ¥53,691 Total liabilities 24,664 Fair value of identifiable net assets 29,027 Total consideration 60,318 Non-controlling interests (Note 1) 6,379 Goodwill (Note 2) ¥37,670
(Note 1) Non-controlling interests were measured by multiplying the shareholding ratio after the business combination by the fair values of identifiable net assets of the acquiree at the date of acqusition of control, excluding the portion individually attributable to non-controlling shareholders.
(Note 2) Goodwill reflects the expected future excess earning power. The total amount of goodwill that is expected to be deductible for tax purposes is ¥10,988 million.
The above amounts, which are fair values based on the best estimate at present, may change within one year from the acquisition dates when additional information was obtained related to facts and circumstances that existed as of the acquisition dates. Post-acquisition revenue and profit of acquisitions during the year ended December 31, 2019 were ¥27,113 million and ¥2,902 million, respectively.
(Pro forma information)Assuming that the business combinations were executed at the beginning of FY2019, revenue and loss of the consolidated statement of income for the year ended December 31, 2019 would be ¥1,056,390 million and ¥73,616 million, respectively. This pro forma information is unaudited. Furthermore, such information does not necessarily indicate possible future events, nor reflect the operating results of the Group should the actual equity investment have occurred as of the beginning of the fiscal year.
FY2020: Year ended December 31, 2020The main companies acquired by the Group in the year ended December 31, 2020 are as follows. Additionally, the Group acquired some businesses from Casley Consulting, Inc.
Name of acquiree Place of incorporation 4Cite USA Digital Pi USA Media Storm USA Dentsu elfto architect Inc. (formerly Elfto Inc.) Japan IPG Inc. Japan
Dentsu Group Integrated Report 202135

The business combinations were performed to strengthen the Group’s operations, expand its share particularly in fast-growing regions, and enhance its capabilities in the media and digital domains. The Group acquired shares of several companies and businesses in the year ended December 31, 2020, but as the impact of each individual transaction on the consolidated financial statements is not material, the following amounts are not provided for each transaction. The acquisition cost of businesses acquired by the Group in the year ended December 31, 2020 is ¥12,774 million ($123 million). The acquisition cost consists of ¥9,999 million ($97 million) in cash, ¥444 million ($4 million) in shares, and ¥2,331 million ($23 million) in contingent considerations. The amount of ¥444 million ($4 million) in shares was determined using the acquisition-date fair value of the equity interest in IPG, Inc. The amount of ¥44 million ($0 million) in revaluation gain on step acquisition was recognized in the consolidated statement of income after remeasuring at acquisition-date fair value of the equity interest in IPG, Inc. already held by the Company at the time of acquisition during the year ended December 31, 2020. Contingent consideration is calculated based on the performance of the acquiree The fair value of assets, liabilities, consideration paid, non-controlling interests and goodwill at the business combination-date are as follows.
(Millions of Yen) (Millions of U.S. Dollars)
Total assets ¥18,278 $177 Total liabilities 14,489 140 Fair value of identifiable net assets 3,788 37 Total consideration 12,774 123 Non-controlling interests (Note 1) 613 6 Goodwill (Note 2) ¥9,599 $93
(Note 1) Non-controlling interests were measured by multiplying the shareholding ratio after the business combination by the fair values of identifiable net assets of the acquiree at the date of acquisition of control, excluding the portion individually attributable to non-controlling shareholders.
(Note 2) Goodwill reflects the expected future excess earning power. The total amount of goodwill that is expected to be deductible for tax purposes is ¥8,349 million ($81 million).
The above amounts, which are fair values based on the best estimate at present, may change within one year from the acquisition dates when additional information is obtained related to facts and circumstances that existed as of the acquisition dates. Post-acquisition revenue and profit of acquisitions during the year ended December 31, 2020 were ¥6,409 million ($62 million) and ¥883 million ($9 million), respectively.
(Pro forma information)Assuming that the business combinations were executed at the beginning of the current fiscal year, revenue and loss of the consolidated statement of income for the year ended December 31, 2020 would be ¥940,219 million ($9,084 million) and ¥152,427 million ($1,473 million), respectively. This pro forma information is unaudited. Furthermore, such information does not necessarily indicate possible future events, nor reflect the operating results of the Group should the actual equity investment have occurred as of the beginning of the fiscal year.
8. CASH AND CASH EQUIVALENTSThe breakdown of cash and cash equivalents is as follows:
(Millions of Yen) (Millions of U.S. Dollars)
FY2019(As of December 31, 2019)
FY2020(As of December 31, 2020)
FY2020(As of December 31, 2020)
Cash and time deposits due within three months ¥414,055 ¥530,692 $5,127
Cash and cash equivalents are classified as financial assets measured at amortized cost. The above amount as of December 31, 2019 is after eliminating the deposit into the cash pooling account which the Company considers as loans to Dentsu International Limited. amounting to ¥109,321 million as of December 31, 2019.
Dentsu Group Integrated Report 202136
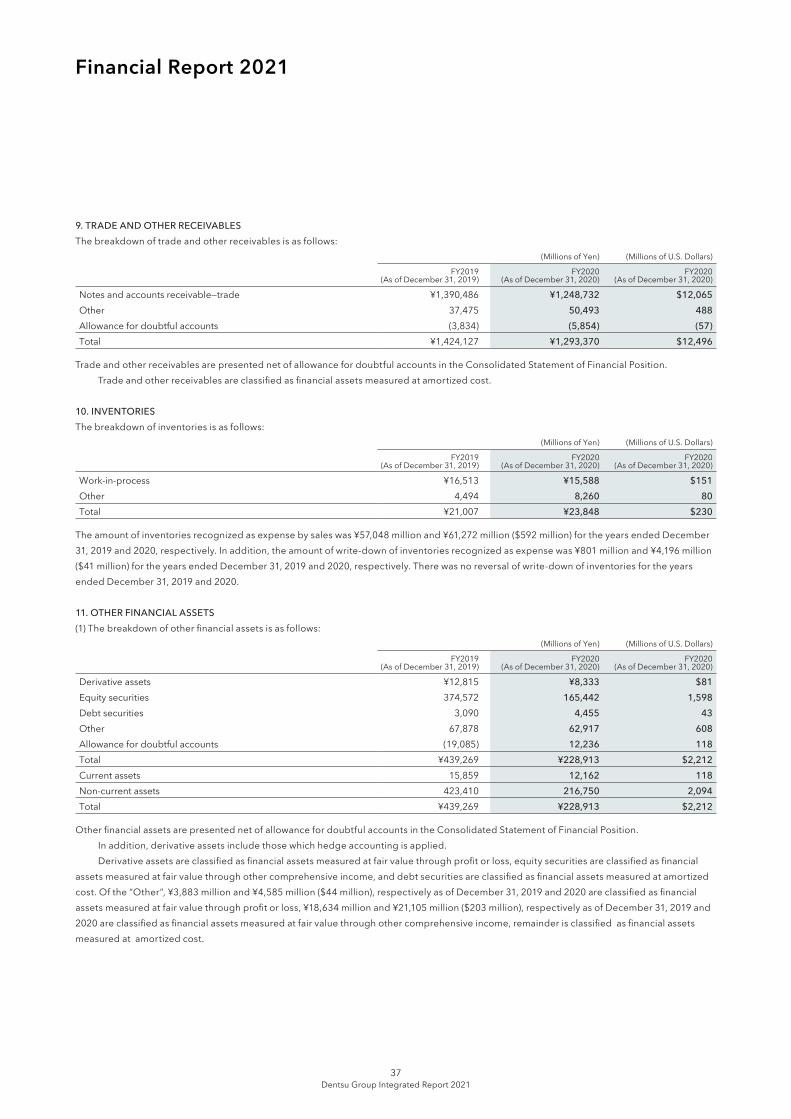
Financial Report 2021
9. TRADE AND OTHER RECEIVABLESThe breakdown of trade and other receivables is as follows:
(Millions of Yen) (Millions of U.S. Dollars)
FY2019(As of December 31, 2019)
FY2020(As of December 31, 2020)
FY2020(As of December 31, 2020)
Notes and accounts receivable—trade ¥1,390,486 ¥1,248,732 $12,065Other 37,475 50,493 488Allowance for doubtful accounts (3,834) (5,854) (57)Total ¥1,424,127 ¥1,293,370 $12,496
Trade and other receivables are presented net of allowance for doubtful accounts in the Consolidated Statement of Financial Position. Trade and other receivables are classified as financial assets measured at amortized cost.
10. INVENTORIESThe breakdown of inventories is as follows:
(Millions of Yen) (Millions of U.S. Dollars)
FY2019(As of December 31, 2019)
FY2020(As of December 31, 2020)
FY2020(As of December 31, 2020)
Work-in-process ¥16,513 ¥15,588 $151Other 4,494 8,260 80Total ¥21,007 ¥23,848 $230
The amount of inventories recognized as expense by sales was ¥57,048 million and ¥61,272 million ($592 million) for the years ended December 31, 2019 and 2020, respectively. In addition, the amount of write-down of inventories recognized as expense was ¥801 million and ¥4,196 million ($41 million) for the years ended December 31, 2019 and 2020, respectively. There was no reversal of write-down of inventories for the years ended December 31, 2019 and 2020.
11. OTHER FINANCIAL ASSETS(1) The breakdown of other financial assets is as follows:
(Millions of Yen) (Millions of U.S. Dollars)
FY2019(As of December 31, 2019)
FY2020(As of December 31, 2020)
FY2020(As of December 31, 2020)
Derivative assets ¥12,815 ¥8,333 $81Equity securities 374,572 165,442 1,598Debt securities 3,090 4,455 43Other 67,878 62,917 608Allowance for doubtful accounts (19,085) 12,236 118Total ¥439,269 ¥228,913 $2,212Current assets 15,859 12,162 118Non-current assets 423,410 216,750 2,094Total ¥439,269 ¥228,913 $2,212
Other financial assets are presented net of allowance for doubtful accounts in the Consolidated Statement of Financial Position. In addition, derivative assets include those which hedge accounting is applied. Derivative assets are classified as financial assets measured at fair value through profit or loss, equity securities are classified as financial assets measured at fair value through other comprehensive income, and debt securities are classified as financial assets measured at amortized cost. Of the “Other”, ¥3,883 million and ¥4,585 million ($44 million), respectively as of December 31, 2019 and 2020 are classified as financial assets measured at fair value through profit or loss, ¥18,634 million and ¥21,105 million ($203 million), respectively as of December 31, 2019 and 2020 are classified as financial assets measured at fair value through other comprehensive income, remainder is classified as financial assets measured at amortized cost.
Dentsu Group Integrated Report 202137
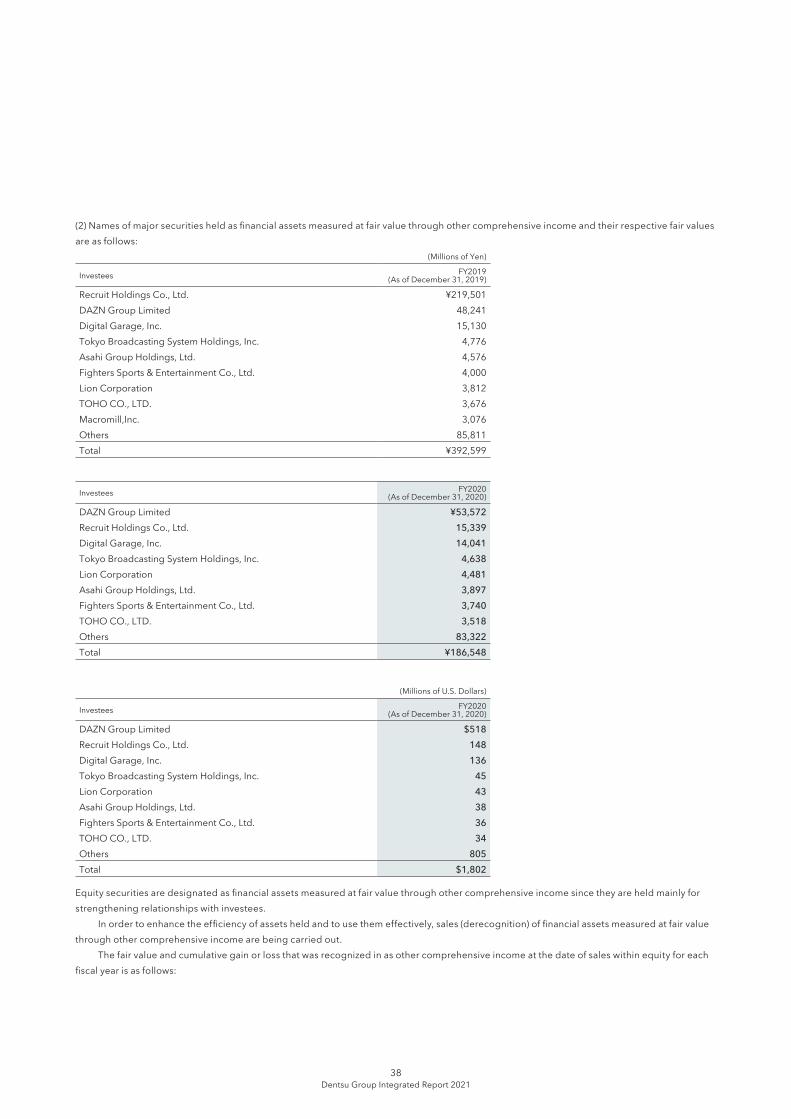
(2) Names of major securities held as financial assets measured at fair value through other comprehensive income and their respective fair values are as follows:
(Millions of Yen)
Investees FY2019(As of December 31, 2019)
Recruit Holdings Co., Ltd. ¥219,501DAZN Group Limited 48,241Digital Garage, Inc. 15,130Tokyo Broadcasting System Holdings, Inc. 4,776Asahi Group Holdings, Ltd. 4,576Fighters Sports & Entertainment Co., Ltd. 4,000Lion Corporation 3,812TOHO CO., LTD. 3,676Macromill,Inc. 3,076Others 85,811Total ¥392,599
Investees FY2020(As of December 31, 2020)
DAZN Group Limited ¥53,572Recruit Holdings Co., Ltd. 15,339Digital Garage, Inc. 14,041Tokyo Broadcasting System Holdings, Inc. 4,638Lion Corporation 4,481Asahi Group Holdings, Ltd. 3,897Fighters Sports & Entertainment Co., Ltd. 3,740TOHO CO., LTD. 3,518Others 83,322Total ¥186,548
(Millions of U.S. Dollars)
Investees FY2020(As of December 31, 2020)
DAZN Group Limited $518Recruit Holdings Co., Ltd. 148Digital Garage, Inc. 136Tokyo Broadcasting System Holdings, Inc. 45Lion Corporation 43Asahi Group Holdings, Ltd. 38Fighters Sports & Entertainment Co., Ltd. 36TOHO CO., LTD. 34Others 805Total $1,802
Equity securities are designated as financial assets measured at fair value through other comprehensive income since they are held mainly for strengthening relationships with investees. In order to enhance the efficiency of assets held and to use them effectively, sales (derecognition) of financial assets measured at fair value through other comprehensive income are being carried out. The fair value and cumulative gain or loss that was recognized in as other comprehensive income at the date of sales within equity for each fiscal year is as follows:
Dentsu Group Integrated Report 202138
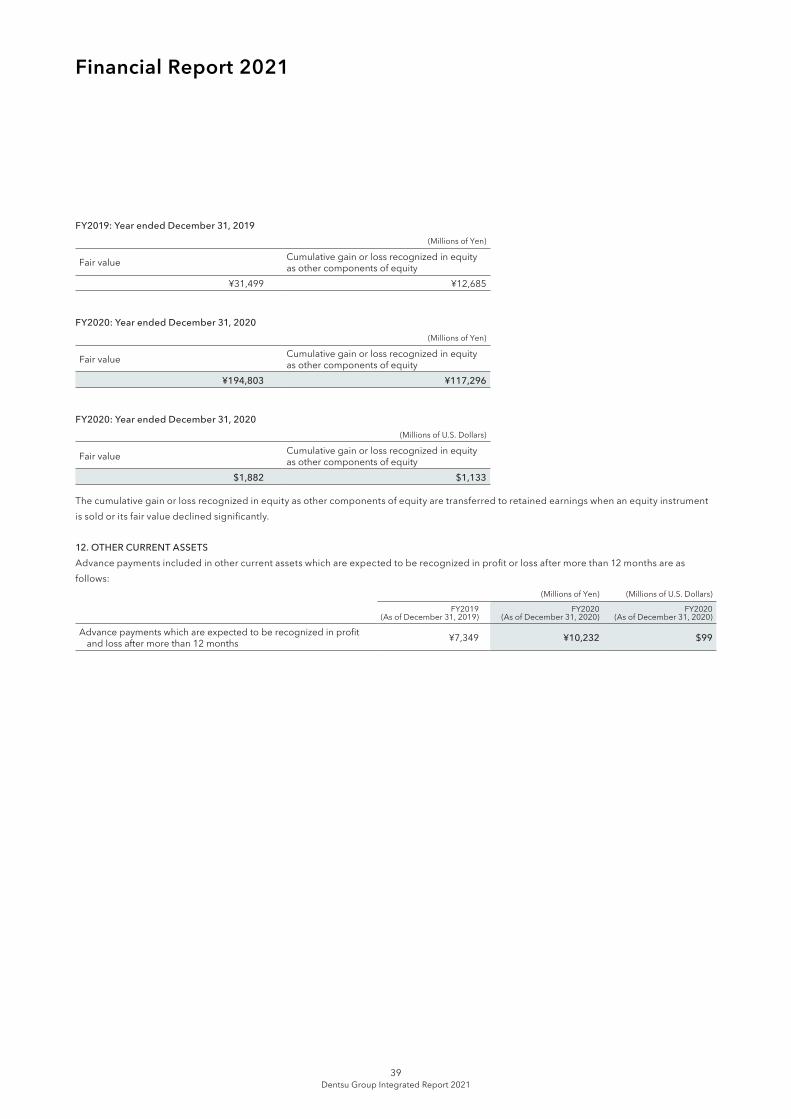
Financial Report 2021
FY2019: Year ended December 31, 2019(Millions of Yen)
Fair value Cumulative gain or loss recognized in equity as other components of equity
¥31,499 ¥12,685
FY2020: Year ended December 31, 2020(Millions of Yen)
Fair value Cumulative gain or loss recognized in equity as other components of equity
¥194,803 ¥117,296
FY2020: Year ended December 31, 2020 (Millions of U.S. Dollars)
Fair value Cumulative gain or loss recognized in equity as other components of equity
$1,882 $1,133
The cumulative gain or loss recognized in equity as other components of equity are transferred to retained earnings when an equity instrument is sold or its fair value declined significantly.
12. OTHER CURRENT ASSETSAdvance payments included in other current assets which are expected to be recognized in profit or loss after more than 12 months are as follows:
(Millions of Yen) (Millions of U.S. Dollars)
FY2019(As of December 31, 2019)
FY2020(As of December 31, 2020)
FY2020(As of December 31, 2020)
Advance payments which are expected to be recognized in profit and loss after more than 12 months ¥7,349 ¥10,232 $99
Dentsu Group Integrated Report 202139
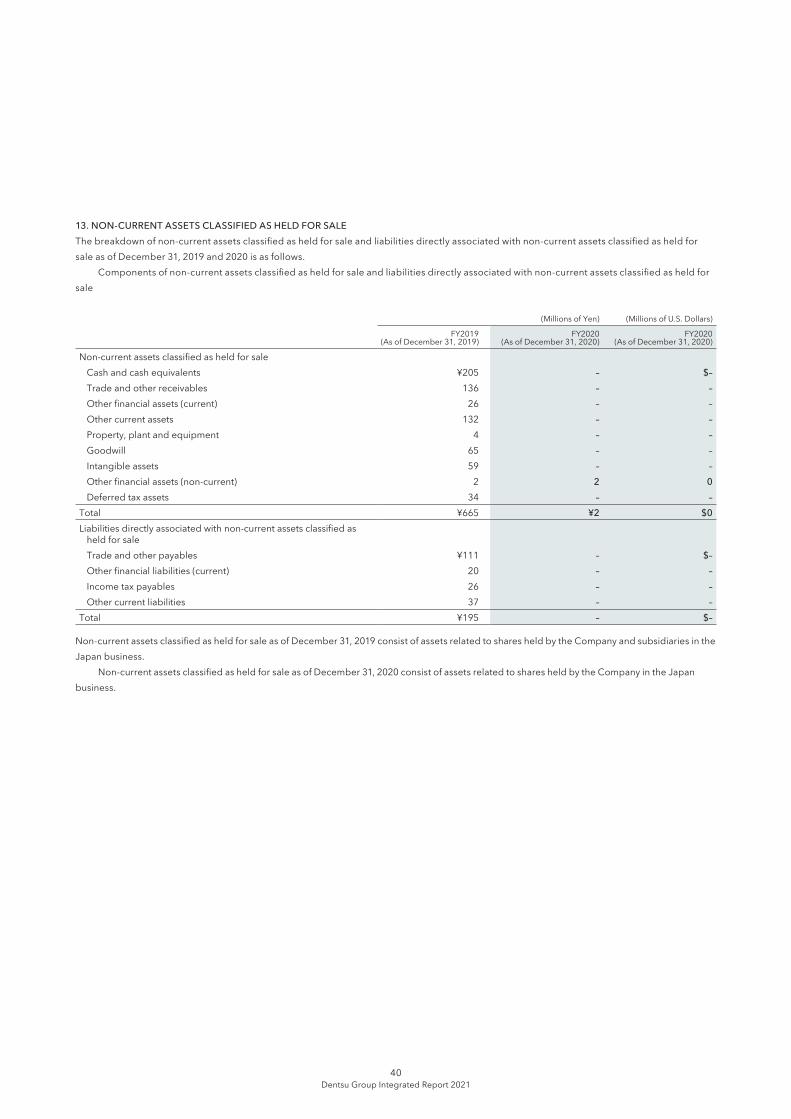
13. NON-CURRENT ASSETS CLASSIFIED AS HELD FOR SALEThe breakdown of non-current assets classified as held for sale and liabilities directly associated with non-current assets classified as held for sale as of December 31, 2019 and 2020 is as follows. Components of non-current assets classified as held for sale and liabilities directly associated with non-current assets classified as held for sale
(Millions of Yen) (Millions of U.S. Dollars)
FY2019(As of December 31, 2019)
FY2020(As of December 31, 2020)
FY2020(As of December 31, 2020)
Non-current assets classified as held for saleCash and cash equivalents ¥205 – $–Trade and other receivables 136 – –Other financial assets (current) 26 – –Other current assets 132 – –Property, plant and equipment 4 – –Goodwill 65 – –Intangible assets 59 – –Other financial assets (non-current) 2 2 0Deferred tax assets 34 – –
Total ¥665 ¥2 $0Liabilities directly associated with non-current assets classified as
held for saleTrade and other payables ¥111 – $–Other financial liabilities (current) 20 – –Income tax payables 26 – –Other current liabilities 37 – –
Total ¥195 – $–
Non-current assets classified as held for sale as of December 31, 2019 consist of assets related to shares held by the Company and subsidiaries in the Japan business. Non-current assets classified as held for sale as of December 31, 2020 consist of assets related to shares held by the Company in the Japan business.
Dentsu Group Integrated Report 202140
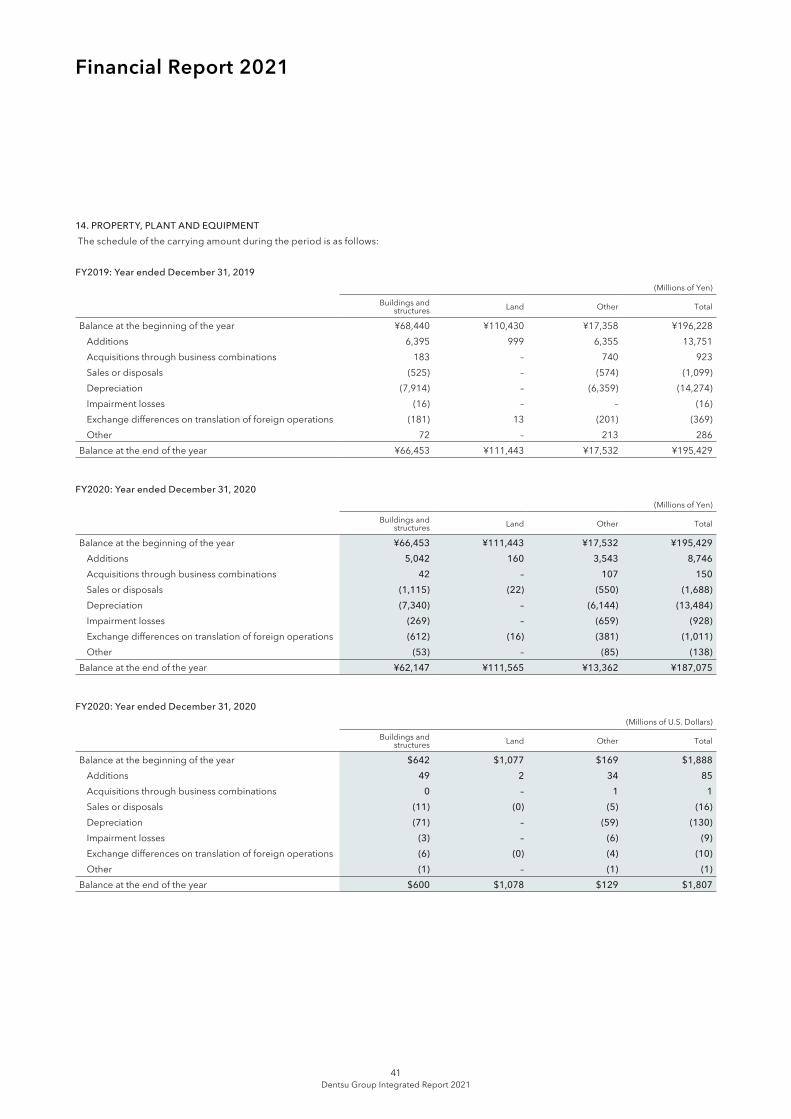
Financial Report 2021
14. PROPERTY, PLANT AND EQUIPMENT The schedule of the carrying amount during the period is as follows:
FY2019: Year ended December 31, 2019(Millions of Yen)
Buildings and structures Land Other Total
Balance at the beginning of the year ¥68,440 ¥110,430 ¥17,358 ¥196,228Additions 6,395 999 6,355 13,751Acquisitions through business combinations 183 – 740 923Sales or disposals (525) – (574) (1,099)Depreciation (7,914) – (6,359) (14,274)Impairment losses (16) – – (16)Exchange differences on translation of foreign operations (181) 13 (201) (369)Other 72 – 213 286
Balance at the end of the year ¥66,453 ¥111,443 ¥17,532 ¥195,429
FY2020: Year ended December 31, 2020(Millions of Yen)
Buildings and structures Land Other Total
Balance at the beginning of the year ¥66,453 ¥111,443 ¥17,532 ¥195,429Additions 5,042 160 3,543 8,746Acquisitions through business combinations 42 – 107 150Sales or disposals (1,115) (22) (550) (1,688)Depreciation (7,340) – (6,144) (13,484)Impairment losses (269) – (659) (928)Exchange differences on translation of foreign operations (612) (16) (381) (1,011)Other (53) – (85) (138)
Balance at the end of the year ¥62,147 ¥111,565 ¥13,362 ¥187,075
FY2020: Year ended December 31, 2020 (Millions of U.S. Dollars)
Buildings and structures Land Other Total
Balance at the beginning of the year $642 $1,077 $169 $1,888Additions 49 2 34 85Acquisitions through business combinations 0 – 1 1Sales or disposals (11) (0) (5) (16)Depreciation (71) – (59) (130)Impairment losses (3) – (6) (9)Exchange differences on translation of foreign operations (6) (0) (4) (10)Other (1) – (1) (1)
Balance at the end of the year $600 $1,078 $129 $1,807
Dentsu Group Integrated Report 202141
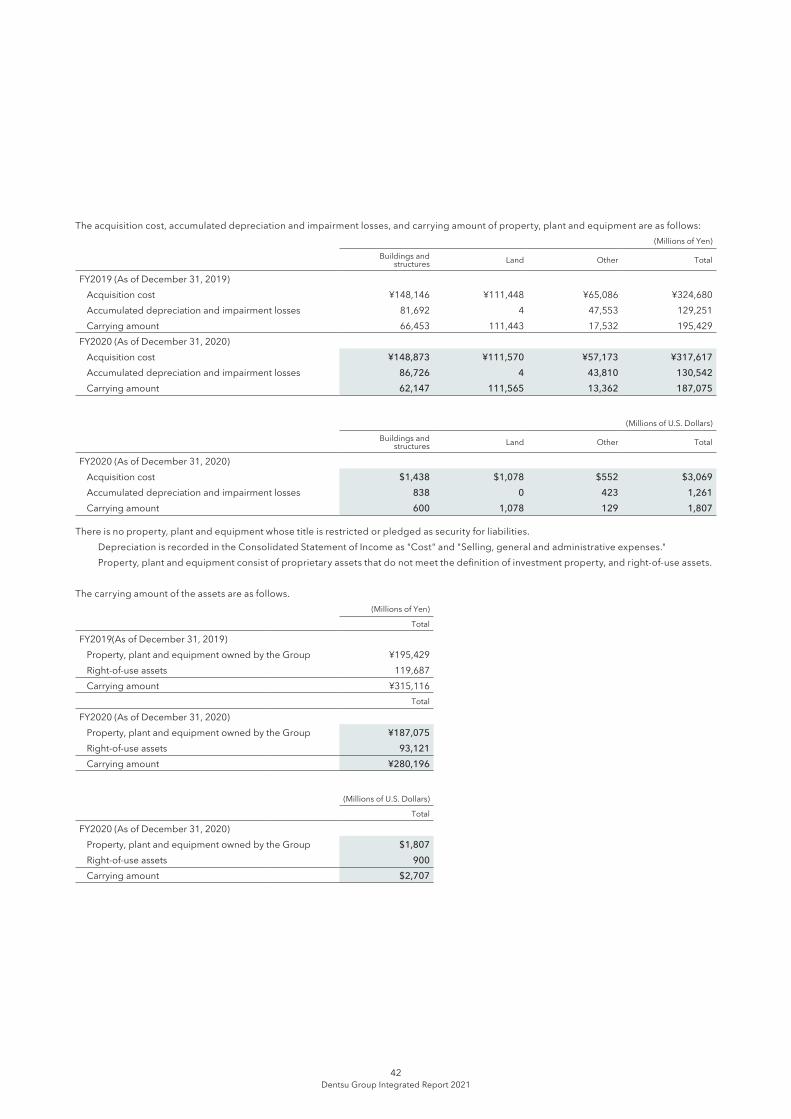
The acquisition cost, accumulated depreciation and impairment losses, and carrying amount of property, plant and equipment are as follows:(Millions of Yen)
Buildings and structures Land Other Total
FY2019 (As of December 31, 2019)Acquisition cost ¥148,146 ¥111,448 ¥65,086 ¥324,680Accumulated depreciation and impairment losses 81,692 4 47,553 129,251Carrying amount 66,453 111,443 17,532 195,429
FY2020 (As of December 31, 2020)Acquisition cost ¥148,873 ¥111,570 ¥57,173 ¥317,617Accumulated depreciation and impairment losses 86,726 4 43,810 130,542Carrying amount 62,147 111,565 13,362 187,075
(Millions of U.S. Dollars)
Buildings and structures Land Other Total
FY2020 (As of December 31, 2020)Acquisition cost $1,438 $1,078 $552 $3,069Accumulated depreciation and impairment losses 838 0 423 1,261Carrying amount 600 1,078 129 1,807
There is no property, plant and equipment whose title is restricted or pledged as security for liabilities. Depreciation is recorded in the Consolidated Statement of Income as "Cost" and "Selling, general and administrative expenses." Property,plantandequipmentconsistofproprietaryassetsthatdonotmeetthedefinitionofinvestmentproperty,andright-of-useassets.
The carrying amount of the assets are as follows.(Millions of Yen)
Total
FY2019(As of December 31, 2019)Property, plant and equipment owned by the Group ¥195,429Right-of-useassets 119,687Carrying amount ¥315,116
Total
FY2020 (As of December 31, 2020)Property, plant and equipment owned by the Group ¥187,075Right-of-useassets 93,121Carrying amount ¥280,196
(Millions of U.S. Dollars)
Total
FY2020 (As of December 31, 2020)Property, plant and equipment owned by the Group $1,807Right-of-useassets 900Carrying amount $2,707
Dentsu Group Integrated Report 202142
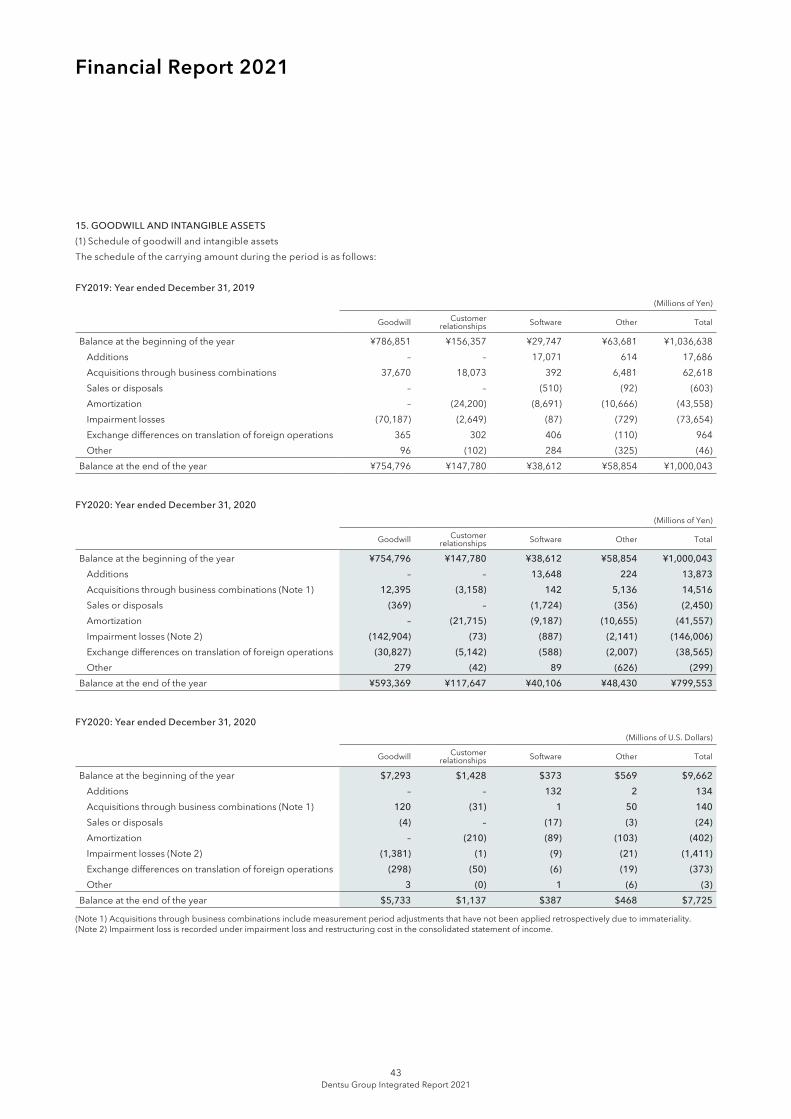
Financial Report 2021
15. GOODWILL AND INTANGIBLE ASSETS(1) Schedule of goodwill and intangible assetsThe schedule of the carrying amount during the period is as follows:
FY2019: Year ended December 31, 2019(Millions of Yen)
Goodwill Customer relationships Software Other Total
Balance at the beginning of the year ¥786,851 ¥156,357 ¥29,747 ¥63,681 ¥1,036,638Additions – – 17,071 614 17,686Acquisitions through business combinations 37,670 18,073 392 6,481 62,618Sales or disposals – – (510) (92) (603)Amortization – (24,200) (8,691) (10,666) (43,558)Impairment losses (70,187) (2,649) (87) (729) (73,654)Exchange differences on translation of foreign operations 365 302 406 (110) 964Other 96 (102) 284 (325) (46)
Balance at the end of the year ¥754,796 ¥147,780 ¥38,612 ¥58,854 ¥1,000,043
FY2020: Year ended December 31, 2020(Millions of Yen)
Goodwill Customer relationships Software Other Total
Balance at the beginning of the year ¥754,796 ¥147,780 ¥38,612 ¥58,854 ¥1,000,043Additions – – 13,648 224 13,873Acquisitions through business combinations (Note 1) 12,395 (3,158) 142 5,136 14,516Sales or disposals (369) – (1,724) (356) (2,450)Amortization – (21,715) (9,187) (10,655) (41,557)Impairment losses (Note 2) (142,904) (73) (887) (2,141) (146,006)Exchange differences on translation of foreign operations (30,827) (5,142) (588) (2,007) (38,565)Other 279 (42) 89 (626) (299)
Balance at the end of the year ¥593,369 ¥117,647 ¥40,106 ¥48,430 ¥799,553
FY2020: Year ended December 31, 2020 (Millions of U.S. Dollars)
Goodwill Customer relationships Software Other Total
Balance at the beginning of the year $7,293 $1,428 $373 $569 $9,662Additions – – 132 2 134Acquisitions through business combinations (Note 1) 120 (31) 1 50 140Sales or disposals (4) – (17) (3) (24)Amortization – (210) (89) (103) (402)Impairment losses (Note 2) (1,381) (1) (9) (21) (1,411)Exchange differences on translation of foreign operations (298) (50) (6) (19) (373)Other 3 (0) 1 (6) (3)
Balance at the end of the year $5,733 $1,137 $387 $468 $7,725
(Note 1) Acquisitions through business combinations include measurement period adjustments that have not been applied retrospectively due to immateriality.(Note 2) Impairment loss is recorded under impairment loss and restructuring cost in the consolidated statement of income.
Dentsu Group Integrated Report 202143
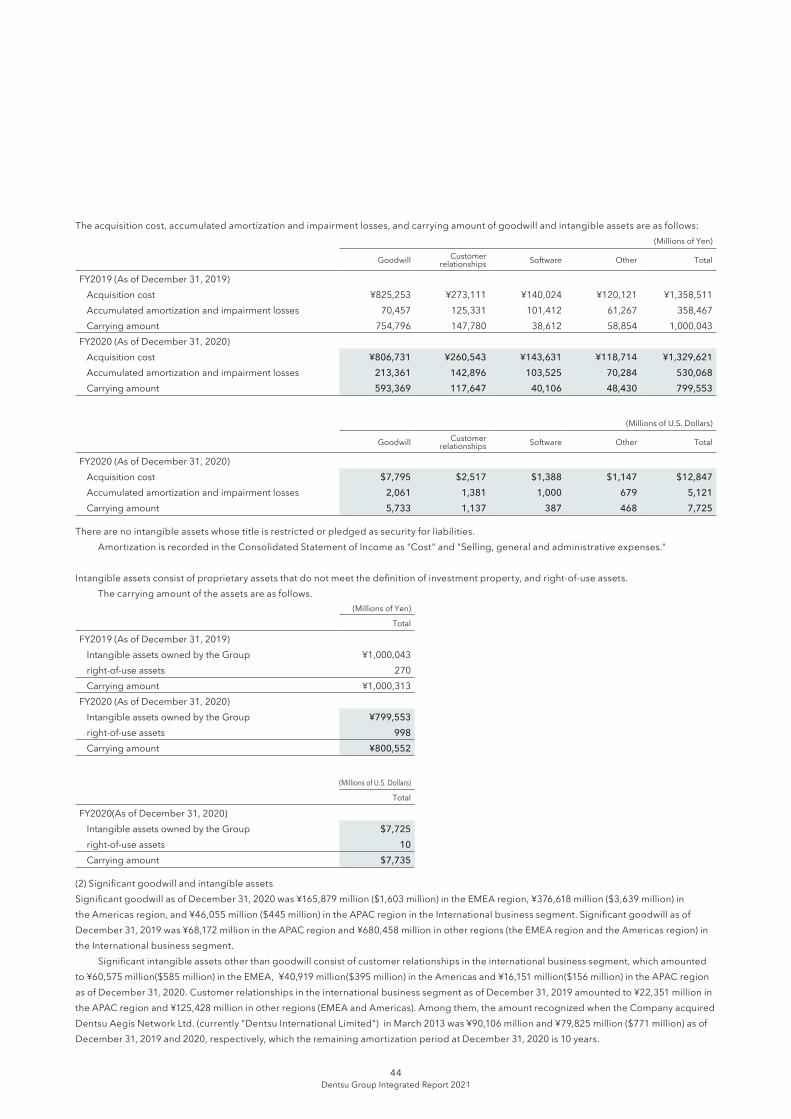
The acquisition cost, accumulated amortization and impairment losses, and carrying amount of goodwill and intangible assets are as follows:(Millions of Yen)
Goodwill Customer relationships Software Other Total
FY2019 (As of December 31, 2019)Acquisition cost ¥825,253 ¥273,111 ¥140,024 ¥120,121 ¥1,358,511Accumulated amortization and impairment losses 70,457 125,331 101,412 61,267 358,467Carrying amount 754,796 147,780 38,612 58,854 1,000,043
FY2020 (As of December 31, 2020)Acquisition cost ¥806,731 ¥260,543 ¥143,631 ¥118,714 ¥1,329,621Accumulated amortization and impairment losses 213,361 142,896 103,525 70,284 530,068Carrying amount 593,369 117,647 40,106 48,430 799,553
(Millions of U.S. Dollars)
Goodwill Customer relationships Software Other Total
FY2020 (As of December 31, 2020)Acquisition cost $7,795 $2,517 $1,388 $1,147 $12,847 Accumulated amortization and impairment losses 2,061 1,381 1,000 679 5,121Carrying amount 5,733 1,137 387 468 7,725
There are no intangible assets whose title is restricted or pledged as security for liabilities. Amortization is recorded in the Consolidated Statement of Income as "Cost" and "Selling, general and administrative expenses."
Intangibleassetsconsistofproprietaryassetsthatdonotmeetthedefinitionofinvestmentproperty,andright-of-useassets. The carrying amount of the assets are as follows.
(Millions of Yen)
Total
FY2019 (As of December 31, 2019)Intangible assets owned by the Group ¥1,000,043right-of-useassets 270Carrying amount ¥1,000,313
FY2020 (As of December 31, 2020)Intangible assets owned by the Group ¥799,553right-of-useassets 998Carrying amount ¥800,552
(Millions of U.S. Dollars)
Total
FY2020(As of December 31, 2020)Intangible assets owned by the Group $7,725right-of-useassets 10Carrying amount $7,735
(2)SignificantgoodwillandintangibleassetsSignificantgoodwillasofDecember31,2020was¥165,879million($1,603million)intheEMEAregion,¥376,618million($3,639million)intheAmericasregion,and¥46,055million($445million)intheAPACregionintheInternationalbusinesssegment.SignificantgoodwillasofDecember 31, 2019 was ¥68,172 million in the APAC region and ¥680,458 million in other regions (the EMEA region and the Americas region) in the International business segment. Significantintangibleassetsotherthangoodwillconsistofcustomerrelationshipsintheinternationalbusinesssegment,whichamountedto¥60,575million($585million)intheEMEA,¥40,919million($395million)intheAmericasand¥16,151million($156million)intheAPACregionas of December 31, 2020. Customer relationships in the international business segment as of December 31, 2019 amounted to ¥22,351 million in the APAC region and ¥125,428 million in other regions (EMEA and Americas). Among them, the amount recognized when the Company acquired DentsuAegisNetworkLtd.(currently”DentsuInternationalLimited")inMarch2013was¥90,106millionand¥79,825million($771million)asofDecember 31, 2019 and 2020, respectively, which the remaining amortization period at December 31, 2020 is 10 years.
Dentsu Group Integrated Report 202144
Financial Report 2021
(3) Impairment testing of goodwillA.Cash-generatingunitgroupsforgoodwillIn the year ended December 31, 2019, the Company allocated goodwill for International business operations to the APAC region and other regionsoftheInternationalbusinessasseparatecash-generatingunitgroups.However,thereisarisingneedtomonitorgoodwillinamoredetailedunitthanbefore,astheCOVID-19pandemicdeterioratedthemacroenvironmentoftheEMEAandAmericasregionsandtheCompanyhaslaunchedanewstructuralreformprogramintheyearendedDecember31,2020.Followingareviewoncash-generatingunitgroupsinlightofthissituation,goodwillisallocatedtotheEMEAregionandAmericasregionastwoseparatecash-generatingunitgroupsfromtheyearendedDecember 31, 2020.
B. Results of impairment test of goodwillBased on the latest business plan compiled using the most recent results, the Group conducted an annual impairment test of goodwill related to International business operations during the year ended December 31, 2020. As a result, the Group recognized impairment loss on goodwill of¥140,367million($1,356million)intheInternationalbusinessasawhole(includingindividualimpairmentlossesof¥46,143million($446million)fortheEMEAregionand¥6,209million($60million)fortheAPACregion).TherecoverableamountsintheEMEAandAPACregionsfortheyearendedDecember31,2020were¥261,555million($2,527million)and¥66,864million($646million),respectively.Therecoverableamount in the entire International business segment including the Americas region and unallocated central assets and costs, in addition to the EMEAandAPACregions,was¥705,334million($6,815million).IntheyearendedDecember31,2019,animpairmentlossof¥70,187millionwasrecognized in the APAC region. The recoverable amount in the APAC region for the year ended December 31, 2019 was ¥96,252 million.
C. Overview of impairment test of goodwillIntheInternationalbusinesssegment,theCompanyconfirmsthenecessityofrecognizingimpairmentontheInternationalbusinesssegmentasawhole,includingcentralassetsandcostsunallocatedtoeachregion,inadditiontotheimpairmenttestofgoodwillforeachcash-generatingunit group. The recoverable amount is calculated using the value in use based on the budgets for the year ending December 31, 2021 approved bymanagementandtheresultsforecastforthesubsequentfourfiscalyears.Thekeyassumptionsandinputsusedtocalculatethevalueinuseare as follows.•ImpactofthespreadofCOVID-19:TheimpactisassumedtobethegreatestintheyearendedDecember31,2020andthatarecoverytrend
will emerge in the year ending December 31, 2021 and continue thereafter.• Operating margin: Operating margin is assumed to improve from the year ended December 31, 2020 as a result of the new structural reform launchedthisfiscalyear.
•Estimateofnetworkingcapital:TheCompanyestimatesthelong-termexpectednetworkingcapitalbasedonpastaverages.•Perpetualgrowthrate:Theperpetualgrowthratesetforcashflowsforaperiodexceedingfiveyearsrangesfrom1.5%to1.75%(yearendedDecember31,2019:1.5%to2.0%)fortheentireInternationalbusinesssegment.
•Discountrate:Thepre-taxdiscountrateusedtocalculatethevalueinuseforeachcash-generatingunitgroupandcentralcostsincludedintheentireInternationalbusinesssegmentrangesfrom9.6%to12.4%(yearendedDecember31,2019:9.0%to10.8%).
•Centralassetsandcentralcosts:Intheimpairmenttestofgoodwillforeachcash-generatingunitgroup,centralassetsandcentralcostsoftheInternationalbusinesssegmentareallocatedtoeachcash-generatingunitgroupbasedonreasonableandconsistentcalculation.Theallocationratiois72.5%(yearendedDecember31,2019:66.3%).
Assuming all other variables are constant, the sensitivity analysis of the impairment loss for the key assumptions for the entire International business segment, in addition to the amount recognized for the year ended December 31, 2020 is as follows.
(Millions of Yen)
0.1%increaseindiscount rate
0.1%decreaseinperpetual growth rate
0.1%decreaseinoperating margin
Additional impairment loss to be recognized ¥8,842.00 ¥6,210.00 ¥5,319.00
(Millions of U.S. Dollars)
0.1%increaseindiscount rate
0.1%decreaseinperpetual growth rate
0.1%decreaseinoperating margin
Additional impairment loss to be recognized $85 $60 $51
Dentsu Group Integrated Report 202145
16. LEASES(1)LeasecostsandcashflowsLeasecostsandcashflowsareasfollows:
(Millions of Yen) (Millions of U.S. Dollars)
FY2019(Year ended
December 31, 2019)
FY2020(Year ended
December 31, 2020)
FY2020(Year ended
December 31, 2020)
Depreciationexpensesbytypeofright-of-useassetBuildings and structures ¥31,515 ¥30,058 $304 Software 121 254 1 Others 159 220 2
Total depreciation expenses 31,796 30,533 307 Interest expense on lease obligations 4,153 3,665 40 Expensesforshort-termleasesandleasesoflow-valueassets 5,651 5,406 55 Totalcashoutflowsrelatedtoleases ¥42,385 ¥42,737 $410
(2)Right-of-useassetsincludedinthecarryingamountoffixedassetsThecarryingamountandincreaseofright-of-useassetsincludedinthecarryingamountoffixedassetsareasfollows.
Buildings and structures
Others (property, plant and equipment) Software Total
As of December 31, 2019 ¥115,303 ¥4,383 ¥270 ¥119,957As of December 31, 2020 ¥88,672 ¥4,449 ¥998 ¥94,120
(Millions of U.S. Dollars)
Buildings and structures
Others (property, plant and equipment) Software Total
As of December 31, 2019 $1,114 $42 $3 $1,159As of December 31, 2020 $857 $43 $10 $909
Theincreaseinright-of-useassetsfortheyearendedDecember31,2019andtheyearendedDecember31,2020was¥23,457millionand11,179million($108million),respectively.
(3) Lease obligationThe maturity analysis of the lease obligation is as follows.
(Millions of Yen) (Millions of U.S. Dollars)
FY2019(As of December 31, 2020)
FY2020(As of December 31, 2020)
FY2020(As of December 31, 2020)
ContractualundiscountedcashflowsLess than 1 year ¥35,990 ¥31,956 $3091 year to 5 years 76,826 61,112 590More than 5 years 32,786 27,711 268
Undiscounted lease obligation balance 145,603 120,780 1,167Discount of lease obligation (12,540) (11,241) (109)Balanceofleaseobligationsincludedinotherfinancialliabilities 133,063 109,539 1,058Current 37,343 29,414 284Non-current ¥95,719 ¥80,125 $774
(4) Nature of leasing activityTheGroupleasesbuildingsprimarilyasoffices.Theleaseperiodforthebuildingisbetween1and20years,insomecases,thelesseehastheoption to extend the term of the lease for one year or the same period as the original contract. In the Japan business in particular, many lease contracts for buildings allow the lessee to repeatedly exercise the extension option, and the optiontoterminatethecontractearlyifthewrittennoticeisgiventotheotherpartysixmonthsinadvance.However,onlyleasepaymentsfortheperiod for which it is reasonably certain that the option will be exercised are included in the measurement of the lease obligation. These option are used as needed by the leasing entity to utilize the building for its business.
Dentsu Group Integrated Report 202146
Financial Report 2021
(5) Sale and leaseback transactionIn the year ended December 31, 2019, the Group entered into a transaction in which it sold a portion of land and buildings in the Japan business andfinancedit,andleasedbackthelandandbuildingsforthreeyearsfromtheviewpointofeffectiveuseofassetsheldbytheGroup.Theresultingcashinflowsareincludedincashflowsfromfinancingactivities.Thereisnorepurchaseoptionattheendofthecontractperiod.Thegains or losses arising from the sale and leaseback transaction are not material.
(6)PotentiallyexposedfuturecashoutflowsnotreflectedinthemeasurementoftheleaseobligationIn the international business, the Group has lease contracts for buildings that have already been contracted as of December 31, 2019, but not yet started,andtheleaseperiodofthemaintransactionsis16to20years.Non-cancellableleasepaymentstotal¥107,345million($1,037million).Thesearenotreflectedinthemeasurementofleaseobligations.
17. INVESTMENT PROPERTY(1) Schedule of investment propertyThe schedule of the carrying amount of investment property during the period is as follows:
(Millions of Yen) (Millions of U.S. Dollars)
FY2019(Year ended
December 31, 2019)
FY2020(Year ended
December 31, 2020)
FY2020(Year ended
December 31, 2020)
Balance at the beginning of the year ¥37,089 ¥36,835 $356Additions 85 – –Transfer to property, plant and equipment – (53) (1)Depreciation (339) (394) (4)Sales or disposals – (25) (0)Other – – –
Balance at the end of the year ¥36,835 ¥36,362 $351Acquisition cost (balance at the beginning of the year) ¥46,186 ¥46,269 $447Accumulated depreciation and impairment losses(balance at the beginning of the year) 9,096 9,433 91
Acquisition cost (balance at the end of the year) ¥46,269 ¥46,164 $446Accumulated depreciation and impairment losses(balance at the end of the year) 9,433 9,801 $95
(2) Fair valueThe carrying amount and fair value of investment property are as follows:
(Millions of Yen) (Millions of U.S. Dollars)
FY2019(As of December 31, 2019)
FY2020(As of December 31, 2020)
FY2020(As of December 31, 2020)
Carrying amount Fair value Carrying amount Fair value Carrying amount Fair value
Investment property (Level 3) ¥36,835 ¥51,981 ¥36,362 ¥51,388 $351 $497
Thefairvalueofinvestmentpropertyisdeterminedbyrealestateappraisalvaluemainlybasedondiscountedcashflowmodelandobservablequoted prices for similar properties and others. The investment property that is measured at fair value is categorized into the three levels of fair value hierarchy according to observability andsignificanceoftheinputsusedinthemeasurements. Thefairvaluehierarchyisdefinedasfollows: Level 1: Fair value measured at the quoted price in the active market Level 2: Fair value that is measured using the observable price other than categorized in level 1 directly or indirectly Level 3: Fair value that is measured based on unobservable inputs Thefairvalueofinvestmentpropertyforeachfiscalyearendiscategorizedwithinlevel3ofthefairvaluehierarchy.
Dentsu Group Integrated Report 202147
(3) Income and expenses from investment propertyThe rental income from investment property and direct operating expenses associated with the investment property are as follows:
(Millions of Yen) (Millions of U.S. Dollars)
FY2019(Year ended
December 31, 2019)
FY2020(Year ended
December 31, 2020)
FY2020(Year ended
December 31, 2020)
Rental income ¥2,159 ¥2,032 $20Direct operating expenses 762 754 7
There are no investment properties that do not generate rental income and direct operating expenses associated with the investment property.
18. INVESTMENTS ACCOUNTED FOR USING THE EQUITY METHODThe carrying amount of investments in associates and joint ventures is as follows:
(Millions of Yen) (Millions of U.S. Dollars)
FY2019(As of December 31, 2019)
FY2020(As of December 31, 2020)
FY2020(As of December 31, 2020)
Total carrying amount ¥47,662 ¥50,906 $492
Thefinancialinformationofassociatesandjointventuresisasfollows.TheseamountstakeintoaccounttheGroup'sownershipratio.(Millions of Yen) (Millions of U.S. Dollars)
FY2019(Year ended
December 31, 2019)
FY2020(Year ended
December 31, 2020)
FY2020(Year ended
December 31, 2020)
Profitfortheyear ¥517 ¥1,680 $16Other comprehensive income (119) (186) (2)Comprehensive income for the year ¥397 ¥1,493 $14
In addition to the above, revaluation gain on step acquisition of ¥2,175 million was recognized for the year ended December 31, 2019. Inaddition,impairmentlossofinvestmentsaccountedforusingtheequitymethodof¥958million($9million),gainonsaleofinvestmentsinassociatesof¥144million($1million)andrevaluationgainonstepacquisitionof¥44million($0million)wererecognizedfortheyearendedDecember 31, 2020. The Group does not recognize the share of the cumulative amount of losses exceeding the carrying amounts incurred in certain investees accounted for using the equity method. Unrecognizedlossesforeachfiscalyearandcumulativeunrecognizedlossesfortheinvestmentsareasfollows:
(Millions of Yen) (Millions of U.S. Dollars)
FY2019(Year ended
December 31, 2019)
FY2020(Year ended
December 31, 2020)
FY2020(Year ended
December 31, 2020)
Unrecognized losses ¥30 ¥201 $2
(Millions of Yen) (Millions of U.S. Dollars)
FY2019(As of December 31, 2019)
FY2020(Year ended
December 31, 2020)
FY2020(Year ended
December 31, 2020)
Cumulative unrecognized losses ¥50 ¥235 $2
Dentsu Group Integrated Report 202148
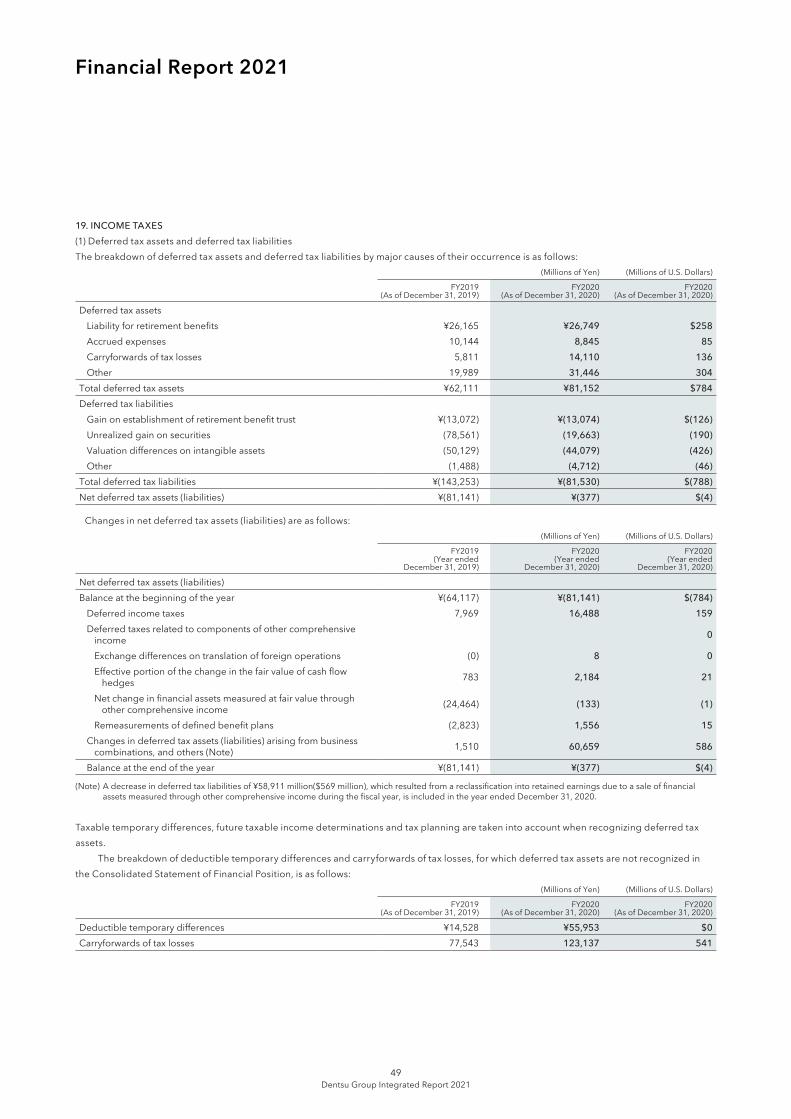
Financial Report 2021
19. INCOME TAXES(1) Deferred tax assets and deferred tax liabilities The breakdown of deferred tax assets and deferred tax liabilities by major causes of their occurrence is as follows:
(Millions of Yen) (Millions of U.S. Dollars)
FY2019(As of December 31, 2019)
FY2020(As of December 31, 2020)
FY2020(As of December 31, 2020)
Deferred tax assetsLiabilityforretirementbenefits ¥26,165 ¥26,749 $258Accrued expenses 10,144 8,845 85Carryforwards of tax losses 5,811 14,110 136Other 19,989 31,446 304
Total deferred tax assets ¥62,111 ¥81,152 $784Deferred tax liabilitiesGainonestablishmentofretirementbenefittrust ¥(13,072) ¥(13,074) $(126)Unrealized gain on securities (78,561) (19,663) (190)Valuation differences on intangible assets (50,129) (44,079) (426)Other (1,488) (4,712) (46)
Total deferred tax liabilities ¥(143,253) ¥(81,530) $(788)Net deferred tax assets (liabilities) ¥(81,141) ¥(377) $(4)
Changes in net deferred tax assets (liabilities) are as follows:(Millions of Yen) (Millions of U.S. Dollars)
FY2019(Year ended
December 31, 2019)
FY2020(Year ended
December 31, 2020)
FY2020(Year ended
December 31, 2020)
Net deferred tax assets (liabilities)Balance at the beginning of the year ¥(64,117) ¥(81,141) $(784)
Deferred income taxes 7,969 16,488 159Deferred taxes related to components of other comprehensive
income 0
Exchange differences on translation of foreign operations (0) 8 0Effectiveportionofthechangeinthefairvalueofcashflow
hedges 783 2,184 21
Netchangeinfinancialassetsmeasuredatfairvaluethroughother comprehensive income (24,464) (133) (1)
Remeasurementsofdefinedbenefitplans (2,823) 1,556 15Changes in deferred tax assets (liabilities) arising from business
combinations, and others (Note) 1,510 60,659 586
Balance at the end of the year ¥(81,141) ¥(377) $(4)
(Note)Adecreaseindeferredtaxliabilitiesof¥58,911million($569million),whichresultedfromareclassificationintoretainedearningsduetoasaleoffinancialassetsmeasuredthroughothercomprehensiveincomeduringthefiscalyear,isincludedintheyearendedDecember31,2020.
Taxable temporary differences, future taxable income determinations and tax planning are taken into account when recognizing deferred tax assets. The breakdown of deductible temporary differences and carryforwards of tax losses, for which deferred tax assets are not recognized in the Consolidated Statement of Financial Position, is as follows:
(Millions of Yen) (Millions of U.S. Dollars)
FY2019(As of December 31, 2019)
FY2020(As of December 31, 2020)
FY2020(As of December 31, 2020)
Deductible temporary differences ¥14,528 ¥55,953 $0 Carryforwards of tax losses 77,543 123,137 541
Dentsu Group Integrated Report 202149
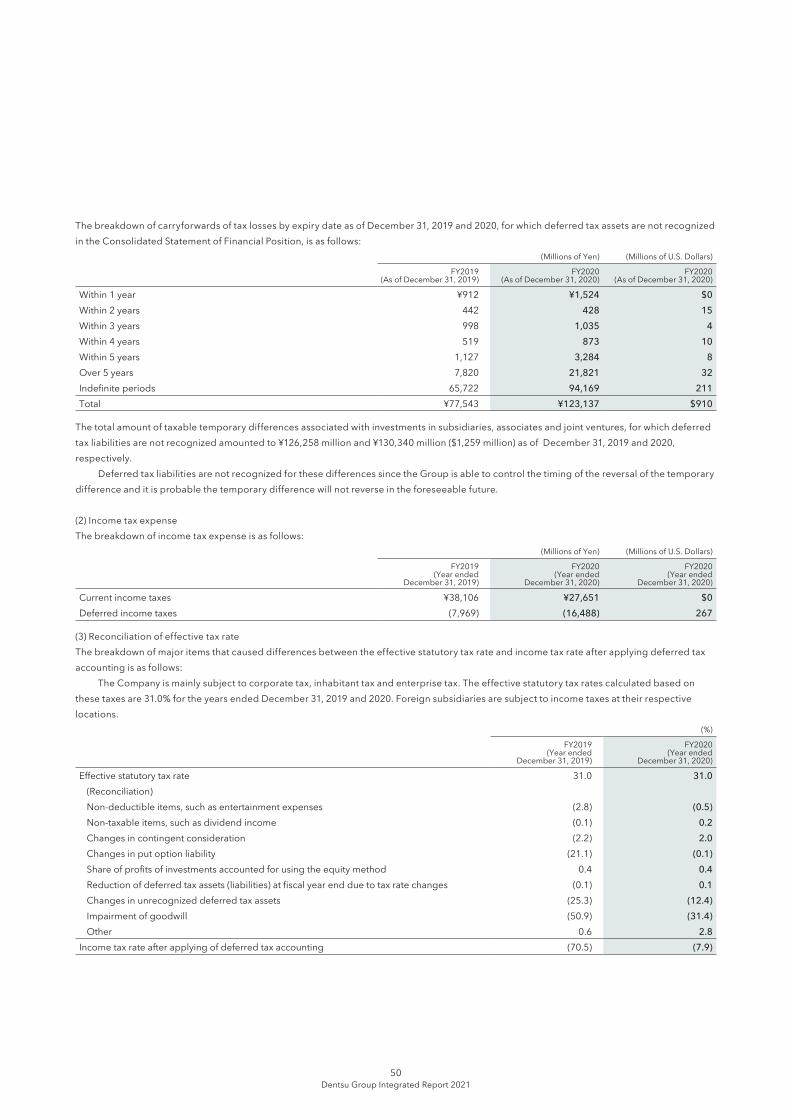
The breakdown of carryforwards of tax losses by expiry date as of December 31, 2019 and 2020, for which deferred tax assets are not recognized in the Consolidated Statement of Financial Position, is as follows:
(Millions of Yen) (Millions of U.S. Dollars)
FY2019(As of December 31, 2019)
FY2020(As of December 31, 2020)
FY2020(As of December 31, 2020)
Within 1 year ¥912 ¥1,524 $0Within 2 years 442 428 15Within 3 years 998 1,035 4Within 4 years 519 873 10Within 5 years 1,127 3,284 8Over 5 years 7,820 21,821 32Indefiniteperiods 65,722 94,169 211Total ¥77,543 ¥123,137 $910
The total amount of taxable temporary differences associated with investments in subsidiaries, associates and joint ventures, for which deferred taxliabilitiesarenotrecognizedamountedto¥126,258millionand¥130,340million($1,259million)asofDecember31,2019and2020,respectively. Deferred tax liabilities are not recognized for these differences since the Group is able to control the timing of the reversal of the temporary difference and it is probable the temporary difference will not reverse in the foreseeable future.
(2) Income tax expenseThe breakdown of income tax expense is as follows:
(Millions of Yen) (Millions of U.S. Dollars)
FY2019(Year ended
December 31, 2019)
FY2020(Year ended
December 31, 2020)
FY2020(Year ended
December 31, 2020)
Current income taxes ¥38,106 ¥27,651 $0Deferred income taxes (7,969) (16,488) 267
(3) Reconciliation of effective tax rateThe breakdown of major items that caused differences between the effective statutory tax rate and income tax rate after applying deferred tax accounting is as follows: The Company is mainly subject to corporate tax, inhabitant tax and enterprise tax. The effective statutory tax rates calculated based on thesetaxesare31.0%fortheyearsendedDecember31,2019and2020.Foreignsubsidiariesaresubjecttoincometaxesattheirrespectivelocations.
(%)
FY2019(Year ended
December 31, 2019)
FY2020(Year ended
December 31, 2020)
Effective statutory tax rate 31.0 31.0(Reconciliation)Non-deductibleitems,suchasentertainmentexpenses (2.8) (0.5)Non-taxableitems,suchasdividendincome (0.1) 0.2Changes in contingent consideration (2.2) 2.0Changes in put option liability (21.1) (0.1)Shareofprofitsofinvestmentsaccountedforusingtheequitymethod 0.4 0.4Reductionofdeferredtaxassets(liabilities)atfiscalyearendduetotaxratechanges (0.1) 0.1Changes in unrecognized deferred tax assets (25.3) (12.4)Impairment of goodwill (50.9) (31.4)Other 0.6 2.8
Income tax rate after applying of deferred tax accounting (70.5) (7.9)
Dentsu Group Integrated Report 202150
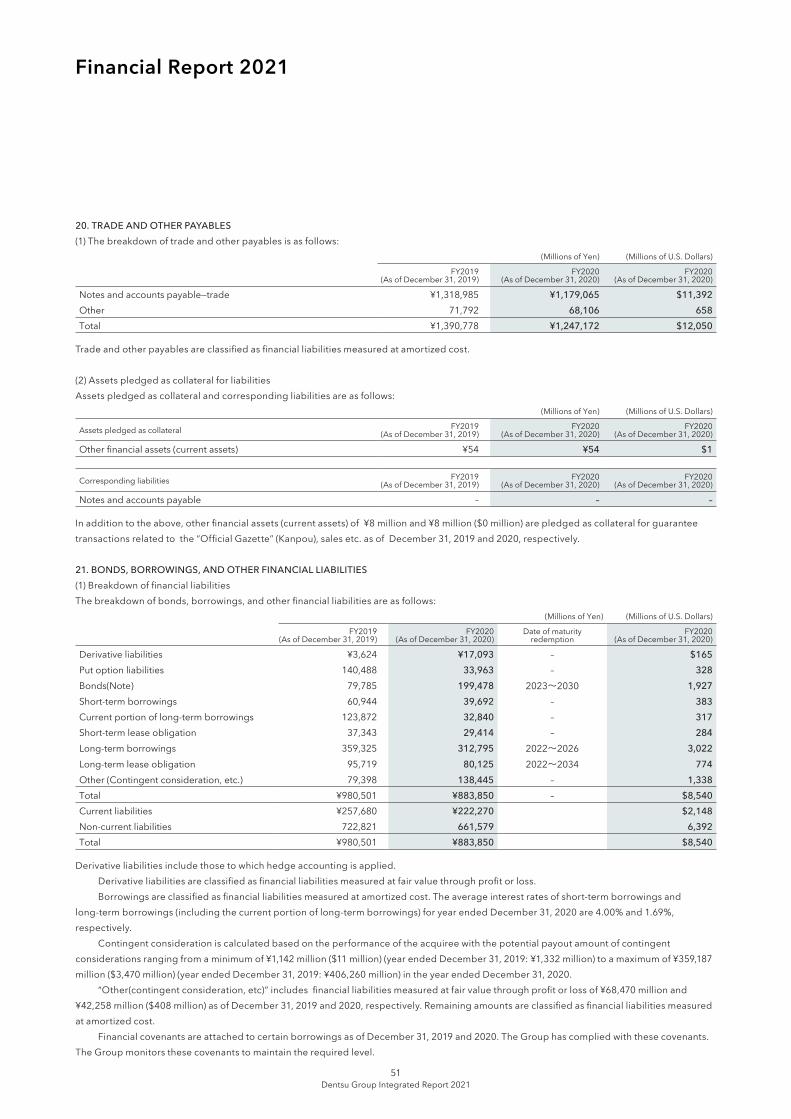
Financial Report 2021
20. TRADE AND OTHER PAYABLES(1) The breakdown of trade and other payables is as follows:
(Millions of Yen) (Millions of U.S. Dollars)
FY2019(As of December 31, 2019)
FY2020(As of December 31, 2020)
FY2020(As of December 31, 2020)
Notes and accounts payable—trade ¥1,318,985 ¥1,179,065 $11,392Other 71,792 68,106 658Total ¥1,390,778 ¥1,247,172 $12,050
Trade and other payables are classified as financial liabilities measured at amortized cost.
(2) Assets pledged as collateral for liabilitiesAssets pledged as collateral and corresponding liabilities are as follows:
(Millions of Yen) (Millions of U.S. Dollars)
Assets pledged as collateral FY2019(As of December 31, 2019)
FY2020(As of December 31, 2020)
FY2020(As of December 31, 2020)
Other financial assets (current assets) ¥54 ¥54 $1
Corresponding liabilities FY2019(As of December 31, 2019)
FY2020(As of December 31, 2020)
FY2020(As of December 31, 2020)
Notes and accounts payable – – –
In addition to the above, other financial assets (current assets) of ¥8 million and ¥8 million ($0 million) are pledged as collateral for guarantee transactions related to the “Official Gazette” (Kanpou), sales etc. as of December 31, 2019 and 2020, respectively.
21. BONDS, BORROWINGS, AND OTHER FINANCIAL LIABILITIES(1) Breakdown of financial liabilitiesThe breakdown of bonds, borrowings, and other financial liabilities are as follows:
(Millions of Yen) (Millions of U.S. Dollars)
FY2019(As of December 31, 2019)
FY2020(As of December 31, 2020)
Date of maturity redemption
FY2020(As of December 31, 2020)
Derivative liabilities ¥3,624 ¥17,093 – $165Put option liabilities 140,488 33,963 – 328Bonds(Note) 79,785 199,478 2023~2030 1,927Short-term borrowings 60,944 39,692 – 383Current portion of long-term borrowings 123,872 32,840 – 317Short-term lease obligation 37,343 29,414 – 284Long-term borrowings 359,325 312,795 2022~2026 3,022Long-term lease obligation 95,719 80,125 2022~2034 774Other (Contingent consideration, etc.) 79,398 138,445 – 1,338Total ¥980,501 ¥883,850 – $8,540Current liabilities ¥257,680 ¥222,270 $2,148Non-current liabilities 722,821 661,579 6,392Total ¥980,501 ¥883,850 $8,540
Derivative liabilities include those to which hedge accounting is applied. Derivative liabilities are classified as financial liabilities measured at fair value through profit or loss. Borrowings are classified as financial liabilities measured at amortized cost. The average interest rates of short-term borrowings and long-term borrowings (including the current portion of long-term borrowings) for year ended December 31, 2020 are 4.00% and 1.69%, respectively. Contingent consideration is calculated based on the performance of the acquiree with the potential payout amount of contingent considerations ranging from a minimum of ¥1,142 million ($11 million) (year ended December 31, 2019: ¥1,332 million) to a maximum of ¥359,187 million ($3,470 million) (year ended December 31, 2019: ¥406,260 million) in the year ended December 31, 2020. “Other(contingent consideration, etc)” includes financial liabilities measured at fair value through profit or loss of ¥68,470 million and ¥42,258 million ($408 million) as of December 31, 2019 and 2020, respectively. Remaining amounts are classified as financial liabilities measured at amortized cost. Financial covenants are attached to certain borrowings as of December 31, 2019 and 2020. The Group has complied with these covenants. The Group monitors these covenants to maintain the required level.
Dentsu Group Integrated Report 202151
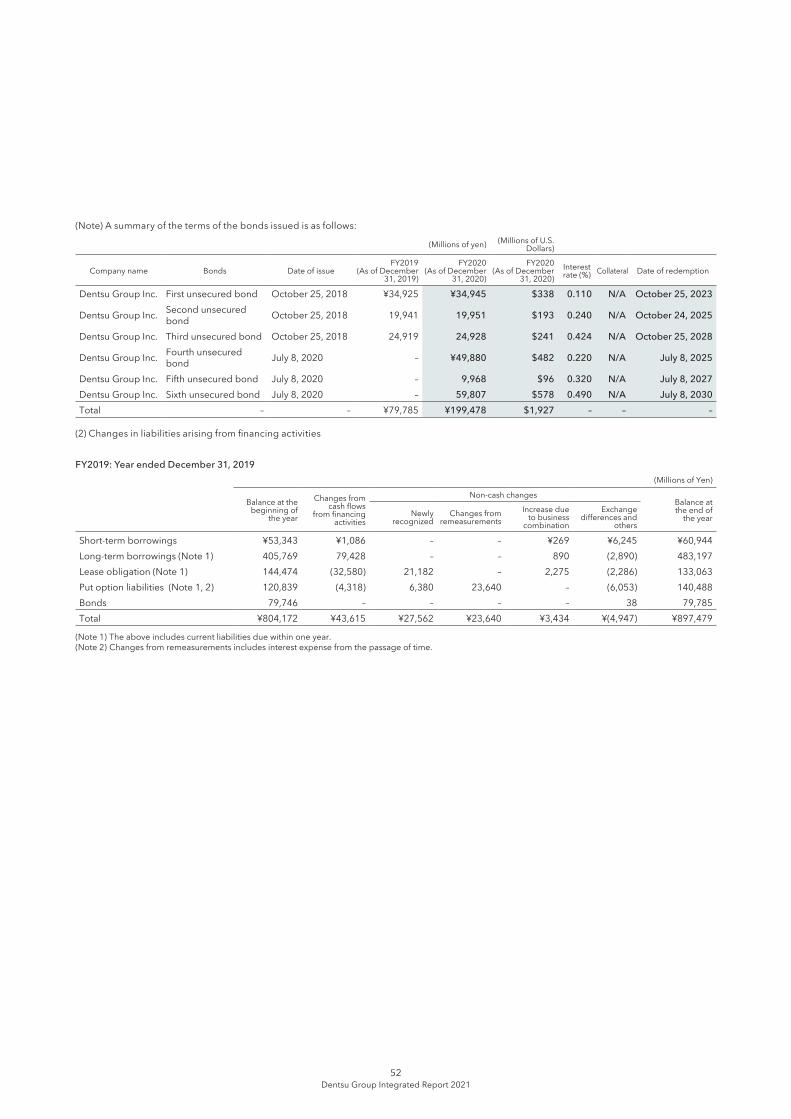
(Note) A summary of the terms of the bonds issued is as follows:
(Millions of yen) (Millions of U.S. Dollars)
Company name Bonds Date of issueFY2019
(As of December 31, 2019)
FY2020(As of December
31, 2020)
FY2020(As of December
31, 2020)Interest rate (%) Collateral Date of redemption
Dentsu Group Inc. First unsecured bond October 25, 2018 ¥34,925 ¥34,945 $338 0.110 N/A October 25, 2023
Dentsu Group Inc. Second unsecured bond October 25, 2018 19,941 19,951 $193 0.240 N/A October 24, 2025
Dentsu Group Inc. Third unsecured bond October 25, 2018 24,919 24,928 $241 0.424 N/A October 25, 2028
Dentsu Group Inc. Fourth unsecured bond July 8, 2020 – ¥49,880 $482 0.220 N/A July 8, 2025
Dentsu Group Inc. Fifth unsecured bond July 8, 2020 – 9,968 $96 0.320 N/A July 8, 2027Dentsu Group Inc. Sixth unsecured bond July 8, 2020 – 59,807 $578 0.490 N/A July 8, 2030Total – – ¥79,785 ¥199,478 $1,927 – – –
(2) Changes in liabilities arising from financing activities
FY2019: Year ended December 31, 2019(Millions of Yen)
Balance at the beginning of
the year
Changes from cash flows
from financing activities
Non-cash changesBalance at the end of
the yearNewly recognized
Changes from remeasurements
Increase due to business
combination
Exchange differences and
others
Short-term borrowings ¥53,343 ¥1,086 – – ¥269 ¥6,245 ¥60,944Long-term borrowings (Note 1) 405,769 79,428 – – 890 (2,890) 483,197Lease obligation (Note 1) 144,474 (32,580) 21,182 – 2,275 (2,286) 133,063Put option liabilities (Note 1, 2) 120,839 (4,318) 6,380 23,640 – (6,053) 140,488Bonds 79,746 – – – – 38 79,785Total ¥804,172 ¥43,615 ¥27,562 ¥23,640 ¥3,434 ¥(4,947) ¥897,479
(Note 1) The above includes current liabilities due within one year.(Note 2) Changes from remeasurements includes interest expense from the passage of time.
Dentsu Group Integrated Report 202152
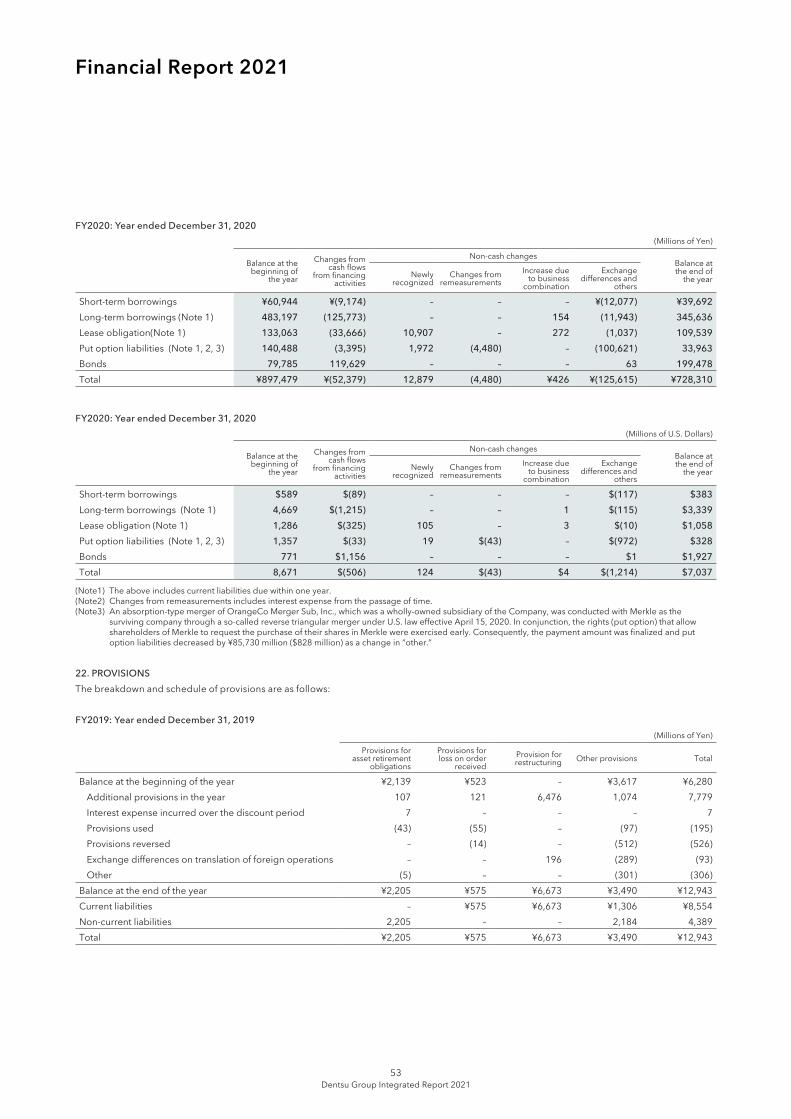
Financial Report 2021
FY2020: Year ended December 31, 2020(Millions of Yen)
Balance at the beginning of
the year
Changes from cash flows
from financing activities
Non-cash changesBalance at the end of
the yearNewly recognized
Changes from remeasurements
Increase due to business
combination
Exchange differences and
others
Short-term borrowings ¥60,944 ¥(9,174) – – – ¥(12,077) ¥39,692Long-term borrowings (Note 1) 483,197 (125,773) – – 154 (11,943) 345,636Lease obligation(Note 1) 133,063 (33,666) 10,907 – 272 (1,037) 109,539Put option liabilities (Note 1, 2, 3) 140,488 (3,395) 1,972 (4,480) – (100,621) 33,963Bonds 79,785 119,629 – – – 63 199,478Total ¥897,479 ¥(52,379) 12,879 (4,480) ¥426 ¥(125,615) ¥728,310
FY2020: Year ended December 31, 2020(Millions of U.S. Dollars)
Balance at the beginning of
the year
Changes from cash flows
from financing activities
Non-cash changesBalance at the end of
the yearNewly recognized
Changes from remeasurements
Increase due to business
combination
Exchange differences and
others
Short-term borrowings $589 $(89) – – – $(117) $383Long-term borrowings (Note 1) 4,669 $(1,215) – – 1 $(115) $3,339Lease obligation (Note 1) 1,286 $(325) 105 – 3 $(10) $1,058Put option liabilities (Note 1, 2, 3) 1,357 $(33) 19 $(43) – $(972) $328Bonds 771 $1,156 – – – $1 $1,927Total 8,671 $(506) 124 $(43) $4 $(1,214) $7,037
(Note1) The above includes current liabilities due within one year.(Note2) Changes from remeasurements includes interest expense from the passage of time. (Note3) An absorption-type merger of OrangeCo Merger Sub, Inc., which was a wholly-owned subsidiary of the Company, was conducted with Merkle as the
surviving company through a so-called reverse triangular merger under U.S. law effective April 15, 2020. In conjunction, the rights (put option) that allow shareholders of Merkle to request the purchase of their shares in Merkle were exercised early. Consequently, the payment amount was finalized and put option liabilities decreased by ¥85,730 million ($828 million) as a change in “other.”
22. PROVISIONSThe breakdown and schedule of provisions are as follows:
FY2019: Year ended December 31, 2019(Millions of Yen)
Provisions for asset retirement
obligations
Provisions for loss on order
received Provision for restructuring Other provisions Total
Balance at the beginning of the year ¥2,139 ¥523 – ¥3,617 ¥6,280Additional provisions in the year 107 121 6,476 1,074 7,779Interest expense incurred over the discount period 7 – – – 7Provisions used (43) (55) – (97) (195)Provisions reversed – (14) – (512) (526)Exchange differences on translation of foreign operations – – 196 (289) (93)Other (5) – – (301) (306)
Balance at the end of the year ¥2,205 ¥575 ¥6,673 ¥3,490 ¥12,943Current liabilities – ¥575 ¥6,673 ¥1,306 ¥8,554Non-current liabilities 2,205 – – 2,184 4,389Total ¥2,205 ¥575 ¥6,673 ¥3,490 ¥12,943
Dentsu Group Integrated Report 202153
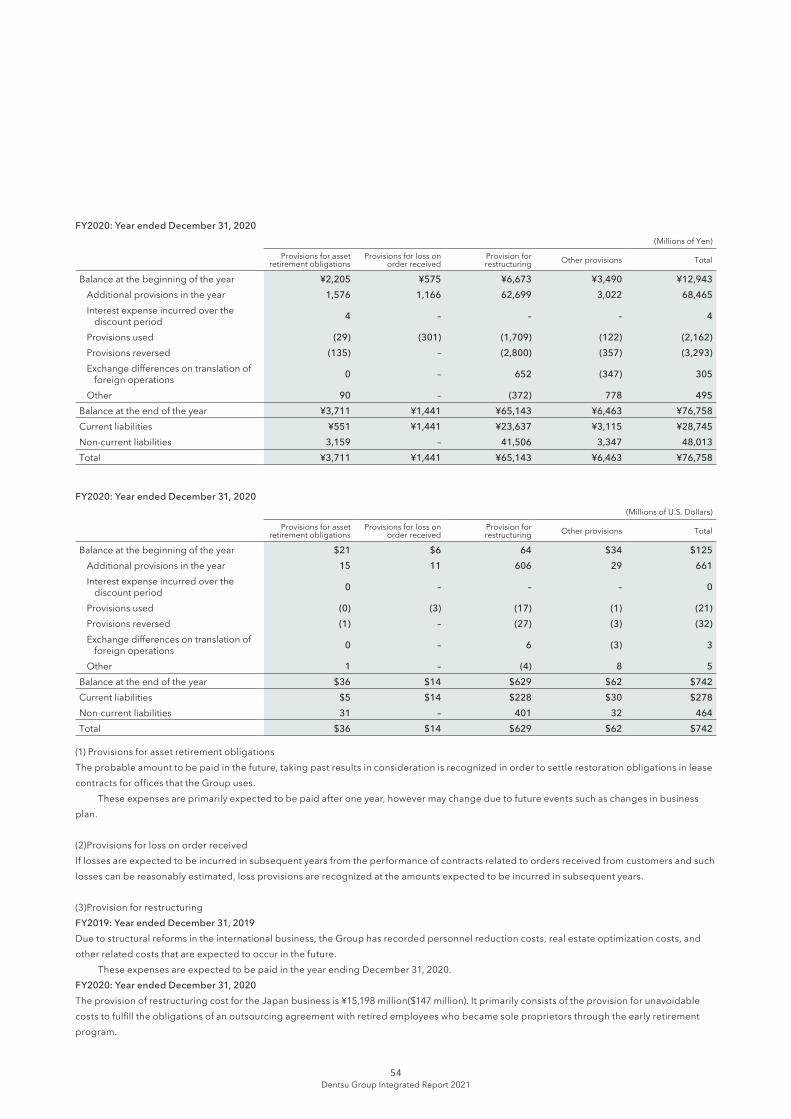
FY2020: Year ended December 31, 2020(Millions of Yen)
Provisions for asset retirement obligations
Provisions for loss on order received
Provision for restructuring Other provisions Total
Balance at the beginning of the year ¥2,205 ¥575 ¥6,673 ¥3,490 ¥12,943Additional provisions in the year 1,576 1,166 62,699 3,022 68,465Interest expense incurred over the
discount period 4 – – – 4
Provisions used (29) (301) (1,709) (122) (2,162)Provisions reversed (135) – (2,800) (357) (3,293)Exchange differences on translation of
foreign operations 0 – 652 (347) 305
Other 90 – (372) 778 495Balance at the end of the year ¥3,711 ¥1,441 ¥65,143 ¥6,463 ¥76,758Current liabilities ¥551 ¥1,441 ¥23,637 ¥3,115 ¥28,745Non-current liabilities 3,159 – 41,506 3,347 48,013Total ¥3,711 ¥1,441 ¥65,143 ¥6,463 ¥76,758
FY2020: Year ended December 31, 2020 (Millions of U.S. Dollars)
Provisions for asset retirement obligations
Provisions for loss on order received
Provision for restructuring Other provisions Total
Balance at the beginning of the year $21 $6 64 $34 $125Additional provisions in the year 15 11 606 29 661Interest expense incurred over the
discount period 0 – – – 0
Provisions used (0) (3) (17) (1) (21)Provisions reversed (1) – (27) (3) (32)Exchange differences on translation of
foreign operations 0 – 6 (3) 3
Other 1 – (4) 8 5Balance at the end of the year $36 $14 $629 $62 $742Current liabilities $5 $14 $228 $30 $278Non-current liabilities 31 – 401 32 464Total $36 $14 $629 $62 $742
(1) Provisions for asset retirement obligationsThe probable amount to be paid in the future, taking past results in consideration is recognized in order to settle restoration obligations in lease contracts for offices that the Group uses. These expenses are primarily expected to be paid after one year, however may change due to future events such as changes in business plan.
(2)Provisions for loss on order received If losses are expected to be incurred in subsequent years from the performance of contracts related to orders received from customers and such losses can be reasonably estimated, loss provisions are recognized at the amounts expected to be incurred in subsequent years.
(3)Provision for restructuringFY2019: Year ended December 31, 2019Due to structural reforms in the international business, the Group has recorded personnel reduction costs, real estate optimization costs, and other related costs that are expected to occur in the future. These expenses are expected to be paid in the year ending December 31, 2020.FY2020: Year ended December 31, 2020The provision of restructuring cost for the Japan business is ¥15,198 million($147 million). It primarily consists of the provision for unavoidable costs to fulfill the obligations of an outsourcing agreement with retired employees who became sole proprietors through the early retirement program.
Dentsu Group Integrated Report 202154
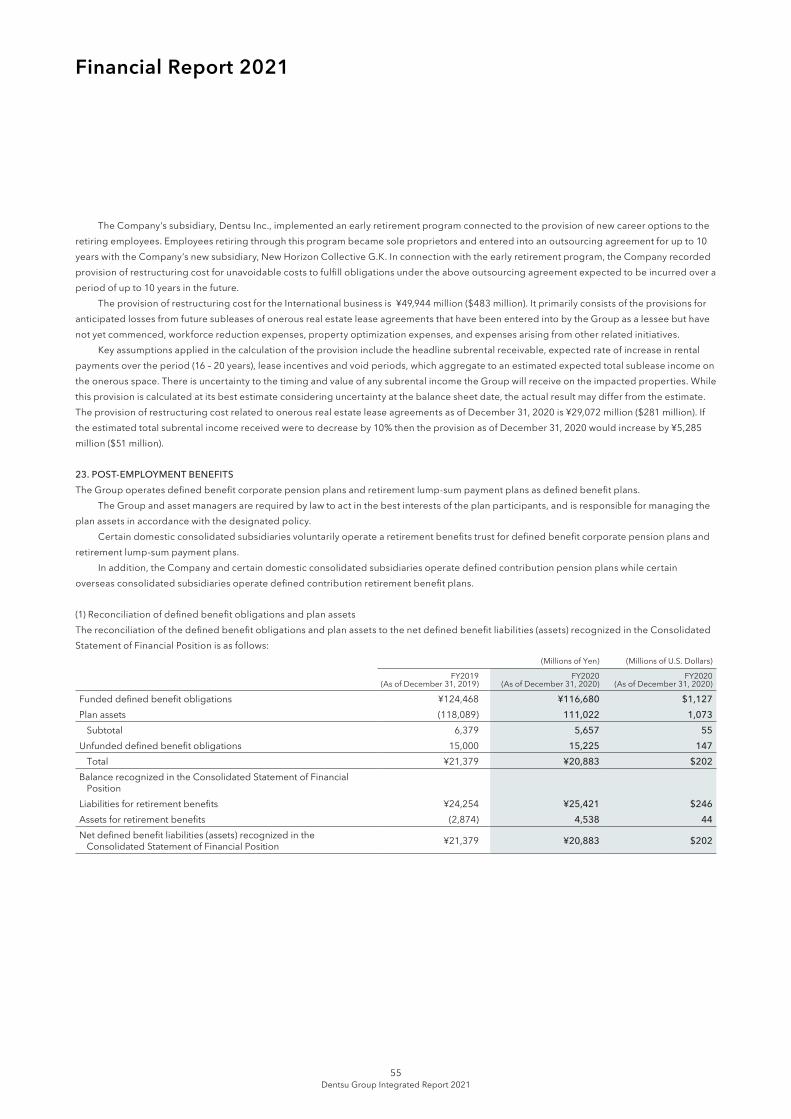
Financial Report 2021
The Company’s subsidiary, Dentsu Inc., implemented an early retirement program connected to the provision of new career options to the retiring employees. Employees retiring through this program became sole proprietors and entered into an outsourcing agreement for up to 10 years with the Company’s new subsidiary, New Horizon Collective G.K. In connection with the early retirement program, the Company recorded provision of restructuring cost for unavoidable costs to fulfill obligations under the above outsourcing agreement expected to be incurred over a period of up to 10 years in the future. The provision of restructuring cost for the International business is ¥49,944 million ($483 million). It primarily consists of the provisions for anticipated losses from future subleases of onerous real estate lease agreements that have been entered into by the Group as a lessee but have not yet commenced, workforce reduction expenses, property optimization expenses, and expenses arising from other related initiatives. Key assumptions applied in the calculation of the provision include the headline subrental receivable, expected rate of increase in rental payments over the period (16 – 20 years), lease incentives and void periods, which aggregate to an estimated expected total sublease income on the onerous space. There is uncertainty to the timing and value of any subrental income the Group will receive on the impacted properties. While this provision is calculated at its best estimate considering uncertainty at the balance sheet date, the actual result may differ from the estimate. The provision of restructuring cost related to onerous real estate lease agreements as of December 31, 2020 is ¥29,072 million ($281 million). If the estimated total subrental income received were to decrease by 10% then the provision as of December 31, 2020 would increase by ¥5,285 million ($51 million).
23. POST-EMPLOYMENT BENEFITSThe Group operates defined benefit corporate pension plans and retirement lump-sum payment plans as defined benefit plans. The Group and asset managers are required by law to act in the best interests of the plan participants, and is responsible for managing the plan assets in accordance with the designated policy. Certain domestic consolidated subsidiaries voluntarily operate a retirement benefits trust for defined benefit corporate pension plans and retirement lump-sum payment plans. In addition, the Company and certain domestic consolidated subsidiaries operate defined contribution pension plans while certain overseas consolidated subsidiaries operate defined contribution retirement benefit plans.
(1) Reconciliation of defined benefit obligations and plan assetsThe reconciliation of the defined benefit obligations and plan assets to the net defined benefit liabilities (assets) recognized in the Consolidated Statement of Financial Position is as follows:
(Millions of Yen) (Millions of U.S. Dollars)
FY2019(As of December 31, 2019)
FY2020(As of December 31, 2020)
FY2020(As of December 31, 2020)
Funded defined benefit obligations ¥124,468 ¥116,680 $1,127Plan assets (118,089) 111,022 1,073
Subtotal 6,379 5,657 55Unfunded defined benefit obligations 15,000 15,225 147
Total ¥21,379 ¥20,883 $202Balance recognized in the Consolidated Statement of Financial
Position Liabilities for retirement benefits ¥24,254 ¥25,421 $246Assets for retirement benefits (2,874) 4,538 44Net defined benefit liabilities (assets) recognized in the
Consolidated Statement of Financial Position ¥21,379 ¥20,883 $202
Dentsu Group Integrated Report 202155
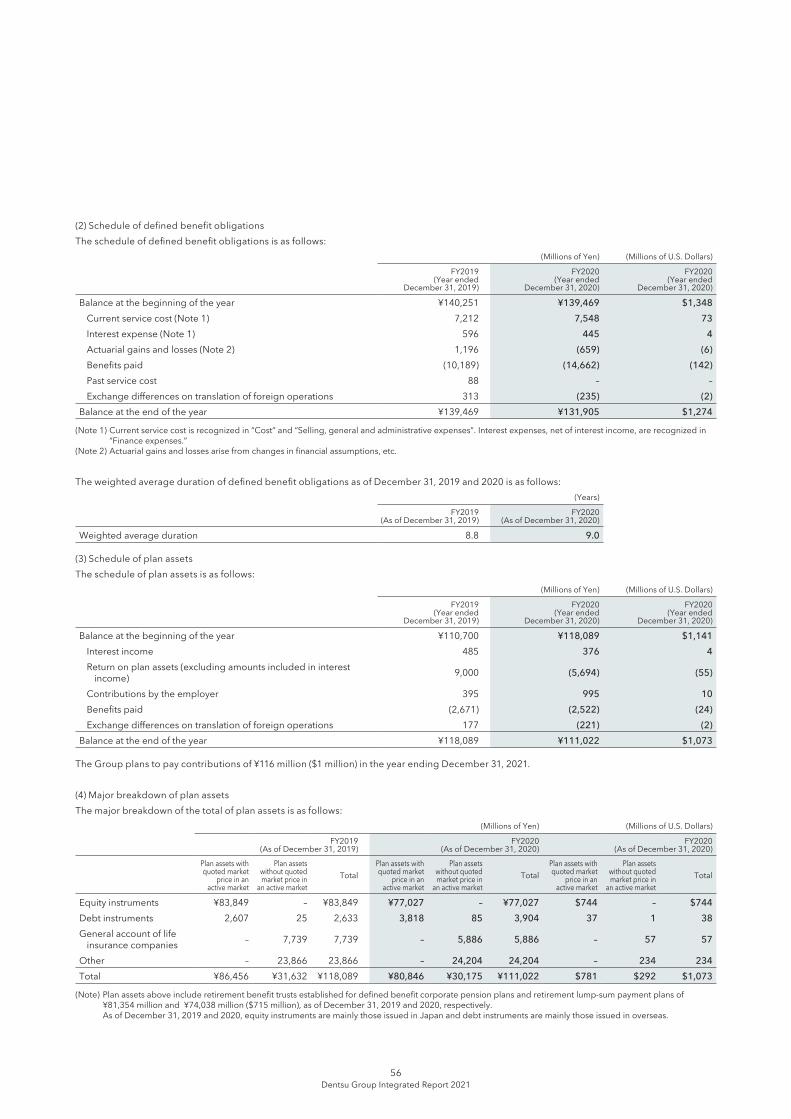
(2) Schedule of defined benefit obligationsThe schedule of defined benefit obligations is as follows:
(Millions of Yen) (Millions of U.S. Dollars)
FY2019(Year ended
December 31, 2019)
FY2020(Year ended
December 31, 2020)
FY2020(Year ended
December 31, 2020)
Balance at the beginning of the year ¥140,251 ¥139,469 $1,348Current service cost (Note 1) 7,212 7,548 73Interest expense (Note 1) 596 445 4Actuarial gains and losses (Note 2) 1,196 (659) (6)Benefits paid (10,189) (14,662) (142)Past service cost 88 – –Exchange differences on translation of foreign operations 313 (235) (2)
Balance at the end of the year ¥139,469 ¥131,905 $1,274
(Note 1) Current service cost is recognized in “Cost” and “Selling, general and administrative expenses”. Interest expenses, net of interest income, are recognized in “Finance expenses.”
(Note 2) Actuarial gains and losses arise from changes in financial assumptions, etc.
The weighted average duration of defined benefit obligations as of December 31, 2019 and 2020 is as follows:(Years)
FY2019(As of December 31, 2019)
FY2020(As of December 31, 2020)
Weighted average duration 8.8 9.0
(3) Schedule of plan assetsThe schedule of plan assets is as follows:
(Millions of Yen) (Millions of U.S. Dollars)
FY2019(Year ended
December 31, 2019)
FY2020(Year ended
December 31, 2020)
FY2020(Year ended
December 31, 2020)
Balance at the beginning of the year ¥110,700 ¥118,089 $1,141Interest income 485 376 4Return on plan assets (excluding amounts included in interest
income) 9,000 (5,694) (55)
Contributions by the employer 395 995 10Benefits paid (2,671) (2,522) (24)Exchange differences on translation of foreign operations 177 (221) (2)
Balance at the end of the year ¥118,089 ¥111,022 $1,073
The Group plans to pay contributions of ¥116 million ($1 million) in the year ending December 31, 2021.
(4) Major breakdown of plan assetsThe major breakdown of the total of plan assets is as follows:
(Millions of Yen) (Millions of U.S. Dollars)
FY2019(As of December 31, 2019)
FY2020(As of December 31, 2020)
FY2020(As of December 31, 2020)
Plan assets with quoted market
price in an active market
Plan assets without quoted market price in
an active marketTotal
Plan assets with quoted market
price in an active market
Plan assets without quoted market price in
an active marketTotal
Plan assets with quoted market
price in an active market
Plan assets without quoted market price in
an active marketTotal
Equity instruments ¥83,849 – ¥83,849 ¥77,027 – ¥77,027 $744 – $744Debt instruments 2,607 25 2,633 3,818 85 3,904 37 1 38General account of life
insurance companies – 7,739 7,739 – 5,886 5,886 – 57 57
Other – 23,866 23,866 – 24,204 24,204 – 234 234Total ¥86,456 ¥31,632 ¥118,089 ¥80,846 ¥30,175 ¥111,022 $781 $292 $1,073
(Note) Plan assets above include retirement benefit trusts established for defined benefit corporate pension plans and retirement lump-sum payment plans of ¥81,354 million and ¥74,038 million ($715 million), as of December 31, 2019 and 2020, respectively.
As of December 31, 2019 and 2020, equity instruments are mainly those issued in Japan and debt instruments are mainly those issued in overseas.
Dentsu Group Integrated Report 202156
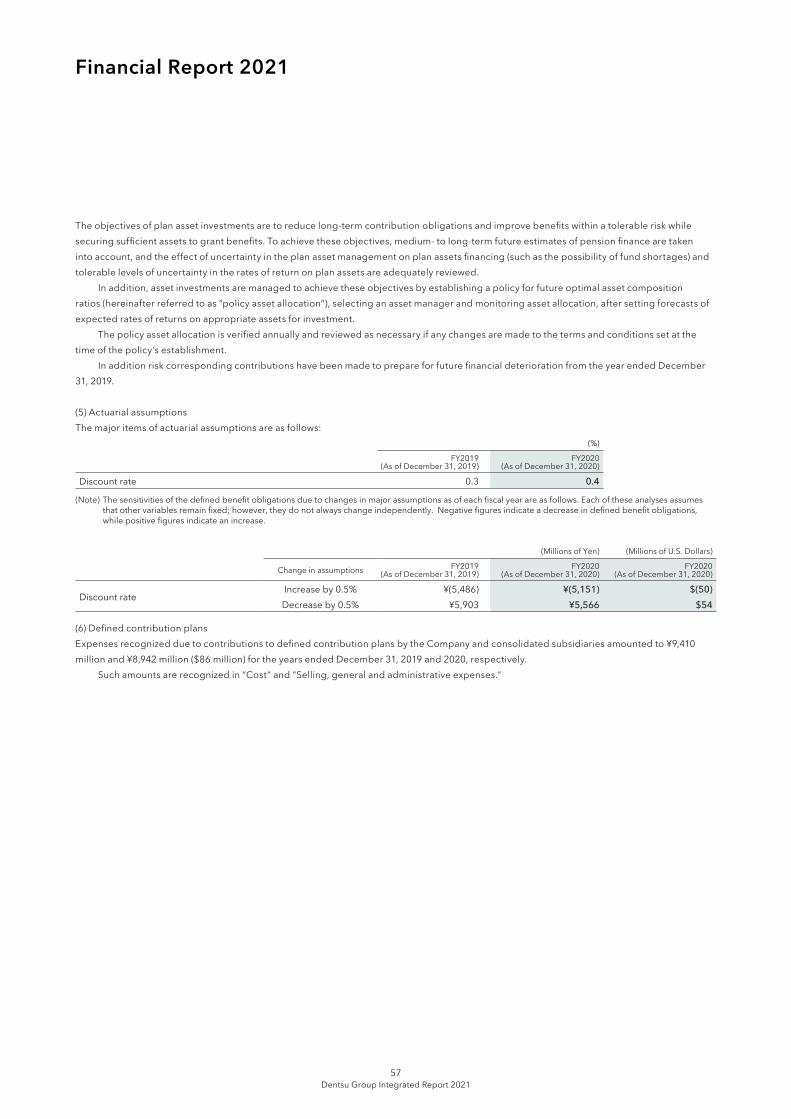
Financial Report 2021
The objectives of plan asset investments are to reduce long-term contribution obligations and improve benefits within a tolerable risk while securing sufficient assets to grant benefits. To achieve these objectives, medium- to long-term future estimates of pension finance are taken into account, and the effect of uncertainty in the plan asset management on plan assets financing (such as the possibility of fund shortages) and tolerable levels of uncertainty in the rates of return on plan assets are adequately reviewed. In addition, asset investments are managed to achieve these objectives by establishing a policy for future optimal asset composition ratios (hereinafter referred to as “policy asset allocation”), selecting an asset manager and monitoring asset allocation, after setting forecasts of expected rates of returns on appropriate assets for investment. The policy asset allocation is verified annually and reviewed as necessary if any changes are made to the terms and conditions set at the time of the policy’s establishment. In addition risk corresponding contributions have been made to prepare for future financial deterioration from the year ended December 31, 2019.
(5) Actuarial assumptionsThe major items of actuarial assumptions are as follows:
(%)
FY2019(As of December 31, 2019)
FY2020(As of December 31, 2020)
Discount rate 0.3 0.4
(Note) The sensitivities of the defined benefit obligations due to changes in major assumptions as of each fiscal year are as follows. Each of these analyses assumes that other variables remain fixed; however, they do not always change independently. Negative figures indicate a decrease in defined benefit obligations, while positive figures indicate an increase.
(Millions of Yen) (Millions of U.S. Dollars)
Change in assumptions FY2019(As of December 31, 2019)
FY2020(As of December 31, 2020)
FY2020(As of December 31, 2020)
Discount rateIncrease by 0.5% ¥(5,486) ¥(5,151) $(50)Decrease by 0.5% ¥5,903 ¥5,566 $54
(6) Defined contribution plansExpenses recognized due to contributions to defined contribution plans by the Company and consolidated subsidiaries amounted to ¥9,410 million and ¥8,942 million ($86 million) for the years ended December 31, 2019 and 2020, respectively. Such amounts are recognized in “Cost” and “Selling, general and administrative expenses.”
Dentsu Group Integrated Report 202157
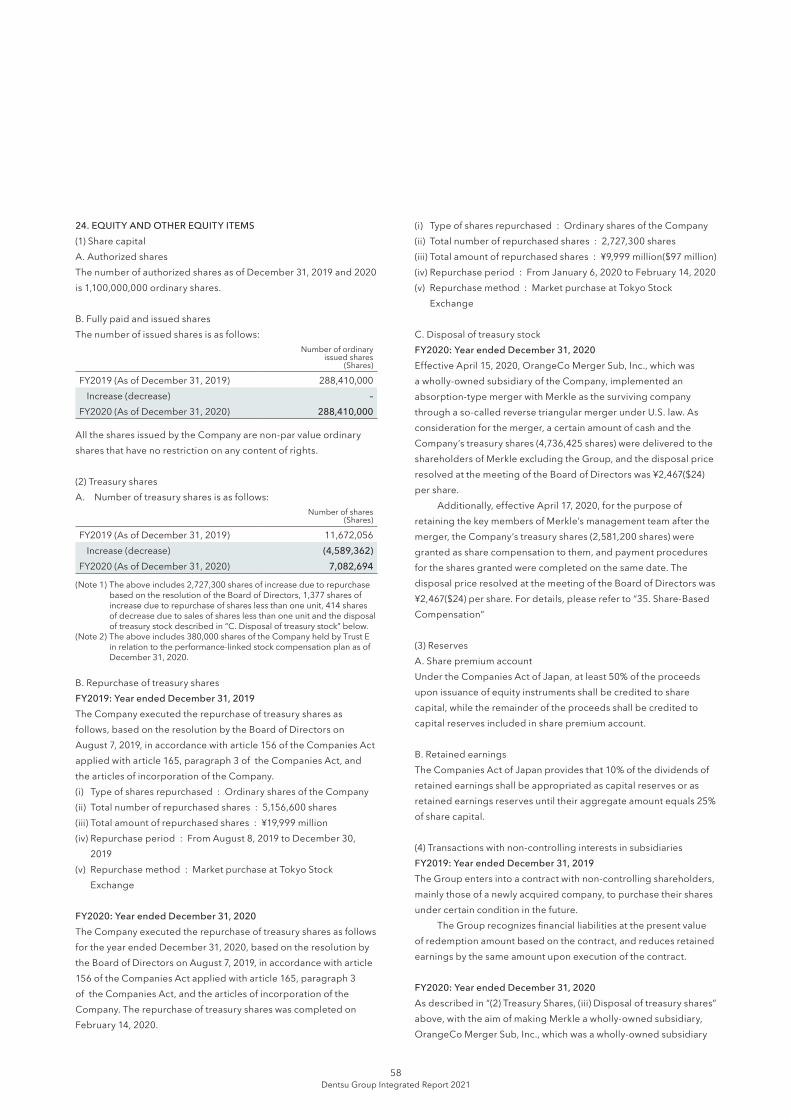
24. EQUITY AND OTHER EQUITY ITEMS(1) Share capitalA. Authorized sharesThe number of authorized shares as of December 31, 2019 and 2020 is 1,100,000,000 ordinary shares.
B. Fully paid and issued sharesThe number of issued shares is as follows:
Number of ordinaryissued shares
(Shares)
FY2019 (As of December 31, 2019) 288,410,000Increase (decrease) –
FY2020 (As of December 31, 2020) 288,410,000
All the shares issued by the Company are non-par value ordinary shares that have no restriction on any content of rights.
(2) Treasury sharesA. Number of treasury shares is as follows:
Number of shares(Shares)
FY2019 (As of December 31, 2019) 11,672,056Increase (decrease) (4,589,362)
FY2020 (As of December 31, 2020) 7,082,694
(Note 1) The above includes 2,727,300 shares of increase due to repurchase based on the resolution of the Board of Directors, 1,377 shares of increase due to repurchase of shares less than one unit, 414 shares of decrease due to sales of shares less than one unit and the disposal of treasury stock described in “C. Disposal of treasury stock” below.
(Note 2) The above includes 380,000 shares of the Company held by Trust E in relation to the performance-linked stock compensation plan as of December 31, 2020.
B. Repurchase of treasury sharesFY2019: Year ended December 31, 2019The Company executed the repurchase of treasury shares as follows, based on the resolution by the Board of Directors on August 7, 2019, in accordance with article 156 of the Companies Act applied with article 165, paragraph 3 of the Companies Act, and the articles of incorporation of the Company.(ⅰ) Type of shares repurchased : Ordinary shares of the Company(ⅱ) Total number of repurchased shares : 5,156,600 shares(ⅲ) Total amount of repurchased shares : ¥19,999 million(ⅳ) Repurchase period : From August 8, 2019 to December 30,
2019(ⅴ) Repurchase method : Market purchase at Tokyo Stock
Exchange
FY2020: Year ended December 31, 2020The Company executed the repurchase of treasury shares as follows for the year ended December 31, 2020, based on the resolution by the Board of Directors on August 7, 2019, in accordance with article 156 of the Companies Act applied with article 165, paragraph 3 of the Companies Act, and the articles of incorporation of the Company. The repurchase of treasury shares was completed on February 14, 2020.
(ⅰ) Type of shares repurchased : Ordinary shares of the Company(ⅱ) Total number of repurchased shares : 2,727,300 shares(ⅲ) Total amount of repurchased shares : ¥9,999 million($97 million)(ⅳ) Repurchase period : From January 6, 2020 to February 14, 2020(ⅴ) Repurchase method : Market purchase at Tokyo Stock
Exchange
C. Disposal of treasury stockFY2020: Year ended December 31, 2020Effective April 15, 2020, OrangeCo Merger Sub, Inc., which was a wholly-owned subsidiary of the Company, implemented an absorption-type merger with Merkle as the surviving company through a so-called reverse triangular merger under U.S. law. As consideration for the merger, a certain amount of cash and the Company’s treasury shares (4,736,425 shares) were delivered to the shareholders of Merkle excluding the Group, and the disposal price resolved at the meeting of the Board of Directors was ¥2,467($24) per share. Additionally, effective April 17, 2020, for the purpose of retaining the key members of Merkle’s management team after the merger, the Company’s treasury shares (2,581,200 shares) were granted as share compensation to them, and payment procedures for the shares granted were completed on the same date. The disposal price resolved at the meeting of the Board of Directors was ¥2,467($24) per share. For details, please refer to “35. Share-Based Compensation”
(3) ReservesA. Share premium accountUnder the Companies Act of Japan, at least 50% of the proceeds upon issuance of equity instruments shall be credited to share capital, while the remainder of the proceeds shall be credited to capital reserves included in share premium account.
B. Retained earningsThe Companies Act of Japan provides that 10% of the dividends of retained earnings shall be appropriated as capital reserves or as retained earnings reserves until their aggregate amount equals 25% of share capital.
(4) Transactions with non-controlling interests in subsidiariesFY2019: Year ended December 31, 2019The Group enters into a contract with non-controlling shareholders, mainly those of a newly acquired company, to purchase their shares under certain condition in the future. The Group recognizes financial liabilities at the present value of redemption amount based on the contract, and reduces retained earnings by the same amount upon execution of the contract.
FY2020: Year ended December 31, 2020As described in “(2) Treasury Shares, (iii) Disposal of treasury shares” above, with the aim of making Merkle a wholly-owned subsidiary, OrangeCo Merger Sub, Inc., which was a wholly-owned subsidiary
Dentsu Group Integrated Report 202158
Financial Report 2021
of the Company, implemented an absorption-type merger with Merkle as the surviving company through a so-called reverse triangular merger under U.S. law effective April 15, 2020. As a result, the carrying amount of non-controlling interests decreased by ¥17,953 million ($173 million). In addition, retained earnings increased by ¥17,953 million ($173 million) as the difference between the decrease in non-controlling interests and the change in retained earnings recognized at the time of the initial acquisition in 2016 was accounted for as a change in retained earnings.
Dentsu Group Integrated Report 202159
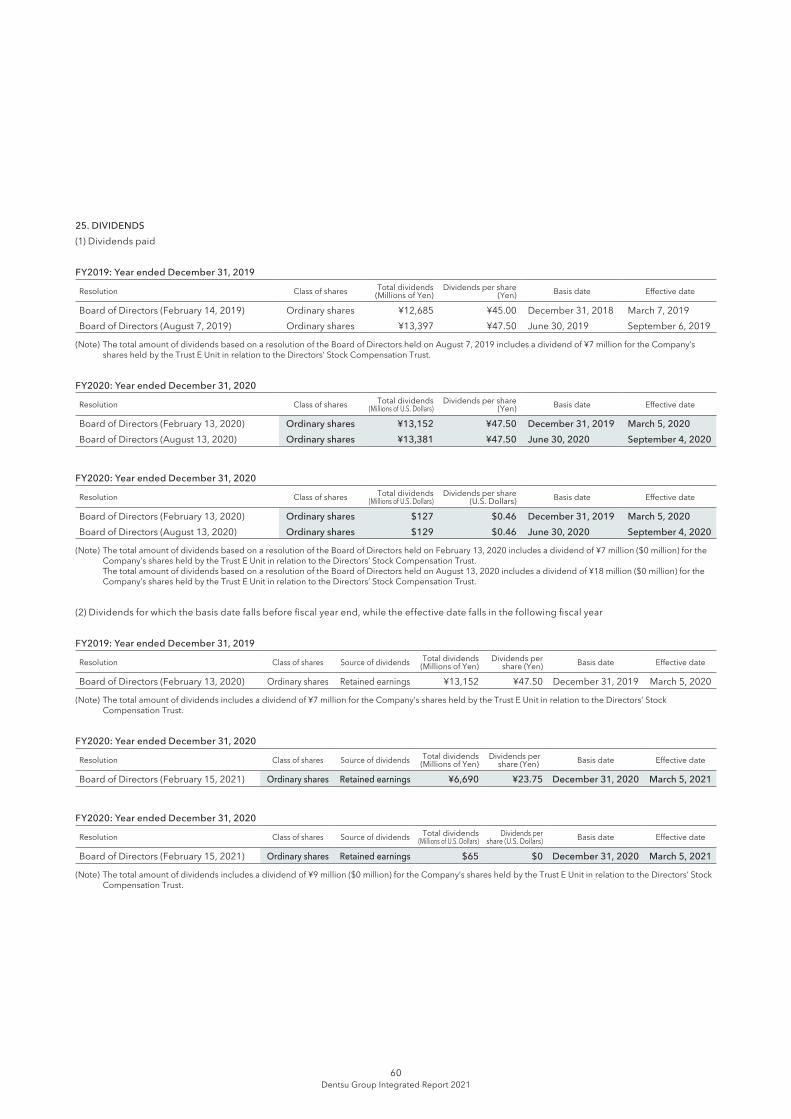
25. DIVIDENDS(1) Dividends paid
FY2019: Year ended December 31, 2019
Resolution Class of shares Total dividends(Millions of Yen)
Dividends per share (Yen) Basis date Effective date
Board of Directors (February 14, 2019) Ordinary shares ¥12,685 ¥45.00 December 31, 2018 March 7, 2019Board of Directors (August 7, 2019) Ordinary shares ¥13,397 ¥47.50 June 30, 2019 September 6, 2019
(Note) The total amount of dividends based on a resolution of the Board of Directors held on August 7, 2019 includes a dividend of ¥7 million for the Company’s shares held by the Trust E Unit in relation to the Directors’ Stock Compensation Trust.
FY2020: Year ended December 31, 2020
Resolution Class of shares Total dividends(Millions of U.S. Dollars)
Dividends per share (Yen) Basis date Effective date
Board of Directors (February 13, 2020) Ordinary shares ¥13,152 ¥47.50 December 31, 2019 March 5, 2020Board of Directors (August 13, 2020) Ordinary shares ¥13,381 ¥47.50 June 30, 2020 September 4, 2020
FY2020: Year ended December 31, 2020
Resolution Class of shares Total dividends(Millions of U.S. Dollars)
Dividends per share(U.S. Dollars) Basis date Effective date
Board of Directors (February 13, 2020) Ordinary shares $127 $0.46 December 31, 2019 March 5, 2020Board of Directors (August 13, 2020) Ordinary shares $129 $0.46 June 30, 2020 September 4, 2020
(Note) The total amount of dividends based on a resolution of the Board of Directors held on February 13, 2020 includes a dividend of ¥7 million ($0 million) for the Company’s shares held by the Trust E Unit in relation to the Directors’ Stock Compensation Trust.
The total amount of dividends based on a resolution of the Board of Directors held on August 13, 2020 includes a dividend of ¥18 million ($0 million) for the Company’s shares held by the Trust E Unit in relation to the Directors’ Stock Compensation Trust.
(2) Dividends for which the basis date falls before fiscal year end, while the effective date falls in the following fiscal year
FY2019: Year ended December 31, 2019
Resolution Class of shares Source of dividends Total dividends(Millions of Yen)
Dividends per share (Yen) Basis date Effective date
Board of Directors (February 13, 2020) Ordinary shares Retained earnings ¥13,152 ¥47.50 December 31, 2019 March 5, 2020
(Note) The total amount of dividends includes a dividend of ¥7 million for the Company’s shares held by the Trust E Unit in relation to the Directors’ Stock Compensation Trust.
FY2020: Year ended December 31, 2020
Resolution Class of shares Source of dividends Total dividends(Millions of Yen)
Dividends per share (Yen) Basis date Effective date
Board of Directors (February 15, 2021) Ordinary shares Retained earnings ¥6,690 ¥23.75 December 31, 2020 March 5, 2021
FY2020: Year ended December 31, 2020
Resolution Class of shares Source of dividends Total dividends(Millions of U.S. Dollars)
Dividends per share (U.S. Dollars) Basis date Effective date
Board of Directors (February 15, 2021) Ordinary shares Retained earnings $65 $0 December 31, 2020 March 5, 2021
(Note) The total amount of dividends includes a dividend of ¥9 million ($0 million) for the Company’s shares held by the Trust E Unit in relation to the Directors’ Stock Compensation Trust.
Dentsu Group Integrated Report 202160
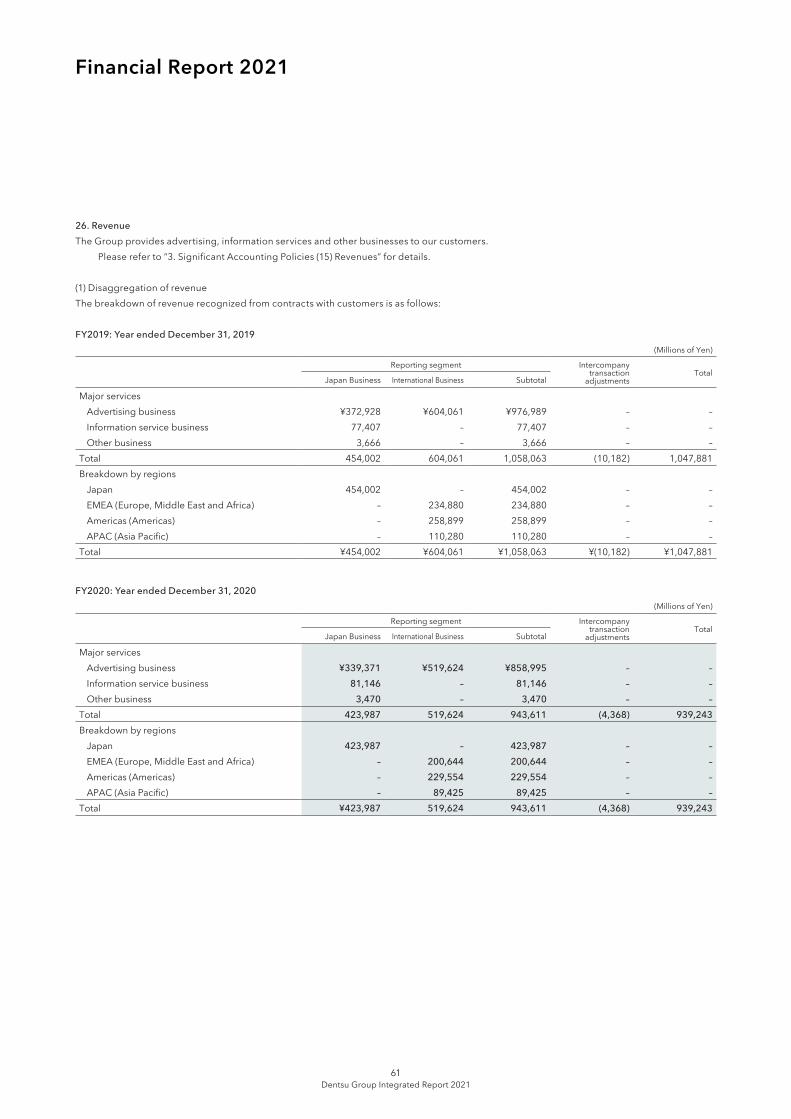
Financial Report 2021
26. RevenueThe Group provides advertising, information services and other businesses to our customers. Please refer to “3. Significant Accounting Policies (15) Revenues” for details.
(1) Disaggregation of revenueThe breakdown of revenue recognized from contracts with customers is as follows:
FY2019: Year ended December 31, 2019(Millions of Yen)
Reporting segment Intercompany transaction
adjustmentsTotal
Japan Business International Business Subtotal
Major servicesAdvertising business ¥372,928 ¥604,061 ¥976,989 – –Information service business 77,407 – 77,407 – –Other business 3,666 – 3,666 – –
Total 454,002 604,061 1,058,063 (10,182) 1,047,881Breakdown by regions
Japan 454,002 – 454,002 – –EMEA (Europe, Middle East and Africa) – 234,880 234,880 – –Americas (Americas) – 258,899 258,899 – –APAC (Asia Pacific) – 110,280 110,280 – –
Total ¥454,002 ¥604,061 ¥1,058,063 ¥(10,182) ¥1,047,881
FY2020: Year ended December 31, 2020(Millions of Yen)
Reporting segment Intercompany transaction
adjustmentsTotal
Japan Business International Business Subtotal
Major servicesAdvertising business ¥339,371 ¥519,624 ¥858,995 – –Information service business 81,146 – 81,146 – –Other business 3,470 – 3,470 – –
Total 423,987 519,624 943,611 (4,368) 939,243Breakdown by regions
Japan 423,987 – 423,987 – –EMEA (Europe, Middle East and Africa) – 200,644 200,644 – –Americas (Americas) – 229,554 229,554 – –APAC (Asia Pacific) – 89,425 89,425 – –
Total ¥423,987 519,624 943,611 (4,368) 939,243
Dentsu Group Integrated Report 202161
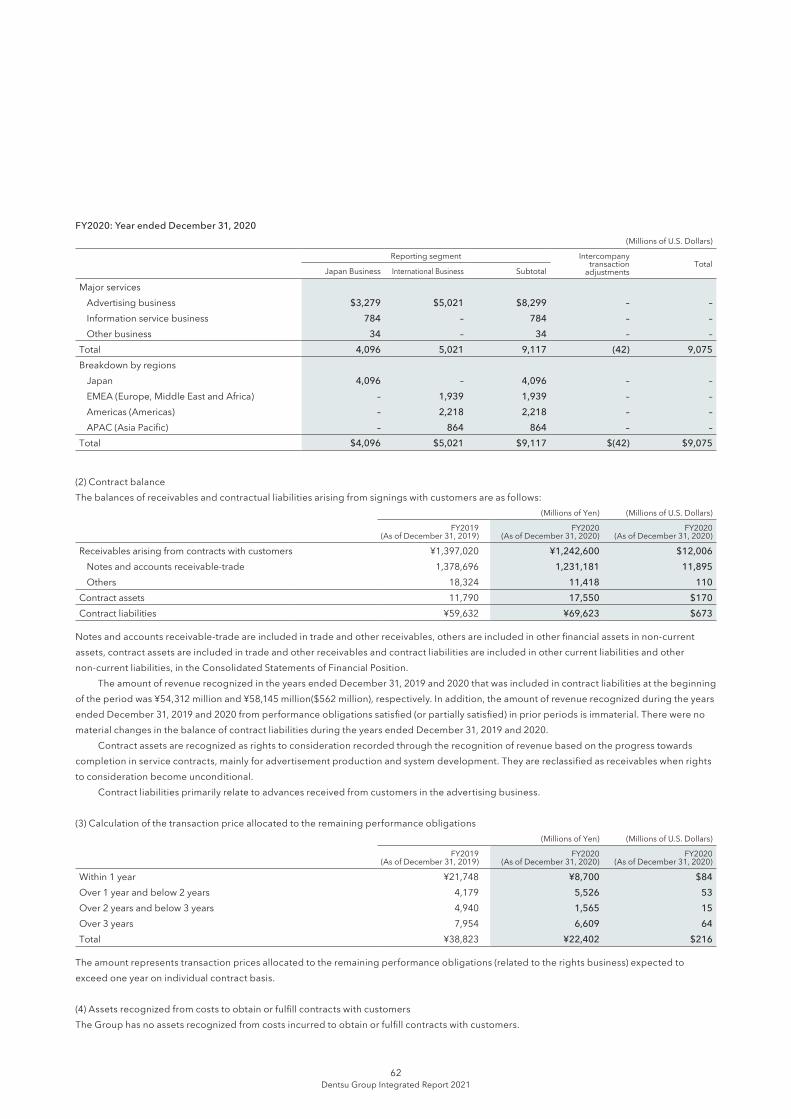
FY2020: Year ended December 31, 2020(Millions of U.S. Dollars)
Reporting segment Intercompany transaction
adjustmentsTotal
Japan Business International Business Subtotal
Major servicesAdvertising business $3,279 $5,021 $8,299 – –Information service business 784 – 784 – –Other business 34 – 34 – –
Total 4,096 5,021 9,117 (42) 9,075Breakdown by regions
Japan 4,096 – 4,096 – –EMEA (Europe, Middle East and Africa) – 1,939 1,939 – –Americas (Americas) – 2,218 2,218 – –APAC (Asia Pacific) – 864 864 – –
Total $4,096 $5,021 $9,117 $(42) $9,075
(2) Contract balanceThe balances of receivables and contractual liabilities arising from signings with customers are as follows:
(Millions of Yen) (Millions of U.S. Dollars)
FY2019(As of December 31, 2019)
FY2020(As of December 31, 2020)
FY2020(As of December 31, 2020)
Receivables arising from contracts with customers ¥1,397,020 ¥1,242,600 $12,006Notes and accounts receivable-trade 1,378,696 1,231,181 11,895Others 18,324 11,418 110
Contract assets 11,790 17,550 $170Contract liabilities ¥59,632 ¥69,623 $673
Notes and accounts receivable-trade are included in trade and other receivables, others are included in other financial assets in non-current assets, contract assets are included in trade and other receivables and contract liabilities are included in other current liabilities and other non-current liabilities, in the Consolidated Statements of Financial Position. The amount of revenue recognized in the years ended December 31, 2019 and 2020 that was included in contract liabilities at the beginning of the period was ¥54,312 million and ¥58,145 million($562 million), respectively. In addition, the amount of revenue recognized during the years ended December 31, 2019 and 2020 from performance obligations satisfied (or partially satisfied) in prior periods is immaterial. There were no material changes in the balance of contract liabilities during the years ended December 31, 2019 and 2020. Contract assets are recognized as rights to consideration recorded through the recognition of revenue based on the progress towards completion in service contracts, mainly for advertisement production and system development. They are reclassified as receivables when rights to consideration become unconditional. Contract liabilities primarily relate to advances received from customers in the advertising business.
(3) Calculation of the transaction price allocated to the remaining performance obligations(Millions of Yen) (Millions of U.S. Dollars)
FY2019(As of December 31, 2019)
FY2020(As of December 31, 2020)
FY2020(As of December 31, 2020)
Within 1 year ¥21,748 ¥8,700 $84Over 1 year and below 2 years 4,179 5,526 53Over 2 years and below 3 years 4,940 1,565 15Over 3 years 7,954 6,609 64Total ¥38,823 ¥22,402 $216
The amount represents transaction prices allocated to the remaining performance obligations (related to the rights business) expected to exceed one year on individual contract basis.
(4) Assets recognized from costs to obtain or fulfill contracts with customersThe Group has no assets recognized from costs incurred to obtain or fulfill contracts with customers.
Dentsu Group Integrated Report 202162
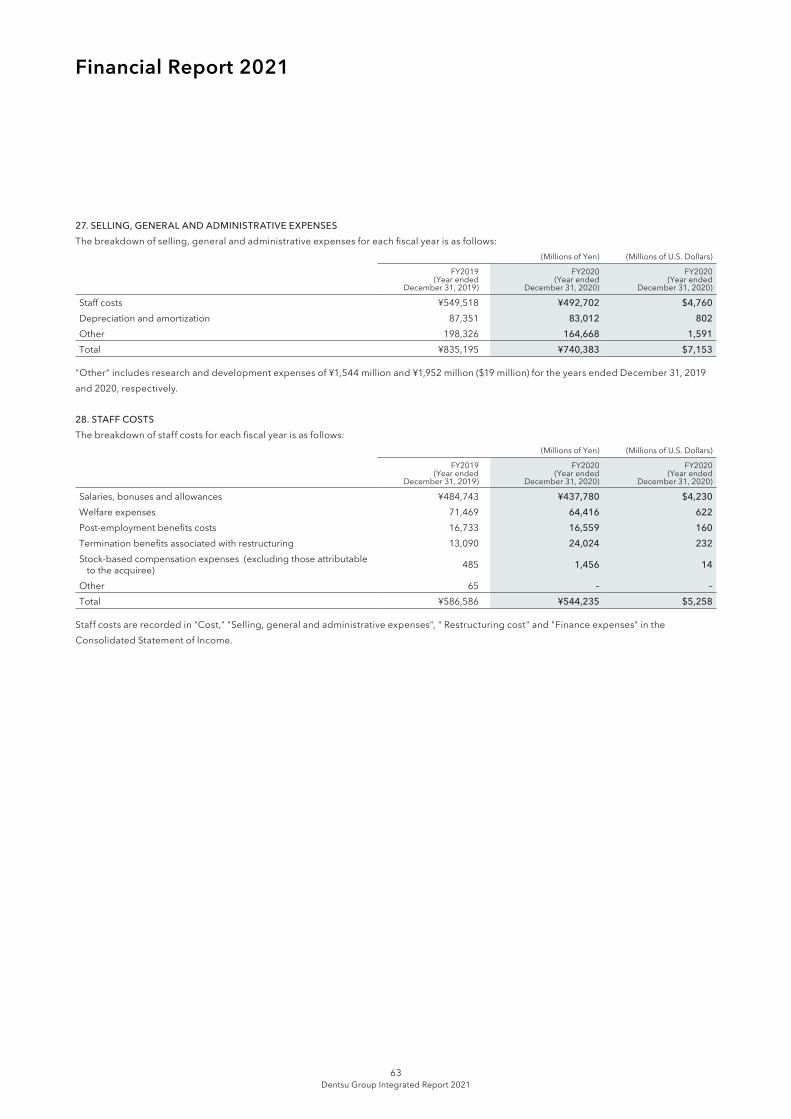
Financial Report 2021
27. SELLING, GENERAL AND ADMINISTRATIVE EXPENSESThe breakdown of selling, general and administrative expenses for each fiscal year is as follows:
(Millions of Yen) (Millions of U.S. Dollars)
FY2019(Year ended
December 31, 2019)
FY2020(Year ended
December 31, 2020)
FY2020(Year ended
December 31, 2020)
Staff costs ¥549,518 ¥492,702 $4,760 Depreciation and amortization 87,351 83,012 802Other 198,326 164,668 1,591Total ¥835,195 ¥740,383 $7,153
"Other" includes research and development expenses of ¥1,544 million and ¥1,952 million ($19 million) for the years ended December 31, 2019 and 2020, respectively.
28. STAFF COSTSThe breakdown of staff costs for each fiscal year is as follows:
(Millions of Yen) (Millions of U.S. Dollars)
FY2019(Year ended
December 31, 2019)
FY2020(Year ended
December 31, 2020)
FY2020(Year ended
December 31, 2020)
Salaries, bonuses and allowances ¥484,743 ¥437,780 $4,230 Welfare expenses 71,469 64,416 622Post-employment benefits costs 16,733 16,559 160Termination benefits associated with restructuring 13,090 24,024 232Stock-based compensation expenses (excluding those attributable
to the acquiree) 485 1,456 14
Other 65 – –Total ¥586,586 ¥544,235 $5,258
Staff costs are recorded in "Cost," "Selling, general and administrative expenses", " Restructuring cost" and "Finance expenses" in the Consolidated Statement of Income.
Dentsu Group Integrated Report 202163
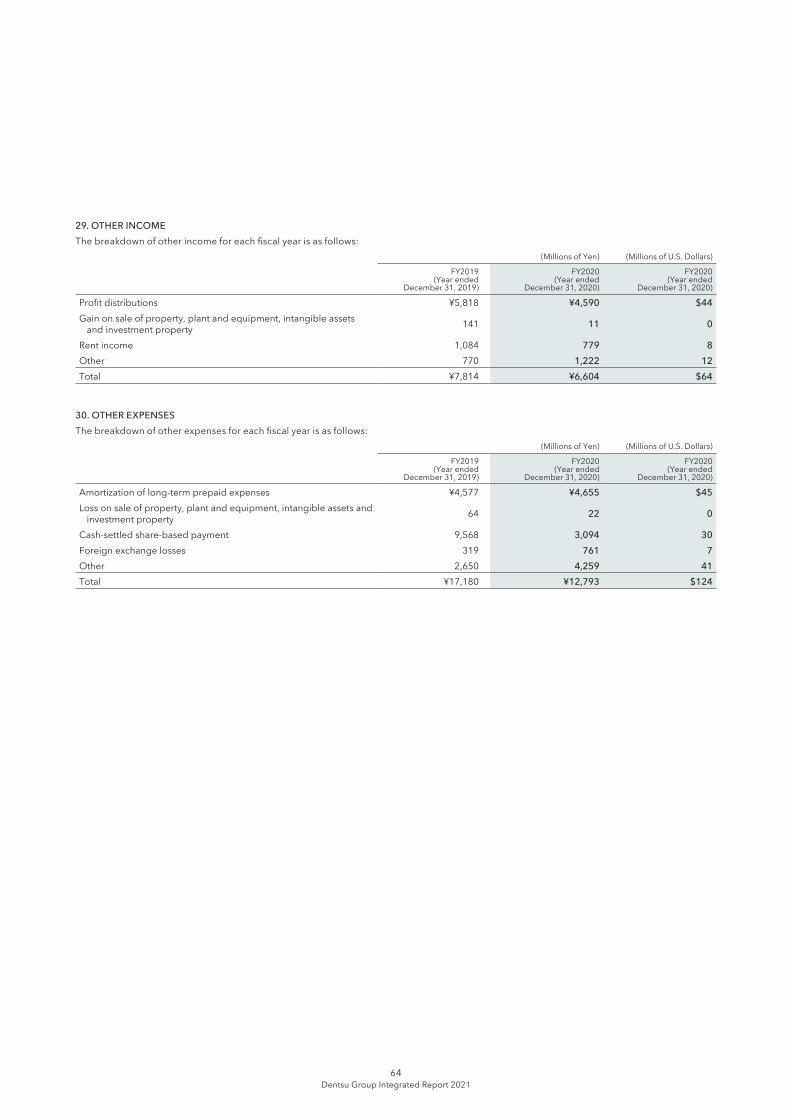
29. OTHER INCOMEThe breakdown of other income for each fiscal year is as follows:
(Millions of Yen) (Millions of U.S. Dollars)
FY2019(Year ended
December 31, 2019)
FY2020(Year ended
December 31, 2020)
FY2020(Year ended
December 31, 2020)
Profit distributions ¥5,818 ¥4,590 $44 Gain on sale of property, plant and equipment, intangible assets
and investment property 141 11 0
Rent income 1,084 779 8Other 770 1,222 12Total ¥7,814 ¥6,604 $64
30. OTHER EXPENSESThe breakdown of other expenses for each fiscal year is as follows:
(Millions of Yen) (Millions of U.S. Dollars)
FY2019(Year ended
December 31, 2019)
FY2020(Year ended
December 31, 2020)
FY2020(Year ended
December 31, 2020)
Amortization of long-term prepaid expenses ¥4,577 ¥4,655 $45 Loss on sale of property, plant and equipment, intangible assets and
investment property 64 22 0
Cash-settled share-based payment 9,568 3,094 30Foreign exchange losses 319 761 7Other 2,650 4,259 41Total ¥17,180 ¥12,793 $124
Dentsu Group Integrated Report 202164
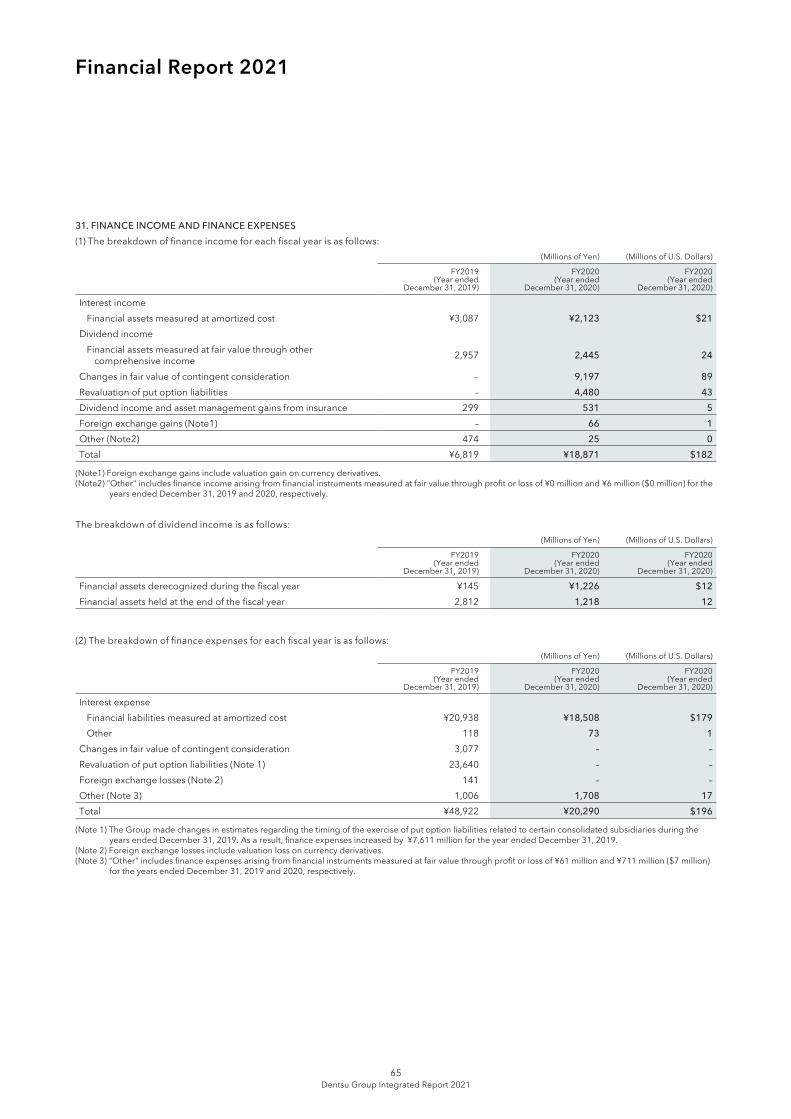
Financial Report 2021
31. FINANCE INCOME AND FINANCE EXPENSES(1) The breakdown of finance income for each fiscal year is as follows:
(Millions of Yen) (Millions of U.S. Dollars)
FY2019(Year ended
December 31, 2019)
FY2020(Year ended
December 31, 2020)
FY2020(Year ended
December 31, 2020)
Interest incomeFinancial assets measured at amortized cost ¥3,087 ¥2,123 $21
Dividend incomeFinancial assets measured at fair value through other
comprehensive income 2,957 2,445 24
Changes in fair value of contingent consideration – 9,197 89Revaluation of put option liabilities – 4,480 43Dividend income and asset management gains from insurance 299 531 5Foreign exchange gains (Note1) – 66 1Other (Note2) 474 25 0Total ¥6,819 ¥18,871 $182
(Note1) Foreign exchange gains include valuation gain on currency derivatives.(Note2) "Other" includes finance income arising from financial instruments measured at fair value through profit or loss of ¥0 million and ¥6 million ($0 million) for the
years ended December 31, 2019 and 2020, respectively.
The breakdown of dividend income is as follows:(Millions of Yen) (Millions of U.S. Dollars)
FY2019(Year ended
December 31, 2019)
FY2020(Year ended
December 31, 2020)
FY2020(Year ended
December 31, 2020)
Financial assets derecognized during the fiscal year ¥145 ¥1,226 $12 Financial assets held at the end of the fiscal year 2,812 1,218 12
(2) The breakdown of finance expenses for each fiscal year is as follows:(Millions of Yen) (Millions of U.S. Dollars)
FY2019(Year ended
December 31, 2019)
FY2020(Year ended
December 31, 2020)
FY2020(Year ended
December 31, 2020)
Interest expenseFinancial liabilities measured at amortized cost ¥20,938 ¥18,508 $179 Other 118 73 1
Changes in fair value of contingent consideration 3,077 – –Revaluation of put option liabilities (Note 1) 23,640 – –Foreign exchange losses (Note 2) 141 – –Other (Note 3) 1,006 1,708 17Total ¥48,922 ¥20,290 $196
(Note 1) The Group made changes in estimates regarding the timing of the exercise of put option liabilities related to certain consolidated subsidiaries during the years ended December 31, 2019. As a result, finance expenses increased by ¥7,611 million for the year ended December 31, 2019.
(Note 2) Foreign exchange losses include valuation loss on currency derivatives.(Note 3) "Other" includes finance expenses arising from financial instruments measured at fair value through profit or loss of ¥61 million and ¥711 million ($7 million)
for the years ended December 31, 2019 and 2020, respectively.
Dentsu Group Integrated Report 202165
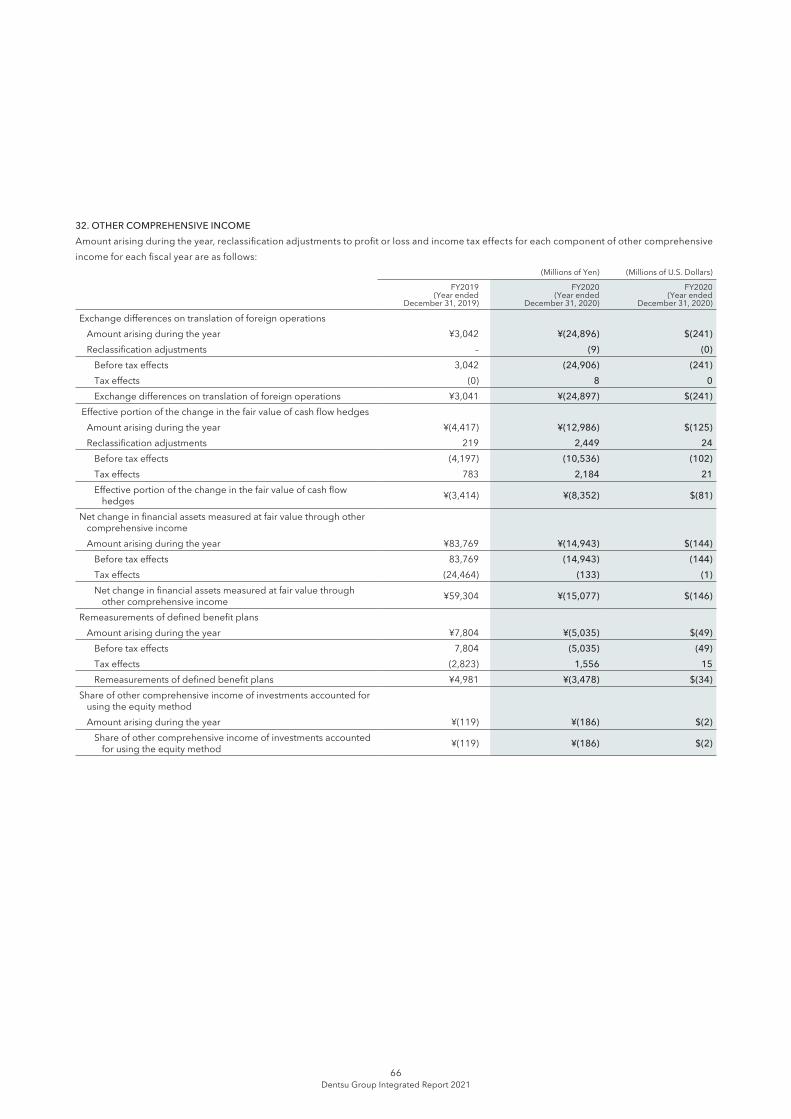
32. OTHER COMPREHENSIVE INCOMEAmount arising during the year, reclassification adjustments to profit or loss and income tax effects for each component of other comprehensive income for each fiscal year are as follows:
(Millions of Yen) (Millions of U.S. Dollars)
FY2019(Year ended
December 31, 2019)
FY2020(Year ended
December 31, 2020)
FY2020(Year ended
December 31, 2020)
Exchange differences on translation of foreign operationsAmount arising during the year ¥3,042 ¥(24,896) $(241)Reclassification adjustments – (9) (0)
Before tax effects 3,042 (24,906) (241)Tax effects (0) 8 0 Exchange differences on translation of foreign operations ¥3,041 ¥(24,897) $(241)
Effective portion of the change in the fair value of cash flow hedgesAmount arising during the year ¥(4,417) ¥(12,986) $(125)Reclassification adjustments 219 2,449 24
Before tax effects (4,197) (10,536) (102)Tax effects 783 2,184 21 Effective portion of the change in the fair value of cash flow
hedges ¥(3,414) ¥(8,352) $(81)
Net change in financial assets measured at fair value through other comprehensive incomeAmount arising during the year ¥83,769 ¥(14,943) $(144)
Before tax effects 83,769 (14,943) (144)Tax effects (24,464) (133) (1)Net change in financial assets measured at fair value through
other comprehensive income ¥59,304 ¥(15,077) $(146)
Remeasurements of defined benefit plansAmount arising during the year ¥7,804 ¥(5,035) $(49)
Before tax effects 7,804 (5,035) (49)Tax effects (2,823) 1,556 15 Remeasurements of defined benefit plans ¥4,981 ¥(3,478) $(34)
Share of other comprehensive income of investments accounted for using the equity methodAmount arising during the year ¥(119) ¥(186) $(2)
Share of other comprehensive income of investments accounted for using the equity method ¥(119) ¥(186) $(2)
Dentsu Group Integrated Report 202166
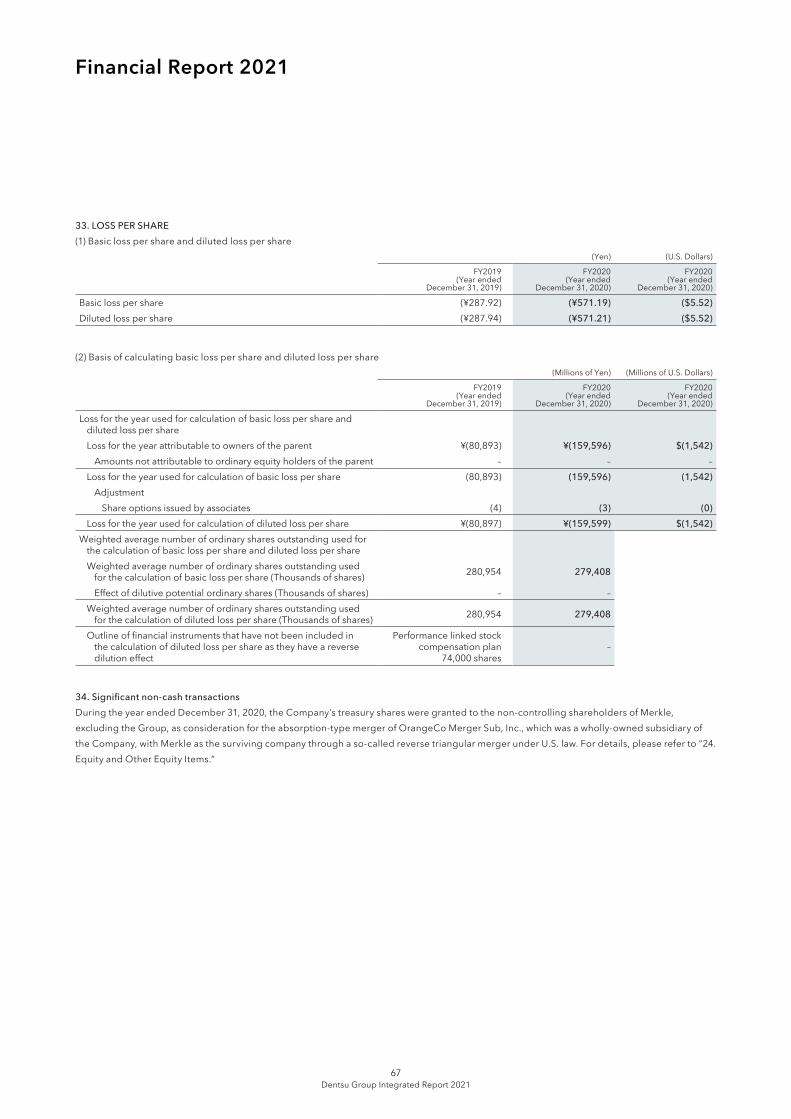
Financial Report 2021
33. LOSS PER SHARE(1) Basic loss per share and diluted loss per share
(Yen) (U.S. Dollars)
FY2019(Year ended
December 31, 2019)
FY2020(Year ended
December 31, 2020)
FY2020(Year ended
December 31, 2020)
Basic loss per share (¥287.92) (¥571.19) ($5.52)Diluted loss per share (¥287.94) (¥571.21) ($5.52)
(2) Basis of calculating basic loss per share and diluted loss per share (Millions of Yen) (Millions of U.S. Dollars)
FY2019(Year ended
December 31, 2019)
FY2020(Year ended
December 31, 2020)
FY2020(Year ended
December 31, 2020)
Loss for the year used for calculation of basic loss per share and diluted loss per share Loss for the year attributable to owners of the parent ¥(80,893) ¥(159,596) $(1,542)
Amounts not attributable to ordinary equity holders of the parent – – –Loss for the year used for calculation of basic loss per share (80,893) (159,596) (1,542)
AdjustmentShare options issued by associates (4) (3) (0)
Loss for the year used for calculation of diluted loss per share ¥(80,897) ¥(159,599) $(1,542)Weighted average number of ordinary shares outstanding used for
the calculation of basic loss per share and diluted loss per share Weighted average number of ordinary shares outstanding used
for the calculation of basic loss per share (Thousands of shares) 280,954 279,408
Effect of dilutive potential ordinary shares (Thousands of shares) – –Weighted average number of ordinary shares outstanding used
for the calculation of diluted loss per share (Thousands of shares) 280,954 279,408
Outline of financial instruments that have not been included in the calculation of diluted loss per share as they have a reverse dilution effect
Performance linked stock compensation plan
74,000 shares–
34. Significant non-cash transactionsDuring the year ended December 31, 2020, the Company’s treasury shares were granted to the non-controlling shareholders of Merkle, excluding the Group, as consideration for the absorption-type merger of OrangeCo Merger Sub, Inc., which was a wholly-owned subsidiary of the Company, with Merkle as the surviving company through a so-called reverse triangular merger under U.S. law. For details, please refer to “24. Equity and Other Equity Items.”
Dentsu Group Integrated Report 202167
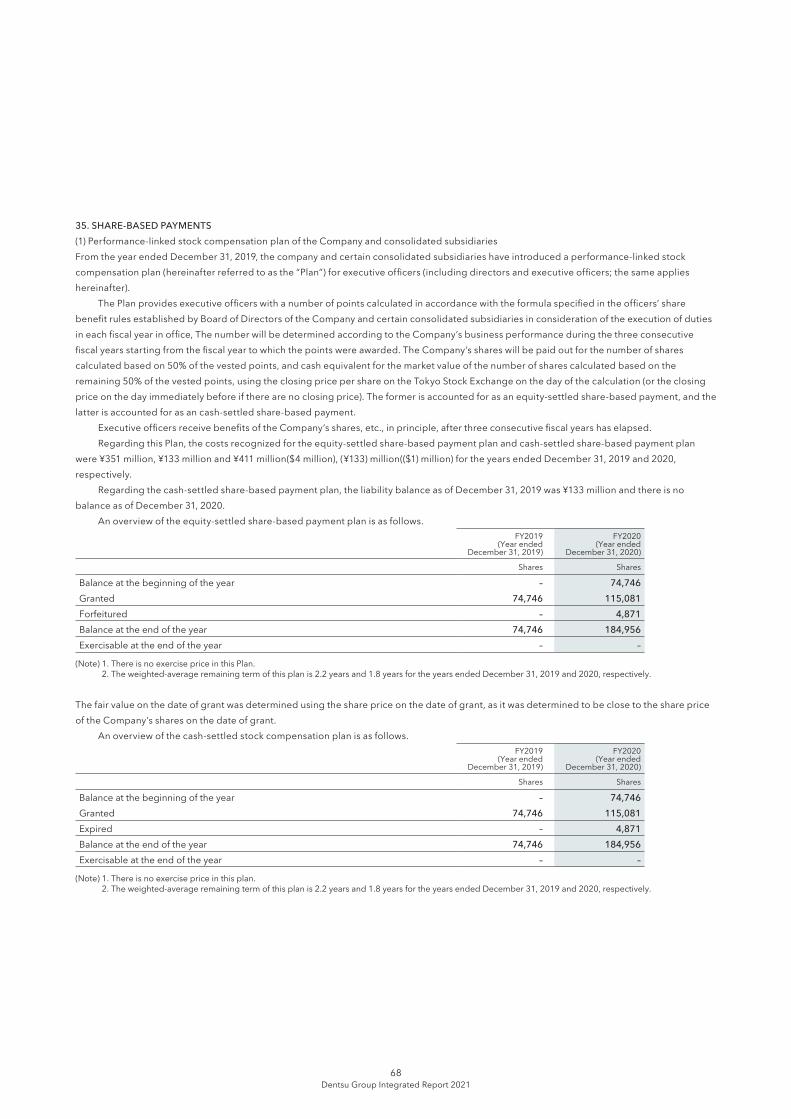
35. SHARE-BASED PAYMENTS(1) Performance-linked stock compensation plan of the Company and consolidated subsidiariesFrom the year ended December 31, 2019, the company and certain consolidated subsidiaries have introduced a performance-linked stock compensation plan (hereinafter referred to as the “Plan”) for executive officers (including directors and executive officers; the same applies hereinafter). The Plan provides executive officers with a number of points calculated in accordance with the formula specified in the officers’ share benefit rules established by Board of Directors of the Company and certain consolidated subsidiaries in consideration of the execution of duties in each fiscal year in office, The number will be determined according to the Company’s business performance during the three consecutive fiscal years starting from the fiscal year to which the points were awarded. The Company’s shares will be paid out for the number of shares calculated based on 50% of the vested points, and cash equivalent for the market value of the number of shares calculated based on the remaining 50% of the vested points, using the closing price per share on the Tokyo Stock Exchange on the day of the calculation (or the closing price on the day immediately before if there are no closing price). The former is accounted for as an equity-settled share-based payment, and the latter is accounted for as an cash-settled share-based payment. Executive officers receive benefits of the Company’s shares, etc., in principle, after three consecutive fiscal years has elapsed. Regarding this Plan, the costs recognized for the equity-settled share-based payment plan and cash-settled share-based payment plan were ¥351 million, ¥133 million and ¥411 million($4 million), (¥133) million(($1) million) for the years ended December 31, 2019 and 2020, respectively. Regarding the cash-settled share-based payment plan, the liability balance as of December 31, 2019 was ¥133 million and there is no balance as of December 31, 2020. An overview of the equity-settled share-based payment plan is as follows.
FY2019(Year ended
December 31, 2019)
FY2020(Year ended
December 31, 2020)
Shares Shares
Balance at the beginning of the year – 74,746Granted 74,746 115,081Forfeitured – 4,871Balance at the end of the year 74,746 184,956Exercisable at the end of the year – –
(Note) 1. There is no exercise price in this Plan. 2. The weighted-average remaining term of this plan is 2.2 years and 1.8 years for the years ended December 31, 2019 and 2020, respectively.
The fair value on the date of grant was determined using the share price on the date of grant, as it was determined to be close to the share price of the Company’s shares on the date of grant. An overview of the cash-settled stock compensation plan is as follows.
FY2019(Year ended
December 31, 2019)
FY2020(Year ended
December 31, 2020)
Shares Shares
Balance at the beginning of the year – 74,746Granted 74,746 115,081Expired – 4,871Balance at the end of the year 74,746 184,956Exercisable at the end of the year – –
(Note) 1. There is no exercise price in this plan. 2. The weighted-average remaining term of this plan is 2.2 years and 1.8 years for the years ended December 31, 2019 and 2020, respectively.
Dentsu Group Integrated Report 202168
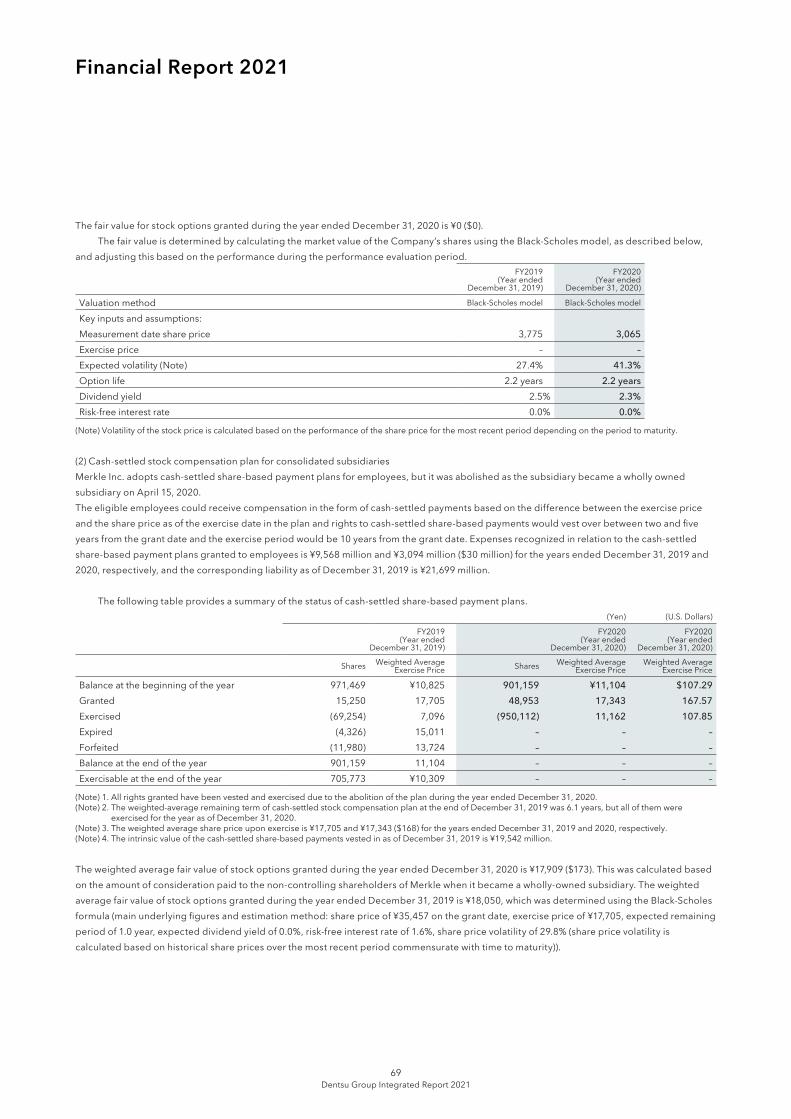
Financial Report 2021
The fair value for stock options granted during the year ended December 31, 2020 is ¥0 ($0). The fair value is determined by calculating the market value of the Company’s shares using the Black-Scholes model, as described below, and adjusting this based on the performance during the performance evaluation period.
FY2019(Year ended
December 31, 2019)
FY2020(Year ended
December 31, 2020)
Valuation method Black-Scholes model Black-Scholes model
Key inputs and assumptions:Measurement date share price 3,775 3,065Exercise price – –Expected volatility (Note) 27.4% 41.3%Option life 2.2 years 2.2 yearsDividend yield 2.5% 2.3%Risk-free interest rate 0.0% 0.0%
(Note) Volatility of the stock price is calculated based on the performance of the share price for the most recent period depending on the period to maturity.
(2) Cash-settled stock compensation plan for consolidated subsidiariesMerkle Inc. adopts cash-settled share-based payment plans for employees, but it was abolished as the subsidiary became a wholly owned subsidiary on April 15, 2020.The eligible employees could receive compensation in the form of cash-settled payments based on the difference between the exercise price and the share price as of the exercise date in the plan and rights to cash-settled share-based payments would vest over between two and five years from the grant date and the exercise period would be 10 years from the grant date. Expenses recognized in relation to the cash-settled share-based payment plans granted to employees is ¥9,568 million and ¥3,094 million ($30 million) for the years ended December 31, 2019 and 2020, respectively, and the corresponding liability as of December 31, 2019 is ¥21,699 million.
The following table provides a summary of the status of cash-settled share-based payment plans.(Yen) (U.S. Dollars)
FY2019(Year ended
December 31, 2019)
FY2020(Year ended
December 31, 2020)
FY2020(Year ended
December 31, 2020)
Shares Weighted Average Exercise Price Shares Weighted Average
Exercise Price Weighted Average
Exercise Price
Balance at the beginning of the year 971,469 ¥10,825 901,159 ¥11,104 $107.29Granted 15,250 17,705 48,953 17,343 167.57 Exercised (69,254) 7,096 (950,112) 11,162 107.85 Expired (4,326) 15,011 – – –Forfeited (11,980) 13,724 – – –Balance at the end of the year 901,159 11,104 – – –Exercisable at the end of the year 705,773 ¥10,309 – – –
(Note) 1. All rights granted have been vested and exercised due to the abolition of the plan during the year ended December 31, 2020.(Note) 2. The weighted-average remaining term of cash-settled stock compensation plan at the end of December 31, 2019 was 6.1 years, but all of them were
exercised for the year as of December 31, 2020.(Note) 3. The weighted average share price upon exercise is ¥17,705 and ¥17,343 ($168) for the years ended December 31, 2019 and 2020, respectively.(Note) 4. The intrinsic value of the cash-settled share-based payments vested in as of December 31, 2019 is ¥19,542 million.
The weighted average fair value of stock options granted during the year ended December 31, 2020 is ¥17,909 ($173). This was calculated based on the amount of consideration paid to the non-controlling shareholders of Merkle when it became a wholly-owned subsidiary. The weighted average fair value of stock options granted during the year ended December 31, 2019 is ¥18,050, which was determined using the Black-Scholes formula (main underlying figures and estimation method: share price of ¥35,457 on the grant date, exercise price of ¥17,705, expected remaining period of 1.0 year, expected dividend yield of 0.0%, risk-free interest rate of 1.6%, share price volatility of 29.8% (share price volatility is calculated based on historical share prices over the most recent period commensurate with time to maturity)).
Dentsu Group Integrated Report 202169
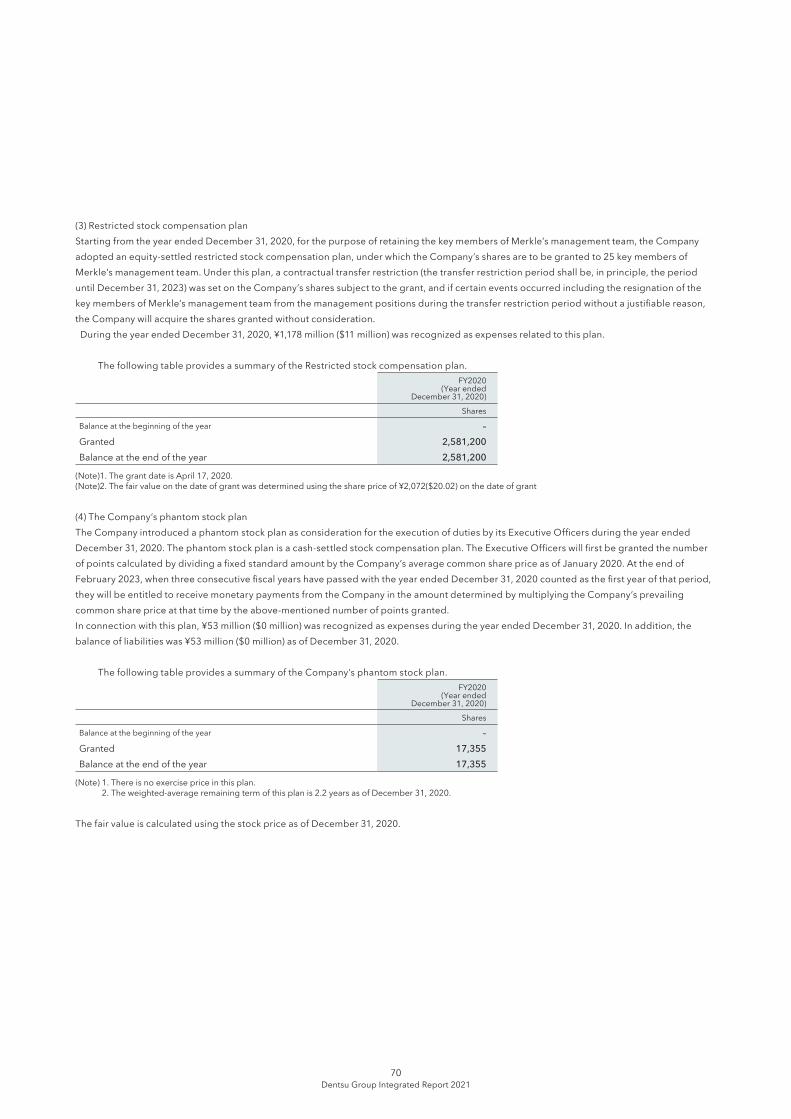
(3) Restricted stock compensation planStarting from the year ended December 31, 2020, for the purpose of retaining the key members of Merkle’s management team, the Company adopted an equity-settled restricted stock compensation plan, under which the Company’s shares are to be granted to 25 key members of Merkle’s management team. Under this plan, a contractual transfer restriction (the transfer restriction period shall be, in principle, the period until December 31, 2023) was set on the Company’s shares subject to the grant, and if certain events occurred including the resignation of the key members of Merkle’s management team from the management positions during the transfer restriction period without a justifiable reason, the Company will acquire the shares granted without consideration. During the year ended December 31, 2020, ¥1,178 million ($11 million) was recognized as expenses related to this plan.
The following table provides a summary of the Restricted stock compensation plan.FY2020
(Year ended December 31, 2020)
Shares
Balance at the beginning of the year –Granted 2,581,200 Balance at the end of the year 2,581,200
(Note)1. The grant date is April 17, 2020.(Note)2. The fair value on the date of grant was determined using the share price of ¥2,072($20.02) on the date of grant
(4) The Company’s phantom stock planThe Company introduced a phantom stock plan as consideration for the execution of duties by its Executive Officers during the year ended December 31, 2020. The phantom stock plan is a cash-settled stock compensation plan. The Executive Officers will first be granted the number of points calculated by dividing a fixed standard amount by the Company’s average common share price as of January 2020. At the end of February 2023, when three consecutive fiscal years have passed with the year ended December 31, 2020 counted as the first year of that period, they will be entitled to receive monetary payments from the Company in the amount determined by multiplying the Company’s prevailing common share price at that time by the above-mentioned number of points granted.In connection with this plan, ¥53 million ($0 million) was recognized as expenses during the year ended December 31, 2020. In addition, the balance of liabilities was ¥53 million ($0 million) as of December 31, 2020.
The following table provides a summary of the Company’s phantom stock plan.FY2020
(Year ended December 31, 2020)
Shares
Balance at the beginning of the year –Granted 17,355 Balance at the end of the year 17,355
(Note) 1. There is no exercise price in this plan. 2. The weighted-average remaining term of this plan is 2.2 years as of December 31, 2020.
The fair value is calculated using the stock price as of December 31, 2020.
Dentsu Group Integrated Report 202170
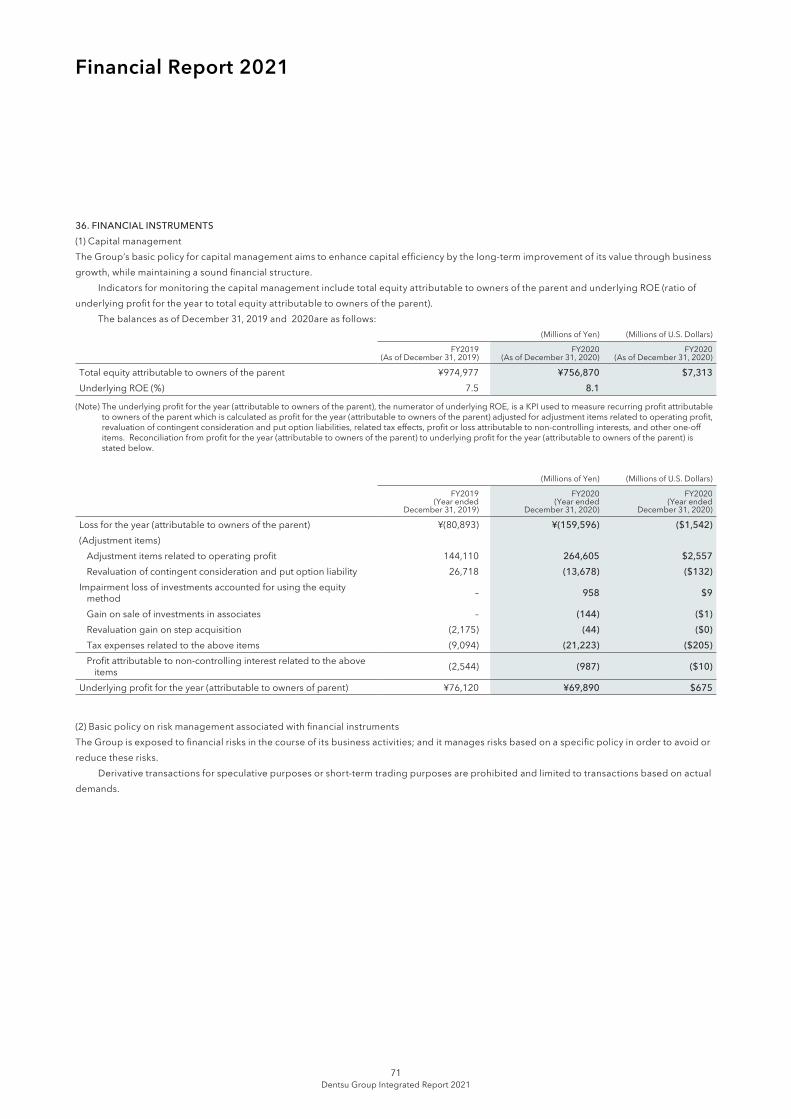
Financial Report 2021
36. FINANCIAL INSTRUMENTS(1) Capital managementThe Group’s basic policy for capital management aims to enhance capital efficiency by the long-term improvement of its value through business growth, while maintaining a sound financial structure. Indicators for monitoring the capital management include total equity attributable to owners of the parent and underlying ROE (ratio of underlying profit for the year to total equity attributable to owners of the parent). The balances as of December 31, 2019 and 2020are as follows:
(Millions of Yen) (Millions of U.S. Dollars)
FY2019(As of December 31, 2019)
FY2020(As of December 31, 2020)
FY2020(As of December 31, 2020)
Total equity attributable to owners of the parent ¥974,977 ¥756,870 $7,313Underlying ROE (%) 7.5 8.1
(Note) The underlying profit for the year (attributable to owners of the parent), the numerator of underlying ROE, is a KPI used to measure recurring profit attributable to owners of the parent which is calculated as profit for the year (attributable to owners of the parent) adjusted for adjustment items related to operating profit, revaluation of contingent consideration and put option liabilities, related tax effects, profit or loss attributable to non-controlling interests, and other one-off items. Reconciliation from profit for the year (attributable to owners of the parent) to underlying profit for the year (attributable to owners of the parent) is stated below.
(Millions of Yen) (Millions of U.S. Dollars)
FY2019(Year ended
December 31, 2019)
FY2020(Year ended
December 31, 2020)
FY2020(Year ended
December 31, 2020)
Loss for the year (attributable to owners of the parent) ¥(80,893) ¥(159,596) ($1,542)(Adjustment items)
Adjustment items related to operating profit 144,110 264,605 $2,557 Revaluation of contingent consideration and put option liability 26,718 (13,678) ($132)
Impairment loss of investments accounted for using the equity method – 958 $9
Gain on sale of investments in associates – (144) ($1)Revaluation gain on step acquisition (2,175) (44) ($0)Tax expenses related to the above items (9,094) (21,223) ($205)Profit attributable to non-controlling interest related to the above
items (2,544) (987) ($10)
Underlying profit for the year (attributable to owners of parent) ¥76,120 ¥69,890 $675
(2) Basic policy on risk management associated with financial instrumentsThe Group is exposed to financial risks in the course of its business activities; and it manages risks based on a specific policy in order to avoid or reduce these risks. Derivative transactions for speculative purposes or short-term trading purposes are prohibited and limited to transactions based on actual demands.
Dentsu Group Integrated Report 202171
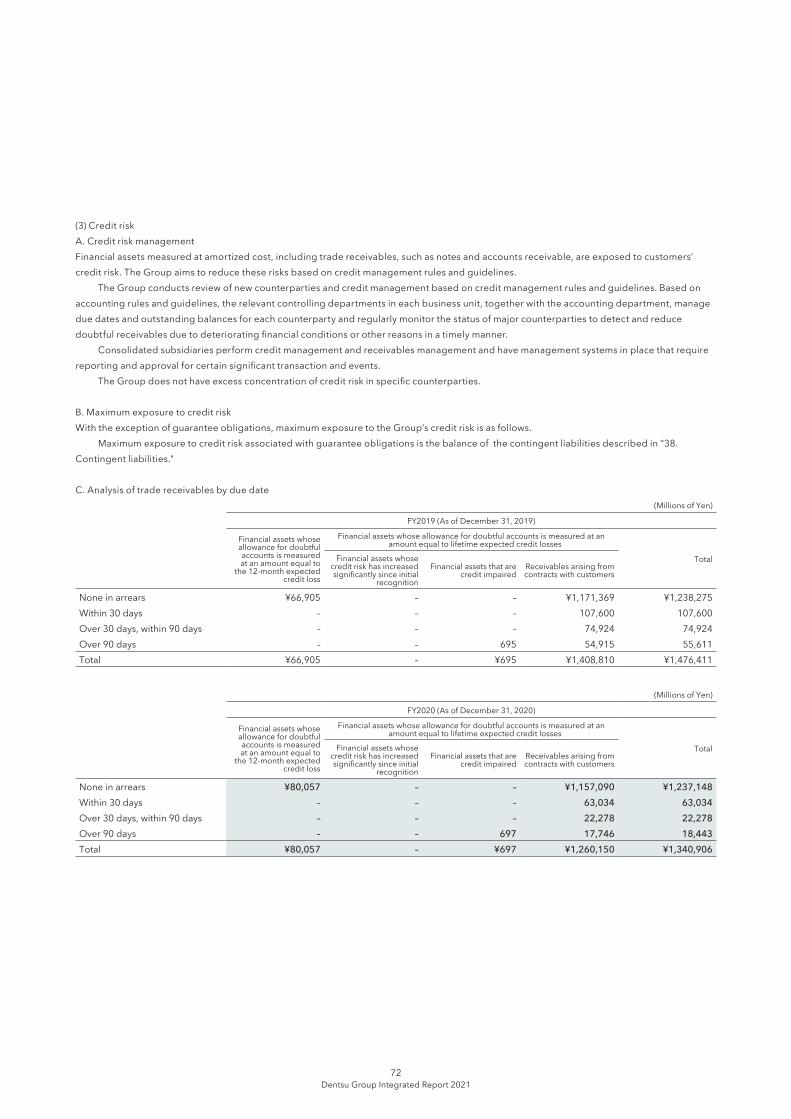
(3) Credit riskA. Credit risk managementFinancial assets measured at amortized cost, including trade receivables, such as notes and accounts receivable, are exposed to customers’ credit risk. The Group aims to reduce these risks based on credit management rules and guidelines. The Group conducts review of new counterparties and credit management based on credit management rules and guidelines. Based on accounting rules and guidelines, the relevant controlling departments in each business unit, together with the accounting department, manage due dates and outstanding balances for each counterparty and regularly monitor the status of major counterparties to detect and reduce doubtful receivables due to deteriorating financial conditions or other reasons in a timely manner. Consolidated subsidiaries perform credit management and receivables management and have management systems in place that require reporting and approval for certain significant transaction and events. The Group does not have excess concentration of credit risk in specific counterparties.
B. Maximum exposure to credit riskWith the exception of guarantee obligations, maximum exposure to the Group’s credit risk is as follows. Maximum exposure to credit risk associated with guarantee obligations is the balance of the contingent liabilities described in "38. Contingent liabilities."
C. Analysis of trade receivables by due date(Millions of Yen)
FY2019 (As of December 31, 2019)
Financial assets whose allowance for doubtful accounts is measured at an amount equal to
the 12-month expected credit loss
Financial assets whose allowance for doubtful accounts is measured at an amount equal to lifetime expected credit losses
TotalFinancial assets whose credit risk has increased significantly since initial
recognition
Financial assets that are credit impaired
Receivables arising from contracts with customers
None in arrears ¥66,905 – – ¥1,171,369 ¥1,238,275 Within 30 days – – – 107,600 107,600Over 30 days, within 90 days – – – 74,924 74,924Over 90 days – – 695 54,915 55,611Total ¥66,905 – ¥695 ¥1,408,810 ¥1,476,411
(Millions of Yen)
FY2020 (As of December 31, 2020)
Financial assets whose allowance for doubtful accounts is measured at an amount equal to
the 12-month expected credit loss
Financial assets whose allowance for doubtful accounts is measured at an amount equal to lifetime expected credit losses
TotalFinancial assets whose credit risk has increased significantly since initial
recognition
Financial assets that are credit impaired
Receivables arising from contracts with customers
None in arrears ¥80,057 – – ¥1,157,090 ¥1,237,148 Within 30 days – – – 63,034 63,034Over 30 days, within 90 days – – – 22,278 22,278Over 90 days – – 697 17,746 18,443Total ¥80,057 – ¥697 ¥1,260,150 ¥1,340,906
Dentsu Group Integrated Report 202172
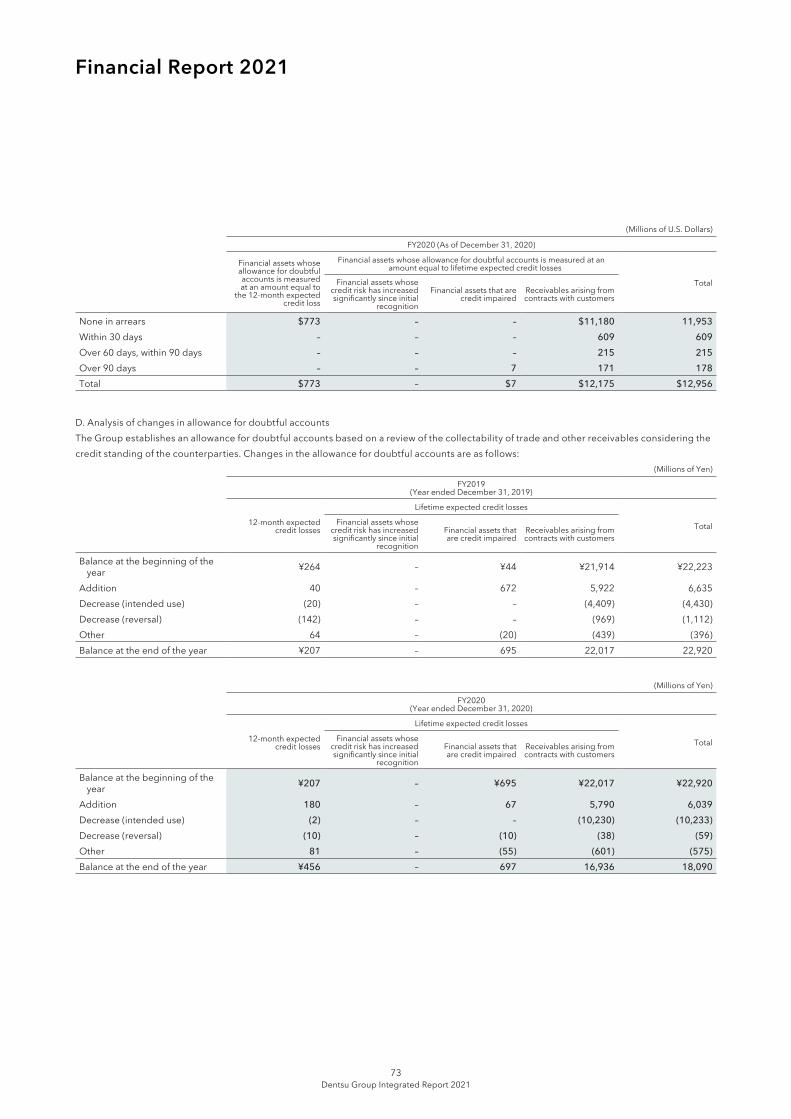
Financial Report 2021
(Millions of U.S. Dollars)
FY2020 (As of December 31, 2020)
Financial assets whose allowance for doubtful accounts is measured at an amount equal to
the 12-month expected credit loss
Financial assets whose allowance for doubtful accounts is measured at an amount equal to lifetime expected credit losses
TotalFinancial assets whose credit risk has increased significantly since initial
recognition
Financial assets that are credit impaired
Receivables arising from contracts with customers
None in arrears $773 – – $11,180 11,953Within 30 days – – – 609 609Over 60 days, within 90 days – – – 215 215Over 90 days – – 7 171 178Total $773 – $7 $12,175 $12,956
D. Analysis of changes in allowance for doubtful accountsThe Group establishes an allowance for doubtful accounts based on a review of the collectability of trade and other receivables considering the credit standing of the counterparties. Changes in the allowance for doubtful accounts are as follows:
(Millions of Yen)
FY2019(Year ended December 31, 2019)
12-month expected credit losses
Lifetime expected credit losses
TotalFinancial assets whose credit risk has increased significantly since initial
recognition
Financial assets that are credit impaired
Receivables arising from contracts with customers
Balance at the beginning of the year ¥264 – ¥44 ¥21,914 ¥22,223
Addition 40 – 672 5,922 6,635 Decrease (intended use) (20) – – (4,409) (4,430)Decrease (reversal) (142) – – (969) (1,112)Other 64 – (20) (439) (396)Balance at the end of the year ¥207 – 695 22,017 22,920
(Millions of Yen)
FY2020(Year ended December 31, 2020)
12-month expected credit losses
Lifetime expected credit losses
TotalFinancial assets whose credit risk has increased significantly since initial
recognition
Financial assets that are credit impaired
Receivables arising from contracts with customers
Balance at the beginning of the year ¥207 – ¥695 ¥22,017 ¥22,920
Addition 180 – 67 5,790 6,039 Decrease (intended use) (2) – – (10,230) (10,233)Decrease (reversal) (10) – (10) (38) (59)Other 81 – (55) (601) (575)Balance at the end of the year ¥456 – 697 16,936 18,090
Dentsu Group Integrated Report 202173
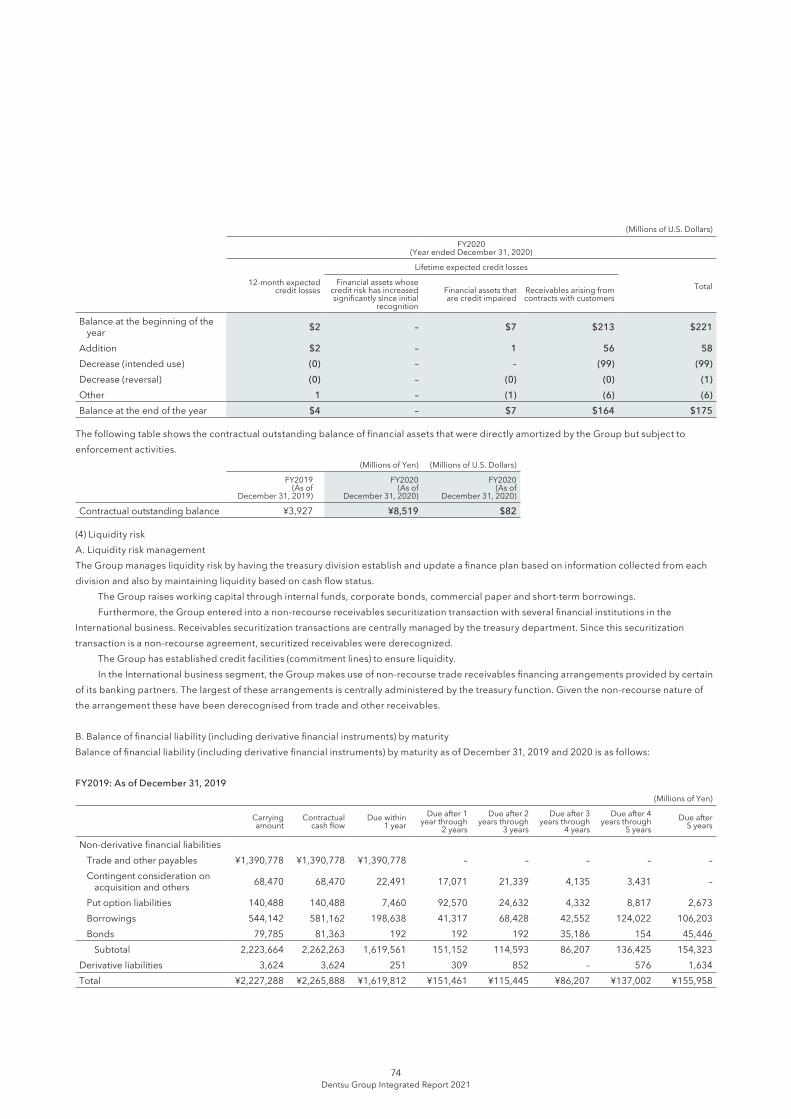
(Millions of U.S. Dollars)
FY2020(Year ended December 31, 2020)
12-month expected credit losses
Lifetime expected credit losses
TotalFinancial assets whose credit risk has increased significantly since initial
recognition
Financial assets that are credit impaired
Receivables arising from contracts with customers
Balance at the beginning of the year $2 – $7 $213 $221
Addition $2 – 1 56 58Decrease (intended use) (0) – – (99) (99)Decrease (reversal) (0) – (0) (0) (1)Other 1 – (1) (6) (6)Balance at the end of the year $4 – $7 $164 $175
The following table shows the contractual outstanding balance of financial assets that were directly amortized by the Group but subject to enforcement activities.
(Millions of Yen) (Millions of U.S. Dollars)
FY2019(As of
December 31, 2019)
FY2020(As of
December 31, 2020)
FY2020(As of
December 31, 2020)
Contractual outstanding balance ¥3,927 ¥8,519 $82
(4) Liquidity riskA. Liquidity risk managementThe Group manages liquidity risk by having the treasury division establish and update a finance plan based on information collected from each division and also by maintaining liquidity based on cash flow status. The Group raises working capital through internal funds, corporate bonds, commercial paper and short-term borrowings. Furthermore, the Group entered into a non-recourse receivables securitization transaction with several financial institutions in the International business. Receivables securitization transactions are centrally managed by the treasury department. Since this securitization transaction is a non-recourse agreement, securitized receivables were derecognized. The Group has established credit facilities (commitment lines) to ensure liquidity. In the International business segment, the Group makes use of non-recourse trade receivables financing arrangements provided by certain of its banking partners. The largest of these arrangements is centrally administered by the treasury function. Given the non-recourse nature of the arrangement these have been derecognised from trade and other receivables.
B. Balance of financial liability (including derivative financial instruments) by maturityBalance of financial liability (including derivative financial instruments) by maturity as of December 31, 2019 and 2020 is as follows:
FY2019: As of December 31, 2019(Millions of Yen)
Carrying amount
Contractual cash flow
Due within 1 year
Due after 1 year through
2 years
Due after 2 years through
3 years
Due after 3 years through
4 years
Due after 4 years through
5 yearsDue after
5 years
Non-derivative financial liabilitiesTrade and other payables ¥1,390,778 ¥1,390,778 ¥1,390,778 – – – – –Contingent consideration on
acquisition and others 68,470 68,470 22,491 17,071 21,339 4,135 3,431 –
Put option liabilities 140,488 140,488 7,460 92,570 24,632 4,332 8,817 2,673Borrowings 544,142 581,162 198,638 41,317 68,428 42,552 124,022 106,203Bonds 79,785 81,363 192 192 192 35,186 154 45,446
Subtotal 2,223,664 2,262,263 1,619,561 151,152 114,593 86,207 136,425 154,323Derivative liabilities 3,624 3,624 251 309 852 – 576 1,634Total ¥2,227,288 ¥2,265,888 ¥1,619,812 ¥151,461 ¥115,445 ¥86,207 ¥137,002 ¥155,958
Dentsu Group Integrated Report 202174
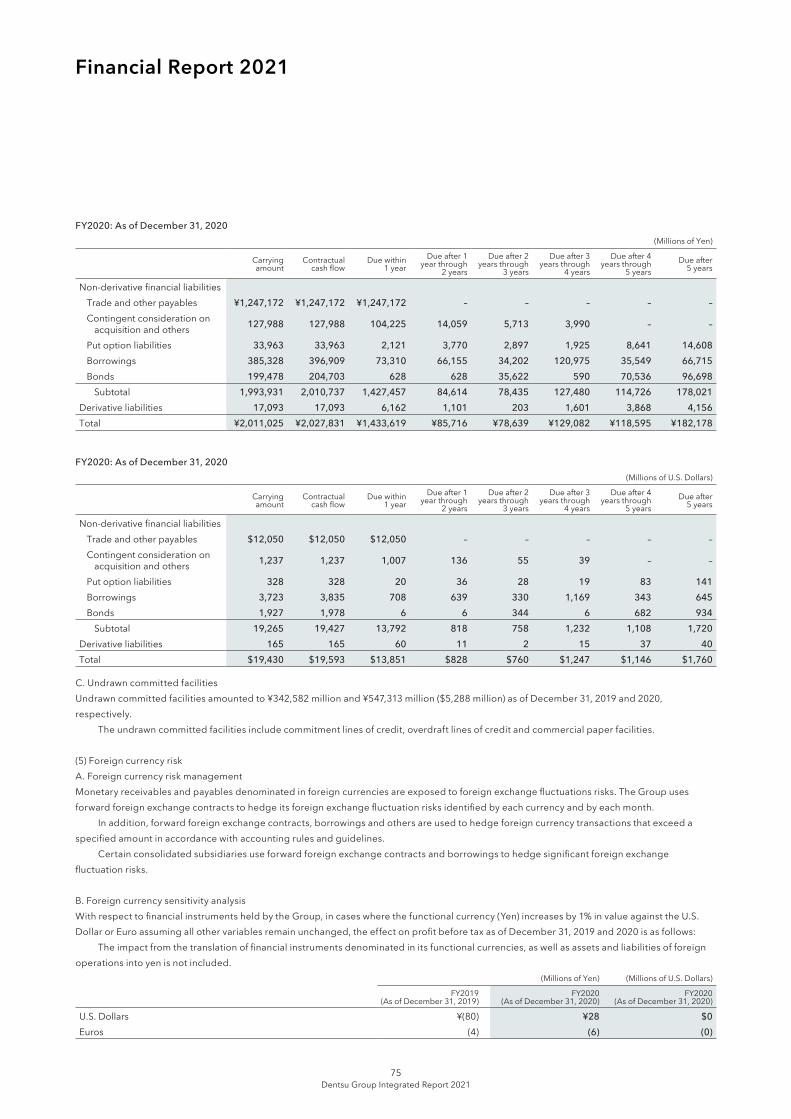
Financial Report 2021
FY2020: As of December 31, 2020(Millions of Yen)
Carrying amount
Contractual cash flow
Due within 1 year
Due after 1 year through
2 years
Due after 2 years through
3 years
Due after 3 years through
4 years
Due after 4 years through
5 yearsDue after
5 years
Non-derivative financial liabilitiesTrade and other payables ¥1,247,172 ¥1,247,172 ¥1,247,172 – – – – –Contingent consideration on
acquisition and others 127,988 127,988 104,225 14,059 5,713 3,990 – –
Put option liabilities 33,963 33,963 2,121 3,770 2,897 1,925 8,641 14,608Borrowings 385,328 396,909 73,310 66,155 34,202 120,975 35,549 66,715Bonds 199,478 204,703 628 628 35,622 590 70,536 96,698
Subtotal 1,993,931 2,010,737 1,427,457 84,614 78,435 127,480 114,726 178,021Derivative liabilities 17,093 17,093 6,162 1,101 203 1,601 3,868 4,156Total ¥2,011,025 ¥2,027,831 ¥1,433,619 ¥85,716 ¥78,639 ¥129,082 ¥118,595 ¥182,178
FY2020: As of December 31, 2020 (Millions of U.S. Dollars)
Carrying amount
Contractual cash flow
Due within 1 year
Due after 1 year through
2 years
Due after 2 years through
3 years
Due after 3 years through
4 years
Due after 4 years through
5 yearsDue after
5 years
Non-derivative financial liabilitiesTrade and other payables $12,050 $12,050 $12,050 – – – – –Contingent consideration on
acquisition and others 1,237 1,237 1,007 136 55 39 – –
Put option liabilities 328 328 20 36 28 19 83 141Borrowings 3,723 3,835 708 639 330 1,169 343 645Bonds 1,927 1,978 6 6 344 6 682 934
Subtotal 19,265 19,427 13,792 818 758 1,232 1,108 1,720Derivative liabilities 165 165 60 11 2 15 37 40Total $19,430 $19,593 $13,851 $828 $760 $1,247 $1,146 $1,760
C. Undrawn committed facilitiesUndrawn committed facilities amounted to ¥342,582 million and ¥547,313 million ($5,288 million) as of December 31, 2019 and 2020, respectively. The undrawn committed facilities include commitment lines of credit, overdraft lines of credit and commercial paper facilities.
(5) Foreign currency riskA. Foreign currency risk managementMonetary receivables and payables denominated in foreign currencies are exposed to foreign exchange fluctuations risks. The Group uses forward foreign exchange contracts to hedge its foreign exchange fluctuation risks identified by each currency and by each month. In addition, forward foreign exchange contracts, borrowings and others are used to hedge foreign currency transactions that exceed a specified amount in accordance with accounting rules and guidelines. Certain consolidated subsidiaries use forward foreign exchange contracts and borrowings to hedge significant foreign exchange fluctuation risks.
B. Foreign currency sensitivity analysisWith respect to financial instruments held by the Group, in cases where the functional currency (Yen) increases by 1% in value against the U.S. Dollar or Euro assuming all other variables remain unchanged, the effect on profit before tax as of December 31, 2019 and 2020 is as follows: The impact from the translation of financial instruments denominated in its functional currencies, as well as assets and liabilities of foreign operations into yen is not included.
(Millions of Yen) (Millions of U.S. Dollars)
FY2019(As of December 31, 2019)
FY2020(As of December 31, 2020)
FY2020(As of December 31, 2020)
U.S. Dollars ¥(80) ¥28 $0 Euros (4) (6) (0)
Dentsu Group Integrated Report 202175
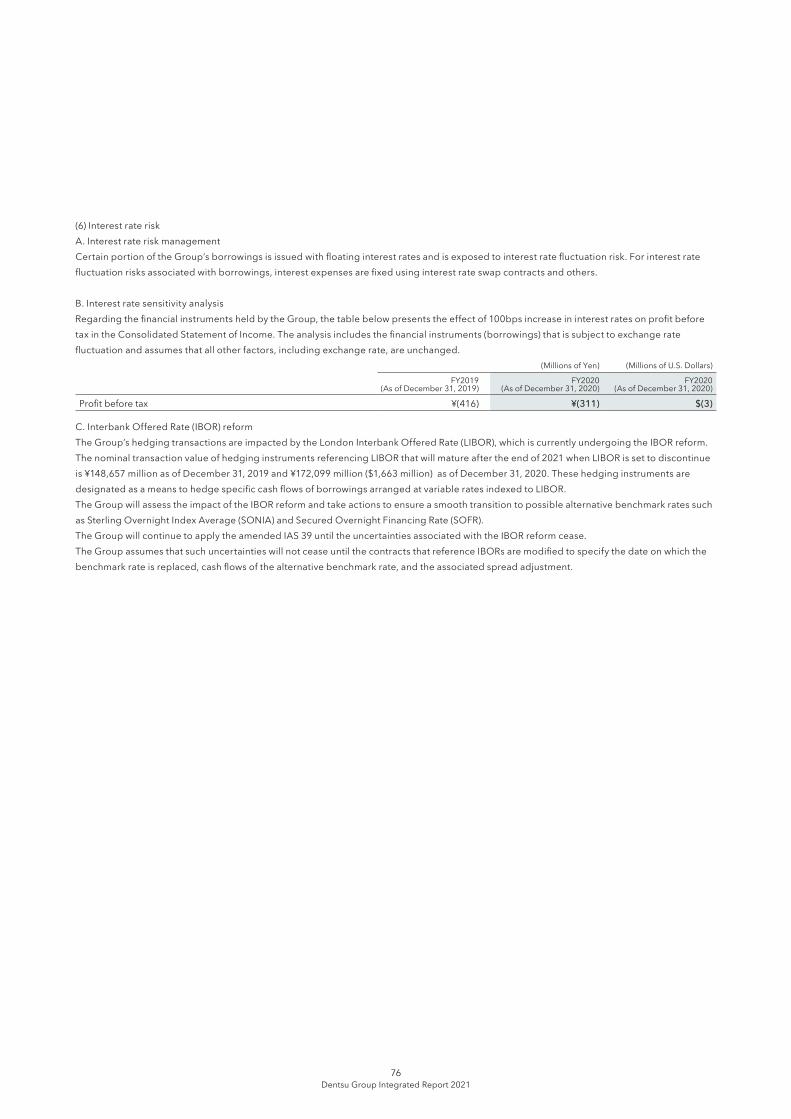
(6) Interest rate riskA. Interest rate risk managementCertain portion of the Group’s borrowings is issued with floating interest rates and is exposed to interest rate fluctuation risk. For interest rate fluctuation risks associated with borrowings, interest expenses are fixed using interest rate swap contracts and others.
B. Interest rate sensitivity analysisRegarding the financial instruments held by the Group, the table below presents the effect of 100bps increase in interest rates on profit before tax in the Consolidated Statement of Income. The analysis includes the financial instruments (borrowings) that is subject to exchange rate fluctuation and assumes that all other factors, including exchange rate, are unchanged.
(Millions of Yen) (Millions of U.S. Dollars)
FY2019(As of December 31, 2019)
FY2020(As of December 31, 2020)
FY2020(As of December 31, 2020)
Profit before tax ¥(416) ¥(311) $(3)
C. Interbank Offered Rate (IBOR) reformThe Group’s hedging transactions are impacted by the London Interbank Offered Rate (LIBOR), which is currently undergoing the IBOR reform. The nominal transaction value of hedging instruments referencing LIBOR that will mature after the end of 2021 when LIBOR is set to discontinue is ¥148,657 million as of December 31, 2019 and ¥172,099 million ($1,663 million) as of December 31, 2020. These hedging instruments are designated as a means to hedge specific cash flows of borrowings arranged at variable rates indexed to LIBOR.The Group will assess the impact of the IBOR reform and take actions to ensure a smooth transition to possible alternative benchmark rates such as Sterling Overnight Index Average (SONIA) and Secured Overnight Financing Rate (SOFR).The Group will continue to apply the amended IAS 39 until the uncertainties associated with the IBOR reform cease.The Group assumes that such uncertainties will not cease until the contracts that reference IBORs are modified to specify the date on which the benchmark rate is replaced, cash flows of the alternative benchmark rate, and the associated spread adjustment.
Dentsu Group Integrated Report 202176
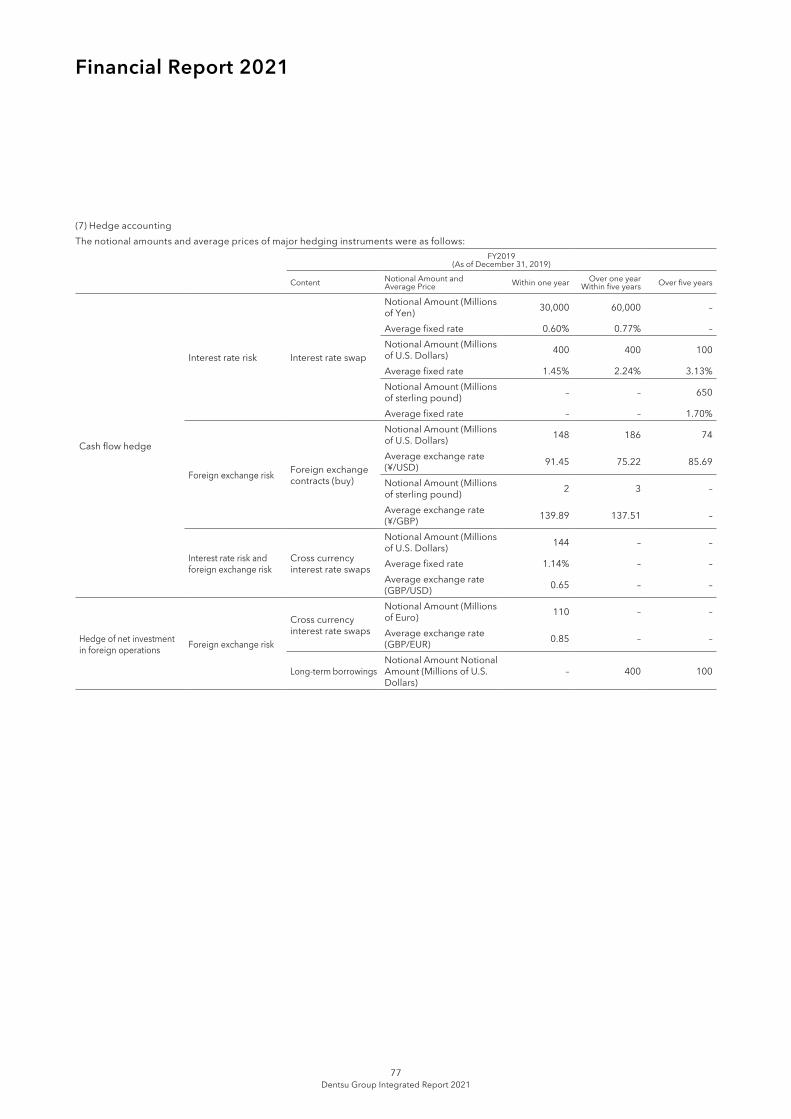
Financial Report 2021
(7) Hedge accountingThe notional amounts and average prices of major hedging instruments were as follows:
FY2019(As of December 31, 2019)
Content Notional Amount and Average Price Within one year Over one year
Within five years Over five years
Cash flow hedge
Interest rate risk Interest rate swap
Notional Amount (Millions of Yen) 30,000 60,000 –
Average fixed rate 0.60% 0.77% –Notional Amount (Millions of U.S. Dollars) 400 400 100
Average fixed rate 1.45% 2.24% 3.13%Notional Amount (Millions of sterling pound) – – 650
Average fixed rate – – 1.70%
Foreign exchange risk Foreign exchange contracts (buy)
Notional Amount (Millions of U.S. Dollars) 148 186 74
Average exchange rate (¥/USD) 91.45 75.22 85.69
Notional Amount (Millions of sterling pound) 2 3 –
Average exchange rate (¥/GBP) 139.89 137.51 –
Interest rate risk and foreign exchange risk
Cross currency interest rate swaps
Notional Amount (Millions of U.S. Dollars) 144 – –
Average fixed rate 1.14% – –Average exchange rate (GBP/USD) 0.65 – –
Hedge of net investment in foreign operations Foreign exchange risk
Cross currency interest rate swaps
Notional Amount (Millions of Euro) 110 – –
Average exchange rate (GBP/EUR) 0.85 – –
Long-term borrowingsNotional Amount Notional Amount (Millions of U.S. Dollars)
– 400 100
Dentsu Group Integrated Report 202177
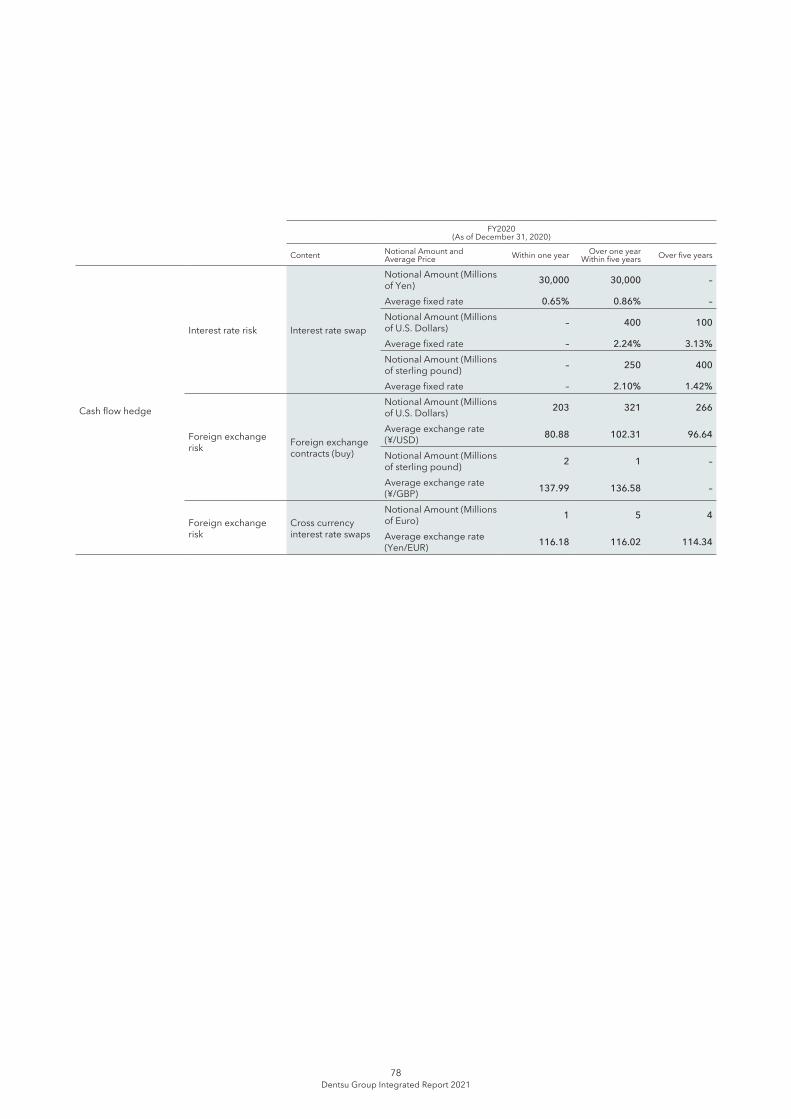
FY2020(As of December 31, 2020)
Content Notional Amount andAverage Price Within one year Over one year
Within five years Over five years
Cash flow hedge
Interest rate risk Interest rate swap
Notional Amount (Millions of Yen) 30,000 30,000 –
Average fixed rate 0.65% 0.86% –Notional Amount (Millions of U.S. Dollars) – 400 100
Average fixed rate – 2.24% 3.13%Notional Amount (Millions of sterling pound) – 250 400
Average fixed rate – 2.10% 1.42%
Foreign exchange risk Foreign exchange
contracts (buy)
Notional Amount (Millions of U.S. Dollars) 203 321 266
Average exchange rate (¥/USD) 80.88 102.31 96.64
Notional Amount (Millions of sterling pound) 2 1 –
Average exchange rate (¥/GBP) 137.99 136.58 –
Foreign exchange risk
Cross currency interest rate swaps
Notional Amount (Millions of Euro) 1 5 4
Average exchange rate (Yen/EUR) 116.18 116.02 114.34
Dentsu Group Integrated Report 202178
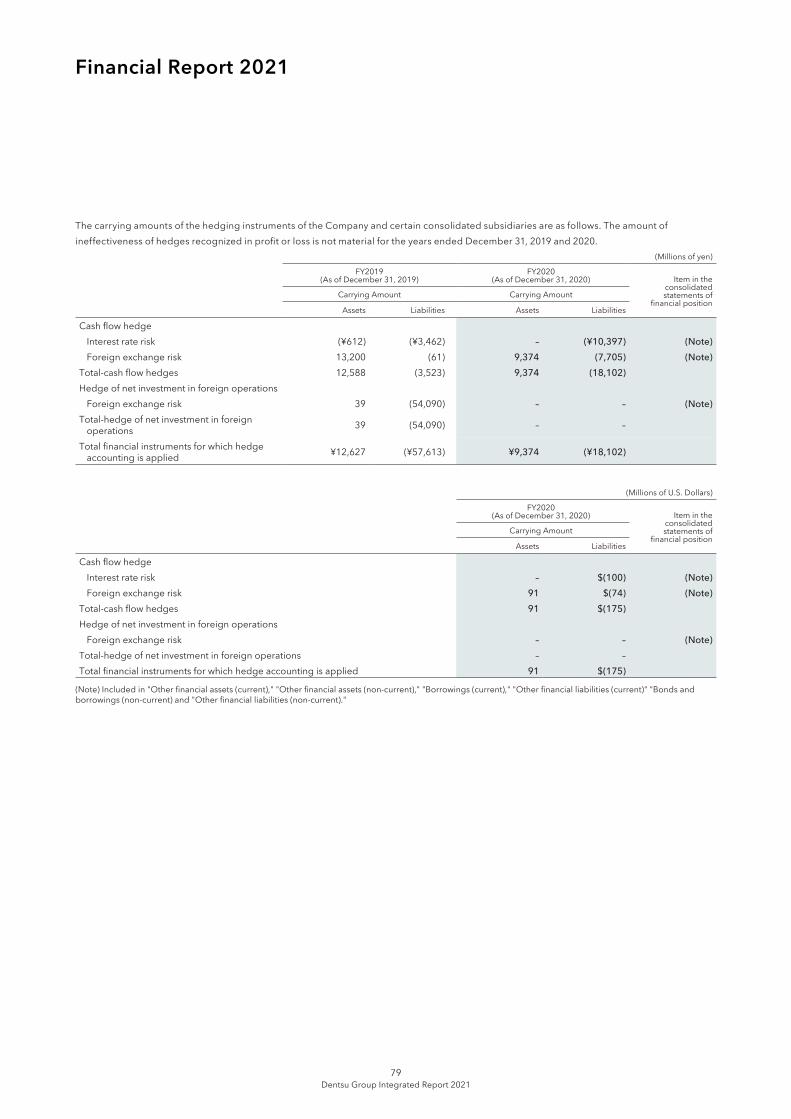
Financial Report 2021
The carrying amounts of the hedging instruments of the Company and certain consolidated subsidiaries are as follows. The amount of ineffectiveness of hedges recognized in profit or loss is not material for the years ended December 31, 2019 and 2020.
(Millions of yen)
FY2019(As of December 31, 2019)
FY2020(As of December 31, 2020) Item in the
consolidated statements of
financial positionCarrying Amount Carrying Amount
Assets Liabilities Assets Liabilities
Cash flow hedgeInterest rate risk (¥612) (¥3,462) – (¥10,397) (Note)Foreign exchange risk 13,200 (61) 9,374 (7,705) (Note)
Total-cash flow hedges 12,588 (3,523) 9,374 (18,102)Hedge of net investment in foreign operations
Foreign exchange risk 39 (54,090) – – (Note)Total-hedge of net investment in foreign
operations 39 (54,090) – –
Total financial instruments for which hedge accounting is applied ¥12,627 (¥57,613) ¥9,374 (¥18,102)
(Millions of U.S. Dollars)
FY2020(As of December 31, 2020) Item in the
consolidated statements of
financial positionCarrying Amount
Assets Liabilities
Cash flow hedgeInterest rate risk – $(100) (Note)Foreign exchange risk 91 $(74) (Note)
Total-cash flow hedges 91 $(175)Hedge of net investment in foreign operations
Foreign exchange risk – – (Note)Total-hedge of net investment in foreign operations – –Total financial instruments for which hedge accounting is applied 91 $(175)
(Note) Included in "Other financial assets (current)," "Other financial assets (non-current)," "Borrowings (current)," "Other financial liabilities (current)" "Bonds and borrowings (non-current) and "Other financial liabilities (non-current)."
Dentsu Group Integrated Report 202179
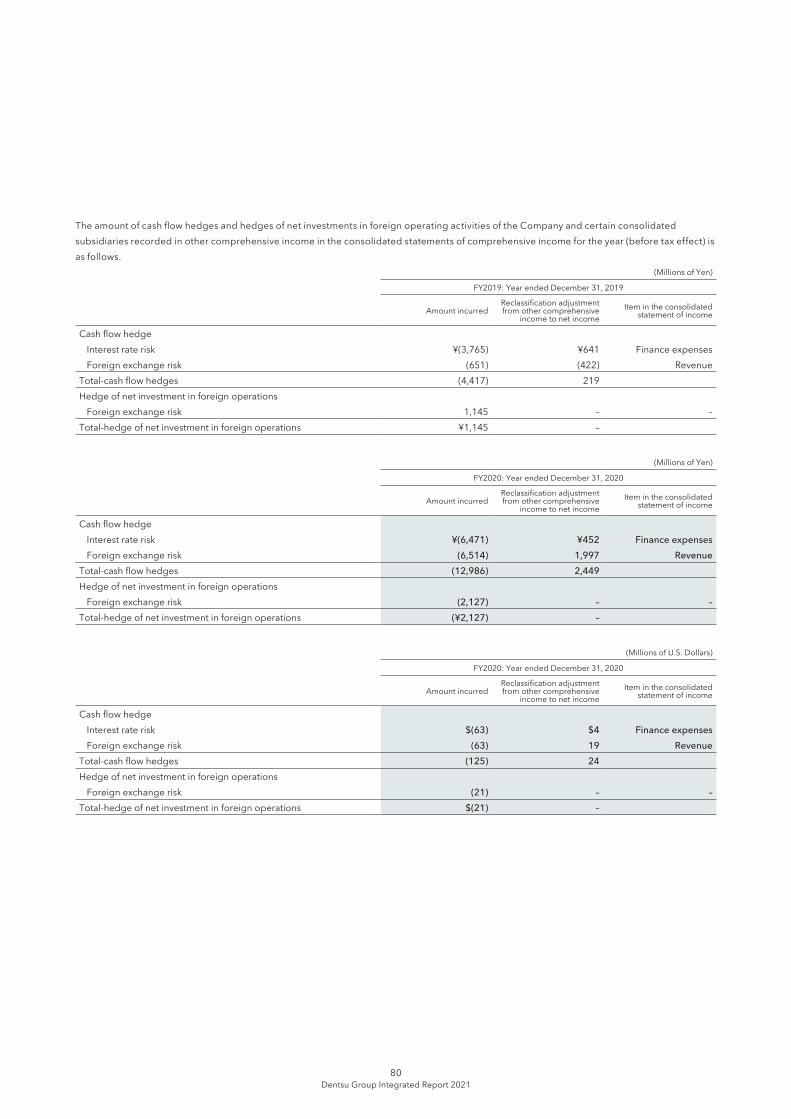
The amount of cash flow hedges and hedges of net investments in foreign operating activities of the Company and certain consolidated subsidiaries recorded in other comprehensive income in the consolidated statements of comprehensive income for the year (before tax effect) is as follows.
(Millions of Yen)
FY2019: Year ended December 31, 2019
Amount incurredReclassification adjustment from other comprehensive
income to net incomeItem in the consolidated
statement of income
Cash flow hedgeInterest rate risk ¥(3,765) ¥641 Finance expensesForeign exchange risk (651) (422) Revenue
Total-cash flow hedges (4,417) 219 Hedge of net investment in foreign operations
Foreign exchange risk 1,145 – –Total-hedge of net investment in foreign operations ¥1,145 –
(Millions of Yen)
FY2020: Year ended December 31, 2020
Amount incurredReclassification adjustment from other comprehensive
income to net incomeItem in the consolidated
statement of income
Cash flow hedgeInterest rate risk ¥(6,471) ¥452 Finance expensesForeign exchange risk (6,514) 1,997 Revenue
Total-cash flow hedges (12,986) 2,449 Hedge of net investment in foreign operations
Foreign exchange risk (2,127) – –Total-hedge of net investment in foreign operations (¥2,127) –
(Millions of U.S. Dollars)
FY2020: Year ended December 31, 2020
Amount incurredReclassification adjustment from other comprehensive
income to net incomeItem in the consolidated
statement of income
Cash flow hedgeInterest rate risk $(63) $4 Finance expensesForeign exchange risk (63) 19 Revenue
Total-cash flow hedges (125) 24 Hedge of net investment in foreign operations
Foreign exchange risk (21) – –Total-hedge of net investment in foreign operations $(21) –
Dentsu Group Integrated Report 202180
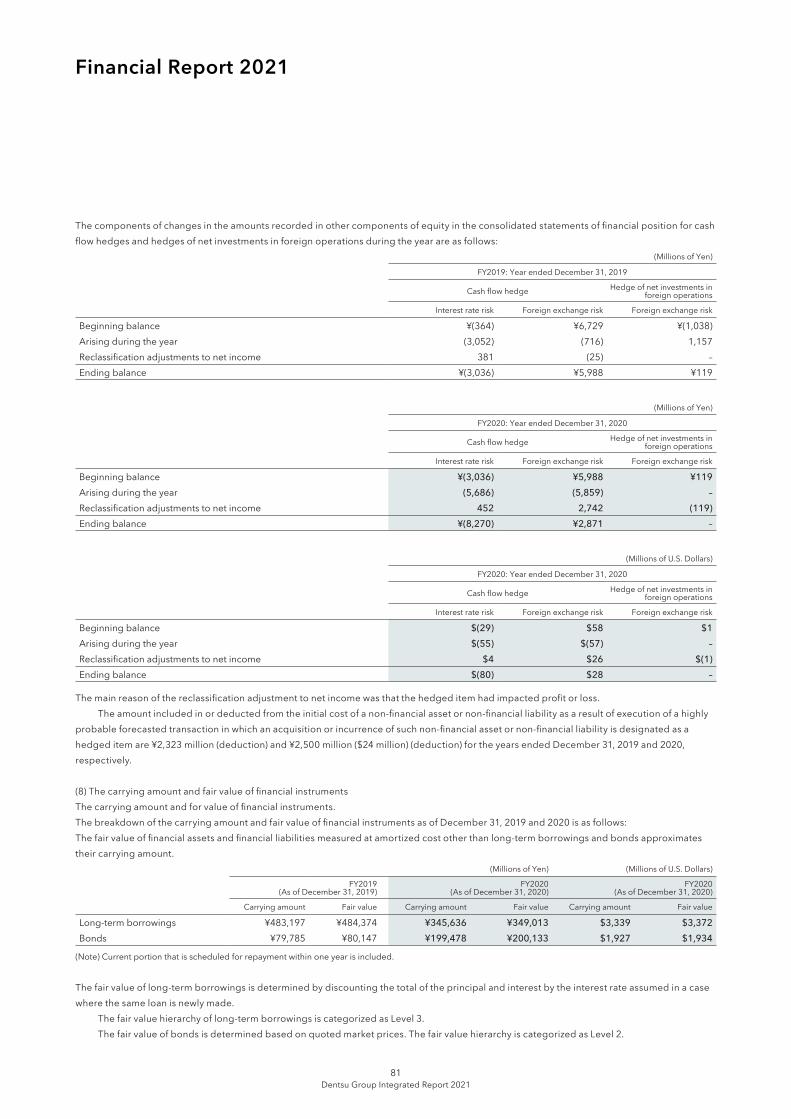
Financial Report 2021
The components of changes in the amounts recorded in other components of equity in the consolidated statements of financial position for cash flow hedges and hedges of net investments in foreign operations during the year are as follows:
(Millions of Yen)
FY2019: Year ended December 31, 2019
Cash flow hedge Hedge of net investments in foreign operations
Interest rate risk Foreign exchange risk Foreign exchange risk
Beginning balance ¥(364) ¥6,729 ¥(1,038)Arising during the year (3,052) (716) 1,157 Reclassification adjustments to net income 381 (25) –Ending balance ¥(3,036) ¥5,988 ¥119
(Millions of Yen)
FY2020: Year ended December 31, 2020
Cash flow hedge Hedge of net investments in foreign operations
Interest rate risk Foreign exchange risk Foreign exchange risk
Beginning balance ¥(3,036) ¥5,988 ¥119 Arising during the year (5,686) (5,859) –Reclassification adjustments to net income 452 2,742 (119)Ending balance ¥(8,270) ¥2,871 –
(Millions of U.S. Dollars)
FY2020: Year ended December 31, 2020
Cash flow hedge Hedge of net investments in foreign operations
Interest rate risk Foreign exchange risk Foreign exchange risk
Beginning balance $(29) $58 $1 Arising during the year $(55) $(57) –Reclassification adjustments to net income $4 $26 $(1)Ending balance $(80) $28 –
The main reason of the reclassification adjustment to net income was that the hedged item had impacted profit or loss. The amount included in or deducted from the initial cost of a non-financial asset or non-financial liability as a result of execution of a highly probable forecasted transaction in which an acquisition or incurrence of such non-financial asset or non-financial liability is designated as a hedged item are ¥2,323 million (deduction) and ¥2,500 million ($24 million) (deduction) for the years ended December 31, 2019 and 2020, respectively.
(8) The carrying amount and fair value of financial instrumentsThe carrying amount and for value of financial instruments.The breakdown of the carrying amount and fair value of financial instruments as of December 31, 2019 and 2020 is as follows:The fair value of financial assets and financial liabilities measured at amortized cost other than long-term borrowings and bonds approximates their carrying amount.
(Millions of Yen) (Millions of U.S. Dollars)
FY2019(As of December 31, 2019)
FY2020(As of December 31, 2020)
FY2020(As of December 31, 2020)
Carrying amount Fair value Carrying amount Fair value Carrying amount Fair value
Long-term borrowings ¥483,197 ¥484,374 ¥345,636 ¥349,013 $3,339 $3,372 Bonds ¥79,785 ¥80,147 ¥199,478 ¥200,133 $1,927 $1,934
(Note) Current portion that is scheduled for repayment within one year is included.
The fair value of long-term borrowings is determined by discounting the total of the principal and interest by the interest rate assumed in a case where the same loan is newly made. The fair value hierarchy of long-term borrowings is categorized as Level 3. The fair value of bonds is determined based on quoted market prices. The fair value hierarchy is categorized as Level 2.
Dentsu Group Integrated Report 202181
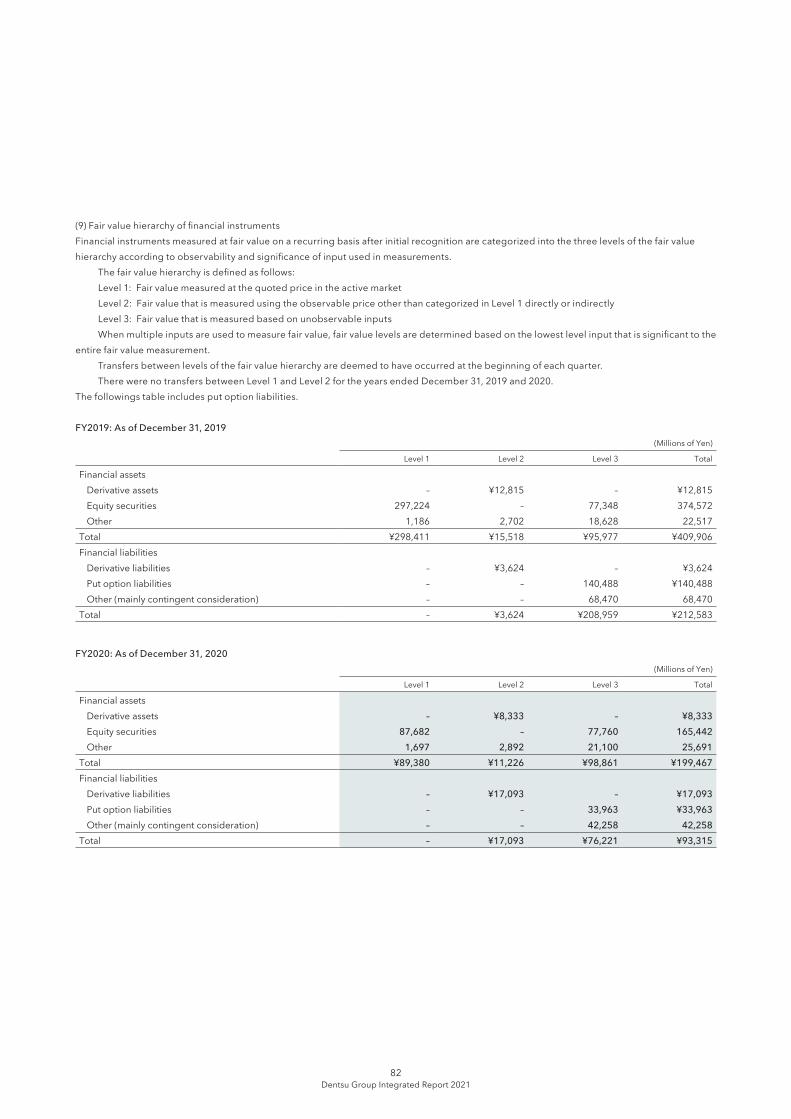
(9) Fair value hierarchy of financial instrumentsFinancial instruments measured at fair value on a recurring basis after initial recognition are categorized into the three levels of the fair value hierarchy according to observability and significance of input used in measurements. The fair value hierarchy is defined as follows: Level 1: Fair value measured at the quoted price in the active market Level 2: Fair value that is measured using the observable price other than categorized in Level 1 directly or indirectly Level 3: Fair value that is measured based on unobservable inputs When multiple inputs are used to measure fair value, fair value levels are determined based on the lowest level input that is significant to the entire fair value measurement. Transfers between levels of the fair value hierarchy are deemed to have occurred at the beginning of each quarter. There were no transfers between Level 1 and Level 2 for the years ended December 31, 2019 and 2020.The followings table includes put option liabilities.
FY2019: As of December 31, 2019(Millions of Yen)
Level 1 Level 2 Level 3 Total
Financial assetsDerivative assets – ¥12,815 – ¥12,815 Equity securities 297,224 – 77,348 374,572Other 1,186 2,702 18,628 22,517
Total ¥298,411 ¥15,518 ¥95,977 ¥409,906 Financial liabilities
Derivative liabilities – ¥3,624 – ¥3,624 Put option liabilities – – 140,488 ¥140,488 Other (mainly contingent consideration) – – 68,470 68,470
Total – ¥3,624 ¥208,959 ¥212,583
FY2020: As of December 31, 2020(Millions of Yen)
Level 1 Level 2 Level 3 Total
Financial assetsDerivative assets – ¥8,333 – ¥8,333 Equity securities 87,682 – 77,760 165,442Other 1,697 2,892 21,100 25,691
Total ¥89,380 ¥11,226 ¥98,861 ¥199,467 Financial liabilities
Derivative liabilities – ¥17,093 – ¥17,093 Put option liabilities – – 33,963 ¥33,963 Other (mainly contingent consideration) – – 42,258 42,258
Total – ¥17,093 ¥76,221 ¥93,315
Dentsu Group Integrated Report 202182
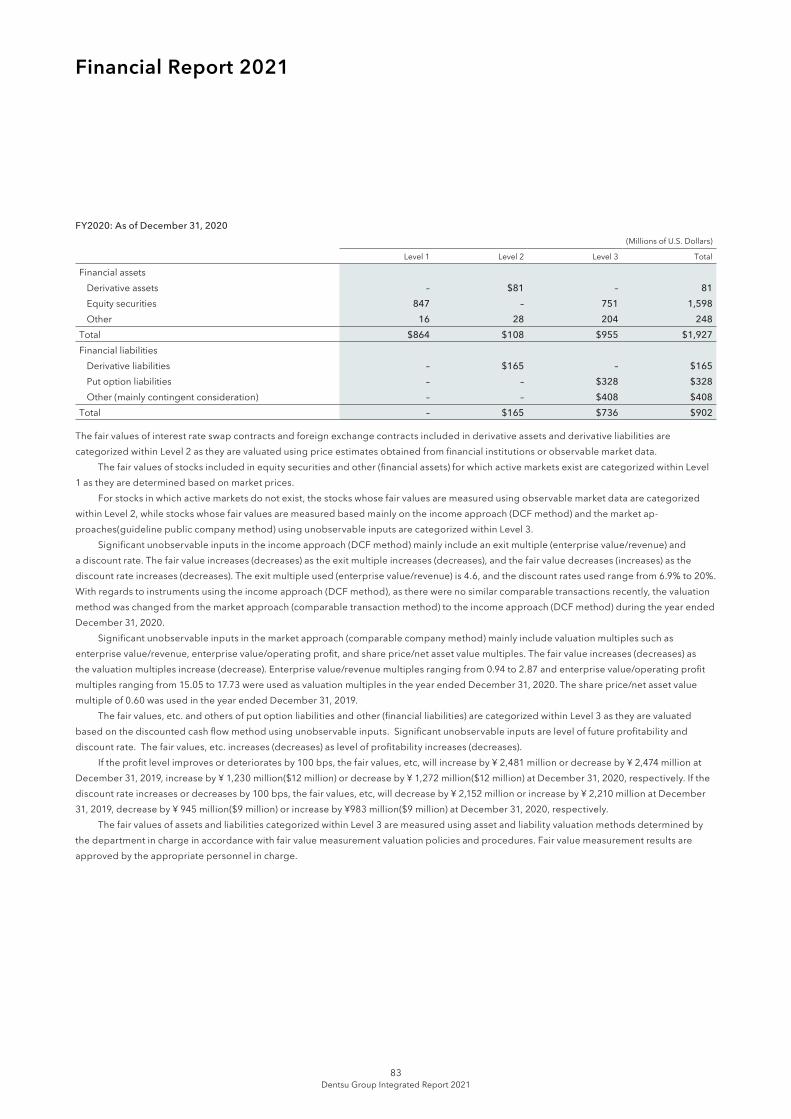
Financial Report 2021
FY2020: As of December 31, 2020 (Millions of U.S. Dollars)
Level 1 Level 2 Level 3 Total
Financial assetsDerivative assets – $81 – 81Equity securities 847 – 751 1,598Other 16 28 204 248
Total $864 $108 $955 $1,927 Financial liabilities
Derivative liabilities – $165 – $165 Put option liabilities – – $328 $328 Other (mainly contingent consideration) – – $408 $408
Total – $165 $736 $902
The fair values of interest rate swap contracts and foreign exchange contracts included in derivative assets and derivative liabilities are categorized within Level 2 as they are valuated using price estimates obtained from financial institutions or observable market data. The fair values of stocks included in equity securities and other (financial assets) for which active markets exist are categorized within Level 1 as they are determined based on market prices. For stocks in which active markets do not exist, the stocks whose fair values are measured using observable market data are categorized within Level 2, while stocks whose fair values are measured based mainly on the income approach (DCF method) and the market ap-proaches(guideline public company method) using unobservable inputs are categorized within Level 3. Significant unobservable inputs in the income approach (DCF method) mainly include an exit multiple (enterprise value/revenue) and a discount rate. The fair value increases (decreases) as the exit multiple increases (decreases), and the fair value decreases (increases) as the discount rate increases (decreases). The exit multiple used (enterprise value/revenue) is 4.6, and the discount rates used range from 6.9% to 20%. With regards to instruments using the income approach (DCF method), as there were no similar comparable transactions recently, the valuation method was changed from the market approach (comparable transaction method) to the income approach (DCF method) during the year ended December 31, 2020. Significant unobservable inputs in the market approach (comparable company method) mainly include valuation multiples such as enterprise value/revenue, enterprise value/operating profit, and share price/net asset value multiples. The fair value increases (decreases) as the valuation multiples increase (decrease). Enterprise value/revenue multiples ranging from 0.94 to 2.87 and enterprise value/operating profit multiples ranging from 15.05 to 17.73 were used as valuation multiples in the year ended December 31, 2020. The share price/net asset value multiple of 0.60 was used in the year ended December 31, 2019. The fair values, etc. and others of put option liabilities and other (financial liabilities) are categorized within Level 3 as they are valuated based on the discounted cash flow method using unobservable inputs. Significant unobservable inputs are level of future profitability and discount rate. The fair values, etc. increases (decreases) as level of profitability increases (decreases). If the profit level improves or deteriorates by 100 bps, the fair values, etc, will increase by ¥ 2,481 million or decrease by ¥ 2,474 million at December 31, 2019, increase by ¥ 1,230 million($12 million) or decrease by ¥ 1,272 million($12 million) at December 31, 2020, respectively. If the discount rate increases or decreases by 100 bps, the fair values, etc, will decrease by ¥ 2,152 million or increase by ¥ 2,210 million at December 31, 2019, decrease by ¥ 945 million($9 million) or increase by ¥983 million($9 million) at December 31, 2020, respectively. The fair values of assets and liabilities categorized within Level 3 are measured using asset and liability valuation methods determined by the department in charge in accordance with fair value measurement valuation policies and procedures. Fair value measurement results are approved by the appropriate personnel in charge.
Dentsu Group Integrated Report 202183
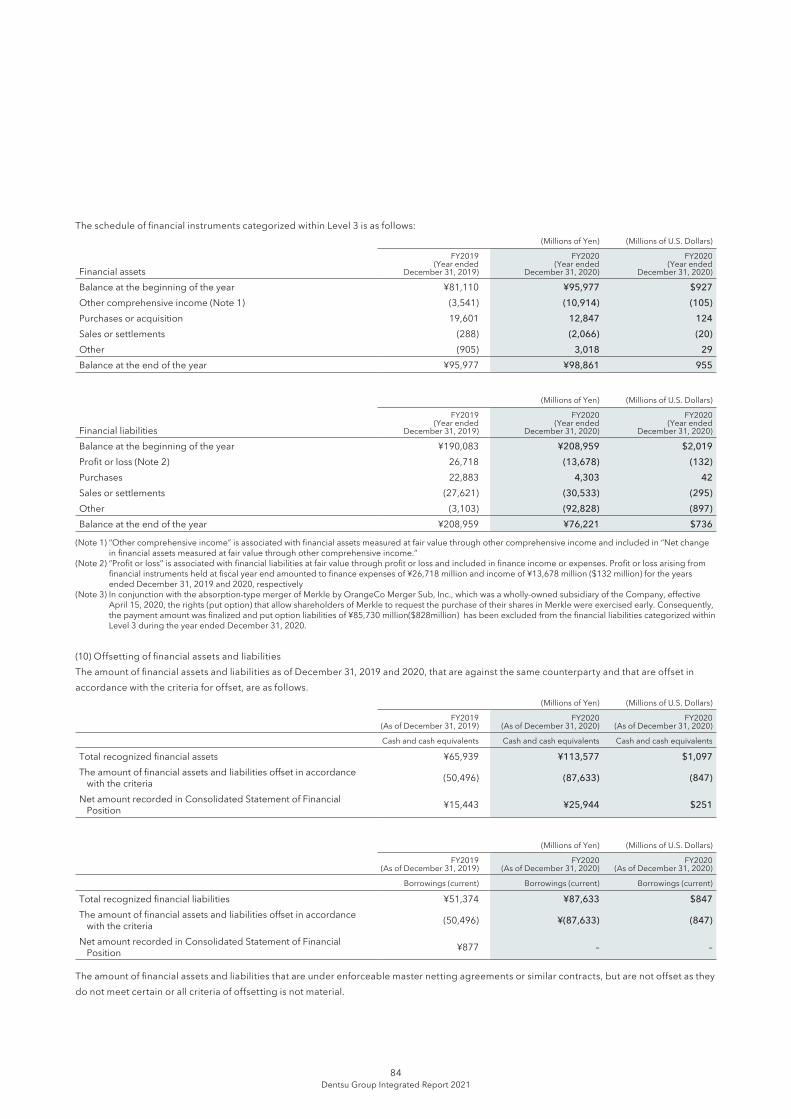
The schedule of financial instruments categorized within Level 3 is as follows:(Millions of Yen) (Millions of U.S. Dollars)
Financial assetsFY2019
(Year ended December 31, 2019)
FY2020(Year ended
December 31, 2020)
FY2020(Year ended
December 31, 2020)
Balance at the beginning of the year ¥81,110 ¥95,977 $927 Other comprehensive income (Note 1) (3,541) (10,914) (105)Purchases or acquisition 19,601 12,847 124 Sales or settlements (288) (2,066) (20)Other (905) 3,018 29 Balance at the end of the year ¥95,977 ¥98,861 955
(Millions of Yen) (Millions of U.S. Dollars)
Financial liabilitiesFY2019
(Year ended December 31, 2019)
FY2020(Year ended
December 31, 2020)
FY2020(Year ended
December 31, 2020)
Balance at the beginning of the year ¥190,083 ¥208,959 $2,019 Profit or loss (Note 2) 26,718 (13,678) (132)Purchases 22,883 4,303 42 Sales or settlements (27,621) (30,533) (295)Other (3,103) (92,828) (897)Balance at the end of the year ¥208,959 ¥76,221 $736
(Note 1) “Other comprehensive income” is associated with financial assets measured at fair value through other comprehensive income and included in “Net change in financial assets measured at fair value through other comprehensive income.”
(Note 2) “Profit or loss” is associated with financial liabilities at fair value through profit or loss and included in finance income or expenses. Profit or loss arising from financial instruments held at fiscal year end amounted to finance expenses of ¥26,718 million and income of ¥13,678 million ($132 million) for the years ended December 31, 2019 and 2020, respectively
(Note 3) In conjunction with the absorption-type merger of Merkle by OrangeCo Merger Sub, Inc., which was a wholly-owned subsidiary of the Company, effective April 15, 2020, the rights (put option) that allow shareholders of Merkle to request the purchase of their shares in Merkle were exercised early. Consequently, the payment amount was finalized and put option liabilities of ¥85,730 million($828million) has been excluded from the financial liabilities categorized within Level 3 during the year ended December 31, 2020.
(10) Offsetting of financial assets and liabilitiesThe amount of financial assets and liabilities as of December 31, 2019 and 2020, that are against the same counterparty and that are offset in accordance with the criteria for offset, are as follows.
(Millions of Yen) (Millions of U.S. Dollars)
FY2019(As of December 31, 2019)
FY2020(As of December 31, 2020)
FY2020(As of December 31, 2020)
Cash and cash equivalents Cash and cash equivalents Cash and cash equivalents
Total recognized financial assets ¥65,939 ¥113,577 $1,097 The amount of financial assets and liabilities offset in accordance
with the criteria (50,496) (87,633) (847)
Net amount recorded in Consolidated Statement of Financial Position ¥15,443 ¥25,944 $251
(Millions of Yen) (Millions of U.S. Dollars)
FY2019(As of December 31, 2019)
FY2020(As of December 31, 2020)
FY2020(As of December 31, 2020)
Borrowings (current) Borrowings (current) Borrowings (current)
Total recognized financial liabilities ¥51,374 ¥87,633 $847 The amount of financial assets and liabilities offset in accordance
with the criteria (50,496) ¥(87,633) (847)
Net amount recorded in Consolidated Statement of Financial Position ¥877 – –
The amount of financial assets and liabilities that are under enforceable master netting agreements or similar contracts, but are not offset as they do not meet certain or all criteria of offsetting is not material.
Dentsu Group Integrated Report 202184
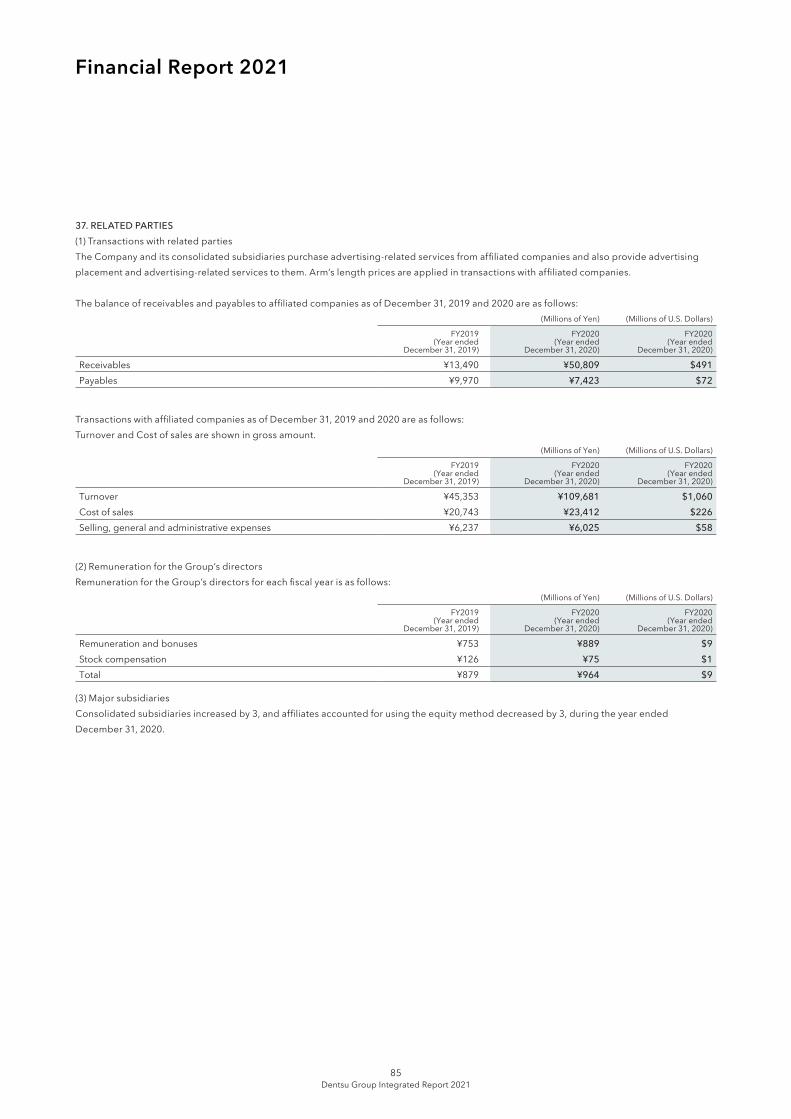
Financial Report 2021
37. RELATED PARTIES(1) Transactions with related partiesThe Company and its consolidated subsidiaries purchase advertising-related services from affiliated companies and also provide advertising placement and advertising-related services to them. Arm’s length prices are applied in transactions with affiliated companies.
The balance of receivables and payables to affiliated companies as of December 31, 2019 and 2020 are as follows:(Millions of Yen) (Millions of U.S. Dollars)
FY2019(Year ended
December 31, 2019)
FY2020(Year ended
December 31, 2020)
FY2020(Year ended
December 31, 2020)
Receivables ¥13,490 ¥50,809 $491 Payables ¥9,970 ¥7,423 $72
Transactions with affiliated companies as of December 31, 2019 and 2020 are as follows:Turnover and Cost of sales are shown in gross amount.
(Millions of Yen) (Millions of U.S. Dollars)
FY2019(Year ended
December 31, 2019)
FY2020(Year ended
December 31, 2020)
FY2020(Year ended
December 31, 2020)
Turnover ¥45,353 ¥109,681 $1,060 Cost of sales ¥20,743 ¥23,412 $226 Selling, general and administrative expenses ¥6,237 ¥6,025 $58
(2) Remuneration for the Group’s directorsRemuneration for the Group’s directors for each fiscal year is as follows:
(Millions of Yen) (Millions of U.S. Dollars)
FY2019(Year ended
December 31, 2019)
FY2020(Year ended
December 31, 2020)
FY2020(Year ended
December 31, 2020)
Remuneration and bonuses ¥753 ¥889 $9 Stock compensation ¥126 ¥75 $1 Total ¥879 ¥964 $9
(3) Major subsidiariesConsolidated subsidiaries increased by 3, and affiliates accounted for using the equity method decreased by 3, during the year ended December 31, 2020.
Dentsu Group Integrated Report 202185
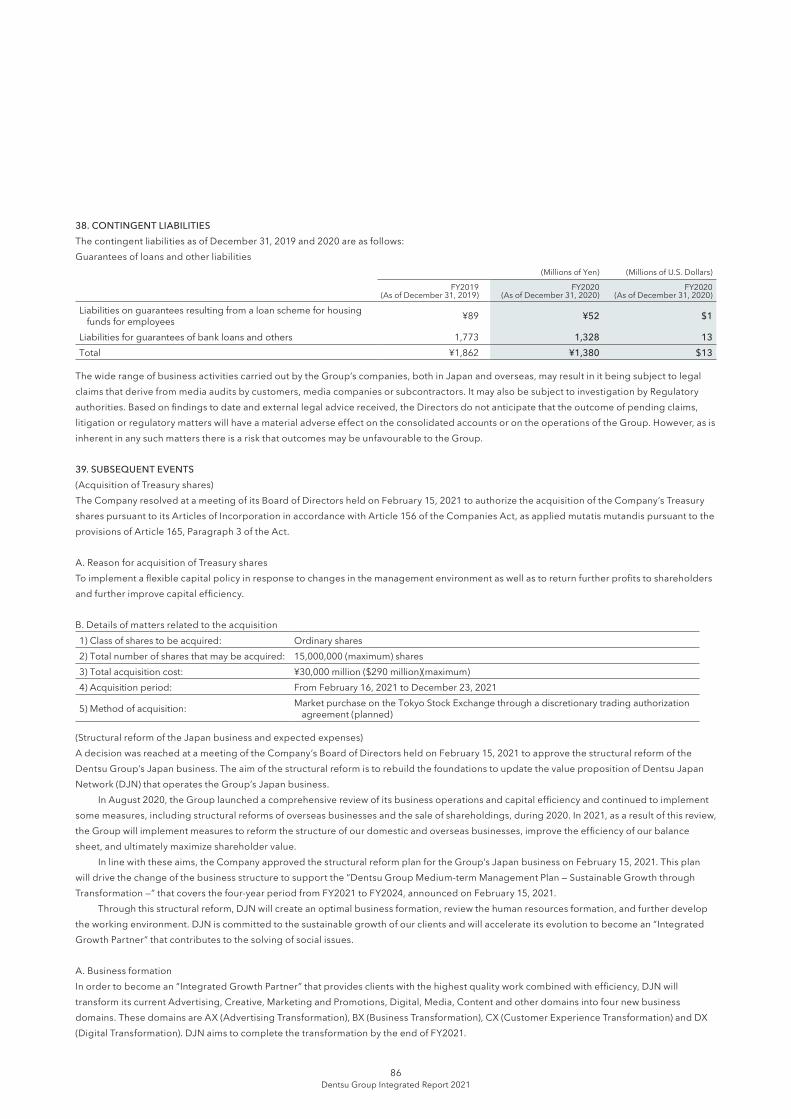
38. CONTINGENT LIABILITIESThe contingent liabilities as of December 31, 2019 and 2020 are as follows:Guarantees of loans and other liabilities
(Millions of Yen) (Millions of U.S. Dollars)
FY2019(As of December 31, 2019)
FY2020(As of December 31, 2020)
FY2020(As of December 31, 2020)
Liabilities on guarantees resulting from a loan scheme for housing funds for employees ¥89 ¥52 $1
Liabilities for guarantees of bank loans and others 1,773 1,328 13Total ¥1,862 ¥1,380 $13
The wide range of business activities carried out by the Group’s companies, both in Japan and overseas, may result in it being subject to legal claims that derive from media audits by customers, media companies or subcontractors. It may also be subject to investigation by Regulatory authorities. Based on findings to date and external legal advice received, the Directors do not anticipate that the outcome of pending claims, litigation or regulatory matters will have a material adverse effect on the consolidated accounts or on the operations of the Group. However, as is inherent in any such matters there is a risk that outcomes may be unfavourable to the Group.
39. SUBSEQUENT EVENTS(Acquisition of Treasury shares)The Company resolved at a meeting of its Board of Directors held on February 15, 2021 to authorize the acquisition of the Company’s Treasury shares pursuant to its Articles of Incorporation in accordance with Article 156 of the Companies Act, as applied mutatis mutandis pursuant to the provisions of Article 165, Paragraph 3 of the Act.
A. Reason for acquisition of Treasury sharesTo implement a flexible capital policy in response to changes in the management environment as well as to return further profits to shareholders and further improve capital efficiency.
B. Details of matters related to the acquisition1) Class of shares to be acquired: Ordinary shares2) Total number of shares that may be acquired: 15,000,000 (maximum) shares3) Total acquisition cost: ¥30,000 million ($290 million)(maximum) 4) Acquisition period: From February 16, 2021 to December 23, 2021
5) Method of acquisition: Market purchase on the Tokyo Stock Exchange through a discretionary trading authorization agreement (planned)
(Structural reform of the Japan business and expected expenses)A decision was reached at a meeting of the Company’s Board of Directors held on February 15, 2021 to approve the structural reform of the Dentsu Group’s Japan business. The aim of the structural reform is to rebuild the foundations to update the value proposition of Dentsu Japan Network (DJN) that operates the Group’s Japan business. In August 2020, the Group launched a comprehensive review of its business operations and capital efficiency and continued to implement some measures, including structural reforms of overseas businesses and the sale of shareholdings, during 2020. In 2021, as a result of this review, the Group will implement measures to reform the structure of our domestic and overseas businesses, improve the efficiency of our balance sheet, and ultimately maximize shareholder value. In line with these aims, the Company approved the structural reform plan for the Group’s Japan business on February 15, 2021. This plan will drive the change of the business structure to support the “Dentsu Group Medium-term Management Plan — Sustainable Growth through Transformation —” that covers the four-year period from FY2021 to FY2024, announced on February 15, 2021. Through this structural reform, DJN will create an optimal business formation, review the human resources formation, and further develop the working environment. DJN is committed to the sustainable growth of our clients and will accelerate its evolution to become an “Integrated Growth Partner” that contributes to the solving of social issues.
A. Business formationIn order to become an “Integrated Growth Partner” that provides clients with the highest quality work combined with efficiency, DJN will transform its current Advertising, Creative, Marketing and Promotions, Digital, Media, Content and other domains into four new business domains. These domains are AX (Advertising Transformation), BX (Business Transformation), CX (Customer Experience Transformation) and DX (Digital Transformation). DJN aims to complete the transformation by the end of FY2021.
Dentsu Group Integrated Report 202186
Financial Report 2021
·AX: Advertising transformation domain to maximize the sophistication and efficiency of advertising ·BX: Business transformation domain to support the business transformation of client companies ·CX: Customer experience transformation domain to design and deliver the optimum customer experience ·DX: Digital transformation domain to facilitate transformation of the marketing infrastructure In order to enhance the value of the four new business domains and to bolster the competitiveness of DJN by maximizing the strength of individual companies, corporate functions will be optimized to each of the four groups (the AX group, BX group, CX group and DX group), in terms of expertise and synergy generation, which will cover a establishment of a virtual organization. In addition, DJN aims to rebuild the platform business to support these four business domains and establish a new company with the aim of more enhanced and efficient DJN-wide corporate functions.
B. Human resources formationDJN will develop an optimal human resources formation within the Group to foster an environment in which diverse human resources who are aiming for business growth and contribution to society and willing to change and continue to grow are able to gather together and flourish. To this end, DJN will consider a lot of initiatives including considering reassigning human resources in terms of expertise and synergy generation and the implementation of a review of its human resources recruitment strategy with an eye on the personnel needed for new growth. In addition, as measures to support the pursuit of a variety of career opportunities, DJN will consider multiple measures for supporting employees’ growth in line with the business formation changes and voluntary early retirement programs for supporting employees who seek new careers. As a step toward this optimization, Dentsu Inc. has already implemented a voluntary early retirement program linked to the provision of new career options to employees in FY2020, and other measures will be implemented during FY2021. DJN companies will announce these implementations as necessary when the details have been finalized.
C. Working environment developmentWith the Dentsu Headquarters Building in Shiodome, Tokyo as its core business base, DJN will evolve it into a place where each company can connect with each other, driving revenue synergies and new business opportunities. By arranging the office and shared spaces of each DJN company under a design suitable for a new way of working, DJN will reduce fixed costs and at the same time create an environment where employees can work in a more lively and efficient manner. As part of the work style reforms we have been conducting since 2017, the Group has been improving the office and IT environment in conjunction with promoting personnel measures. Furthermore, with regard to COVID-19, we have responded swiftly to the ever-changing social environment, such as the transition to a remote work system at an early stage and office design changes. This time, we will further evolve the office environment from the viewpoint of business emergence and efficient working styles. Although the plan is scheduled to be completed by the end of FY2024, we will continue to evolve the working experience for our people by responding swiftly to the changes in the social environment.
Effect of the event on consolidated profit or lossThe total cost of the structural reform of the Group’s Japan business is estimated to be approximately ¥50,000 million($483 million). Of this amount, approximately ¥24,000 million($232 million) was already recorded as expenses related to the voluntary early retirement program in FY2020, ¥23,000 million($222 million) will be used in FY2021, and the remaining ¥3,000 million($29 million) will be allocated to FY2022 and beyond. It is expected that the costs for FY2021 will be related to the voluntary early retirement program, expenses related to business and organizational enhancement, and expenses related to working environment development. Compared to FY2019, an average annual cost reduction of approximately 21,000 million yen from FY2022 onward is anticipated as an effect of the structural reform of the Group’s Japan business.
By steadily implementing these structural reform measures for the Japan business, the Group aims to realize the change of the business structure that underpins growth, achieve the medium-term management plan, and further improve corporate value.
(Sale of fixed assets)The Company convened a meeting of its Board of Directors on March 23, 2021, at which it resolved to sell some of its fixed assets to a third party, and entered into an agreement for the sale on March 24, 2021.
A. Reason for transfer of fixed assetsThe sales of some fixed assets held in the Japan business segment is aimed at improving capital efficiency, further strengthening the financial structure, and securing funds to invest for growth.
Dentsu Group Integrated Report 202187
B. Details, locations, and current usage of the assets to be transferred1. Komazawa (Facility name: Dentsu Hasseien) ·Land: 27,544.70 m2 ·Buildings (total of four buildings): 4,515.27 m2 ·Location: 1-919 and others, Komazawa, Setagaya-ku, Tokyo ·Current usage: Being used as an athletic facility and a garden
2. Kamakura (Facility name: Dentsu Kamakura Training Center) ·Land: 14,034.31 m2 ·Buildings (total of two buildings): 2,691.35 m2 ·Location: 3-1340 and others, Omachi, Kamakura City, Kanagawa Prefecture ·Current usage: Being used as a training center
C. Outline of transfereeThe transferee is a Japanese corporation (financial business / real estate business entity located in Tokyo). There is no capital or personal relationship between the Company and the transferee, and the transferee does not fall under the category of a related party of the Company.
D. Transfer scheduleThe Company plans to transfer the two above-mentioned fixed assets on the same date.1. Board of Directors resolution date: March 23, 20212. Contract conclusion date: March 24, 20213. Property handover date: April 30, 2021
E. Monetary impactDue to the transfer of the above two properties, the Company plans to record a gain on sales of fixed assets of approximately ¥30,000 million($290 million) in the second quarter of FY2021.
Dentsu Group Integrated Report 202188
Financial Report 2021
Dentsu Group Integrated Report 202189
Dentsu Group Integrated Report 202190
Financial Report 2021
Dentsu Group Integrated Report 202191