Embed Size (px)
Citation preview

Financial
Projections
Guide
Simple Steps for Starting Your Business®


This guide was created to accompany the SCORE Financial
Projections Template, which is part of the Simple Steps for
Starting Your Business® program.
More information about the program can be found here:
http://www.score.org/Simple_Steps_for_Starting
You can find PDFs of all of the presentations and handouts,
including this guide and the Financial Projections Template, on
the participant page:
http://www.score.org/startyourbusiness
Email [email protected] with questions or comments.
This guide is based on a similar document created by Bill McCabe of
the Port Charlotte SCORE chapter. Thank you to Mr. McCabe and
all volunteers who spend their time educating SCORE clients.

Contents Welcome ................................................................................................................................. 5
Important Notes .................................................................................................................... 6
Tabs .......................................................................................................................................... 7
Directions ........................................................................................................................... 8
Starting Point ..................................................................................................................... 9
Payroll ................................................................................................................................ 15
Sales Forecast .................................................................................................................. 18
Additional Inputs ............................................................................................................. 22
Monthly Operating Expenses ....................................................................................... 26
Cash Flow ......................................................................................................................... 30
Income Statement ........................................................................................................... 32
Balance Sheet ................................................................................................................... 34
Other Helpful Tabs ............................................................................................................. 35
Glossary ................................................................................................................................. 36

Welcome
Financial forecasting can be one of the most intimidating parts of starting a
business. If you are dreading this part of the process – RELAX! We’ve developed
this guide with you in mind. And the best
part is: you can meet with a SCORE
mentor for one-on-one guidance.
Here are some tips for low-stress
completion of this financial projections
template:
1. Write the numbers into this guide
first (in pencil!), before copying them
into the Excel spreadsheet.
2. Take some MS Excel training before
using the spreadsheet:
http://office.microsoft.com/en-
us/training/microsoft-excel-training-
curriculum-guide-FX102828216.aspx
3. Save a blank “master” version of the Financial Projections Template, just in
case.
4. When you don’t know a word, refer to the glossary. If there is something
that’s not in there, ask your mentor or the instructor. There is space for
you to add additional definitions.
5. Remember that it’s normal to create multiple versions. Don’t worry about
getting it “wrong.” Initially, you should strive to learn how to use the
Template, rather than worrying about the detailed accuracy of your
assumptions. Your SCORE mentor can advise you on how to determine
the standard assumptions for the type of business you want to open.
Tip:
When you receive your copy of the
SCORE Financial Projections Template,
save a copy under your business name and
label it as version 1 (e.g. WidgetsCo-
V1.xls), before you enter your data. This
will enable you to go back to a clean
original in case something goes wrong.
As you make changes, “save as” different
versions so you can go back to the latest
version if you need to.

Important Notes
Accept the fact that you cannot predict the results of future events
accurately, so just make your best estimates. Fill in the requested
information after researching each item. The numbers should be based on the
plan you have developed so far. You may be able to come up with accurate
numbers for some items. Others will be best guesses.
The forecast you will generate from the data in this workbook will be
for the first 36 months of the existence of your business, which may not
correspond to a calendar year. For example, if your business were to open its
doors on July 1st, the forecast for months 1-12 would be for July through June of
the following calendar year.
With adjustment, this template can be used by an ongoing business
making plans for the future. If this is your situation, bring that fact to the
attention of your instructor or mentor.
Once you have transferred data you collected in this guide to the Excel
spreadsheet, the spreadsheet will calculate an initial set of income
statements, balance sheets and cash flow statements for the three
years of the forecast, together with some other reports. Immediately save
a copy of the template as version 2 (e.g. WidgetsCo-V2.xls). You can then make
whatever changes you need in version 2 and still have version 1 to go back to in
case something goes wrong. Do the same thing for each additional iteration.
Changes will be required until you arrive at a forecast that you think best
represents the financial outcomes of your plan.

7
Tabs
The following pages discuss each of the main tabs in the Financial Projections
Template. For all tabs where you will need to input some information, we’ve
provided spaces for you to write the information down in this guide first. That
way, you can simply transfer the information over the Template. We’ve found
that, for many people, this method is easier than immediately filling out the
Template. However, if you feel comfortable doing so, feel free to jump right in to
using the Template instead.
It’s important to note that the tabs are all “locked.” This means that you won’t be
able to accidentally alter any of the formulas. You will be able to change the width
of columns, row height, and the size and location of text boxes. If you see “###”
in a column, that means the column is too narrow for the numbers to display.
You can “unlock” the Template by using the code found on the Directions tab.
We do not recommend doing this unless you have another copy saved and you
have some understanding of how Excel formulas work.

8
Directions
Here you can read some directions for completing the template. You’ll also be
asked to input your name, business name, and the month and year that you are
starting on. This will determine how the months are displayed on the rest of the
template. If you leave it blank, the months will be displayed as Month 1, Month 2,
and so on. If you enter May 2015 as your starting month and year, the months will
display as May, June, July, etc.
Prepared by: ____________________________________________
Company Name: ________________________________________
Starting Month: _________________________________________
Starting Year: ___________________________________________
Directions

9
Starting Point
In this tab, you will be developing the financial Balance Sheet for your business at
the time it opens its doors for making the first sales. If you have an existing
business, you will record the actual Balance Sheet numbers at the point in time
from which you are projecting financial forecasts for future months.
Fixed Assets
These are items that you will purchase which will have value in the long-term
(more than 1 year). Read the descriptions below, and enter an estimate for each
amount. Remember, you can always make changes later when you’ve done more
research.
Real Estate
When you purchase real estate, the cost of any buildings can be depreciated, but
the cost of the land cannot be. Therefore, for accounting purposes, you will need
to break down the cost of the real estate into land and buildings. A good rule of
thumb is 20% of the real estate cost is land, and 80% buildings, but you should
consult a tax professional for an exact breakdown.
Land (A) $
Buildings (B) $
Leasehold Improvements are updates or changes you need to make in your
rental space before you can begin. These may include painting, installing new walls
or partitions, new flooring, light fixtures, etc. (C) $
Equipment includes machinery, computers, ovens, printing presses, etc. Any
type machine or device you’ll need to produce your product or service.
(D) $
Furniture and Fixtures are items like desks, chairs, tables, lamps, clothing
racks, display cases, etc. (E) $
1-StartingPoint

10
Vehicles include any car, truck, van etc. that will be used for the business.
(F) $
Other will include anything you will need to purchase as a Fixed Asset which
doesn’t quite match up with the previous categories, if needed.
(G) $
Operating Capital
These are shorter-term assets, things you will likely use within one year. Read the
descriptions below, and enter an estimate for each amount. Remember, you can
always make changes later when you’ve done more research.
Pre-Opening Salaries and Wages include any payment to employees or
contractors who help you get things ready before you have officially opened your
business. (H) $
Prepaid Insurance Premiums will need to paid on any insurance you plan to
get. See page 11 of the Simple Steps for Starting Your Business workbook for
more information about different kinds of insurance. (I) $
Inventory means the goods and materials that you will sell, or that you’ll use to
produce your product or service. (J) $
Legal and Accounting Fees may need to be paid if you hire a lawyer and/or an
accountant to help you get your business set up. (K) $
Rent Deposits are fairly typical with any rental space, and you’ll usually get the
deposit back if you leave the space in good condition. (L) $
Utility Deposits are charged by most utility companies prior to activating
service. In some areas, this can be waived with a letter of reference.
(M) $
1-StartingPoint

11
Supplies may include things like paper, pens, notepads, tissues, etc.
(N) $
Advertising and Promotion include fees paid to a marketing consultant, ad
space purchased, website creation, etc. (O) $
Licenses may be required locally, on the state level, or nationally in order for
you to operate your business. (P) $
Other initial start-up costs include anything you’ll need to purchase, which
doesn’t fit into these categories. (Q) $
1-StartingPoint

12
Fixed Assets
Enter your answers from pages 9 & 10 here and calculate the total. Depreciation
expense represents writing off the value of a fixed asset over its estimated useful
life, rather than expensing the entire cost in one year. Read more about
depreciation in the glossary. The Financial Projections Template will calculate
depreciation of assets automatically using the time periods shown. If your
research shows that you should use a different time period, cross out the number
used below and write in the new one. You will be able to make changes in the
Template as well.
Item Amount Depreciation
(Years)
A Real Estate – Land $ n/a
B Buildings $ 20
C Leasehold Improvements $ 3
D Equipment $ 7
E Furniture and Fixtures $ 5
F Vehicles $ 5
G Other $ 5
(1)TOTAL FIXED ASSETS
Operating Capital
Enter your answers from pages 10 & 11 here.
Item Amount
H Pre-Opening Salaries and Wages $
I Prepaid Insurance Premiums $
J Inventory $
K Legal and Accounting Fees $
L Rent Deposits $
M Utility Deposits $
N Supplies $
O Advertising and Promotion $
P Licenses $
Q Other Initial Start-Up Costs $
(2)TOTAL OPERATING CAPITAL
1-StartingPoint

13
Sources of Funding
Refer to Page 12 totals to complete this chart. Add the (1)Total Fixed Assets to
the (2)Total Operating Capital to get the (3)Total Funding Needed.
(1)Total Fixed Assets
$
(2)Total Operating Capital
$
(3)Total Funding Needed
$
Now that you’ve added up your Total Funding Needed, you have to figure out
how to pay for everything! The Financial Projections Template will calculate what
percentage of your funding is coming from each of the following categories. It will
also calculate the monthly payments for your loans, if you have any.
Equity
First, you should think about how much funding you can raise before going into
debt. Most banks or other financial institutions would expect 25% to 30% of your
total funding needed to be covered by equity capital.
How much money will you (and any other owners) be putting into this
business?
(A) $
Do you have any outside investors (friends, family, or anyone who is
providing funding in exchange for ownership of part of your business)?
If yes, how much funding will you receive in total from all investors?
(B) $
If no, leave blank.
EQUITY SUBTOTAL (A+B)
$
1-StartingPoint

14
Remaining Balance Needed
(FUNDING NEEDED – EQUITY SUBTOTAL)
$
Debt
Now that you know how much you will have in equity, you may need to
supplement that with debt-based funding.
Will you have a mortgage (are you planning to purchase a building
and/or land?)
If yes, what is the estimated loan amount? (F) $
If no, leave it blank.
Will you have a vehicle loan (will you need to purchase a vehicle for
your business?)
If yes, what is the estimated loan amount? (G) $
If no, leave blank.
SUBTOTAL (F+G)*: $
*If this subtotal doesn’t equal the Remaining Balance Needed amount, you’ll have
to divide the rest between a Commercial Loan (C), Credit Card Debt (E) and
Other Bank Debt (G). The total below needs to equal (3)Total Funding Needed
or you will not be fully funded.
Sources of Funding Totals
A Owner’s Equity $
B Outside Investors $
C Commercial Loan $
D Commercial Mortgage $
E Credit Card Debt $
F Vehicle Loans $
G Other Bank Debt $
TOTAL $
1-StartingPoint

15
Payroll
Employee Types
Fill in your estimate of the compensation for each employee or independent
contractor that your plan calls for. Owner’s compensation, for this purpose, does
not include profit or cash distributions.
To convert a salary to average hourly pay, use the following formula:
Salary ÷ 52 (weeks/year) ÷ 40 (hours/week) = hourly pay
If you have multiple owners, find the hourly salary for each owner, add them
together and then divide by the number of owners.
Example from Ann:
Owner 1: $54,000 ÷ 52 ÷ 40 = $25.96
Owner 2: $42,000 ÷ 52 ÷ 40 = $20.19
Average: ($25.96 + $20.19) ÷ 2 = $23.08
To find the average hourly rate for hourly employees, add up the different hourly
wages and then divide by the number of hourly employees. You will be able to
add temporary employees at certain times of the year in the Financial Projections
Model. Here, just include employees you’ll have most of the year.
(hourly wage 1 + hourly wage 2) ÷ 2
Employee Types Number of
Owners/
Employees
Average
Hourly Pay
Estimated
Hours/Week
(per person)
Owners $
Full-Time Employees $
Part-Time Employees $
Independent Contractors $
2a-PayrollYear1

16
Payroll Taxes and Benefits
This part is tricky, so we’ve included the percentages for you (based on 2013). If
you need to make changes, you can cross out the listed percentage and write in
the correct one. The SCORE Financial Projections Template will automatically
calculate the monthly amounts due for Social Security, Medicare, Federal
Unemployment and State Unemployment taxes.
Payroll Taxes and Benefits Wage Base Limit* Percentage of
Salary/Wage
Social Security $110,111 6.20%
Medicare 1.45%
Federal Unemployment Tax
(FUTA)
$7,000
0.80%
State Unemployment Tax
(SUTA)**
$7,000
3.45%
Worker’s Compensation n/a 2.85%
Employee Health Insurance n/a 0.00%
Other Employee Benefit
Programs
n/a
0.00%
*The wage base limit is the maximum earned gross income on which a given tax may be
imposed. So you pay taxes on everything up to that amount.
**This varies by state. Ask your SCORE mentor or instructor for advice on finding your state’s
information.
2a-PayrollYear1

17
This tab of the Template will show you the totals for year 1, plus estimates for
years 2 and 3. You can adjust those estimates by changing the growth rates. For
example, if you think you’re going to double the number of employees you have
in year 2, you can make the growth rate 100%.
This may seem too abstract right now, but once the numbers for Year 1 have
been entered and you are viewing the Financial Projections Template, it will make
more sense.
2b-PayrollYrs1-3

18
Sales Forecast
Product Lines and Units
Some businesses may be able to use an actual unit, while others may have to
invent a unit. For example, a shoe store could use pairs of shoes sold as its unit,
and an average price and cost per pair for the value factors. A service business
might use number of service calls made and an average price and cost. Or, you
could use dollar units, such as sales in units of $100 and cost of sales in units of
$50.
Wages and salaries are included in the salaries and wages tables 2a and 2b. If you
own (or are starting) a manufacturing or contracting business and you want to
include labor cost in the COGS per Unit, consult your instructor or mentor to
determine that calculation.
Product Lines Units (ex. Dresses,
Boxes, Hours)
Sales Price
Per Unit
COGS Per
Unit
Margin Per
Unit (sales price per unit
– COGS per unit) Plant Mix Bags $2,000 $1,100 $900
What the
customer
pays
What it costs
to produce the
product/service
Your net
profit!
The
product/service
3a-SalesForecastYear1

19
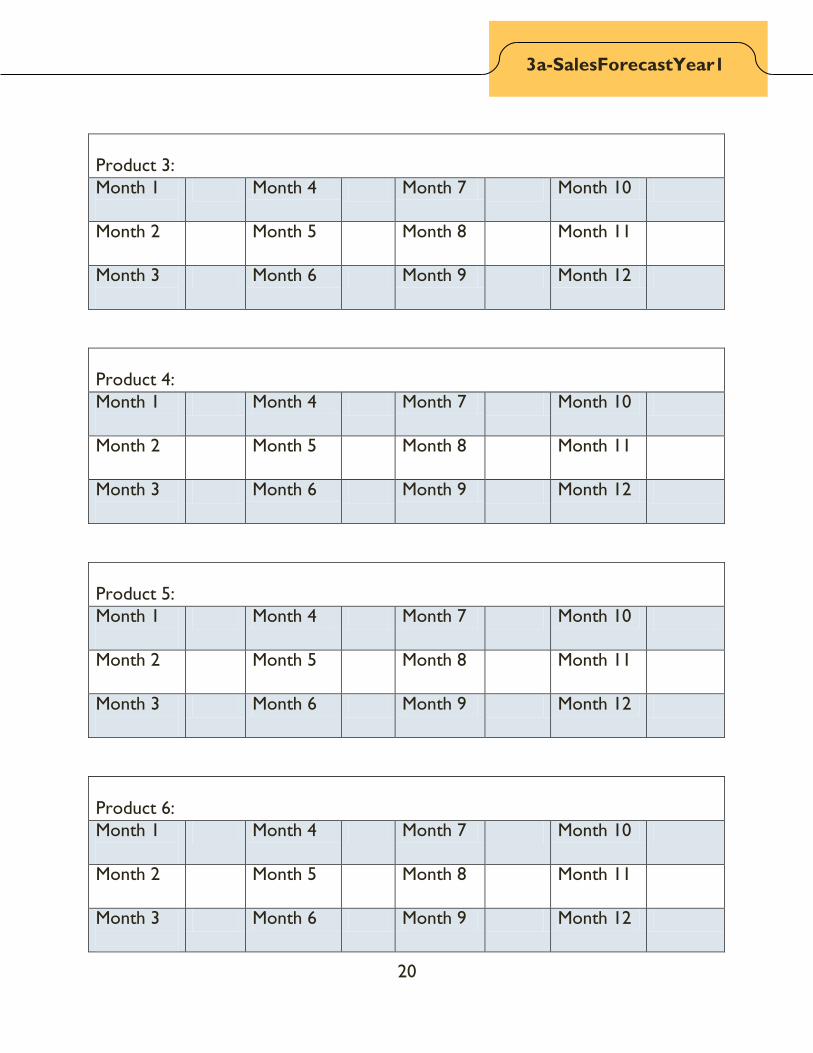
Projected Sales Per Month
Use the tables below to record how many units of each product/service you think
you will sell in a given month. For most businesses, sales will increase or decrease
at different times during the year. This forecast will help you plan for when you’re
not bringing in as much profit.
Example from Ann: Bags of Plant Mix
Month 1
5 Month 4 10 Month 7 5 Month 10 10
Month 2
5 Month 5 20 Month 8 20 Month 11 5
Month 3
5 Month 6 20 Month 9 15 Month 12 5
Product 1:
Month 1
Month 4 Month 7 Month 10
Month 2
Month 5 Month 8 Month 11
Month 3
Month 6 Month 9 Month 12
Product 2:
Month 1
Month 4 Month 7 Month 10
Month 2
Month 5 Month 8 Month 11
Month 3
Month 6 Month 9 Month 12
3a-SalesForecastYear1
20
Product 3:
Month 1
Month 4 Month 7 Month 10
Month 2
Month 5 Month 8 Month 11
Month 3
Month 6 Month 9 Month 12
Product 4:
Month 1
Month 4 Month 7 Month 10
Month 2
Month 5 Month 8 Month 11
Month 3
Month 6 Month 9 Month 12
Product 5:
Month 1
Month 4 Month 7 Month 10
Month 2
Month 5 Month 8 Month 11
Month 3
Month 6 Month 9 Month 12
Product 6:
Month 1
Month 4 Month 7 Month 10
Month 2
Month 5 Month 8 Month 11
Month 3
Month 6 Month 9 Month 12
3a-SalesForecastYear1

21
Sales Growth Rate
Enter a percentage for the rate of sales growth you anticipate year over year. You
can adjust individual months and make other edits on the Financial Projections
Template.
Again, though this may seem abstract, once the numbers for Year 1 have been
entered and you are viewing the calculations within the Financial Projections
Template, it will make more sense.
3b-SalesForecastYrs1-3

22
Additional Inputs
This section is where you will enter some parameters that are necessary for
calculations in later tabs.
Accounts Receivable
If your business will be retail (where people pay at the time they purchase the
goods/services), put 100% next to “Paid within 30 days”. If you will be contracting
work and payments will be made on different intervals, you will need to find out
what the industry standard is. If you’re not sure, put 100% next to “Paid between
30 and 60 days.” If you have a mix of retail and contract work, divide up the
percentage. You can always update this when you have more information.
Accounts Receivable (A/R) Days Sales Outstanding
Percent of Collections Year 1 Year 2 Year 3
Paid within 30 days % % %
Paid between 30 and 60 days % % %
Paid in more than 60 days % % %
Allowance for bad debt % % %
This should equal 100% ----> 100% 100% 100%
4-Additional-Inputs

23
Accounts Payable
This will vary depending on the vendor, your business’s credit history, and how
you set up the contract. If you’re not yet sure, put 100% next to “Paid within 30
days,” and update this when you have more information.
You will notice here that some people may pay you between 30 and 60 days, but
you may have to pay people within 30 days. This impacts cash flow, which you will
learn more about in the next section.
Line of Credit
As you saw above, sometimes you may have to pay for things before you receive
payment yourself. In order to ensure that you have enough cash each month, you
may need to set up a line of credit. This is usually done with a bank. Below, you
will need to enter the minimum amount you would feel comfortable seeing in
your bank account. If you go below this amount, you can draw from your line of
credit. You will have to pay this money back with interest, so also enter an
interest rate. The interest rate will likely be some percentage points higher than
the prime rate, but this will vary by lender.
Line of Credit Assumptions
Desired Minimum Cash Balance $
Line of Credit Interest Rate %
Accounts Payable (A/P)
Percent of Disbursements Year 1 Year 2 Year 3
Paid within 30 days % % %
Paid between 30 and 60 days % % %
Paid in more than 60 days % % %
This should equal 100% ----> 100% 100% 100%
4-Additional-Inputs

24
Additional Fixed Assets Purchases
Below include the additional fixed assets that you will purchase in the first,
second, and third years. Include an estimate of which month you will purchase
them. For example, you might buy one delivery van for your flower shop initially,
and then plan on buying a second one after nine months, based on sales
projections.
Remember, the categories for Fixed Assets are: Real Estate, Leasehold
Improvements, Equipment, Furniture and Fixtures, Vehicles, and Other Fixed
Assets.
Fixed Assets Month/Year Amount
Ex. Real Estate July Year 2013 $150,000
4-Additional-Inputs

25
Other
Below we’ve included the default amounts for the Income Tax Rate and
Amortization Period for your startup-costs. If these numbers are not correct,
cross them out and enter the correct amount. Speak with your instructor or
SCORE mentor for guidance.
Effective Income Tax Rate – Year 1
20%
Effective Income Tax Rate – Year 2
20%
Effective Income Tax Rate – Year 3
20%
Amortization Period in Years
3
4-Additional-Inputs

26
Monthly Operating Expenses
Operating Expenses are the costs associated with running the business. Based on
any research you have done, put in monthly estimates below. If you haven’t yet
researched all of these expenses, enter your best guess and update that amount
later. Usually, you can get a basic idea of cost by doing an online search for each
product or service that you will need. Enter “0” for anything you won’t use.
The expenses listed here are common ones found on the Schedule C IRS form,
which business owners need to complete. For more information, visit:
http://www.irs.gov/uac/Schedule-C-(Form-1040),-Profit-or-Loss-From-Business.
Advertising includes print or media ads, business cards, mailers/brochures, signs,
give-away items, samples, sponsorships (ex. sponsoring a pet adoption day for
your local shelter). (A) $
Car and Truck Expenses can EITHER include mileage costs (the amount per
mile varies year to year) OR direct costs for your gas, oil, repairs, insurance,
depreciation and registration. (B) $
Commissions and Fees may include, for example, a finder’s fee for someone
who helped you find a business to buy, or an employment agency who helps staff
your business. It doesn’t include commission paid as part of a salary to an
employee. (C) $
Contract Labor (not included in payroll) might include hiring a cleaning
company, landscaper or any other outside business which performs a task for you.
(D) $
Insurance (other than health) will include things like liability insurance. See
page 11 of the Simple Steps for Starting Your Business workbook for more
information about different kinds of insurance. (E) $
5a-OpExYear1

27
Legal and Professional Services would include tax preparation,
payroll/accounting, legal advice, and the like. (F) $
Licenses would include any ongoing licenses that were not already accounted for
in the Start-Up Expenses section. (G) $
Office Expenses are costs that relate directly to the operation of your business.
These might include: computer software, postage, cell phone, internet, office
equipment costs. You must have receipts for all items. (H) $
Rent or Lease – Vehicles, Machinery, Equipment includes anything that you
rent/lease for your business. (I) $
Rent or Lease – Other Business Property is rented/leased office or storage
space, or anything else which doesn’t fit into the above category.
(J) $
Repairs and Maintenance are expenses associated with fixing something that
broke, or performing routine maintenance. If you fix/maintain the item yourself,
you cannot deduct labor costs. (K) $
Supplies are items you need to purchase to produce your product or service.
For example, if you sell custom stationary the cost of the paper would be a
supply. If you just re-sell paper that would be inventory, not supplies.
(L) $
Travel, Meals and Entertainment is a bit more complex, and you will want to
consult a tax professional to see what exactly can be deducted and how it should
be documented. For the purposes of this workbook, put together an estimate of
how often you’ll travel out of town, overnight each month and then the average
cost per trip. (M) $
5a-OpExYear1

28
Utilities are services like electricity, gas, telephone, etc. that are directly related
to your business. If you work from home, figure out the percentage of square
footage in the home that is dedicated work space. Then apply that percentage to
the utilities – for example, if your office takes up 15%, you can deduct 15% of
your electricity,(N) $
Miscellaneous is the category for anything that doesn’t fall into one of the
categories already mentioned. (O) $
Expenses Monthly Cost
A Advertising $
B Car and Truck Expenses $
C Commissions and Fees $
D Contract Labor (Not included in payroll) $
E Insurance (other than health) $
F Legal and Professional Services $
G Licenses $
H Office Expense $
I Rent or Lease – Vehicles, Machinery, Equipment $
J Rent or Lease – Other Business Property $
K Repairs and Maintenance $
L Supplies $
M Travel, Meals and Entertainment $
N Utilities $
O Miscellaneous $
5a-OpExYear1

29
This tab of the Template will show you the totals for year one, plus estimates for
years two and three. You can adjust those estimates by changing the growth
rates. For example, if you think you’re going to expand office space in year three,
you can demonstrate that by increasing the percentage.
One method companies use to make expense and sales projections is to use their
best judgment of what actual expenses are going to be in year one and then
multiply them by a growth factor in subsequent years.
This would not work for expenses that are likely to remain fixed or close to
constant like rent, utilities, and other expenses that may not grow as fast as
revenues.
However, for expenses like advertising, trade show and others that are more
directly related to sales, this methodology works.
Expenses Growth Rate
Year 1-2
Growth Rate
Year 2-3
Advertising % %
Car and Truck Expenses % %
Commissions and Fees % %
Contract Labor (Not included in payroll) % %
Insurance (other than health) % %
Legal and Professional Services % %
Licenses % %
Office Expense % %
Rent or Lease – Vehicles, Machinery,
Equipment
% %
Rent or Lease – Other Business Property % %
Repairs and Maintenance % %
Supplies % %
Travel, Meals and Entertainment % %
Utilities % %
Miscellaneous % %
5b-OpExYrs1-3

30
Cash Flow
Most items here will automatically pull from other areas of the Financial
Projections Template. However, there are four items in the Cash Outflows
section that you will need to input for year 1, as well as years 2 and 3. Those
items are listed below. It may be easier to complete this section once you’ve
started to fill out the Template. That way, you will know what your monthly Line
of Credit balance is, and you’ll have an idea of what your profits will be to
determine Owner’s Distribution and Dividends Paid. In many cases, these will
both be zero for the first year.
Item Estimated Amount Per Month
Additional Inventory
Owner’s Distribution
Line of Credit
Repayments
Dividends Paid
6a-CashFlowYear1

31
This tab is the same as tab 6a, but it allows you to make cash flow projections by
month for years 2 and 3.
Item Estimated Amount Per Month
Year 2 Year 3
Additional Inventory
Owner’s Distribution
Line of Credit
Repayments
Dividends Paid
6b-CashFlowYrs1-3

32
Income Statement
You will not need to enter any information here, as the Template will
automatically calculate all of the information. In order to better understand the
information and what it means for your business, you should set up an
appointment with a SCORE mentor. You can refer to page 46 in the Simple Steps
for Starting Your Business workbook for more information about Income
Statements. This page also contains a blank income statement for those who want
to complete one independently.
NOTES:_____________________________________________________
____________________________________________________________
____________________________________________________________
____________________________________________________________
____________________________________________________________
____________________________________________________________
____________________________________________________________
____________________________________________________________
____________________________________________________________
____________________________________________________________
____________________________________________________________
____________________________________________________________
____________________________________________________________
____________________________________________________________
____________________________________________________________
7a-IncomeStatementYear1

33
You will not need to enter any information here, as the Template will
automatically calculate all of the information for years 2 and 3.
NOTES:_____________________________________________________
____________________________________________________________
____________________________________________________________
____________________________________________________________
____________________________________________________________
____________________________________________________________
____________________________________________________________
____________________________________________________________
____________________________________________________________
____________________________________________________________
____________________________________________________________
____________________________________________________________
____________________________________________________________
____________________________________________________________
____________________________________________________________
____________________________________________________________
____________________________________________________________
____________________________________________________________
____________________________________________________________
7b-IncomeStatementYrs1-3
34
Balance Sheet
Like the Income Statement, the Template will automatically calculate all of the
information on this tab. You can refer to page 48 in the Simple Steps for Starting
Your Business workbook for more information about Balance Sheets. There is
also a blank one on page 49, if you’d like to complete one independently.
Remember to set up a time to speak with a SCORE mentor to ensure that you
understand what the numbers mean for your business.
NOTES:_____________________________________________________
____________________________________________________________
____________________________________________________________
____________________________________________________________
____________________________________________________________
____________________________________________________________
____________________________________________________________
____________________________________________________________
____________________________________________________________
____________________________________________________________
____________________________________________________________
____________________________________________________________
____________________________________________________________
____________________________________________________________
____________________________________________________________
____________________________________________________________
8-BalanceSheet

35
Other Helpful Tabs
Breakeven Analysis
This tab will auto-populate based on information you’ve entered in previous tabs.
Here, you can determine the number of units you will need to sell each month to
breakeven. This means that revenues are equal to expenses. Any units you sell
above the breakeven point are profit.
Financial Ratios
This tab generates some standard ratios that you might find useful. There is space
for you to enter the norms for your industry so that you can see a side-by-side
comparison with your ratios.
Diagnostic Tools
Many start-up entrepreneurs are unsure whether their financial information is
within reasonable ranges. This tab will give you very general guidelines as to
whether your numbers are too high, too low, or just right. You should speak
with your SCORE mentor for more tailored information regarding your financials.
COGS Calculator
This tab isn’t meant to “store” data. It’s a calculator and, like a calculator that
you’d use at your desk, you can enter data into it to get an idea of your Cost of
Goods Sold (COGS) for different items. You will largely use this when you are
working on your Sales Forecast.
Amortization & Depreciation
This tab is helpful in a variety of ways. It not only shows what you will owe
month-by-month for the first three years of any loans of credit card debt you take
out, but it also shows depreciation for our fixed assets for 3 years and how your
start-up costs can be amortized over the first 3 years.

Glossary
accounts payable Money owed to others for goods and services received
accounts receivable Money owed from customers for goods and services sold
additional inventory Raw materials or finished goods that are ready or will be ready for sale, which are purchased to replenish existing inventory
amortization The paying off of debt in regular installments over a period of time
assets All resources owned by the business
balance sheet A financial statement that shows the company’s financial position at a moment in time—all assets, all liabilities, and all equity
benchmarking Comparing company’s results to the experiences of others of similar size and within the same industry
benefits Costs paid by company for employee-related items, such as Social Security, worker comp, health insurance, vacations, sick days, etc.
book value Sum of all assets, minus all liabilities = equity. The intrinsic value of the business owned by the stockholders
breakeven point Point at which total sales for a period of time = total expenses for that period of time (in other words, there is neither a profit nor a loss)
business concept An idea which can be used for commercial purposes
capital Long term money held in the business that is used to create profit
cash flow statement An analytical tool that demonstrates the short-term viability of a company, particularly its ability to pay bills

37
C-corp. A limited liability legal structure in which the company is taxed separately from its shareholders
collateral Property and goods used to secure repayment of a loan
cost of goods sold (COGS)
Also called cost of sales or variable costs. The costs associated with a specific product, not including overhead costs, such as payroll or office supplies.
current Will occur within 12 months of the financial statement date
debt capital Debt raised by the business by taking out a loan
depreciation
Cost of expensing a fixed asset over its estimated useful life; Many people use “Straight Line” depreciation, equal amounts over the life of the asset, for management planning and reporting purposes. “Accelerated” depreciation might be used for tax reporting purposed. Consult your accountant for advice.
direct cost Cost that can be directly traced to producing specific goods or services
disbursements Money paid out
dividends paid Money paid to shareholders
equity (see book value)
expense Operating costs the business incurs through its efforts to earn revenue
financial projection Estimate of future financial outcomes (see forecast)
fixed expense Business expenses which must be paid every month, even if you have no customers (for example: rent, utilities, telephone, loan payments)
forecast Making statements about events which have not yet been observed
fringe benefits (see benefits)
funds management Management of cash flow

38
gross profit
Revenue minus the cost of making a product or
providing a service, but before deducting overhead,
payroll, taxes and interest payments
gross profit margin % Gross profit divided by total sales
income Revenue produced through sales of goods and services
income statement Analysis of financial performance over a period of time (also called the Profit and Loss statement, or ‘P&L’)
indirect cost Costs that are not directly accountable to a unit of production, also called overhead (such as taxes, administration, personnel, and security)
industry comparison (see benchmarking)
liabilities What the business owes to others
line of credit
The maximum credit a customer is allowed; This is usually arranged with a bank, and the borrower is allowed to borrow up to a pre-defined amount. This is generally used to maintain a certain minimum cash balance for the business.
long term Occurs later than 12 months from the financial statement date
model Computer program that uses facts and assumptions to simulate financial operations of a business
net profit Sum of total revenue and gains, less all expenses (including taxes) for a reporting period
net profit before taxes Sum of total revenue and gains, less all expenses except for income taxes for the reporting period
net profit margin % Net profit divided by total sales
operating expense Expenditures incurred in the normal course of business
overhead (see indirect cost)
owners distribution A payment of earnings to owners of a business

39
payment terms Conditions under which a seller completes a sale, including the time the customer has to pay off the amount due
profit & loss statement (see income statement)
profitable Excess of purchase price over the costs of bringing product or service to market
projected Estimated or forecast
ratios Calculations used to make numerical comparisons
receipts (see income)
revenue (see income)
sales (see income)
sales forecast Estimated sales for a time period
sales unit As used in the SCORE model, it is a product or service, or a group of products or services, regarded as a single line-item entry in the sales forecast
S-corp.
A limited liability legal structure in which the corporation's income or losses are divided among and passed through to its shareholders who then report the income or loss on their own individual income tax returns
short term Occurs within 12 months of the financial statement date
sole proprietorship A business entity that is owned and run by one individual in which there is no legal distinction between the owner and the business
sources of funds Typical sources include profit from operations, debt from money borrowed, and sale of equity interest to shareholders
spreadsheets
An interactive computer application use for analysis of information in a tabular form. These are frequently used
for financial information because of their ability to re-
calculate the entire sheet automatically after a change to
a single cell is made.

40
subcontract Individual or business who signs a contract to perform
part or all of the obligations of another's contract