Embed Size (px)
Citation preview
Financial Plan Statements for
New York City July 2007
The City of New York
TABLE OF CONTENTS REPORT NO. INTRODUCTION PAGE
Notes to Financial Plan Statements 1-4
1 Financial Plan Summary 5 1A Month-By-Month Revenue and Obligation Forecast 6
2 Analysis of Change in Fiscal Year Plan 7
3 Revenue Activity By Major Area 8-9 4 Obligation Analysis 10
4A/4B Personnel Control Reports 11-16 5 Capital Commitments 17-19
5A Capital Cash Flow 20-21
6/6A Month-By-Month Cash Flow Forecast 22-24

NOTES TO FINANCIAL PLAN STATEMENTS I. Summary of Significant Financial Policies, Procedures and Development
A. Financial Plan Statements
The City's Financial Plan Statements represent the accounts of the General Fund and certain transactions of the Capital Projects Fund of the City, including the Department of Education and the City University of New York. They do not include the total operations of the New York City Health and Hospitals Corporation (HHC) but do include the City's subsidy to HHC and the City's share of payments to the Corporation in connection with its role as a Medicaid provider.
Covered Organization Financial Plans are issued quarterly.
The City's Financial Plan Statements incorporate the policies and procedures discussed in Note B. Such data are
unaudited. Prior years' balances for cash, accounts receivable and outstanding obligations are derived from preliminary FY 2007 balances and are subject to audit adjustments. Amounts reported may be subject to reclassification or adjustments arising from management review and audits of the City’s FY 2007 and FY 2008 Financial Statements. The Financial Plan on which these statements are based was prepared in accordance with generally accepted accounting principles.
B. Basis of Accounting
1. Revenues
Real estate tax revenue is recorded on the modified accrual basis of accounting, which recognizes as revenue payments received against the current year levy and late payments on prior year levies received within the first two months of the following year, reduced by estimated tax refunds to be made in the period.
Taxpayer assessed revenues (e.g. sales, income and certain excise taxes), net of estimated refunds, are
recorded on a modified accrual basis. Revenues are susceptible to accrual if they are both measurable and available to be used to finance governmental operations during the year.
Page 1 July 2007 FPS

All other revenues are recorded when received in cash. Amounts expected to be paid to MAC by the State from sales tax for debt service on MAC bonds and for MAC
operating expenses are included in City revenues on an accrual basis (see Note B-2(a) for expenditure offset).
Federal categorical grants except as noted below are recognized as revenue as claims are filed during the year and adjusted at year-end for revenues earned but not claimed. State grants are recognized in the same manner. Advances provided to the City in anticipation of filing of claims by the City for federal and state reimbursement of Medicaid and welfare expenditures are recognized as revenue when received.
2. Expenditures
(a) Debt Service
Debt Service expenditures on general obligation issuances are recorded when City real estate tax
collections are deposited into the Debt Service fund in advance of the actual debt service payment.
Debt Service expenditures are net of Transitional Finance Authority (TFA) debt service and City personal income taxes (PIT) are net of PIT deposited into the TFA Debt Service fund in advance of the actual debt service payment.
MAC debt service and administrative expenses after fiscal year 2005 reflect retention by MAC of the 4.125%
sales tax levied in the City by the State for State oversight costs and MAC operating expenses. (b) Fixed Assets
Acquisitions of fixed assets having a useful life of more than five years and costing more than $15,000 are
treated as capital expenditures. All other acquisitions of fixed assets are treated as operating expenditures.
Page 2 July 2007 FPS

(c) Encumbrances Encumbrances entered during FY 2008 for OTPS purchase orders and contracts expected to be received by
June 30, 2008 are treated as expenditures.
(d) Self-Insurance
The City is self-insured with respect to most risks, including, but not limited to, property damage, personal injury, and workers' compensation. Settlements reached or judgments entered during FY 2008 are recorded when paid and adjusted at year-end for any additional unpaid settlements reached or judgments entered during FY 2008.
(e) Vacation and Sick Leave
The annual costs of actual vacation and sick leave are recorded on a cash basis.
(f) Materials and Supplies
Purchases of materials and supplies are treated as expenditures when encumbered. No inventory accounts
are included in the financial statements.
(g) General Reserve
The General Reserve provides for shortfalls in revenues and overruns in uncontrollable expenditures. 3. Capital Commitments
The basis of reporting actual capital commitments, as well as sources and uses of capital expenditures, has been changed. Commitments and expenditures are now reported based upon the accounting period of the transaction. In prior Financial Plan Statements, these actuals were based upon dates transactions were entered in the City’s Financial Management System.
Page 3 July 2007 FPS

C. Pension Plans
The City sponsors or participates in pension plans covering all eligible employees. Most plans require employee contributions. The plans provide pension benefits based on salary and length of service. In the event of disability during employment, participants may receive retirement allowances based on satisfaction of certain service requirements and other plan provisions. The City's main pension systems are the five major actuarial systems - The New York City Employees' Retirement System, The Teachers Retirement System, The Board of Education Retirement System, The New York City Police Pension Fund, Article 2 and the Fire Department Pension Fund Article 1-B. The City also contributed to three other actuarial systems and sponsors six non-actuarial retirements' systems for certain employees, retirees and beneficiaries not covered by any of the five major actuarial systems. In addition, the City provides cost-of-living and other supplemental pensions to certain retirees of the actuarial and non-actuarial systems.
Page 4 July 2007 FPS

Report No. 1
Financial Plan Summary

NEW YORK CITYFINANCIAL PLAN SUMMARY
REPORT NO. 1MONTH: JULY
(MILLIONS OF DOLLARS) FISCAL YEAR 2008
BETTER/ BETTER/ BETTER/ACTUAL PLAN (WORSE) ACTUAL PLAN (WORSE) FORECAST PLAN (WORSE)
REVENUES:
TAXES GENERAL PROPERTY TAXES 5,990$ 6,072$ (82)$ 5,990$ 6,072$ (82)$ 12,984$ 12,984$ -$ OTHER TAXES 1,048 962 86 1,048 962 86 23,491 23,491 - MISCELLANEOUS REVENUES 519 519 - 519 519 - 5,997 5,997 - UNRESTRICTED INTGOVT. AID - - - - - - 340 340 - LESS: INTRA-CITY REVENUES (8) (8) - (8) (8) - (1,393) (1,393) - DISALLOWANCES - - - - - - (15) (15) -
SUBTOTAL 7,549 7,545 4 7,549 7,545 4 41,404 41,404 -
OTHER CATEGORICAL GRANTS - - - - - - 1,006 1,006 - CAPITAL INTER-FUND TRANSFERS - - - - - - 436 436 - FEDERAL GRANTS 6 6 - 6 6 - 5,295 5,295 - STATE GRANTS 7 7 - 7 7 - 10,824 10,824 -
TOTAL REVENUES 7,562$ 7,558$ 4$ 7,562$ 7,558$ 4$ 58,965$ 58,965$ -$
EXPENDITURES:
PS 1,363$ 1,367$ 4$ 1,363$ 1,367$ 4$ 33,081$ 33,081$ -$ OTPS 6,111 8,287 2,176 6,111 8,287 2,176 24,004 24,004 - DEBT SERVICE 145 32 (113) 145 32 (113) 2,963 2,963 - MAC DEBT SERVICE FUNDING - - - - - - 10 10 - GENERAL RESERVE - - - - - - 300 300 -
SUBTOTAL 7,619 9,686 2,067 7,619 9,686 2,067 60,358 60,358 - LESS: INTRA-CITY EXPENSES (8) (8) - (8) (8) - (1,393) (1,393) -
TOTAL EXPENDITURES 7,611$ 9,678$ 2,067$ 7,611$ 9,678$ 2,067$ 58,965$ 58,965$ -$
SURPLUS/(DEFICIT) (49)$ (2,120)$ 2,071$ (49)$ (2,120)$ 2,071$ -$ -$ -$
CURRENT MONTH YEAR-TO-DATE FISCAL YEAR 2008
Page 5 July 2007 FPS
Report No. 1A
Month-by-Month Revenue and Obligation Forecast

NEW YORK CITYMONTH-BY-MONTH - REVENUE AND OBLIGATION FORECAST
REPORT NO. 1AMONTH: JULY
(MILLIONS OF DOLLARS) FISCAL YEAR 2008
ACTUAL
POST TOTALJUL AUG SEP OCT NOV DEC JAN FEB MAR APR MAY JUN JUNE YEAR
REVENUES:
TAXES GENERAL PROPERTY TAXES 5,990$ 109$ 308$ 345$ 47$ 2,392$ 2,714$ 49$ 511$ 273$ 23$ 65$ 158$ 12,984$ OTHER TAXES 1,048 1,018 3,021 1,225 1,484 2,651 2,944 1,357 2,472 2,238 1,059 2,735 239 23,491 MISCELLANEOUS REVENUES 519 358 320 347 360 360 405 364 462 997 501 671 333 5,997 UNRESTRICTED INTGOVT. AID - - - - - - - - - - - 340 - 340 ANTICIPATED REVENUES - - - - - - - - - - - - - - LESS: INTRA-CITY REVENUES (8) (7) (45) (55) (60) (75) (100) (110) (115) (125) (135) (225) (333) (1,393) DISALLOWANCES - - - - - - - - - - (5) (10) - (15)
SUBTOTAL 7,549 1,478 3,604 1,862 1,831 5,328 5,963 1,660 3,330 3,383 1,443 3,576 397 41,404
OTHER CATEGORICAL GRANTS - 53 101 92 46 55 105 47 46 123 43 295 - 1,006 CAPITAL INTER-FUND TRANSFERS - 34 17 21 20 61 23 24 26 66 26 26 92 436 FEDERAL GRANTS 6 52 144 319 476 237 617 416 394 512 442 443 1,237 5,295 STATE GRANTS 7 28 1,515 266 995 870 1,185 925 973 1,101 961 1,105 893 10,824
TOTAL REVENUES: 7,562$ 1,645$ 5,381$ 2,560$ 3,368$ 6,551$ 7,893$ 3,072$ 4,769$ 5,185$ 2,915$ 5,445$ 2,619$ 58,965$
EXPENDITURES:
PS 1,363$ 1,693$ 2,519$ 2,385$ 2,899$ 2,535$ 2,733$ 2,523$ 2,613$ 2,472$ 2,972$ 4,963$ 1,411$ 33,081$ OTPS 6,111 1,768 2,659 929 1,781 993 2,259 1,056 2,221 845 1,627 1,229 526 24,004 DEBT SERVICE 145 2 4 8 22 4 18 2 3 49 59 2,647 - 2,963 MAC DEBT SERVICE FUNDING - - - - - - 5 - - - - 5 - 10 GENERAL RESERVE - - - - - - - - - - - - 300 300
SUBTOTAL 7,619 3,463 5,182 3,322 4,702 3,532 5,015 3,581 4,837 3,366 4,658 8,844 2,237 60,358 LESS: INTRA-CITY EXPENSES (8) (7) (45) (55) (60) (75) (100) (110) (115) (125) (135) (225) (333) (1,393)
TOTAL EXPENDITURES 7,611$ 3,456$ 5,137$ 3,267$ 4,642$ 3,457$ 4,915$ 3,471$ 4,722$ 3,241$ 4,523$ 8,619$ 1,904$ 58,965$
SURPLUS/(DEFICIT) (49)$ (1,811)$ 244$ (707)$ (1,274)$ 3,094$ 2,978$ (399)$ 47$ 1,944$ (1,608)$ (3,174)$ 715$ -$
FORECAST
Page 6 July 2007 FPS

Report No. 2
Analysis of Change in Fiscal Year Plan

NEW YORK CITYANALYSIS OF CHANGE IN FISCAL YEAR FORECAST
REPORT NO. 2MONTH: JULY
(MILLIONS OF DOLLARS) FISCAL YEAR 2008
CHANGES INITIAL PLAN FROM
DESCRIPTION 6/20/2007 INITIAL PLAN
REVENUES: TAXES GENERAL PROPERTY TAXES 12,984$ -$ -$ OTHER TAXES 23,491 - - MISCELLANEOUS REVENUES 5,997 - - UNRESTRICTED INTERGOVERNMENTAL AID 340 - - LESS:INTRA-CITY REVENUES (1,393) - - DISALLOWANCES (15) - -
SUBTOTAL 41,404 - -
OTHER CATEGORICAL GRANTS 1,006 - - CAPITAL INTERFUND TRANSFERS 436 - - FEDERAL GRANTS 5,295 - - STATE GRANTS 10,824 - -
TOTAL REVENUES 58,965$ -$ -$
EXPENDITURES: PERSONAL SERVICE 33,081$ -$ -$ OTHER THAN PERSONAL SERVICE 24,004 - - DEBT SERVICE 2,963 - - MAC DEBT SERVICE FUNDING 10 - - GENERAL RESERVE 300 - -
SUBTOTAL 60,358 - - LESS:INTRA-CITY EXPENDITURES (1,393) - -
TOTAL EXPENDITURES 58,965$ -$ -$
CHANGES FROM PREVIOUS FORECAST
Page 7 July 2007 FPS

Report No. 3
Revenue Activity by Major Area

NEW YORK CITYREVENUE ACTIVITY BY MAJOR AREA (RECOGNITION BASIS)
REPORT NO. 3MONTH: JULY
(MILLIONS OF DOLLARS) FISCAL YEAR 2008
BETTER/ BETTER/ BETTER/ACTUAL PLAN (WORSE) ACTUAL PLAN (WORSE) FORECAST PLAN (WORSE)
TAXES:GENERAL PROPERTY TAXES 5,990$ 6,072$ (82)$ 5,990$ 6,072$ (82)$ 12,984$ 12,984$ -$ PERSONAL INCOME TAX 411 390 21 411 390 21 7,499 7,499 - GENERAL CORPORATION TAX - - - - - - 3,163 3,163 - BANKING CORPORATION TAX - - - - - - 813 813 - UNINCORPORATED BUSINESS TAX - - - - - - 1,586 1,586 - GENERAL SALES TAX 322 309 13 322 309 13 4,644 4,644 - REAL PROPERTY TRANSFER TAX 157 125 32 157 125 32 1,381 1,381 - MORTGAGE RECORDING TAX 126 108 18 126 108 18 1,249 1,249 - COMMERCIAL RENT TAX - - - - - - 550 550 - UTILITY TAX - - - - - - 355 355 - OTHER TAXES 32 30 2 32 30 2 544 544 - TAX AUDIT REVENUES * - - - - - - 559 559 - TAX PROGRAM (STAR) - - - - - - 1,148 1,148 -
TOTAL TAXES 7,038$ 7,034$ 4$ 7,038$ 7,034$ 4$ 36,475$ 36,475$ -$
MISCELLANEOUS REVENUES:LICENSES/FRANCHISES/ETC. 35 35 - 35 35 - 419 419 - INTEREST INCOME 21 21 - 21 21 - 387 387 - CHARGES FOR SERVICES 40 40 - 40 40 - 563 563 - WATER AND SEWER CHARGES 261 261 - 261 261 - 1,194 1,194 - RENTAL INCOME 8 8 - 8 8 - 194 194 - FINES AND FORFEITURES 70 70 - 70 70 - 724 724 - MISCELLANEOUS 76 76 - 76 76 - 1,123 1,123 - INTRA-CITY REVENUE 8 8 - 8 8 - 1,393 1,393 -
TOTAL MISCELLANEOUS 519$ 519$ -$ 519$ 519$ -$ 5,997$ 5,997$ -$
* The financial plan as submitted on June 20, 2007 reflects $559 million in Tax Audit Revenues, anticipated to be collected as follows:
CURRENT MONTH YEAR-TO-DATE FISCAL YEAR 2008ACTUAL ACTUAL PLAN
SALES TAX -$ -$ 20$ PERSONAL INCOME TAX - - 25 GENERAL CORPORATION TAX - - 327 COMMERCIAL RENT TAX - - 15 FINANCIAL CORPORATION TAX - - 101 UTILITY TAX - - 8 UNINCORPORATED BUSINESS TAX - - 48 REAL PROPERTY TRANSFER - - 6 OTHER TAXES - - 9
TOTAL -$ -$ 559$
CURRENT MONTH YEAR-TO-DATE FISCAL YEAR 2008
Page 8 July 2007 FPS
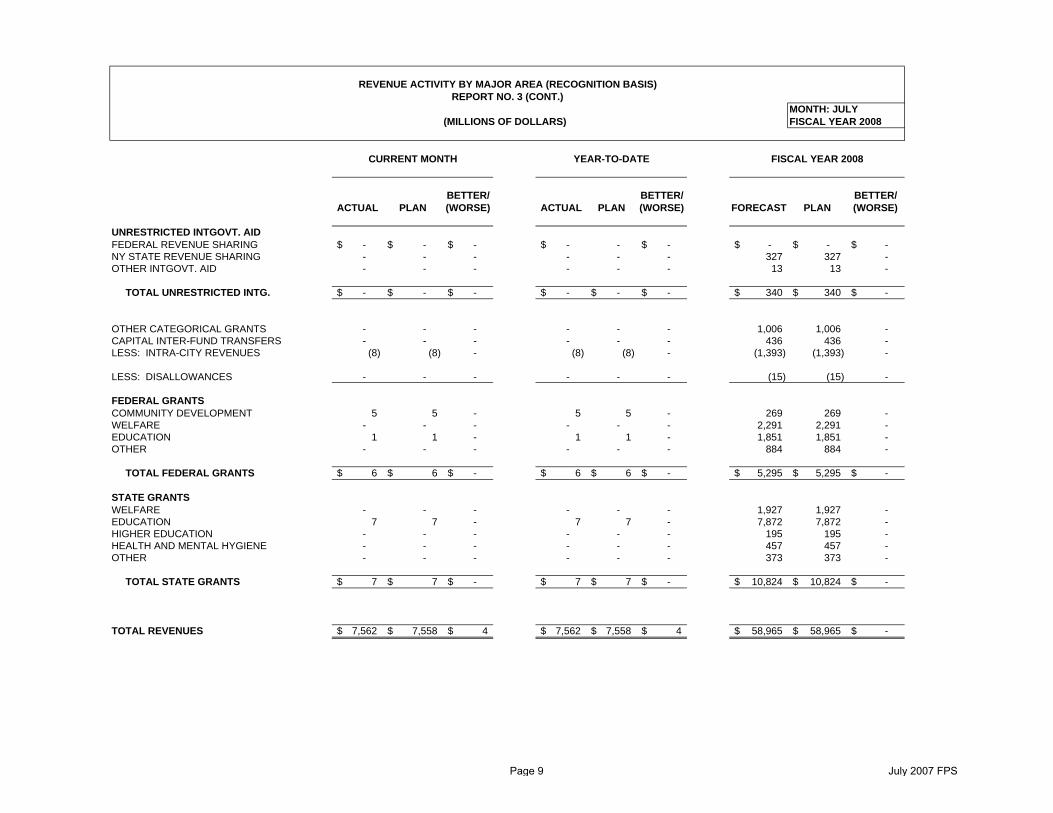
REVENUE ACTIVITY BY MAJOR AREA (RECOGNITION BASIS)REPORT NO. 3 (CONT.)
MONTH: JULY(MILLIONS OF DOLLARS) FISCAL YEAR 2008
CURRENT MONTH YEAR-TO-DATE FISCAL YEAR 2008
BETTER/ BETTER/ BETTER/ACTUAL PLAN (WORSE) ACTUAL PLAN (WORSE) FORECAST PLAN (WORSE)
UNRESTRICTED INTGOVT. AIDFEDERAL REVENUE SHARING -$ -$ -$ -$ - -$ -$ -$ -$ NY STATE REVENUE SHARING - - - - - - 327 327 - OTHER INTGOVT. AID - - - - - - 13 13 -
TOTAL UNRESTRICTED INTG. -$ -$ -$ -$ -$ -$ 340$ 340$ -$
OTHER CATEGORICAL GRANTS - - - - - - 1,006 1,006 - CAPITAL INTER-FUND TRANSFERS - - - - - - 436 436 - LESS: INTRA-CITY REVENUES (8) (8) - (8) (8) - (1,393) (1,393) -
LESS: DISALLOWANCES - - - - - - (15) (15) -
FEDERAL GRANTSCOMMUNITY DEVELOPMENT 5 5 - 5 5 - 269 269 - WELFARE - - - - - - 2,291 2,291 - EDUCATION 1 1 - 1 1 - 1,851 1,851 - OTHER - - - - - - 884 884 -
TOTAL FEDERAL GRANTS 6$ 6$ -$ 6$ 6$ -$ 5,295$ 5,295$ -$
STATE GRANTSWELFARE - - - - - - 1,927 1,927 - EDUCATION 7 7 - 7 7 - 7,872 7,872 - HIGHER EDUCATION - - - - - - 195 195 - HEALTH AND MENTAL HYGIENE - - - - - - 457 457 - OTHER - - - - - - 373 373 -
TOTAL STATE GRANTS 7$ 7$ -$ 7$ 7$ -$ 10,824$ 10,824$ -$
TOTAL REVENUES 7,562$ 7,558$ 4$ 7,562$ 7,558$ 4$ 58,965$ 58,965$ -$
Page 9 July 2007 FPS

Report No. 4
Obligation Analysis

NEW YORK CITYOBLIGATION ANALYSIS
REPORT NO. 4MONTH: JULY
(MILLIONS OF DOLLARS) FISCAL YEAR 2008
CURRENT MONTH YEAR-TO-DATE FISCAL YEAR 2008
BETTER/ BETTER/ BETTER/ACTUAL PLAN (WORSE) ACTUAL PLAN (WORSE) FORECAST PLAN (WORSE)
UNIFORM FORCES POLICE DEPT. 238$ 242$ 4$ 238$ 242$ 4$ 3,887$ 3,887$ -$ FIRE DEPT. 125 122 (3) 125 122 (3) 1,473 1,473 - DEPT. OF CORRECTION 68 70 2 68 70 2 933 933 - SANITATION DEPT. 361 318 (43) 361 318 (43) 1,247 1,247 -
HEALTH & WELFARE DEPT. OF SOCIAL SERVICES 1,183 1,391 208 1,183 1,391 208 8,571 8,571 - DEPT. OF HOMELESS SERVICES 276 339 63 276 339 63 681 681 - ADMIN. FOR CHILD SERVICES 1,197 1,608 411 1,197 1,608 411 2,752 2,752 - HEALTH & MENTAL HYGIENE 392 596 204 392 596 204 1,602 1,602 -
OTHER AGENCIES HOUSING PRESERVATION & DEV. 118 69 (49) 118 69 (49) 520 520 - ENVIRONMENTAL PROTECTION 136 138 2 136 138 2 967 967 - TRANSPORTATION DEPT. 105 154 49 105 154 49 648 648 - PARKS & RECREATION DEPT. 50 52 2 50 52 2 367 367 - DEPT. OF CITYWIDE ADMIN. SERVICES 404 857 453 404 857 453 1,028 1,028 - ALL OTHER 728 805 77 728 805 77 3,077 3,077 -
COVERED ORGANIZATIONS DEPT. OF EDUCATION 1,206 2,076 870 1,206 2,076 870 16,983 16,983 - HIGHER EDUCATION 62 27 (35) 62 27 (35) 641 641 - HEALTH & HOSPITALS CORP. 1 - (1) 1 - (1) 138 138 -
OTHER MISCELLANEOUS BUDGET: FRINGE BENEFITS 158 129 (29) 158 129 (29) 3,611 3,611 - TRANSIT SUBSIDIES 14 4 (10) 14 4 (10) 330 330 - JUDGMENTS & CLAIMS 61 12 (49) 61 12 (49) 635 635 - OTHER 120 171 51 120 171 51 1,266 1,266 - PENSION CONTRIBUTIONS 471 474 3 471 474 3 5,728 5,728 - DEBT SERVICE 145 32 (113) 145 32 (113) 2,963 2,963 - MAC DEBT SERVICE FUNDING - - - - - - 10 10 - PRIOR YEAR ADJUSTMENTS - - - - - - - - - UNALLOCATED REDUCTIONS - - - - - - - - -
SUB-TOTAL 7,619$ 9,686$ 2,067$ 7,619$ 9,686$ 2,067$ 60,058$ 60,058$ -$
PLUS GENERAL RESERVE - - - - - - 300 300 - LESS INTRA-CITY EXPENSES (8) (8) - (8) (8) - (1,393) (1,393) -
TOTAL EXPENDITURES 7,611$ 9,678$ 2,067$ 7,611$ 9,678$ 2,067$ 58,965$ 58,965$ -$
Page 10 July 2007 FPS

Report No. 4A & 4B
Personnel Control Reports
MONTH: JULY (MILLIONS OF DOLLARS) FISCAL YEAR 2008
BETTER/ BETTER/ BETTER/ BETTER/ACTUAL PLAN * ACTUAL PLAN (WORSE) ACTUAL PLAN (WORSE) FORECAST PLAN (WORSE) FORECAST PLAN (WORSE)
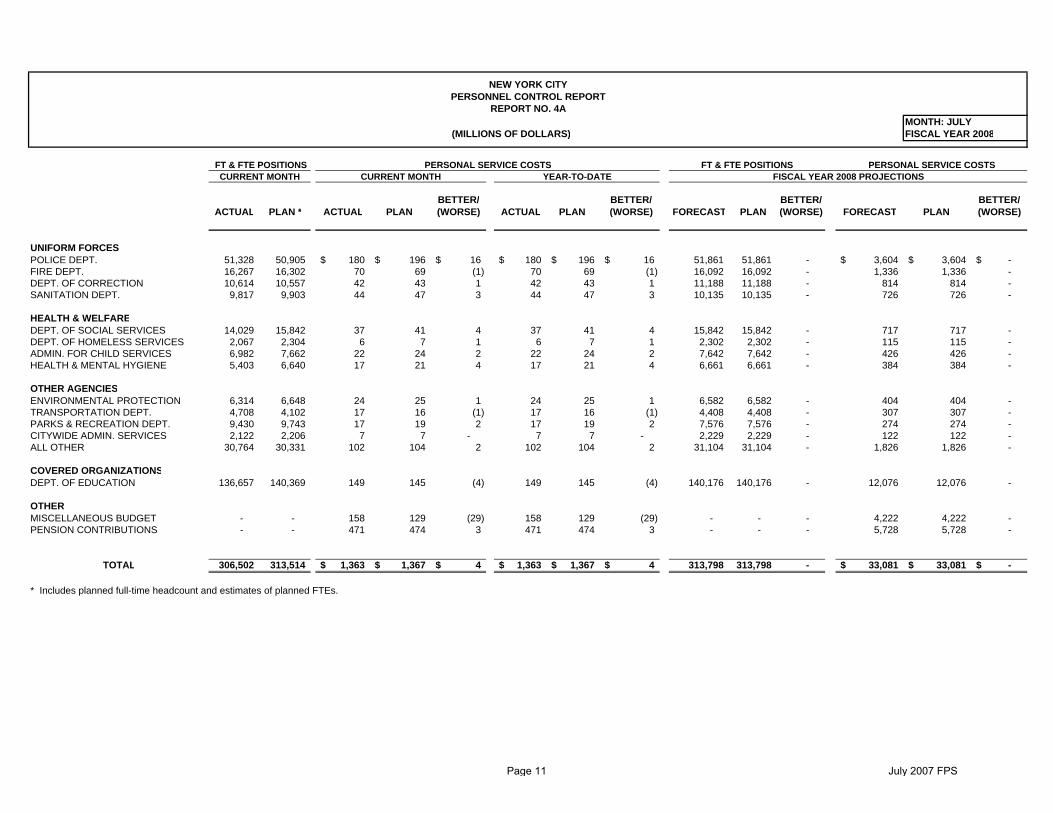
UNIFORM FORCESPOLICE DEPT. 51,328 50,905 180$ 196$ 16$ 180$ 196$ 16$ 51,861 51,861 - 3,604$ 3,604$ -$ FIRE DEPT. 16,267 16,302 70 69 (1) 70 69 (1) 16,092 16,092 - 1,336 1,336 - DEPT. OF CORRECTION 10,614 10,557 42 43 1 42 43 1 11,188 11,188 - 814 814 - SANITATION DEPT. 9,817 9,903 44 47 3 44 47 3 10,135 10,135 - 726 726 -
HEALTH & WELFARE DEPT. OF SOCIAL SERVICES 14,029 15,842 37 41 4 37 41 4 15,842 15,842 - 717 717 - DEPT. OF HOMELESS SERVICES 2,067 2,304 6 7 1 6 7 1 2,302 2,302 - 115 115 - ADMIN. FOR CHILD SERVICES 6,982 7,662 22 24 2 22 24 2 7,642 7,642 - 426 426 - HEALTH & MENTAL HYGIENE 5,403 6,640 17 21 4 17 21 4 6,661 6,661 - 384 384 -
OTHER AGENCIES ENVIRONMENTAL PROTECTION 6,314 6,648 24 25 1 24 25 1 6,582 6,582 - 404 404 - TRANSPORTATION DEPT. 4,708 4,102 17 16 (1) 17 16 (1) 4,408 4,408 - 307 307 - PARKS & RECREATION DEPT. 9,430 9,743 17 19 2 17 19 2 7,576 7,576 - 274 274 - CITYWIDE ADMIN. SERVICES 2,122 2,206 7 7 - 7 7 - 2,229 2,229 - 122 122 - ALL OTHER 30,764 30,331 102 104 2 102 104 2 31,104 31,104 - 1,826 1,826 -
COVERED ORGANIZATIONS DEPT. OF EDUCATION 136,657 140,369 149 145 (4) 149 145 (4) 140,176 140,176 - 12,076 12,076 -
OTHER MISCELLANEOUS BUDGET - - 158 129 (29) 158 129 (29) - - - 4,222 4,222 - PENSION CONTRIBUTIONS - - 471 474 3 471 474 3 - - - 5,728 5,728 -
TOTAL 306,502 313,514 1,363$ 1,367$ 4$ 1,363$ 1,367$ 4$ 313,798 313,798 - 33,081$ 33,081$ -$
* Includes planned full-time headcount and estimates of planned FTEs.
REPORT NO. 4APERSONNEL CONTROL REPORT
NEW YORK CITY
FT & FTE POSITIONS PERSONAL SERVICE COSTS FT & FTE POSITIONS PERSONAL SERVICE COSTSCURRENT MONTH CURRENT MONTH YEAR-TO-DATE FISCAL YEAR 2008 PROJECTIONS
Page 11 July 2007 FPS

NEW YORK CITYPERSONNEL CONTROL REPORT
REPORT NO. 4B
FULL-TIME POSITIONS FULL-TIME POSITIONSCURRENT MONTH FISCAL YEAR 2008 PROJECTIONS
BETTER/ BETTER/ACTUAL PLAN (WORSE) FORECAST PLAN (WORSE)
UNIFORM FORCESPOLICE DEPT. 46,074 46,195 121 46,129 46,129 - FIRE DEPT. 16,187 16,256 69 16,024 16,024 - DEPT. OF CORRECTION 10,532 10,507 (25) 11,139 11,139 - SANITATION DEPT. 9,753 9,802 49 10,025 10,025 -
HEALTH & WELFARE DEPT. OF SOCIAL SERVICES 13,849 15,842 1,993 15,842 15,842 - DEPT. OF HOMELESS SERVICES 2,032 2,300 268 2,300 2,300 - ADMIN. FOR CHILD SERVICES 6,911 7,601 690 7,582 7,582 - HEALTH & MENTAL HYGIENE 4,193 5,155 962 5,209 5,209 -
OTHER AGENCIES ENVIRONMENTAL PROTECTION 5,850 6,267 417 6,300 6,300 - TRANSPORTATION DEPT. 4,304 3,935 (369) 4,229 4,229 - PARKS & RECREATION DEPT. 3,556 3,891 335 3,891 3,891 - CITYWIDE ADMIN. SERVICES 1,826 1,895 69 1,962 1,962 - ALL OTHER 25,665 26,334 669 27,279 27,279 -
COVERED ORGANIZATIONS DEPT. OF EDUCATION 120,925 123,399 2,474 123,206 123,206 -
TOTAL 271,657 279,379 7,722 281,117 281,117 -
MONTH: JULYFISCAL YEAR 2008
Page 12 July 2007 FPS

NOTES TO REPORTS NO. 4, 4A AND 4B
The current month, year-to-date and fiscal year plan data in Reports No. 4, 4A & 4B reflect the Financial Plan submitted to the Financial Control Board on June 20, 2007. There are 306,502 filled positions as of July of which 271,657 are full-time positions and 34,845 are full-time equivalent positions. Of the 306,502 filled positions, 264,881 are estimated to be wholly or partially city funded. For the fiscal year (June 30, 2008) 281,117 of the 313,798 positions are full-time and 270,164 of the 313,798 positions are estimated to be city funded positions.
In some instances prior year charges are reflected in FY2008 year-to-date expenses. These will be journaled back to prior years at a later date.
Department of Sanitation: The $(43) million year-to-date variance is primarily due to:
• $(64) million in accelerated encumbrances, primarily for municipal waste export and automotive supplies and materials.
• $18 million in delayed encumbrances, primarily for motor vehicle fuel and general contractual services. • $3 million in personal services.
Department of Social Services: The $208 million year-to-date variance is primarily due to:
• $204 million in OTPS, reflecting delayed encumbrances of $100 million for aid to dependent children, $60
million for medical assistance, $58 million for payments for home relief, $13 million for non-grant charges, $9 million for rentals of land, buildings and structures and $4 million for general supplies and materials, offset by accelerated encumbrances of $(10) million for homeless family services, $(9) million for AIDS services, $(5) million for security services, $(4) million for employment services, $(3) million for food and forage supplies and $(3) million for data processing equipment.
• $4 million in personal services.
Page 13 July 2007 FPS

Department of Homeless Services: The $63 million year-to-date variance is primarily due to:
• $89 million in delayed encumbrances, including $64 million for homeless family services, $16 million for security services, $3 million for general contractual services and $3 million for general maintenance and repairs.
• $(26) million in accelerated encumbrances, primarily for homeless individual services.
Administration for Children’s Services: The $411 million year-to-date variance is primarily due to:
• $476 million in delayed encumbrances, including $329 million for subsidized adoption, $77 million for
children’s charitable institutions, $38 million for child welfare services, $14 million for Head Start, $9 million for general fixed charges, $4 million for direct foster care of children and $4 million for rentals of land, buildings and structures.
• $(67) million in accelerated encumbrances, primarily for day care of children and general maintenance and
repairs.
• $2 million in personal services. Department of Health and Mental Hygiene: The $204 million year-to-date variance is primarily due to:
• $300 million in delayed encumbrances, including $274 million for mental hygiene services, $15 million for AIDS services and $4 million for general supplies and materials.
• $(100) million in accelerated encumbrances, including $(37) million for general contractual services, $(35)
million for mental health services, $(14) million for other professional services and $(4) million for medical, surgical and lab supplies.
• $4 million in personal service.
Page 14 July 2007 FPS

Department of Housing Preservation and Development: The $(49) million year-to-date variance is primarily due to:
• $(54) million in accelerated encumbrances, including $(30) million for general contractual services, $(6) million for fuel oil, $(5) million for Federal 8 rent subsidy, $(4) million for community consultant contracts and $(4) million for maintenance costs.
• $5 million in delayed encumbrances, primarily for other general expenses.
Department of Transportation: The $49 million year-to-date variance is primarily due to:
• $76 million in delayed encumbrances, including $25 million for maintenance and operation of infrastructures, $15 million for rentals of land, buildings and structures, $8 million for general contractual services, $7 million for security services, $5 million for general maintenance and repairs, $4 million for cleaning services and $4 million for maintenance and repairs of motor vehicle equipments.
• $(27) million in accelerated encumbrances primarily for general supplies and materials and motor vehicle
fuel. Department of Citywide Administrative Services: The $453 million year-to-date variance is primarily due to:
• $459 million in delayed encumbrances, including $440 million for heat, light and power, $8 million for rentals of land, buildings and structures, $6 million for general maintenance and repairs and $3 million for security services.
• $(6) million in accelerated encumbrances, primarily for maintenance supplies.
Department of Education: The $870 million year-to-date variance is primarily due to:
• $(4) million in personal services, of which $(10) million represents backpay that will be journaled to prior years and $6 million represents the current year spending variance.
• $874 million in OTPS, including delayed encumbrances of $416 million for transportation of pupils, $293
Page 15 July 2007 FPS

million for contract payments, $81 million for professional direct educational services, $34 million for other books, $30 million for general supplies and materials and $9 million for general contractual services.
Higher Education: The $(35) million year-to-date variance is primarily due to:
• $(32) million in OTPS, reflecting accelerated encumbrances of $(15) million for CUNY senior expenses, $(13) million for college student financial assistance and $(3) million for general contractual services.
• $(3) million in personal services.
Debt Service: The $(113) million year-to-date variance is primarily due to earlier than planned obligation for Interest Exchange Agreements ($82 million), Floating Rate Support Costs ($14 million), Lease Debt ($12 million) and general interest on bonds ($4 million).
Page 16 July 2007 FPS

Report No. 5
Capital Commitments

CITY OF NEW YORKCAPITAL COMMITMENTS
REPORT NO. 5(Dollars in Millions)
MONTH: JULY FISCAL YEAR: 2008
CURRENT MONTH YEAR-TO-DATE FISCAL YEARDESCRIPTION ACTUAL PLAN ACTUAL PLAN PLAN
TRANSIT $0.0 (C) $0.0 (C) $0.0 (C) $0.0 (C) $80.0 (C)0.0 (N) 0.0 (N) 0.0 (N) 0.0 (N) 0.0 (N)
HIGHWAY AND STREETS 0.4 (C) 1.9 (C) 0.4 (C) 1.9 (C) 441.1 (C) 0.0 (N) 0.0 (N) 0.0 (N) 0.0 (N) 121.3 (N)
HIGHWAY BRIDGES 1.5 (C) 11.0 (C) 1.5 (C) 11.0 (C) 666.9 (C)0.0 (N) 0.0 (N) 0.0 (N) 0.0 (N) 66.7 (N)
WATERWAY BRIDGES 0.0 (C) 0.0 (C) 0.0 (C) 0.0 (C) 399.4 (C)0.0 (N) 0.0 (N) 0.0 (N) 0.0 (N) 316.5 (N)
WATER SUPPLY 0.0 (C) 0.3 (C) 0.0 (C) 0.3 (C) 18.0 (C)0.0 (N) 0.0 (N) 0.0 (N) 0.0 (N) 0.0 (N)
WATER MAINS, 33.0 (C) 153.3 (C) 33.0 (C) 153.3 (C) 1,411.9 (C)SOURCES & TREATMENT 0.0 (N) 0.0 (N) 0.0 (N) 0.0 (N) 0.0 (N)
SEWERS 2.2 (C) 6.7 (C) 2.2 (C) 6.7 (C) 186.9 (C)0.0 (N) 0.0 (N) 0.0 (N) 0.0 (N) 0.0 (N)
WATER POLLUTION CONTROL 10.8 (C) 25.9 (C) 10.8 (C) 25.9 (C) 1,485.9 (C) 0.0 (N) 0.0 (N) 0.0 (N) 0.0 (N) 0.0 (N)
ECONOMIC DEVELOPMENT 0.0 (C) 0.0 (C) 0.0 (C) 0.0 (C) 438.5 (C)0.0 (N) 0.0 (N) 0.0 (N) 0.0 (N) 7.5 (N)
PORT DEVELOPMENT 0.0 (C) 0.0 (C) 0.0 (C) 0.0 (C) 0.0 (C)0.0 (N) 0.0 (N) 0.0 (N) 0.0 (N) 0.0 (N)
EDUCATION 100.0 (C) 0.0 (C) 100.0 (C) 0.0 (C) 1,032.4 (C)219.0 (N) 0.0 (N) 219.0 (N) 0.0 (N) 2,031.3 (N)
SYMBOLS:(C) CITY FUNDS(N) NON-CITY FUNDS, FEDERAL AND OTHER SOURCES
Page 17 July 2007 FPS
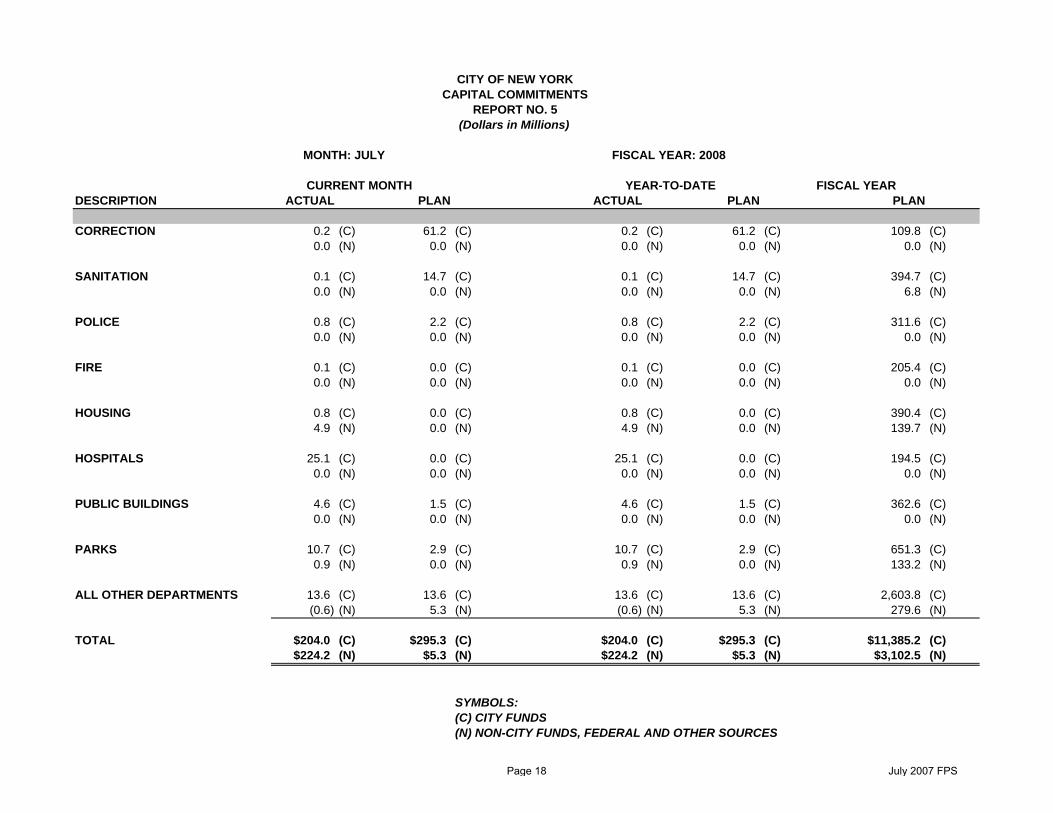
CITY OF NEW YORKCAPITAL COMMITMENTS
REPORT NO. 5(Dollars in Millions)
MONTH: JULY FISCAL YEAR: 2008
CURRENT MONTH YEAR-TO-DATE FISCAL YEARDESCRIPTION ACTUAL PLAN ACTUAL PLAN PLAN
CORRECTION 0.2 (C) 61.2 (C) 0.2 (C) 61.2 (C) 109.8 (C)0.0 (N) 0.0 (N) 0.0 (N) 0.0 (N) 0.0 (N)
SANITATION 0.1 (C) 14.7 (C) 0.1 (C) 14.7 (C) 394.7 (C)0.0 (N) 0.0 (N) 0.0 (N) 0.0 (N) 6.8 (N)
POLICE 0.8 (C) 2.2 (C) 0.8 (C) 2.2 (C) 311.6 (C)0.0 (N) 0.0 (N) 0.0 (N) 0.0 (N) 0.0 (N)
FIRE 0.1 (C) 0.0 (C) 0.1 (C) 0.0 (C) 205.4 (C)0.0 (N) 0.0 (N) 0.0 (N) 0.0 (N) 0.0 (N)
HOUSING 0.8 (C) 0.0 (C) 0.8 (C) 0.0 (C) 390.4 (C)4.9 (N) 0.0 (N) 4.9 (N) 0.0 (N) 139.7 (N)
HOSPITALS 25.1 (C) 0.0 (C) 25.1 (C) 0.0 (C) 194.5 (C)0.0 (N) 0.0 (N) 0.0 (N) 0.0 (N) 0.0 (N)
PUBLIC BUILDINGS 4.6 (C) 1.5 (C) 4.6 (C) 1.5 (C) 362.6 (C)0.0 (N) 0.0 (N) 0.0 (N) 0.0 (N) 0.0 (N)
PARKS 10.7 (C) 2.9 (C) 10.7 (C) 2.9 (C) 651.3 (C)0.9 (N) 0.0 (N) 0.9 (N) 0.0 (N) 133.2 (N)
ALL OTHER DEPARTMENTS 13.6 (C) 13.6 (C) 13.6 (C) 13.6 (C) 2,603.8 (C)(0.6) (N) 5.3 (N) (0.6) (N) 5.3 (N) 279.6 (N)
TOTAL $204.0 (C) $295.3 (C) $204.0 (C) $295.3 (C) $11,385.2 (C)$224.2 (N) $5.3 (N) $224.2 (N) $5.3 (N) $3,102.5 (N)
SYMBOLS:(C) CITY FUNDS(N) NON-CITY FUNDS, FEDERAL AND OTHER SOURCES
Page 18 July 2007 FPS

NEW YORK CITY
CAPITAL COMMITMENTS REPORT NO. 5 (MILLIONS IN DOLLARS) Month: July Fiscal Year: 2008 City Funds: Total Authorized Commitment Plan $11,385 Less: Reserve for Unattained Commitments (1,187) Commitment Plan $10,198 Non-City Funds: Total Authorized Commitment Plan $3,103 Less: Reserve for Unattained Commitments 0 Commitment Plan $3,103 Month and year-to-date variances are reported against the authorized FY 2008 Executive Capital Commitment Plan of $11,385 million rather than the Financial Plan level of $10,198 million. The additional $1,187 million of commitments is included to help the City meet the overall Financial Plan target. Aggregate commitments are not expected to exceed the approved plan level as it may be modified from time to time.
Page 19 July 2007 FPS

Report No. 5A
Capital Cash Flow

CITY OF NEW YORKCAPITAL CASHFLOW
REPORT NO. 5A(Dollars in Millions)
MONTH: JULY FISCAL YEAR 2008
CURRENT MONTH YEAR-TO-DATE FISCAL YEARDESCRIPTION ACTUAL ACTUAL PLAN
TRANSIT $0.0 (C) $0.0 (C) $49.6 (C)0.0 (N) 0.0 (N) 6.2 (N)
HIGHWAY AND STREETS 12.4 (C) 12.4 (C) 276.1 (C) 0.7 (N) 0.7 (N) 37.8 (N)
HIGHWAY BRIDGES 9.0 (C) 9.0 (C) 296.1 (C)3.2 (N) 3.2 (N) 22.3 (N)
WATERWAY BRIDGES 10.0 (C) 10.0 (C) 166.8 (C)3.1 (N) 3.1 (N) 105.2 (N)
WATER SUPPLY 18.4 (C) 18.4 (C) 149.0 (C)0.0 (N) 0.0 (N) 0.0 (N)
WATER MAINS, 47.4 (C) 47.4 (C) 640.2 (C)SOURCES & TREATMENT 0.0 (N) 0.0 (N) 0.7 (N)
SEWERS 16.1 (C) 16.1 (C) 110.0 (C)0.1 (N) 0.1 (N) 0.3 (N)
WATER POLLUTION CONTROL 99.1 (C) 99.1 (C) 813.2 (C) 0.6 (N) 0.6 (N) 24.7 (N)
ECONOMIC DEVELOPMENT 8.8 (C) 8.8 (C) 292.8 (C)1.6 (N) 1.6 (N) 62.2 (N)
PORT DEVELOPMENT 0.0 (C) 0.0 (C) 0.0 (C)0.0 (N) 0.0 (N) 0.0 (N)
EDUCATION 23.5 (C) 23.5 (C) 563.7 (C)378.0 (N) 378.0 (N) 2,285.0 (N)
SYMBOLS:(C) CITY FUNDS(N) NON-CITY FUNDS, FEDERAL AND OTHER SOURCES
Page 20 July 2007 FPS
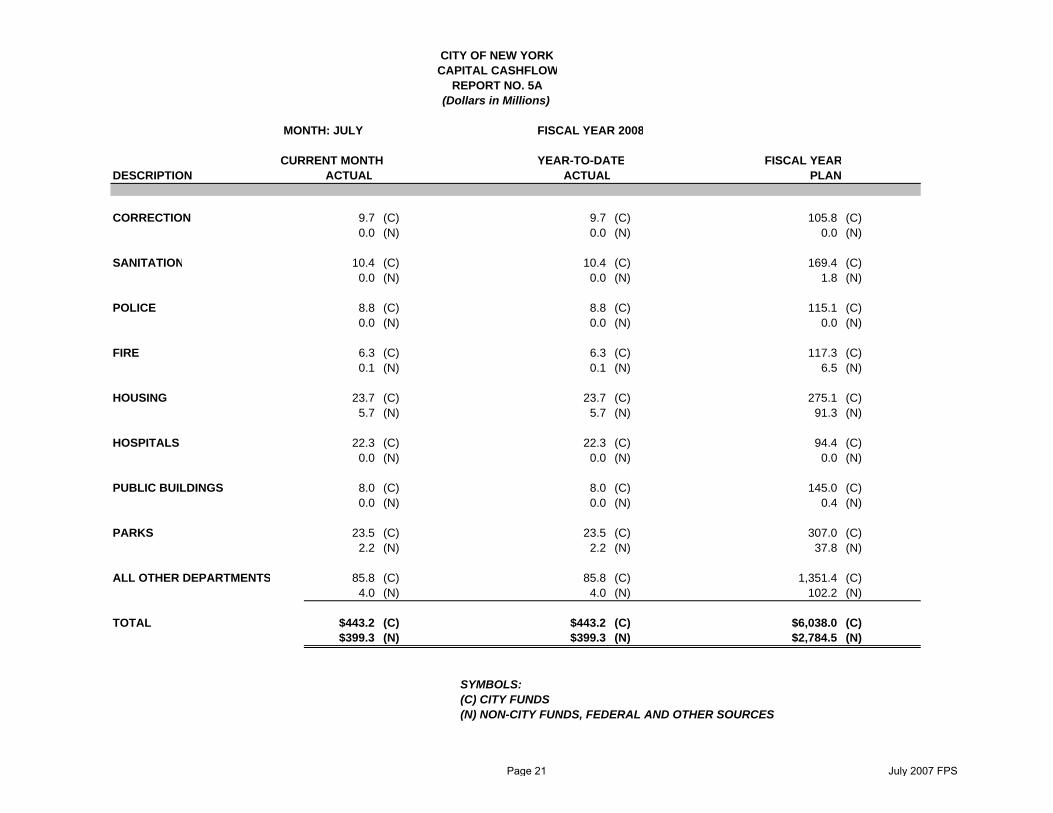
CITY OF NEW YORKCAPITAL CASHFLOW
REPORT NO. 5A(Dollars in Millions)
MONTH: JULY FISCAL YEAR 2008
CURRENT MONTH YEAR-TO-DATE FISCAL YEARDESCRIPTION ACTUAL ACTUAL PLAN
CORRECTION 9.7 (C) 9.7 (C) 105.8 (C)0.0 (N) 0.0 (N) 0.0 (N)
SANITATION 10.4 (C) 10.4 (C) 169.4 (C)0.0 (N) 0.0 (N) 1.8 (N)
POLICE 8.8 (C) 8.8 (C) 115.1 (C)0.0 (N) 0.0 (N) 0.0 (N)
FIRE 6.3 (C) 6.3 (C) 117.3 (C)0.1 (N) 0.1 (N) 6.5 (N)
HOUSING 23.7 (C) 23.7 (C) 275.1 (C)5.7 (N) 5.7 (N) 91.3 (N)
HOSPITALS 22.3 (C) 22.3 (C) 94.4 (C)0.0 (N) 0.0 (N) 0.0 (N)
PUBLIC BUILDINGS 8.0 (C) 8.0 (C) 145.0 (C)0.0 (N) 0.0 (N) 0.4 (N)
PARKS 23.5 (C) 23.5 (C) 307.0 (C)2.2 (N) 2.2 (N) 37.8 (N)
ALL OTHER DEPARTMENTS 85.8 (C) 85.8 (C) 1,351.4 (C)4.0 (N) 4.0 (N) 102.2 (N)
TOTAL $443.2 (C) $443.2 (C) $6,038.0 (C)$399.3 (N) $399.3 (N) $2,784.5 (N)
SYMBOLS:(C) CITY FUNDS(N) NON-CITY FUNDS, FEDERAL AND OTHER SOURCES
Page 21 July 2007 FPS

Report No. 6 & 6A
Month-by-Month Cash Flow Forecast

MONTH-BY-MONTH CASH FLOW FORECASTREPORT NO. 6
MONTH: JULY (MILLIONS OF DOLLARS) FISCAL YEAR 2008
ACTUAL 12 ADJUST-JUL AUG SEP OCT NOV DEC JAN FEB MAR APR MAY JUN Months MENTS TOTAL
CASH INFLOWSCURRENT
GENERAL PROPERTY TAX $3,590 $109 $308 $345 $47 $2,392 $2,714 $49 $511 $273 $23 $2,065 $12,426 $558 $12,984OTHER TAXES 443 1,079 2,856 1,373 1,479 2,690 2,870 1,432 2,308 2,381 1,051 2,933 22,895 596 23,491 FEDERAL GRANTS 159 70 184 220 193 594 281 429 443 453 396 429 3,851 1,444 5,295 STATE GRANTS 108 133 779 204 617 797 243 763 3,260 284 1,271 972 9,431 1,393 10,824 OTHER CATEGORICAL 53 42 98 71 43 71 80 45 64 104 42 71 784 222 1,006 UNRESTRICTED (NET OF DISALL.) 6 (6) - - - - - - - - (5) (10) (15) 340 325 MISCELLANEOUS REVENUES 511 351 275 292 300 285 305 254 347 872 366 446 4,604 - 4,604 CAPITAL INTER-FUND TRANSFERS - 34 17 21 20 61 23 24 26 66 26 26 344 92 436
SUBTOTAL 4,870 1,812 4,517 2,526 2,699 6,890 6,516 2,996 6,959 4,433 3,170 6,932 54,320 4,645 58,965 PRIOR
OTHER TAXES 437 179 60 - - - - - - - - - 676 - 676 FEDERAL GRANTS 205 165 117 122 81 167 113 73 152 52 43 103 1,393 795 2,188 STATE GRANTS 56 250 454 82 59 112 54 122 141 47 71 81 1,529 546 2,075 OTHER CATEGORICAL 28 48 41 6 3 3 6 21 5 5 5 2 173 189 362 UNRESTRICTED - 6 20 - - - - - - - - 13 39 (6) 33 MISC. REVENUE/CAPITAL IFA 118 52 - - - - - - - - - - 170 (170) -
SUBTOTAL 844 700 692 210 143 282 173 216 298 104 119 199 3,980 1,354 5,334
CAPITALCAPITAL TRANSFERS 309 368 601 1,201 603 553 213 197 947 831 703 499 7,025 (987) 6,038 FEDERAL AND STATE 237 215 214 214 309 249 117 218 240 220 264 255 2,752 33 2,785
OTHERSENIOR COLLEGES 1 1 - 274 99 1 1 420 252 1 130 413 1,593 - 1,593 HOLDING ACCT. & OTHER ADJ. 15 (15) - - - - - - - - - - - - - OTHER SOURCES 645 - - - - - - - - - - - 645 - 645
TOTAL INFLOWS $6,921 $3,081 $6,024 $4,425 $3,853 $7,975 $7,020 $4,047 $8,696 $5,589 $4,386 $8,298 $70,315 $5,045 $75,360
CASH OUTFLOWSCURRENT
PS $1,319 $1,696 $2,104 $2,388 $3,320 $2,538 $2,736 $2,526 $2,219 $2,475 $3,372 $4,046 $30,739 $2,342 $33,081OTPS 1,215 1,391 1,713 1,865 1,706 1,608 1,819 1,662 2,247 1,740 1,986 2,267 21,219 1,692 22,911 DEBT SERVICE 36 12 14 18 32 14 28 12 13 35 57 2,692 2,963 - 2,963 MAC FUNDING - - - - 5 - - - - 5 - - 10 - 10
SUBTOTAL 2,570 3,099 3,831 4,271 5,063 4,160 4,583 4,200 4,479 4,255 5,415 9,005 54,931 4,034 58,965 PRIOR
PS 1,280 785 85 35 35 35 300 30 30 30 30 30 2,705 - 2,705 OTPS 922 353 25 50 50 300 50 200 50 50 50 20 2,120 - 2,120 OTHER TAXES 81 135 - - - - - - - - - - 216 - 216 DISALLOWANCE RESERVE - - - - - - - - - - - - - 899 899
SUBTOTAL 2,283 1,273 110 85 85 335 350 230 80 80 80 50 5,041 899 5,940 CAPITAL
CITY DISBURSEMENTS 443 369 405 514 629 496 514 599 381 575 460 653 6,038 - 6,038 FEDERAL AND STATE 399 51 408 32 410 51 441 28 437 27 429 72 2,785 - 2,785
OTHERSENIOR COLLEGES 116 146 88 187 197 111 144 97 148 194 66 99 1,593 - 1,593 OTHER USES - - - - - - - - - - - 645 645 - 645
TOTAL OUTFLOWS $5,811 $4,938 $4,842 $5,089 $6,384 $5,153 $6,032 $5,154 $5,525 $5,131 $6,450 $10,524 $71,033 $4,933 $75,966
NET CASH FLOW $1,110 ($1,857) $1,182 ($664) ($2,531) $2,822 $988 ($1,107) $3,171 $458 ($2,064) ($2,226) ($718) $112 ($606)
BEGINNING BALANCE $4,473 $5,583 $3,726 $4,908 $4,244 $1,713 $4,535 $5,523 $4,416 $7,587 $8,045 $5,981 $4,473ENDING BALANCE $5,583 $3,726 $4,908 $4,244 $1,713 $4,535 $5,523 $4,416 $7,587 $8,045 $5,981 $3,755 $3,755
NEW YORK CITY
FORECAST
Page 22 July 2007 FPS
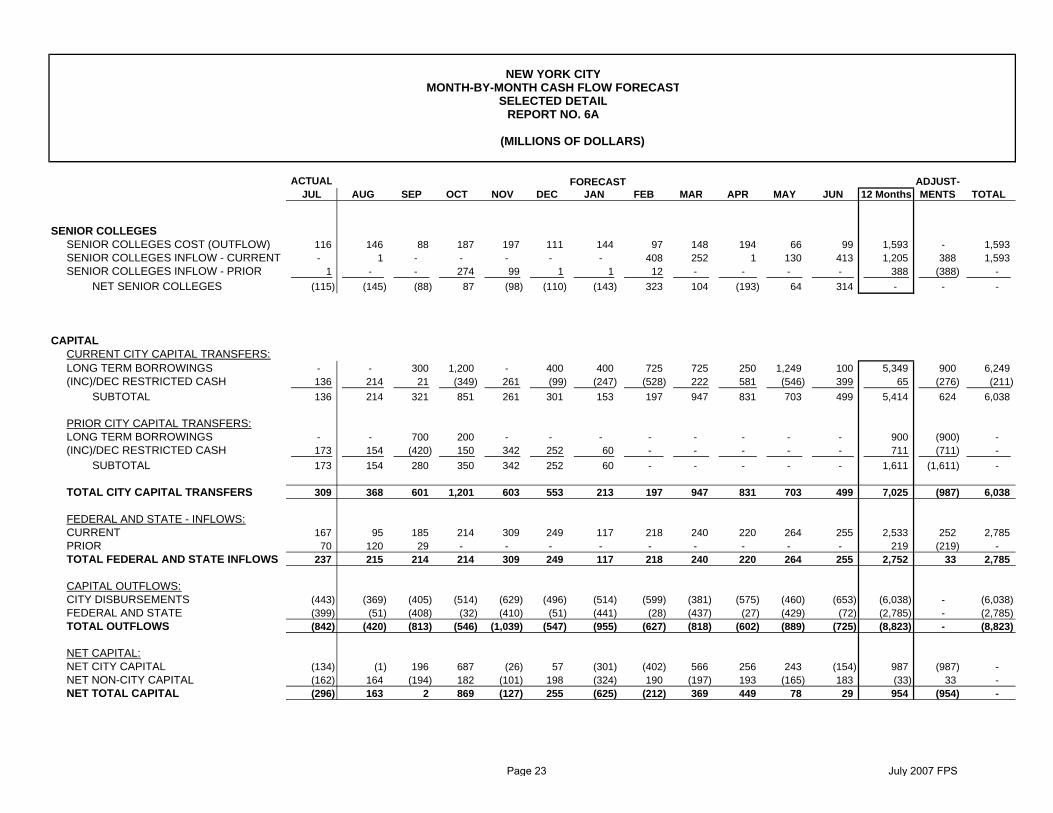
NEW YORK CITYMONTH-BY-MONTH CASH FLOW FORECAST
SELECTED DETAIL
(MILLIONS OF DOLLARS)
ACTUAL ADJUST-JUL AUG SEP OCT NOV DEC JAN FEB MAR APR MAY JUN 12 Months MENTS TOTAL
SENIOR COLLEGES SENIOR COLLEGES COST (OUTFLOW) 116 146 88 187 197 111 144 97 148 194 66 99 1,593 - 1,593 SENIOR COLLEGES INFLOW - CURRENT - 1 - - - - - 408 252 1 130 413 1,205 388 1,593 SENIOR COLLEGES INFLOW - PRIOR 1 - - 274 99 1 1 12 - - - - 388 (388) -
NET SENIOR COLLEGES (115) (145) (88) 87 (98) (110) (143) 323 104 (193) 64 314 - - -
CAPITALCURRENT CITY CAPITAL TRANSFERS:LONG TERM BORROWINGS - - 300 1,200 - 400 400 725 725 250 1,249 100 5,349 900 6,249 (INC)/DEC RESTRICTED CASH 136 214 21 (349) 261 (99) (247) (528) 222 581 (546) 399 65 (276) (211)
SUBTOTAL 136 214 321 851 261 301 153 197 947 831 703 499 5,414 624 6,038
PRIOR CITY CAPITAL TRANSFERS:LONG TERM BORROWINGS - - 700 200 - - - - - - - - 900 (900) - (INC)/DEC RESTRICTED CASH 173 154 (420) 150 342 252 60 - - - - - 711 (711) -
SUBTOTAL 173 154 280 350 342 252 60 - - - - - 1,611 (1,611) -
TOTAL CITY CAPITAL TRANSFERS 309 368 601 1,201 603 553 213 197 947 831 703 499 7,025 (987) 6,038
FEDERAL AND STATE - INFLOWS:CURRENT 167 95 185 214 309 249 117 218 240 220 264 255 2,533 252 2,785 PRIOR 70 120 29 - - - - - - - - - 219 (219) - TOTAL FEDERAL AND STATE INFLOWS 237 215 214 214 309 249 117 218 240 220 264 255 2,752 33 2,785
CAPITAL OUTFLOWS:CITY DISBURSEMENTS (443) (369) (405) (514) (629) (496) (514) (599) (381) (575) (460) (653) (6,038) - (6,038) FEDERAL AND STATE (399) (51) (408) (32) (410) (51) (441) (28) (437) (27) (429) (72) (2,785) - (2,785) TOTAL OUTFLOWS (842) (420) (813) (546) (1,039) (547) (955) (627) (818) (602) (889) (725) (8,823) - (8,823)
NET CAPITAL:NET CITY CAPITAL (134) (1) 196 687 (26) 57 (301) (402) 566 256 243 (154) 987 (987) - NET NON-CITY CAPITAL (162) 164 (194) 182 (101) 198 (324) 190 (197) 193 (165) 183 (33) 33 - NET TOTAL CAPITAL (296) 163 2 869 (127) 255 (625) (212) 369 449 78 29 954 (954) -
REPORT NO. 6A
FORECAST
Page 23 July 2007 FPS

NOTES TO REPORT #6/6A 1. Beginning Balance The July 2007 beginning balance is preliminary and subject to the FY 2007 audited Comprehensive Annual Financial Report (CAFR). 2. Ending Balances
The actual monthly ending cash balances are subject to restatement after the completion of bank reconciliations and the FY 2007 audited Comprehensive Annual Financial Report (CAFR). The June 2008 ending balance includes deferred revenue from FY 2009 prepaid Real Estate Taxes. 3. Long Term Borrowings
Long Term Borrowings are comprised of proceeds of City general obligation bonds, NYC TFA debt and Water Authority revenue bonds and financing provided by Pay-As-You-Go Capital, exclusive of bonds issued for refunding.
4. Restricted Cash Bond Proceeds
In certain instances a portion of the proceeds from each bond issuance is for capital expenditures to be made in
succeeding months. Restricted cash bond proceeds accounts have been set up for this purpose. Balances in these accounts are excluded from the cash balances that are reflected in Report #6.
Page 24 July 2007 FPS