Embed Size (px)
Citation preview

8/6/2019 Financial Performance Analysis of Prudential Bank Final Edit
http://slidepdf.com/reader/full/financial-performance-analysis-of-prudential-bank-final-edit 1/27
1
Table of Content
1. Introduction................................ ................................ ................................ .................... 3
1.1 Methodology ................................ ................................ ................................ ................................ ..... 3
2. Industry Description and Analysis ................................ ................................ ................ 4
2.1 Current Trends in the Industry ................................ ................................ ................................ .......... 5
3. Company Description and Analysis ................................ ................................ .............. 6
3.1 The Bank¶s Shareholders are: ................................ ................................ ................................ ........... 6
3.2 Corporate Mission of the Bank ................................ ................................ ................................ .......... 6
3.3 Products and services ................................ ................................ ................................ ....................... 7 a. Domestic Banking ................................ ................................ ................................ ........................... 7 b. Specialized Retail Banking Services ................................ ................................ ............................... 7 c. International Banking................................ ................................ ................................ ..................... 7 d. Non- traditional exports/projects financing................................ ................................ .................... 8 e. PBL¶s e-Banking Products and Services Include: ................................ ................................ .......... 8
3.4 Success Story and what is impressive about Prudential Bank Ltd. ................................ ...................... 9
4. Identification of Significant Accounting polices................................ .......................... 11 4.1 Basis of Accounting ................................ ................................ ................................ ......................... 11
4.2 F unctional and Presentation Currency ................................ ................................ ............................ 11
4.3 Revenue Recognition ................................ ................................ ................................ ....................... 11 a. Interest Income and Expense ................................ ................................ ................................ ........... 11 b. Non-Interest Income ................................ ................................ ................................ ....................... 11 c. Income Tax ................................ ................................ ................................ ................................ ..... 12 d. Regulatory Impairment Reserve ................................ ................................ ................................ ...... 12 e. Property, plant and equipment ................................ ................................ ................................ ......... 12 f. Intangible Assets- Computer Software ................................ ................................ ............................. 12 g. Provisions ................................ ................................ ................................ ................................ ....... 12 h. Foreign Currency ................................ ................................ ................................ ............................ 12 i. Post Balance Sheet Events ................................ ................................ ................................ ............... 13
5. Analysis of the Bank¶s Financials ................................ ................................ ................ 13
5.1 Trend Analysis ................................ ................................ ................................ ................................ 13 a. Net Interest Income ................................ ................................ ................................ ......................... 14 b. Net Operating Income [Total (Gross) Income] and Operating Expenses ............ ......... ........ ... ........ ... 14 c. Profit before Tax ................................ ................................ ................................ ............................. 14 d. Assets ................................ ................................ ................................ ................................ ............. 14 e. Shareholder¶s Fund ................................ ................................ ................................ ......................... 15
5.2 V ertical Analysis ................................ ................................ ................................ ............................. 15 a. Net Interest Income and Net Operating Income................................ ................................ ........... 16 b. Pre-Tax Profit ................................ ................................ ................................ ............................... 16 c. Assets and Liabilities................................ ................................ ................................ ..................... 17
5.3 Key Ratios Analysis................................ ................................ ................................ ......................... 18 a. Profitability Ratios ................................ ................................ ................................ ........................ 18 b. Liquidity Ratio ................................ ................................ ................................ .............................. 19 c. Solvency Ratios ................................ ................................ ................................ ............................. 20
6. Evaluation and Summary ................................ ................................ ............................ 20
7. Limitations of Ratio and Financial Statement Analysis ................................ ............. 21
8. Appendices ................................ ................................ ................................ ................... 24
Appendix A - F inal Accounts of Prudential Bank Limited between the Periods of 2005 - 2009 ........................ 24

8/6/2019 Financial Performance Analysis of Prudential Bank Final Edit
http://slidepdf.com/reader/full/financial-performance-analysis-of-prudential-bank-final-edit 2/27
2
Appendix B ± Graphical representation of the Profit and Loss Account Trend Analysis.............................. 26
Appendix C - Graphical representation of the Balance Trend Analysis ................................ ....................... 26
9. Reference ................................ ................................ ................................ ...................... 27

8/6/2019 Financial Performance Analysis of Prudential Bank Final Edit
http://slidepdf.com/reader/full/financial-performance-analysis-of-prudential-bank-final-edit 3/27
3
1. Introduction
The purpose of this project is to apply the knowledge acquired in Financial Management to
analyze and evaluate the financial performance of a non listed organization, specifically
Prudential Bank, Ghana Limited. To achieve this objective, the financial strengths and
weaknesses of the bank were assessed using the methodology mentioned below. Results of the
evaluation will be valuable in making investment and other business related decisions.
1.1 Methodology
The methods used in computing and analyzing the financial performance for the organization
includes the use of the following tools:
Calculation of relevant financial ratios
- Profitability
- Liquidity
- Efficiency (activity)
- Solvency
Assessment by trend analysis and
Assessment by vertical analysis

8/6/2019 Financial Performance Analysis of Prudential Bank Final Edit
http://slidepdf.com/reader/full/financial-performance-analysis-of-prudential-bank-final-edit 4/27
4
2. Industry Descri ti n and Analysis
As at December 2009 t e number of commercial Bank s in Ghana stood at 26, a considerable
upshot from the lower number s of the late 1990s. However, the commercial bank ing terrain has
not changed dramaticall with about four ma jor bank s, Barclays, GCB, Standard char ted and
SG- SSB jointly accounting for over 60% of the total bank ing sector assets and deposits (B G
R epor t, 2008). As at 2008 year-end only two bank s, Barclays and Ghana Commercial Bank,
have more than a hundred branches nationwide and 17 bank s have less than 20 branches each
across the country, showing glar ing dis par ities in outreach strategies of the commercial bank s.
Des pite the renewed interest in the bank ing sector and the overall competitiveness of the
f inancial services sector some urban areas and most rural areas continue to remain under served
by commercial bank s, a situation that offer s some oppor tunity to Micro Finance Institutions.
For example, there are only 5 commercial bank s which have a presence in Upper East and
Upper West R egions: Barclays, NIB, ADB, GCB and SG-SB. These bank s, plus four other s
(each with only one branch bank), are the only commercial bank s in the Nor thern R egion. As
indicated in Figure 1, the total number of bank s¶ branches in these three regions (34) is lesser
than the number of total bank s¶ branches in the Eastern R egion alone (38) and less than 13% of
the total bank s¶ branches in Greater Accra alone (264).
Figure 1: Total of Commercial Bank s' Branch Network s In Each R egion
Bank of Ghana (May 2008)
This situation will not change in the medium to long-term given the considerable hurdle to
overcome in generating the level of commercial activity in most of the under served areas; and

8/6/2019 Financial Performance Analysis of Prudential Bank Final Edit
http://slidepdf.com/reader/full/financial-performance-analysis-of-prudential-bank-final-edit 5/27
5
the kind of activity that will necessitate the required geographical spread by the commercial
banks.
The Central bank have sought to engender healthy competition among banks by admitting new
banks into the system, while encouraging existing banks to beef up their capital and adopt
universal banking. The result is an evolving competitive banking sector that has witnessed
continuing growth in banking sector assets, liabilities and incomes.
A number of critical factors that have to underpin banking operations for success in the market
includes the provision of quality products and services, competitive pricing of these products
and services, operational efficiency and enhanced access by customers to products and services
that meet their needs. And there is the need to satisfy the growing needs of the market without
compromising standards.
Ghana's financial sector reforms have increased the banking system's resilience to potential
financial shocks. Moreover, the central bank is carefully monitoring the system's financial
stability; it publishes a periodic financial stability report that is discussed by the central bank's
monetary policy committee.
2.1 Current Trends in the Industry
Most banks now employ cutting edge technologies to roll out their products to the Ghanaian
customer. Banking halls are housed in ultra modern buildings, staffed with well trained smart
looking ladies and gentlemen.
The re-denomination of the cedi and the development of appropriate technological solutions
such as cash cards, mobile and internet banking, and biometric solutions are all reshaping the
financial sector and redefining the way forward in doing modern business with the financial
sector as a vital backbone for sustenance and growth.
The Bank of Ghana, in pursuance of its objective to enhance the efficiency and security of
existing payment systems to bring them up to international standards, introduced the ChequeCodeline Clearing System in the year 2009. The system currently ensures clearance of cheques
within two days and is intended to enhance efficiency, reliability and timeliness in the clearing
of cheques.
A further addition to the payment automation process is a system to manage non-cheque inter-
bank transfers through the Automated Clearing House System.

8/6/2019 Financial Performance Analysis of Prudential Bank Final Edit
http://slidepdf.com/reader/full/financial-performance-analysis-of-prudential-bank-final-edit 6/27
6
The Base II Framework for Capital Measurement and Capital Standards has been adopted with
implementation to commence in 2010. This would ensure that banks maintain adequate capital
at all times to manage the various types of risks inherent in their operations.
3. Company Description and Analysis
Prudential Bank Limited (PBL) was incorporated as a private limited liability company in 1993
under the Companies Code 1963 (Act 179). The Bank opened its doors for business on 15th
August, 1996 with its first Branch in Accra. As at the end of August 2008, the bank had 14
branches located in the Accra/Tema metropolis and Kumasi. The Bank is licensed to carry on
the business of banking and to provide ancillary services.
The Bank has two wholly owned subsidiary companies namely: PBL Properties Limited which
is engaged in real estates, the sale, purchase and rental of vehicles and Prudential Securities
Limited (PSL), an investment and stock broking firm.
The Bank has embarked on an aggressive expansion of its Branch network in Accra/Tema and
Kumasi and plans to open branches in Takoradi and other regional centres outside its current
locations. As of the time this report was written the bank had 26 branches in all with new
entrance into the Northern and Central Regions. The Bank as part of its branch network
expansion is envisaged to open nine (9) new branches in various parts of the Country by the
end of the year 2010.
3.1 The Bank¶s Shareholders are:
y
Messrs J.S. Addo Consultants Ltdy The Social Security & National Insurance Trust (SSNIT)
y National Trust Holding Company Ltd. (NTHC)
y Ghana Union Assurance Company Ltd. (GUA)
y PBL Staff Provident Fund; and
y Four individual Ghanaians
3.2 Corporate Mission of the Bank
To provide domestic and international banking services with a strategic focus on project
financing and export development. Prudential Bank Limited is committed to play a positive and
innovative role in the financial intermediation process and, most importantly, to offer the best
and the most remunerative banking services to the business community. Quality, creativity and
innovation are the hallmarks of PBL.
Prudential bank is fast positioning it self to becoming one of the leading banks in Ghana by
venturing into almost all sectors financial banking and investments. The bank initially started
with the typical domestic banking services and expanded to cover International banking as well

8/6/2019 Financial Performance Analysis of Prudential Bank Final Edit
http://slidepdf.com/reader/full/financial-performance-analysis-of-prudential-bank-final-edit 7/27
7
as non-traditional exports/projects financing. The bank can also boast of some innovative
products that it has developed and offered to its cherished customers.
3.3 Products and services
Details of some of the activities and services and products provided by the bank are given as
below:
a. Domestic Banking
Our Domestic Banking Services are designed to mobilize deposits, offer credit facilities and
provide services to facilitate the general payment system. E-banking and e-zwich products and
services have been introduced recently to augment the traditional banking products and
services which have hitherto been offered by the Bank.
PBL¶s Domestic Banking Products and Services include:
y Current Account
y Savings Account
y Prudential Business Savings Account
y Prudential Welfare Savings Account
y Fixed/Time Deposit Account
y Call Deposit Account
y Certificates of Deposit
y Local Currency Funds Transfer
y Mobile Cash Collection Service
y Issue of Bonds and Guarantees
y Cash Wise ATM Services
y Credit and Debit Cards
y Instant Money Transfer Service (IMT)
b. Specialized Retail Banking Services
y Fee Collection Services
y Salaries, Dividends and Bonuses Administration
y Utility Bills Collection
c. International Banking
Prudential Bank Limited offers a one stop shop for all International Banking activities. PBL
has got a team of knowledgeable personnel who offer their services and give expert advice and
guidance to help grow international business.
The following services are provided at the International Banking Department
y Provision of Foreign Currency and Foreign Exchange Accounts
y Handling of Foreign Transfers, Remittances and Collection of Foreign Cheques
y Issue of Bonds and Guarantees
y Export Advisory Services

8/6/2019 Financial Performance Analysis of Prudential Bank Final Edit
http://slidepdf.com/reader/full/financial-performance-analysis-of-prudential-bank-final-edit 8/27
8
d. Non- traditional exports/projects financing
The corporate mission of PBL among others is to provide Domestic and International Banking
services with a strategic focus on Project Financing and Export Development.
Prudential Bank Limited, in line with its mission, has therefore set up a department of well-
trained and dedicated staff to specifically attend to Non-Traditional Exports and Special
Projects (NTE/SPD). This department focuses on providing special export finance schemes for
the production and marketing of Non-Traditional Exports as well as providing term financing
for projects.
e. PBL¶s e-Banking Products and Services Include:
I. cashWise Automated Teller Machines (ATMS) PBL cashWise ATMs provide self-
service banking facilities such as Cash Withdrawal, Cheque Book Request,
Full/Mini Statement Request, Account Balance Enquiry, Funds Transfer, Personal
Information Number (PIN) Change, etc.
II. textWise (SMS Banking)
SMS Banking enables customers to monitor their account status via a mobile phone
anytime, anywhere. textWise offers the existing banking facilities of cashWise
ATMs, except cash withdrawals. It is simple and easy to use. All a customer needs
is a mobile phone.
III. netWise (Internet Banking)
PBL¶s internet banking which is incorporated in the Bank¶s website takes banking
activities to the door step of every one irrespective of your geographical location.
netWise gives you the opportunity of banking around the clock. You can download
your financial statement and access your account information anytime on theinternet.
IV. E-zwich Platform
this enables a cross-transaction channel where customers from PBL, other Banks
and the unbanked perform all Point of Sale (POS) transactions from a common
platform. Such transactions include cash transfers, retail payments, cash pay back

8/6/2019 Financial Performance Analysis of Prudential Bank Final Edit
http://slidepdf.com/reader/full/financial-performance-analysis-of-prudential-bank-final-edit 9/27
9
and 3rd party bill payments. PBL offers interested merchants POS devices for
installation at their retail premises. PBL also issues e-zwich smart cards to
customers and non-customers.
3.4 Success Story and what is impressive about Prudential Bank Ltd.
Prudential bank is a socio-economic oriented bank which provides the most remunerative
banking services to the business community especially the small and medium scale enterprises.
As part of the bank¶s mission, the company continually strives to provide quality, innovative
products in leading the way in the management of project financing and export development.
Ghana is a developing country and heavily depends on exports of traditional and non-
traditional commodities which could be very challenging considering the cost of capital
involved; this is where Prudential Bank Limited comes in to offer its expertise and financial
support. Prudential Bank in no small way is helping to keep the wheels of industries running.
Prudential bank has over the years been recognised as one of the distinguished banks in Ghana
and has won a lot of award to its credit. Below is a summary of some of the awards it has won:
Year Award category Position Won
2003 Short-term loan financing 2003 1st
2004 Most socially responsible bank 2004 3rd
2005 Long-term loan financing 2005 1st
2005 Competitive pricing 2005 2nd
2006 Best bank in long-term loan financing 1st
2007 Best bank, short term loan financing 3rd
2007 Best bank competitive pricing 1st 2008 Best bank, trade finance 2
nd
2008 Best bank, corporate social responsibility 3rd
2008 Best bank, medium term loan financing 2nd
As the awards clearly spells out, the bank stands out in the area of Loan Financing and to me
this a very impressive and remarkable achievement and much needed support to industry to
drive the development agenda of the country.
Prudential Bank Limited, as a good corporate citizen, recognizes the positive relationships
between being socially responsible and building of its public image. For this reason, the Bank
has formally incorporated social responsibility objectives in its decision making process.
The Bank during the year, continued to discharge its social responsibilities by giving back an
amount of GH¢ 77,568 to the society which represents a 36 % increase of that of the previous
year of an amount of GH¢ 57,052. Some of the institutions that have benefited from this kind
gesture include:

8/6/2019 Financial Performance Analysis of Prudential Bank Final Edit
http://slidepdf.com/reader/full/financial-performance-analysis-of-prudential-bank-final-edit 10/27
10
West Africa College of Surgeons; National Cardiothoracic Centre; Aid to Artisans; Ghana
Export Promotion Council; National Farmers Day; Best Teachers¶ Awards ceremonies; SOS
Children¶s Village; African University College of Communication; The Ghana Police Service
and Methodist University College.
In recognition of the banks outstanding support to various institutions, the bank can also boast
of the following awards:
GHANA EXPORT PROMOTIONS COUNCIL
1997- 9th
National Award for Export Achievement in recognition of creditable
performance in Export Service.
2001- 13th
National Award for Export Achievement, Gold Award for Export Financing
2006- 18th
National Award for Export Achievement.
GHANA INVESTMENT PROMOTION CENTRE
Leader in the Banking (Commercial and Merchant) Sector for the year 2004.
GHANA CLUB 100
2002-Ghana¶s Top 100 Companies
2003- Ghana¶s Top 100 Companies
2004- Ghana¶s Top 100 Companies
2005-Ghana¶s Top 100 Companies
3RD
ASHANTI FINANCIAL SERVICES EXCELLENCE AWARDS 2006.
Best Bank in Small and Medium Enterprise Finance. (Gold Award)
COPAL (COCOA PRODUCERS¶ ALLIANCE)
Award of Appreciation in recognition of Prudential Bank¶s outstanding support for
2009 Copal Cocoa Day Celebration as a silver sponsor.
All the above mentioned awards and recognitions say it all, that, the bank is a remarkable bank
and really is promoting the Ghanaian Industry toward growth and prosperity.

8/6/2019 Financial Performance Analysis of Prudential Bank Final Edit
http://slidepdf.com/reader/full/financial-performance-analysis-of-prudential-bank-final-edit 11/27
11
4. Identification of Significant Accounting polices
The significant accounting policies adopted by the Bank and which have been applied in
preparing their financial statements are stated below:
4.1 Basis of Accounting
The banks financial statements are prepared under the historical cost convention as modified by
the adoption of fair value measurement basis, in compliance with IFRS requirements, for
µavailable for sale (AFS)¶ investments and financial assets and financial liabilities held at fair
value through profit or loss (FVTPL).
4.2 Functional and Presentation Currency
The financial statements are presented in Ghana Cedi (GH¢) which is the functional and
presentation currency of the Bank.
4.3 Revenue Recognition
Revenue is recognized to the extent that the economic benefits will flow to the Bank and the
revenue can be reliably measured. The following specific recognition criteria apply to revenue
recognition.
a. Interest Income and Expense
Interest income and expense are recognised in the income statement for all interest bearing
financial instruments including loans and advances as interest accrues using the effective
interest rate method.
b. Non-Interest Income
The Bank earns commission and fees from a wide range of services provided to its customers.
Fee income is accounted for as follows:
± Income earned on performance of discrete services (such as funds transfers, specialclearing, transaction negotiation with third parties etc) is recognized as revenue upon
completion of the act or service
± Income arising from service fees (such as special statement requests, safe custody,
commission on turnover, etc) is recognized as the services are provided
± Loan origination fees and similar fees form an integral part of the effective interest
rate of a financial instrument and are not shown as part of non-interest income.

8/6/2019 Financial Performance Analysis of Prudential Bank Final Edit
http://slidepdf.com/reader/full/financial-performance-analysis-of-prudential-bank-final-edit 12/27
12
c. Income Tax
Income Tax in the Profit and Loss Account comprises current tax and deferred tax.
Current tax is the tax expected to be payable, under the Internal Revenue Act 2000 (Act 592),
on the taxable profit for the year.
Deferred income tax is provided on all temporary differences at the balance sheet date between
the tax bases of assets and liabilities and their carrying amounts.
d. Regulatory Impairment Reserve
To cater for any shortfall between the Bank of Ghana¶s credit loss provision requirements and
loans and advances impairments based on IFRS principles, a charge is made to Income Surplus
in respect of the difference required to bring up the cumulative provision to the level required
under the Bank of Ghana regulations.
e. Property, plant and equipment
The Bank recognizes an item of property, plant and equipment as an asset when it is probable
that future economic benefits will flow to it and the amount meets the materiality threshold set by the Bank. Property, plant and equipment are stated at cost less accumulated depreciation and
any impairment in value. Depreciation is provided on the depreciable amount of each
component on a straight-line basis over the anticipated useful life of the asset.
f. Intangible Assets- Computer Software
Cost incurred to acquire and bring to use specific computer software licenses are capitalized
and amortised on the basis of the expected useful lives using the straight-line method.
Maximum useful live ranges between 4 and 5 years.
g. Provisions
The Bank recognizes provisions when it has a present obligation (legal or constructive) as a
result of past events and it is probable that an outflow of resources embodying economic
benefits will be required to settle the obligation and a reliable estimate can be made of the
amount of the obligation.
h. Foreign Currency
Transactions denominated in foreign currency are translated into cedis at the rates of exchange
ruling on the dates of the transactions. Assets and liabilities denominated in foreign currencies
are translated into cedis at exchange rates ruling at the balance sheet date. Any gains or losses
resulting from foreign currency translation or exchange are dealt with through the profit and
loss account for the year.

8/6/2019 Financial Performance Analysis of Prudential Bank Final Edit
http://slidepdf.com/reader/full/financial-performance-analysis-of-prudential-bank-final-edit 13/27
13
i. Post Balance Sheet Events
Events subsequent to the balance sheet date are reflected only to the extent that they relate
directly to the financial statement and the effect is material.
5. Analysis of the Bank¶s Financials
Prudential Bank¶s activities over the period being observed have grown steadily over time. The
bank registered it¶s most impressive profit before tax in the 2007 financial year, however it
could not maintain the growth trend; and even though it did significantly well in 2008, the
bank¶ profit before tax was on the plunge in 2009.
The following analysis will try to reveal and explain some of the realities that could have
contribute to the observed trends in the banks financial activities.
5.1 Trend Analysis
Trend analysis is calculated by computing changes in like items from a base year relative to
two or more other years. This is done by selecting a base year whose amount is set equal to
100%.
(Table 1.0 Calculations for the trend analysis for the profit and loss account)
14919112075100Profit After Tax
81302316157100Taxation
13321816795100Profit Before Tax
18674238107100Provision for bad & doubtful debts
309249170143100Operating Expenses
255229174128100Total (Gross) Income
241166155115100Commissions and fees
248225182137100Net Interest Income
473272189110100Interest Expense
350246185125100Interest Income
%%%%%
20092008200720062005Description/ Year
8/6/2019 Financial Performance Analysis of Prudential Bank Final Edit
http://slidepdf.com/reader/full/financial-performance-analysis-of-prudential-bank-final-edit 14/27
14
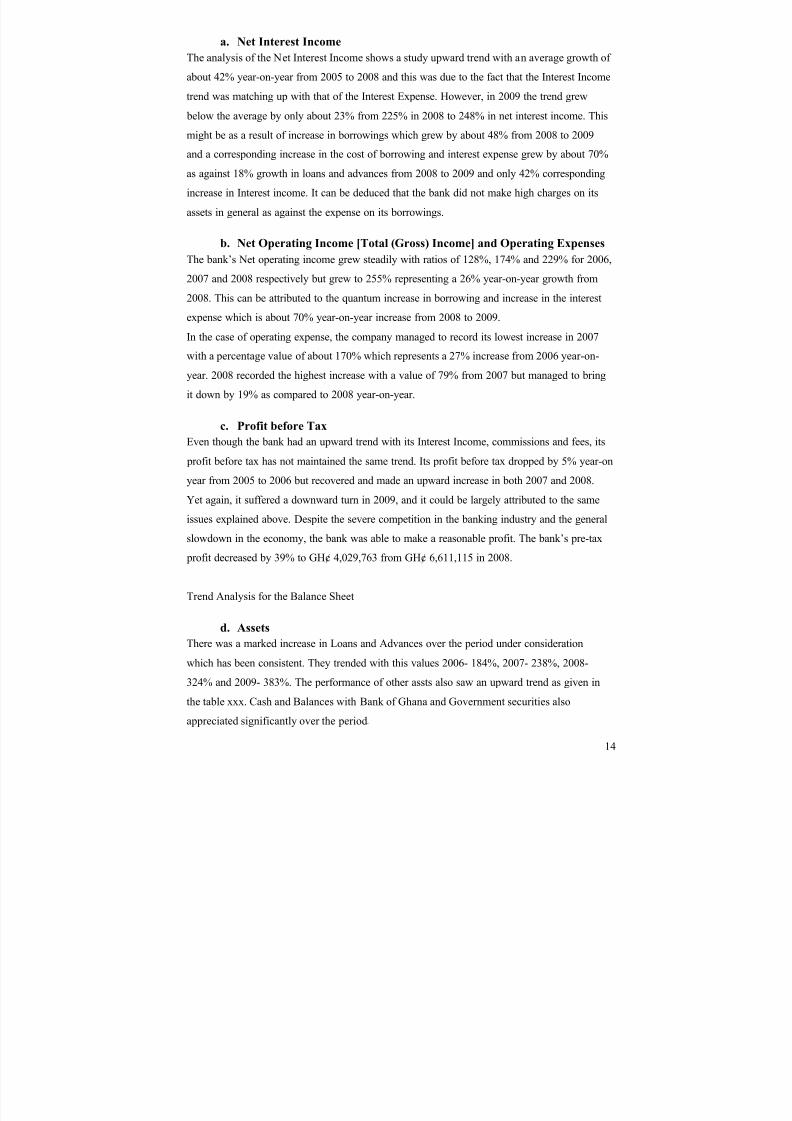
a. Net Interest Income
The analysis of the Net Interest Income shows a study upward trend with an average growth of
about 42% year-on-year from 2005 to 2008 and this was due to the fact that the Interest Income
trend was matching up with that of the Interest Expense. However, in 2009 the trend grew
below the average by only about 23% from 225% in 2008 to 248% in net interest income. This
might be as a result of increase in borrowings which grew by about 48% from 2008 to 2009
and a corresponding increase in the cost of borrowing and interest expense grew by about 70%
as against 18% growth in loans and advances from 2008 to 2009 and only 42% corresponding
increase in Interest income. It can be deduced that the bank did not make high charges on its
assets in general as against the expense on its borrowings.
b. Net Operating Income [Total (Gross) Income] and Operating Expenses
The bank¶s Net operating income grew steadily with ratios of 128%, 174% and 229% for 2006,
2007 and 2008 respectively but grew to 255% representing a 26% year-on-year growth from
2008. This can be attributed to the quantum increase in borrowing and increase in the interestexpense which is about 70% year-on-year increase from 2008 to 2009.
In the case of operating expense, the company managed to record its lowest increase in 2007
with a percentage value of about 170% which represents a 27% increase from 2006 year-on-
year. 2008 recorded the highest increase with a value of 79% from 2007 but managed to bring
it down by 19% as compared to 2008 year-on-year.
c. Profit before Tax
Even though the bank had an upward trend with its Interest Income, commissions and fees, its
profit before tax has not maintained the same trend. Its profit before tax dropped by 5% year-on
year from 2005 to 2006 but recovered and made an upward increase in both 2007 and 2008.
Yet again, it suffered a downward turn in 2009, and it could be largely attributed to the same
issues explained above. Despite the severe competition in the banking industry and the general
slowdown in the economy, the bank was able to make a reasonable profit. The bank¶s pre-tax
profit decreased by 39% to GH¢ 4,029,763 from GH¢ 6,611,115 in 2008.
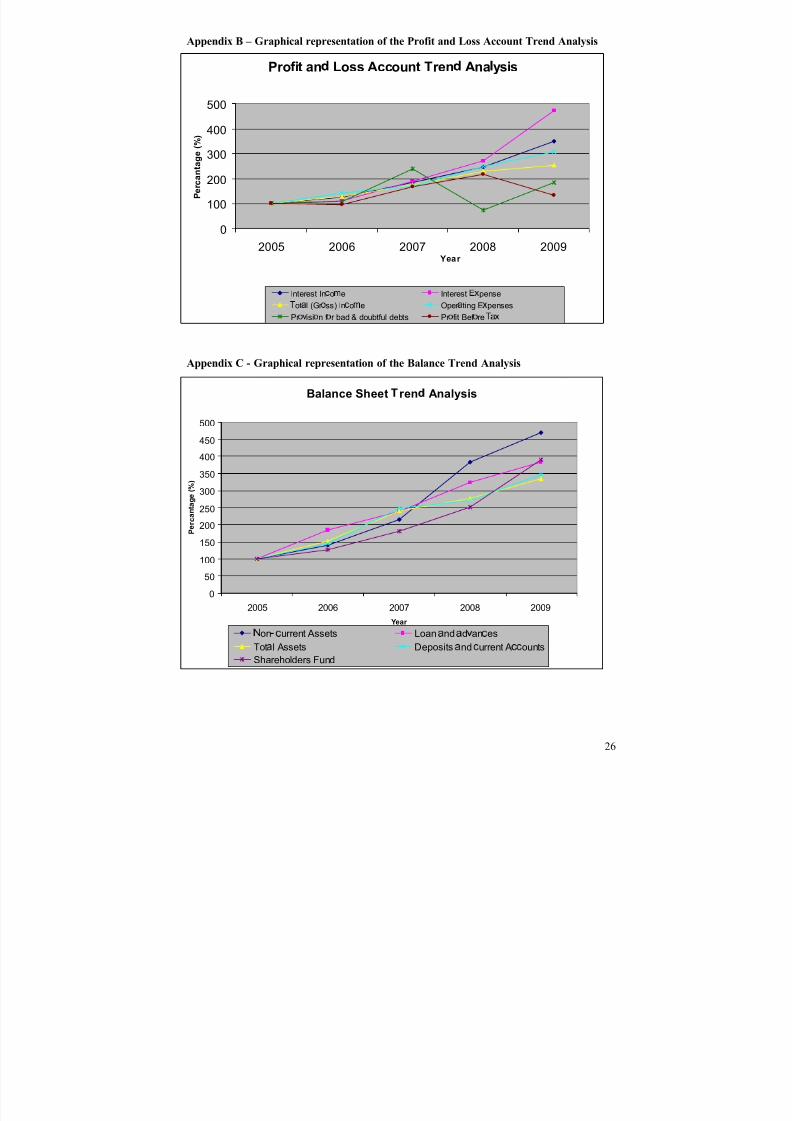
Trend Analysis for the Balance Sheet
d. Assets
There was a marked increase in Loans and Advances over the period under consideration
which has been consistent. They trended with this values 2006- 184%, 2007- 238%, 2008-
324% and 2009- 383%. The performance of other assts also saw an upward trend as given in
the table xxx. Cash and Balances with Bank of Ghana and Government securities also
appreciated significantly over the period.

8/6/2019 Financial Performance Analysis of Prudential Bank Final Edit
http://slidepdf.com/reader/full/financial-performance-analysis-of-prudential-bank-final-edit 15/27
15
e. Shareholder¶s Fund
Shareholder¶s fund trended with an impressive year-on-year growth with the following
percentages registered; 2006- 127%, 2007- 181%, 2008- 250% and 2009- an all time high of
390%. The upward growth in shareholder¶s fund can largely be attributed to the consistent
increase in Income surplus which also is experiencing an upward trend. Below is the table of
calculations summary.
(Table 2.0 Calculations for the trend analysis for the profit and loss account )
5.2 Vertical Analysis
Vertical analysis is where all the profit and loss items and all the balance sheet items are
expressed as a percentage of their respective totals. It is useful for comparing the importance of
specific components in the operations of the business. Changes in the components from one
year to the other are easily identified.
390250181127100Sha
eholde ¡
Fund
540365350186100Non-¢
u
ent Liabilitie¡
309269233150100Cu
ent Liabilitie¡
347270247144100Depo¡
it¡
and¢
u
ent A¢ ¢
ount¡
333276239152100Total A¡ ¡
et¡
383324238184100Loan and ad£
an¢
e¡
329273240152100Cu
ent A¡ ¡
et¡
469382214140100Non-¢
u
ent A¡ ¡
et¡
%%%%%
20092008200720062005De¡ ¢
iption/ Yea

8/6/2019 Financial Performance Analysis of Prudential Bank Final Edit
http://slidepdf.com/reader/full/financial-performance-analysis-of-prudential-bank-final-edit 16/27
16
(Table 3.0 Calculations for the Vertical analysis for the profit and loss account )
a. Net Interest Income and Net Operating Income
The vertical analysis indicates that there were significant fluctuations in this component. The
bank recorded a rising Net Interest Income of 55% from 2005 to 60% in 2006. In 2007
percentage fell by 6% to 54%. The downward trend continued into 2008 registering 50% which
was a 4% fall from the previous year. As if this was not enough, 2009 was the worst hit period
and had a record low of 39%. Even though the bank allocated a greater proportion of its
resources to loans and advances to generate higher levels of income, the interest income could
not much up with the Interest Expense which was on the upward trend and this might have led
to the fall in the percentage value of the Net Interest Income.The Net Operating Income followed a downward trend just like that of the Net Interest Income
and the same reasons might account for it as above.
b. Pre-Tax Profit
The banks pre-tax values of 2005- 22%, 2006- 16%, 2007- 20%, 2008- 19% and 2009- 8%
clearly shows that the bank was making less profits over periods with it worst profit period
being recorded in 2009. This was because the bank grew it assets which was mainly financed
by deposits, borrowings and shareholder¶s fund.
713111016Profit After Tax
(1)(6)(9)(7)(5)Taxati¤ ¥
819 20 16 22Profit Before Tax
(3.05)(1.73)(7.42)(4.94)(5.75)Provi¦
ion for bad & doubtful debts
(49.74)(56.95)(51.71)(64.38)(56.38)Operating Expenses
61 7879 86 84Total Income
5.6211.544.703.595.03Other Operating Income
16.4916.1320.1422.0323.94Commissions and fees
39 50 5460 55Net Interest Income
(61.12)(49.87)(46.14)(39.85)(45.21)Interest Expense
100.00100.00100.00100.00100.00Interest Income
%%%%%
20092008200720062005Descr iption/ Year
7 13 11 10 16 Profit After Tax
(1)(6)(9)(7)(5)Taxation
819 20 16 22Profit Before Tax
(3.05)(1.73)(7.42)(4.94)(5.75)Provision for bad & doubtful debts
(49.74)(56.95)(51.71)(64.38)(56.38)Operating Expenses
61 7879 86 84Total Income
5.6211.544.703.595.03Other Operating Income
16.4916.1320.1422.0323.94Commissions and fees
39 50 5460 55Net Interest Income
(61.12)(49.87)(46.14)(39.85)(45.21)Interest Expense
100.00100.00100.00100.00100.00Interest Income
%%%%%
20092008200720062005Descr iption/ Year

8/6/2019 Financial Performance Analysis of Prudential Bank Final Edit
http://slidepdf.com/reader/full/financial-performance-analysis-of-prudential-bank-final-edit 17/27
17
(Table 4.0 Calculations for the Vertical analysis for the Balance Sheet)
c. Assets and Liabilities
The bank maintained a fairly stable rise in its Property, Plant and Equipment with these values:
2005- 2.82%, 2006- 2.59%, 2007- 2.52%, 2008- 3.9% and 2009- 3.96%. This significant rise in
pattern can be attributed to the bank¶s implementation of its plan of expanding its Branch
locations and the improvement of its infrastructure. In general, all of the banks assets saw a
healthy growth which can be attributed to deposits, borrowings and shareholder¶s fund.
100100100100100Total Liabilities & Shareholders funds
76556Shareholders Funds
1.900.810.280.080.01Income (Deficit) Surplus
1.712.341.550.512.24Statutory Reserve Fund
1.620.000.000.000.00Capital Surplus
2.092.532.914.644.00Stated Capital
9394959594Total liabilities
13.2710.8411.9910.028.19Borrowings
7983838586Total
5.4713.999.8817.2414.58Creditors and Accruals
73.9469.5073.4067.5070.98Deposits and Current Accounts
LIABILITIES & S.HOLDERS FUNDS
100.00100.00100.00100.00100.00Total Assets
3.963.902.522.592.82Property, Plant and Equipment
9696979797Total
3.243.293.551.852.65Other Assets Account
54.6055.8447.2357.7147.52Loans and Advances
1.770.190.220.340.38Other Investments Securities
17.5120.4625.3517.7510.72Due from Other Banks and Financial Inst.
9.989.5614.1611.4131.50Government Securities
8.946.756.978.344.41Cash and Balances with Bank of Ghana
%%%%%ASSETS:
20092008200720062005Description/ Year

8/6/2019 Financial Performance Analysis of Prudential Bank Final Edit
http://slidepdf.com/reader/full/financial-performance-analysis-of-prudential-bank-final-edit 18/27
18
5.3 K ey Ratios Analysis
(Table 5.0 Calculations for the Key Ratios)
a. Profitability Ratios
It measures how a firm is able to make satisfactory income and whether it is able to maximize
the wealth of its shareholders.
i. Profit Margin:
It measures how much of interest income that is retained after taking into consideration all
expenses including tax. The values registered for the various years are 2005- 16.39%, 2006-
9.87%, 2007- 10.61%, 2008- 12.71% and for 2009- 6.99%.
The bank had the best profit margin in 2005 but could not hold on its grip and 2006 registered a
fall in profit margin to 9.87%.
1.81:11.91:12.53:11.91:11.31:1a:bLong Ter m Liabilitie
§
Shar eholder §
̈ quity
Long Ter m Liabilitie§
Star eholder §
̈ quity
1.001.562.172.151.85©
imes r e-Ta in
ome + Int.
p.
Inter e t
pen eInter e
§
t Co
er age
Solvency Ra
ios
81.55
73.2065.7175.0767.32
%
per ating ̈
pen§
e
100
per ating In ome per ating e
pen§
e to
oper atingin ome r atio
61.1249.8746.1439.8545.21%
Inter e§
t ̈
pen§
e
100Inter e
§
t In ome
Inter e§
t ̈
pen§
e toInter e
§
t in omer atio
0.810.381.670.971.67%
Bad debt
100Total Loan
Bad Debt a§
% of Total Loan
0.74:10.80:10.64:10.86:10.67:1a:b
Total Loan
Total Depo§
it§
Loan to Depo§
it Ratio
E
iciency Ra
ios
0.24:10.20:10.25:10.23:10.42:1a:bCa
!
h + Marketable Se"
ur itie!
Curr ent Liabilitie§ Ca
§
h Ratio
1.21:11.15:11.17:11.15:11.14:1a:bs
Curr ent A§ §
et§
Curr ent Liabilitie§
Curr ent Ratio
Liquidi
y Ra
ios
13.8127.5523.8421.3836.08%Net pr of it
100Shar eholder'
§
̈ quityRetur n on ̈ quity
1.192.352.081.872.98%
Net pr of it
100Total A
§ §
etRetur n on A
§ §
et
6.9912.7110.619.8716.39%
Net pr of it
100
Inter e§
t In ome# r of it Mar gin Ratio
$
%
o
i
abili
y Ra
ios
20092008200720062005UnitFor mulaDe§
r iption

8/6/2019 Financial Performance Analysis of Prudential Bank Final Edit
http://slidepdf.com/reader/full/financial-performance-analysis-of-prudential-bank-final-edit 19/27
19
The bank was able to turn around it operations and managed to double its Due from Other
Banks and Financial Institutions in 2007 which led to the increase in its Net operating interest
and thereby increasing it Profit Margin for the year 2007 to 10.61%.
In 2008, PBL increased the amount of Loans and advances and this lead to an increase in its
interest income which in effect increased its net operating interest and hence an improvement
in it Profit Margin to 12.71%. The bank recoded it lowest Profit Margin in 2009 and this could
be ascribed to the fact the bank recorded high deposits and increased its borrowing which in
turn attracted high interest expense. Even though loans and advances also increased in that
same year, its interest income could not much up the interest expense. This explanation might
have contributed to the sharp fall in profit margin for the year at a record low, 6.99%.
ii. Return on Assets
It is the primary ratio used in measuring the profitability of a firm.
The ratios recorded followed the same pattern as that of the Profit Margin and similar reasons
could be ascribed.
iii. Return on Equity
It measures how much investors are receiving as their returns for the investment they made in
the company. The ratios recorded followed the same pattern as that of the Profit
Margin and that of Return on Assets and therefore similar reasons could also be ascribed.
b. Liquidity Ratio
These ratios measure the capability of the company to meet its short-term obligation when they
fall due.
i. Current Ratio
The acceptance of a particular current ratio differs among stakeholders. Whiles Short-term
creditors prefer a high current ratio since it reduces their risk, shareholders may prefer a lower
current ratio so that more of the firm's assets are working to grow the business. Typical valuesfor the current ratio vary by firm and industry.
PBL recorded consistent solid levels current ratios of 1.14:1 for 2005, 1.15:1 for 2006, 1.17:1
for 2007, 1.15:1 for 2008 and an all time high 1.21:1 in 2009. The ratio in 2009 can be ascribed
to the tremendous increase in the companies Cash and Balances with bank of Ghana and also
the quantum increase in the value of Other Investment securities.

8/6/2019 Financial Performance Analysis of Prudential Bank Final Edit
http://slidepdf.com/reader/full/financial-performance-analysis-of-prudential-bank-final-edit 20/27
20
ii. Cash Ratio
Current ratio might not give accurate indication of ability to meet short term obligations
promptly as advances and other current assets might not be easily converted into cash. The cash
ratio addresses this drawback of the current ratio. The figures recorded for the period saw a
downward trend from a high of 0.42:1 in 2005 to a low of 0.24:1 in 2009. This can be
explained as due to the consistent increase in Deposits and Current accounts which saw a
continuous upward trend from GH¢ 72,356,100 in 2005 to a high of GH¢ 251,275,920 in 2009.
Though the ratios for the period are low, it is considered normal for the banking industry.
c. Solvency Ratios
These ratios measure the ability of the firm to survive into the foreseeable future.
i. Debt to Equity Ratio
6. Evaluation and Summary
Summarizing using the data between 2008 and 2009, Interest income rose by about 42.15%,
however Net profit Margin fell by about 39.05 %. This is as a result of increase in interest
expenses of about 74.21%.
The increase in operating expenses is due partly to increase in obligation in terms of interest
payment on Deposit and current Accounts and the servicing of interest on borrowings. This

8/6/2019 Financial Performance Analysis of Prudential Bank Final Edit
http://slidepdf.com/reader/full/financial-performance-analysis-of-prudential-bank-final-edit 21/27
21
was without a significant increase in receipt from investment income. Compared to last year,
the percentage of Deposits and current account that went into Loans and Advances fell.
The bank channeled most of its funds into branch expansion; this also explains the increase in
Deposits and current Accounts and a corresponding increase in operating expenses. This is an
indication of an increase in the client base of the bank. Part of the Funds from theDeposits and
Current accounts went into capacity building which will yield returns in the medium to long
term and ensuring that in the future it will reap the benefits and make more significant gains
and profits. This is shown in the increase in property, plant & equipment, Other Investments
securities and the clearing of almost half of creditors and Accruals balance
The increase in the asset base of the bank, growing client base and increase in Income surplus
makes investing in the bank worthwhile.
As the debt to equity ratio indicates, the bank is making strides and becoming less geared firm
whish is very positive to attract more investments and to ensure it successful.
I am therefore confident from the data and information gathered from the analysis of the bank¶s
financials that it will be worthwhile to invest in the bank. This is because all the positive
indicators, like it client base growth with regard to deposits, improvement in it¶s assets in the
form of branch expansions and plant and equipment, the company is well positioned to give a
good return on my investment. The bank¶s proposed dividends went up from GH¢ 11,900.00 in
2008 to GH¢ 16,100.00 in 2009, an increase by about 35.30 % which represents a good leap
and growth.
I will not hesitate to invest all of my ¢200 million cedis in the bank if it should float shares by
listing on the Ghana stock Exchange.
7. Limitations of Ratio and Financial Statement Analysis
The following limitations should be kept in mind in relying on ratio analysis:
Interpretation of the ratio: It is difficult to generalise about whether a particular ratio is µgood¶
or µbad¶. For example a high current ratio may indicate a strong liquidity position, which is
good or excessive cash which is bad. Similarly Non current assets turnover ratio may denote
either a firm that uses its assets efficiently or one that is under capitalised and cannot afford to
buy enough assets.

8/6/2019 Financial Performance Analysis of Prudential Bank Final Edit
http://slidepdf.com/reader/full/financial-performance-analysis-of-prudential-bank-final-edit 22/27
22
Price changes: Inflation renders comparisons of results over time misleading as financial
figures will not be within the same levels of purchasing power. Changes in results over time
may show as if the enterprise has improved its performance and position when in fact after
adjusting for inflationary changes it will show the different picture.
Technological changes: When comparing performance over time, there is need to consider the
changes in technology. The movement in performance should be in line with the changes in
technology. For ratios to be more meaningful the enterprise should compare its results with
another of the same level of technology as this will be a good basis measurement of efficiency.
Changes in accounting policy: Changes in accounting policy may affect the comparison of
results between different accounting years as misleading. The problem with this situation is that
the directors may be able to manipulate the results through the changes in accounting policy.
This would be done to avoid the effects of an old accounting policy or gain the effects of a new
one. It is likely to be done in a sensitive period, perhaps when the business¶s profits are low.
Changes in accounting standard: Accounting standards offers standard ways of recognizing,
measuring and presenting financial transactions. Any change in standards will affect the
reporting of an enterprise and its comparison of results over a number of years.
Different financial and business risk profile: No two companies are the same, even when they
are competitors in the same industry or market. Using ratios to compare one company with
another could provide misleading information. Businesses may be within the same industry but
having different financial and business risk. One company may be able to obtain bank loans at
reduced rates and may show high gearing levels while as another may not be successful in
obtaining cheap rates and it may show that it is operating at low gearing level. To an informed
analyst he may feel like company two is better when in fact its low gearing level is because it
cannot be able to secure further funding.

8/6/2019 Financial Performance Analysis of Prudential Bank Final Edit
http://slidepdf.com/reader/full/financial-performance-analysis-of-prudential-bank-final-edit 23/27
23

8/6/2019 Financial Performance Analysis of Prudential Bank Final Edit
http://slidepdf.com/reader/full/financial-performance-analysis-of-prudential-bank-final-edit 24/27

8/6/2019 Financial Performance Analysis of Prudential Bank Final Edit
http://slidepdf.com/reader/full/financial-performance-analysis-of-prudential-bank-final-edit 25/27
8/6/2019 Financial Performance Analysis of Prudential Bank Final Edit
http://slidepdf.com/reader/full/financial-performance-analysis-of-prudential-bank-final-edit 26/27
26
Profit an Loss Account Tr en Ana ysis
0
100
200
300
400
500
2005 2006 2007 2008 2009 Year
P e r c a n t a g e
( % )
Inter est Inp oq
e Inter estr
s penset
ot u l (Gr v ss) Inp oq
e Oper u ting Es penses
Pr v w
isi v n f v r bad & doubtf ul debts Pr v f it Bef v r e t
u s
Balance Sheet r en Analysis
0
50
100
150
200
250
300
350
400
450
500
2005 2006 2007 2008 2009
Year
P e r c a n t a g e ( % )
x ony �
urr ent Assets Loan �
nd �
d�
an�
es
Tot�
l Assets Deposits �
nd �
urr ent A� �
ounts
Shar eholder s Fund
Appendix B ± Graphical representation of the Profit and Loss Account Trend Analysis
Appendix C - Graphical representation of the Balance Trend Analysis

8/6/2019 Financial Performance Analysis of Prudential Bank Final Edit
http://slidepdf.com/reader/full/financial-performance-analysis-of-prudential-bank-final-edit 27/27
9. Reference
Dr Acquah P. A. The emerging Ghanaian Banking Environment. Central Bank Articles and
Speeches
Dr Acquah P. A. Evaluating the Banking System in Ghana. (06-05-2006). Keynote address at
the Fifth Banking Awards Ceremony
Dyson, J.R. (2004). Accounting for Non - Accounting Students
George M. & Gloria K, Milliar B. (30-04-2007). Developments in the Ghanaian Banking
Sector :
Gyasi, K. (2004). Accounting for the Graduate Non- Accounting Students
Otieku J. & Aboagye-Otchere F. EMBA-6 09 Accounting Lecture Notes.
Audited financial reports of Prudential Bank Limited. 2007, 2008 and 2009
http://www.accountingformanagement.com
http://en.wikipedia.org/wiki/Financial_ratio#cite_note-Groppelli.2C_p._436-2#cite_note-
Groppelli.2C_p._436-2
http://www.bog.gov.gh