Embed Size (px)
Citation preview

Financial Performance Analysis:
In the case
Of
Addis Home Depot PLC
A Senior Essay Submitted to the Department of Accounting
Business Faculty
St. Mary’s University
In Partial Fulfillment of the Requirements for the Degree of Bachelor of Arts in Accounting
By:
Eyob Mengesha
Milkias Worku
Samuel Mekonnen
July 2014 Addis Ababa

Table of ContentsCHAPTER PAGE
1. INTRODUCTION
I. Introduction..............................................................................................................................1
1.1 Background of the study...................................................................................................... 1
1.2 Background of the organization........................................................................................... 2
2. Statement of the problem...........................................................................................................2
3. Research Questions....................................................................................................................3
4. Research Objective.................................................................................................................... 3
4.1 General Objective.................................................................................................................3
4.2 Specific objectives................................................................................................................4
5. Significance of the study............................................................................................................4
6. Delimitation of the study............................................................................................................4
7. Research Design and Methodology........................................................................................... 5
7.1 Research Design................................................................................................................... 5
7.2 Population, Sample Size & Sampling technique.................................................................. 5
7.3 Type of data collected...........................................................................................................5
7.4 Method of data collection.....................................................................................................5
7.5 Data analysis technique........................................................................................................ 5
8. Limitations of the study............................................................................................................. 6
9. Organization of the study...........................................................................................................6
II. RELATED LITRATURE REVIEW
1. Measuring and analayzing financial performance................................................................... 7
2. Definition and objectives of financial performance analysis..................................................... 7
2.1 Assessement of past performance and current position...............................................8
2.2 Assessement of potential and related risk................................................................... 8
3. Significance of financial performance analysis 9

4. Type of financial performance analysis.................................................................................9
4.1 Material used.............................................................................................................. 10
4.2 Modus Operandi.........................................................................................................10
5. Tools of financial performance analysis.............................................................................11
5.1 Ratio analysis............................................................................................................11
5.1.1 Standard of comparision................................................................................. 11
5.1.2 Basic financial ratios....................................................................................... 12
1. Liquidity ratio..............................................................................................12
2. Activity ratio................................................................................................15
3. Leverage ratio..............................................................................................18
4. Profitablity ratio..........................................................................................21
5.1.3 Limitations of ratio analysis............................................................................ 28
III. DATA ANALYSIS AND INTERPRETATION
1. Introduction........................................................................................................................29
2. Addis Home Depot PLC Performance evaluation..............................................................29
2.1 Horizontal Trend Analysis.......................................................................................29
2.2 Vertical Analysis...................................................................................................... 30
3. Ratio Analysis..................................................................................................................... 30
3.1 Liquidity Ratios....................................................................................................... 30
3.2 Activity Ratios......................................................................................................... 34
3.3 Leverage Ratios....................................................................................................... 39
3.4 Profitability Ratios...................................................................................................42
IV. SUMMARY, CONCLUSION AND RECOMMENDATION
1. Summary............................................................................................................................ 46
2. Conclusion..........................................................................................................................48
3. Recommendation................................................................................................................49

Acknowledgment
“Thank you Lord! for all you have done for Us.”
First, we wish to express our indebtedness to some of the people who have helped us in the
preparation of this paper. Foremost among our debts are Ato Legesse T/Mariam, currently a
General Manager in MIDROC CEO Management and Leadership Services plc and Wzt
Eyerusalem Ketema, a finance manager in addis Home Depot plc, for their valuable contribution
in assisting us in a professional manner and offering materials. We also thank Wzt Tigist Keno a
librarian at Addis Ababa University.
Next, we are very glad to thank our advisor Ato Fitsum Habte, who potentially read our paper
and gave us constrictive and valuable comments from the start to the end of this paper.
Lastly, our sincere gratitude goes to Wzt Esrael Mesfin for her commitments to read and type the
work.

DeclarationWe the undersigned, declare that this senior essay/project is our original work, prepared under
the guidance of Advisor Fitsum Habte. All sources of materials used for the manuscript have
been duly acknowledged.
Name: Eyob Mengesha, Milkias Worku and Samuel Mekonnen
Signature:_______________ ,______________ and________________
Place of Submission:____________________________________
Date of Submission:
St. Mary’s University
Financial Performance Analysis:
In the case
Of
Addis Home Depot PLC
By:
Eyob Mengesha
Milkias Worku
Samuel Mekonnen
Business Faculty
Department of Accounting
Approved By the Committee of Examiners
Department Head Signature
Advisor Signature
Internal Examiner Signature
External Examiner Signature

CHAPTER ONE
INTRODUCTION
1. Introduction
1.1. Background of the study
Accounting may be defined as a service, a descriptive and analytical discipline and an
information system. The major objective and end result of using accounting is to prepare
financial statements. Financial statements are the principal means through which information is
communicated to its users for effective economic decision making (Pandey, 2007, 43)
Companies produce financial statement to know the financial condition at the end of the year and
the operating result during the period. No matter how carefully prepared, financial statements are
essential historical document. They tell what has happened during a particular series of years.
The most valuable information to most users of financial statement, however; concerns in
predicting the future by means of comparison, evaluation and trend analysis (Miller, 1992; 95).
In this flexible and dynamic business environment financial performance analysis is a critical
part of a company. The analysis of financial performance is a process of evaluating relationship
between component parts of financial statement to obtain a better understanding of the
company’s position and performance which helps to know what will happen in the future (Shall
and Haley, 1991; 241)
Ross and Jordan (2001; 122) explained that skills of financial performance analysis and
interpretations are important to a wide range of people including investors, creditors and
regulators to diagnose their firms’ ill, prescribe useful remedies and anticipate the financial
consequences of their actions.
There are various tools and techniques in conducting financial performance analysis.
Pandey (2007; 515) explained that financial performance analysis uses ratio as a powerful tool.

Ratios are among the most popular and widely used tools of financial performance analysis for
both internal and external purpose; they are useful tools for management and as a guide to
investors, creditors and others.
Based on the above framework in this study financial ratio analysis is considered as a key tools
to analyze the financial performance of addis HOME DEPOT PLC, a member of the MIDROC
Ethiopia Technology Group.
1.2. Background of the Company
addis HOME DEPOT PLC was established and legally registered on April 07, 2003 G.C with a
capital of Birr 5 million under the control of MIDROC Ethiopia, Office of the Chief Executive
Officer.
It is a member of the MIDROC Ethiopia Technology Group, is the largest store for building and
construction materials in Ethiopia. It is a one-stop-shop for all construction materials, finishing
and decorative items, household appliances, electronics, hand tools, gardening equipment, etc.,
making it the first of its kind in the country. (www.midroc-ethiotechgroup.com)
2. Statement of the problem
Regular checking of a firm’s financial performance status is a basic task of a business firm to
know where the firm exactly is. Financial performance analysis enables a firm to identify its area
of weakness, the area that needs improvement and the area of strength in its daily business
operation.
Financial performance analysis includes analysis and interpretation of financial statements, in
such a way that it under takes full diagnosis of the profitability and financial soundness of the
business.
Financial performance analysis creates an opportunity to invest more or review the strategic
approach of the company to ward various stakeholder including customers, bankers and
investors.

A comprehensive approach of a firm’s financial performance analysis reveals the clear picture of
the firm.
Despite the fact that addis HOME DEPOT PLC is producing audited financial statement for
users timely, they are not making regular financial performance analysis. But the company
makes annual performance review only to determine its profitability by comparing with its
annual budget and the previous year’s performance which is not enough.
This study therefore; aims to analyze the financial performance of addis HOME DEPOT PLC by
using financial ratios analysis techniques to examine the effects of financial performance on the
company Liquidity, Activity, Leverage and profitability position to indicate the implication of
trend analysis in financial statement items which reveals on financial performance and to review
the financial performance of addis HOME DEPOT PLC.
3. Research Questions
Conducting this research is to get answers for the following basic research questions:
S How is the firm’s financial performance status? , Is healthy or not?
S How efficiently the firm manages its asset?
S What is the liquidity position of the firm? Strong or weak to pay their current obligation?
S How is the firm’s capital structure constructed? , Is healthy or not?
S How is the firm’s profitability? , Is it favorable or unfavorable?
4. Research objectives
4.1. General Objective
The main objective of the research is to analyze the financial performance of addis HOME
DEPOT PLC by using financial ratios and to draw best practices and lessons for future
progressive growth of the firm.

4.2. Specific Objective
In order to achieve the general objectives the study also has the following specific objectives:
> To analyze the financial performance of the firm in line with
• Liquidity position
• Asset management
• Capital structure
• Profitability
> To evaluate and identify the strengths and weakness of the firm
> To give the possible conclusion and recommendations based on the findings.
5. Significance of the study
S To disclose the financial performance condition of the firm to the stake holders with
regard to the firm’s weakness and strength and others affairs.
S To assist the management section by letting them know how they are financially
performing and also to pave the way to make comprehensive financial performance
analysis in the company’s future operation.
S To give supportive idea to the management and concerned government body for the
setting of industry average or bench mark in the same industry.
S To enlighten financial decision makers to analyze the past financial performance and
problems, and also to project assumed future results.
S To enables the company to have concrete information regarding its financial performance
from the year 2009 to 2013
S To serve as a baseline for future researchers.
6. Delimitation of the study
The study covered the five years financial performance analysis of addis HOME DEPOT PLC
by using the balance sheet and income statement from the year 2009 to 2013.
Including in this research study more similar firms would have made the finding more
dependable, but because of time and resource constraints the researchers focused only the
selected firm.

7. Research design and methodology
7.1. Research design
The research design employed in this study is descriptive type that enables the researchers to
describe the phenomena as reported by the researchers’ informant. Both qualitative and
quantitative data were used for the research purpose.
7.2. Population, sample size and sampling technique
This research predominantly based on secondary data of the five years audited financial reports
of the firm from the year 2009 to 2013. But the researchers also gathered primary data through
unstructured interview with financial manager to strengthen and further clarify the secondary
data directly from the finance department. For this purpose the researchers employed judgmental
sampling technique and selected the finance manager as a sample. This judgmental sampling was
taken based on who provide the best information for the purpose of this study.
7.3. Type of data collected
In order to develop trend and ratio analysis the researchers used both secondary and primary data
of addis HOME DEPOT PLC. The audited annual financial reports for the selected company
during the year 2009 to 2013 were the area of focuses as a source of secondary data. The other
sources like literatures from various books, journals and websites were also used as a source of
secondary data. The only primary data was unstructured interview.
7. 4. Method of data collection
The data were collected from five years audited financial statement in the form of document
analysis. Furthermore; in order to support the secondary data, the researchers communicated the
finance department of the firm through interview.
7.5. Data analysis technique
The data collected were meaningless unless and otherwise they were not interpreted and
analyzed correctly. The data were analyzed through table, graph and percentage. The researchers
used descriptive analysis technique through the use of:-

i) Ratio analysis
In financial analysis ratio is used an index for evaluating financial performance of a firm.
ii) Trend analysis
A way to evaluate performance of firm’s to compare present ratios with past ratio.
8. Limitation of the study
The study is limited by the following factors:-
• Since the company has not its own industry average, it was difficult to make optional
(additional) comparison so as to strengthen the findings.
Even though; the study has the above limitation, the researchers tried to exert the
maximum possible effort to curb the limitation by using other options, like horizontal and
vertical analysis techniques.
9. Organization of the Study
The study gives coherent flow of ideas of the findings that the study arrived at and it has four
chapters.
The first chapter of the study deals with introduction and it contains the background of the study
and the company, statement of the problem, objectives of the study, research questions, and
significance of the study, delimitation of the study, research design and methodology and
limitation of the study.
The second chapter (that is the review of the literature) discusses and examines recent (or
historically significant) research studies and other books as a basis for the purposed study.
The third chapter is the main body of the study and it deals with the analysis and interpretation of
the data.
The fourth chapter (findings, conclusion and recommendation) deals with the description of the
conclusion drawn based on the findings and the presentation of the recommendations forwarded
is based on the conclusion drawn from the findings.

CHAPTER TWO
RELATED LITRATURE REVIEW
This chapter indicates some related literature reviews with regard to the problem which we have
seen under the study in chapter one that can helps the researcher to compare and contrast the
theory to the actual practice.
1. Measuring and Analyzing Financial Performance of a Firm
A firm itself as well as various interested groups such as managers, stakeholder, creditors and tax
authorities seeks answers to the following important questions (Meigs, 1988; 29).
1. What is the financial position of the firm at given point of time?
II. How is the financial performance of the firm over a given period of time?
These questions can be answered with the help of financial analysis of a firm.
2. Definition and Objective of Financial Performance analysis
Pandey in his book, financial management, and defined financial performance analysis as it is the
process of identifying the financial strength and weakness of the firm by properly establishing
relationship between the items of the balance sheet and income statement.
Financial performance analysis includes analysis and interpretation of financial statements, in
such a way that is under takes full diagnosis of the profitability and financial soundness of the
business.
The first task in performance analysis is to select the information which is relevant to the
decision under consideration from the total information contained in the financial statements.
The second is to arrange the information in a way to highlight significant relationships (pandey,
2007; 517).
The final is interpretation and drawing of inferences and conclusions.

• Creditors and investors use financial analysis into two general ways (Ross and Jordan,
2001; 67).
a. To judge past performance and a current position and
b. To judge future potential and the risk connected with the potential and related risk.
2.1 Assessment of Past Performance and Current position
Past performance is often a good indicator of future performance.
Therefore an investor or creditor looks at the trend of past sales, expense, net income, cash flow
and return on investment not only as a means of judging management’s past performance but
also as possible indicators of future performance. In addition, an analysis of current position will
tell, for example; what assets the business owns and what liabilities must be paid. It will also tell
what the cash position is, how much debt the company has in relation to equity, and how
reasonable the inventories and current positions is often important in achieving the second
general objective of financial analysis (Ross and Jordan, 2001; 67).
2.2 Assessment of Potential and related risk
Information about the past and present is useful only to the extent that it has bearing on decisions
concerning the future.
An investor judges the potential earning ability of a company because that ability will affect the
value of the market price of the company’s stock and the amount of dividends the company will
pay.
A creditor judges the potential debt-paying ability of the company. The potentials of some
companies are easier to predict than those of others and so there is less risk associated with them.
The riskiness of the investment or loan depends upon how easy it is to predict future profitability
or liquidity (Ibid).
In short, financial performance analysis is the process of selection, relation and evaluation (Ibid).

3. Significance of Financial performance Analysis
Interest of various related groups is affected by the financial performance of a firm. Therefore,
these groups analyze the financial performance of the firm (Gitman, 1997; 116).
The type of analysis various according to the specific interest of the party involved (Ibid).
• Trade creditors: interest in the liquidity of the firm (appraisal of firm’s liquidity).
• Bond holders: interested in the cash flow of the firm (appraisal of firm’s capital
structure, the major sources and uses of funds, profitability overtime, and projection of
future profitability).
• Investors: interested in present and expected future earnings as well as stability of these
earnings (appraisal of firm’s profitability and financial condition).
• Management: Interested in internal control, better financial condition and better
performance (appraisal of firm’s present financial condition, evaluation of opportunities
in relation to this current position, return on investment provided by various assets of the
company).
4. Types of Financial Performance Analysis
Financial performance analysis can be classified into different categories on the basis of material
used and modes operandi (www.bentleycg.com).
Financial A alysis
Material Used Modus Operandi
External Analysis Internal Analysis Horizontal Analysis Vertical Analysis

4.1. Material Used: on the basis of material used financial performance can be analyzed
in the following two ways (www.bentleycg.com).
i. External Analysis
This analysis is undertaken by the outsiders of the business namely, investors, credit agencies,
government agencies and other creditors who have accessed to the internal records of the
company. They mainly use published financial statements for the analysis and as it services
limited purposes.
ii. Internal Analysis
This analysis is undertaken by the persons namely executives and employees of the organization
or by the officers appointed by government or court who have access to the books of account and
other information related to the business.
4.2. Modus Operandi: on the basis of modus operandi financial performance can be
analyzed on the following two ways (www.bentleycg.com).
i. Horizontal analysis
In this type of analysis financial statements for a number of year are reviewed and analyzed. The
current year’s figures are compared with the standard or base year and changes are shown
usually in the form of percentages. This analysis helps the management to have an insight into
levels and areas of strengths and weakness. This analysis also called Dynamic Analysis as it
based on data from various years.
ii. Vertical analysis
In this type of analysis study is made of quantitative relationship of the various items of financial
statements on a particular date.
This analysis is useful in comparing the performance of several companies in the same group, or
divisions or departments in the same company. This analysis is not much helpful in proper
analysis of firm’s financial position because it depends on the data for one period. This analysis
is also called Static Analysis as it based on data from one date or for one accounting period.

In order to evaluate financial condition and performance of a firm, the financial analyst needs
certain tools to be applied on various financial aspects.
One of the widely used and powerful tools is ratio or index.
5.1. Ratio Analysis
The first step in executing analysis of financial statement is to carefully read the statement and
their accompanying note. The use of ratio analysis has become wide spread to the extent that
computerized financial statement analysis program prepared financial ratio as part of their
overall analysis (Kieso and Weygandt, 1998; 232).
Ratio Analysis is a powerful tool of financial performance analysis. Ratio is defined as “the
indicated quotient of two mathematical expressions” and “the relationship between two or more
things” (Kieso and Weygandt, 1998; 232).
In financial analysis a ratio is used as an index or yardstick for evaluating the financial position
and performance of the firm. Ratio analysis plays an important role in determining the financial
strength and weakness of a company relative to that of other companies in the same industry.
The analysis also reveals whether the company’s financial position has been improving or
deteriorating over time (Ibid).
5.1.1. Standard Of Comparison
A single ratio in itself doesn’t indicate favorable or unfavorable condition. It should be compared
with some standard of comparison may consist of (Pandey, 2007; 518).
> Ratios are calculated from the past financial statement of the same firm.
> Ratios can be developed using the projected, or Performa financial statement of the same
firm.
> Ratios of some selected firm especially the most progressive and successful, at the same
point in time.
> Ratios of the industry to which the firm belongs.
5. Tools of financial Performance Analysis

Financial ratio can be designed to measure almost any aspect of a company performance. In
general analysts use ratio as tool in identifying areas of strength or weakness in a company.
Ratio; however tend to identify symptoms rather than problem (Pandey, 2007; 518).
A ratio whose value is judged to be different or unusually high or low may help indentify
significant event but will seldom provide enough information in and of it, to identify the reasons
for an event’s occurrence.
1. Liquidity ratio
2. Activity ratio
3. Leverage (debt) ratio
4. Profitability ratio
1. Liquidity Ratio
Liquidity is a measure of short run ability to meet obligation as they become due. Liquidity is a
pre-requisite for the very survival of firm. If a firm falls to meet its current obligations, its
continued existence is doubtful.
Therefore the immediate concern of short term creditors is that cash will be generated to pay of
the obligation, when it is due (pandey, 2007; 519)
Liquidity ratio is the relationship of current assets as compared to the current liabilities, and the
timing of funds from inventories through receivables in to cash. The two most widely uses
liquidity ratios are the current ratio and the quick ratio.
A. Current Ratio
Current ratio indicates how the firm management has been able to meet current liability i.e.
Account payable with the current asset. The current ratio is computed by dividing current asset
by current liability. Current asset normally include cash, marketable security and inventory;
current liability consists of account payable, short term notes payable, current maturity of a long
term debt and accrued expense (Pandey, 2007; 520)
5.1.2. Basic Financial Ratios

Current ratio= Current asset
Current liability
Interpretation
This ratio designed to assist the decision maker in determining a firm’s ability to pay its current
liability. The higher the ratio, the greater the ability of the company to meet its immediate
financial obligation. As a conventional rule, a current ratio of 2:1 or more is considered to be
satisfactory (Pandey, 2007; 520)
B. Quick Ratio
The quick ratio sometimes called the acid-test ratio, serve the same general purpose as the
current ratio but excludes inventory from current assets.
This is done because inventories are typically a firm’s least liquid current asset and hence the
assets on which losses are most likely to occur in the event of liquidation. Thus the quick ratio
measures a firm ability to pay its current liability by converting its most liquid assets in to cash
(Pandey, 2007; 522).
Quick ratio=Current asset - Inventory
Current liability
Interpretation
Generally a quick ratio of 1 (one) is considered to represent a satisfactory current financial
condition (Ibid).
C. Cash Ratio
The ratio of cash and cash equivalents of a company to its current liabilities. The cash ratio is
most commonly used as a measure of company liquidity. It can therefore determine if, and how
quickly, the company can repay its short-term debt. A strong cash ratio is useful to creditors
when deciding how much debt, if any, they would be willing to extend to the asking party.

Cash ratio is calculated using the following formula:
Cash + Cash EquivalentsCash Ratio =
Current Liabilities
Interpretation
A cash ratio of 1.00 and above means that the business will be able to pay all its current
liabilities in immediate short term. Therefore, creditors usually prefer high cash ratio. But
businesses usually do not plan to keep their cash and cash equivalent at level with their current
liabilities because they can use a portion of idle cash to generate profits. This means that a
normal value of cash ratio is somewhere below 1.00.
Generally Cash ratio measures the immediate amount of cash available to satisfy short-term
liabilities, A cash ratio of 0.5:1 or higher is preferred. (www.financialratioss.com)
Possible Solution to Improve a Firm’s Liquidity in General
• Increase capital. Capital contributed in the form of cash will increase liquidity
immediately. And, equity financing reduces the need for debt financing.
• Refinance debt with better terms and conditions.
• Leasebacks may be an alternative to capital expenditures for fixed asset purchases.
• Sales of fixed assets or other property. The decision to sell assets will need to be weighed
against the income-generating capacity of those assets.
• Shorten the maturity cycle - the time from purchases of raw materials and the start of
production, or the start of the income-producing activity, until collection on accounts
receivable.
• Negotiate longer payment terms with vendors or other creditors.
• Monitor the amount of money that's being taken out of the business for non-business
purposes such as owner's draws/dividend. Taking too much money out can put an
unnecessary cash drain on the business.
• Monitor Account receivable periodically (www. entrepreneur. com)

Evaluation of activity ratio basically involves identifying how much a firm has invested in
particular types of asset (or group of assets) relative to the revenue the asset is producing. In
particular it measures how efficiently a company manages its assets (Pandey, 2007; 524).
Efficiency is equated with rapid turnover; hence these ratios are referred to collectively as
activity ratio. Some activity ratios concentrate on individual asset such as inventory or account
receivable (pandey, 2007; 524).
These ratio are also called turn over ratios because they indicated the speed with which assets are
being converts or turned over in to sales.
Activity ratios, thus involves a relationship between sales and asset.
A proper balance between sales and asset generally reflects that assets are managed well (Ibid).
A. Inventory Turnover Ratio (ITOR) and Days of Inventory Holding (DIH)
Inventory turnover ratio:- Shows how rapidly the inventory is turning over in to receivable or
cash through sales It is used to measure the inventory management efficiency of a business
(Ibid).
ITOR= Cost of Goods sold
Inventory
Days of inventory holding: - measures the average number of days it takes the company to sell
its inventory of finished goods, it is the number of days the inventory remains in the stock until it
is sold (Ibid).
DIH= 360
2. Activity Ratios
ITOR

Interpretation
In general, a higher value of inventory turnover indicates better performance and lower value
means inefficiency in controlling inventory levels. A lower inventory turnover ratio may be an
indication of over-stocking which may pose risk of obsolescence and increased inventory
holding costs. However, a very high value of this ratio may be accompanied by loss of sales due
to inventory shortage. (www .flnancialratioss.com)
B. Account Receivable Turnover Ratio (ARTO) and Average Collection Period
(ACP)
Average Collection period:- measures the average numbers of days it takes for the company to
collect it account receivable or number of day’s sales tied up in receivables (Pandey,2007;524)
ACP= Account Receivable
Average Sales per year
Interpretation
A short collection period means prompt collection and better management of receivables. A
longer collection period may negatively affect the short-term debt paying ability of the business
in the eyes of analysts. (www.financialratioss.com)
Account receivable turnover ratio:- measures the numbers of times per year the company is
turning over its receivable (pandey,2007;524).
ARTO = Net Sales
Account receivable
Interpretation
Accounts receivable turnover measures the efficiency of a business in collecting its credit sales.
Generally a high value of accounts receivable turnover is favorable and lower figure may
indicate inefficiency in collecting outstanding sales. (www.financialratioss.com)

C. Total asset turnover (TATO):- It is the ratio of a company's sales to its assets. It is
an efficiency ratio which tells how successfully the company is using its assets to
generate revenue. (Ibid).
Total asset turn over = Net Sales
Total asset
Interpretation
If a company can generate more sales with fewer assets it has a higher turnover ratio which tells
it is a good company because it is using its assets efficiently. A lower turnover ratio tells that the
company is not using its assets optimally. Total asset turnover ratio is a key driver of return on
equity. {www.Jinancialratioss. com)
D. Fixed asset turn over (FATO):- The fixed asset turn over measure how well the firm
was its long term (fixed) asset and shows how many dollars of sales are supported
one dollar of fixed asset (Pandey,2007;523).
Fixed asset turnover = Sales
Fixed asset
Interpretation: If the fixed asset turnover ratio is low as compared to the industry or past years
of data for the firm, it means that sales are low or the investment in plant and equipment is too
high. This may not be a serious problem if the company has just made an investment in fixed
asset to modernize. If the fixed asset turnover ratio is too high, then the business firm is likely
operating over capacity and needs to either increase its asset base (plant, property, equipment) to
support its sales or reduce its capacity. {www.Jinancialratioss.com)

• Implement and use total quality assurance practices and procedures throughout the entire
business cycle.
• Reduce the maturity cycle - the time from the initial purchase of raw materials and
supplies for production through final collection on account from customers.
• Increase the rotation of inventory by discounting slow-moving items, and selling off
obsolete items.
• Use just-in-time delivery methods to reduce the investment in inventory on hand.
• Subcontract or outsource certain phases of the productive cycle that can be more
efficiently performed outside the business.
• Implement and carry out preventive maintenance and scheduled maintenance of plant,
machinery and equipment.
• Follow design capacity indications for plant, machinery and equipment.
• Replace obsolete or inefficient machinery, and equipment.
(www. financialratioss.com)
3. Leverage Ratios
The short term creditors, like bankers and suppliers of raw material, are more concerned with the
firm’s current debt paying liability. One the other hand long term creditors, like debenture
holders financial institution are more concerned with the firm long term financial strength. In
fact, a firm should have a stronger shorter as well as long term financial position (Pandey, 2007;
523).
To judge the long term financial position of the firm financial leverage or capital structure ratio
will be calculated. This ratio index mix of funds provided by owners and lenders assets. The
manner in which assets are financed has a number of implications.
First between debt and equity, debt is more risky from the forms point of view. The firm has
legal obligation to pay interest to debt holders, irrespective of the profit made or loss incurred by
the firm. The process of magnifying the shareholders return through the employment of debt is
called financial leverage or trading on equity (Schall and Haley, 1991; 511).

Leverage ratio may be calculated from the balance sheet items to determine the extent to which
operating profit are sufficient to cover the fixed changed.
A. Total Debt Ratio
Several debt ratios may be used to analyze the long term solvency of a firm. The firm may be
interested in knowing the proportion of the interest-bearing debt (also called funded debt) in
capital structure. It may therefore, compute debt ratio by dividing total debt (TD) by capital
employed (CE) or total net asset (NA) (Schall and Haley, 1991; 511).
Total debt will included short and long term borrowing financial institution debentures/bonds,
deferred payment arrangement for bugging capital equipment and bank borrowing, public
deposits and any other interest-bearing loan.
Capital employed will include total debit and net worth (NW).
Debt ratio = Total debit = TD
Total debit + Net worth TD+NW
OR Total debit = TD
Capital employed CE
Note that capital employed (CE) equals net assets (NA) which consist of net fixed assets (NFA)
and net current assets (NCA).
Net current asset are equal to current asset (CA) minus current liability (CL) excluding interest
bearing debt. These relations are given below.
NFA+CA=NW+TD+CL NFA+NCA=NW+TD
NFA+NCA=NW+TD NA=CE
Because of the equity of capital employed and net asset, debt ratio can be defined a total debt
divided by net asset.

Net Asset NA
Interpretation
Debt ratio ranges from 0.00 to 1.00. Lower value of debt ratio is favorable and a higher value
indicates that higher portion of company's assets are claimed by it creditors which means higher
risk in operation since the business would find it difficult to obtain loans for new projects. Debt
ratio of 0.5 means that half of the company’s’ assets are financed through debts.
(www .financialratioss, com)
B. Earning Coverage Ratio
The earning coverage ratio is a financial ratio that provides a quick picture of a company's ability
to pay the interest charges on its debt. The "coverage" aspect of the ratio indicates how many
times the interest could be paid from available earnings, thereby providing a sense of the safety
margin a company has for paying its interest for any period. A company that sustains earnings
well above its interest requirements is in an excellent position to weather possible financial
storms. By contrast, a company that barely manages to cover its interest costs may easily fall
into bankruptcy if its earnings suffer for even a single month.
Therefore; it is measure of a company’s ability to meet the service changes on its debt finance
(Shall and Heley, 1991; 514).
Earnings per share = EBIT
Interest expense
Interpretation
The lower the ratio, the more the company is burdened by debt expense. When a company's
interest coverage ratio is 1.5 or lower, its ability to meet interest expenses may be questionable.
An interest coverage ratio below 1 indicates the company is not generating sufficient revenues to
satisfy interest expenses. (Shall and Heley, 1991; 514).

• Increase capital. This will depend on the type of business structure. In a sole
proprietorship it means making additional capital contributions. In a partnership,
additional capital contributions would have to be requested from the partners. And in a
corporation, additional shares would need to be issued. For a closely-held corporation, it
may mean going public.
• Re-finance debt at lower interest rates.
• Obtain new loans, possibly long-term loans at lower interest rates, to pay off short-term
debt with a higher interest rate.
• Use mortgage debt, at a lower interest rate, to pay off unsecured loans, at higher rates.
• Request extensions of payment terms.
• Sell off assets in order to pay down debts.
(http:// campus.murraystate.edu/)
4. Profitability Ratio
It describes the firms past profitability. Even if there is little evidence that past profitability will
indicate the future prospect. Profitability ratio measure the success of the firm’s management in
earning a net return from the resources entrusted to them specifically, profitability ration can be
used to answer such question as how much of each sale was management able to convert in to
profit? And did the company shareholders receive an adequate return on their investment. For
discussion purpose it is better to divide profitability in to two groups.
i. Profitability in relation to sales
ii. Profitability in relation to investment
i. Profitability in relation to sales
It is important from a profit stand point that the firm be able to generate adequate profit on each
unit of sales. It sales lock of sufficient margin of profit; it is difficult for the firm to convert its
fixed cost, fixed changes on debt, and to earn profit for shareholders.
The profit ratio discussed here is commonly referred to as profit margin and include the gross
profit margin, operating profit margin, and net profit margin (Shall and Haley, 1991; 514)

A. Gross Profit Margin
Gross profit margin ratio shows the profit relating to sales after the direct production costs are
deducted. It may be used as an indicator of the efficiency of the production operating and the
relation between production cost and selling price (Shall and Haley, 1991; 535).
Gross profit margin = Sales - Cost goods sold
Net sales
A high gross profit margin ratio is a sign of good management. A gross margin ratio may
increase due to any of the following factors (Ibid).
S Higher sales prices cost of goods sold remaining constant.
S Lower cost of goods sold, sales, sales prices remaining constant.
S A combination of variations in sales price and cost the margin widening.
S An increase in the proportionate volume of higher margin items.
A low gross profit margin may reflect cost of goods sold due to (Shall and Haley, 1991; 535).
• The firm’s mobility to purchase favorable item
• In efficient utilization of plant and machinery, or over invest item in plant and machinery.
• Resulting in higher cost of production.
Interpretation
Gross margin ratio measures profitability. Higher values indicate that more cents are earned per
dollar of revenue which is favorable because more profit will be available to cover non
production costs. But gross margin ratio analysis may mean different things for different kinds of
businesses. (Shall and Haley, 1991; 535).

B. Operating Profit Margin
Moving down the income the next statements the next profit figure in countered is net operating
income (Shall and Haley, 1991; 535).
Operating profit margin = Net operating figure
Sales
The operating profit margin reflects the firms operating expenses as well as its cost of goods
sold. Therefore, this ratio serves as on overall measure of operating effectiveness (Shall and
Haley, 1991; 535).
Interpretation
Thus a higher value of operating margin ratio is favorable which indicates that more proportion
of revenue is converted to operating income. An increase in operating margin ratio overtime
means that the profitability is improving. It is also important to compare the gross margin ratio of
a business to the average gross profit margin of the industry. In general, a business which is more
efficient is controlling its overall costs will have higher operating margin ratio.
(w w w .financialratioss, com)
C. Net Profit Margin
The final profit margin considered involves the net after that profit of the firm as a percent of
sales (Shall and Haley, 1991; 536).
Net profit margin = Profit after tax
Sales
Net profit margin is one of the most closely followed numbers in finance. Shareholders look at
net profit margin closely because it shows how good a company is at converting revenue into
profits available for shareholders.

Net profit margin is often used to compare companies within the same industry, in a process
known as "margin analysis." Net profit margin is a percentage of sales, not an absolute number,
so it can be extremely useful to compare net profit margins among a group of companies to see
which are most effective at converting sales into profits. (www.Jinandalratioss.com)
ii. Profitable in relation to investment
This category of profitability ratio attempt to measure firm profit in relation to the capital
invested by owners and creditors. If the firm cannot produce a satisfactory profit on its assets
base, it may be mis-using the assets (Shall and Haley, 1991; 536).
A. Rate of Return on Asset (ROTA)
The relationship of the earnings of a business to its total income is a important indicator of the
effectiveness of management in influencing a return to suppliers of capitals as well as methods of
predicting future earnings (Ibid).
Average total asset = Total asset of the end of last year + Total assets at the end of current year
2
Net income is found on the current year’s income statement; average total asset must be
calculated as the average of total asset at the previous year and the current year (Ibid).
Rate of return on asset = Net income
Average total asset

Return on assets indicates the number of cents earned on each dollar of assets. Thus higher
values of return on assets show that business is more profitable. This ratio should be only used to
compare companies in the same industry. The reason for this is that companies in some
industries are most asset-insensitive i.e. they need expensive plant and equipment to generate
income compared to others. Their ROTA will naturally be lower than the ROTA of companies
which are low asset-insensitive. An increasing trend of ROTA indicates that the profitability of
the company is improving. Conversely, a decreasing trend means that profitability is
deteriorating.
This ratio is regarded as a measure of a company’s efficiency in the use of its asset to generate
sales (www.Jinandalratioss.com)
B. Return on Investment (ROI)
Return on investment (ROI) is the concept of an investment of some resource yielding a
benefit to the investor. A high ROI means the investment gains compare favorably to investment
cost. As a performance measure, ROI is used to evaluate the efficiency of an investment or to
compare the efficiency of a number of different investments. In purely economic terms, it is one
way of considering profits in relation to capital invested. (Ibid).
ROI=ROTA= EBIT (1-T)
Total Assets
RONA= EBIT (1-T)
Net Assets
ROTA and RONA are respectively return on total asset and return on net asset. RONA is
equivalent of return on capital employed (Pandey, 2007; 521).

C. Rate of return on Equity
To measure how effectively the resource provide by company shareholders are being utilized,
analysis calculate the rate of return on equity shares for potential investors as a rough indication
of the long term return which they may anticipate the ratio is calculated by dividing net income
reduced by divide on preference share by average equity share capital (Lawrence and Gitman,
1997; 137).
Rate of return on equity = Net income - Preference divided
Average equity share capital
ROE= Profit after tax = PAT
Net worth NW
Interpretation
Return on equity is an important measure of the profitability of a company. Higher values are
generally favorable meaning that the company is efficient in generating income on new
investment. Investors should compare the ROE of different companies and also check the trend
in ROE over time. (www.Jinandalratioss.com)

Possible Solution to Improve a Firm’s Profitability
-Implement or revise a marketing plan, invest in appropriate advertising and publicity for the
targeted consumers, expand consumer knowledge of your product or service, offer new or
improved products based on customer needs.
-Use total quality control systems to eliminate defects and improve efficiencies throughout
the business.
-Increase productivity by properly training personnel, using machinery and equipment in
accordance with their design capacity and specifications; outsource work that can be done
more cost-efficiently outside the business.
-Develop realistic budgets and compare actual results to budget.
-Improve employee motivation by creating and maintaining a healthy work environment and
providing appropriate incentives.
-Invest in the necessary information systems to adequately handle the flow of information
and transactions in the business, as efficiently as possible.
-Be aware of the tax consequences of business transactions
(www. free-business-plans.com)

According to Kieso (1998; 233) because a ratio can be computed precisely, it is easy to attach a
high degree of reliability or significance to it. The reader of financial statements must understand
the basic limitations associated with ratio analysis when evaluating on enterprise.
Like all weapons, ratio analysis suffers from a number of weaknesses.
1. Rations ignore non quantitative factors like skills of the work force, state of personnel
relations and motivation, competence of management etc., except insofar as these are
reflected by below average performance (Gitman,1997;117).
2. Ratios are naturally static measures as indices which are purse not likely to tell the
process which leads to the state of affairs obtained and are not likely to predict the
direction of change in future. One has to use other theoretical frameworks to predict such
directional changes. Such things like inflation are ignored by ratios (Vanhorne, 1998;
692).
3. Ratios are prepared out of accounting figures which are products of accounting
measurements and estimates. Financial ratio analysis ignores subjecting the ratios to the
rules of probability to determine their exact level (Ross and Jordan, 2001; 72).
4. Ratio analysis is restricted by the amount of information available in published statement;
businesses have the tendency to report only the legal minimum, rather than the maximum
possible details (Ibid).
5. Ratios are not ends in themselves (Pandey, 2007; 540).
6. The interpretation and comparison of ratios are also rendered invalid by the changing
volume of money. The accounting figures, presented in the financial statement are
expressed in the monetary unit, which is assumed to remain constant. In fact prices
changes over years and as a result assets acquired at different dates will be expressed in
different amount in the balance sheet. This comparison is being meaningless (Vanhorne,
1998; 693).
5.1.3. Limitations of Ratio Analysis

CHAPTER THREE
DATA ANALYSIS AND INTERPRETATION
1. Introduction
In this chapter, the researchers tried to discuss about the performance of addis HOME DEPOT
PLC using ratio and trend analysis. The data was collected from the annual audited reports of
addis HOME DEPOT PLC that prepared for external reporting purpose. The financial statements
examined cover the accounting period of five years from June 2009 to June 2013 G.C which
follows Generally Accepted Accounting Principles. However, transaction dates and monthly
closing of books will be on the basis of Gregorian calendar.
2. addis HOME DEPOT PLC Performance Evaluation
The financial analysis performed at addis HOME DEPOT PLC is a percentage of horizontal
analysis and vertical analysis for evaluation of its performance and to indicate whether the firm
is improved through time or not. This horizontal analysis shows the trend performance of the
company and vertical analysis shows quantitative relationship of the various items of financial
statement on a particular dates using ratio method but the researchers did not compare the result
with the same industry.
2.1 Horizontal Trend Analysis
The horizontal percentage analysis is performed to show its improvement as compared to the
base year for computation. The analysis is taken place on both balance sheet and income
statement items. But this analysis starts from the fiscal year June 30, 2009 G.C. and takes its
account balances as a base year and performs the analysis for the four consecutive years. The
horizontal analysis is done by:-
Percentage Analysis = Amount in current year - Amount in base year
Amount in base year
In this type of analysis study is made of quantitative relationship of the various items of financial
statements on a particular date. The vertical analysis compares each separate figure to one
specific figure in the financial statement. The comparison is reported as a percentage. This
method compares several items to one certain item in the same accounting period.
3. Ratio Analysis
As it was already mentioned, ratios help to evaluate financial strengths and weaknesses of a
company and its business trend. All the major ratios are undertaken in this study, so as to reveal
the liquidity, leverage, activity and profitability of addis HOME DEPOT PLC.
3.1 Liquidity Ratios
Liquidity is the ability of the firm to convert its current assets in to cash. The liquidity of a
business firm is usually for particular interest to its short term creditors since the liquidity of the
firm measures its ability to pay those creditors.
Several financial ratios measure the liquidity of the firm. But in this paper for the purpose of
analysis the researchers use current ratio, quick ratio and cash ratio.
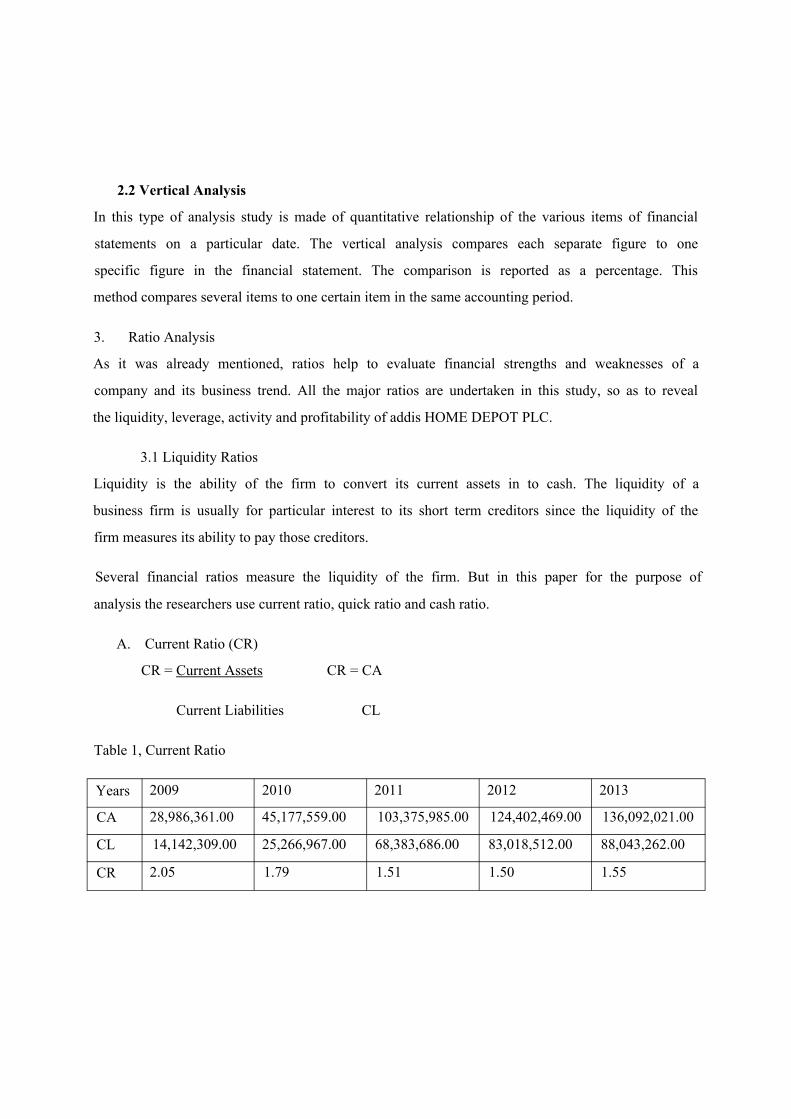
A. Current Ratio (CR)
CR = Current Assets CR = CA
Current Liabilities CL
2.2 Vertical Analysis
Table 1, Current Ratio
Years 2009 2010 2011 2012 2013
CA 28,986,361.00 45,177,559.00 103,375,985.00 124,402,469.00 136,092,021.00
CL 14,142,309.00 25,266,967.00 68,383,686.00 83,018,512.00 88,043,262.00
CR 2.05 1.79 1.51 1.50 1.55

It can be further noticed from the above table that the company had 2.05, 1.79, 1.51, 1.50 and
1.55 birr in current assets available for every one birr in current liabilities of the year 2009, 2010,
2011 2012 and 2013 respectively. This implies that the liquidity statuses of the company is
declining for the first four years and a little incremental change in 2013 compare with 2012 but
from the base year all years are declined; because of the current asset growth rate is less than the
growth rate of current liabilities.
The current asset for the year 2010, 2011, 2012 and 2013 is increased by 56%, 257%, 329%,
370% respectively from the base year where as the current liability for the year 2010, 2011, 2012
and 2013 is increased by 79%, 384%, 487%, 523 % respectively from the base year; so this
implies current asset growth rate is less than the growth rate of current liabilities.
So; the current ratio for the year 2010, 2011, 2012 and 2013 is decreased by 13%, 26%, 27%,
and 25% respectively from the base year.
As a conventional rule, a current ratio of 2:1 (CA is twice of CL) or more is considered as to be
satisfactory.
Therefore; it can be interpreted as the company had not sufficient amount of liquidity which
enables it to cover its current liability by using its current asset for the year 2010 to 2013.

B. Quick Ratio (QR)
Quick ratio has the same purpose as current ratio, is used to evaluate the company’s ability to
meet its short term obligation by using only quick assets.
QR = Quick Asset = Current Asset - Inventory
Current Liability Current Liability
Table 2, Quick Ratio
Years 2009 2010 2011 2012 2013
Current
Asset (a)28,986,361.00 45,177,559.00 103,375,985.00 124,402,469.00 136,092,021.00
Inventory
(b)23,025,551.00 36,553,202.00 67,235,759.00 87,463,864.00 105,683,579.00
Quick
Asset
(c=a-b)
5,960,810.00 8,624,357.00 36,140,226.00 36,938,605.00 30,408,442.00
Current
Liability14,142,309.00 25,266,967.00 68,383,686.00 83,018,512.00 88,043,262.00
QR 0.42 0.34 0.53 0.44 0.35
Quick Ratio
Quick Ratio

In 2009, the quick ratio was 0.42 and in the following year 2010, it was decreased by 19%
because of quick asset growth rate is less than current liability growth rate. In 2011 and 2012
quick ratio was increased by 25% and 6% respectively this is due to quick asset growth rate is
more than current liability growth rate. In 2013 quick ratio was decreased by 18% from the base
year of 2009.
A Quick ratio of 1:1 or greater is usually recommended.
Therefore; it can be interpreted as the company had not sufficient amount of liquidity which
enables it to cover its current liability by using its quick asset for the year 2009 to 2013.
C. Cash Ratio (CR)
The cash ratio is an indication of the company’s ability to pay off its current liability if some
reason for immediate payment were demanded.
CR = Cash + Cash Equivalents
Current liability
Table 3, Cash Ratio
Years 2009 2010 2011 2012 2013
Cash 3,860,867.00 5,573,102.00 23,128,418.00 11,321,445.00 17,152,957.00
Current14,142,309.00 25,266,967.00 68,383,686.00 83,018,512.00 88,043,262.00
Liability
CR 0.27 0.22 0.34 0.14 0.19

In the year 2009, the cash ratio was 0.27 and then it decreased by 19% for the year 2010. In
2011, it was increased by 24% then for the subsequent year 2012 and 2013 it was decreased by
50% and 29% respectively.
If the cash ratio of a company is 0.50 to 1 or higher is preferred.
This implies that the company had not sufficient cash to settle its immediate claims.
3.2 Activity Ratios
Evaluation of activity ratio basically involves identifying how much a company has invested in a
particular type of asset (group of assets) relative to the revenue that asset is producing. The
efficiency with the assets management and effectiveness of the firm in utilizing them can be
assessed using the following measures.
A. Inventory Turnover Ratio (ITOR)
This ratio is a measure of how rapidly the inventory is turning into receivables or cash through
sales.
ITOR = Sales
Inventories
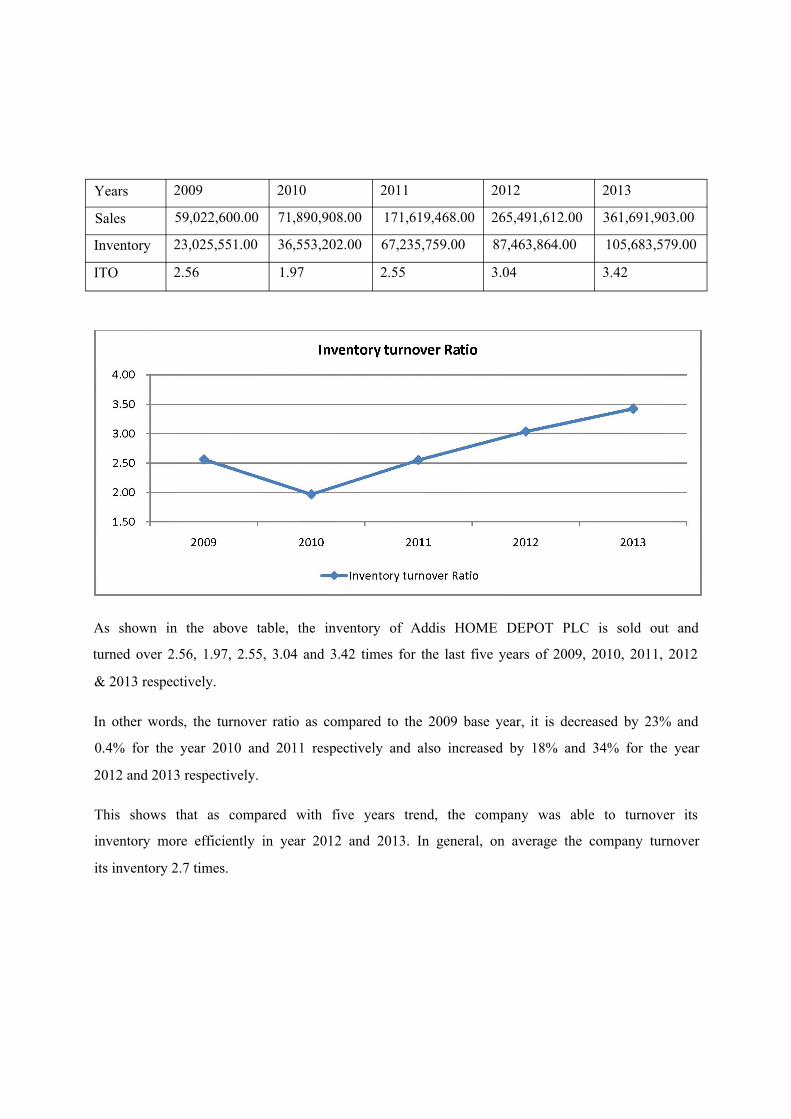
Years 2009 2010 2011 2012 2013
Sales 59,022,600.00 71,890,908.00 171,619,468.00 265,491,612.00 361,691,903.00
Inventory 23,025,551.00 36,553,202.00 67,235,759.00 87,463,864.00 105,683,579.00
ITO 2.56 1.97 2.55 3.04 3.42
As shown in the above table, the inventory of Addis HOME DEPOT PLC is sold out and
turned over 2.56, 1.97, 2.55, 3.04 and 3.42 times for the last five years of 2009, 2010, 2011, 2012
& 2013 respectively.
In other words, the turnover ratio as compared to the 2009 base year, it is decreased by 23% and
0.4% for the year 2010 and 2011 respectively and also increased by 18% and 34% for the year
2012 and 2013 respectively.
This shows that as compared with five years trend, the company was able to turnover its
inventory more efficiently in year 2012 and 2013. In general, on average the company turnover
its inventory 2.7 times.

B. Average Collection Period (ACP)
It represents the average length of time that the firm must wait after making a sale before
receiving cash or number of day’s sales tied up in receivable. The company’s average collection
period is measured using the following formula:-
ACP = Receivables *360 = Debtors *360
Sales Sales
Table 5, Average Collection Period
Years 2009 2010 2011 2012 2013
Receivable 1,523,837.00 2,414,463.00 12,527,731.00 24,739,481.00 12,077,773.00
Days in the
year(360)360 360 360 360 360
Receivable
*360548,581,320.- 869,206,680.-
4,509,983,560.- 8,906,213,160.- 4,347,998,280.-
Sales 59,022,600.00 71,890,908.00 171,619,468.00 265,491,612.00 361,691,903.00
DAYS 9 12 26 34 12
Average Collection Period Ratio
o .........
2009 2010 2011 2012 2013
-Average Collection Period Ratio
As it was shown above, the ACP of addis HOME DEPOT PLC was in continuous increase
during the periods of 2009 to 2012 but in 2013, it was decreased from the last two years.

The ACP of years 2010, 2011, 2012 and 2013 was increased by 30%, 183%, 261% and 30%
respectively as compared to the base year 2009.
The company’s ACP was not good for the 2011 and 2012 as compared to the base year 2009.
These negatively affect the short-term debt (immediate payment) ability for the years 2011 and
2012. But in the year 2013, the receivable collection management becomes stronger.
C. Fixed Assets Turnover Ratio (FATO)
It indicates the extent or percentage of capacity to which a firm is using existing property and
shows how many sales, is supported by one birr of fixed assets.
FATO = Sales
Fixed Assets
Table 6, Fixed Assets Turnover Ratio
Years 2009 2010 2011 2012 2013
Sales 59,022,600.00 71,890,908.00 171,619,468.00 265,491,612.00 361,691,903.00
Fixed
assets1,158,698.00 1,449,518.00 1,381,732.00 1,375,921.00 3,274,910.00
FATO 50.94 49.60 124.21 192.96 110.44

As it was shown in the above table, the company FATO is decreased by 3% for the year 2010
and increased by 144%, 279%, and 117% for the year 2011, 2012 and 2013 respectively as
compared to the 2009 base year.
The company’s fixed asset turnover ratio looks high/good. This is because of the greater increase
in sales and the nature of the business i.e. merchandising business (the company’s major part of
the asset is invested in current asset especially in inventory)
In general, from the amount of birr 1 investment in fixed asset the company earns 106 birr in
sales on average. This shows the company fixed asset turnover is in a good position.
D. Total Asset Turnover Ratio (TATO)
It indicates the company’s capability in generating sales from all resources committed to total
asset.
TATO = Sales
Total Assets
Table 7, Total Asset Turnover Ratio
Year 2009 2010 2011 2012 2013
Sales 59,022,600.00 71,890,908.00 171,619,468.00 265,491,612.00 361,691,903.00
Total31,465,632.00 47,860,888.00 106,404,766.00 129,538,677.00 143,040,455.00
Assets
TATO 1.88 1.50 1.61 2.05 2.53

3.00
2.50
2.00
1.50
1.00
2009 2010 2011 2012 2013
Total Asset Turnover Ratio
In the year 2009, the company TATO ratio was 1.88 and in 2013 it is increased by 35% due to a
high increase in sales. The TATO ratio is decreased by 20% and 14% for the year 2010 and 2011
respectively as compared to the 2009 base year and it was increased by 9% and 35% for the year
2012 and 2013 respectively. This shows the total asset turnover increases for the last two years.
In general, from the amount of Birr 1 investment in total asset the company earns 1.9 birr in sales
on average. This indicates that the company total asset turnover is in incremental position.
3.3 Leverage Ratios
It indicates that the capacity of the company’s revenues to support interest and other fixed
charges and whether there are sufficient assets to pay off the debt in the event of liquidation.
For analysis purpose, the two most important leverage ratios are calculated in this study.
A. Debt to Asset Ratio (DAR)
Debt to asset ratio shows that the relationship of debt with the total asset.
Debt ratio measures the production of total assets financed by the company’s creditors.
DAR = Total Debt ; DAR = TD
Total Asset TA

Year 2009 2010 2011 2012 2013
TD 24,076,739.00 35,400,812.00 78,784,519.00 93,706,633.00 99,213,913.00
TA 31,465,632.00 47,860,888.00 106,404,766.00 129,538,677.00 143,040,455.00
DAR 0.77 0.74 0.74 0.72 0.69
As it was shown in table 8, the debt ratio of addis HOME DEPOT PLC decreased for the
consecutive four years.
Assets financed by debt capital in the year 2010, 2011, 2012 and 2013 is declined by 3%,
3%, 5% and 9% respectively as compared to the base year 2009. This is because of the
growth rate of total debt is less than the growth rate of total asset.
The five year debt to asset showed on average 73% of the company asset is financed by
creditors. It obviously implies that owners have provided the remaining finance. They have
financed 1-0.73=0.27=27%.

In general the company’s debt ratios were high for the five years. This implies that they are
highly dependent in debt financing. But, the trend showed the company’s debt ratio is
decreasing.
B. Debt to Equity Ratio (DER)
Debt to equity ratio reflects the relative claim of creditor and shareholders in financing the
company’s asset or it simply indicates the relationship between the long-term funds provided
by creditors and those provided by the company’s owners.
DER = Total Debt ; DER = TD
Total Equity TE
Table 9, Debt to Equity Ratio
Year 2009 2010 2011 2012 2013
TD24,076,739.00 35,400,812.00 78,784,519.00 93,706,633.00 99,213,913.00
TE7,388,893.00 12,460,076.00 27,620,247.00 35,832,044.00 43,826,542.00
DER 3.26 2.84 2.85 2.62 2.26
Debt to Equity Ratio
3.60
3.20
2.80
2.40
2.00
2009 2010 2011 2012 2013
Debt to Equity Ratio
It is clear from debt asset ratio that the company’s lenders have contributed more funds than
owners’, lenders’ contribution is 2.7 times more than owners’ contribution. i.e. 0.73/0.27=2.7
= 270%
The debt to equity ratio is on decreasing trend as compared to the 2009 base year. This is
because of the growth rate of total debt is lower than the growth rate of total equity.
This indicates that the company’s trend showed financial strengthen by using more equity
financing than debt financing.
3.4 Profitability Ratios
Profitability ratio measure the success of the firm’s management in earning a net return from
the resources entrusted to them specifically, profitability ration can be used to answer such
question as how much of each sale was management able to convert in to profit? And did
the company shareholders receive an adequate return on their investment.
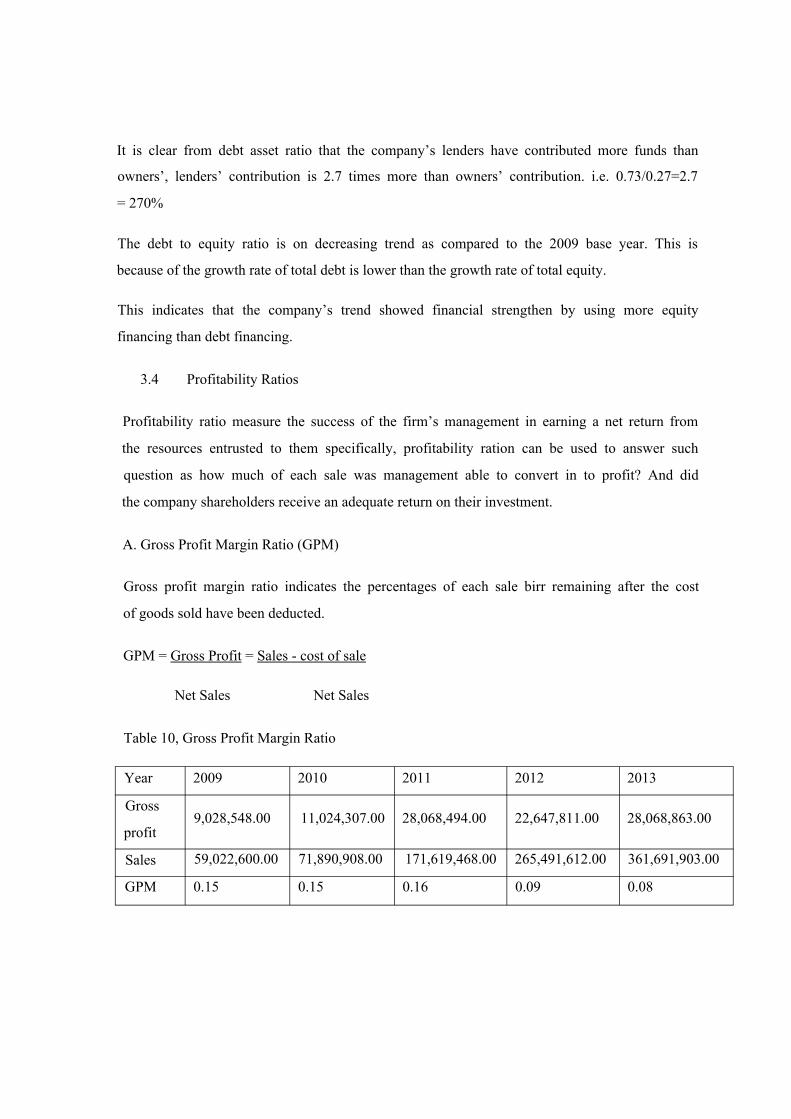
A. Gross Profit Margin Ratio (GPM)
Gross profit margin ratio indicates the percentages of each sale birr remaining after the cost
of goods sold have been deducted.
GPM = Gross Profit = Sales - cost of sale
Net Sales Net Sales
Table 10, Gross Profit Margin Ratio
Year 2009 2010 2011 2012 2013
Gross9,028,548.00 11,024,307.00 28,068,494.00 22,647,811.00 28,068,863.00
profit
Sales 59,022,600.00 71,890,908.00 171,619,468.00 265,491,612.00 361,691,903.00
GPM 0.15 0.15 0.16 0.09 0.08

0.20
2009 2010 2011 2012 2013
• Gross Profit Margin Ratio
In the year 2010 the gross profit margin ratio is the same as base year 2009. In 2011 the
gross profit margin ratio was increased by 7% as compared to the 2009 base year. And in
2012 and 2013 the gross profit margin ratio was decreased by 44% and 49% respectively as
compared to the 2009 base year. This is due to growth rate of sales is more than growth rate
of gross profit.
On average 13% of net sales is the gross profit of a company. This indicates that the
company incurred more cost related with sales and decrease gross profit margin on price for
the sake of increasing market share since more part of net sale is absorbed by cost of goods
sold.
B. Net Profit Margin Ratio (NPM)
The ratio measure the company’s percentage of each sales Birr remaining after all costs and
expenses.
NPM = Net Income (Loss)
Sales

Year 2009 2010 2011 2012 2013
Net3,961,577.00 4,735,884.00 14,826,177.00 8,457,597.00 10,601,992.00
Income/Loss
Sales 59,022,600.00 71,890,908.00 171,619,468.00 265,491,612.00 361,691,903.00
NPM 0.07 0.07 0.09 0.03 0.03
Net Profit Margin Ratio
In the year 2009 the company net profit margin ratio was 0.07 and in 2010 the same as base year
2009. In the year 2011 the NPM is increased by 29% as compared to the 2009 base year. In 2012
and 2013, the NPM is decreased by 53% each as compared to the 2009 base year. The decreasing
of NPM was due to a growth rate of sales is more than growth rate of Net profit.
In general, on average 5.6% of net sales is the net income after tax. This indicates that the
company was not efficient in resource utilization since the portion of net income for sales is low.
This comes because the company did not control cost and expenses efficiently or the company’s
gross profit margin on price is too low.

C. Rate of Return on Asset (ROTA)
It measures the company’s profitability per birr of investment in total asset.
ROTA is also net earnings per unit of a given asset.
ROTA = Net Income (Loss)
Total Assets
Table 12, Rate of Return on Asset
Year 2009 2010 2011 2012 2013
Net3,961,577.00 4,735,884.00 14,826,177.00 8,457,597.00 10,601,992.00
Income/Loss
Total Asset 31,465,632.00 47,860,888.00 106,404,766.00 129,538,677.00 143,040,455.00
ROA 0.13 0.10 0.14 0.07 0.07
Return on Asset Ratio
For the year 2010, 2012 and 2013 the ROTA was decreased by 21%, 48% and 48% respectively
as compared to the base year 2009 but in 2011 it was increased by 11% as compared to the base
year 2009. The rate was fluctuating from time to time and the company’s earning power is not
sufficient and the company’s not utilize its asset efficiently.

CHAPTER FOUR
SUMMARY, CONCLUSION AND RECOMMENDATION
1. Summary of Findings
This part consists of the major findings the researchers come across while conducting the
research on the topic performance evaluation using ratio analysis, taking addis HOME DEPOT
PLC. In order to achieve this result the researchers used various methods of data collection
including document review and interview. On the basis of the detailed data analysis and
interpretations the following summary points are identified.
The financial performance of the company is analyzed by reviewing the five year financial
statements. From the financial statement analysis the following results are obtained.
1.1. Liquidity Ratios
Current ratio: the company’s average current ratio is determined as 1.68. The current ratios in
the year 2009, 2010, 2011, 2012 and 2013 were 2.05, 1.79, 1.51, 1.50 and 1.55 respectively.
Quick ratio: the company average quick ratio is determined as 0.42.
The quick ratios were 0.42, 0.34, 0.53, 0.44 and 0.35 for the years 2009, 2010, 2011, 2012 and
2013 respectively.
Cash ratio: The Company’s ability to settle its current liability using cash on average is 0.23.
The cash ratio of the company in the years 2009, 2010, 2011, 2012 and 2013 were 0.27, 0.22,
0.34, 0.14 and 0.19 respectively.
1.2. Activity Ratios
Inventory turnover ratio: the company’s average inventory turnover ratio is determined as 2.7
times. The ITO ratios were 2.56, 1.97, 2.55, 3.04 and 3.42 in the years 2009, 2010, 2011, 2012
and 2013 respectively.

Average collection period: average collection period of the company were 9, 12, 26, 34 and 12
in the years 2009, 2010, 2011, 2012 and 2013 respectively. The company’s average collection
period is determined as 19 days.
Fixed assets turnover ratio: the company’s average fixed assets turnover ratio is determined as
106. The yearly fixed assets turnover ratios were 50.94, 49.6, 124.21, 192.96 and 110.44 for the
years 2009, 2010, 2011, 2012 and 2013 respectively.
Total assets turnover ratio: The total asset turnover ratios for the company were 1.88, 1.50,
1.61, 2.05 and 2.53 in the years 2009, 2010, 2011, 2012 and 2013 respectively. The company
average total asset turnover ratio is determined as 1.9.
1.3. Leverage Ratios
Debt to asset ratio: The five years debts to asset ratio of the company were 0.77, 0.74, 0.74,
0.72, and 0.69 in the years 2009, 2010, 2011, 2012 and 2013 respectively. On average the
company debt to asset ratio is 0.73 times.
Debt to equity ratio: The five years debts to equity ratio of the company were 3.26, 2.84, 2.85,
2.62, and 2.26 in the years 2009, 2010, 2011, 2012 and 2013 respectively. On average the
company debt to equity ratio is 2.7 times.
1.4. Profitability Ratios
Gross profit margin ratio: The five years gross profit margin ratios of the company were 0.15,
0.15, 0.16, 0.09 and 0.08 in the years 2009, 2010, 2011, 2012 and 2013 respectively. On average
the company’s gross profit margin ratio is 0.13.
Net profit margin ratio: The five years net profit margin ratios of the company were 0.07, 0.07,
0.09, 0.03, and 0.03 in the years 2009, 2010, 2011, 2012 and 2013 respectively. On average the
company’s net profit margin ratio is 0.06.
Return on asset ratio: the company’s return on asset ratios in the years 2009, 2010, 2011, 2012
and 2013 were 0.13, 0.10, 0.14, 0.07 and 0.07 respectively. The company’s average return on
asset ratio is calculated as 0.10.

2. Conclusion
The researchers have discussed the performance of addis HOME DEPOT PLC. The financial
statements are reviewed for five consecutive years (2009 -2013 G.C) and judgmental interview is
made with the finance department. The researchers undertake the study by using the above data.
Based on the findings of the study the following conclusions are drawn.
S Based on the computed liquidity ratios, mainly current ratio, quick ratio and cash ratio the
company did not satisfied the conventional rule; this shows the company’s weakness in
terms of paying its short-term debt when it compared with the standards.
S When we see the overall activity ratio, the company’s competency in asset utilization is
good. But the Inventory turnover ratio is not efficient (healthy). This is because; the
average inventory turnover ratio is 2.7 times (Meaning, on average the inventory turned
in to new inventory within 4 and 1/2 months. This implies that, there is asset (money) tied
up with inventory.
S When we come to the leverage ratio, the company’s capital structure showed 73% of the
total asset on average is covered by debt. This implies that the company is not healthy
because of more of the company’s asset is covered by debt and this lead to risk in
operation. But, the trend showed decreasing the debt ratio and becomes too good
structure.
S When we come to profitability ratio, the company incurred more cost and expense related
with sales and the company’s gross profit margin on price is too low. This in turn lead the
company’s profit is unfavorable when it compared to sales.
S Based on the above reason, the overall financial performance of addis HOME DEPOT
PLC was not good.

3. Recommendation
The researchers give some recommendation to the company, based on the findings of the
research paper.
> The researchers recommend the company to make ratio analysis regularly and the
company should have standard ratio (industry average) or the management should set
bench mark for the purpose of comparison.
> In order to improve the turning of inventory problem in to receivables through sales, the
company should design and implement some techniques like making reasonable discount
on the price of the product (work more on marketing), setting the maximum inventory
holding period at the head office level and use Just in time delivery method for
purchasing activity.
> According to the calculated profitability ratios, the company profitability is not attractive.
So, the company should reduce its cost of goods sold and operating expenses by
separating controlling and non controlling cost and implementing corrective action like;
by reducing purchasing cost, decreasing wastes like paper usage and decreasing
overheads like electricity, telephone and so on.
> The company’s better implement and revise marketing plan by investing more on
advertising and publicity for the targeted consumers, expand customer knowledge for
their product and offer new or improved product based on customer needs.
> The main purpose of addis HOME DEPOT PLC is generating attractive profit on asset
invested for their investors. Therefore, the company should improve its activity with
regard to utilizing its asset to generate attractive profit for their investors.
> In order to improve the liquidity ratios, the company is better to implement some
techniques like to the change the current liabilities (especially MIDROC Gold liabilities
assessed on the findings) to long term liabilities with better condition, negotiate longer
payment terms with vendors, refinance debt with long term contract and increase capital
in the form of cash.
> In order to improve the leverage ratio, the company should set its optimum capital
structure and implement corrective action through some techniques like increase capital
and paying of its debt to creditors to achieve its optimum capital structure.

ACRONYMS
> IBID - Same source as last time
> ITOR - Inventory turnover ratio
> DIH - Days of inventory holding
> ARTO - Account receivable turnover ratio
> ACP - Average collection period
> TA - Total asset
> TD - Total debt
> CE - Capital employed
> NA - Net asset
> NW - Net worth
> NFA - Net fixed asset
> NCA - Net current asset
> CA - Current asset
> CL - Current liability
> EBIT - Earning before interest and tax
> ROI - Return on investment
> ROTA - Rate of return on asset
> ROE - Rate of return on equity
> CR -Current ratio
> QR - Quick ratio
> FATO - Fixed asset turnover ratio
> TATO - Total asset turnover ratio
> DAR - Debt to asset ratio
> DER - Debt to equity ratio
> GPM - Gross profit margin
> NPM - Net profit margin

BIBLOGRAPHY
addis Home Depot PLC. (2009-2013). Audited Annual Financial Report.
Diamond, Michael A. & Flamholtz, Eric G. (1991). Financial Accounting. 2nded. USA:
PWS-KENT Pub. Co.
Pandey, I M. (2007). Financial Management. 9thed. India: Vikas Publishing House Pvt. Ltd.
Van Horne, James C. (1998). Financial Management and Policy. 11thed. USA: Prentice Hall.
Kieso, Donald E. & Weygandt, Jerry J. (1998). Intermediate Accounting. 9thed. Canada:
Jhon Wiley & Sons Inc.
Larson, Kermit D. & Miller, Paul B.W. (1992). Financial Accounting. 5thed. USA: Irwin
Professional.
Gitman, Lawrence J. (1997). Principles of Managerial Finance. 8thed. USA: Addison-
Wesley.
Ross, Stephen A. & Jordan, Bradford D. (2001). Essential of Corporate Finance. 3rded. USA:
McGraw-Hill.
Schall, Lawrence D. & Haley, Charles W. (1991). Introduction to Financial Management.
6thed. Singapore: McGraw-Hill.
Meigs, Walter B. (1988). Financial Accounting. 5thed. USA: McGraw-Hill.
<http://www.bentleycg.com>. [May 07, 2014].
<http://www.entrepreneur.com>. [April 26, 2014].
<http://www.financialratioss.com>. [May 11, 2014].
<http://www.campus.murraystate.edu>. [May 14, 2014].
<http://www.free-business-plans.com>. [April 25, 2014]
<http://www.midroc-ethiotechgroup.com>. [February 06, 2014].

APPENDIX

This work is licensed under a Creative CommonsAttribution - Noncommercial - NoDerivs 4.0 License.
To view a copy of the license please see: http://creativecommons.org/licenses/by-nc-nd/4.0/
This is a download from the BLDS Digital Library on OpenDocshttp://opendocs.ids.ac.uk/opendocs/
Institute of Development Studies