Embed Size (px)
Citation preview

May 8, 2018
Financial Report(January 1 ~ March 31, 2018)
2
Key Subjects
2018 1st QuarterFinancial Results Summary
Changes in Scope of Consolidation, Affiliated CompaniesFinancial Results Summary
2018 Annual Financial Results ForecastFinancial Results Forecast SummaryCapex / Depreciation, Tire Production Capacity etc.
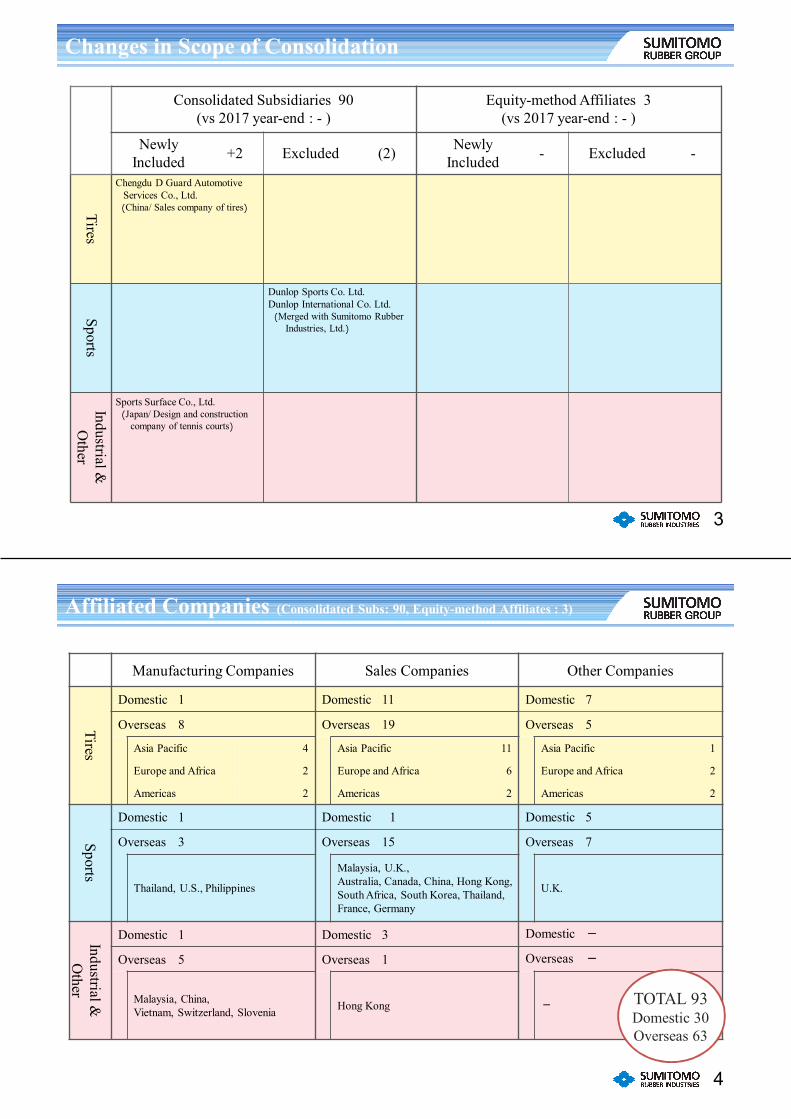
3
Consolidated Subsidiaries 90(vs 2017 year-end : - )
Equity-method Affiliates 3(vs 2017 year-end : - )
NewlyIncluded +2 Excluded (2) Newly
Included - Excluded -
Tires
Chengdu D Guard AutomotiveServices Co., Ltd.(China/ Sales company of tires)
Sports
Dunlop Sports Co. Ltd.Dunlop International Co. Ltd.(Merged with Sumitomo Rubber
Industries, Ltd.)
Industrial &
Other
Sports Surface Co., Ltd.(Japan/ Design and construction
company of tennis courts)
Changes in Scope of Consolidation
4
Manufacturing Companies Sales Companies Other Companies
TiresDomestic 1 Domestic 11 Domestic 7
Overseas 8 Overseas 19 Overseas 5
Asia Pacific 4 Asia Pacific 11 Asia Pacific 1
Europe and Africa 2 Europe and Africa 6 Europe and Africa 2
Americas 2 Americas 2 Americas 2
Sports
Domestic 1 Domestic 1 Domestic 5
Overseas 3 Overseas 15 Overseas 7
Thailand, U.S., Philippines
Malaysia, U.K., Australia, Canada, China, Hong Kong, South Africa, South Korea, Thailand,France, Germany
U.K.
Industrial &
Other
Domestic 1 Domestic 3 Domestic -
Overseas 5 Overseas 1 Overseas -
Malaysia, China, Vietnam, Switzerland, Slovenia Hong Kong - TOTAL 93
Domestic 30Overseas 63
Affiliated Companies (Consolidated Subs: 90, Equity-method Affiliates : 3)

2018Jan.-Mar.
2017Jan.-Mar.
vs2017
2017Annual
Sales Revenue
BusinessProfit (%)
OperatingProfit (%)
Profit
5
※1
※2
※1. Business Profit : Sales Revenue – (COS + SGA)※2. Profit : Profit attributable to owners of parent
The above notes apply throughout this report.
Billions of Yen
Consolidated Financial Results (2018 Jan.-Mar.)
212.7 192.1 111% 877.9
14.3 12.2 67.0(6.7%) (6.3%) (7.6%)
14.0 11.8 67.4(6.6%) (6.2%) (7.7%)
7.7 8.6 90% 47.0
117%
118%
163.9
190.7 185.2 182.7
9.1%
9.7%
6.5%7.5%15.0
18.5
12.1 13.7
14.4
17.9
12.0 12.6 8.8%
9.4%
6.5% 6.9%
9.0 10.9
7.7
16.8
0
5
10
15
20
25
0.0
50.0
100.0
150.0
200.0
2013 2014 2015 2016Net Sales (JGAAP) / Sales Revenue(IFRS) : Left Operating Income (JGAAP) / Business Profit (IFRS)Ordinary Income (JGAAP) Operating Profit (IFRS)Profit attributable to owners of parent (JGAAP) / (IFRS)
Japanese G A A P I F R S
6
%:Profit % :Record HighBillions
of Yen
Consolidated Sales Revenue / Profit (Jan.-Mar.)
178.3 192.1
212.7
8.0%
6.3%
6.7%
13.5 11.8
14.0
14.2 12.2
14.3
7.6%6.2%
6.6%
8.2 8.6 7.7
0.0
5.0
10.0
15.0
20.0
25.0
2016 2017 2018
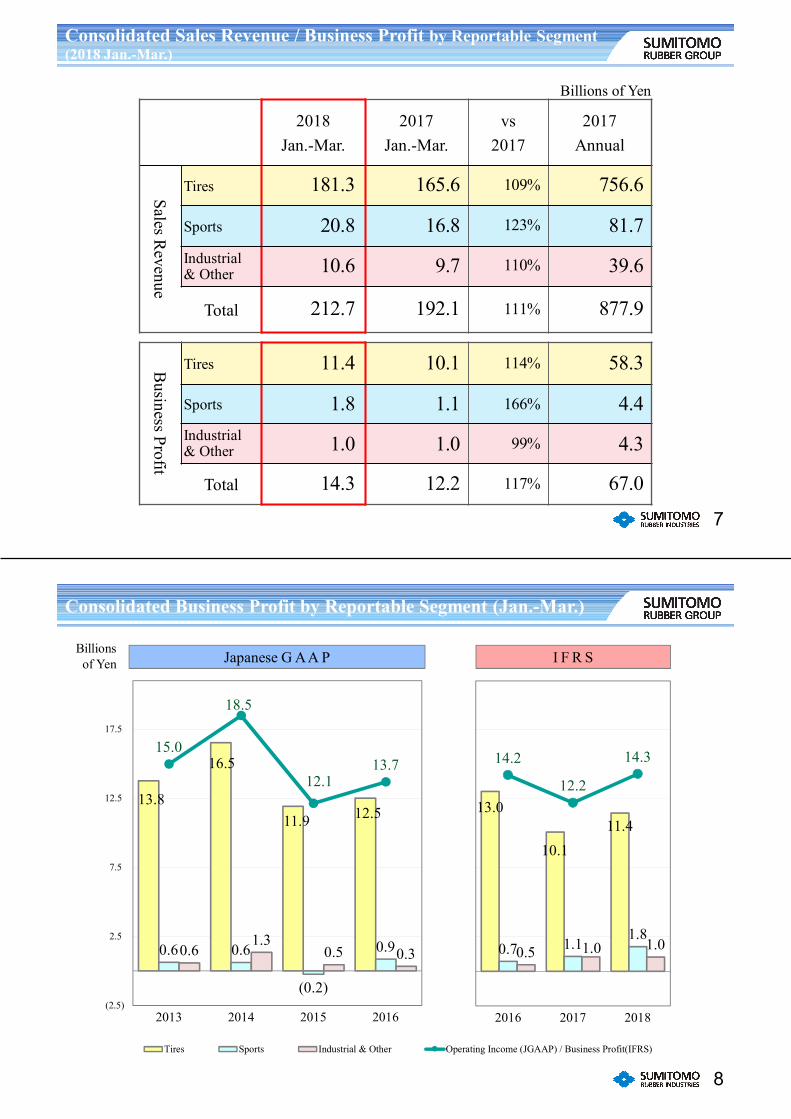
7
Billions of Yen
2018Jan.-Mar.
2017Jan.-Mar.
vs2017
2017Annual
Sales Revenue
Tires
Sports
Industrial& Other
Total
Business Profit
Tires
Sports
Industrial& Other
Total
181.3 165.6 109% 756.6
20.8 16.8 123% 81.7
10.6 9.7 110% 39.6
212.7 192.1 111% 877.9
11.4 10.1 114% 58.3
1.8 1.1 166% 4.4
1.0 1.0 99% 4.3
14.3 12.2 117% 67.0
Consolidated Sales Revenue / Business Profit by Reportable Segment(2018 Jan.-Mar.)
Japanese G A A P I F R S
8
Billionsof Yen
13.8
16.5
11.9 12.5
0.6 0.6
(0.2)
0.9 0.6 1.3
0.5 0.3
15.0
18.5
12.1 13.7
(2.5)
2.5
7.5
12.5
17.5
2013 2014 2015 2016
Tires Sports Industrial & Other Operating Income (JGAAP) / Business Profit(IFRS)
Consolidated Business Profit by Reportable Segment (Jan.-Mar.)
13.0
10.1 11.4
0.7 1.1 1.8 0.5 1.0 1.0
14.2
12.2
14.3
2016 2017 2018

8.2
4.3
2.0
5.3 5.7 7.2
0.7 2.2
5.1
14.2 12.2
14.3
2016 2017 2018
10.2
12.8
4.5
8.0
4.2
6.3 5.8 5.2
0.6 (0.6)1.8
0.5
15.0 18.5
12.1 13.7
(2.5)
2.5
7.5
12.5
17.5
2013 2014 2015 2016
Japan Asia Others Operating Income (JGAAP) / Business Profit (IFRS)
I F R S
9
Japanese G A A P
JapanAsia
OthersTotal
Billionsof Yen
※Sales and Profit for geographic areas on this page are based on sales company’s location.
Sales Revenue94.3 109.1 97.4 86.3 82.6 85.8 92.532.4 35.5 38.2 35.2 35.2 40.1 40.837.1 46.0 49.6 61.1 60.6 66.1 79.3
163.9 190.7 185.2 182.7 178.3 192.1 212.7
Consolidated Business Profit by Geographic Areas (Jan.-Mar.)
10% of Overseas
ConsolidatedSales Revenue
Japanese G A A P I F R SBillionsof Yen
※Overseas Sales on this page are based on customer’s location.
Overseas Sales Revenue (Jan.-Mar.)
21.8 20.0 25.5 32.8
15.4 17.3 14.7 15.0
33.4 36.8 40.2 37.4
17.8 22.8
25.9 25.7 88.4 97.0
106.3 111.0
0.0
25.0
50.0
75.0
100.0
125.0
150.0
2013 2014 2015 2016North America Europe Asia Other
32.1 35.8 32.4
14.9 19.6 34.4
37.3
41.5
42.3 25.2
25.2
25.4 109.5
122.1
134.4
2016 2017 2018
163.9 190.7 185.2 182.7 178.3 192.1 212.754% 51% 57% 61% 61% 64% 63%
12.214.3
0.0
5.0
10.0
15.0
11
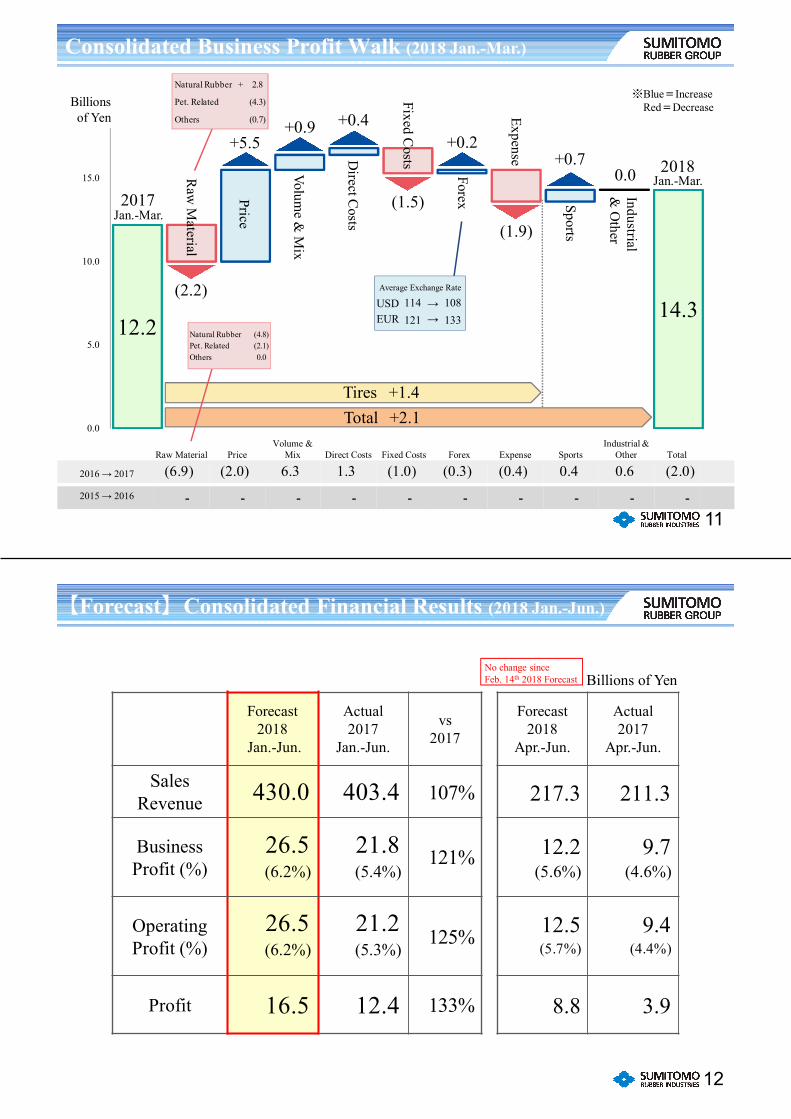
2017Jan.-Mar.
2018
Tires +1.4Total +2.1
Raw
Material
+5.5
Price
Volume &
Mix
Direct C
osts
+0.4
(1.5)
Fixed Costs
Forex
+0.2
Expense
(1.9)Sports
+0.7Industrial&
Other
(2.2)
+0.9
0.0 Jan.-Mar.
Raw Material PriceVolume &
Mix Direct Costs Fixed Costs Forex Expense SportsIndustrial &
Other Total
2016 → 2017
2015 → 2016 - - - - - - - - - -
※Blue=IncreaseRed=DecreaseBillions
of Yen
Consolidated Business Profit Walk (2018 Jan.-Mar.)
Average Exchange Rate
USD →EUR →
114 108121 133
Natural Rubber + 2.8
Pet. Related (4.3)
Others (0.7)
(6.9) (2.0) 6.3 1.3 (1.0) (0.3) (0.4) 0.4 0.6 (2.0)
Natural Rubber (4.8)Pet. Related (2.1)Others 0.0
12
Billions of Yen
【Forecast】Consolidated Financial Results (2018 Jan.-Jun.)
No change sinceFeb. 14th 2018 Forecast
Forecast2018
Jan.-Jun.
Actual2017
Jan.-Jun.
vs2017
Forecast2018
Apr.-Jun.
Actual2017
Apr.-Jun.
SalesRevenue
BusinessProfit (%)
OperatingProfit (%)
Profit
430.0 403.4 107% 217.3 211.3
26.5 21.8 12.2 9.7(6.2%) (5.4%) (5.6%) (4.6%)
26.5 21.2 12.5 9.4(6.2%) (5.3%) (5.7%) (4.4%)
16.5 12.4 133% 8.8 3.9
121%
125%
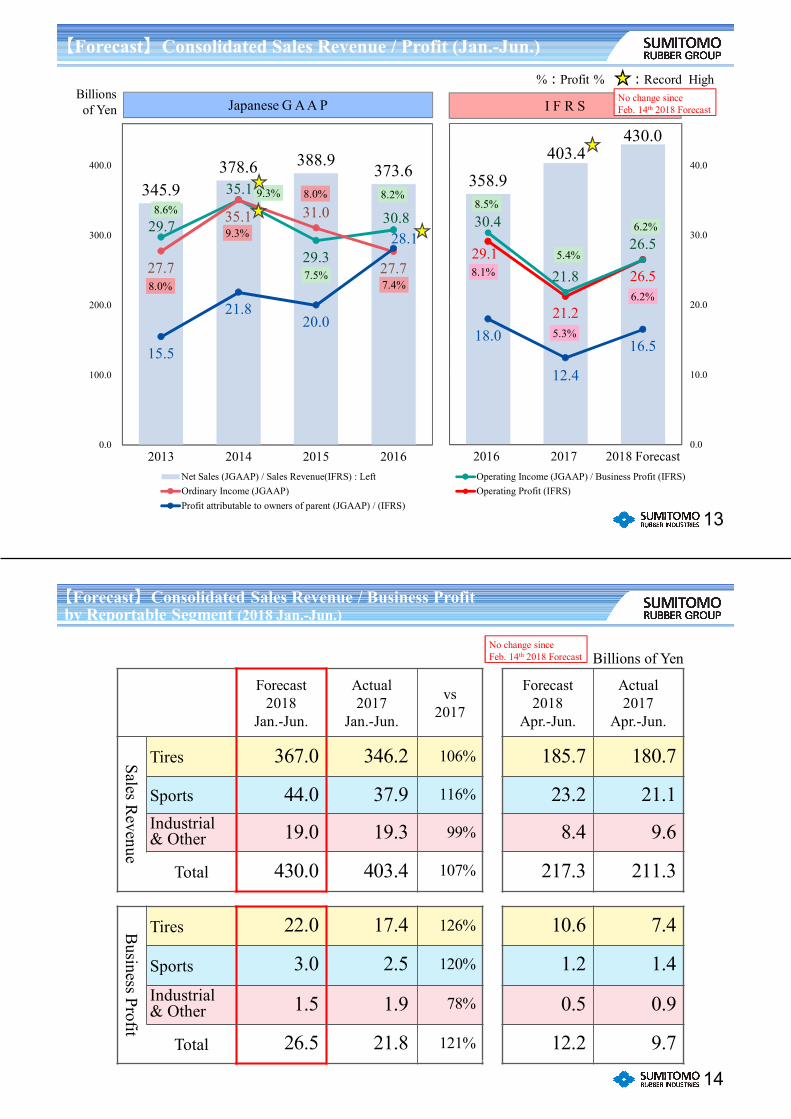
358.9 403.4
430.0
8.5%
5.4%
6.2%
29.1
21.2
26.5
30.4
21.8
26.5
8.1%
5.3%
6.2%
18.0
12.4
16.5
0.0
10.0
20.0
30.0
40.0
2016 2017 2018 Forecast
345.9 378.6 388.9 373.6
8.6%9.3%
7.5%
8.2%
29.7
35.1
29.3
30.8
27.7
35.1 31.0
27.7 8.0%
9.3%
8.0%
7.4%
15.5
21.8 20.0
28.1
0
5
10
15
20
25
30
35
40
45
0.0
100.0
200.0
300.0
400.0
2013 2014 2015 2016Net Sales (JGAAP) / Sales Revenue(IFRS) : Left Operating Income (JGAAP) / Business Profit (IFRS)Ordinary Income (JGAAP) Operating Profit (IFRS)Profit attributable to owners of parent (JGAAP) / (IFRS)
Japanese G A A P I F R S
13
Billionsof Yen
%:Profit % :Record High
【Forecast】Consolidated Sales Revenue / Profit (Jan.-Jun.)
No change sinceFeb. 14th 2018 Forecast
14
Billions of Yen
【Forecast】Consolidated Sales Revenue / Business Profitby Reportable Segment (2018 Jan.-Jun.)
No change sinceFeb. 14th 2018 Forecast
Forecast2018
Jan.-Jun.
Actual2017
Jan.-Jun.
vs2017
Forecast2018
Apr.-Jun.
Actual2017
Apr.-Jun.
Sales Revenue
Tires
SportsIndustrial & Other
Total
Business Profit
Tires
Sports
Industrial & Other
Total
367.0 346.2 106% 185.7 180.7
44.0 37.9 116% 23.2 21.1
19.0 19.3 99% 8.4 9.6
430.0 403.4 107% 217.3 211.3
22.0 17.4 126% 10.6 7.4
3.0 2.5 120% 1.2 1.4
1.5 1.9 78% 0.5 0.9
26.5 21.8 121% 12.2 9.7
21.826.5
0.0
5.0
10.0
15.0
20.0
25.0
30.0
35.0
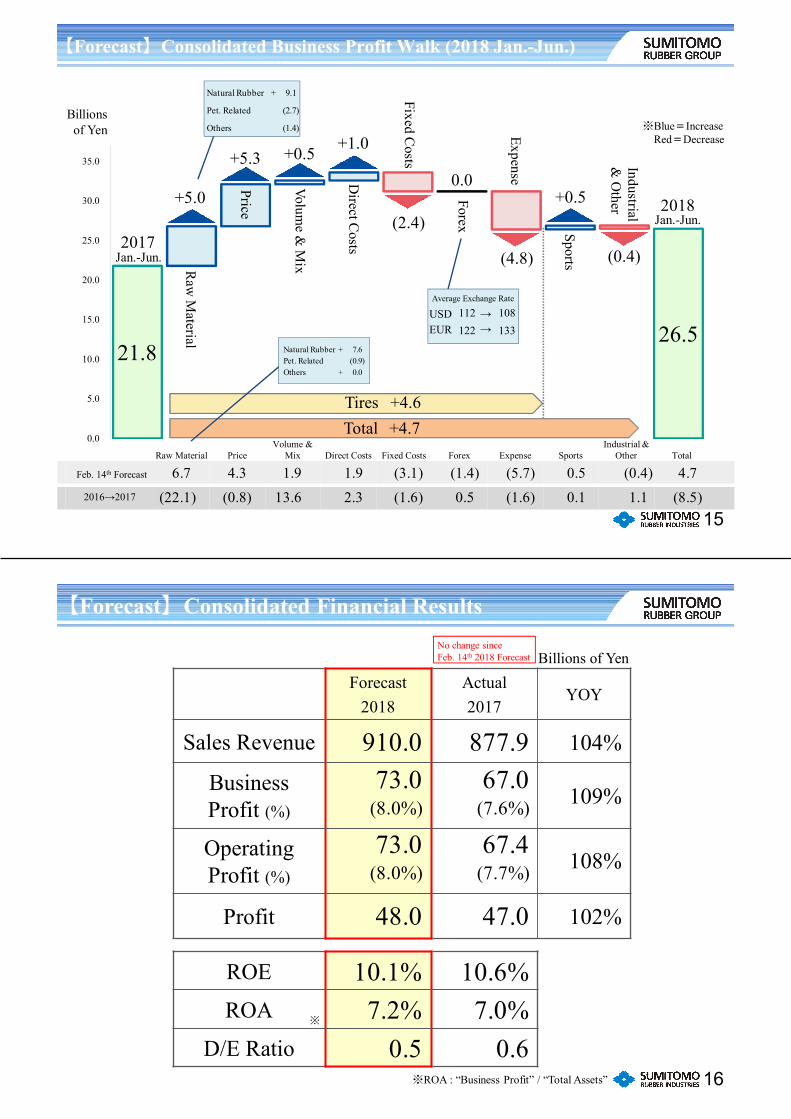
Tires +4.6Total +4.7
+5.0
Raw
Material
+5.3
Price
Volume &
Mix
Direct C
osts
+1.0
(2.4)
Fixed Costs
Forex
0.0
Expense(4.8)
Sports+0.5
Industrial&
Other
+0.5
15
Average Exchange Rate
USD →EUR →
Raw Material PriceVolume &
Mix Direct Costs Fixed Costs Forex Expense SportsIndustrial &
Other Total
Feb. 14th Forecast
2016→2017
(0.4)
※Blue=IncreaseRed=Decrease
Billionsof Yen
2017Jan.-Jun.
2018Jan.-Jun.
112 108122 133
Natural Rubber + 9.1
Pet. Related (2.7)
Others (1.4)
Natural Rubber + 7.6Pet. Related (0.9)Others + 0.0
6.7 4.3 1.9 1.9 (3.1) (1.4) (5.7) 0.5 (0.4) 4.7
(22.1) (0.8) 13.6 2.3 (1.6) 0.5 (1.6) 0.1 1.1 (8.5)
【Forecast】Consolidated Business Profit Walk (2018 Jan.-Jun.)
Forecast2018
Actual2017
YOY
Sales Revenue
BusinessProfit (%)
Operating Profit (%)
Profit
ROE
ROA
D/E Ratio16
Billions of Yen
【Forecast】Consolidated Financial ResultsNo change sinceFeb. 14th 2018 Forecast
※
※ROA : “Business Profit” / “Total Assets”
910.0 877.9 104%
73.0 67.0(8.0%) (7.6%)
73.0 67.4(8.0%) (7.7%)
48.0 47.0 102%
10.1% 10.6%7.2% 7.0%
0.5 0.6
109%
108%
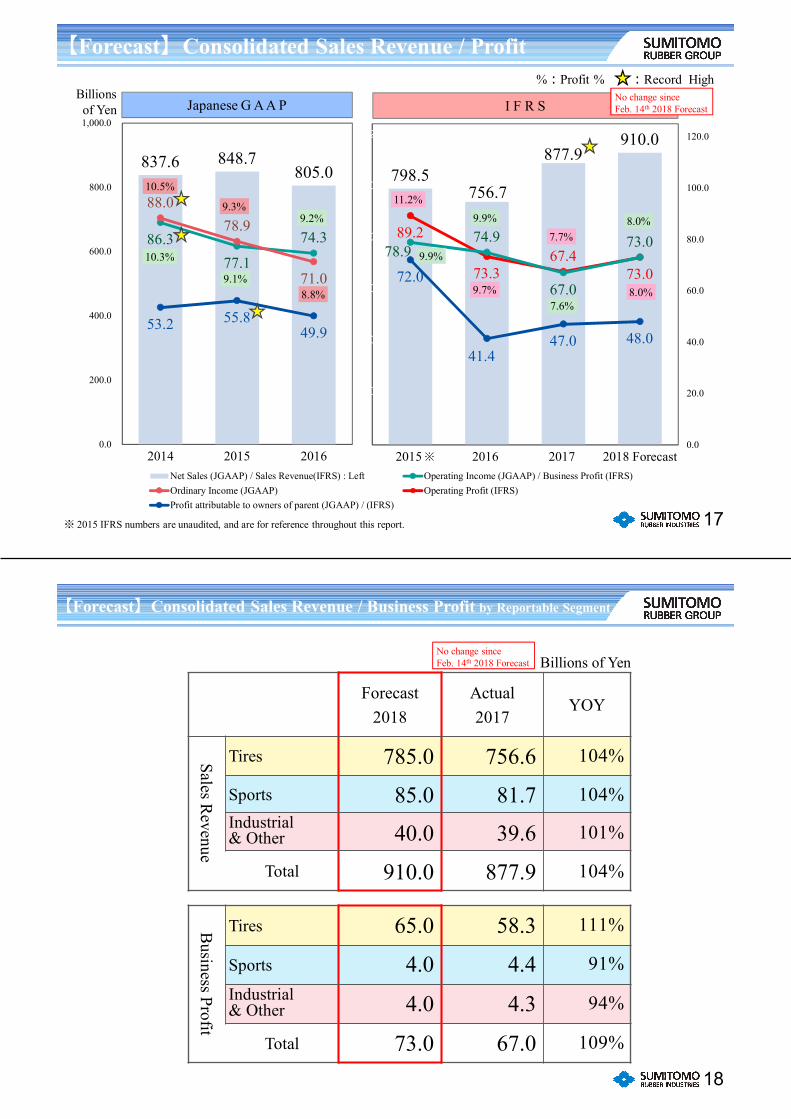
798.5 756.7
877.9 910.0
89.2
73.3 67.4
73.0 78.9
74.9
67.0
73.0 9.9%
9.9%
7.6%
8.0%
11.2%
9.7%
7.7%
8.0%72.0
41.4 47.0 48.0
0.0
20.0
40.0
60.0
80.0
100.0
120.0
2015 2016 2017 2018 Forecast
837.6 848.7 805.0
10.3%
9.1%
9.2%
86.3 77.1
74.3
88.0 78.9
71.0
10.5%
9.3%
8.8%
53.2 55.8 49.9
0
20
40
60
80
100
120
0.0
200.0
400.0
600.0
800.0
1,000.0
2014 2015 2016Net Sales (JGAAP) / Sales Revenue(IFRS) : Left Operating Income (JGAAP) / Business Profit (IFRS)Ordinary Income (JGAAP) Operating Profit (IFRS)Profit attributable to owners of parent (JGAAP) / (IFRS)
※
Japanese G A A P I F R S
17
Billionsof Yen
%:Profit % :Record High
【Forecast】Consolidated Sales Revenue / Profit
No change sinceFeb. 14th 2018 Forecast
※ 2015 IFRS numbers are unaudited, and are for reference throughout this report.
18
Billions of Yen
【Forecast】Consolidated Sales Revenue / Business Profit by Reportable Segment
No change sinceFeb. 14th 2018 Forecast
Forecast2018
Actual2017
YOY
Sales Revenue
Tires
SportsIndustrial & Other
Total
Business Profit
Tires
Sports
Industrial & Other
Total
785.0 756.6 104%
85.0 81.7 104%
40.0 39.6 101%
910.0 877.9 104%
65.0 58.3 111%
4.0 4.4 91%
4.0 4.3 94%
73.0 67.0 109%
67.0 73.0
20.0
30.0
40.0
50.0
60.0
70.0
80.0
90.0
Raw Material PriceVolume &
Mix Direct Costs Fixed Costs Forex Expense SportsIndustrial &
Other TotalFeb. 14th Forecast
2016→2017
+8.7
20172018
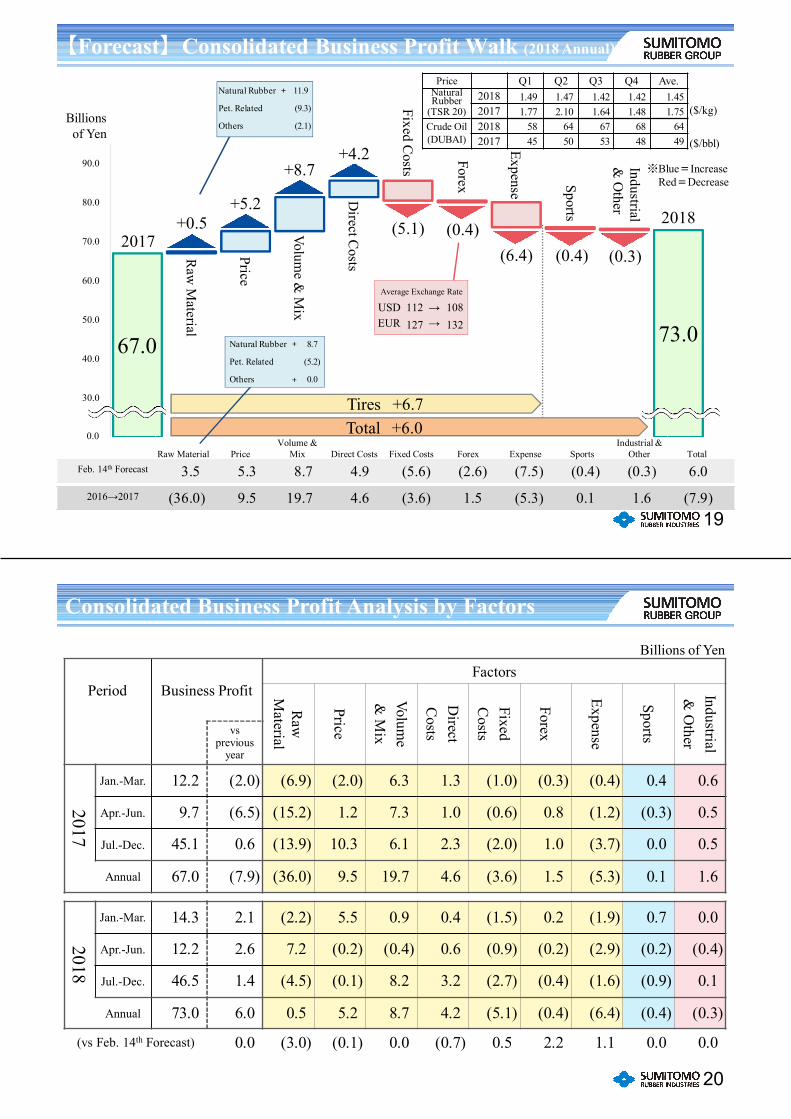
Tires +6.7Total +6.0
+0.5
Raw
Material
+5.2
Price
Volume &
Mix
Direct C
osts
+4.2
(5.1)
Fixed Costs
Forex
(0.4)
Expense(6.4)
Sports
(0.4)
Industrial &
Other
(0.3)
0.0
19
Average Exchange Rate
USD →EUR →
Price Q1 Q2 Q3 Q4 Ave.Natural Rubber
(TSR 20)20182017
Crude Oil(DUBAI)
20182017 ($/bbl)
($/kg)
※Blue=IncreaseRed=Decrease
Billionsof Yen
【Forecast】Consolidated Business Profit Walk (2018 Annual)
Natural Rubber + 8.7
Pet. Related (5.2)
Others + 0.0
112 108127 132
Natural Rubber + 11.9
Pet. Related (9.3)
Others (2.1)
1.49 1.47 1.42 1.42 1.451.77 2.10 1.64 1.48 1.75
58 64 67 68 6445 50 53 48 49
3.5 5.3 8.7 4.9 (5.6) (2.6) (7.5) (0.4) (0.3) 6.0
(36.0) 9.5 19.7 4.6 (3.6) 1.5 (5.3) 0.1 1.6 (7.9)
20
(vs Feb. 14th Forecast)
Billions of Yen
Consolidated Business Profit Analysis by Factors
Period Business ProfitFactors
Raw
M
aterial
Price
Volume
& M
ix
Direct
Costs
FixedC
osts
Forex
Expense
Sports
Industrial &
Other
vs previous
year
2017
Jan.-Mar.
Apr.-Jun.
Jul.-Dec.
Annual
2018
Jan.-Mar.
Apr.-Jun.
Jul.-Dec.
Annual
12.2 (2.0) (6.9) (2.0) 6.3 1.3 (1.0) (0.3) (0.4) 0.4 0.6
9.7 (6.5) (15.2) 1.2 7.3 1.0 (0.6) 0.8 (1.2) (0.3) 0.5
45.1 0.6 (13.9) 10.3 6.1 2.3 (2.0) 1.0 (3.7) 0.0 0.5
67.0 (7.9) (36.0) 9.5 19.7 4.6 (3.6) 1.5 (5.3) 0.1 1.6
14.3 2.1 (2.2) 5.5 0.9 0.4 (1.5) 0.2 (1.9) 0.7 0.0
12.2 2.6 7.2 (0.2) (0.4) 0.6 (0.9) (0.2) (2.9) (0.2) (0.4)
46.5 1.4 (4.5) (0.1) 8.2 3.2 (2.7) (0.4) (1.6) (0.9) 0.1
73.0 6.0 0.5 5.2 8.7 4.2 (5.1) (0.4) (6.4) (0.4) (0.3)
0.0 (3.0) (0.1) 0.0 (0.7) 0.5 2.2 1.1 0.0 0.0

21
Tire Sales Volume (Comparison %)
Jan.-Mar. Apr.-Jun. Jul.-Sep. Oct.-Dec. Annual Jan.-Mar. Apr.-Jun. Jul.-Sep. Oct.-Dec. Annual Jan.-Jun. Jul.-Dec. Annual
113% 111% 111% 107% 110% 103% 105% 98% 96% 100% 105% 96% 100%
103% 114% 106% 100% 105% 102% 96% 97% 104% 100% 98% 99% 99%
114% 107% 113% 104% 109% 100% 112% 130% 133% 119% 105% 128% 117%
112% 112% 112% 109% 111% 103% 101% 106% 105% 104% 106% 105% 106%
NorthAmerica 121% 102% 107% 112% 110% 87% 99% 102% 102% 98% 98% 101% 99%
Europe 130% 182% 173% 137% 154% 142% 107% 107% 104% 114% 123% 101% 111%
Asia 106% 102% 104% 98% 102% 97% 111% 109% 110% 107% 108% 112% 110%
Others 98% 105% 97% 101% 100% 99% 91% 107% 106% 101% 103% 106% 105%
111% 112% 111% 106% 110% 102% 102% 107% 108% 105% 104% 106% 105%
28,230 29,920 31,810 33,510 123,470 28,880 30,510 33,940 36,140 129,480 60,730 69,260 129,990
OverseasO.E.
OverseasRep.
Details
Total
Total T ire Sales (000 Units)
DomesticRep.
2017 Actual2018 Jan.-Mar. Actual,
Apr.-Dec. Forecast 2018 Feb.14th Forecast
DomesticO.E.
22Forex(USD)
000 units
※Numbers shown in the bar graph are yoy% by region.
Tire Overseas Rep. Volume by Regional Segment
101
113 106
104
111 104
0
10,000
20,000
30,000
40,000
50,000
60,000
70,000
2013 2014 2015 2016 2017 2018 Forecast
North America South & Central America
Europe (including Russia) Africa
Middle East Asia
Oceania
94
156
98
95
105
108
134
101
597
104
109
129
124
82
119
100
82
104
101
108
114
98
116
110
102
154
104
102
93
98
103
114
100
107
96
98 106 121 109 112 108
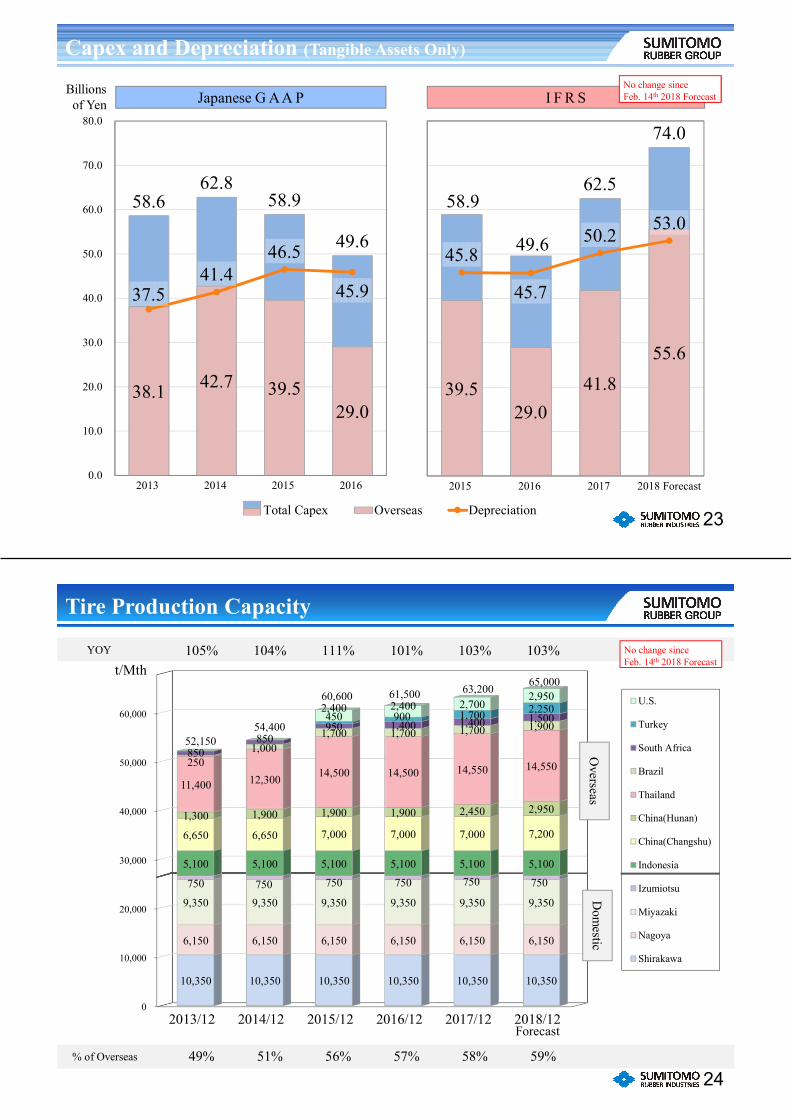
58.6 62.8
58.9
49.6
38.1 42.7 39.5 29.0
37.5 41.4
46.5
45.9
0.0
10.0
20.0
30.0
40.0
50.0
60.0
70.0
80.0
2013 2014 2015 2016
Total Capex Overseas Depreciation 23
Japanese G A A P I F R SBillionsof Yen
Capex and Depreciation (Tangible Assets Only)
58.9
49.6
62.5
74.0
39.5 29.0
41.8 55.6
45.8
45.7
50.2 53.0
2015 2016 2017 2018 Forecast
No change sinceFeb. 14th 2018 Forecast
0
10,000
20,000
30,000
40,000
50,000
60,000
2013/12 2014/12 2015/12 2016/12 2017/12 2018/12
10,350 10,350 10,350 10,350 10,350 10,350
6,150 6,150 6,150 6,150 6,150 6,150
9,350 9,350 9,350 9,350 9,350 9,350
750 750 750 750 750 750
5,100 5,100 5,100 5,100 5,100 5,100
6,650 6,650 7,000 7,000 7,000 7,200 1,300 1,900 1,900 1,900 2,450 2,950
11,400 12,300 14,500 14,500 14,550 14,550 250 1,000
1,700 1,700 1,700 1,900
850 850
950 1,400 1,400 1,500 450 900 1,700 2,250 2,400 2,400 2,700 2,950
52,150 54,400
60,600 61,500 63,200 65,000
U.S.
Turkey
South Africa
Brazil
Thailand
China(Hunan)
China(Changshu)
Indonesia
Izumiotsu
Miyazaki
Nagoya
Shirakawa
24
YOY
Overseas
Dom
estic
t/Mth
% of Overseas
Tire Production Capacity
49% 51% 56% 57% 58% 59%
105% 104% 111% 101% 103% 103%
Forecast
No change sinceFeb. 14th 2018 Forecast

534 588 598
636 679
715
250 295 324
374 415 447
9095
9187
92 94
40
50
60
70
80
90
100
0
100
200
300
400
500
600
700
800
900
2013 2014 2015 2016 2017 2018 Forecast
Total Production Volume Overseas Operating Ratio(%)
YOY
25
%000t
Tire Production Volume and Operating Ratio
102% 110% 102% 106% 107% 105%
26“XXIO X (TEN)” SRIXON “REVO CX”
New Products / New Technologies
Babolat NEW “Pure Drive”※Dunlop Sports Marketing Co. Ltd. is the sole
selling agent of Babolat in Japan.
25.430.8
39.249.3
57.0
68.9
36.046.3
54.5 55.165.3
69.7
46.032.8
40.447.7
26.8 33.6 49.3
61.5 68.4
93.6 61.7 78.0
105.9 109.1 105.1
96.6
51.1 41.4
53.2 64.2
20.0
40.0
60.0
80.0
100.0
120.0
140.0
10.0
20.0
30.0
40.0
50.0
60.0
70.0
80.0
90.0
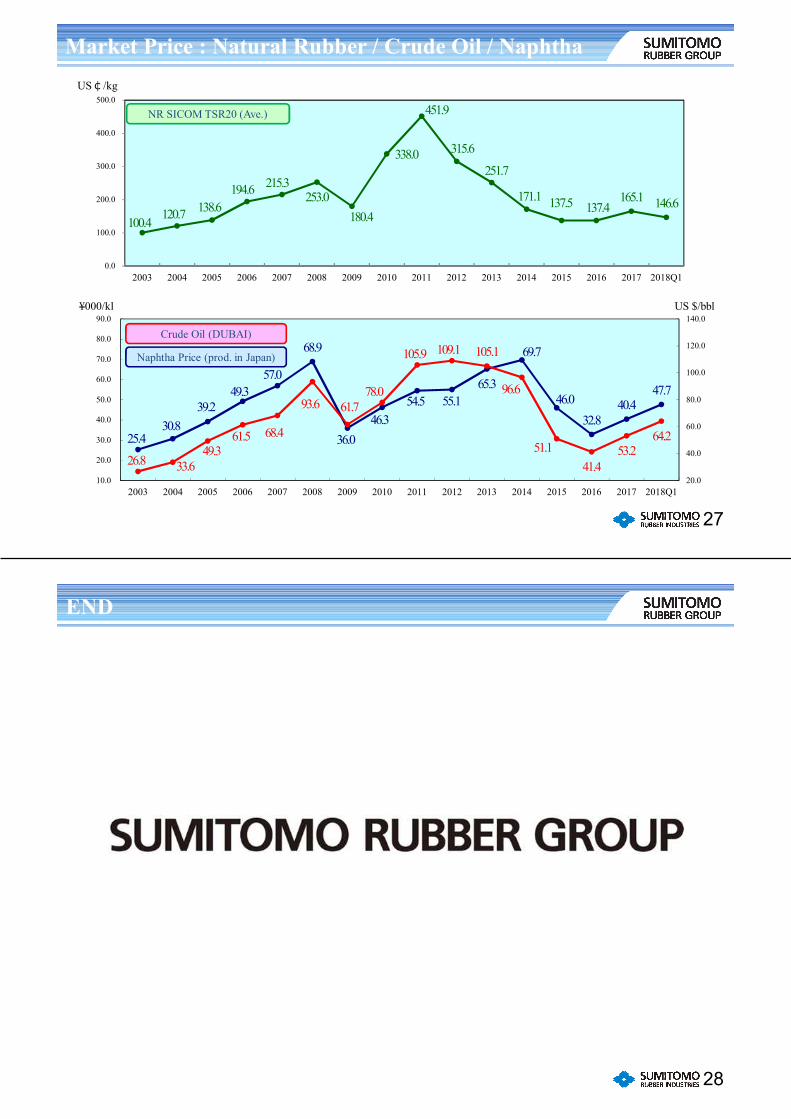
2003 2004 2005 2006 2007 2008 2009 2010 2011 2012 2013 2014 2015 2016 2017 2018Q1
100.4 120.7 138.6194.6 215.3
253.0180.4
338.0
451.9
315.6
251.7
171.1 137.5 137.4165.1 146.6
0.0
100.0
200.0
300.0
400.0
500.0
2003 2004 2005 2006 2007 2008 2009 2010 2011 2012 2013 2014 2015 2016 2017 2018Q1
27
US $/bbl
NR SICOM TSR20 (Ave.)
Naphtha Price (prod. in Japan)
Crude Oil (DUBAI)
¥000/kl
US¢/kg
Market Price : Natural Rubber / Crude Oil / Naphtha
END
28