Embed Size (px)
Citation preview
52 | BROADBAND COMMUNITIES | www.broadbandcommunities.com | JANUARY/FEBRUARY 2017
FINANCING
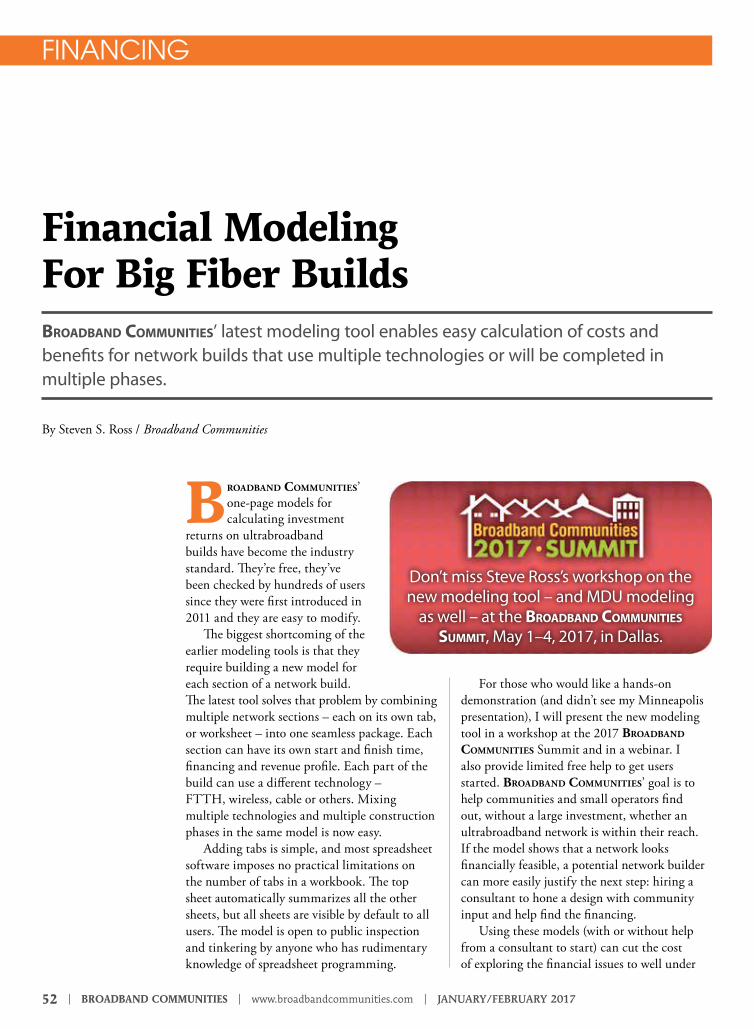
Broadband Communities’ one-page models for calculating investment
returns on ultrabroadband builds have become the industry standard. They’re free, they’ve been checked by hundreds of users since they were first introduced in 2011 and they are easy to modify.
The biggest shortcoming of the earlier modeling tools is that they require building a new model for each section of a network build. The latest tool solves that problem by combining multiple network sections – each on its own tab, or worksheet – into one seamless package. Each section can have its own start and finish time, financing and revenue profile. Each part of the build can use a different technology – FTTH, wireless, cable or others. Mixing multiple technologies and multiple construction phases in the same model is now easy.
Adding tabs is simple, and most spreadsheet software imposes no practical limitations on the number of tabs in a workbook. The top sheet automatically summarizes all the other sheets, but all sheets are visible by default to all users. The model is open to public inspection and tinkering by anyone who has rudimentary knowledge of spreadsheet programming.
For those who would like a hands-on demonstration (and didn’t see my Minneapolis presentation), I will present the new modeling tool in a workshop at the 2017 broadband Communities Summit and in a webinar. I also provide limited free help to get users started. broadband Communities’ goal is to help communities and small operators find out, without a large investment, whether an ultrabroadband network is within their reach. If the model shows that a network looks financially feasible, a potential network builder can more easily justify the next step: hiring a consultant to hone a design with community input and help find the financing.
Using these models (with or without help from a consultant to start) can cut the cost of exploring the financial issues to well under
Financial Modeling For Big Fiber BuildsBroadBand Communities’ latest modeling tool enables easy calculation of costs and benefits for network builds that use multiple technologies or will be completed in multiple phases.
By Steven S. Ross / Broadband Communities
Don’t miss Steve Ross’s workshop on the new modeling tool – and MDU modeling
as well – at the BroadBand Communities summit, May 1–4, 2017, in Dallas.
JANUARY/FEBRUARY 2017 | www.broadbandcommunities.com | BROADBAND COMMUNITIES | 53
$10,000, rather than the $70,000 or more normally necessary.
OVERVIEWThe model is available at www.FTTHanalyzer.com. It comes with three tabs for different network sections and a summary top sheet. Unlike the original spreadsheet, upon which the new tool is based, the model now covers five years rather than four.
Adding new tabs, each representing a unique section of the network build, is possible at any time as long as the new tabs are placed between existing tabs that represent sections of the build. Any network section except the first or last in the stack can be omitted by deleting its tab or by setting to zero the number of premises passed and the money raised to fund the passings. Any worksheet except the summary sheet can be modified without breaking the model – an important factor for ease of use – though modifications require some care. Read on for details about all these processes.
GENERAL ADVICEUsers new to the practice of business modeling often attempt to add too much detail in the early stages. Trying to pin down in advance the exact prices for, say, Wi-Fi routers in customer homes is almost never worth the effort. Other costs are far, far higher, and an extra $10 or $20 per unit should not be the make-or-break point in any decision. Polling residents to see how many would use the proposed network and to find out what services they want and will pay for is far more important.
Once a network is operating, such items as that Wi-Fi router become more important. As operating experience increases, financial models become progressively more detailed. broadband Communities offers two monthly cash flow tools for that purpose.
However, when considering a new broadband network, carefully testing key leverage points is most important. These leverage points include technology (fiber, coax, wireless), expected number of customers, expected average revenue per customer, cost of using existing
utility poles, cost of linking to national and state broadband trunk (middle mile) networks and so forth.
In a modeling exercise, make sure the uncertainties don’t all point in the same direction! Network proponents can easily lowball cost estimates and be overoptimistic about revenues, of course, but those issues are fairly evident. Timing of cash flows is not as easy to understand. A proposed network might indeed meet or exceed its revenue projections but probably not until a few years after operations start.
Modeling is especially important for fiber-to-the-home networks because FTTH is different from copper. FTTH networks usually require higher up-front capital expenses than other types of networks, but because they are generally much easier to maintain, they have lower operating expenses. They use less electric power and are less affected by temperature extremes and flooding. They can often be repaired remotely, without a truck roll. Capital expenses for upgrades are also lower because FTTH networks are almost future-proof. Once fiber is in the ground, it can accommodate vastly
higher bandwidth through changes only to the electronics. Finally, fiber networks have much higher revenue potential than copper networks.
The economics of broadband networks can vary widely depending on competition, construction and marketing costs, customer uses and the needs of local businesses. Don’t rely on rules of thumb. This magazine has reported on network builds with times to cash-flow breakeven that vary from less than one year to seven years.
IS FIBER A POSSIBILITY?Using this model when first considering a network or network expansion can help a community avoid hiring a consultant to develop detailed financial projections when the numbers can’t possibly work. In addition, community residents have more confidence in a model if they fully understand what goes into it.
To estimate costs quickly, visit broadband Communities’ Fiberville.com database of more than 1,000 FTTH deployers (including almost 200 communities). Find a deployer nearby or in a similar circumstance, and call for the basic numbers. Other
BROADBAND COMMUNITIES’ FINANCIAL MODELING TOOLS
The financial models available to view and download at www.FTTHanalyzer.com include investment calculators for
• Cable companies, telephone companies or municipalities • Rural providers • Providers in multifamily housing • Multiple neighborhoods (introduced in this article)
and the following revenue calculators: • Customer monthly revenue calculator• 18-month operational cash flow calculator.
BroadBand Communities placed these models into the public domain for anyone to use and modify free of charge. If the models are incorporated into a commercial package, BroadBand Communities should be credited.
BroadBand Communities can provide limited free guidance by telephone to help users get started. More hands-on help and presentations to community or company audiences are available for a small fee.
Call 877-588-1649, or contact us at [email protected].
54 | BROADBAND COMMUNITIES | www.broadbandcommunities.com | JANUARY/FEBRUARY 2017
FINANCING
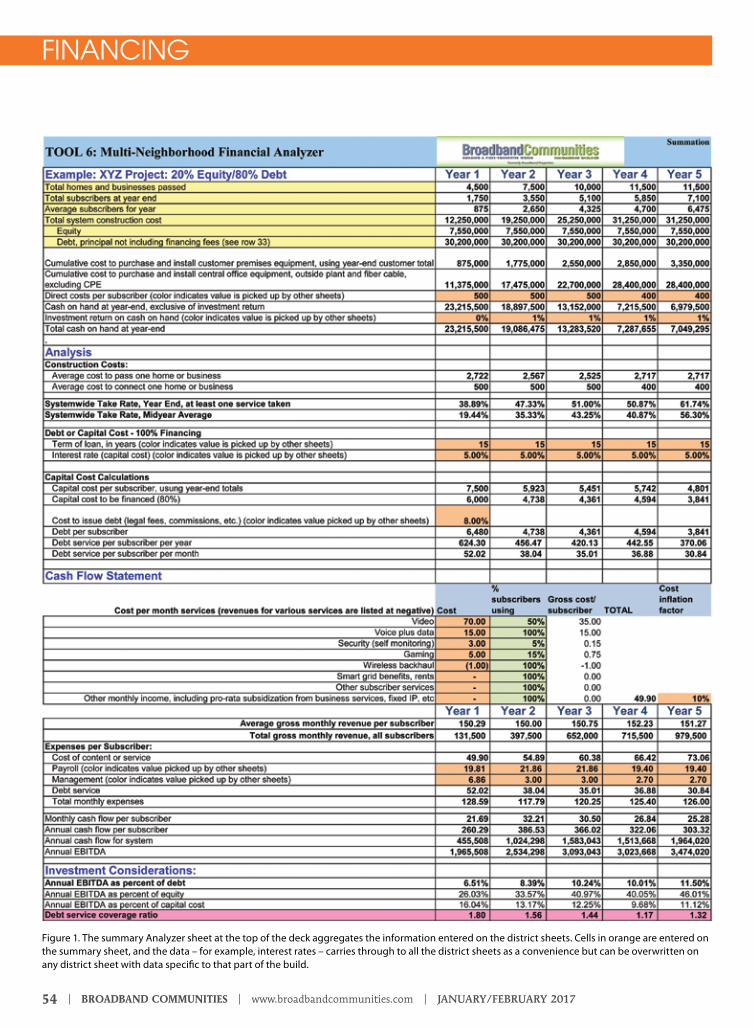
Figure 1. The summary Analyzer sheet at the top of the deck aggregates the information entered on the district sheets. Cells in orange are entered on the summary sheet, and the data – for example, interest rates – carries through to all the district sheets as a convenience but can be overwritten on any district sheet with data specific to that part of the build.
JANUARY/FEBRUARY 2017 | www.broadbandcommunities.com | BROADBAND COMMUNITIES | 55
good sources of information include equipment vendors, local telecom engineering and construction firms that supply labor for network builds and some state telecom offices.
For ease of use, the new file as supplied has all formulas unlocked. Thus, you or anyone else can accidentally overwrite them. Use the Format command on the Home menu (in the Excel ribbon menu) to lock specific cells or ranges of cells or to lock entire sheets and unlock only the cells you want to fiddle with.
The formulas are unlocked because users had trouble with earlier tools, which were supplied with formulas locked, and because a multisheet model
tends to require more exceptions. It is wise for users to choose a specific color to highlight cells whose formulas have been changed. This promotes transparency and makes for easier auditing. An example of this approach is noted in Figure 4.
MULTIPLE PHASES AND DISTRICTSThe multi-neighborhood worksheet is designed for feasibility modeling of networks that must be built or financed in phases or that will cover districts with different financial dynamics. It is similar to the original model, which is the most frequently used tool, but in addition to spanning five years rather than four, it includes better modeling
of service expenses. The published version has three district (or phase) worksheets but, as noted, can be easily expanded to 50 or more. In tests over the past year, I found that most users created models that had between four and 10 worksheets. They often used several worksheets for the same neighborhood if that neighborhood was being built out in phases.
Test users showed their models to citizens, as well as bankers and other sources of capital, to demonstrate the feasibility of the projects they were planning. These projects included builds by incumbent and competitive telephone companies, municipalities and public-private partnerships.
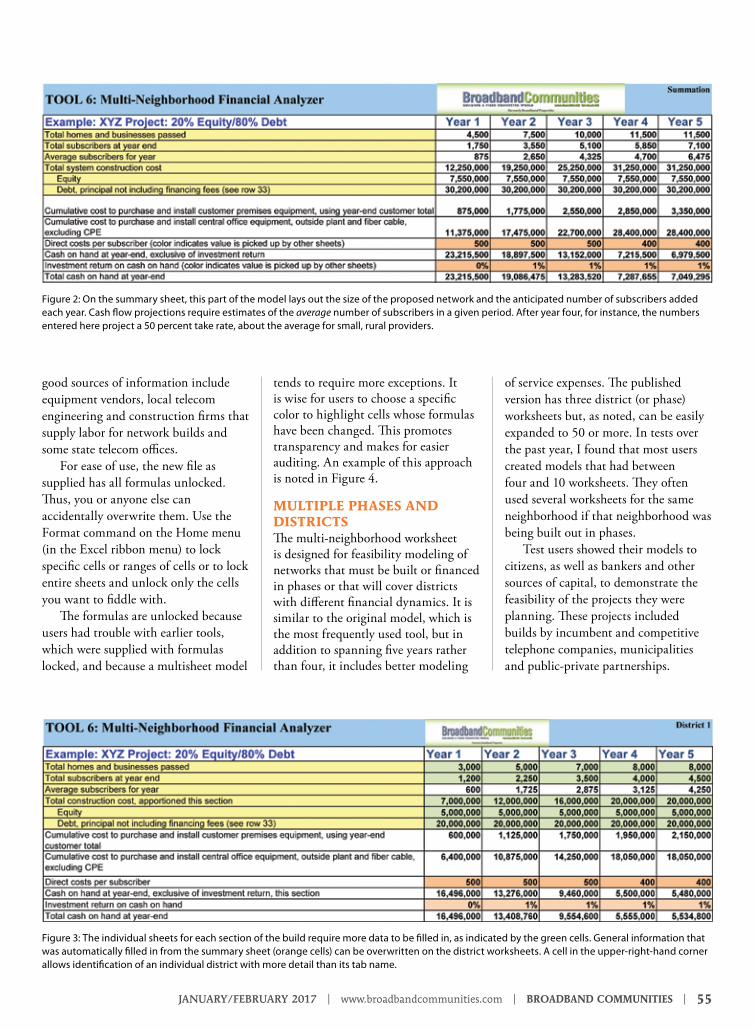
Figure 2: On the summary sheet, this part of the model lays out the size of the proposed network and the anticipated number of subscribers added each year. Cash flow projections require estimates of the average number of subscribers in a given period. After year four, for instance, the numbers entered here project a 50 percent take rate, about the average for small, rural providers.
Figure 3: The individual sheets for each section of the build require more data to be filled in, as indicated by the green cells. General information that was automatically filled in from the summary sheet (orange cells) can be overwritten on the district worksheets. A cell in the upper-right-hand corner allows identification of an individual district with more detail than its tab name.
56 | BROADBAND COMMUNITIES | www.broadbandcommunities.com | JANUARY/FEBRUARY 2017
FINANCING
SECTIONS OF THE MODELAs with earlier feasibility tools, each worksheet has four sections (Figure 1):
• Basics• Analysis• Cash Flow• Investment considerations,
ending with coverage ratios for amortization expenses.
A user provides new values on the summary sheet for the green and orange boxes; the software calculates the rest from data entered on district or neighborhood sheets below the summary sheet. Values entered in the orange boxes are copied automatically onto all sheets but can be overwritten on any neighborhood sheet without breaking the model.
The model is supplied with four worksheets. The tab labeled Analyzer summarizes all the information on other sheets. It aggregates all data on all sheets, starting with one named Dist1 (for “District 1”) and ending on Dist2. To insert a new worksheet, add a new tab anyplace between Dist1 and Dist2, and copy any existing sheet (in this case, Dist1, Dist2, or Wireless) to the new tab. It is possible to delete or rename any sheets except for Dist1 and Dist2 and the top summary sheet. To avoid using the names Dist1 and Dist2, just leave the Dist1 and Dist2
worksheets empty. After setting the initial values for build size and money needed to zero, hiding the Dist1 and Dist2 tabs is an option in many spreadsheet programs.
Here is the easiest way to copy a worksheet:
• Set cursor outside model area in the worksheet
• Ctrl-A, Ctrl-C• Right click on a tab to right of
Dist1, insert new worksheet• Go to blank sheet, set cursor on cell
A1, hit Ctrl-V to copy model sheet.
In some spreadsheet software, column widths and sometimes row heights will have to be adjusted manually on the new tab.
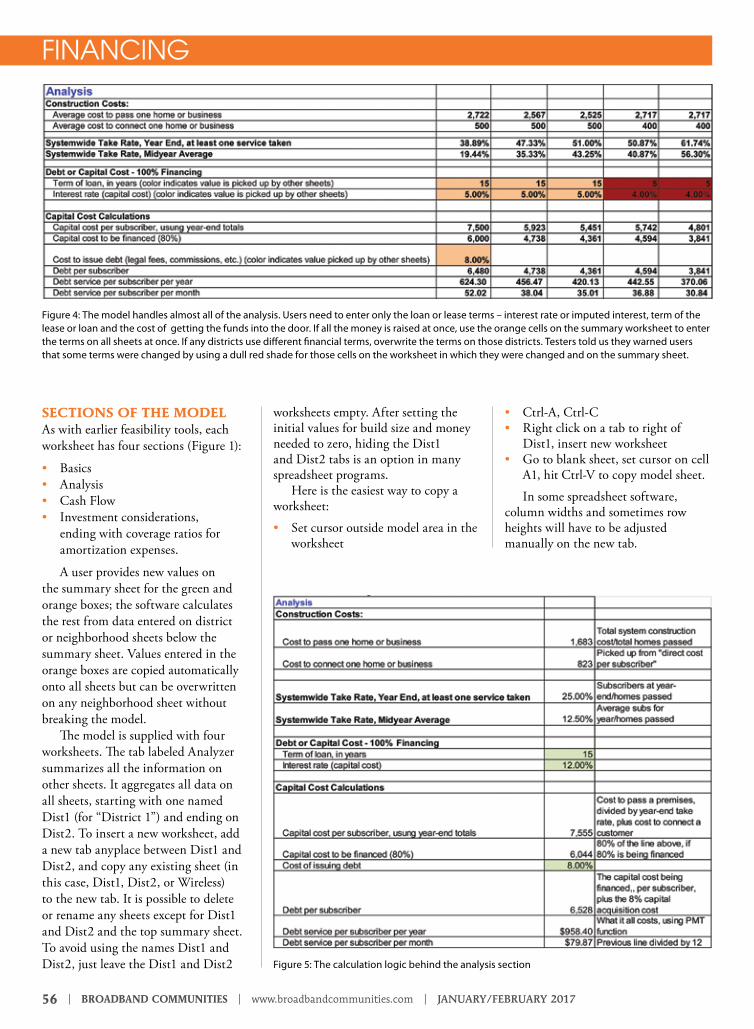
Figure 4: The model handles almost all of the analysis. Users need to enter only the loan or lease terms – interest rate or imputed interest, term of the lease or loan and the cost of getting the funds into the door. If all the money is raised at once, use the orange cells on the summary worksheet to enter the terms on all sheets at once. If any districts use different financial terms, overwrite the terms on those districts. Testers told us they warned users that some terms were changed by using a dull red shade for those cells on the worksheet in which they were changed and on the summary sheet.
Figure 5: The calculation logic behind the analysis section
JANUARY/FEBRUARY 2017 | www.broadbandcommunities.com | BROADBAND COMMUNITIES | 57
Warning: Always keep available a sheet with no orange boxes overwritten for copying into a new tab if needed. Copying from the original software on FTTHanalyzer.com will not work reliably if rows have been added or subtracted.
On the Analyzer sheet (the top-sheet summary), most of the data is pulled from the worksheets that represent separate neighborhood builds. Those worksheets automatically pick up per-customer costs for customer-premises equipment and interest earned on deposits (entered here on the summary sheet in the orange rows).
CONNECTION COSTSIn Figure 2, the model assumes that a network builder incurs a cost to connect a home after passing it only when the resident signs up for service.
This is not always the case! In a rural area, for instance, building all the drops at once and including them in the cost to pass a premises may be a cheaper alternative. In a multiple-dwelling-unit building, installing all premises equipment at once, typically wireless gateways, may be financially wise. The rural and MDU models are helpful in deciding between the “delay” or “all at once” alternatives.
CAPITAL COSTSThe model accounts for the cost of capital (including interest and fees paid to brokers, lawyers and so forth) and the timing of capital inflows. In the XYZ project shown in the figures, the network deployer provides 20 percent of the network cost and raises 80 percent, all in one tranche. Entering different capital flows in different years
is also possible.Using one capital input is more
typical for municipal builds but not at all typical for private builds. During the recent recession, raising all the capital ahead of time and carrying the debt at 10 or 12 percent interest while getting 0 to 1 percent for the same cash on deposit was a loser’s strategy. Even municipalities, which may be forced to raise all their capital at once if they use revenue bond or municipal lease mechanisms, might consider using commercial loans despite their higher (but, as of now, still reasonable) rates because they offer more flexibility on receipt of funds. As this is written, network operators are financing builds at 5 or 6 percent, and they can park money in Treasury bills or other instruments at more than 2 percent. However, as interest rates rise, Treasury
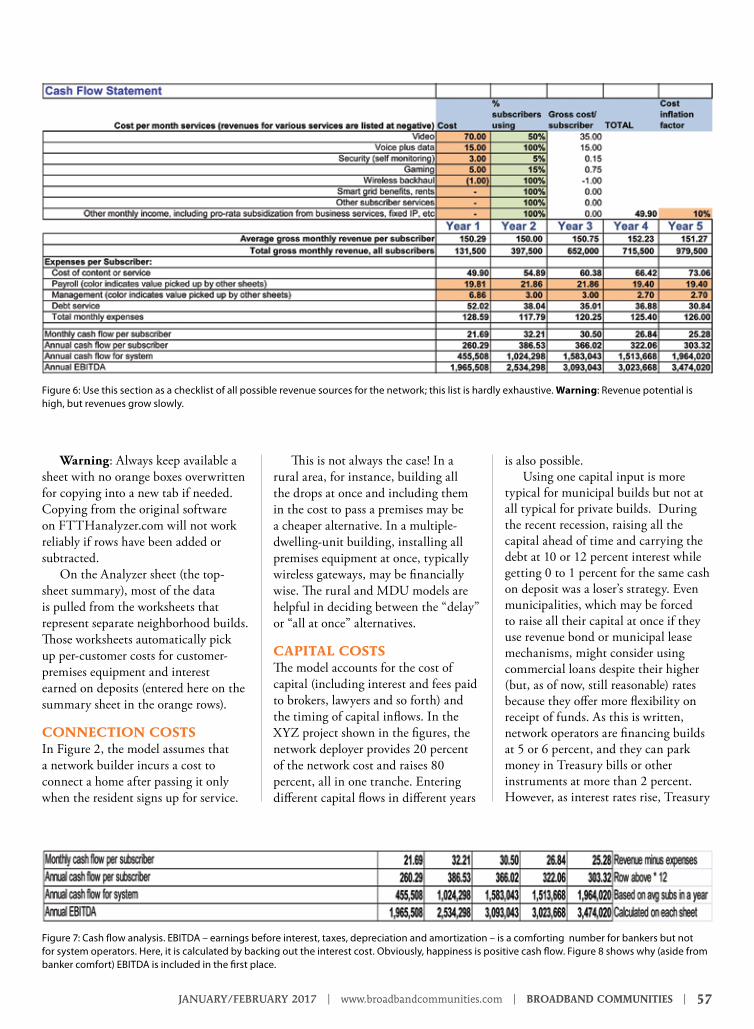
Figure 6: Use this section as a checklist of all possible revenue sources for the network; this list is hardly exhaustive. Warning: Revenue potential is high, but revenues grow slowly.
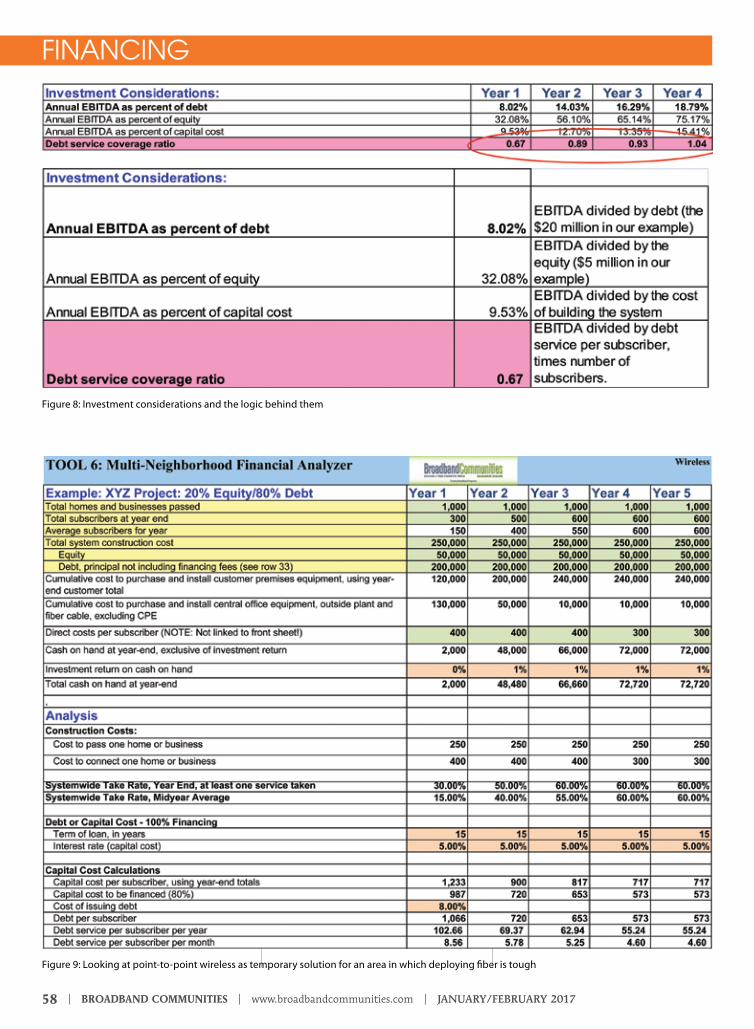
Figure 7: Cash flow analysis. EBITDA – earnings before interest, taxes, depreciation and amortization – is a comforting number for bankers but not for system operators. Here, it is calculated by backing out the interest cost. Obviously, happiness is positive cash flow. Figure 8 shows why (aside from banker comfort) EBITDA is included in the first place.
58 | BROADBAND COMMUNITIES | www.broadbandcommunities.com | JANUARY/FEBRUARY 2017
FINANCING
Figure 8: Investment considerations and the logic behind them
Figure 9: Looking at point-to-point wireless as temporary solution for an area in which deploying fiber is tough
JANUARY/FEBRUARY 2017 | www.broadbandcommunities.com | BROADBAND COMMUNITIES | 59
bill values fall. That strategy is not a game for amateurs.
The model allows the up-front cost of equity (the example is 8 percent in legal and brokerage fees) to be entered farther down in the worksheet. This cost could be counted separately (as in this example) or charged against money raised or against initial equity simply by adjusting the amounts in the inputs and making the explicit cost of capital 0 percent. Changing worksheet formulas is not necessary.
For municipal builds, paying the lender interest only (or interest plus a small amortization) until the system gets to cash-flow positive, typically around year four, is common. In this example, payback starts in year one (using the Excel PMT function for a level term mortgage). Lease deals are also popular in some states.
It is possible to override this assumption for the entire build at once on the summary or on individual district sheets. This capability is especially useful when money is raised over many years to build separate sections of a network.
REVENUEUse the section shown in Figure 6 as a checklist of all possible revenue sources for your network; the example shown here is just a suggestion. Though revenue sources may vary by district, be sure to include all possible sources in all sheets even if many will be zeroed out. Otherwise, the summary sheet will not aggregate the details correctly. However, because the summary sheet sums the final revenue totals on each district sheet, sloppiness will not lead to bad overall projections.
Use the customer monthly revenue calculator as a scratch sheet for the revenue rows in this model. The model assumes content costs will grow annually. Because content costs rise much faster than revenue, especially for video, the model includes an automatic inflation function for content. Warning: Revenue potential is high, but it grows slowly as customers sign on to the new system and to new specific services.
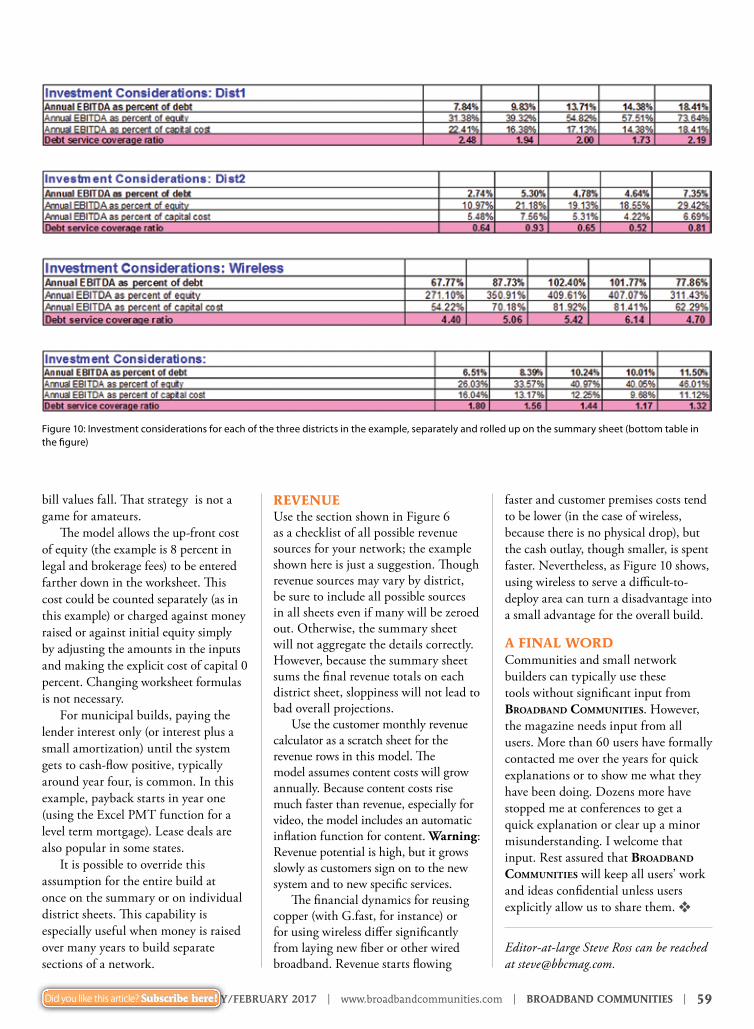
The financial dynamics for reusing copper (with G.fast, for instance) or for using wireless differ significantly from laying new fiber or other wired broadband. Revenue starts flowing
faster and customer premises costs tend to be lower (in the case of wireless, because there is no physical drop), but the cash outlay, though smaller, is spent faster. Nevertheless, as Figure 10 shows, using wireless to serve a difficult-to-deploy area can turn a disadvantage into a small advantage for the overall build.
A FINAL WORDCommunities and small network builders can typically use these tools without significant input from broadband Communities. However, the magazine needs input from all users. More than 60 users have formally contacted me over the years for quick explanations or to show me what they have been doing. Dozens more have stopped me at conferences to get a quick explanation or clear up a minor misunderstanding. I welcome that input. Rest assured that broadband Communities will keep all users’ work and ideas confidential unless users explicitly allow us to share them. v
Editor-at-large Steve Ross can be reached at [email protected].
Figure 10: Investment considerations for each of the three districts in the example, separately and rolled up on the summary sheet (bottom table in the figure)
Did you like this article? Subscribe here!Did you like this article? Subscribe here!