Embed Size (px)
DESCRIPTION
Fin Mkts
Citation preview
Financial Markets (Advanced) Module
NATIONAL STOCK EXCHANGE OF INDIA LIMITED
Sr.No. Name of Module Fees (Rs.)
TestDuration
(inminutes)
No. of Questions
MaximumMarks
PassMarks(%) Validity
1 Financial Markets: A Beginners’ Module * 1686 120 60 100 50 5
2 Mutual Funds : A Beginners' Module 1686 120 60 100 50 5
3 Currency Derivatives: A Beginner’s Module 1686 120 60 100 50 5
4 Equity Derivatives: A Beginner’s Module 1686 120 60 100 50 5
5 Interest Rate Derivatives: A Beginner’s Module 1686 120 60 100 50 5
6 Commercial Banking in India: A Beginner’s Module 1686 120 60 100 50 5
7 Securities Market (Basic) Module 1686 120 60 100 60 5
8 Capital Market (Dealers) Module * 1686 105 60 100 50 5
9 Derivatives Market (Dealers) Module * 1686 120 60 100 60 3
10 FIMMDA-NSE Debt Market (Basic) Module 1686 120 60 100 60 5
11 Investment Analysis and Portfolio Management Module 1686 120 60 100 60 5
12 Fundamental Analysis Module 1686 120 60 100 60 5
13 Financial Markets (Advanced) Module 1686 120 60 100 60 5
14 Securities Markets (Advanced) Module 1686 120 60 100 60 5
15 Mutual Funds (Advanced) Module 1686 120 60 100 60 5
16 Banking Sector Module 1686 120 60 100 60 5
17 Insurance Module 1686 120 60 100 60 5
18 Macroeconomics for Financial Markets Module 1686 120 60 100 60 5
19 NISM-Series-I: Currency Derivatives 1000 120 100 100 60 3
20NISM-Series-II-A: Registrars to an Issue and
1000 120 100 100 50 3
21NISM-Series-II-B: Registrars to an Issue and Share Transfer Agents – Mutual Fund 1000 120 100 100 50 3
22 NISM-Series-IV: Interest Rate Derivatives 1000 120 100 100 60 3
23 NISM-Series-V-A: Mutual Fund Distributors 1000 120 100 100 50 3
24 NISM-Series-VI: Depository Operations 1000 120 100 100 60 3
25 NISM Series VII: Securities Operations and 1000 120 100 100 50 3
26 4495 120 80 100 60 3
27 NSDL–Depository Operations Module 1686 75 60 100 60 # 5
28 Commodities Market Module 2022 120 60 100 50 3
29 1686 120 50 100 60 5
30 Corporate Governance Module 1686 90 100 100 60 5
31 1686 120 60 100 60 5
32 1686 120 60 100 60 5
33Information Security Auditors Module (Part-1) 2528 120 90 100 60
2Information Security Auditors Module (Part-2) 2528 120 90 100 60
34 Options Trading Strategies Module 1686 120 60 100 60 5
35 2247 per 120 75 140 60 NA
36 5618 240 30 100 50 NA
37 Equity Research Module ## 1686 120 65 100 55 2
38 Issue Management Module ## 1686 120 80 100 55 2
39 Market Risk Module ## 1686 120 50 100 55 2
40 Financial Modeling Module ### 1123 150 50 75 50 NA
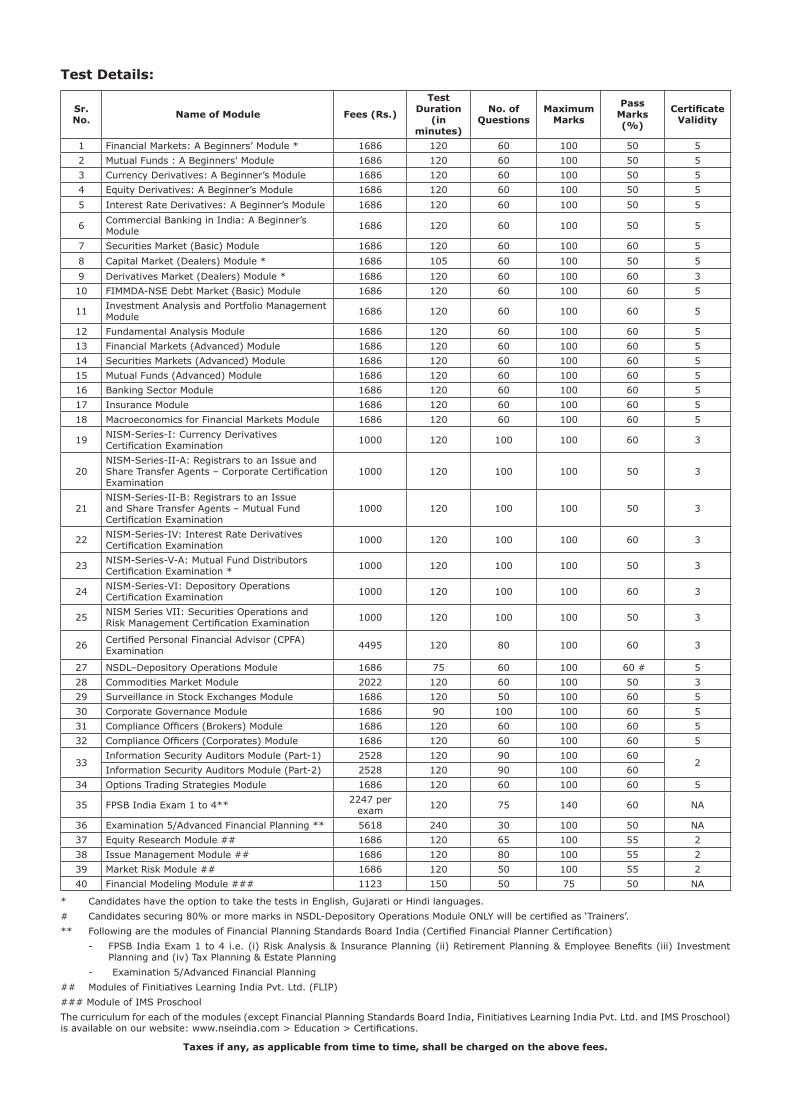
Test Details:
* Candidates have the option to take the tests in English, Gujarati or Hindi languages.
## Modules of Finitiatives Learning India Pvt. Ltd. (FLIP)
### Module of IMS Proschool
Taxes if any, as applicable from time to time, shall be charged on the above fees.
1
Contents
Acronyms ............................................................................................................... 5
Chapter 1 : Financial Markets, Products & Institutions...........................................7
1.1 Financial Markets ........................................................................................... 7
1.2 Financial Products and Market Entities............................................................... 8
1.3 Market Infrastructure Institutions ..................................................................... 9
1.4 ........................................................................................ 9
Chapter 2 : Quantitative Background to Debt .......................................................11
2.1 The Nature of Debt ....................................................................................... 11
2.2 The Price of a Debt Security........................................................................... 11
2.2.1 Perpetual Debt................................................................................ 11
2.2.2 Discount Instrument........................................................................ 12
2.2.3 Coupon Instrument ......................................................................... 15
2.3 Price-Yield Relationship of a Debt Security ....................................................... 17
2.4 ............................................................... 19
Chapter 3 : Debt – Investment Drivers & Approaches ..........................................21
3.1 Interest Risk................................................................................................ 21
3.1.1 Forward Rates ................................................................................ 21
3.1.2 Yield Curve Estimation ..................................................................... 22
3.1.3 Shape of Yield Curve ....................................................................... 24
3.1.4 Debt Portfolio Structures .................................................................. 25
3.2 ............................................................................ 27
3.2.1 Assessment of Sovereign Debt Servicing Ability................................... 27
3.2.2 Assessment of Private Debt Servicing Ability ....................................... 28
3.2.3 Credit Rating .................................................................................. 35
3.2.4 Structured Obligations ..................................................................... 36
3.2.5 Yield Spread & Changes in Credit Risk................................................ 36
2
Chapter 4 : Financial Statements: Analysis & Projections for Equity.....................37
4.1 Financial Statement Analysis.......................................................................... 37
4.1.1 Revenue, Cost & Margin Structure ..................................................... 37
4.1.2 ............................................................................. 37
4.1.3 Dividend Yield................................................................................. 39
4.1.4 Price – Earnings Ratio ...................................................................... 39
4.2 Financial Projections ..................................................................................... 40
Chapter 5 : Equity – Valuation & Investment Decisions (Part 1) ..........................43
5.1 Required Rate of Return on Equity .................................................................. 43
5.2 Weighted Average Cost of Capital (WACC) ....................................................... 45
5.3 Fundamental Valuation Approaches................................................................. 46
5.3.1 Dividend Discounting ....................................................................... 46
5.3.2 Free Cash Flow ............................................................................... 48
5.3.3 Enterprise Value ............................................................................. 52
5.3.4 Earnings Multiple ............................................................................ 52
5.3.5 Price to Book Value Multiple.............................................................. 53
5.4 Margin of Safety........................................................................................... 54
Chapter 6 : Equity – Valuation & Investment Decisions (Part 2) ..........................55
6.1 ......................................................................... 55
6.1.1 Economy Analysis ........................................................................... 55
6.1.2 Industry Analysis ............................................................................ 56
6.2 Top-Down or Bottom-up?............................................................................... 58
6.3 Technical Analysis......................................................................................... 59
Chapter 7 : Derivatives.........................................................................................61
7.1 Background ................................................................................................. 61
7.2 Interest Rate Futures .................................................................................... 65
7.3 Credit Default Swaps (CDS) ........................................................................... 70
7.4 Currency Futures.......................................................................................... 76
7.5 Currency Options ......................................................................................... 79
7.6 Options ............................................................................... 81
3
Chapter 8 : Alternate Assets & Structured Products .............................................86
8.1 Alternate Assets ........................................................................................... 86
8.1.1 Gold .............................................................................................. 86
8.1.2 Real Estate..................................................................................... 87
8.2 Structured Products...................................................................................... 87
8.2.1 Portfolio Insurance .......................................................................... 88
8.2.2 Risks ............................................................................................. 88
8.2.3 SEBI Regulations ............................................................................ 89
Chapter 9 : International Markets ........................................................................91
9.1 Depository Receipts ...................................................................................... 91
9.2 International Stock Indices ............................................................................ 92
9.3 Feeder Funds............................................................................................... 93
9.4 Trading in Global Markets through NSE............................................................ 94
9.4.1 Futures & Options ........................................................................... 94
9.4.2 Exchange Traded Funds (ETFs) ......................................................... 96
Chapter 10 : New Paradigms in Regulation of Financial Markets ..........................98
10.1 Market Infrastructure Institutions ................................................................... 98
10.2 Alternate Investment Funds..........................................................................101
10.3 ...........................................103
10.4 Investment Advisors ....................................................................................104
10.5 Commission on Public Issues of Debt .............................................................111
10.6 Merchant Bankers’ Track Record ....................................................................111
10.7 Algorithmic Trading......................................................................................111
10.8 Outsourcing by Intermediaries ......................................................................112
10.9 .................................................................113
10.10 KYC Registration Agency (KRA) .....................................................................120
References ...........................................................................................................127
4
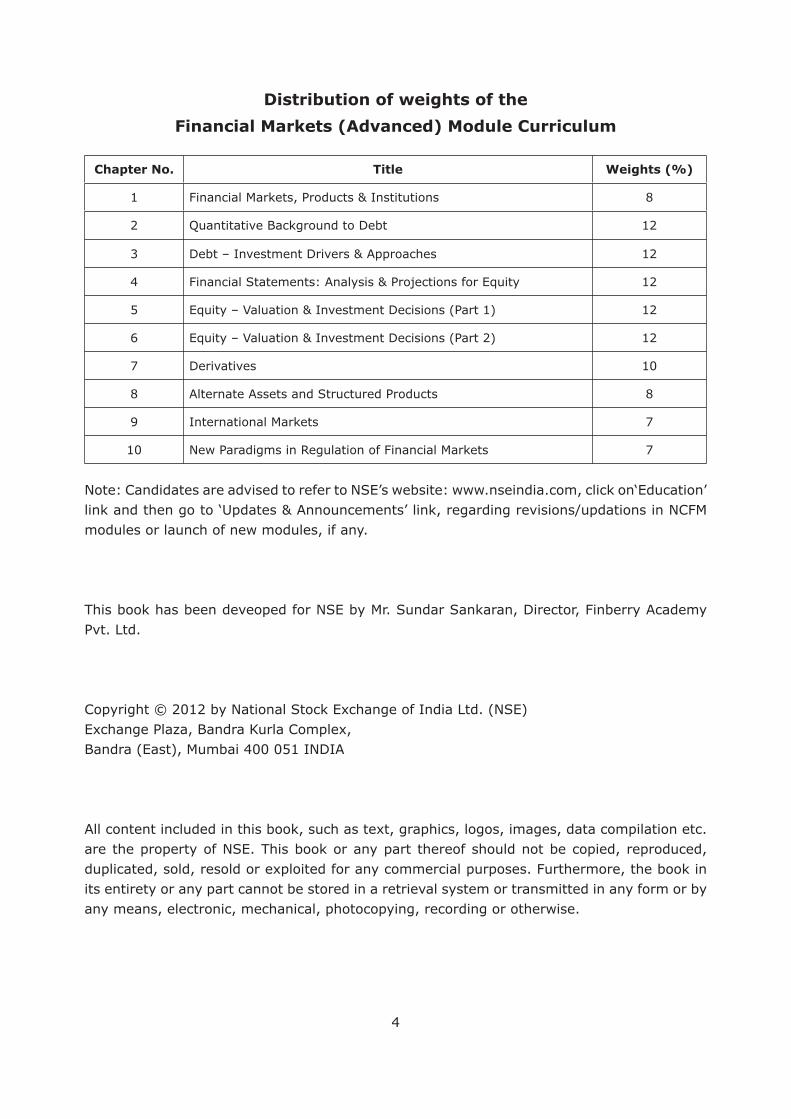
Distribution of weights of the
Financial Markets (Advanced) Module Curriculum
Chapter No. Title Weights (%)
1 8
2 Quantitative Background to Debt 12
3 12
4 12
5 12
6 12
7 Derivatives 10
8 Alternate Assets and Structured Products 8
9 International Markets 7
10 New Paradigms in Regulation of Financial Markets 7
modules or launch of new modules, if any.
This book has been deveoped for NSE by Mr. Sundar Sankaran, Director, Finberry Academy Pvt. Ltd.
Bandra (East), Mumbai 400 051 INDIA
are the property of NSE. This book or any part thereof should not be copied, reproduced,
its entirety or any part cannot be stored in a retrieval system or transmitted in any form or by any means, electronic, mechanical, photocopying, recording or otherwise.
5
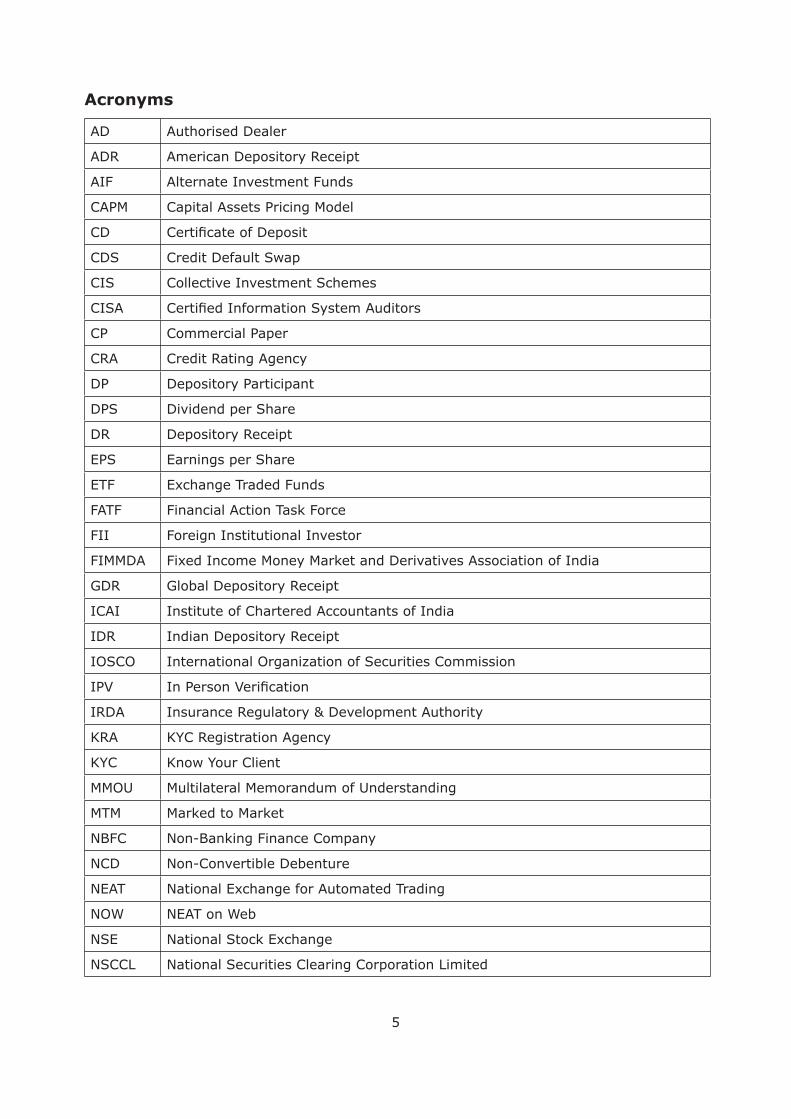
Acronyms
AD Authorised Dealer
ADR American Depository Receipt
AIF Alternate Investment Funds
CAPM Capital Assets Pricing Model
CD
CDS Credit Default Swap
CIS Collective Investment Schemes
CISA
CP Commercial Paper
CRA Credit Rating Agency
DP Depository Participant
DPS Dividend per Share
DR Depository Receipt
EPS Earnings per Share
ETF
FATF Financial Action Task Force
FII Foreign Institutional Investor
FIMMDA
GDR Global Depository Receipt
ICAI Institute of Chartered Accountants of India
IDR Indian Depository Receipt
IOSCO
IPV
IRDA
KRA KYC Registration Agency
KYC Know Your Client
MTM Marked to Market
NBFC Non-Banking Finance Company
NCD Non-Convertible Debenture
NEAT
NOW NEAT on Web
NSE
NSCCL National Securities Clearing Corporation Limited
6
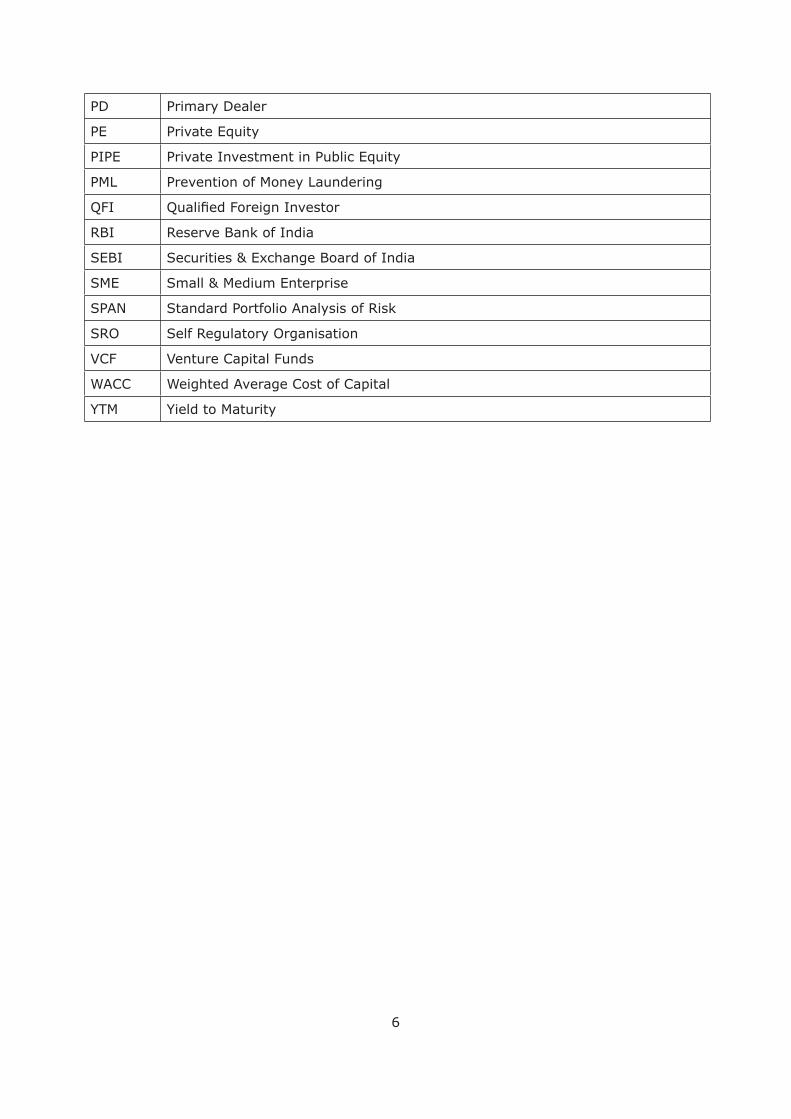
PD Primary Dealer
PE Private Equity
PIPE Private Investment in Public Equity
PML Prevention of Money Laundering
QFI
RBI Reserve Bank of India
SEBI
SME
SPAN Standard Portfolio Analysis of Risk
SRO Self Regulatory Organisation
VCF Venture Capital Funds
WACC Weighted Average Cost of Capital
YTM Yield to Maturity
7
Chapter 1 : Financial Markets, Products & Institutions
1.1 Financial Markets
Financial markets are an important constituent of any economy. They include money
the market for equity and long term debt funds for more than a year.
Financial markets meet various needs of different entities:
o Government
Financial markets help governments meet their borrowing requirements.
Financial markets can force companies to operate under transparent corporate
governance standards.
o Issuing companies
Financial markets make it possible for companies to mobilise money for the
projects they want to implement.
The yield curve in the debt market sets the tone for the borrowing cost of issuing
companies.
The markets give companies a benchmark for their valuation and top management
to assess their performance.
employees
businesses without having to pay from the bank account.
investors, customers, government and general public.
o Investors
companies.
Price discovery in the markets provide messages to investors on where various
companies stand.
Markets provide a platform for investors to punish poor management.
8
o Economy
Financial markets are a barometer of the economy.
Financial markets help in channelling resources from those who have them to
those who need them.
of the economy.
1.2 Financial Products and Market Entities
Governments issue treasury bills and government securities in the debt market. They
also offer shares of public sector undertakings in the equity market.
Financial products issued by companies include equity shares, preference shares,
deposit etc.
Companies can either mobilise moneys from retail investors through a public issue,
or target institutional investors through a private placement. Venture Capital Funds,
Private Equity Funds, Foreign Institutional investors and high net worth individuals are
leading investors in the private placement market.
Investment bankers help companies to mobilise the resources from investors. They also
help businesses acquire other businesses and re-structure themselves.
Broking houses have research teams that cover different sectors and companies.
Their research reports are an important source of information about companies for
investors.
Credit rating agencies rate the debt instruments issued to the public. They also provide
a rating for public issues of equity.
other funds. Brokers, distributers and investment advisers are in touch with investors
The registrar and transfer agent maintains records of investors in companies.
Financial products issued by governments and companies in the primary market are
traded in the secondary market. An active and liquid secondary market is important for
investors to be interested in the primary market.
Futures and options are popular derivative instruments. A convertible debenture, where
the conversion is not compulsory, is like a debenture with an attached option. The
9
markets.
1.3 Market Infrastructure Institutions
The depositories make it possible for the market to trade securities in dematerialised
form. The elimination of physical securities has made it possible for large volumes of
Depositories appoint Depository Participants (DPs) to enable investors to dematerialise
securities Market Infrastructure Institutions (MIIs).
assess for many investors. This can lead to gullible investors investing in products
they should not invest in.
o Broking companies come out with research reports on companies. Issue of capital
by a company may be managed by an investment bank that is part of the same
group as the broking company. In such a situation, the independence of the research
report can get compromised by a desire to help the investment bank make a success
of the issue.
o Asset management companies earn fees that are linked to assets under management.
bullish view of the market and holding back bearish views. This can hurt the interest
of investors who take investment decisions based on biased information.
o Credit rating companies issue ratings to protect investors. However, they earn
can affect the objectivity of the rating.

10
o Investment advisers position themselves as protecters of investor interest. But they
or insurance company). The manufacturer’s commission can incentivise the adviser
to suggest a product to investors for whom it is not suitable.
The securities market regulater, SEBI has introduced various regulations to ensure
transparency and protect investors’ interests.
regulations. The emerging paradigm of regulation is detailed in Chapter 10.
11
Chapter 2 : Quantitative Background to Debt
2.1 The Nature of Debt
The most important promise underlying debt is its servicing. The servicing may be at
debt may or may not be repayable. When it is repayable, it would have a maturity date.
Perpetual debt is not repayable, though it would need to be serviced (through interest
payments).
Thus, normal debt is serviced through three kinds of payments –
may be at a discount).
Perpetual debt is serviced through interest payments only.
How much is likely to be receivable on a debt instrument, and the timing of those cash
2.2 The Price of a Debt Security
2.2.1 Perpetual Debt
Suppose an investor invested Rs. 10,000 with the Government of India on the basis
that interest at 6% p.a. would be receivable on the principal amount forever. Being a
perpetual instrument, the principal is not repayable. What should be its value today?
annuity that is receivable every year. So long as the economic conditions remain stable,
P = A ÷ y
Where,
12
Thus, the price would be Rs. 600 ÷ 6% i.e. Rs. 10,000.
What if the Government were to come out with another perpetual instrument, which
promises interest at 6.25% p.a.?
investing a lesser amount. The intrinsic worth of the earlier debt security is therefore
only this lesser amount. What would that amount be? It is given by the same formula:
P = A ÷ y
instrument would be Rs. 600 ÷ 6.25% i.e. Rs. 9,600.
would increase.
2.2.2 Discount Instrument
A discount instrument is one that does not yield any regular interest. Amount invested
by the investor would however be lower than the redemption amount on maturity i.e.
the investor invests at a discount, which effectively represents interest.
Suppose the Government issued a debt security for Rs. 7,472.58 that will mature at a
value of Rs. 10,000 in 5 years. During these 5 years, the investor will not receive any
interest.
Any investor would like to know what return this represents. The investor will gain
Rs. 10,000 minus Rs. 7,472.58 i.e. Rs. 2,527.42 in 5 years. The gain is Rs. 2,527.42 ÷
Rs. 7,472.58 i.e. 33.82% of the amount invested. Since this is the return over 5 years,
the annual return amounts to 33.82% ÷ 5 i.e. 6.76%.
13
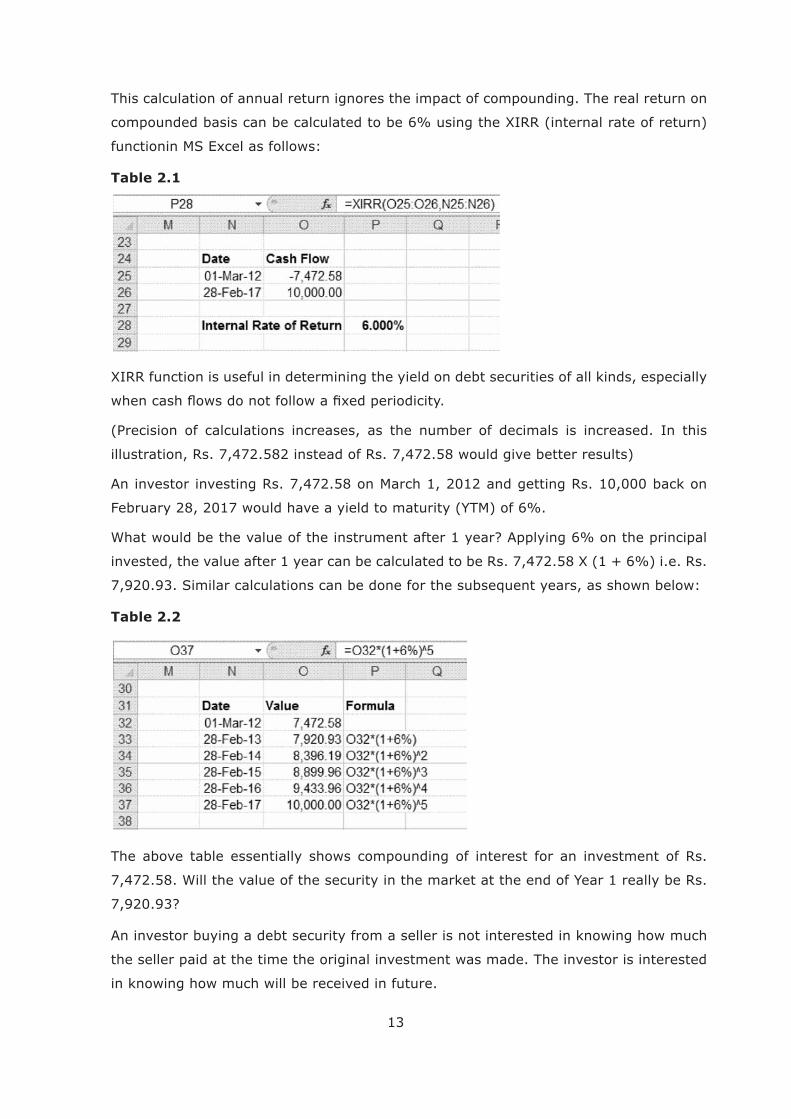
This calculation of annual return ignores the impact of compounding. The real return on
Table 2.1
(Precision of calculations increases, as the number of decimals is increased. In this
illustration, Rs. 7,472.582 instead of Rs. 7,472.58 would give better results)
An investor investing Rs. 7,472.58 on March 1, 2012 and getting Rs. 10,000 back on
February 28, 2017 would have a yield to maturity (YTM) of 6%.
What would be the value of the instrument after 1 year? Applying 6% on the principal
7,920.93. Similar calculations can be done for the subsequent years, as shown below:
Table 2.2
The above table essentially shows compounding of interest for an investment of Rs.
7,472.58. Will the value of the security in the market at the end of Year 1 really be Rs.
7,920.93?
An investor buying a debt security from a seller is not interested in knowing how much
the seller paid at the time the original investment was made. The investor is interested
in knowing how much will be received in future.
14
At the end of 1 year, the instrument has a balance tenor of 4 years, at the end of which
Rs. 10,000 is receivable on the instrument. The investor will be prepared to purchase
the instrument at the present value of Rs. 10,000 to be received 4 years down the line.
This present value is calculated with the following discounting formula:
n
Where,
4 i.e.
Rs. 7,920.93.
Thus, the value calculated by compounding for the elapsed tenor of 1 year, is the same
as the value calculated by discounting for the balance tenor of 4 years. This is because
the yield was held at 6%.
yield of 5.75% for the balance tenor of 4 years. In that case, the price can be calculated 4
pushed up the value of the debt security.
In that case, what would have been the return for the original buyer in 1 year? It can be
calculated as (Rs. 7,996.11 minus Rs. 7,472.58) ÷ Rs. 7,472.58 i.e. 7.01%.
Although the original buyer invested on the basis of a 6% return, the decline in yield
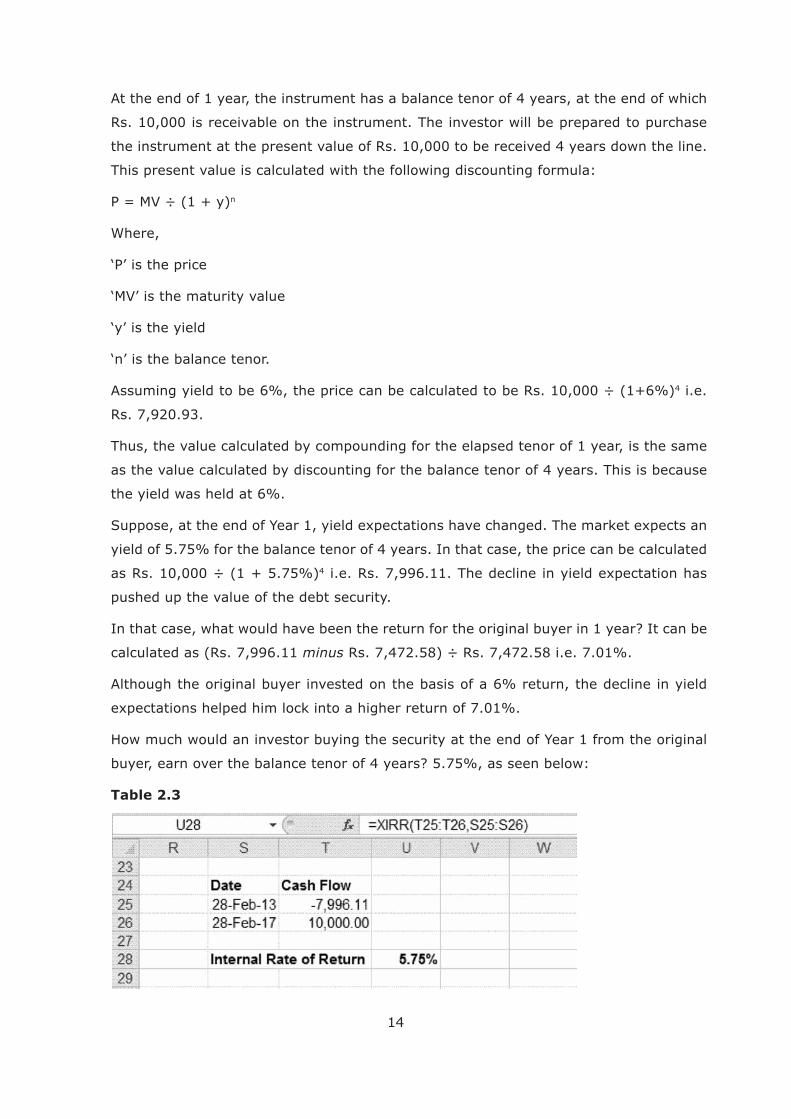
How much would an investor buying the security at the end of Year 1 from the original
buyer, earn over the balance tenor of 4 years? 5.75%, as seen below:
Table 2.3
15
Treasury Bills are short term debt instruments (less than 1 year to maturity) issued
at a discount. These are issued through the Reserve Bank of India for 91 days, 182
days and 364 days maturities. Being short term instruments, there is no question of
compounding.
Suppose a 91-day T-Bill with 7 days to maturity is available at Rs. 99.9589. Two concepts
of returns need to be understood here:
The gain on maturity will be (Rs. 100 – Rs. 99.9589) i.e. Rs. 0.0411.
The gain is over 7 days on an investment of Rs. 99.9589. The annualised return
therefore can be calculated as
i.e. 2.14%.
Discount yield is calculated taking the base as the maturity value (instead of the
initial value in the case of YTM). Further, the year is taken as 360 days instead of
365 days. Accordingly, the discount yield is calculated as
i.e. 2.11%.
The application of the concept can be seen in Chapter 7.
2.2.3 Coupon Instrument
A normal coupon bearing instrument can be viewed as an instrument giving a series
price of a debt security in the market today, is the sum of the present values of each
For this calculation, the discounting formula used earlier can be tweaked to read as
follows:
n
Where,
16
Suppose a debt security of face value Rs. 10,000 offered coupon of 7% p.a., payable
semi-annually, for 2 years. What would be its price after 6 months, assuming the yield
After 6 months, the debt security has 3 more periods of 6 months each to go. Of this,
payment for the last period would include interest of Rs. 350 and principal repayment of
Rs. 10,000.
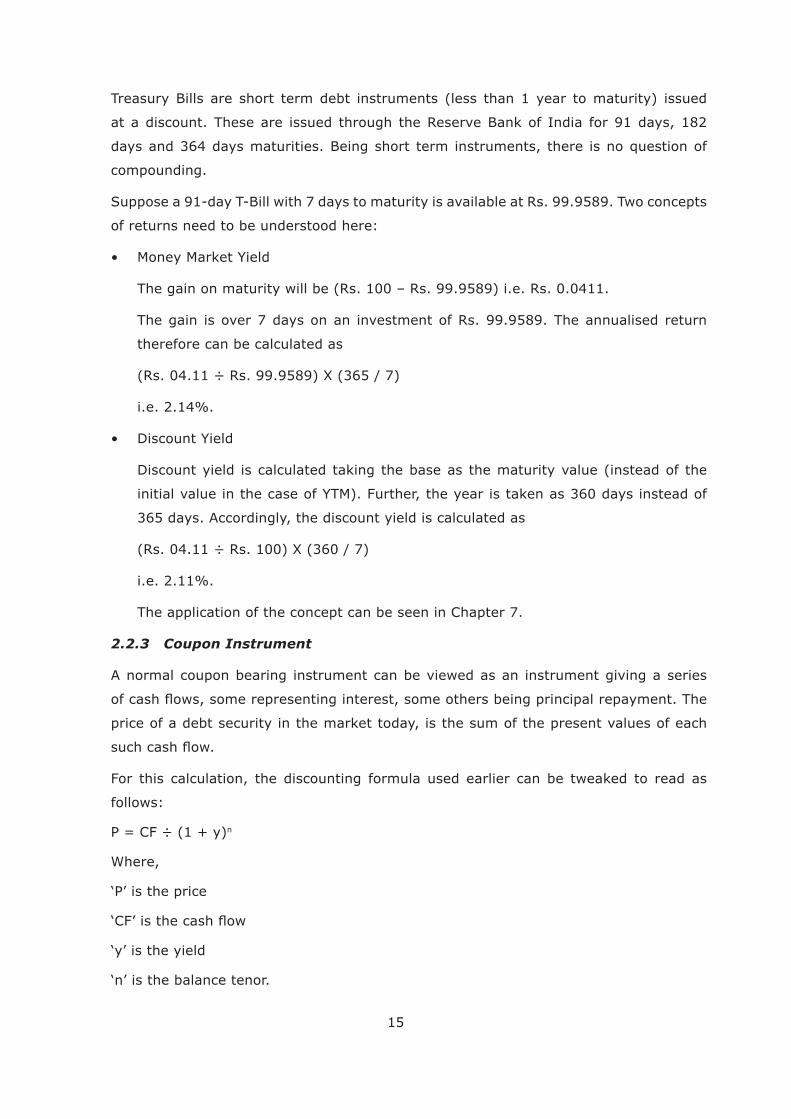
The calculation of price is shown below:
Table 2.4
The increase in yield from 7% to 7.20% has pushed down the price of the security to
Rs. 9,972.04.
frequency)
Where,
date
17
quarterly = 4.
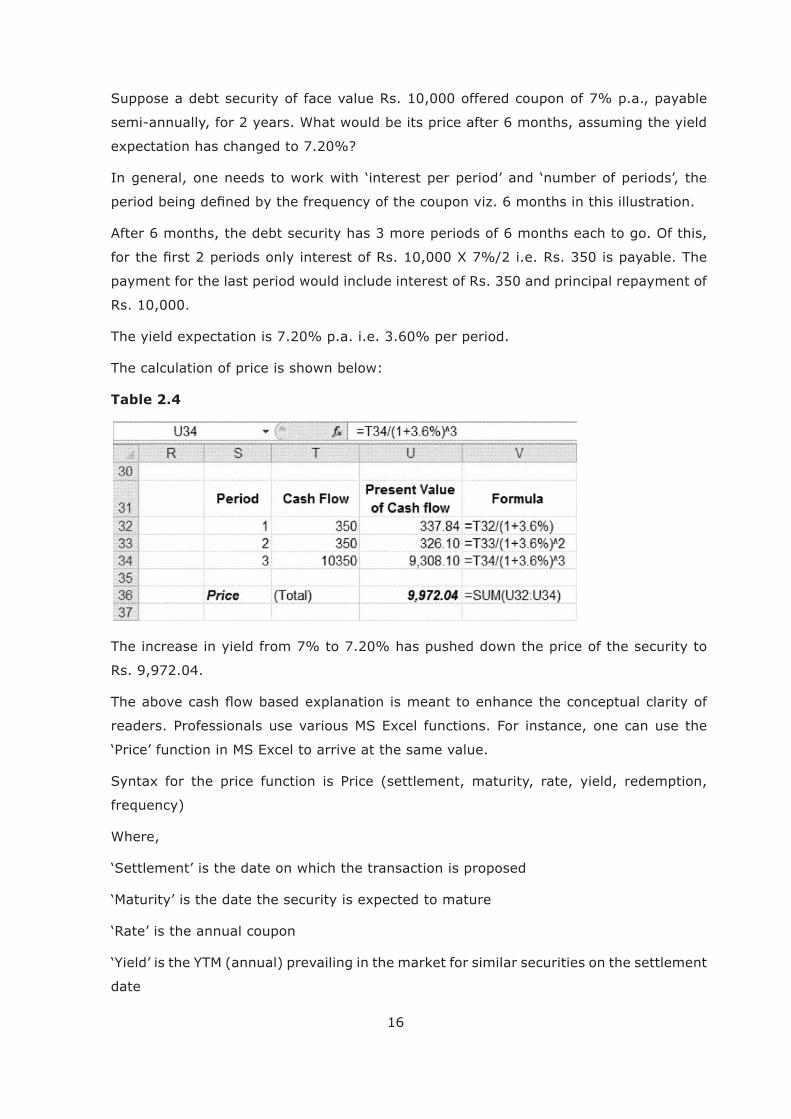
Applying the function, price can be calculated as follows:
Table 2.5
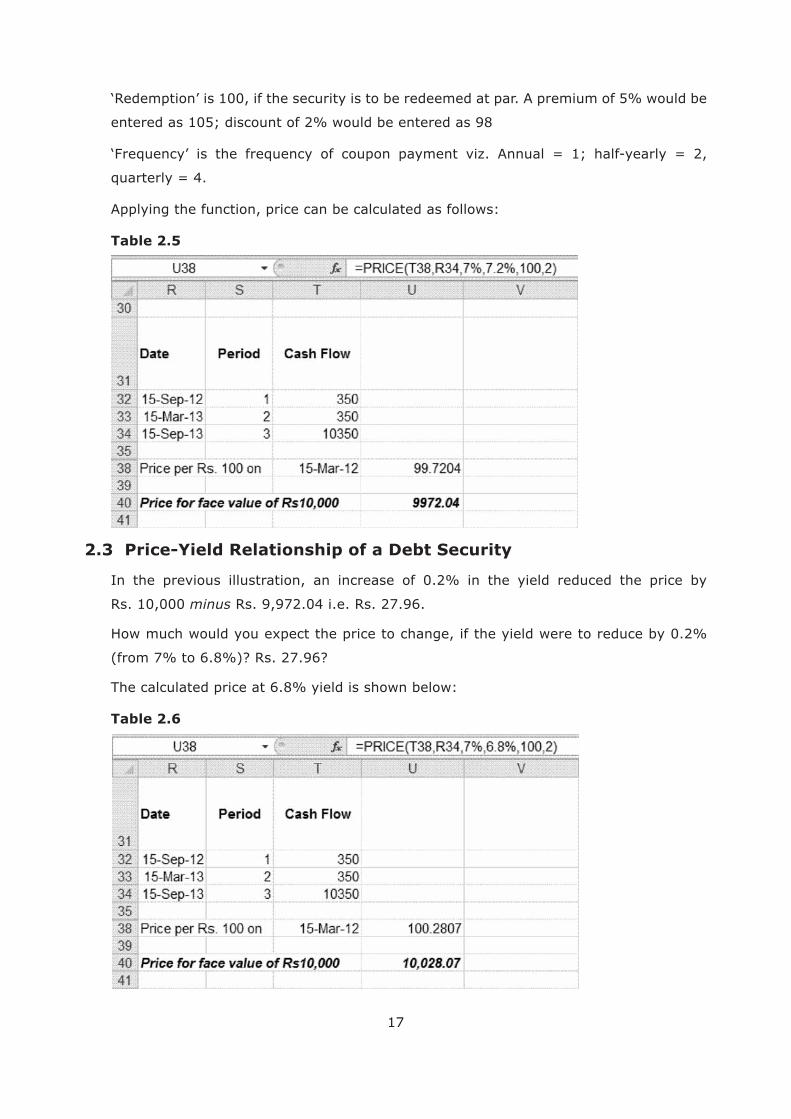
2.3 Price-Yield Relationship of a Debt Security
In the previous illustration, an increase of 0.2% in the yield reduced the price by
Rs. 10,000 minus Rs. 9,972.04 i.e. Rs. 27.96.
(from 7% to 6.8%)? Rs. 27.96?
The calculated price at 6.8% yield is shown below:
Table 2.6
18
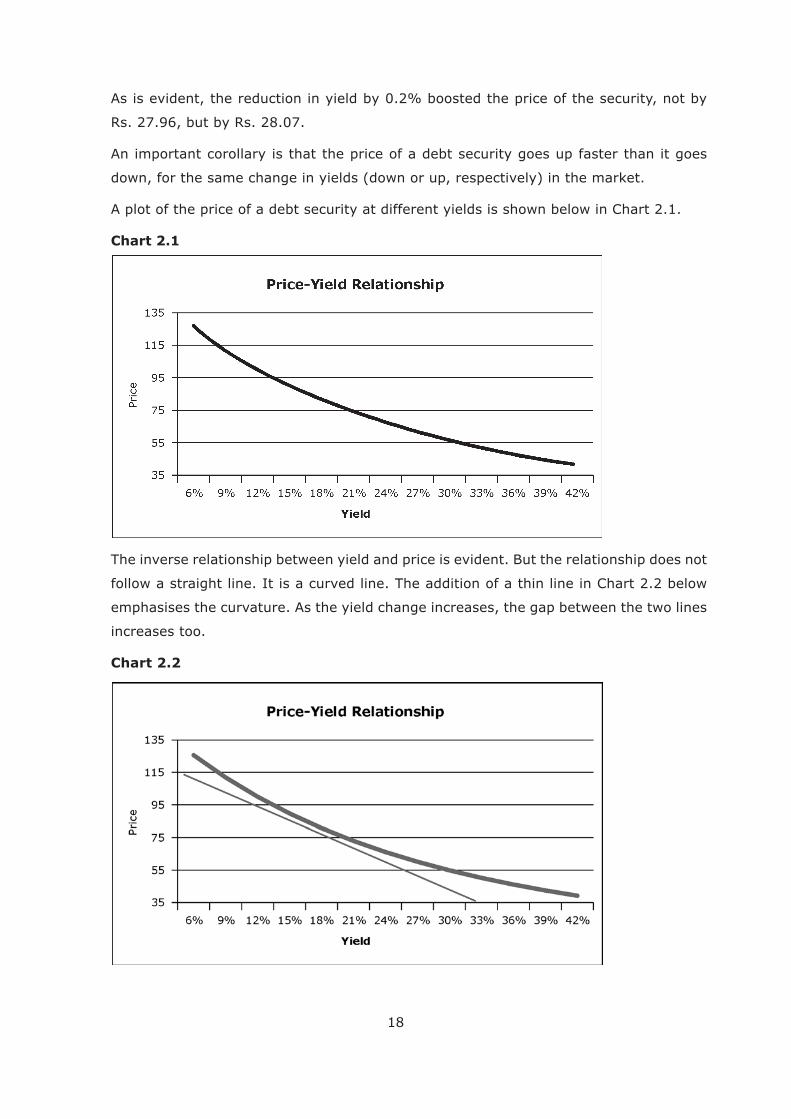
As is evident, the reduction in yield by 0.2% boosted the price of the security, not by
Rs. 27.96, but by Rs. 28.07.
An important corollary is that the price of a debt security goes up faster than it goes
down, for the same change in yields (down or up, respectively) in the market.
A plot of the price of a debt security at different yields is shown below in Chart 2.1.
Chart 2.1
The inverse relationship between yield and price is evident. But the relationship does not
follow a straight line. It is a curved line. The addition of a thin line in Chart 2.2 below
emphasises the curvature. As the yield change increases, the gap between the two lines
increases too.
Chart 2.2
19
this would be clear from the discussion on duration that follows.
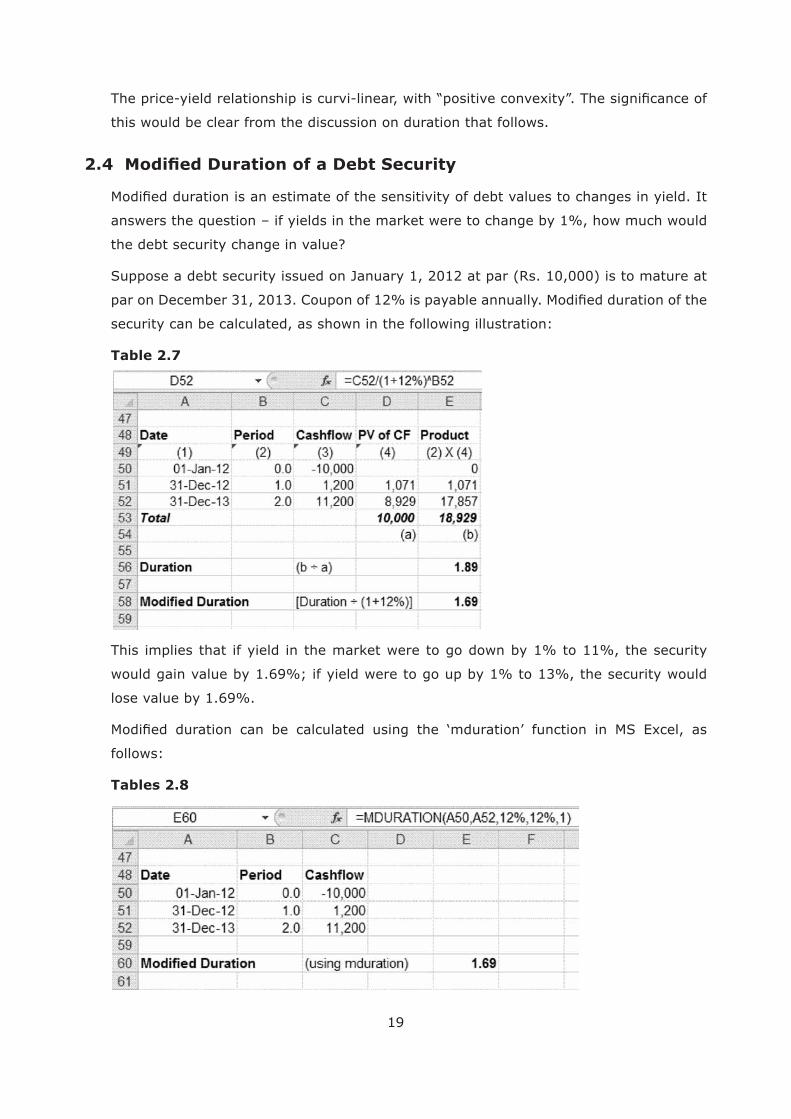
2.4
answers the question – if yields in the market were to change by 1%, how much would
the debt security change in value?
Suppose a debt security issued on January 1, 2012 at par (Rs. 10,000) is to mature at
security can be calculated, as shown in the following illustration:
Table 2.7
This implies that if yield in the market were to go down by 1% to 11%, the security
lose value by 1.69%.
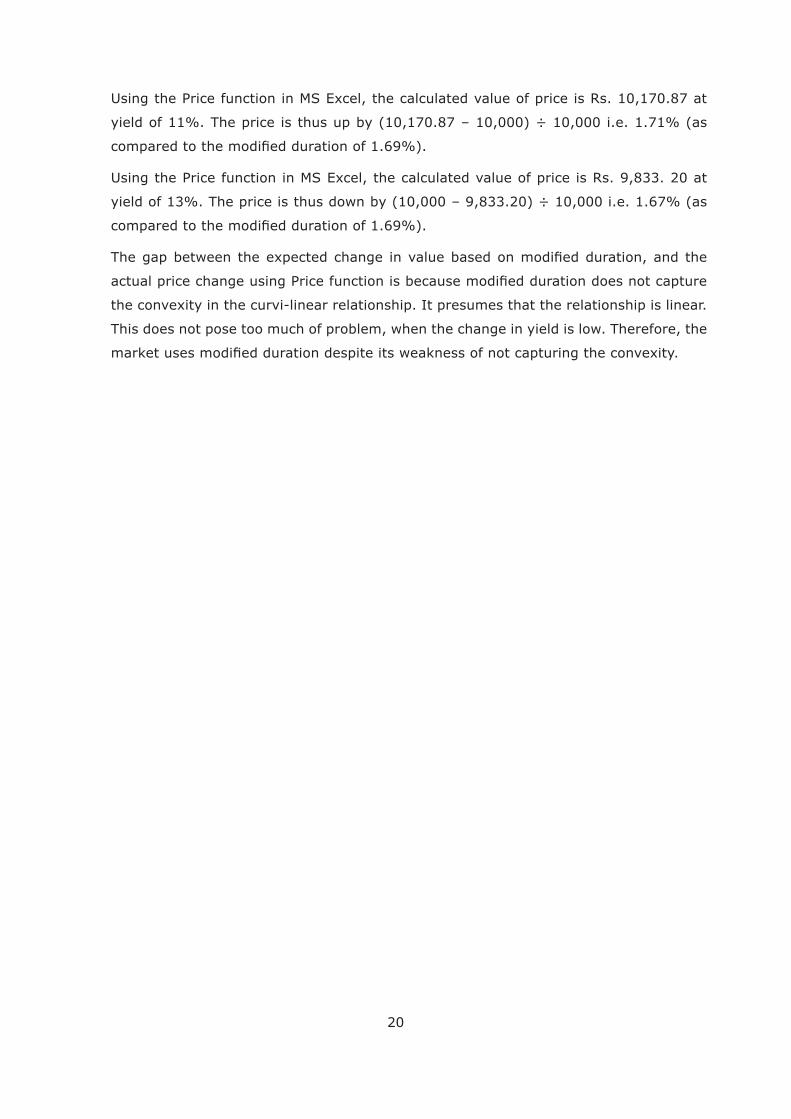
follows:
Tables 2.8
20
yield of 11%. The price is thus up by (10,170.87 – 10,000) ÷ 10,000 i.e. 1.71% (as
yield of 13%. The price is thus down by (10,000 – 9,833.20) ÷ 10,000 i.e. 1.67% (as
This does not pose too much of problem, when the change in yield is low. Therefore, the
21
Chapter 3 : Debt – Investment Drivers & Approaches
3.1 Interest Risk
The measurement of impact of changes in interest rates on the value of debt securities
was discussed in the previous chapter. An understanding of forward rates and yield
curves is important to appreciate interest risk dynamics.
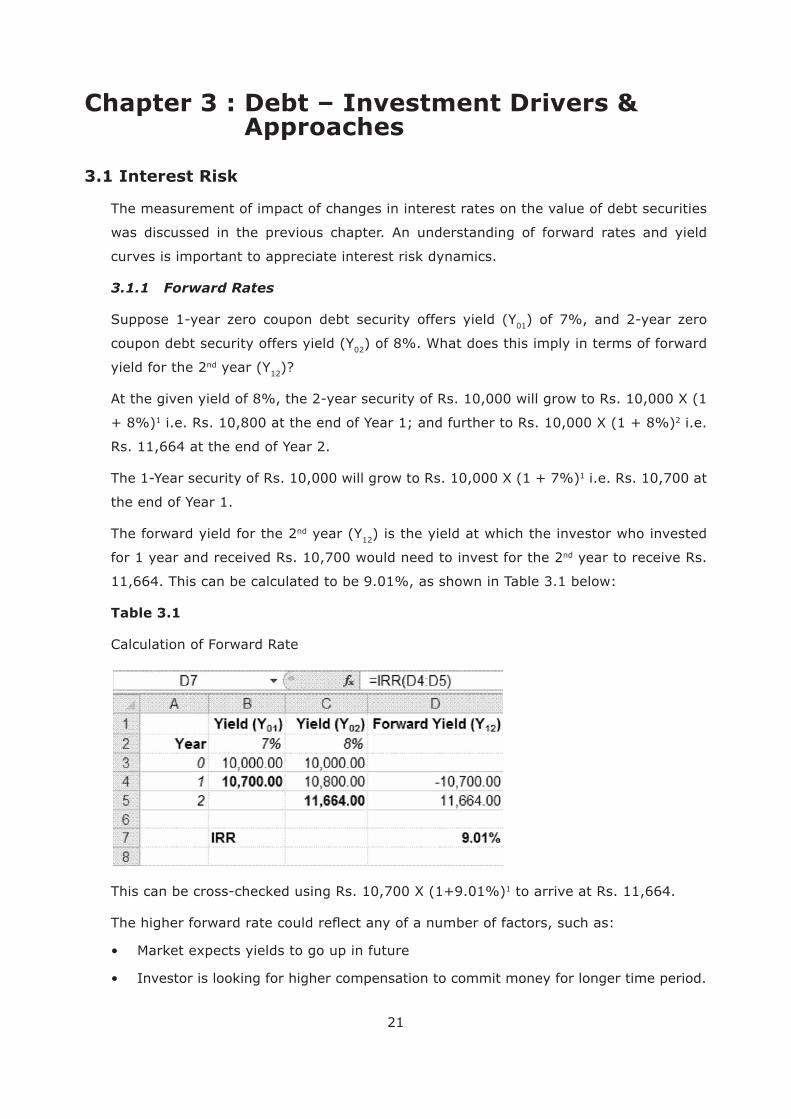
3.1.1 Forward Rates
01
coupon debt security offers yield (Y02) of 8%. What does this imply in terms of forward
yield for the 2nd year (Y12)?
1 2 i.e.
Rs. 11,664 at the end of Year 2.
1 i.e. Rs. 10,700 at
the end of Year 1.
The forward yield for the 2nd year (Y12) is the yield at which the investor who invested
for 1 year and received Rs. 10,700 would need to invest for the 2nd year to receive Rs.
11,664. This can be calculated to be 9.01%, as shown in Table 3.1 below:
Table 3.1
Calculation of Forward Rate
1 to arrive at Rs. 11,664.
22
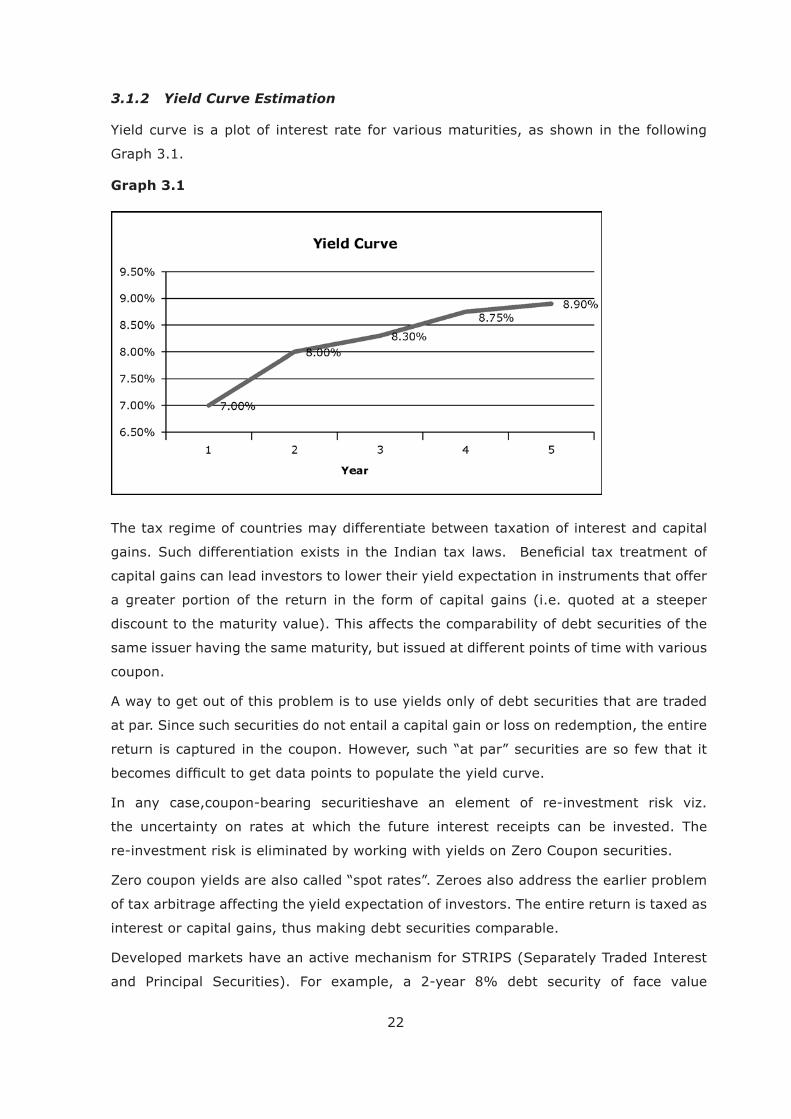
3.1.2 Yield Curve Estimation
Yield curve is a plot of interest rate for various maturities, as shown in the following
Graph 3.1.
Graph 3.1
a greater portion of the return in the form of capital gains (i.e. quoted at a steeper
discount to the maturity value). This affects the comparability of debt securities of the
same issuer having the same maturity, but issued at different points of time with various
coupon.
A way to get out of this problem is to use yields only of debt securities that are traded
at par. Since such securities do not entail a capital gain or loss on redemption, the entire
the uncertainty on rates at which the future interest receipts can be invested. The
re-investment risk is eliminated by working with yields on Zero Coupon securities.
interest or capital gains, thus making debt securities comparable.
Developed markets have an active mechanism for STRIPS (Separately Traded Interest
23
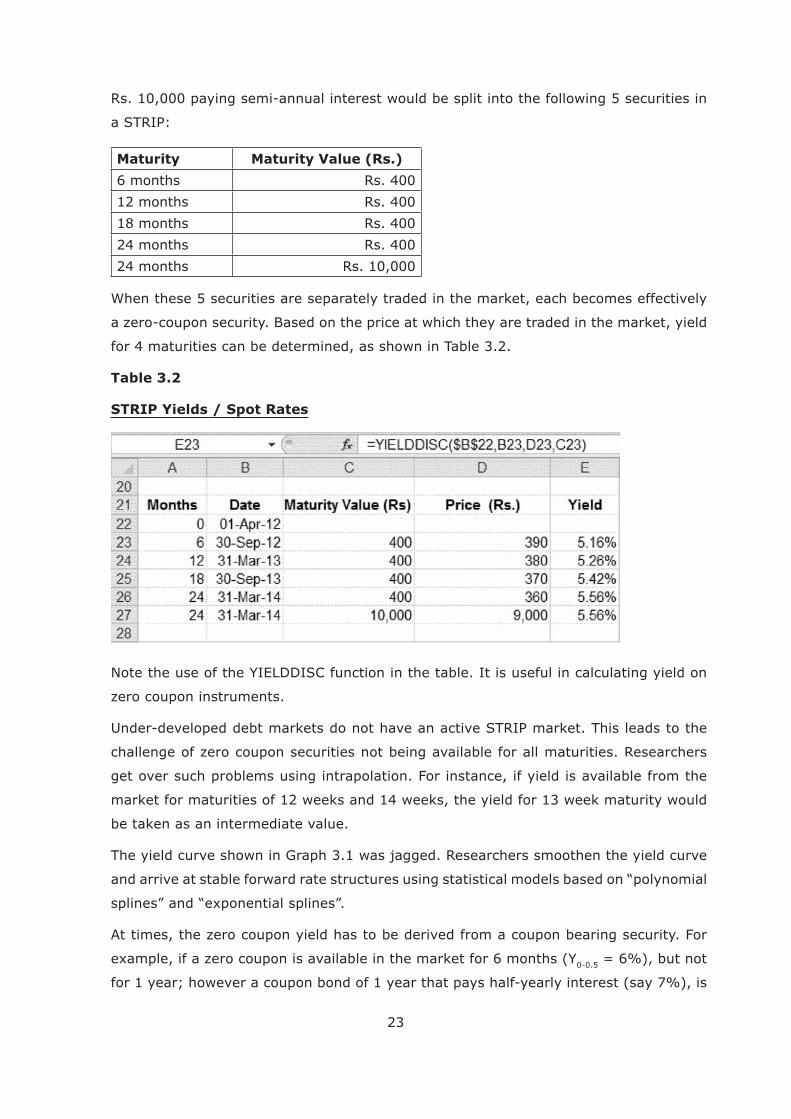
Rs. 10,000 paying semi-annual interest would be split into the following 5 securities in
a STRIP:
Maturity Maturity Value (Rs.)
6 months Rs. 400
12 months Rs. 400
18 months Rs. 400
24 months Rs. 400
24 months Rs. 10,000
When these 5 securities are separately traded in the market, each becomes effectively
for 4 maturities can be determined, as shown in Table 3.2.
Table 3.2
STRIP Yields / Spot Rates
Note the use of the YIELDDISC function in the table. It is useful in calculating yield on
get over such problems using intrapolation. For instance, if yield is available from the
market for maturities of 12 weeks and 14 weeks, the yield for 13 week maturity would
be taken as an intermediate value.
The yield curve shown in Graph 3.1 was jagged. Researchers smoothen the yield curve
and arrive at stable forward rate structures using statistical models based on “polynomial
0-0.5 = 6%), but not
24
01 can be determined by solving the
following price equation of the 1 year coupon-paying bond:
101)
2
A liquid debt market is an important pre-requisite for credible yield curves. Generally,
the market for sovereign debt is the most liquid in any country. Therefore, the yield
3.1.3 Shape of Yield Curve
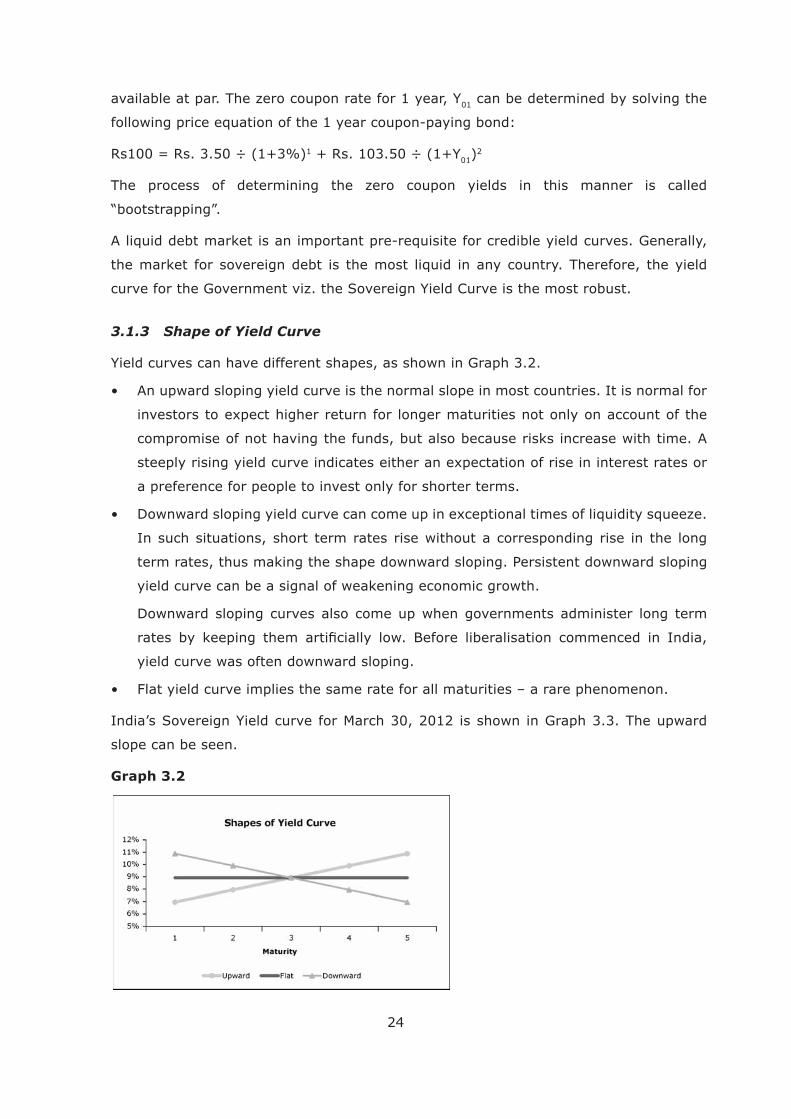
Yield curves can have different shapes, as shown in Graph 3.2.
compromise of not having the funds, but also because risks increase with time. A
a preference for people to invest only for shorter terms.
In such situations, short term rates rise without a corresponding rise in the long
term rates, thus making the shape downward sloping. Persistent downward sloping
yield curve can be a signal of weakening economic growth.
Downward sloping curves also come up when governments administer long term
yield curve was often downward sloping.
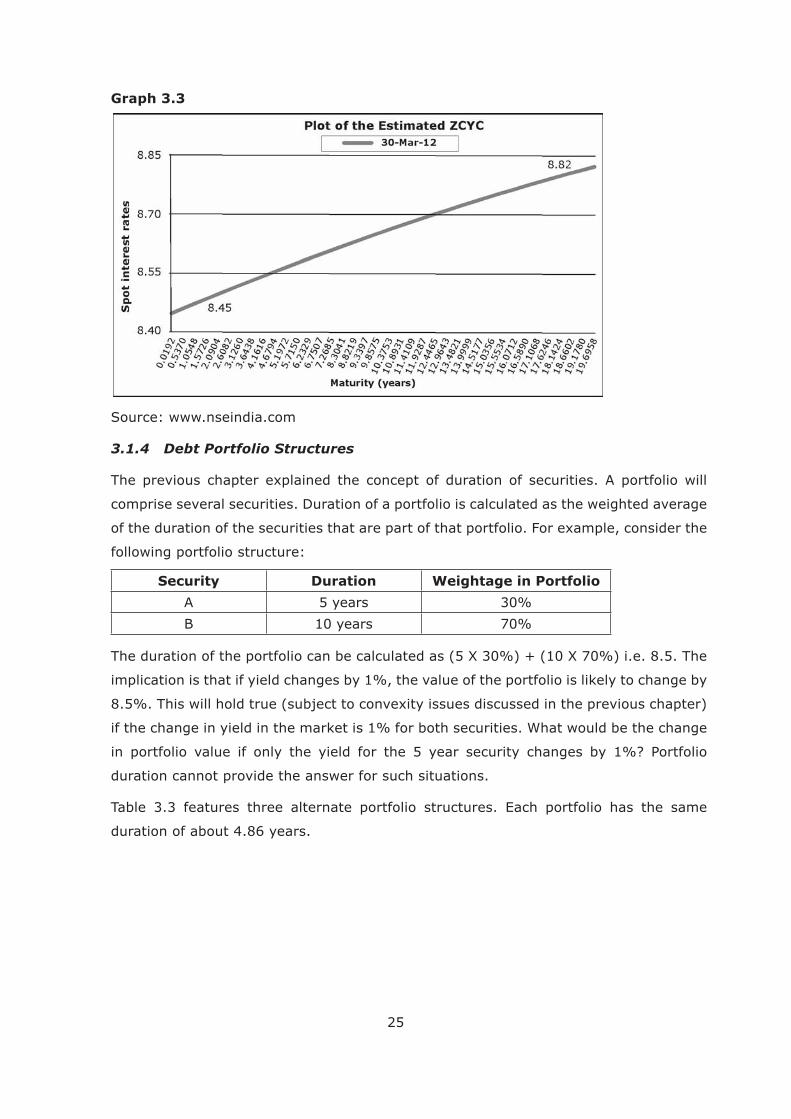
India’s Sovereign Yield curve for March 30, 2012 is shown in Graph 3.3. The upward
slope can be seen.
Graph 3.2
25
Graph 3.3
Source: www.nseindia.com
3.1.4 Debt Portfolio Structures
comprise several securities. Duration of a portfolio is calculated as the weighted average
following portfolio structure:
Security Duration Weightage in Portfolio
A 5 years 30%
B 10 years 70%
implication is that if yield changes by 1%, the value of the portfolio is likely to change by
if the change in yield in the market is 1% for both securities. What would be the change
in portfolio value if only the yield for the 5 year security changes by 1%? Portfolio
duration cannot provide the answer for such situations.
Table 3.3 features three alternate portfolio structures. Each portfolio has the same
duration of about 4.86 years.
26
Table 3.3
Alternate Portfolio Structures of Same Duration
Theoretically, each of the portfolios will change by 4.85% if yields in the market change
by 1% across all the maturities i.e. the yield curve takes a parallel shift. [Technically, the
In reality, yield changes may be different for various maturities i.e. the yield curve may
shift with a change in slope (not a parallel shift). Every instance of duration in the table
can be multiplied by its weightage in the portfolio, in order to assess the impact on the
portfolio arising out of a change of 1% in the security of that duration. The total of this
product column will give the Portfolio Duration (Table 3.4).
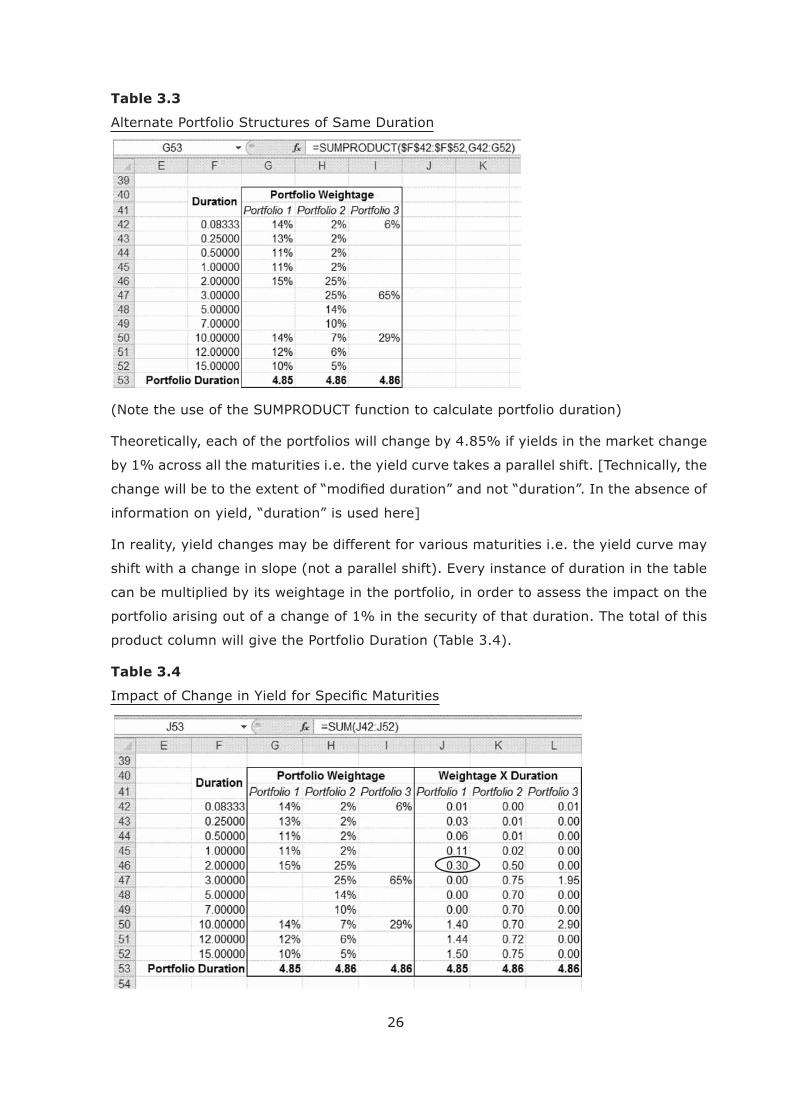
Table 3.4
27
in Portfolio 1. It means that if the yield on the 2-year security were to change by 1%,
with all other yields constant, Portfolio 1 will change by 0.3%. On the same basis, other
If yield on the 2-year security changes by 1% and 10 year security changes by 0.5%,
then what would be the change in Portfolio 1 value if all other yields remain constant?
If the yield changes by 1% for all maturities, then the portfolio value will change by
4.85%.
10, 12 and 15 years) change. Such portfolios that are biased towards one range of
structures.
Debt portfolio managers anticipate the likely change in yield curve structures. Based on
will choose between bullet (short-term bias), bullet (long-term bias) or ladder. The
3.2 Credit Risk & Yield Spreads
3.2.1 Assessment of Sovereign Debt Servicing Ability
On paper, a country can print its local currency to repay its local debt. Therefore, credit
purchasing power without a matching output of goods and services. This leads to high
Therefore, mature countries have institutional mechanisms in place to control printing
of currency notes. This is where the role of monetary authorities like the Reserve Bank
of India comes in. Independence of the monetary authority is a measure of the strength
of a country’s currency management.
28
Economic strength of a country can be seen through parameters such as:
decisions
international investors have in the country
absolute number
foreign currency requirements
of goods and services fall short of its imports. This again is seen as a percentage
problem
reserves.
to output generation in the economy (e.g. India) is considered more robust than
a country dominated by elders who are well beyond the normal working age (e.g.
Japan).
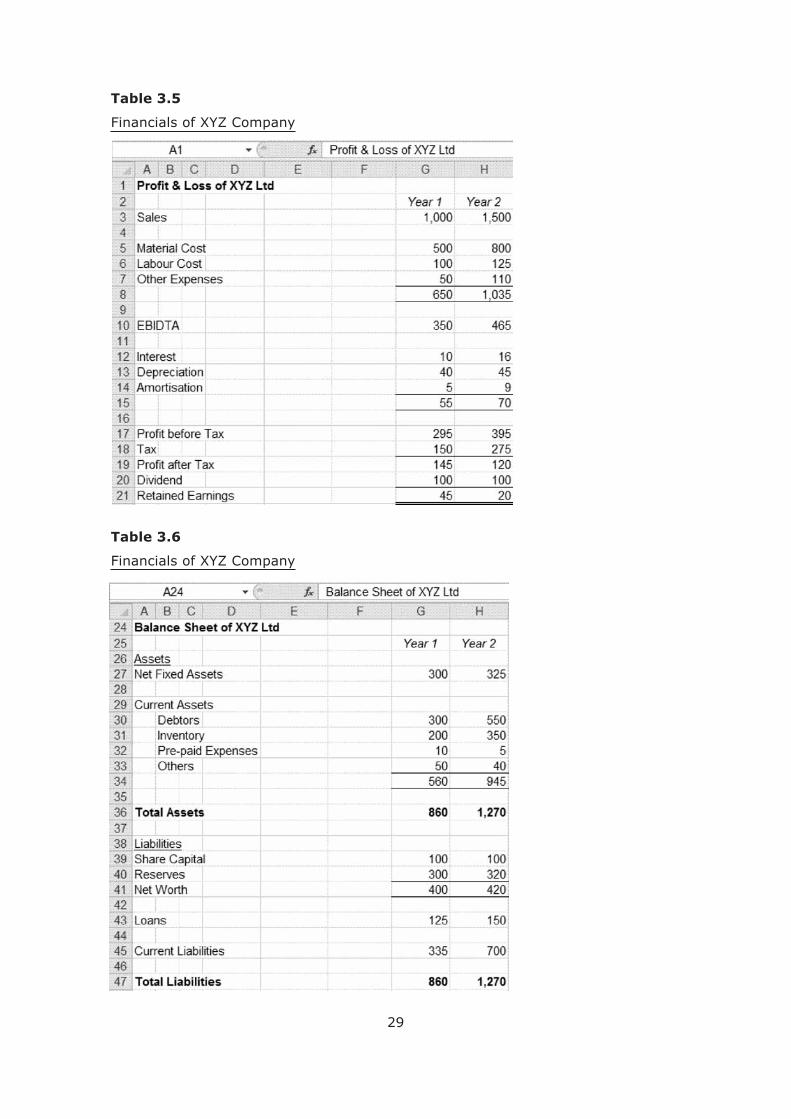
3.2.2 Assessment of Private Debt Servicing Ability
companyover 2 years in Tables 3.5 and 3.6.
29
Table 3.5
Table 3.6
30
Debt servicing can be reviewed through 3 parameters – Solvency, Coverage and Financial
Structure.
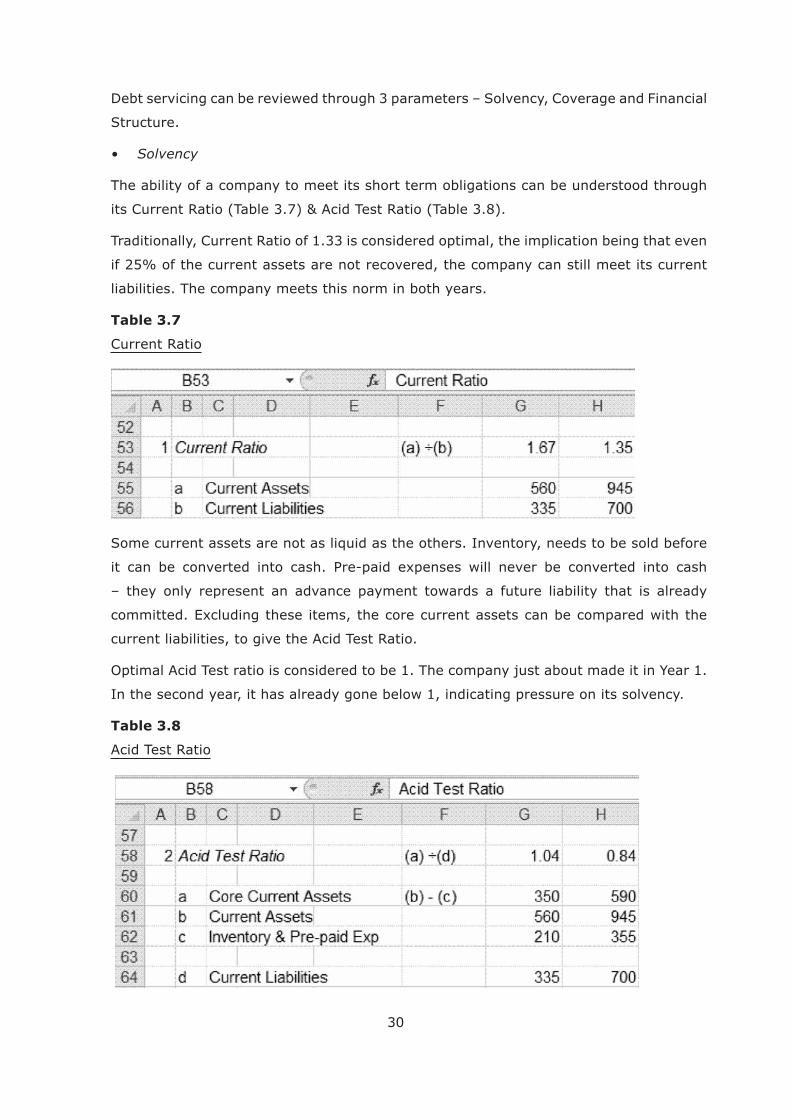
The ability of a company to meet its short term obligations can be understood through
Traditionally, Current Ratio of 1.33 is considered optimal, the implication being that even
if 25% of the current assets are not recovered, the company can still meet its current
liabilities. The company meets this norm in both years.
Table 3.7
Current Ratio
Some current assets are not as liquid as the others. Inventory, needs to be sold before
– they only represent an advance payment towards a future liability that is already
current liabilities, to give the Acid Test Ratio.
Optimal Acid Test ratio is considered to be 1. The company just about made it in Year 1.
In the second year, it has already gone below 1, indicating pressure on its solvency.
Table 3.8
Acid Test Ratio
31
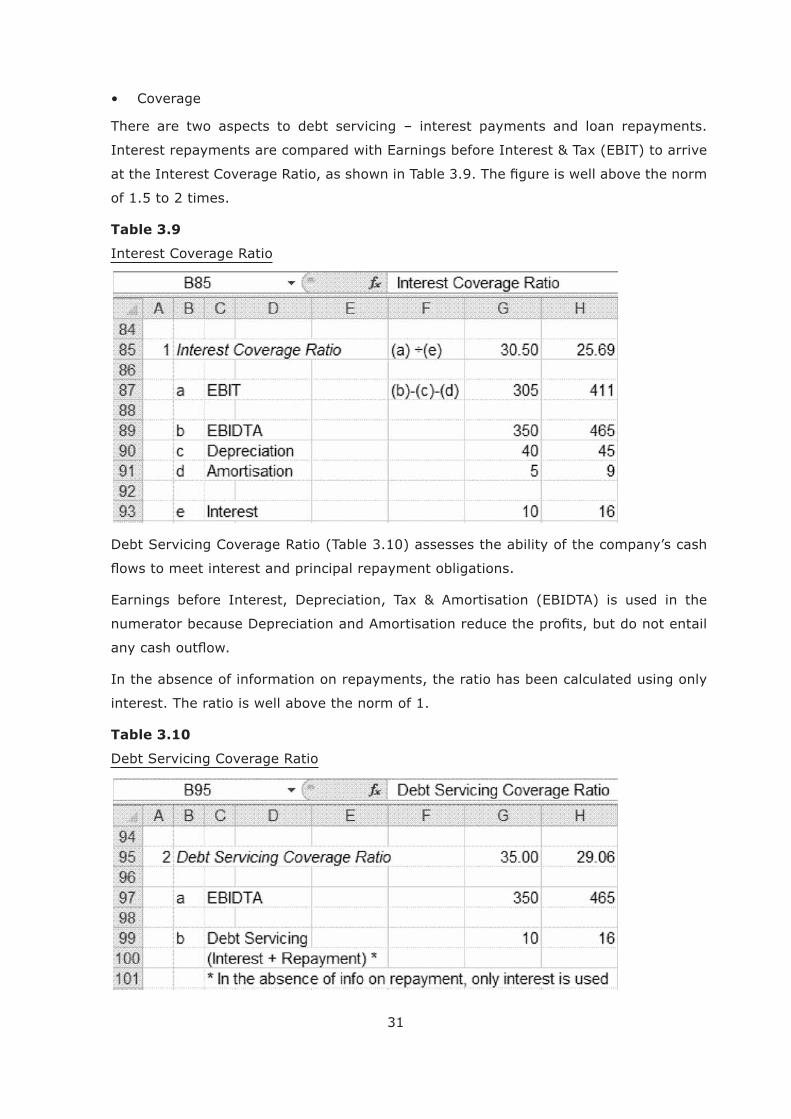
There are two aspects to debt servicing – interest payments and loan repayments.
of 1.5 to 2 times.
Table 3.9
Interest Coverage Ratio
Debt Servicing Coverage Ratio (Table 3.10) assesses the ability of the company’s cash
In the absence of information on repayments, the ratio has been calculated using only
interest. The ratio is well above the norm of 1.
Table 3.10
Debt Servicing Coverage Ratio
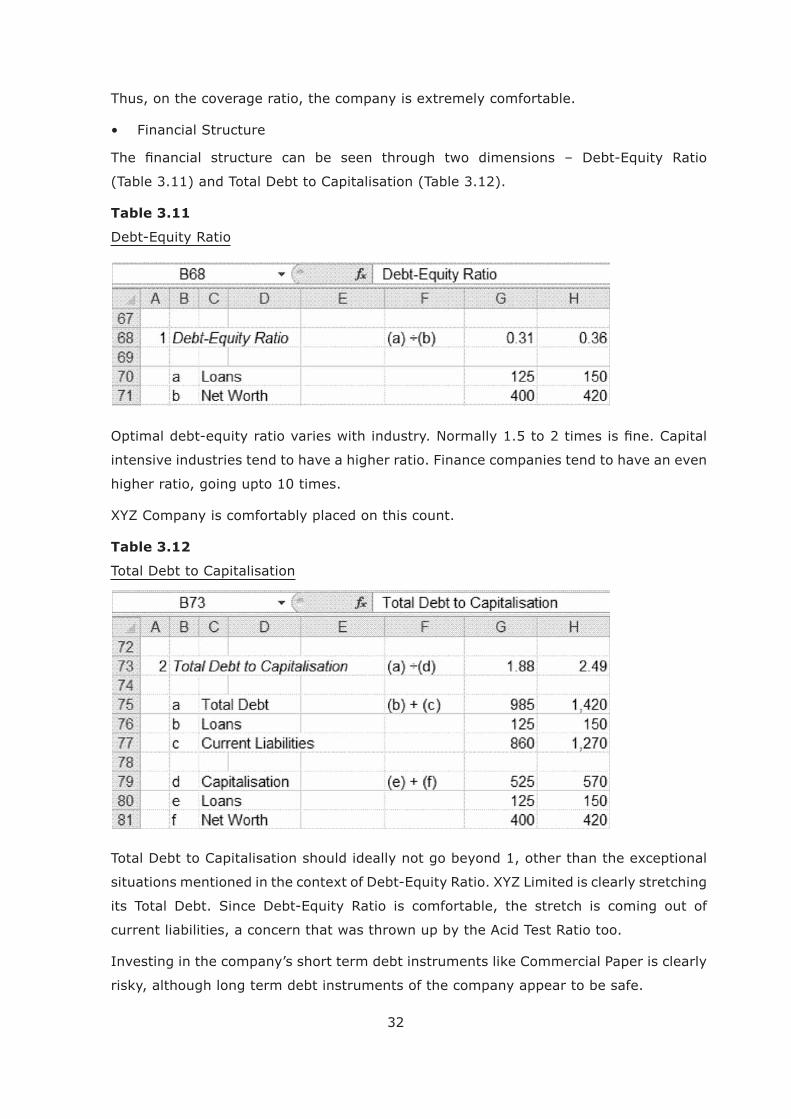
32
(Table 3.11) and Total Debt to Capitalisation (Table 3.12).
Table 3.11
Debt-Equity Ratio
intensive industries tend to have a higher ratio. Finance companies tend to have an even
higher ratio, going upto 10 times.
Table 3.12
Total Debt to Capitalisation
its Total Debt. Since Debt-Equity Ratio is comfortable, the stretch is coming out of
current liabilities, a concern that was thrown up by the Acid Test Ratio too.
Investing in the company’s short term debt instruments like Commercial Paper is clearly
risky, although long term debt instruments of the company appear to be safe.
33
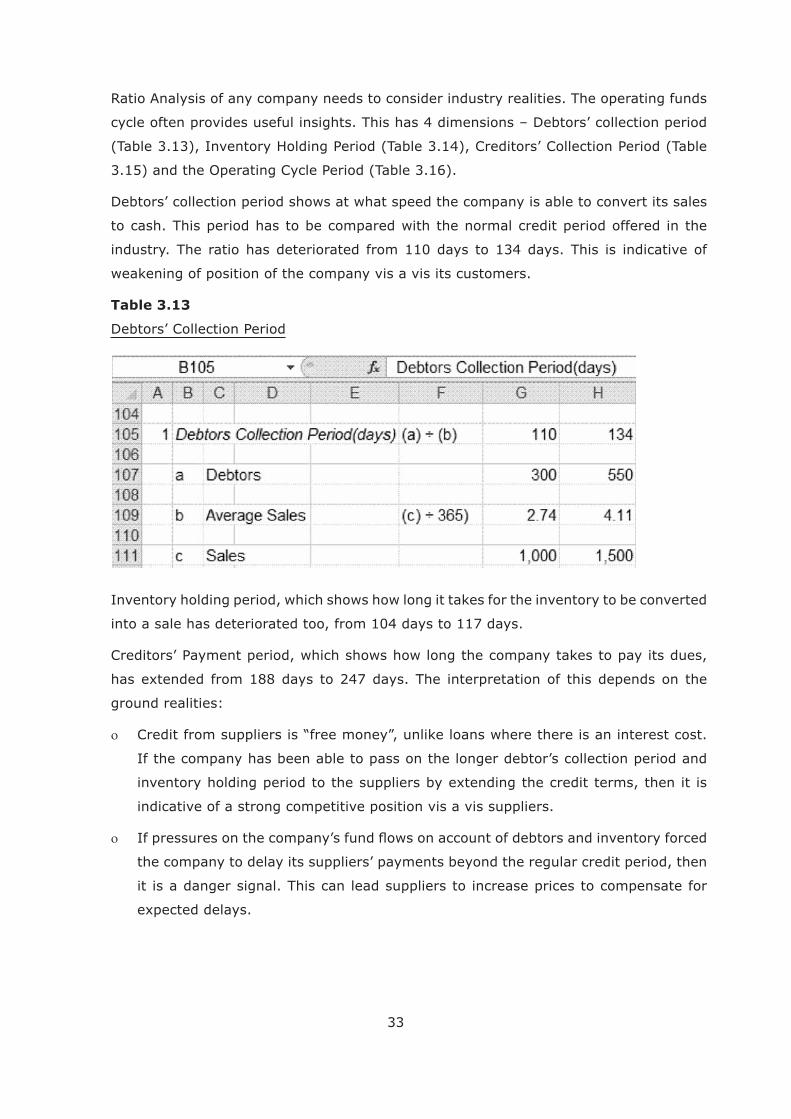
Ratio Analysis of any company needs to consider industry realities. The operating funds
cycle often provides useful insights. This has 4 dimensions – Debtors’ collection period
(Table 3.13), Inventory Holding Period (Table 3.14), Creditors’ Collection Period (Table
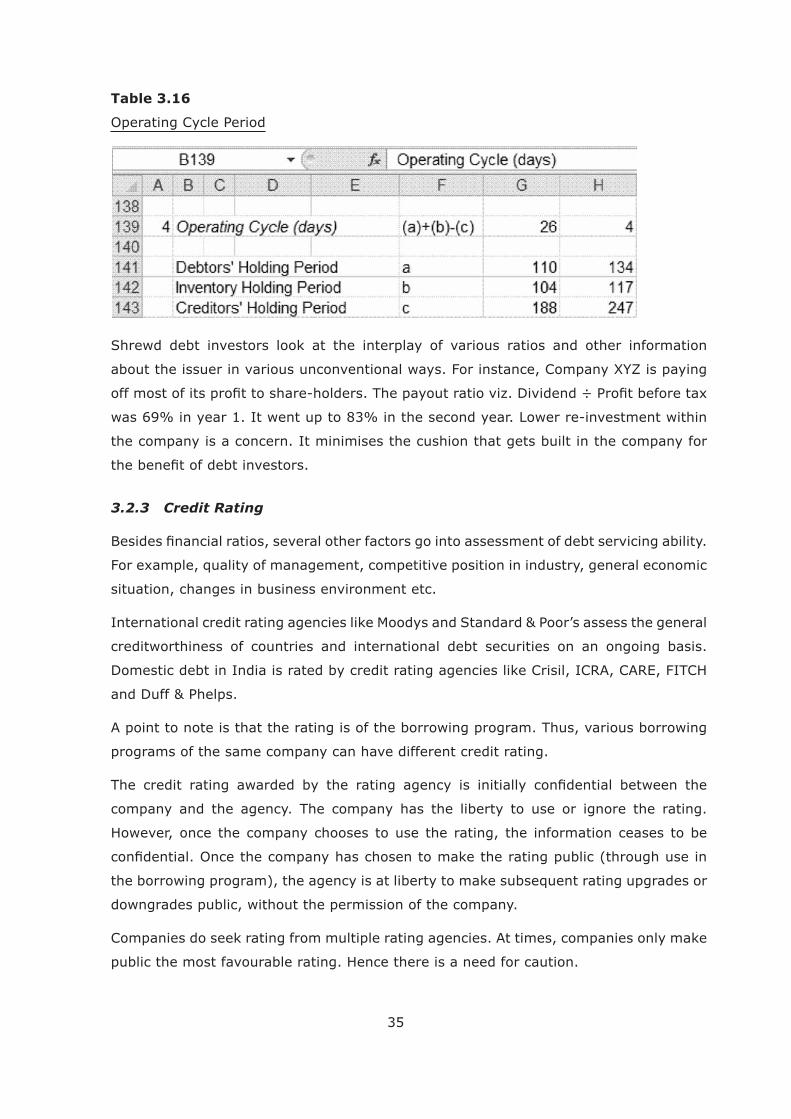
3.15) and the Operating Cycle Period (Table 3.16).
Debtors’ collection period shows at what speed the company is able to convert its sales
to cash. This period has to be compared with the normal credit period offered in the
industry. The ratio has deteriorated from 110 days to 134 days. This is indicative of
weakening of position of the company vis a vis its customers.
Table 3.13
Debtors’ Collection Period
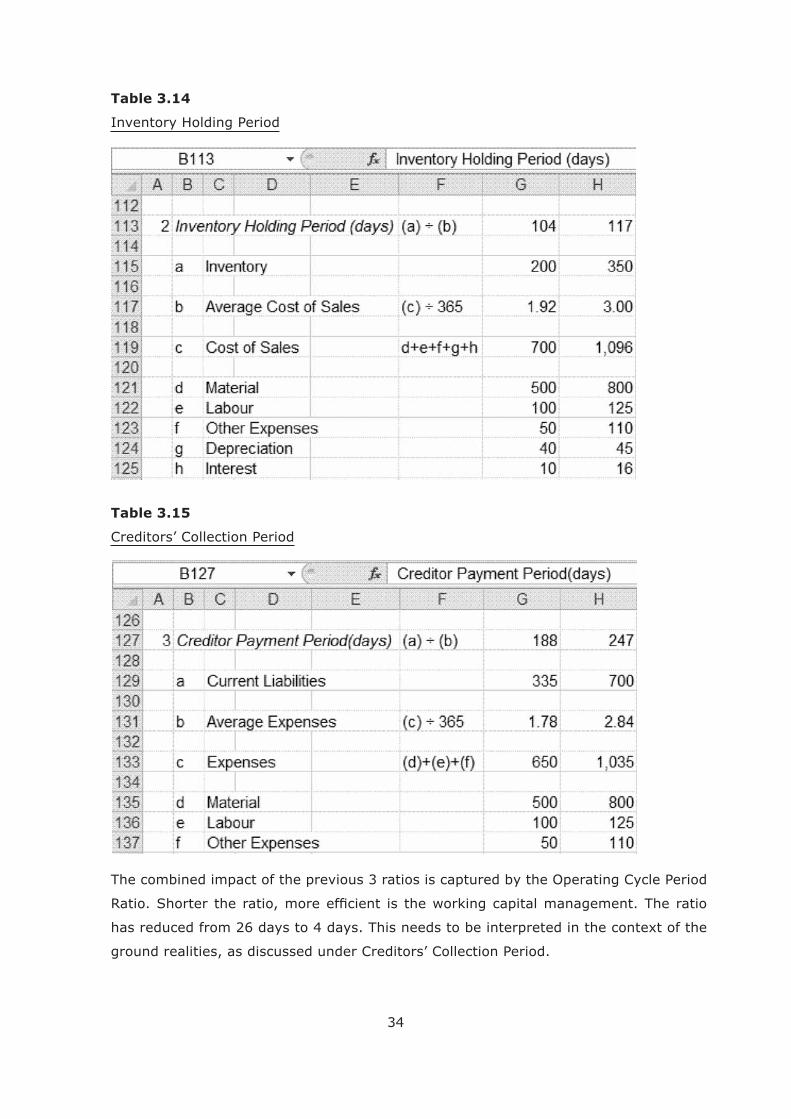
Inventory holding period, which shows how long it takes for the inventory to be converted
into a sale has deteriorated too, from 104 days to 117 days.
Creditors’ Payment period, which shows how long the company takes to pay its dues,
ground realities:
If the company has been able to pass on the longer debtor’s collection period and
indicative of a strong competitive position vis a vis suppliers.
the company to delay its suppliers’ payments beyond the regular credit period, then
it is a danger signal. This can lead suppliers to increase prices to compensate for
34
Table 3.14
Inventory Holding Period
Table 3.15
Creditors’ Collection Period
The combined impact of the previous 3 ratios is captured by the Operating Cycle Period
ground realities, as discussed under Creditors’ Collection Period.
35
Table 3.16
Operating Cycle Period
Shrewd debt investors look at the interplay of various ratios and other information
was 69% in year 1. It went up to 83% in the second year. Lower re-investment within
the company is a concern. It minimises the cushion that gets built in the company for
3.2.3 Credit Rating
situation, changes in business environment etc.
creditworthiness of countries and international debt securities on an ongoing basis.
Domestic debt in India is rated by credit rating agencies like Crisil, ICRA, CARE, FITCH
A point to note is that the rating is of the borrowing program. Thus, various borrowing
programs of the same company can have different credit rating.
company and the agency. The company has the liberty to use or ignore the rating.
However, once the company chooses to use the rating, the information ceases to be
the borrowing program), the agency is at liberty to make subsequent rating upgrades or
downgrades public, without the permission of the company.
Companies do seek rating from multiple rating agencies. At times, companies only make
public the most favourable rating. Hence there is a need for caution.
36
Credit rating is meant to be a forward-looking opinion. However, it is often seen that credit
Further, at times, the ratings do not fully capture the credit risk properly, especially in
3.2.4 Structured Obligations
The regular credit rating of a borrowing program is based on the issuing company’s own
strength or weakness. The credit risk can be reduced through some other collateral
arrangements, such as:
debt investor gets paid off. Thus, a balance sheet risk can be translated into a risk
on the operations of the company and the strength of its customers.
means top credit rating that is not based on the issuer’s balance sheet but a structured
obligation.
3.2.5 Yield Spread & Changes in Credit Risk
Sovereign borrowings tend to be at the lowest yields in the market with the stronger
countries paying lesser than the weaker ones.
Non-sovereign borrowers need to pay higher than the country where they are incorporated
(unless credit is enhanced through a structured obligation). The premium that non-
issuing company needs to pay investors to get them to invest i.e. the yield spread will
be higher.
During weak economic situations or other anticipated problems, yield spreads in the
market go up, especially for weaker borrowers. This pushes up the yield and pulls down
by investing in anticipation of a recovery.
improvement, or disinvesting in anticipation of credit deterioration.
in the market or the company. These are discussed in Chapter 6 (Derivatives) and
Chapter 7 (Structured Products).
37
Chapter 4 : Financial Statements: Analysis & Projections for Equity
4.1 Financial Statement Analysis
Financial Statement Analysis is a key aspect of security evaluation.
With debt, an investor is looking for comfort that the money invested will be returned as
chapter, focussed on this aspect.
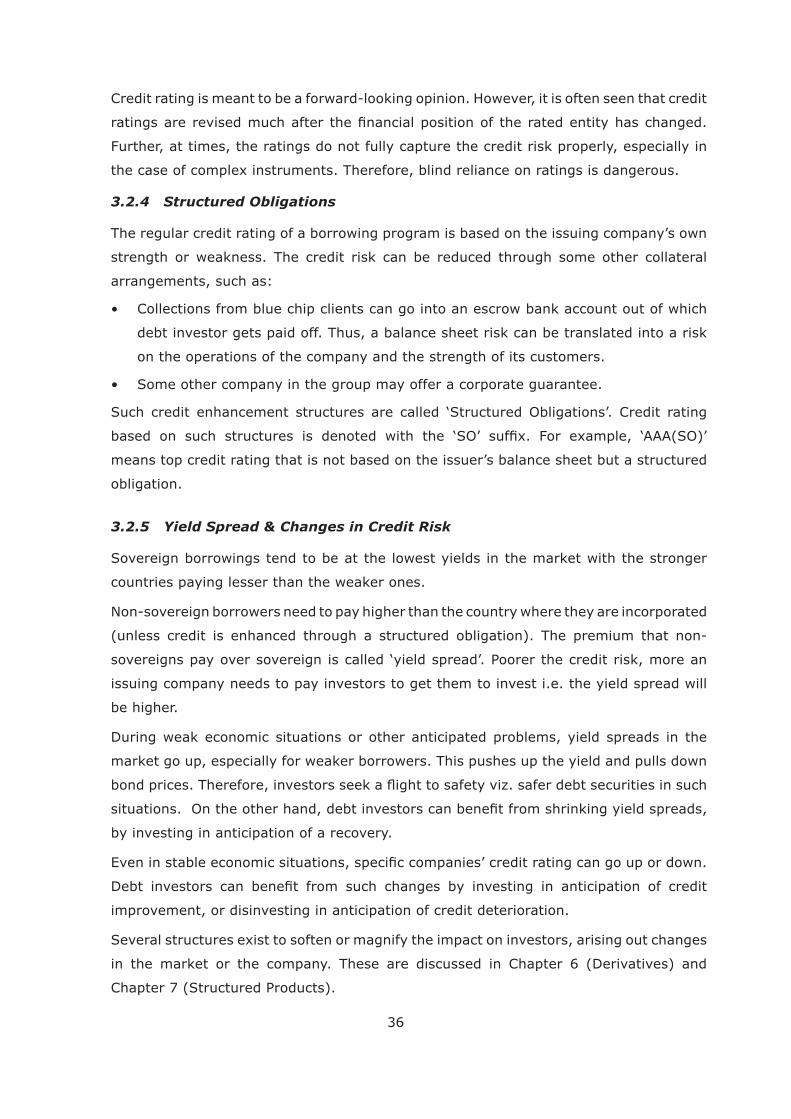
4.1.1 Revenue, Cost & Margin Structure
The numbers are given in Table 4.1. Sales have gone up by 50% to Rs. 1,500. This
should be compared with the industry trend. If industry grew at a slower pace, then it
down from 35% to 31%. Is this a temporary phenomenon? If not, then the stock market
is likely to view the development unfavourably.
markets.
payout ratio. Lower retained earnings means the company is re-investing less in itself.
This can affect the long term growth of the company.
companies, plus surcharge (if applicable).
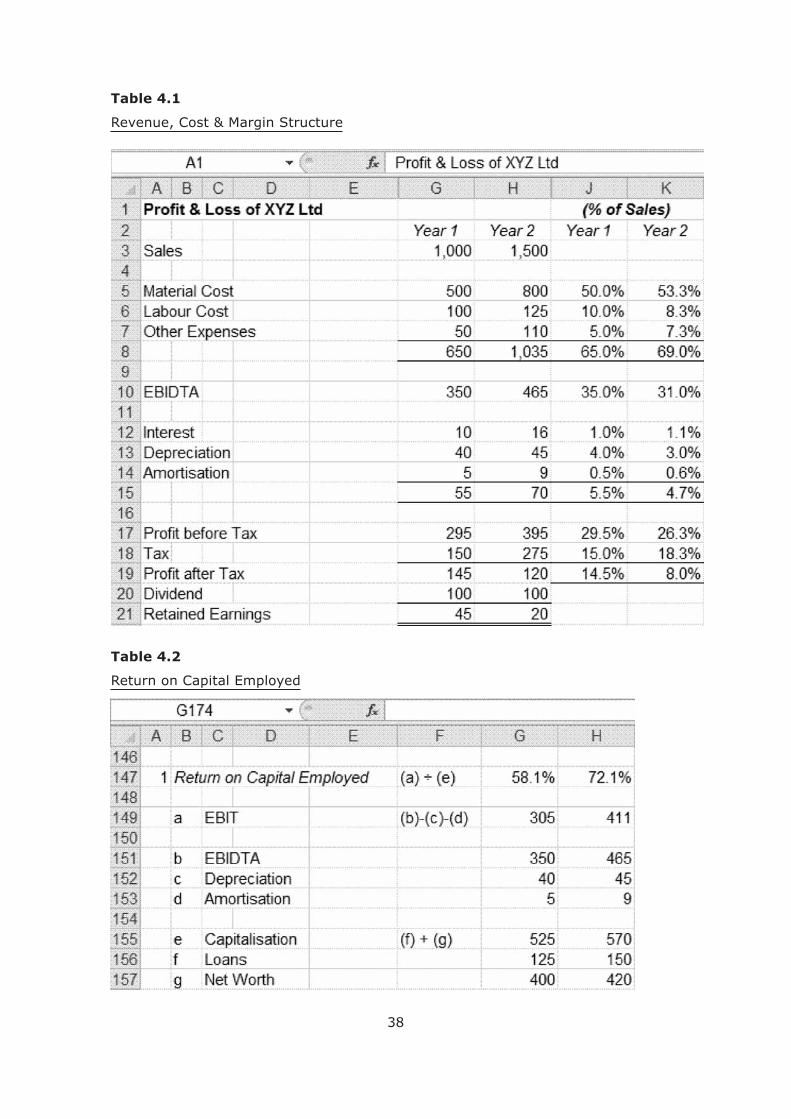
4.1.2
out of longer creditors’ payment period. The interpretation of higher creditors was
discussed in the previous chapter.
ROCE.
38
Table 4.1
Table 4.2
Return on Capital Employed
39
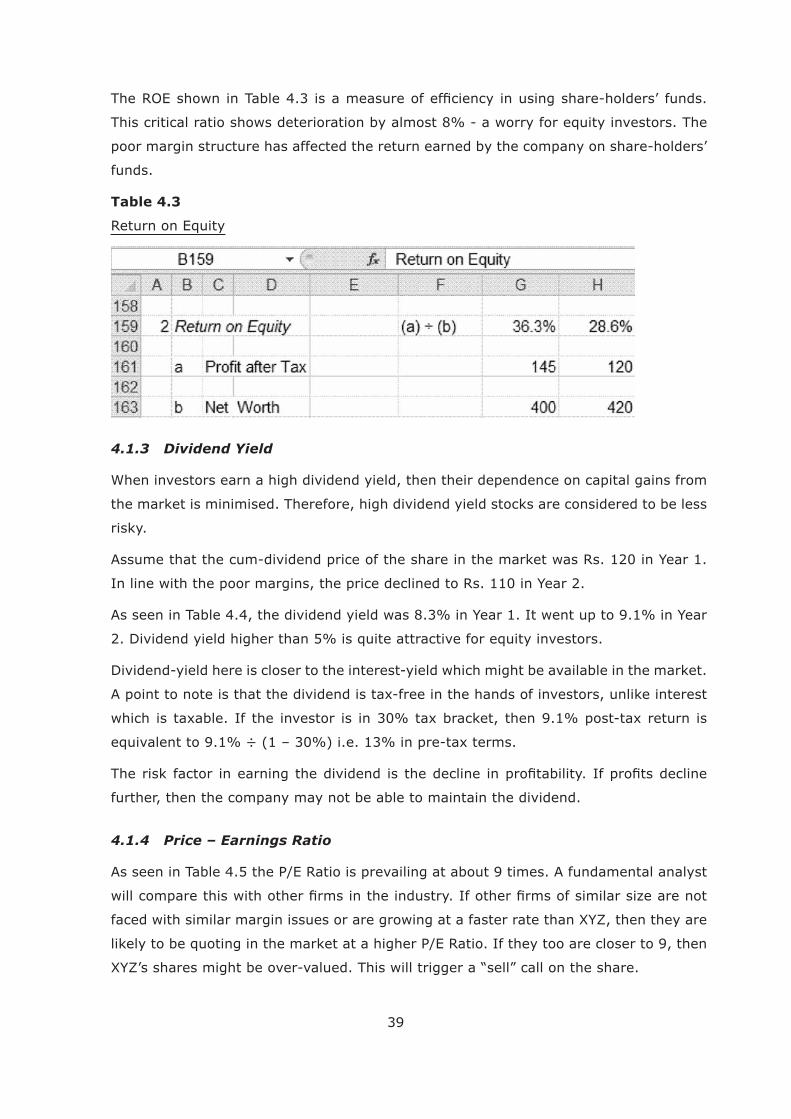
This critical ratio shows deterioration by almost 8% - a worry for equity investors. The
poor margin structure has affected the return earned by the company on share-holders’
funds.
Table 4.3
Return on Equity
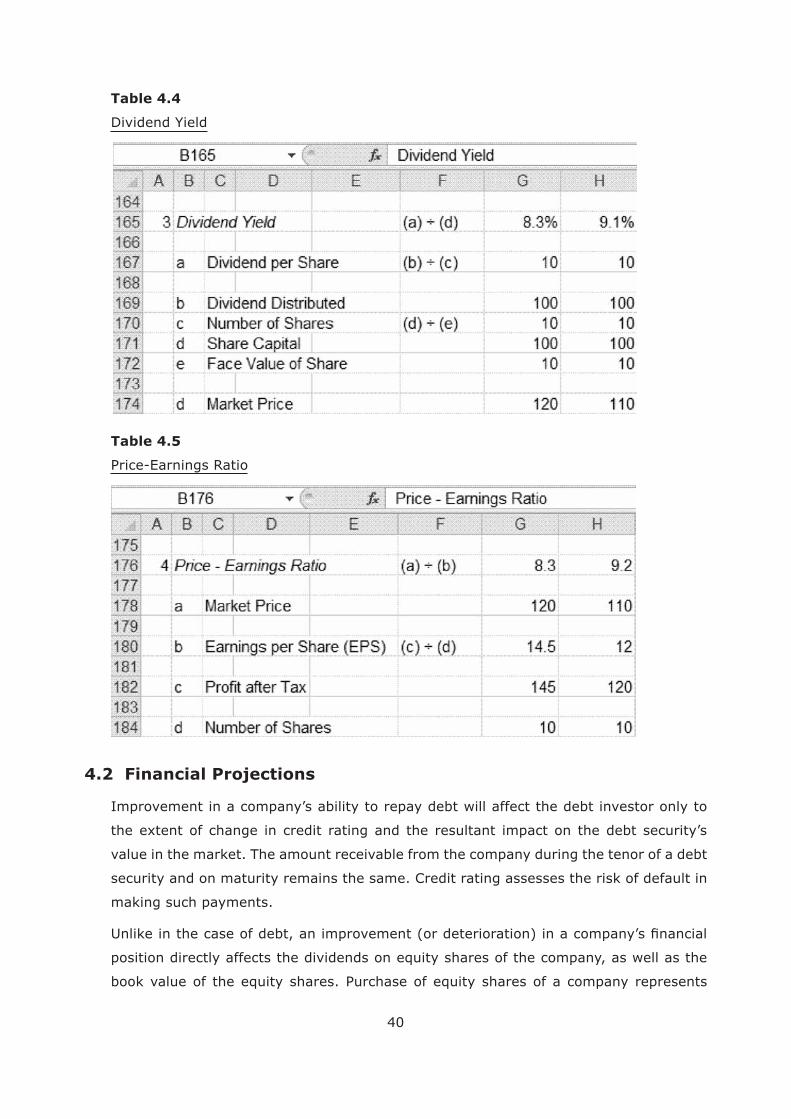
4.1.3 Dividend Yield
When investors earn a high dividend yield, then their dependence on capital gains from
the market is minimised. Therefore, high dividend yield stocks are considered to be less
risky.
Assume that the cum-dividend price of the share in the market was Rs. 120 in Year 1.
In line with the poor margins, the price declined to Rs. 110 in Year 2.
As seen in Table 4.4, the dividend yield was 8.3% in Year 1. It went up to 9.1% in Year
2. Dividend yield higher than 5% is quite attractive for equity investors.
Dividend-yield here is closer to the interest-yield which might be available in the market.
further, then the company may not be able to maintain the dividend.
4.1.4 Price – Earnings Ratio
40
Table 4.4
Dividend Yield
Table 4.5
Price-Earnings Ratio
4.2 Financial Projections
Improvement in a company’s ability to repay debt will affect the debt investor only to
value in the market. The amount receivable from the company during the tenor of a debt
security and on maturity remains the same. Credit rating assesses the risk of default in
making such payments.
position directly affects the dividends on equity shares of the company, as well as the
book value of the equity shares. Purchase of equity shares of a company represents
41
on the valuation of its equity shares. Therefore, fundamental analysis of equity uses
further to projecting the company’s future.
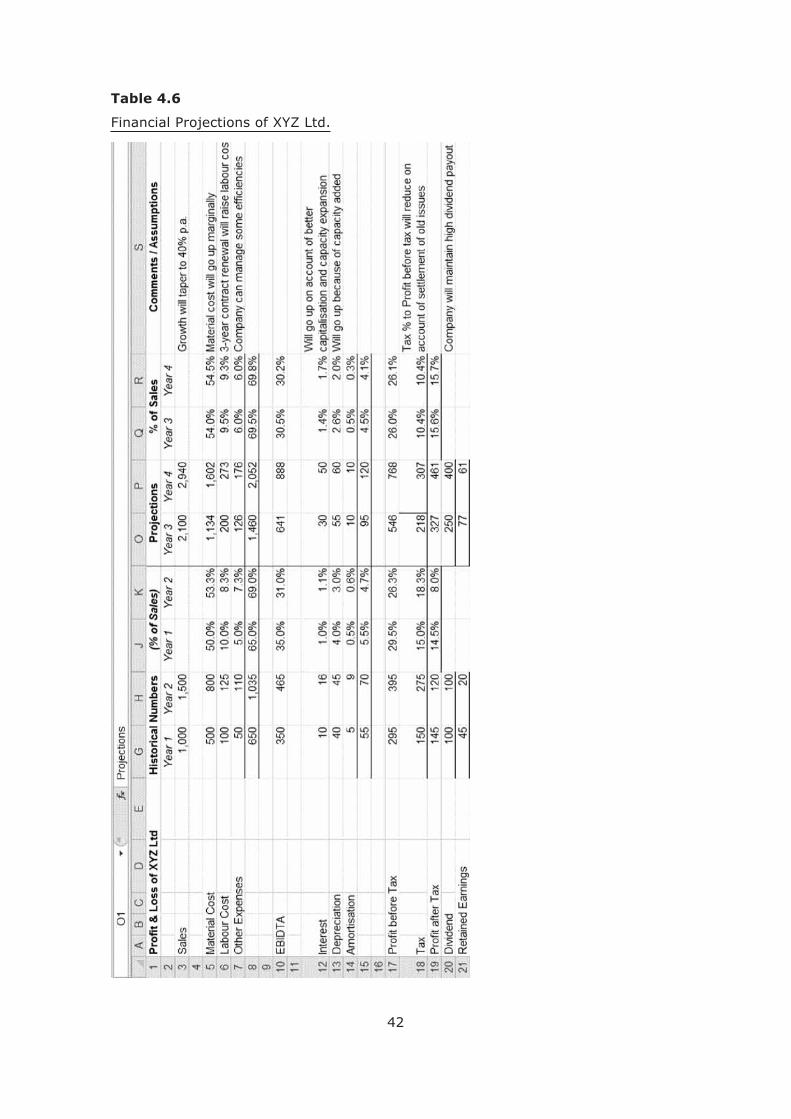
Projecting the future entails analysis of the economy, industry, company and the
company’s strategies. This is discussed in Chapter 6. Based on such analyses, the
Chapter 5.
42
Table 4.6
43
Chapter 5 : Equity – Valuation & Investment Decisions (Part 1)
5.1 Required Rate of Return on Equity
Many approaches to valuation of equity shares use this parameter. The Capital Assets
Pricing Model (CAPM) offers a theoretical construct for determining this.
According to CAPM, investment in equities entails two kinds of risk – Systematic Risks
and Non-systematic Risks.
As per the CAPM Model, the required rate of return on equity can be calculated as
follows:
is the return that can be earned from the government. Treasury bills,
the risk-free return. Based on data in Graph 3.3, let us take it to be 8.45%.
is calculated based on the past price-behaviour of the stock that is being
the same periods. For the academic purpose of understanding the calculations, the
data over a short period is considered in Table 5.1.
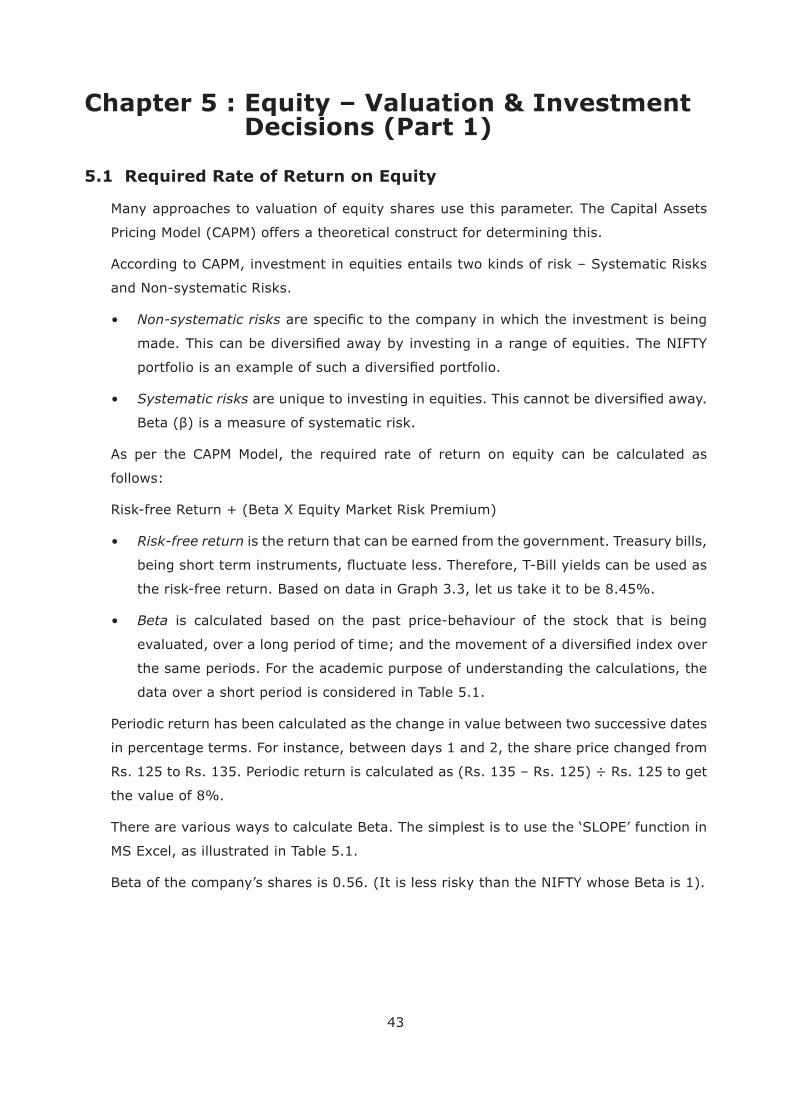
Periodic return has been calculated as the change in value between two successive dates
in percentage terms. For instance, between days 1 and 2, the share price changed from
Rs. 125 to Rs. 135. Periodic return is calculated as (Rs. 135 – Rs. 125) ÷ Rs. 125 to get
the value of 8%.
Beta of the company’s shares is 0.56. (It is less risky than the NIFTY whose Beta is 1).
44
Table 5.1
Calculation of Beta
While working with Beta, it is advisable to check on the strength of the relation between
the two series of data. This is shown in Table 5.2.
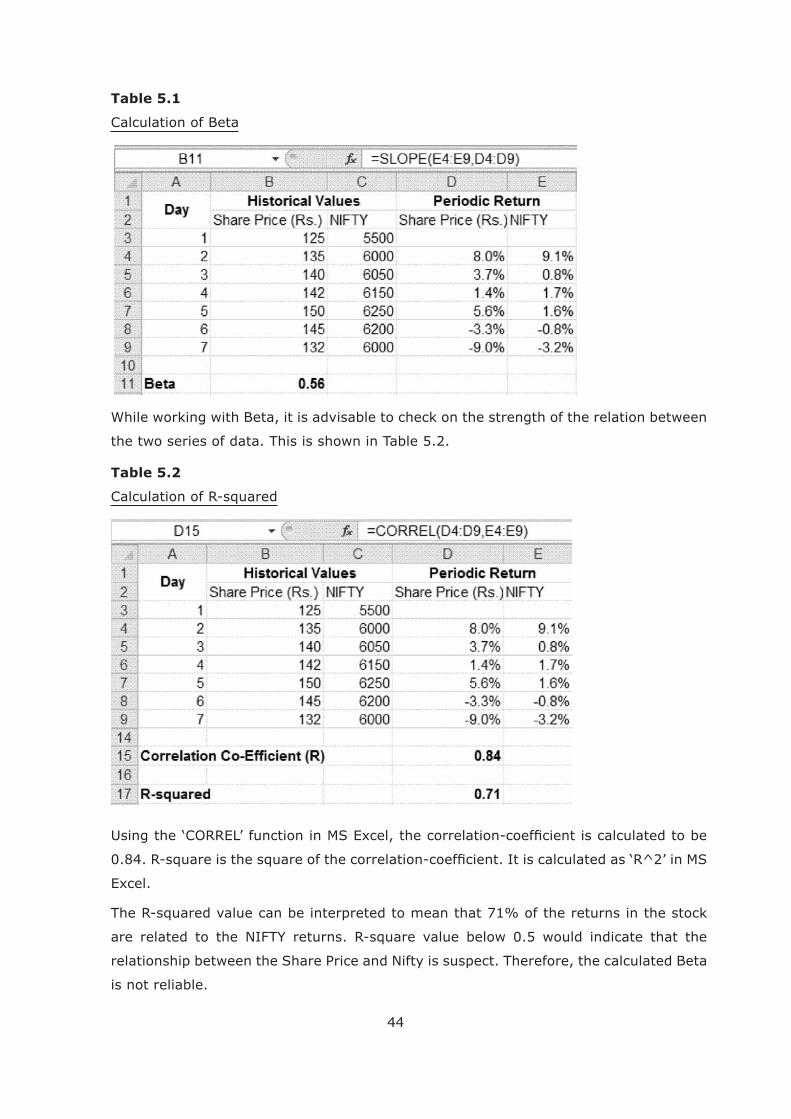
Table 5.2
Calculation of R-squared
The R-squared value can be interpreted to mean that 71% of the returns in the stock
are related to the NIFTY returns. R-square value below 0.5 would indicate that the
relationship between the Share Price and Nifty is suspect. Therefore, the calculated Beta
is not reliable.
45
is the third element that goes into the calculation of
CAPM-based Required rate of return on equity. This can be viewed as the historical
difference between returns on equity and risk-free debt. If we take the historical
equity returns to be 15%, then equity market risk premium would be 15% - 8.45%
i.e. 6.55%.
The company needs to ensure that equity investors earn at least this return. Else, the
company.
5.2 Weighted Average Cost of Capital (WACC)
Equity is only one form of funding for any company. We know the Cost of Equity. As
understand the Cost of Debt too, to determine WACC.
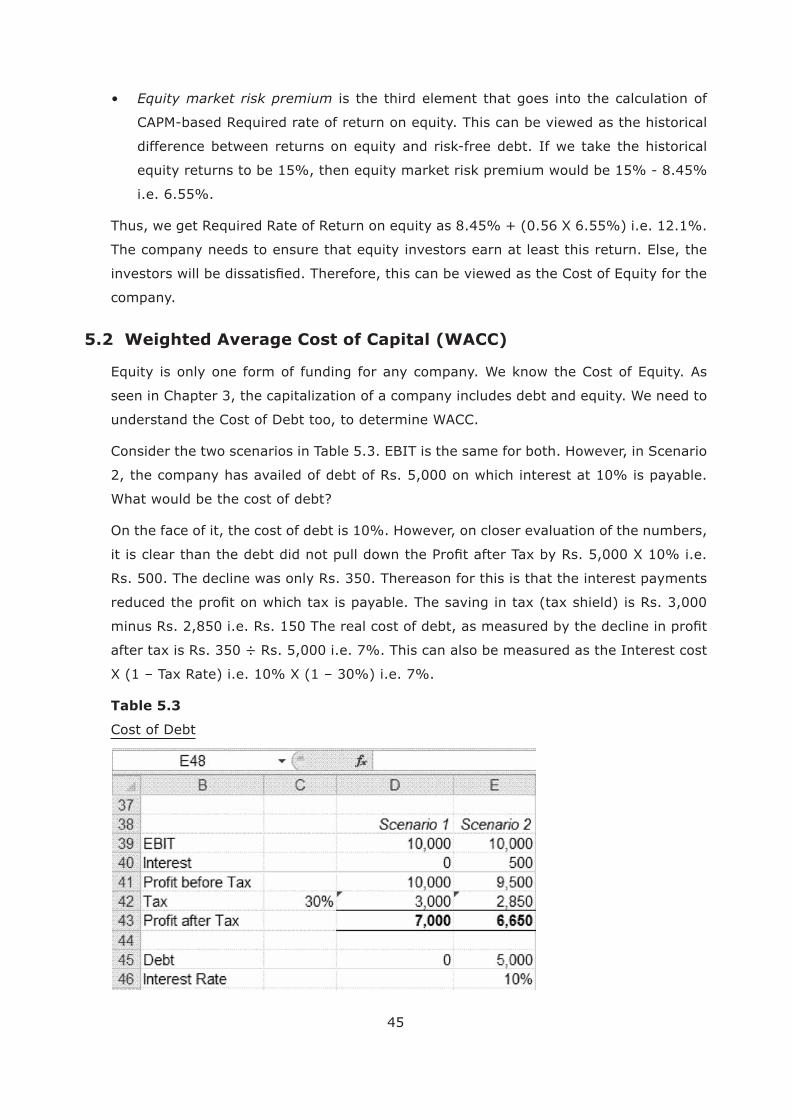
Consider the two scenarios in Table 5.3. EBIT is the same for both. However, in Scenario
2, the company has availed of debt of Rs. 5,000 on which interest at 10% is payable.
What would be the cost of debt?
On the face of it, the cost of debt is 10%. However, on closer evaluation of the numbers,
Rs. 500. The decline was only Rs. 350. Thereason for this is that the interest payments
Table 5.3
Cost of Debt
46
the end of Year 1 and Rs. 150 at the end of Year 2. Average loan during the year was
137.50 i.e. 11.64%.
40% (Rs. 218 ÷ Rs. 546).
We already know the Cost of Equity to be 12.1%. WACC is the weighted average of these
two costs. The weighting to be used is the market value of debt and equity.
company has issued 10 equity shares. Thus, the market value of the company’s equity
WACC can now be calculated as follows:
i.e. 11.4%
This is the amount that the company should earn on its operating assets in order to
WACC is used in some approaches to valuation, as will be discussed later in this
chapter.
5.3 Fundamental Valuation Approaches
5.3.1 Dividend Discounting
An investor buying equity shares of a company and holding them forever will keep
receiving dividends. The price he should be prepared to pay, therefore, would be the
present value of all those dividends. This is similar to the value of a debt security being
equal to the present value of all the future interest and principal repayments. However,
unlike debt where an interest is promised, the dividend in equity is uncertain and subject
Valuation using the Dividend Discounting approach therefore entails estimating a
47
Rs. 10 to be the face value, the number of shares issued is 10. The Rs. 100 dividend
payment on 10 shares amounts to Dividend per Share (DPS) of Rs. 10.
of a perpetual debt security. It can be calculated as DPS ÷ Cost of Equity i.e. Rs. 10 ÷
12.1%. This gives a share value of Rs. 82.65.
According to the Gordon Growth Model, price of the share will be DPS ÷ (Required Rate
equity share would be:
Rs. 10÷ (12.1% - 5%)
i.e. Rs. 140.85
the case of constant dividend assumption.
Here, the price of the equity can be computed as the sum of two values:
A value for the dividends during the initial period. This can be computed by discounting
A value for the dividends during the stable period that follows the initial period.
This value, called the terminal value, can be calculated using the Dividend Growth
Model.
p.a.
48
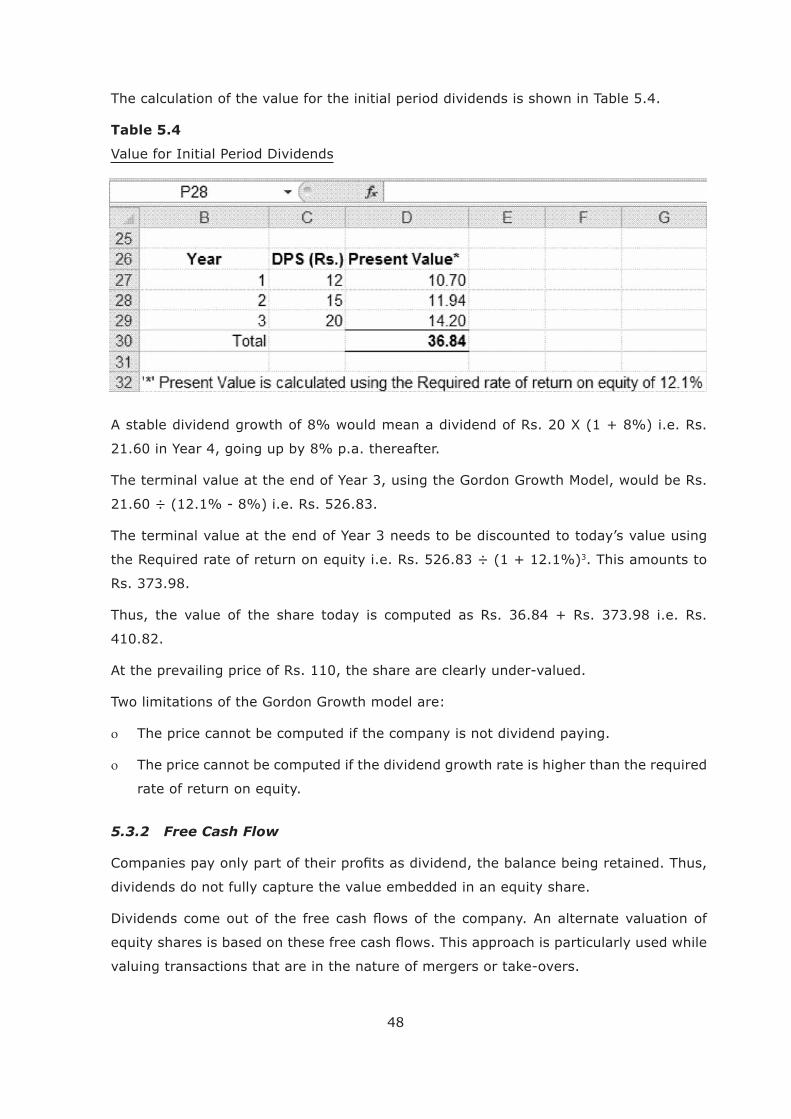
The calculation of the value for the initial period dividends is shown in Table 5.4.
Table 5.4
Value for Initial Period Dividends
21.60 in Year 4, going up by 8% p.a. thereafter.
The terminal value at the end of Year 3, using the Gordon Growth Model, would be Rs.
21.60 ÷ (12.1% - 8%) i.e. Rs. 526.83.
The terminal value at the end of Year 3 needs to be discounted to today’s value using 3. This amounts to
Rs. 373.98.
410.82.
At the prevailing price of Rs. 110, the share are clearly under-valued.
Two limitations of the Gordon Growth model are:
The price cannot be computed if the company is not dividend paying.
The price cannot be computed if the dividend growth rate is higher than the required
rate of return on equity.
5.3.2 Free Cash Flow
dividends do not fully capture the value embedded in an equity share.
valuing transactions that are in the nature of mergers or take-overs.
49
servicing debt and equity investors. It is calculated as follows:
Depreciation and amortisation are added back because they do not involve a
company appears to be 40% (Rs. 218 ÷ Rs. 546). The amount to be added back
Normal working capital investment is the increase in working capital that will
Year 3.
Rs. 100 i.e. Rs. 260.
As with the Gordon Growth model, the FCFF is projected for an initial period and value
for the period after the initial period. The discount factor to use for calculating the value
50
The Value of the Firm, arising out of FCFF in the initial period of 2 years is as follows:
1 2
i.e. Rs. 536.
Rs. 398.56. This is to be divided (WACC – growth rate) to arrive at the Terminal Value
7,380.
This needs to be further discounted for 2 years, to arrive at the Terminal Value as at the 2 i.e. Rs. 5,947.
i.e. Rs. 6,483.
The calculations so far assumed that all the assets of the company were used in the
also invested in some other companies and the FCFE has not factored any income from
those investments. If the market value of those investments were Rs. 200, then that
would be added to the previously calculated value to arrive at a revised Value of the Firm
of Rs. 6,683.
In the same way, any other non-operating assets, such as land bank of the company not
currently used in operations, will be added to determine the Value of the Firm.
From the Free Cash Flow to the Firm, if the payments towards debt servicing are
reduced, the balance belongs to equity investors. This is called “Free Cash Flow to
From Table 4.6, we know that interest payments in Years 3 and 4 were Rs. 30 and Rs.
Rs. 18 and Rs. 30 respectively.
two years.
FCFE (Year 3) = Rs. 260 – Rs. 18 – Rs. 10 i.e. Rs. 232
51
FCFE (Year 4) = Rs. 376 – Rs. 30 – Rs. 15 i.e. Rs. 331
1
12.1%)2
i.e. Rs. 470
This needs to be discounted further for 2 years to arrive at the Terminal Value of the
2 i.e. Rs. 5,523.
i.e. Rs. 5,993.
Since 10 shares are issued, the value of each share would be Rs. 5,993 ÷ 10 i.e. Rs.
599.30
The above is a more precise approach that entails determining the FCFE separately
for each year for an initial period and then estimating a growth rate for a subsequent
period.
An alternate approach is given by the following formula:
Value of Equity of Firm = Value of Firm – Loan outstanding
i.e. Rs. 6,683 – Rs. 150
i.e. Rs. 6,533.
Dividing by the number of equity shares, the value of each share would be Rs. 653.30.
market price of Rs. 110.
Two broad principles to keep in mind while working with Free Cash Flows:
While arriving at the Value of Firm, use Free Cash Flows to Firm and discount them
at the WACC
While arriving at the Value of Equity of the Firm, use Free Cash Flows to Equity and
discount them at the Cost of Equity.
52
5.3.3 Enterprise Value
This is one of the methods of valuation adopted in merger and acquisition transactions.
Value of Company’s Debt – Cash and Investments.
(assuming it is 50% of other current assets) i.e. Rs. 1,255.
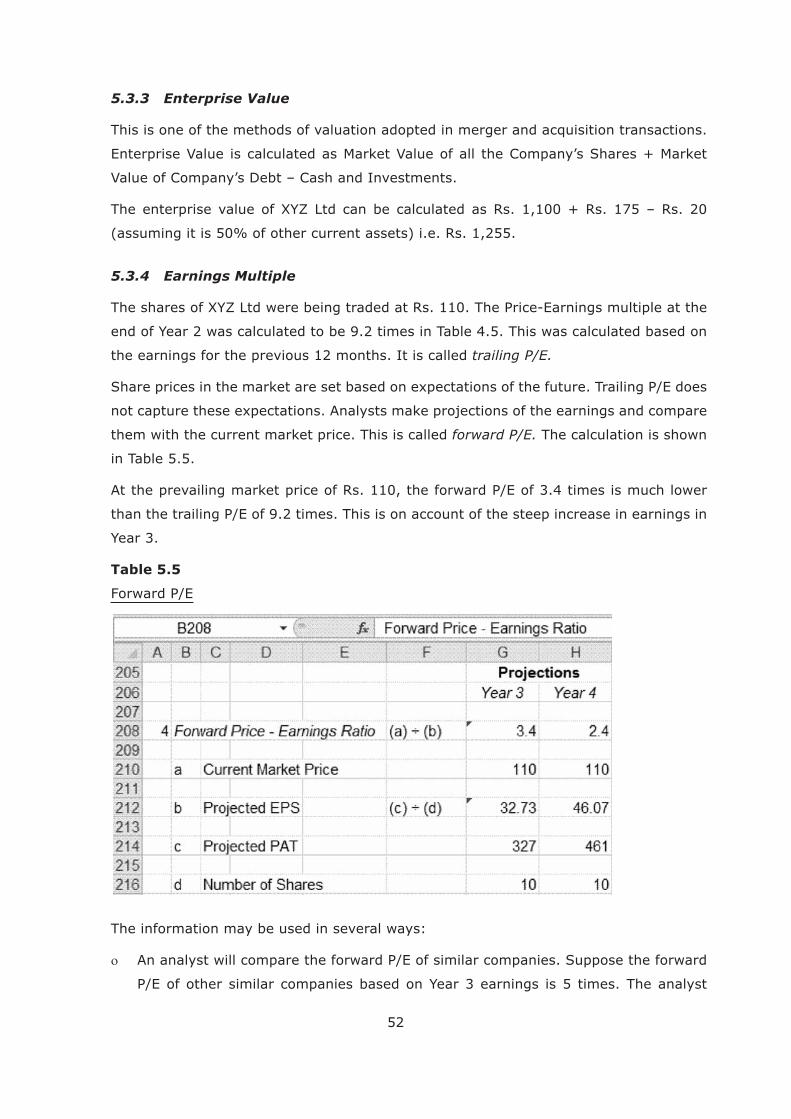
5.3.4 Earnings Multiple
end of Year 2 was calculated to be 9.2 times in Table 4.5. This was calculated based on
the earnings for the previous 12 months. It is called trailing P/E.
them with the current market price. This is called forward P/E. The calculation is shown
in Table 5.5.
Year 3.
Table 5.5
The information may be used in several ways:
53
might conclude that on account of margin considerations, management strength,
Accordingly, the analyst will recommend that the shares be bought.
when it plans to make an Initial Public Offer. At that stage, the investment bankers will
The investment banker needs to understand the industry dynamics well, in order to
arrive at a suitable IPO price.
earnings
capitalisation approach to valuation.
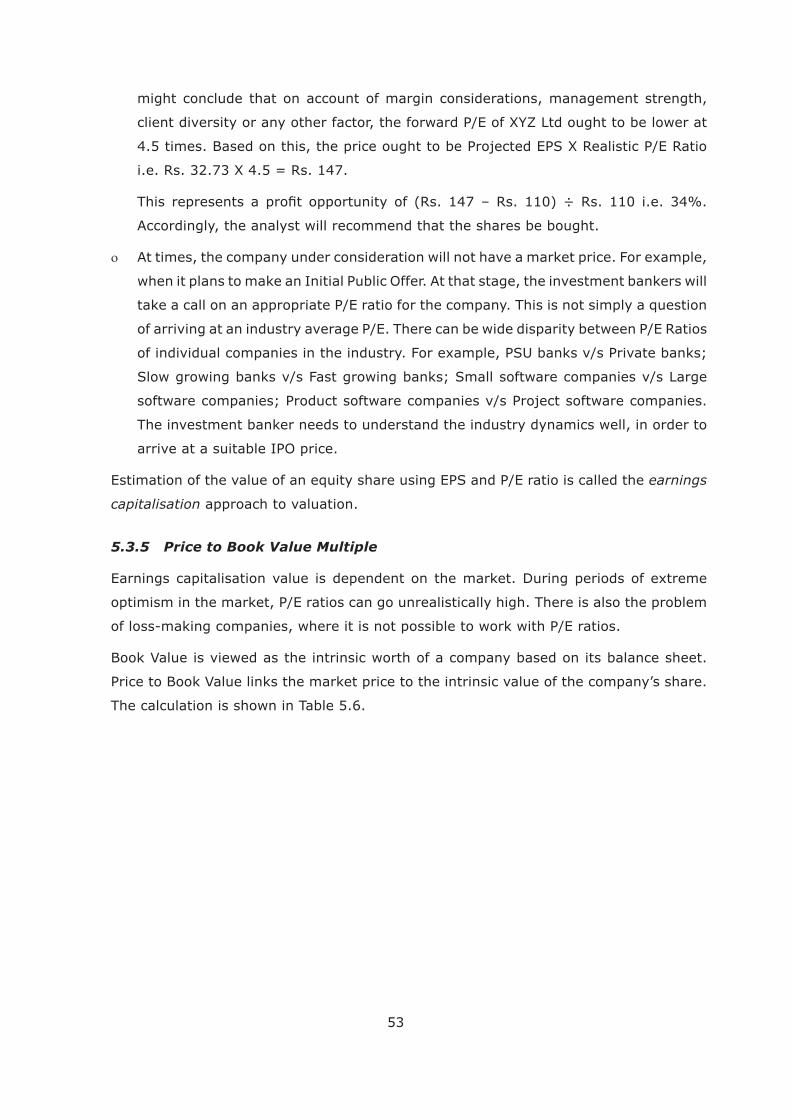
5.3.5 Price to Book Value Multiple
Book Value is viewed as the intrinsic worth of a company based on its balance sheet.
Price to Book Value links the market price to the intrinsic value of the company’s share.
The calculation is shown in Table 5.6.
54
Table 5.6
Price to Book Value
space, where the balance sheet value of the assets is likely to represent their realisable
value.
5.4 Margin of Safety
valuation. Although the formulas may be clear, their application can give a range of
valuation possibilities. Benjamin Graham conceptualised the margin of safety to address
this problem.
Margin of Safety = (Valuation based price – Current market price) ÷ Valuation based
price.
of safety at the current market price of Rs. 110 is (Rs. 147 – Rs. 110) ÷ Rs. 110 i.e.
25%.
This number can be interpreted as a margin for error. Even if the valuation is wrong by
25%, the investment will not lead to losses. 25% of Rs. 147 is Rs. 37. If this is reduced
from the valuation-based price of Rs. 147, we arrive at the current market price of Rs.
110.
Higher the margin of safety, greater is the comfort with which investment decision can
be taken. In the case of risky industries or companies with an inadequate track record,
investment is recommended only if a high margin of safety is available.
55
Chapter 6 : Equity – Valuation & Investment Decisions (Part 2)
6.1 Economy & Industry Analysis
6.1.1 Economy Analysis
The economy drives the markets. The assessment of a country’s economic strength,
etc.) are clear, there are uncertainties associated with servicing of equity. The dividend,
which in any case is a smaller part of an equity investor’s returns, is uncertain. The
market. Therefore, equity investors give a lot more importance to growth-related
economic parameters, than debt investors.
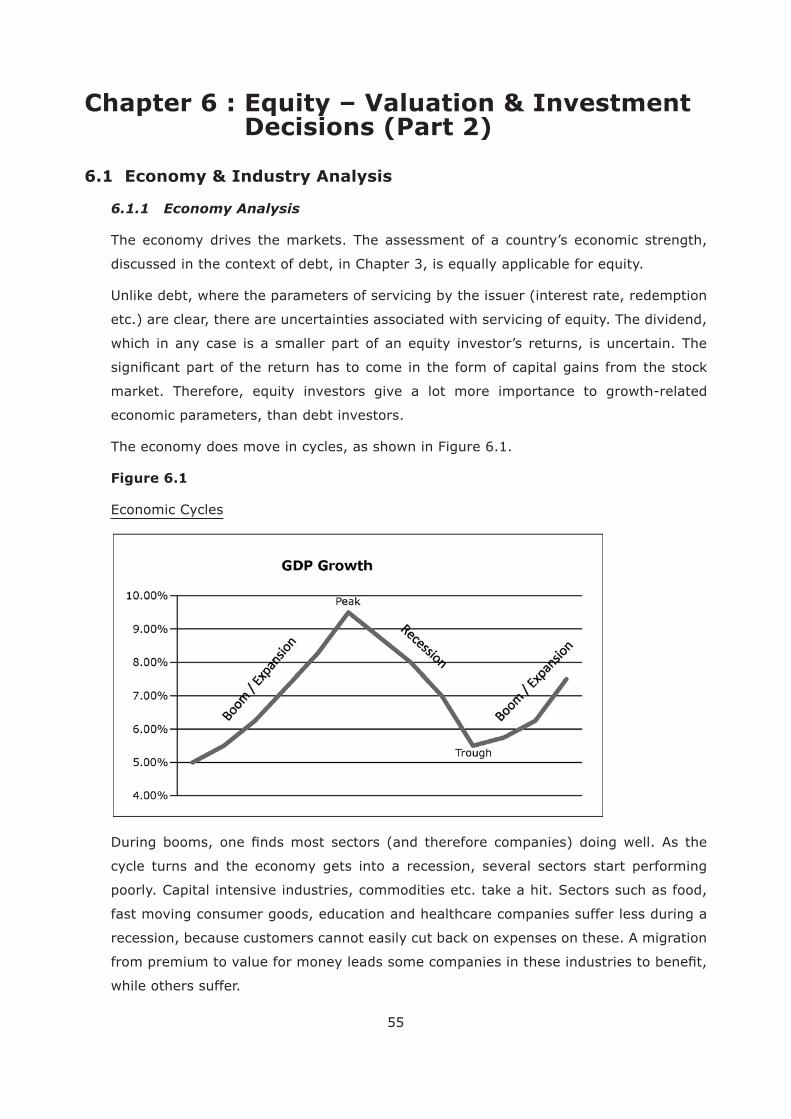
The economy does move in cycles, as shown in Figure 6.1.
Figure 6.1
Economic Cycles
cycle turns and the economy gets into a recession, several sectors start performing
poorly. Capital intensive industries, commodities etc. take a hit. Sectors such as food,
fast moving consumer goods, education and healthcare companies suffer less during a
while others suffer.
56
determines the fundamental valuation of their stocks. In order to earn better returns,
investors try to be ahead of the market. When more people buy before an economic
the share market has already declined by the time a recession sets in.
During stock market booms, the happiness of wealth creation itself can feed more
has resulted in a smaller share market driven wealth effect.
Various economic indicators may point in different directions. Therefore, it is not always
easy to take a call on where the economy is headed. Multiple views prevail in the market.
For instance, in 2010 when the global recovery started, some economists predicted
recessionary dip.
Diverse views pull the markets in different directions. This contributes to the ups and
downs of the share market. Irrational fear and greed magnify the movements. Therefore,
periods of time.
pushing up the share prices of a poorly performing company. Share prices do track the
fundamentals of companies over long periods of time.
Just as it is easier to anticipate seasonal changes than rainfall on a single day, economic
cycles are less challenging to anticipate than stock market cycles. A well-grounded
economist is therefore an important member of the team in most leading investment
institutions.
6.1.2 Industry Analysis
The impact of economic changes on any industry depends on the structure of that
industry. The performance of companies within the industry depends on the structure of
that industry and the competitive strategies pursued by the companies. One of the most
guru, Michael Porter in “Competitive Strategy: Techniques for Analysing Industries and
57
In what has come to be called Five forces model, Porter argues that the attractiveness
the attractiveness of the industry for companies in the industry.
For instance, Airlines, FMCG, consumer electronics and computer hardware industries
are characterised by intense competition. On the other hand, there is little competition
in power transmission.
in the industry.
Buyers of pharmaceutical products have little bargaining power. They buy what
price the products high. In India, the price of essential drugs is controlled by the
dependent on coal, which is characterised by a monopolistic situation in India.
Imports come with incidental transportation costs, import duties etc. The margins of
these companies therefore tend to be under pressure.
industry. Low rail freight rates ensure that road transporters cannot charge very
high freight rates.
the industry. Some industries like photography, consumer electronics and telecom
and music players face a threat from handsets. Switch from chemicals to digital
in photography caused huge problems for erstwhile leader, Kodak. Threat of new
According to Porter, three generic strategies are possible for companies:
or service provider in the industry. Several broking companies have adopted this
strategy in order to gain a larger share of the market. With this approach, the
company is able to build a business of scale.
that the customer values. Some of the foreign banks and wealth management
companies position themselves to offer a more customised service to clients.
58
an industry. This may limit the customer segment, but the company hopes to earn
high margins. In recent times, Bajaj Auto has adopted this strategy. The company
decided to close its traditional scooter business to focus on motor cycles (and three-
wheelers). Despite the focus, they hope to generate more volumes by serving the
global market, rather than limiting to India. The company hopes to be the most
Choice of generic strategy depends on the industry structure as well as the strengths
and weaknesses of the company concerned.
Another strategy guru, the late CK Prahalad came out with the concept of “bottom of
business.
The small shampoo sachets introduced in India led to several new consumers buying
shampoos. In fact this strategy became a differentiator for several new entrants to build
businesses of scale. Later, the larger FMCG companies too started small sachets. This
strategy was replicated in several other businesses, such as detergent, instant coffee
powder and mobile re-charge.
competitive advantage over a long period of time. Fundamental analysts evaluate the
suitability of the company’s strategy along these lines, before investing. This approach
has helped Warren Buffett, the legendary investor to hold on to his investments for
several years – in some cases, decades.
6.2 Top-Down or Bottom-up?
Many international investment institutions adopt an investment approach that allocates
investments along the following dimensions:
The allocations are revised from time to time, generally annually. At times, the allocations
This traditional approach to investment started in an era when such geographic spread
of investments helped minimise risks. Lately, however, it is seen that markets move
59
world.
Despite contagion, there are differences between markets. Even if they move in the
within each sector they select the best companies to have in the portfolio. This is called
a top-down approach, where the sectoral allocation becomes a key decision.
Other investors go for the best companies to have in the portfolio, independent of the
sector. This is called a bottom-up approach or stock-picking approach, where the sectoral
allocation is a result, rather than a decision. They may still have prudential sectoral
limits, but it is not a sectoral allocation based on their inter se prospects. Investors like
Warren Buffett and Peter Lynch are known for their bottom-up approach.
Some analysts reason that while top-down makes more sense in mature markets,
bottom-up is likely to yield better results in developing markets.
6.3 Technical Analysis
The discussions on equity so far, starting from Chapter 5 largely focused on factors
fundamental analysis. Legendary investors like Benjamin Graham, Warren Buffett and
Peter Lynch follow this discipline of investment.
An alternative approach to investments is technical analysis, where the analyst takes
discipline believes that market price captures the thought process of all investors in the
market. Based on this, views can be taken on future price behaviour – the direction it
will take and at what level it is likely to encounter a resistance or a support.
statements etc. Given a company’s technical chart, the technical analyst will have a view
that is independent of the industry to which the company belongs, its margin structure
etc. This makes it simple for many investors to adopt this approach.
The approach to take to investment decisions should depend on the investment
For long term investments, fundamental analysis has stood the test of time. However,

60
EPS will be available, monthly information on production and sales may be available –
but not daily information.
Price-Volume information, on the other hand, is generated every nano-second. This
becomes the heart of technical analysis. For an investor involved in day-trading – buying
support. Technical analysis is typically used in such cases.
Even a long term investor may use technical analysis. Fundamental analysis will help in
taking a decision on buying or selling. Implementation of the decision – the timing – can
be left to technical analysis.
61
Chapter 7 : Derivatives
7.1 Background
Derivative is a contract that derives its value from the value of an underlying.The
bearing security or a physical commodity. Depending on how the pay offs are structured,
it could be a forward, future, option or swap.
price), depending on how the price of the underlying moves. The option buyer pays
the option writer a premium for entering into the contract.
option contract are asymmetric. The downside for the option buyer is limited to the
contracts to sell an underlying.
payments, based on a notional principal. The payments may cover only interest, or
like equity.
derivatives is the leveraging. For the same outgo, it is possible to have a much higher
attractive for speculators and hedgers, besides normal investors.
In many derivative contracts, the concept of continuous compounding is used:
rn

62
where,
Rs. 5,000, continuously compounded at 6% for 3 months would be calculated to be
i.e. Rs. 5,075.57.
0.25
i.e. Rs. 5,073.37.
equation
Where, S is stock price, t is term of the option (time to maturity), r the risk free rate,
on a non-dividend paying stock are the roots of the differential equation, as follows:
Where,
2
neutral world, so that N(d2) is the strike price times the probability that the strike
price will be paid.
0N(d1)ert
T if ST
and is 0 otherwise in a risk neutral world. Here ST
is the strike price.
63
compounded returns on the underlying. When daily sigma is given, they need to be
Sigma annual = sigma daily
are 250 trading days in a year.
years.
It also becomes similar to a forward contract with a delivery price K. Thus the call -r T
As S becomes very large both N(d1) and N(d2) are both close to 1.0.
Similarly the put option price will be 0 as N(-d1) and N (-d2) will be close to 0.
1 and d2 1) and N(d2)
tend to 1.0 and the value of call option is:
-r T
-r T ,0).
The Black Scholes model uses continuous compounding.
Option traders seek to manage the Greeks in order to manage their overall portfolio.
to a small change in price of the underlying asset. Delta of an option, on the other
hand, is the rate of change of the option price with respect to price of the underlying
asset.
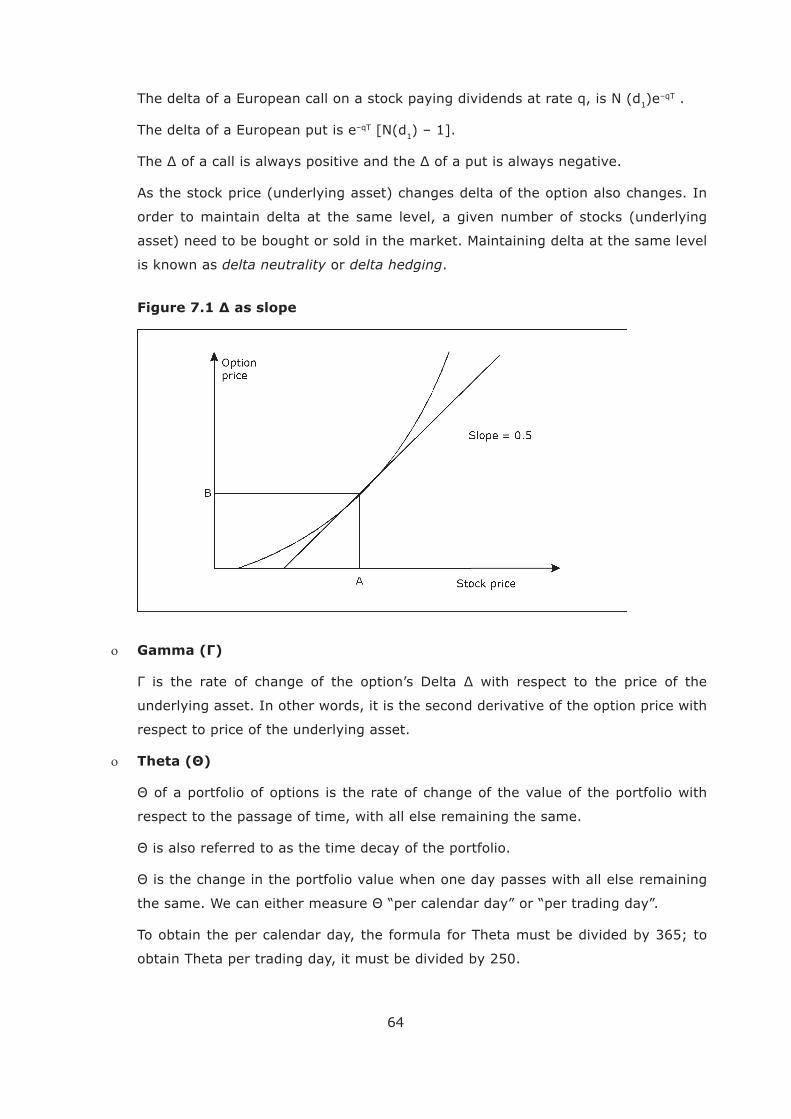
It is the slope of the curve that relates the option price to the price of the underlying
stock price changes by one, the option price changes by about 0.5, or 50% of the
change in the stock price.
Figure 7.1 shows the delta of a stock option.
64
The delta of a European call on a stock paying dividends at rate q, is N (d1)e–qT .
The delta of a European put is e–qT [N(d1
As the stock price (underlying asset) changes delta of the option also changes. In
order to maintain delta at the same level, a given number of stocks (underlying
asset) need to be bought or sold in the market. Maintaining delta at the same level
is known as delta neutrality or delta hedging.
underlying asset. In other words, it is the second derivative of the option price with
respect to price of the underlying asset.
respect to the passage of time, with all else remaining the same.
obtain Theta per trading day, it must be divided by 250.
65
Vega ( )
The vega of a portfolio of derivatives is the rate of change in the value of the portfolio
with respect to volatility of the underlying asset.
If it is high in absolute terms, the portfolio’s value is very sensitive to small
changes in volatility.
If it is low in absolute terms, volatility changes have relatively little impact on
the value of the portfolio.
respect to the interest rate. It measures the sensitivity of the value of a portfolio to
interest rates.
7.2 Interest Rate Futures
In India, interest rate futures are available with underlying in the short term (91-day
T-Bill) or long term (10 year Notional Government of India security bearing coupon of
7%). These are traded in the Currency Derivatives segment on NSE’s automated trading
systems, NEAT plus and NOW (NEAT on Web). The trades are settled through India’s only
settlement.
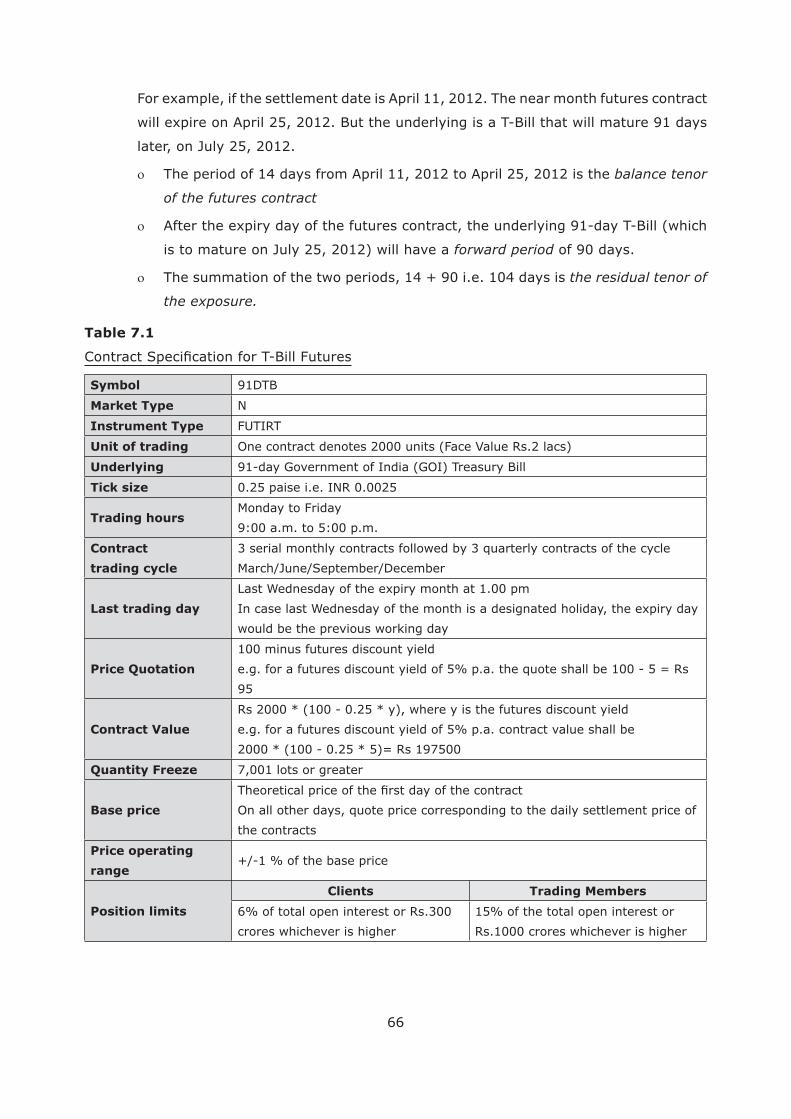
futures on the 91-day T-Bill. The
Rs. 200,000.
concerned month. In case the last Wednesday of the month is a designated holiday,
27, 2013.
66
later, on July 25, 2012.
The period of 14 days from April 11, 2012 to April 25, 2012 is the balance tenor
of the futures contract
is to mature on July 25, 2012) will have a forward period of 90 days.
the residual tenor of
the exposure.
Table 7.1
Symbol 91DTB
Market Type N
Instrument Type
Unit of trading One contract denotes 2000 units (Face Value Rs.2 lacs)
Underlying 91-day Government of India (GOI) Treasury Bill
Tick size 0.25 paise i.e. INR 0.0025
Trading hoursMonday to Friday
9:00 a.m. to 5:00 p.m.
Contract
trading cycle
3 serial monthly contracts followed by 3 quarterly contracts of the cycle
Last trading day
would be the previous working day
Price Quotation
100 minus futures discount yield
e.g. for a futures discount yield of 5% p.a. the quote shall be 100 - 5 = Rs
95
Contract Value
Rs 2000 * (100 - 0.25 * y), where y is the futures discount yield
e.g. for a futures discount yield of 5% p.a. contract value shall be
2000 * (100 - 0.25 * 5)= Rs 197500
Quantity Freeze 7,001 lots or greater
Base price On all other days, quote price corresponding to the daily settlement price of
the contracts
Price operating
range
Position limits
Clients Trading Members
6% of total open interest or Rs.300
crores whichever is higher
15% of the total open interest or
Rs.1000 crores whichever is higher
67
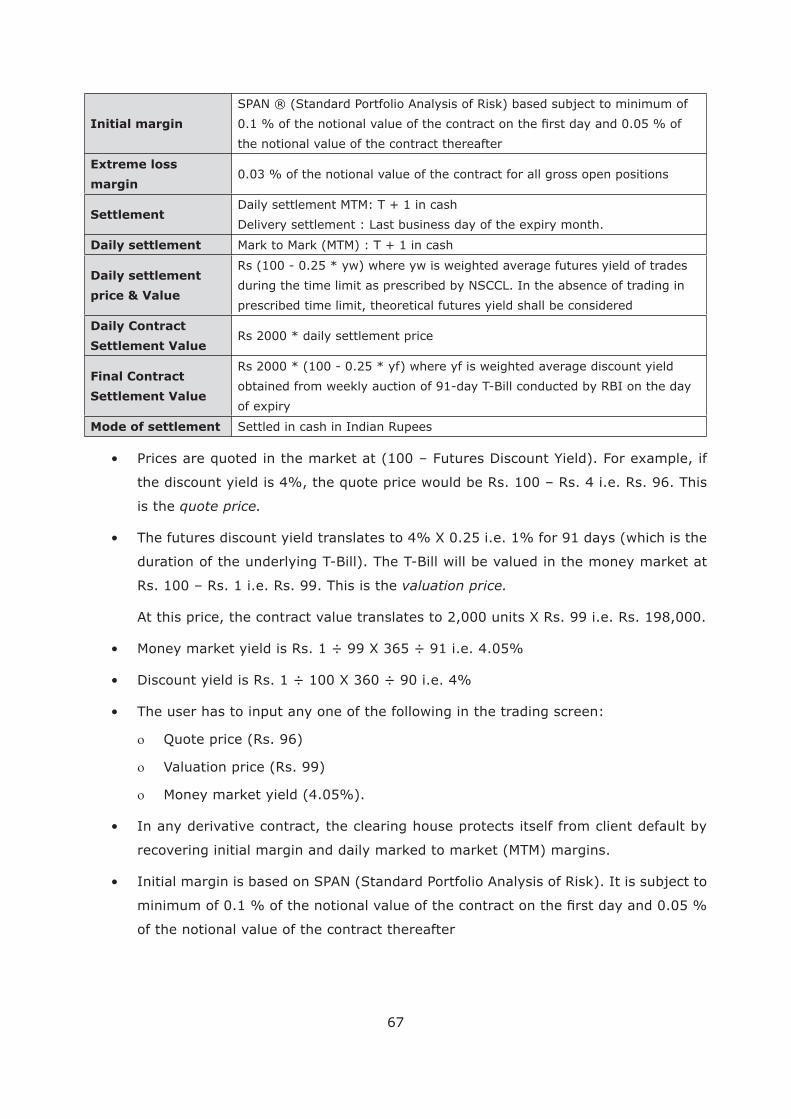
Initial margin
SPAN ® (Standard Portfolio Analysis of Risk) based subject to minimum of
the notional value of the contract thereafter
Extreme loss
margin0.03 % of the notional value of the contract for all gross open positions
Settlement
Daily settlement
Daily settlement
price & Value
Rs (100 - 0.25 * yw) where yw is weighted average futures yield of trades
during the time limit as prescribed by NSCCL. In the absence of trading in
prescribed time limit, theoretical futures yield shall be considered
Daily Contract
Settlement ValueRs 2000 * daily settlement price
Final Contract
Settlement Value
Rs 2000 * (100 - 0.25 * yf) where yf is weighted average discount yield
obtained from weekly auction of 91-day T-Bill conducted by RBI on the day
Mode of settlement Settled in cash in Indian Rupees
the discount yield is 4%, the quote price would be Rs. 100 – Rs. 4 i.e. Rs. 96. This
is the
duration of the underlying T-Bill). The T-Bill will be valued in the money market at
Rs. 100 – Rs. 1 i.e. Rs. 99. This is the valuation price.
Quote price (Rs. 96)
Valuation price (Rs. 99)
Money market yield (4.05%).
recovering initial margin and daily marked to market (MTM) margins.
of the notional value of the contract thereafter
68
of:
In the absence of adequate trades, theoretical futures yield is derived using T-Bill
Association of India (FIMMDA).
Based on this, yield for the forward period of 90 days is computed.
the daily MTM settlement price came to Rs. 99.25. The buyer of the futures contract
price is worked out on the basis of weighted average discount yield obtained from
price for the future. The buyer of the future has made a loss of (Rs. 99 – Rs. 98.95)
0.05 i.e. Rs. 100.
long.
Future on the 10 Year Government Security of 7% p.a. notional coupon, payable semi-
7.2. A few areas of difference:
for accrued interest.
69
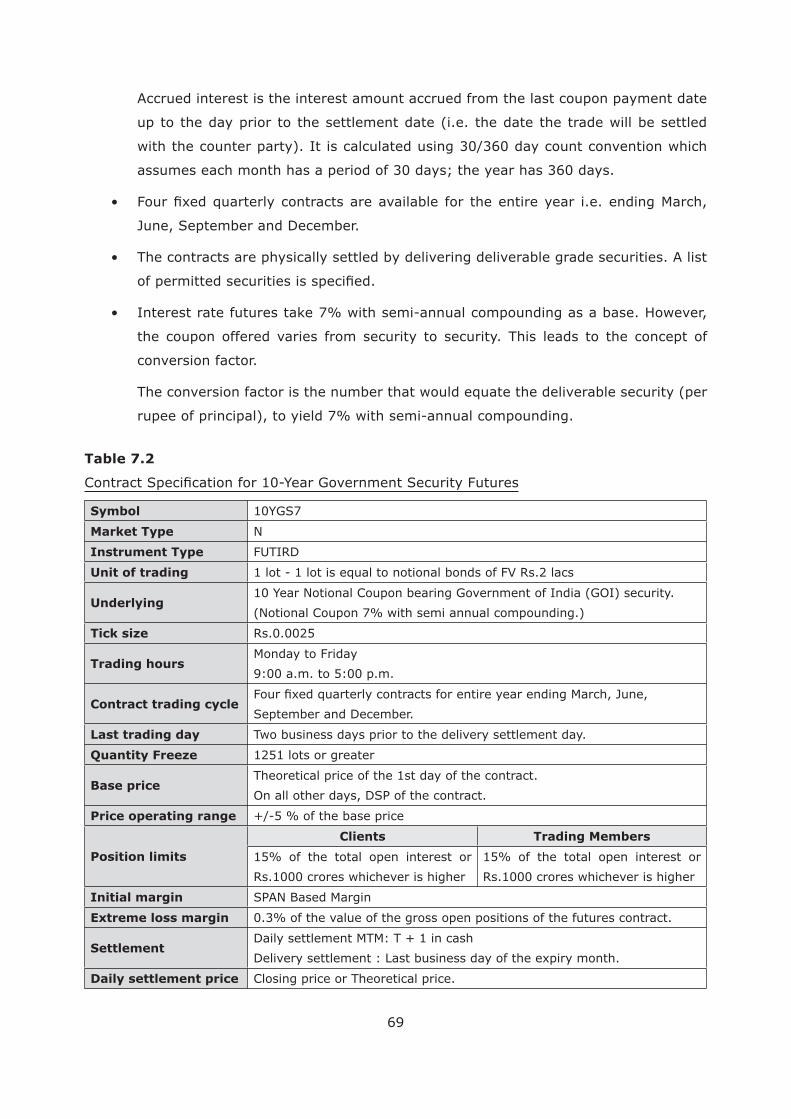
Accrued interest is the interest amount accrued from the last coupon payment date
up to the day prior to the settlement date (i.e. the date the trade will be settled
June, September and December.
the coupon offered varies from security to security. This leads to the concept of
conversion factor.
The conversion factor is the number that would equate the deliverable security (per
rupee of principal), to yield 7% with semi-annual compounding.
Table 7.2
Symbol 10YGS7
Market Type N
Instrument Type
Unit of trading 1 lot - 1 lot is equal to notional bonds of FV Rs.2 lacs
Underlying10 Year Notional Coupon bearing Government of India (GOI) security.
(Notional Coupon 7% with semi annual compounding.)
Tick size Rs.0.0025
Trading hoursMonday to Friday
9:00 a.m. to 5:00 p.m.
Contract trading cycleSeptember and December.
Last trading day Two business days prior to the delivery settlement day.
Quantity Freeze 1251 lots or greater
Base priceTheoretical price of the 1st day of the contract.
On all other days, DSP of the contract.
Price operating range
Position limits
Clients Trading Members
15% of the total open interest or
Rs.1000 crores whichever is higher
15% of the total open interest or
Rs.1000 crores whichever is higher
Initial margin SPAN Based Margin
Extreme loss margin 0.3% of the value of the gross open positions of the futures contract.
Settlement
Daily settlement price Closing price or Theoretical price.
70
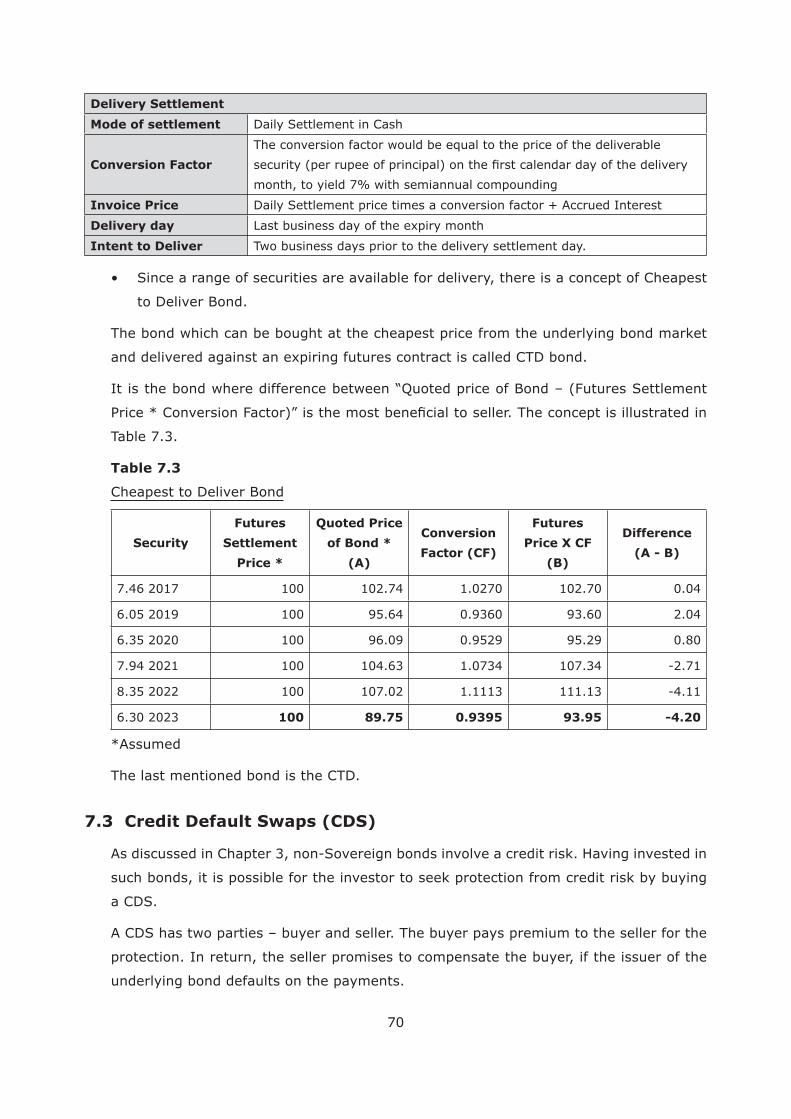
Delivery Settlement
Mode of settlement Daily Settlement in Cash
Conversion Factor
The conversion factor would be equal to the price of the deliverable
month, to yield 7% with semiannual compounding
Invoice Price
Delivery day
Intent to Deliver Two business days prior to the delivery settlement day.
to Deliver Bond.
The bond which can be bought at the cheapest price from the underlying bond market
It is the bond where difference between “Quoted price of Bond – (Futures Settlement
Table 7.3.
Table 7.3
Cheapest to Deliver Bond
Security
Futures
Settlement
Price *
Quoted Price
of Bond *
(A)
Conversion
Factor (CF)
Futures
Price X CF
(B)
Difference
(A - B)
7.46 2017 100 102.74 1.0270 102.70 0.04
6.05 2019 100 95.64 0.9360 93.60 2.04
6.35 2020 100 96.09 0.9529 95.29 0.80
7.94 2021 100 104.63 1.0734 107.34 -2.71
8.35 2022 100 107.02 1.1113 111.13 -4.11
6.30 2023 100 89.75 0.9395 93.95 -4.20
*Assumed
The last mentioned bond is the CTD.
7.3 Credit Default Swaps (CDS)
As discussed in Chapter 3, non-Sovereign bonds involve a credit risk. Having invested in
such bonds, it is possible for the investor to seek protection from credit risk by buying
a CDS.
A CDS has two parties – buyer and seller. The buyer pays premium to the seller for the
protection. In return, the seller promises to compensate the buyer, if the issuer of the
underlying bond defaults on the payments.
71
CDS issues without proper credit risk assessment led several CDS issuers to bankruptcy
in the developed markets in the last few years. RBI has therefore imposed a strict
regulatory regime for the product. The key regulations are as follows:
Users
Commercial Banks, Primary Dealers (PDs), Non-Banking Finance Companies
(NBFCs), Mutual Funds, Insurance Companies, Housing Finance Companies,
Provident Funds, Listed Corporates, Foreign Institutional Investors (FIIs) and
These entities are permitted to buy credit protection (buy CDS contracts) only
to hedge their underlying credit risk on corporate bonds.
Such entities are not permitted to hold credit protection without having eligible
underlying as a hedged item.
bought CDS positions by unwinding them with the original counterparty or by
assigning them in favour of buyer of the underlying bond.
Market Makers
permitted by the Reserve Bank.
Insurance companies and Mutual Funds would be permitted as market-makers
prescribed by their respective regulators (IRDA and SEBI) and as and when
permitted by the respective regulatory authorities.
are permitted to buy protection without having the underlying bond.
transaction.
case a market-maker fails to meet one or more of the eligibility criteria subsequent
to commencing the CDS transactions, it would not be eligible to sell new protection.
as per the contract.
72
called the reference entity. It should be a single legal resident entity [the term
obligation.
Listed corporate bonds
Such SPVs need to make disclosures on the structure, usage, purpose and
management.
limits and any other restriction imposed by the regulators from time to time.
held by them and for periods longer than the tenor of corporate bonds held by
them. They shall not, at any point of time, maintain naked CDS protection i.e. CDS
purchase position without having an eligible underlying.
entering into and unwinding the CDS contract, needs to ensure that the user has
contract.
counterparty or, in the event of sale of the underlying bond, by assigning (novating)
73
end his involvement in the transaction and credit risk will continue to lie with the
original protection seller.
grace period of ten business days from the date of sale of the underlying bond to
unwind the CDS position.
seller) is required to ensure that the protection buyer has the underlying at the time
of unwinding.
The protection seller should also ensure that the transaction is done at a transparent
market price and this must be subject to rigorous audit discipline.
or where the reference entity is a related party to either of the contracting parties.
Disclosures’.
entity which is a related party of the foreign bank, its parent, or group entity.
The identity of the parties responsible for determining whether a credit event
a resident and denominated in Indian Rupees.
The CDS contract has to be denominated and settled in Indian Rupees.
and deliverable obligations.
CDS cannot be written on interest receivables.
CDS cannot be written on securities with original maturity up to one year e.g.,
Debentures (NCDs) with original maturity up to one year.
The CDS contract must represent a direct claim on the protection seller.
74
that would allow the protection seller to unilaterally cancel the contract. However,
if protection buyer defaults under the terms of contract, protection seller can
The CDS contract should not have any clause that may prevent the protection
seller from making the credit event payment in a timely manner, after occurrence
of the credit event and completion of necessary formalities in terms of the
contract.
The protection seller shall have no recourse to the protection buyer for credit-
event losses.
is not permitted.
Dealing in any derivative product where the CDS itself is an underlying is not
permissible.
terms of coupon, coupon payment dates, etc. will be as put in place by FIMMDA in
consultation with the market participants.
approved under Board for Industrial and Financial Reconstruction (BIFR) and
Corporate Debt Restructuring (CDR) mechanism and corporate bond restructuring.
The contracting parties to a CDS may include all or any of the approved credit
events.
bilateral Master Agreement.
has a key role. The DC, based in India, has to deliberate and resolve CDS related
issues such as Credit Events, CDS Auctions, Succession Events, Substitute Reference
Obligations, etc.
At least 25 per cent of the members should be drawn from the users.
The decisions of the Committee are binding on CDS market participants.
occurrence of a credit event and document the same in the CDS documentation.
75
For transactions involving users, physical settlement is mandatory.
For other transactions, market-makers can opt for any of the three settlement
methods (physical, cash and auction), provided the CDS documentation envisages
such settlement.
cash settlement, the protection seller would pay to the protection buyer an amount
equivalent to the loss resulting from the credit event of the reference entity.
obligations, etc.) will be set by the DC on a case by case basis.
If parties do not select Auction Settlement, they will need to bilaterally settle their
trades in accordance with the Settlement Method (unless otherwise freshly negotiated
between the parties).
by the Institute of Chartered Accountants of India (ICAI).
positions. However, if a proprietary model results in a more conservative valuation,
the market participant can use that proprietary model.
in accounting statements have to disclose both the proprietary model price and the
of the rationale behind using a particular model over another.
while dealing with users.
CDS transactions must be conducted in a transparent manner in relation to prices,
market practices etc.
From the protection buyer’s side, it would be appropriate that the senior management
is involved in transactions to ensure checks and balances. Protection sellers need to
ensure:
CDS transactions are undertaken only on obtaining from the counterparty, a copy
of a resolution passed by their Board of Directors, authorising the counterparty
to transact in CDS.
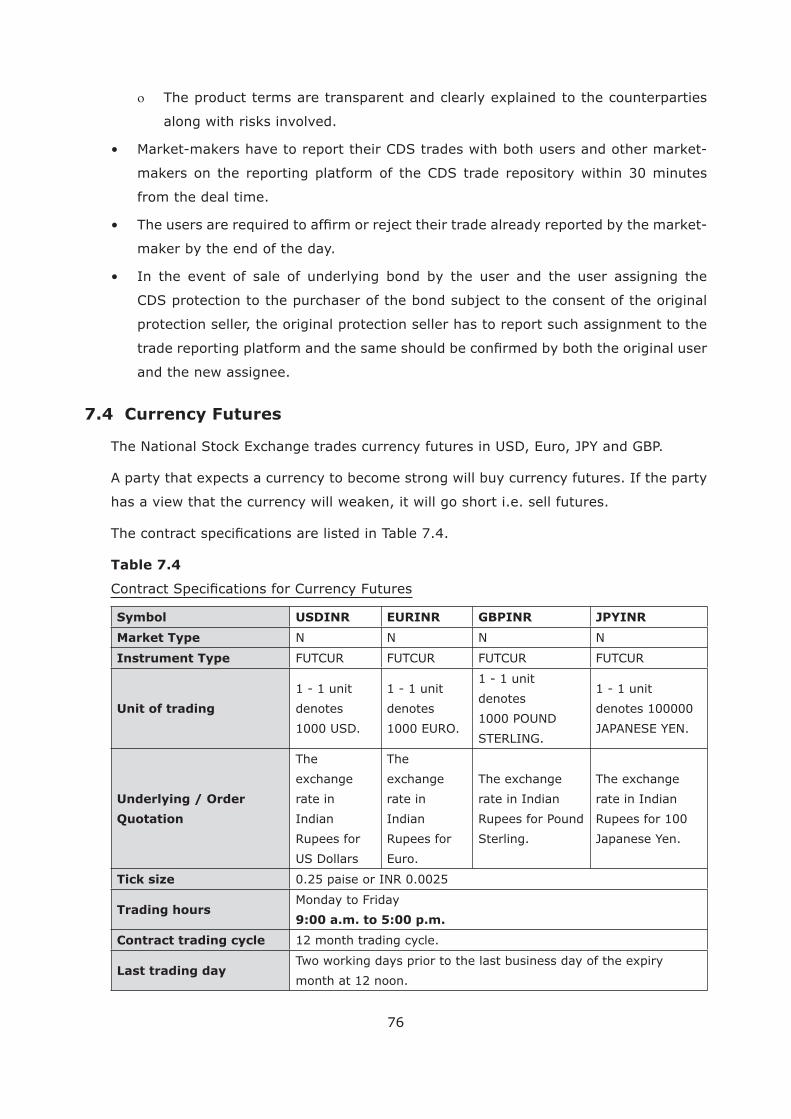
76
along with risks involved.
makers on the reporting platform of the CDS trade repository within 30 minutes
from the deal time.
maker by the end of the day.
CDS protection to the purchaser of the bond subject to the consent of the original
protection seller, the original protection seller has to report such assignment to the
and the new assignee.
7.4 Currency Futures
has a view that the currency will weaken, it will go short i.e. sell futures.
Table 7.4
Symbol USDINR EURINR GBPINR JPYINR
Market Type N N N N
Instrument Type
Unit of trading
1 - 1 unit
denotes
1 - 1 unit
denotes
1 - 1 unit
denotes
STERLING.
1 - 1 unit
denotes 100000
JAPANESE YEN.
Underlying / Order
Quotation
The
rate in
Indian
Rupees for
The
rate in
Indian
Rupees for
Euro.
rate in Indian
Rupees for Pound
Sterling.
rate in Indian
Rupees for 100
Japanese Yen.
Tick size 0.25 paise or INR 0.0025
Trading hoursMonday to Friday
9:00 a.m. to 5:00 p.m.
Contract trading cycle 12 month trading cycle.
Last trading daymonth at 12 noon.
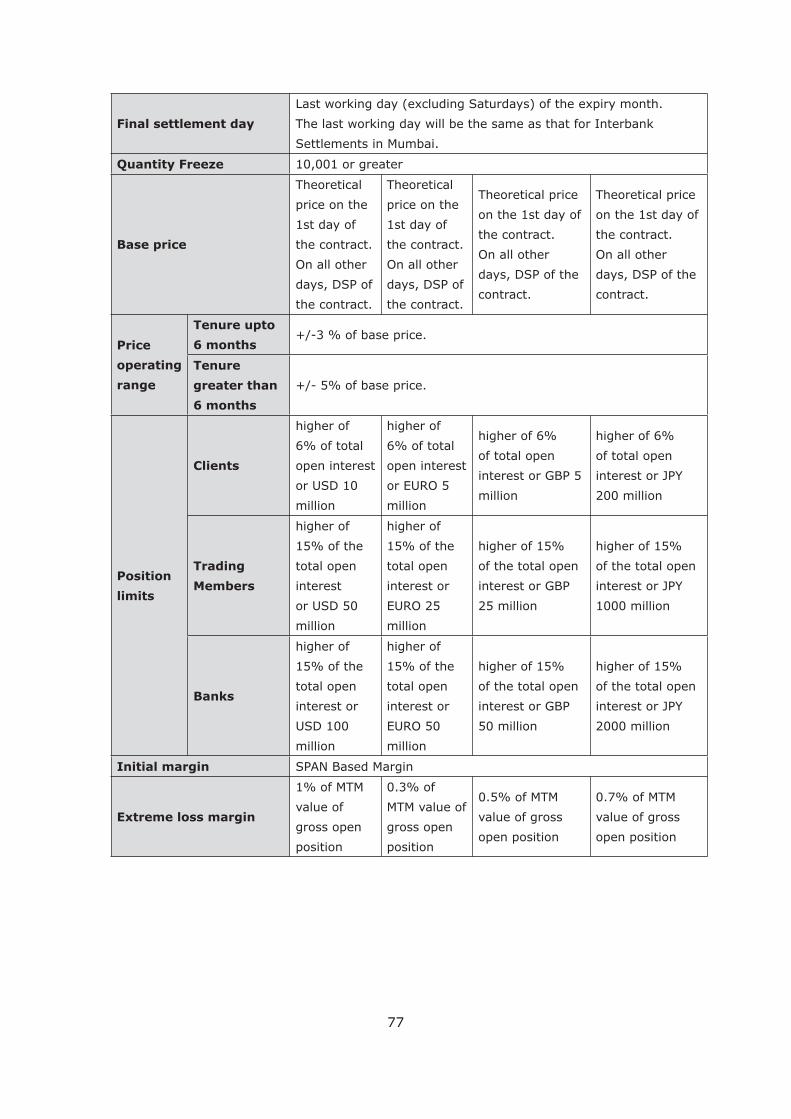
77
Final settlement day The last working day will be the same as that for Interbank
Settlements in Mumbai.
Quantity Freeze 10,001 or greater
Base price
Theoretical
price on the
1st day of
the contract.
On all other
days, DSP of
the contract.
Theoretical
price on the
1st day of
the contract.
On all other
days, DSP of
the contract.
Theoretical price
on the 1st day of
the contract.
On all other
days, DSP of the
contract.
Theoretical price
on the 1st day of
the contract.
On all other
days, DSP of the
contract.
Price
operating
range
Tenure upto
6 months
Tenure
greater than
6 months
Position
limits
Clients
higher of
6% of total
open interest
million
higher of
6% of total
open interest
million
higher of 6%
of total open
interest or GBP 5
million
higher of 6%
of total open
interest or JPY
200 million
Trading
Members
higher of
15% of the
total open
interest
million
higher of
15% of the
total open
interest or
million
higher of 15%
of the total open
interest or GBP
25 million
higher of 15%
of the total open
interest or JPY
1000 million
Banks
higher of
15% of the
total open
interest or
million
higher of
15% of the
total open
interest or
million
higher of 15%
of the total open
interest or GBP
50 million
higher of 15%
of the total open
interest or JPY
2000 million
Initial margin SPAN Based Margin
Extreme loss margin
1% of MTM
value of
gross open
position
0.3% of
MTM value of
gross open
position
0.5% of MTM
value of gross
open position
0.7% of MTM
value of gross
open position
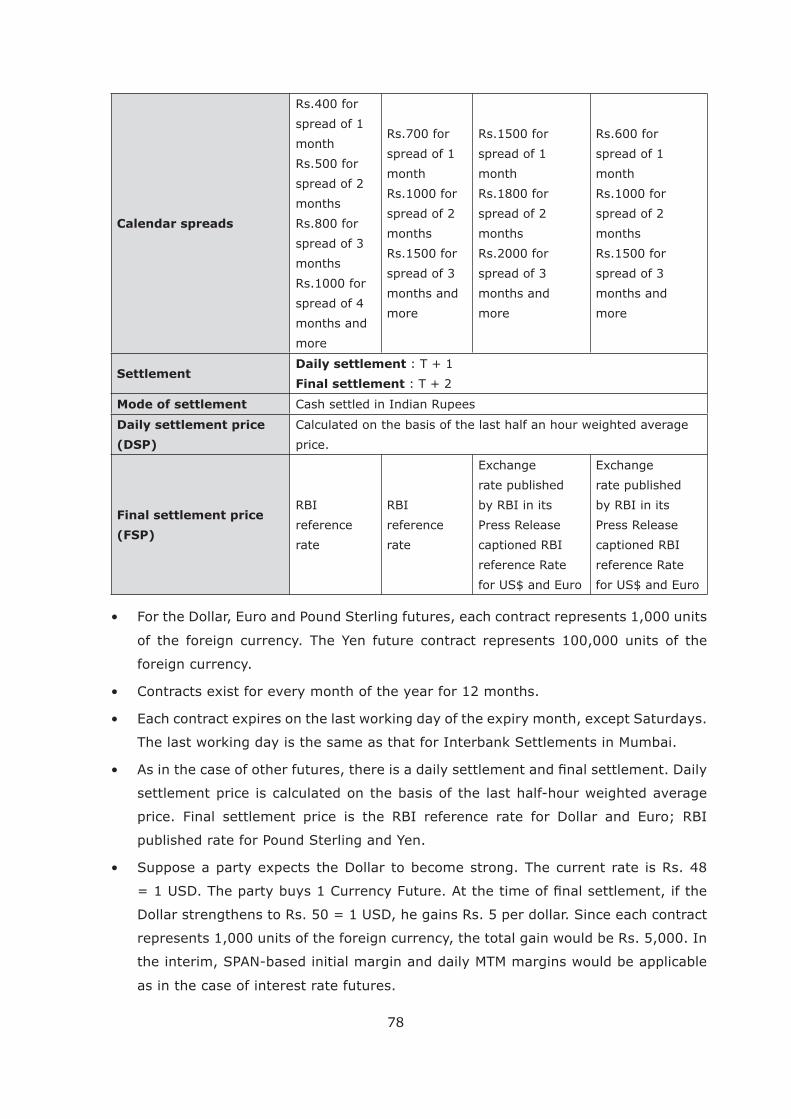
78
Calendar spreads
Rs.400 for
spread of 1
month
Rs.500 for
spread of 2
months
Rs.800 for
spread of 3
months
Rs.1000 for
spread of 4
months and
more
Rs.700 for
spread of 1
month
Rs.1000 for
spread of 2
months
Rs.1500 for
spread of 3
months and
more
Rs.1500 for
spread of 1
month
Rs.1800 for
spread of 2
months
Rs.2000 for
spread of 3
months and
more
Rs.600 for
spread of 1
month
Rs.1000 for
spread of 2
months
Rs.1500 for
spread of 3
months and
more
SettlementDaily settlement
Final settlement
Mode of settlement Cash settled in Indian Rupees
Daily settlement price
(DSP)
Calculated on the basis of the last half an hour weighted average
price.
Final settlement price
(FSP)
RBI
reference
rate
RBI
reference
rate
rate published
by RBI in its
Press Release
captioned RBI
reference Rate
rate published
by RBI in its
Press Release
captioned RBI
reference Rate
of the foreign currency. The Yen future contract represents 100,000 units of the
foreign currency.
The last working day is the same as that for Interbank Settlements in Mumbai.
settlement price is calculated on the basis of the last half-hour weighted average
published rate for Pound Sterling and Yen.
represents 1,000 units of the foreign currency, the total gain would be Rs. 5,000. In
the interim, SPAN-based initial margin and daily MTM margins would be applicable
as in the case of interest rate futures.
79
7.5 Currency Options
In India, currency options are only available on the Dollar-Rupee. These are structured
Each unit of the contract represents 1,000 units of the Dollar.
Three serial monthly contracts are available, followed by one quarterly contract of the
The strike price intervals are of Rs. 0.25 i.e. contracts would be available for a strike
price of Rs.45.00, Rs. 45.25, Rs. 45.50 etc.
A call option is said to be in the money, if the strike price is less than the prevailing
it is out of the money, if the strike price is more than the prevailing market price.
A put option is said to be in the money, if the strike price is more than the prevailing
it is out of the money, if the strike price is less than the prevailing market price.
At any time, at least 12 in the money call option contracts, 12 out of the money call
12 = 25. Similarly, at least 25 put option contracts are available.
Since only the option seller (in both call and put options) has a downside, margins
(span-based initial and MTM daily) are collected only from the option seller. Option buyer
pays only the premium to the option seller. The premium is denominated in rupees.
In a futures contract, the futures price goes up or down depending on the price of the
underlying. However, in an options contract, it is the option premium that goes up or
down depending on the market conditions.
working day is the same as that for Interbank Settlements in Mumbai.
The contracts are cash-settled in Indian rupees.
settlement price and assigned on a random basis to the open short positions of the same
strike and series.
Suppose a party buys a call option on the Dollar with a strike price of Rs. 50, paying a
the option writer.
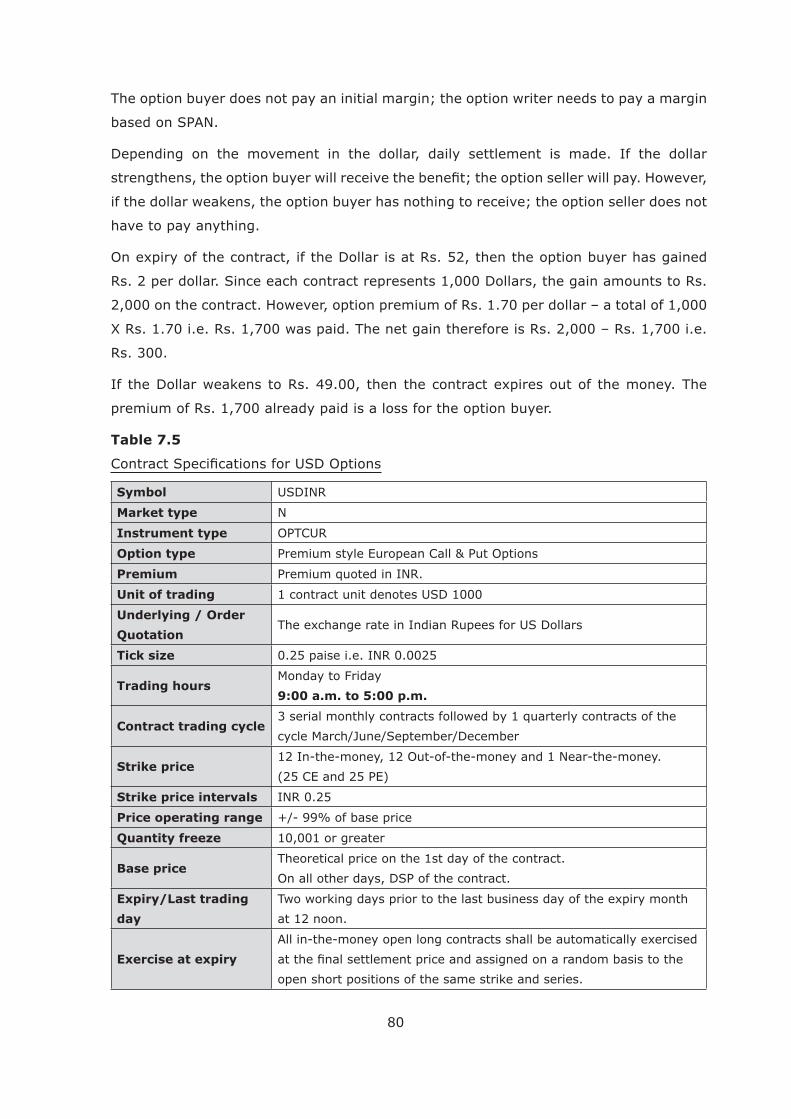
80
based on SPAN.
Depending on the movement in the dollar, daily settlement is made. If the dollar
have to pay anything.
Rs. 2 per dollar. Since each contract represents 1,000 Dollars, the gain amounts to Rs.
2,000 on the contract. However, option premium of Rs. 1.70 per dollar – a total of 1,000
Rs. 300.
premium of Rs. 1,700 already paid is a loss for the option buyer.
Table 7.5
Symbol
Market type N
Instrument type
Option type
Premium Premium quoted in INR.
Unit of trading
Underlying / Order
Quotation
Tick size 0.25 paise i.e. INR 0.0025
Trading hoursMonday to Friday
9:00 a.m. to 5:00 p.m.
Contract trading cycle3 serial monthly contracts followed by 1 quarterly contracts of the
Strike price12 In-the-money, 12 Out-of-the-money and 1 Near-the-money.
(25 CE and 25 PE)
Strike price intervals INR 0.25
Price operating range
Quantity freeze 10,001 or greater
Base priceTheoretical price on the 1st day of the contract.
On all other days, DSP of the contract.
Expiry/Last trading
day at 12 noon.
Exercise at expiry
open short positions of the same strike and series.
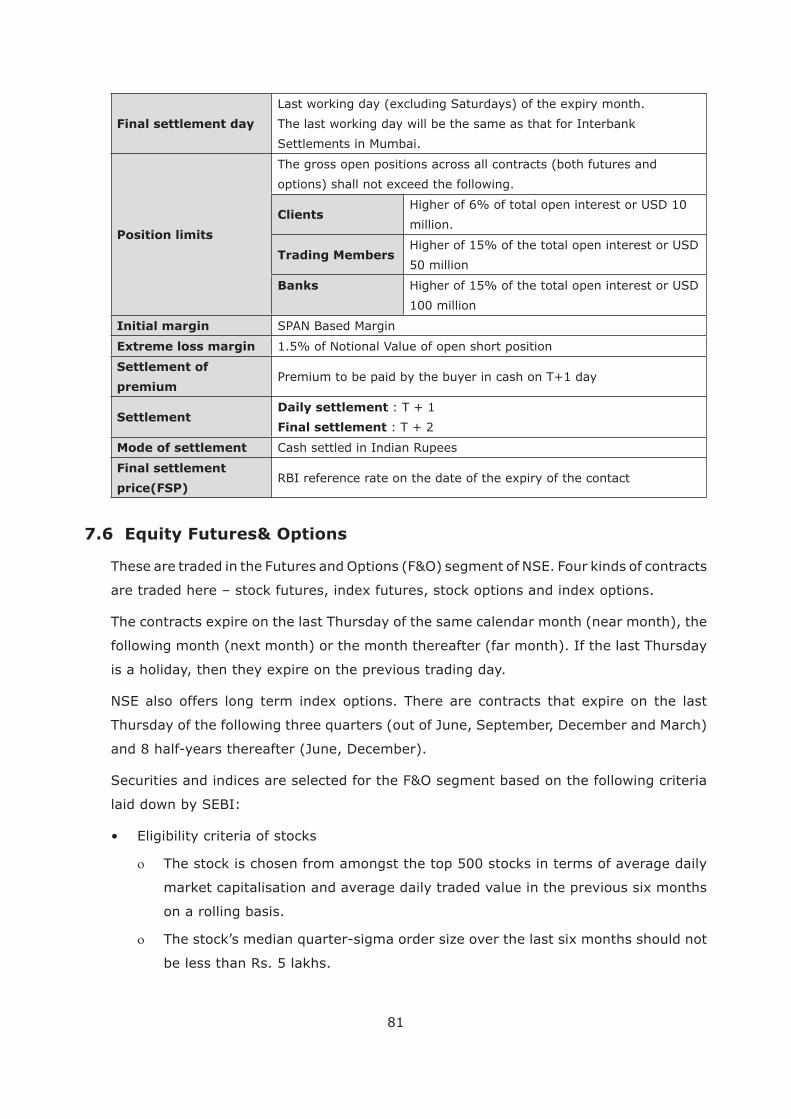
81
Final settlement day The last working day will be the same as that for Interbank
Settlements in Mumbai.
Position limits
The gross open positions across all contracts (both futures and
Clientsmillion.
Trading Members50 million
Banks
100 million
Initial margin SPAN Based Margin
Extreme loss margin 1.5% of Notional Value of open short position
Settlement of
premium
SettlementDaily settlement
Final settlement
Mode of settlement Cash settled in Indian Rupees
Final settlement
price(FSP)
7.6 Equity Futures& Options
Thursday of the following three quarters (out of June, September, December and March)
and 8 half-years thereafter (June, December).
laid down by SEBI:
The stock is chosen from amongst the top 500 stocks in terms of average daily
on a rolling basis.
be less than Rs. 5 lakhs.
82
required to cause a change in the stock price equal to one-quarter of a
standard deviation.
The market wide position limit in the stock is not less than Rs. 100 crores.
The market wide position limit (number of shares) is valued taking the
of contract in the month.
stock) on futures and option contracts on a particular underlying stock is 20% of
the number of shares held by non-promoters in the relevant underlying security i.e.
position limit in the stock shall not be less than Rs. 60 crores and stock’s median
lakhs.
consecutively, then no fresh month contract shall be issued on that security.
part of the month consistently for three monthsis also phased out from trading
re-inclusion for a period of one year.
three consecutive months to be re-introduced for derivatives trading.
80% of the
index constituents are individually eligible for derivatives trading. Further, no
comply with the eligibility criteria on a continuous basis.
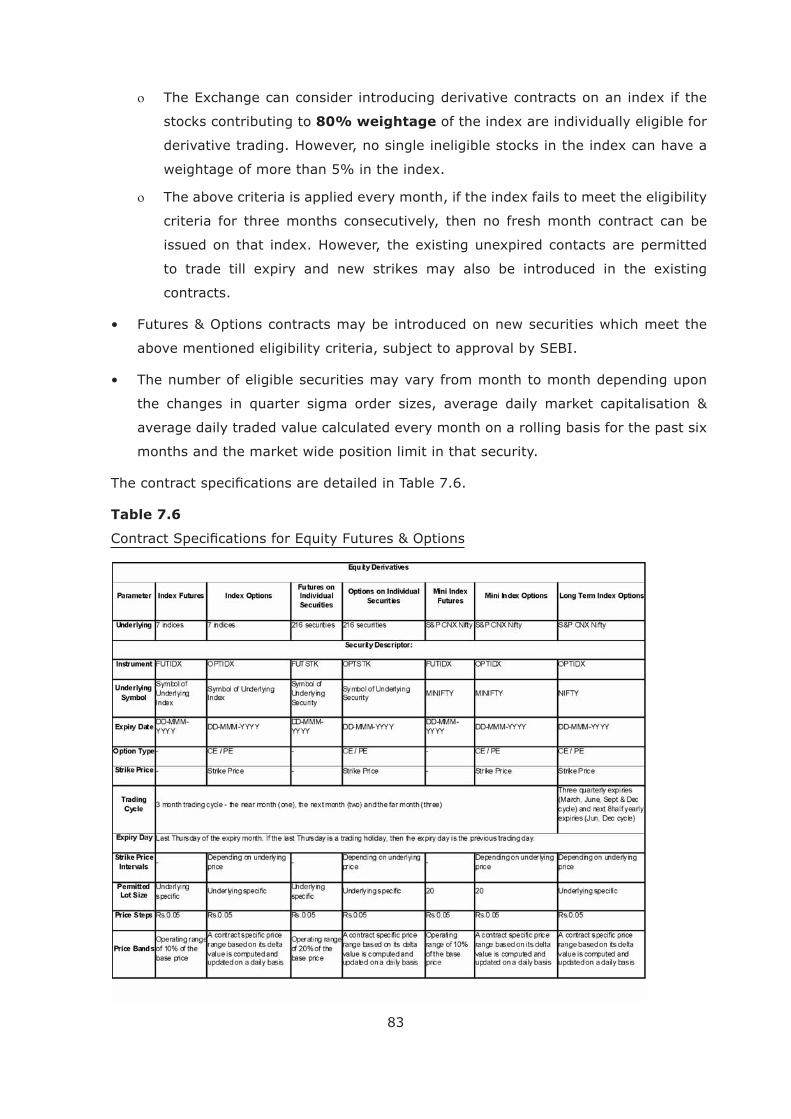
83
stocks contributing to 80% weightage
criteria for three months consecutively, then no fresh month contract can be
contracts.
above mentioned eligibility criteria, subject to approval by SEBI.
months and the market wide position limit in that security.
Table 7.6
84
The minimum contract value is Rs. 2 lakh for regular derivatives and Rs. 1 lakh for mini
funding cost.
Let us consider some illustrations:
April 12, 2012. If the discrete cost of carry is 8.89%, at what price is the underlying
quoting?
t, based on discrete discounting
F, the futures price is Rs. 2,218.80
r is 8.89%
t is (14 ÷ 365) years
t
i.e. Rs. 2,211.55 per share.
go to the investor holding the underlying – not to the buyer of the futures contract.
Therefore, the present value of the dividend needs to be subtracted from the spot
price, to arrive at the futures price (or added to the futures price to arrive at the spot
price).
present value is given by
The resulting value gets rounded off to Rs. 1.50.
i.e. Rs. 2,210.05 per share.
85
of the long futures position already taken on April 12, 2012?
On April 20, 2012, the revised value of t is (6 ÷ 365) years
The present value of the dividend, now receivable on the share in a shorter period
of 5 days, continues to be Rs. 1.50
The long position was taken at a futures price of Rs. 2,218.80. Its value on April 20, (6 ÷ 365)
i.e. Rs. 2,215.70
The value of the position on April 20, 2012 therefore would be Rs. 2,250 – Rs. 1.50
– Rs. 2,215.70
i.e. Rs. 32.80 per share.
This is to be multiplied by the contract multiplier (for SBI) to arrive at the value of
the contract.
The share has become more valuable by Rs. 2,250 – Rs. 2,210.05 i.e. Rs. 39.95. The
futures position however became more valuable by Rs. 32.80 per share.
The assumption here was that cost of carry remained at 8.89%. If that had increased,
then the value of the futures position would have been higher than Rs. 32.80.
April 26, 2012?
rt
e = 2.71828
r = 5.82% (continuously compounded)
t = (14 ÷ 365) years
The Futures price can thus be calculated as
i.e. 5,378.05
The only change is that (r – dividend yield) is to be used, instead of r in the above
formula.
The Futures price can thus be calculated as
i.e. 5,355.10
86
Chapter 8 : Alternate Assets & Structured Products
8.1 Alternate Assets
The discussions so far covered debt and equity as asset classes. These are the main
components of most portfolios. Other asset classes are referred to as alternate assets.
gold and real estate are important asset classes.
8.1.1 Gold
jewellery.
The international price of gold, translated into Indian rupees, with the addition of
transportation costs and import duties gives the value in Indian rupees. Thus, local
gold prices go up, not only when international prices go up, but also if the rupee
becomes weak.
Gains are treated as long-term if the holding is for more than 1 year (3 years for
physical gold and real estate)
period required to qualify as long term capital gains:
87
8.1.2 Real Estate
Real estate is a growth asset that is less volatile than equities. In India, it does offer
decent returns over long periods of time. Regular returns in the form of rentals can also
property.
re-invested.
Some of the issues with real estate are:
8.2 Structured Products
through mutual fund kind of vehicles.
costs, disclosure, governance etc. Over the last few years, high net worth investors have
been offered structured products. These are pass through hybrid products outside the
mutual fund structure. The product is sold to investors on the promise of yield linked to
Suppose it is a 5-year principal protected scheme, offered at a time when sovereign 5 i.e.
This takes care of the principal protection. The balance amount, Rs. 100 – Rs. 68.04 i.e.
Rs. 31.96, is invested in risky assets. Part of the upside on this goes to the investors,
An investor who wants only 80% of the principal protected can have a larger allocation
88
risky assets do not perform, then a loss upto 20% can come up (80% of the principal
being protected).
desired).
8.2.1 Portfolio Insurance
Portfolio insurance models seek to limit the losses of investors, while giving them an
upside. Many of these models are based on OBPI or CPPI.
as the market goes up, the risky assets will gain value. If the market goes down, the
risky assets. In a CPPI, the allocation changes dynamically over time, depending on
how the asset classes perform.
8.2.2 Risks
Models have their inbuilt assumptions – and ranges over which they perform as
desired. These are not always intelligible to the lay investor. Often, issuers use
assess all risks in the investment.
Principal protection, if available, is only on maturity. During the tenor of the
Even if the investment pool makes money, payment is still subject to credit risk of
the issuer.
Structured products are sold privately to high net worth investors. Even if these are
listed, they may not be traded. Therefore, liquidity can be an issue.
89
Although SEBI recently came out with various information requirements, the
transparency and disclosure standards are weaker than in the case of mutual
funds.
8.2.3 SEBI Regulations
All securities that have an in-built principal component in the form of debt securities and
comply with the following regulations:
applicable for issue and listing of debt securities.
net worth of at least Rs. 100crore.
Rs.10lakh in any issue.
showing value of the security under different market conditions such as rising, stable
and falling market conditions. The disclosure has to be in the form of a table along
with a suitable graphic representation.
the returns predicted by the mathematical models.
Protected Market Linked Debentures, the principal amount is subject to the credit
risk of the issuer whereby the investor may or may not recover all or part of the
funds in case of default by the issuer.
90
for such securities will be made available on the websites of the issuer and of the
valuer appointed for the purpose.
offer document.
disclosed in the offer document.
a credit rating agency registered with SEBI.
This valuer has to publicly publish on its website and provide to the issuer, the
value of the securities at a frequency which is not less than once in a calendar
week.
Also, the issuer has to arrange to provideto an investor the value whenever
investor asks for it.
The cost incurred for valuation is to be disclosed in the offer document. At no
point in time can the issuer charge the investor for such services.
The issuer has to make the valuations available on its website.
safeguards:
The intermediary who sells the security to the retail investor has to be a SEBI
regulated entity.
The intermediary has to ensure that investor understands the risks involved,
is capable of taking the risk posed by such securities and satisfy itself, that
The intermediary has to provide to the investor the offer document, whether or
The intermediary has to provide the investor guidance on obtaining valuation
for the securities, i.e., the locations where such information would be available
(issuer or the third party).
the secondary market.
Yet, investors need to be careful while investing in such products.
91
Chapter 9 : International Markets
9.1 Depository Receipts
Depository Receipts (DRs) help in attracting international investors. Suppose an Indian
company wishes to mobilise money from investors abroad. There are two possible
structures:
secondary market purchase) or remit to the company (if it is a primary issue).
to the foreign currency for repatriation.
Investment restrictions of the Indian regulators will need to be complied with.
underlying shares in the Indian company. The DRs are listed in an international
different from their intrinsic worth, derived from the value of the underlying and the
When the converted shares can be re-converted into DRs, it is called “reverse
the price of DR abroad, and the DR’s intrinsic worth.
called GDRs (Global Depository Receipts).
are called IDRs (Indian Depository Receipts).
A typical DR issue goes through the following steps:
Based on this, it decides on the allotments.
92
received and the investors to whom it belongs.
those investments.
9.2 International Stock Indices
some of the leading international stock indices.
1 S&P 500 Index (SPX)
changes in the aggregate market value of 500 stocks representing all major industries.
43 base period.
2 Dow Jones Industrial Average (INDU)
The Dow Jones Industrial Average is a price-weighted average of 30 blue-chip stocks
that are generally the leaders in their industry. It has been a widely followed indicator
of the stock market since October 1, 1928.
stock market. It comprises mainly of blue chip stocks having leadership position in the
market.
3 NASDAQ Composite Index (CCMP)
was developed with a base level of 100 as of February 5, 1971.
4 EURO STOXX 50 Price Eur (SX5E)
93
5 FTSE 100 (UKX)
as of January 3, 1984.
6 Deutsche Borse AG German Stock Index DAX (DAX)
7 Nikkei 225 (NKY)
The Nikkei-225 Stock Average is a price-weighted average of 225 top-rated Japanese
8 Tokyo Stock Exchange Tokyo Price Index TOPIX (TPX)
January 4, 1968.
9 Hong Kong Hang Seng Index (HSI)
9.3 Feeder Funds
An Indian investor desirous of investing abroad can invest directly in the international
shares or mutual funds (subject to regulations of India and the foreign country). This
however gets cumbersome because:
country.
94
transaction.
and other risks of that country.
will need to be converted to Indian rupees and brought back to the country.
Some mutual funds make it convenient for domestic investors to invest abroad, through
The feeder fund in turn invests in a mutual fund scheme (host scheme) abroad. Thus,
the task of foreign currency conversions, compliance with international regulations,
counter party.
9.4 Trading in Global Markets through NSE
9.4.1 Futures & Options
in derivatives where certain foreign indices are the underlying. The investor does not
traded during Indian trading hours and are subject to Indian regulation.
purposes for investors:
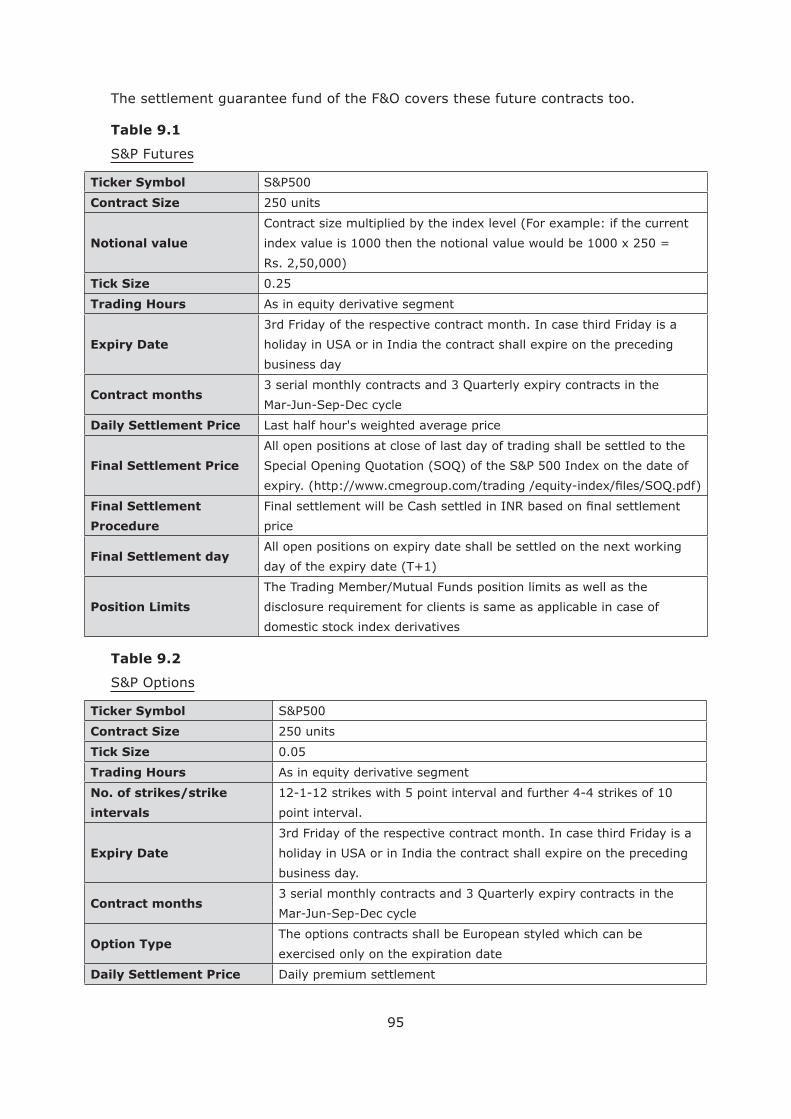
95
Table 9.1
Ticker Symbol
Contract Size 250 units
Notional value
Rs. 2,50,000)
Tick Size 0.25
Trading Hours As in equity derivative segment
Expiry Date
3rd Friday of the respective contract month. In case third Friday is a
business day
Contract monthsMar-Jun-Sep-Dec cycle
Daily Settlement Price Last half hour's weighted average price
Final Settlement Price
All open positions at close of last day of trading shall be settled to the
Final Settlement
Procedure price
Final Settlement day
Position Limits disclosure requirement for clients is same as applicable in case of
Table 9.2
Ticker Symbol
Contract Size 250 units
Tick Size 0.05
Trading Hours As in equity derivative segment
No. of strikes/strike
intervals
12-1-12 strikes with 5 point interval and further 4-4 strikes of 10
point interval.
Expiry Date
3rd Friday of the respective contract month. In case third Friday is a
business day.
Contract monthsMar-Jun-Sep-Dec cycle
Option TypeThe options contracts shall be European styled which can be
Daily Settlement Price Daily premium settlement
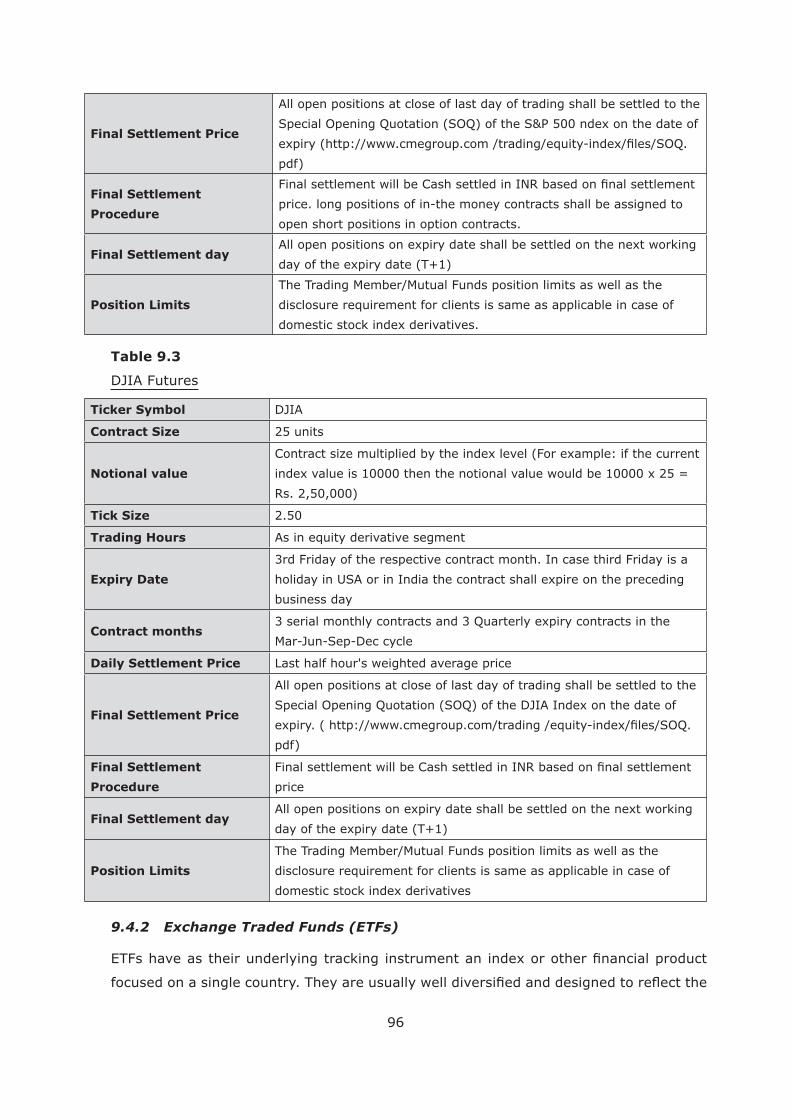
96
Final Settlement Price
All open positions at close of last day of trading shall be settled to the
pdf)
Final Settlement
Procedureprice. long positions of in-the money contracts shall be assigned to
open short positions in option contracts.
Final Settlement day
Position Limits disclosure requirement for clients is same as applicable in case of
Table 9.3
DJIA Futures
Ticker Symbol DJIA
Contract Size 25 units
Notional value
Rs. 2,50,000)
Tick Size 2.50
Trading Hours As in equity derivative segment
Expiry Date
3rd Friday of the respective contract month. In case third Friday is a
business day
Contract monthsMar-Jun-Sep-Dec cycle
Daily Settlement Price Last half hour's weighted average price
Final Settlement Price
All open positions at close of last day of trading shall be settled to the
pdf)
Final Settlement
Procedure price
Final Settlement day
Position Limits disclosure requirement for clients is same as applicable in case of
9.4.2 Exchange Traded Funds (ETFs)
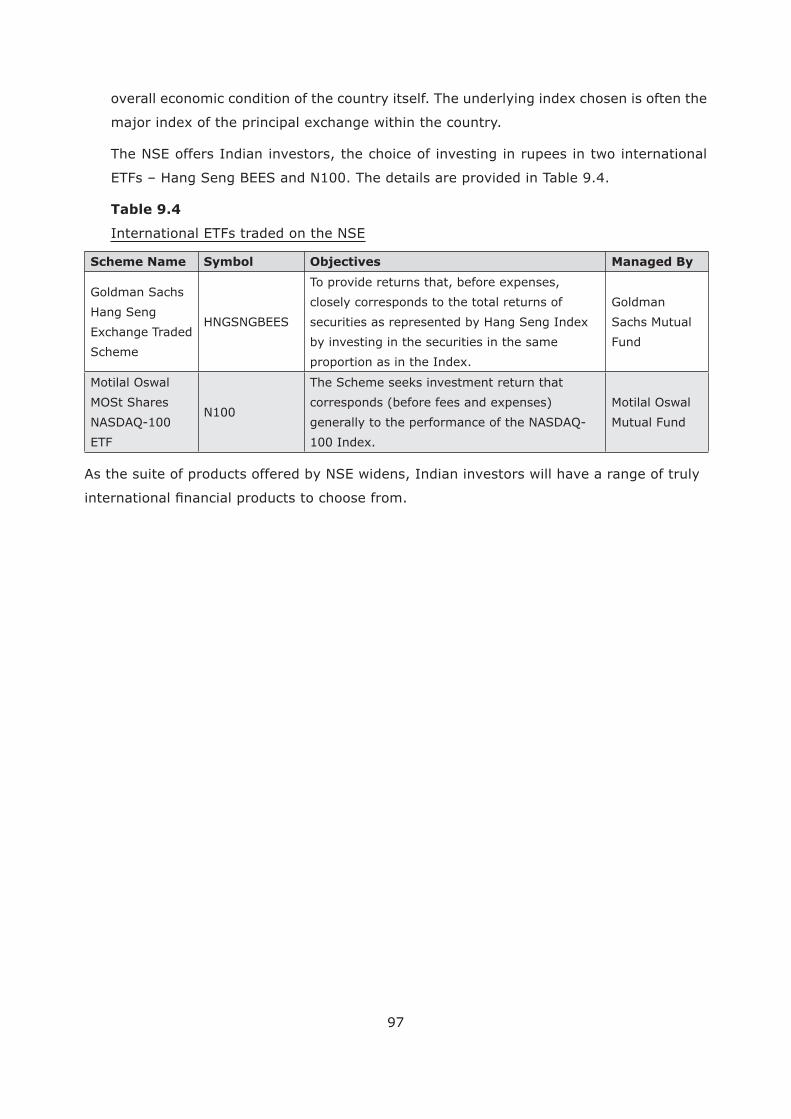
97
The NSE offers Indian investors, the choice of investing in rupees in two international
ETFs – Hang Seng BEES and N100. The details are provided in Table 9.4.
Table 9.4
International ETFs traded on the NSE
Scheme Name Symbol Objectives Managed By
Goldman Sachs
Hang Seng
Scheme
HNGSNGBEES
closely corresponds to the total returns of
by investing in the securities in the same
Goldman
Sachs Mutual
Fund
Motilal Oswal
MOSt Shares
NASDAQ-100
ETF
N100
The Scheme seeks investment return that
generally to the performance of the NASDAQ-
Motilal Oswal
Mutual Fund
As the suite of products offered by NSE widens, Indian investors will have a range of truly
98
Chapter 10 : New Paradigms in Regulation of Financial Markets
10.1 Market Infrastructure Institutions
as securities Market Infrastructure Institutions (MIIs). SEBI constituted a Committee
under the Chairmanship of Dr. Bimal Jalan, (Former Governor, Reserve Bank of India) to
asked to make its recommendations on the following issues:
The committee submitted its report in November 2010. It took the view that MIIs
constitute the nucleus of capital allocation system and are indispensable for economic
could lead to even bigger cataclysmic collapses that may result in an overall economic
country. Therefore, such MIIs are considered systemically important institutions. The
committee also felt that MIIs are in the nature of public utilities.
Stock Exchanges
Besides providing an electronic platform for investors to trade, the following were
o Issuer regulation (listing, monitoring listing compliances, dissemination of
information)
o Member regulation (registration of members, inspection and enforcement
action)
o Trading regulation (setting and enforcing trading rules, market surveillance)
and
99
o Investor protection (dispute resolution, grievance redressal, investor protection
fund)
o Product design
Clearing Corporation
treated as counter-party for the transaction.
Through a process of novation, the clearing corporation interposes itself between
counterparties to the transaction. Therefore, clearing corporations are a major
independent entity whose balance sheet becomes available for settling defaults.
transaction.
NSE, at its very inception, decided to go for a clearing corporation to settle trades
conducted on its platform.
Depository
Depositories facilitate holding securities in electronic form and transfer of securities
by book entry. They operate through Depository Participants (banks, brokers
etc.) who are the contact point for investors to handle depository transactions.
The paperless trading facilitated by depositories enable transfer of large volume of
securities fast, while not compromising on security.
Depositories perform a useful role in preventing fraud through fake share
depositories:
o Depository participants’ regulation (registration, inspection and enforcement
action)
o Admission of securities, dematerialisation, rematerialisation
transfers
o Investor protection (dispute resolution and grievance redressal).
100
of interest:
o Government (Statutory) Model
responsible only for supervision of the market. This model is necessary in countries
enough.
o Limited Exchange SRO Model
perform certain regulatory and surveillance functions related to the operation of its
surveillance functions.
o Strong Exchange SRO Model
OSE), Malaysia (Bursa Malaysia).
conduct.
o Independent SRO Model
Japan (JSDA), Columbia (AMV).
entry, etc. of members of MIIs.
The committee mentioned the following as appropriate features for a well functioning
MII:
in the near future.
101
levy reasonable charges on its users without abusing its dominant or regulatory
position.
o Regulatory function: It should establish itself as a fair and strong regulator, and earn
the trust and goodwill of the market place. Adequate investments would need to be
made to perform this role effectively.
o Professional standards and competitive practices: The MII must maintain the same
professional standards in all its dealings including dealings with its competitors, its
technology providers and related entities. It should maintain its integrity and be
unbiased while dealing with all such entities.
o Transparency: The MII should maintain utmost transparency in its operations.
Disclosures on its website should at least include thos that are mandated for a listed
company.
reach and economies of scale.
The following are key recommendations of the committee as regards capital:
MIIs can be included in the computation. However, all other noncore investments in
o Clearing Corporation - Net worth requirement of Rs. 300 crores at all times. This
is to be maintained in the form of liquid assets at all times. Liquid assets are those
achieves the prescribed net worth, it should not be permitted to pay any dividend to
its shareholders.
10.2 Alternate Investment Funds
In August 2011, SEBI came out with a concept paper on regulation of Alternate
Investment Funds. The background to this is that SEBI has regulations in place for
102
mutual funds, collective investment schemes (CIS), venture capital funds (VCF) and
portfolio managers. However, VCF regulations were being used for other kinds of funds,
such as those in the areas of, Private Equity (PE), Private Investment in Public Equity
(PIPE) and real estate.
The G-30 too has recommended that managers of private pools of capital should register
with a national regulater. “The regulator of such managers should haveauthority to
require periodic regulatory reports and public disclosures ofappropriate information
SEBI’s concept paper has important lessons on the likely direction of regulation of these
funds in the years to come. Key highlights of the paper are as follows:
Regulatory framework is to cover all shades of private pool of capital or investment
without posing systemic risk.
Since mutual funds and CIS involve retail investors, the regulations will seek to
protect against all kinds of risk. In the case of private pools of capital, regulations
will not try to protect against business risks. However, it will provide some minimum
Since portfolio managers are not as closely regulated as mutual funds, the minimum
to segregate the funds and investments of each investor.
need to register separately as alternate investment funds (AIF).
o Portfolio managers who want to give advice, but not handle funds, have to
register as investment advisers.
o The Fund Managers or Investment Managers of Alternative Investment Funds
are to be regulated as investment advisers.
The following categories of AIF are envisaged:
o Venture Capital Fund
o PIPE Funds
o Private Equity Fund
o Debt Funds
o Infrastructure Equity Fund
o Real Estate Fund
103
o Social Venture Funds
o Strategy Fund (Residual Category, including all varieties of funds such as hedge
funds, if any).
At the time of application, the fund has to specify the category under which it is
target investor.
The funds should be close ended. Mobilisation would be only through private
Each category of funds will have separate investment restrictions. For instance:
in any of the market indices.
o PE funds to invest mainly in unlisted companies or companies proposed to be
listed.
o Social Venture Funds are targeted towards social investors who are willing to
accept muted returns. Therefore, investments would be made primarily in social
Any alteration to the fund strategy shall be made with the consent of at least 75%
of unit holders.
Different credit rating agencies were following their own rating symbols. This was quite
confusing for investors. Therefore, SEBI introduced common rating symbols for the
following:
Short term mutual fund schemes
104
10.4 Investment Advisers
In September 2011, SEBI came out with a concept paper on regulation of investment
advisers, through the SRO route. The paper has huge implications on the likely future
this paper are as follows:
Any industry, in order to achieve scale and high productivity, must be free of internal
products like banks, mutual funds, and insurance companies, etc. and the distributors
following:
o Dual role played by distributors as an agent of investors as well as of the
products, agents receive their payments from two sources: commissions from
the manufacturers (either directly or through deductions from the investment
amount of investors), and advisory fees or other charges received from the
investors. This immediately raises the question: whose interests do they
represent: the manufacturers’ or the investors’?
This prevalence of divided loyalties may not be in the best interest of all the
stake holders concerned. It often results in a situation where the distributors are
loyal to only themselves. They would happily churn investors’ portfolio and also
o A situation might arise where distributors are likely to be partial to, and would sell
other manufacturers would scramble to do the same, thus leading to a race to
the bottom.
105
similar products of various manufacturers.
lower, disclosures have a limited effect in solving the problem.
o The person who interfaces with the customer should declare upfront whether he
If he is an advisor, he would be subject to the Investment Advisors
receive all payments from the investor and there would be no limits set on
these payments.
On the other hand, there will be agents who will be associated with the
manufacturer and would receive their remuneration from them. However,
have to call themselves as agents only.
The proposed regulatory framework intends to regulate the activity of providing
investment advisory services in various forms by a wide range of entities including
including but not limited to securities, insurance products, pension funds, etc.
While the activity of giving investment advice will be regulated under the proposed
shall come under the jurisdiction of the respective sectoral regulators such as action
regulations laid down by respective regulators for products falling in their jurisdiction,
including but not limited to suitability and appropriateness of the products.
The SRO formed to regulate investment advisors will be registered under the SEBI
to perform its functions.
Its duties would include registering and setting minimum professional standards,
administering a disputes resolution forum for investors and registered entities etc.
106
Persons desirous of registration as Investment Advisors shall obtain registration
with the SRO established for the purpose. The SRO will be entitled to charge a fee
for granting registration and an annual fee.
by the SRO with the respective regulatory authority, while the complaints regarding
regulators.
private bankers etc. This causes much confusion as to their role and responsibility.
Hence the regulations will provide that no person can carry on the activity of
offering investment advice unless he is registered as an Investment Advisor under
registration as an Investment Advisor must necessarily use the word “investment
advice directly or indirectly for a consideration, which may be received directly from
the investor or who holds himself out as an investment advisor.
investor. It shall include:
o Financial planning service or
The following set of individuals would need to get registered under the regulations
to be able to provide Investment Advisory Services:-
o Independent Investment Advisor– Independent Investment Advisors are
o Representatives of investment advisors or intermediaries who on behalf of the
investment advisor or intermediary provide investment advice to investors:
Representative would mean a person, in the direct employment of, or acting for,
an investment advisor, who performs on behalf of the investment advisor any
107
investment advisory service, whether or not he is remunerated, and whether his
remuneration, if any, is by way of salary, wages, commission or otherwise, and
advisor any investment advisory service whether or not he is remunerated, and
whether his remuneration, if any, is by way of salary, wages, commission or
The following set of non-individuals (corporate entities) would need to get registered
under the regulations to be able to provide Investment Advisory Service:
o Any entity, other than an individual person - representing investment advisor,
who on behalf of the investment advisor provides investment advice to i
nvestors :
Representative would mean a person, acting for, an investment advisor, who
performs on behalf of the investment advisor any investment advisory service,
whether or not it is remunerated, and whether its remuneration, if any, is by
performs for the investment advisor any investment advisory service whether or
not he is remunerated, and whether his remuneration, if any, is by way of salary,
A person shall be deemed not to be engaged in the business of providing investment
advice, if the advice is solely incidental to some other business or profession and
the advice is given only to clients of the person in the course of such other business
or profession and the advice does not specify particular securities and is limited to
general comments made in good faith in regard to trends in the securities market,
the economic situation of the country.
incidental to his legal practice.
o Chartered accountants who are registered under the Institute of Chartered
Accountants of India providing of any investment advice is solely incidental to
the accounting practice.
the advice given, or analysis or report issued, is promulgated only through
108
that person receives no commission or other consideration, apart from any
fee received from subscription to or purchase of the newspaper, for giving
the advice is given, or the analysis or report is issued or promulgated,
solely as incidental to the conduct of that person’s business as a newspaper
proprietor.
o Any person who owns, operates or provides an information service through an
the advice given, or analysis or report issued is promulgated only through
that person receives no commission or other consideration, apart from any
fee received from subscription to the service, for giving the advice, or for
the advice is given, or the analysis or report is issued or promulgated, solely
as incidental to that person’s ownership, operation or provision of that
service.
o Any stock broker or sub-broker as registered under SEBI( Stock Broker and Sub-
Broker) Regulations, 1992, who provides any investment advice as per Regulation
7 read with Schedule II of SEBI (Stock Broker and Sub-broker) Regulation, 1992
and not charging any consideration for such advice.
Insurance Development and Regulatory Authority.
The Individuals who wish to get registered under these regulations would need to
satisfy the following criteria:
institute for e.g. Chartered Accountancy form ICAI, MBA in Finance or similar
purpose
o The individuals should conform to the Fit and Proper Criteria as laid down in
Schedule II of SEBI (Intermediaries) Regulations, 2008.
109
Entities who wish to get registered under these regulations would need to satisfy the
following criteria:
o Capital Adequacy Requirement: Entities would need to maintain a minimum net
worth which would be separate from the net worth required for other activities.
o Key personnel: Entities should have at least 2 key personnel having the relevant
o The entity should conform to the Fit and Proper Criteria laid down in Schedule II
of SEBI (Intermediaries) Regulations, 2008.
o The applicant must have adequate infrastructure to enable it to discharge its
functions as an Investment Advisor.
The following are obligations of an Investment Advisor
o Fiduciary Responsibility to Investors
All information received and provided by the investment advisor would be
provided by the client. Advice should be given by the advisor in the best interest
of the investor.
The Investment Advisors or their representatives would be required to do
or their representative suitable investment advice should be provided. The
Investment Advisor.
o Advertising and Marketing Material
Investment Advisors should not use any advertisement that contains any un
true statement of material fact or that is otherwise misleading.
They should not use or refer to testimonials (which include any statement of a
made by the advisor within the preceding period of not less than one year and
110
than investors seeking advice. In case of advice regarding investment in entities
related to the investment advisor, adequate disclosures shall be made to investor
regarding the relationship.
o Maintaining Records
which indicates the data, facts and opinion leading to that investment decision
would be maintained by the Investment Advisor. Records should be retained for
at least 5 years.
Systematic record of all advises provided would be kept including audio recording
of any oral advice given.
The Investment Advisor would clearly indicate to its clients the fees and charges
that are required to be paid by them. An investment advisor shall disclose to a
prospective clients all material information about itself, its businesses, its disciplinary
with other intermediaries and such other information as is necessary him to take an
informed decision whether to avail of its services.
fee for investment advice.
services such as broking, custody services, DP services, accounting etc., they must
make appropriate disclosures, clarify that the investor is under no obligation to use
their services and maintain arms-length relationship through creation of Chinese
should be left to the investors. Fees and charges paid to service providers should be
paid directly to them and not through investment advisors.
Other than sourcing of research reports, no other part of investment advisory activity
can be outsourced.
The investment advisors shall not be liable for civil or criminal liability in respect
between the investment advisor and his client would be resolved through grievance
redressal mechanism or arbitration created by SEBI.
Portfolio Managers who provide only investment advice would need to be registered
111
10.5 Commission on Public Issues of Debt
In respect of public issues of debt securities, no person connected with the issue (including
person connected with the distribution of the issue) can offer any incentive, whether
direct or indirect, in any manner, whether in cash or kind or services or otherwise to any
10.6 Merchant Bankers’ Track Record
Merchant bankers are required to disclose the track record of the performance of the
public issues managed by them. If more than one merchant banker was involved with
an issue, then disclosure has to be made by the one who signed the due diligence
each public issue managed by the merchant banker. The following information has to
be made available in the website of the merchant banker for every issue handled in the
previous three years:
stage of allotment, 1 quarter thereafter and at the end of each of the following three
o Change in composition of the board of directors of the issuer at the end of each of
o Project implementation and use of issue proceeds – comparision of actual with the
plans mentioned in the offer document
are to be given for the issuer, the peer group and industry average.
A reference to this information has to be made in the Offer Document of public issues
that the merchant banker is associated with.
10.7 Algorithmic Trading
o Have arrangements, procedures and system capability to manage the load on their
systems in such a manner so as to achieve consistent response time to all stock
brokers.
112
o Put in place effective economic disincentives with regard to high daily order-to-trade
ratio of algo orders of the stock broker.
o Put in place monitoring systems to identify and initiate measures to impede any
o Ensure that all algorithmic orders are necessarily routed through broker servers
located in India
o Have appropriate risk controls mechanism including price check and quantity limit
check.
o Put in place a system to identify dysfunctional algos (i.e. algos leading to loop or
runaway situation) and take suitable measures, including advising the member, to
shut down such algos and eliminate orders in the system that have been generated
by the algos.
terminal.
o Seek details of trading strategies used by the algo for inquiry, surveillance,
investigation, etc.
one millisecond.
o Subject the systems of the stock broker to initial conformance tests
10.8 Outsourcing by Intermediaries
The risks associated with outsourcing may be operational risk, reputational risk, legal
systemic risk.
o Intermediaries are not permitted to outsource their core business activities and
Investment related activities in case of Mutual Funds and Portfolio Managers.
113
policy and related overall responsibility for activities undertaken under that policy.
o An activity cannot be outsourced if it would impair the supervisory authority’s right
to assess, or its ability to supervise the business of the intermediary.
o Outsourcing shall be based on evaluation of risk concentrations, limits on the
acceptable overall level of outsourced activities, risks arising from outsourcing
multiple activities to the same entity, etc.
o The following to be considered while outsourcing:
The impact of failure of a third party to adequately perform the activity on the
Ability of the intermediary to cope up with the work, in case of non-performance
party and the measures put in place by the intermediary to address such potential
o Systems to be put in place to have an arm’s length distance between the intermediary
and the third party in terms of infrastructure, manpower, decision-making, record
Know Your Customer (KYC) requirements are permitted to invest in equity shares listed
QFI mean a person resident in a country that is compliant with Financial Action Task
QFI cannot be registered with SEBI as Foreign Institutional Investor or Sub-account.
QFIs need to hold equity shares in a demat account opened with a SEBI registered
114
DP will be either a clearing bank or clearing member of any of the clearing
DP will have appropriate arrangements for receipt and remittance of money with a
DP will demonstrate that it has systems and procedures to comply with the FATF
Standards, Prevention of Money Laundering (PML) Act, Rules and SEBI circulars
DP needs to obtain prior approval of SEBI before commencing the activities relating
to opening of accounts of QFI.
QFIs are permitted to do the following transactions:
Purchase of equity shares in public issues, to be listed on recognised stock
Sale of equity shares which are held in their demat account through SEBI registered
stock brokers.
Purchase of equity shares against rights issues.
Receipt of equity shares due to amalgamation, demerger or such other
corporate actions, subject to the investment limits.
Receipt of dividends.
Tender equity shares in open offer in accordance with SEBI (Substantial Acquisition
of Shares and Takeovers) Regulations, 2011.
Tender equity shares in open offer in accordance with SEBI (Delisting of Equity
Shares) Regulations, 2009.
Tender equity shares in case of buy-back by listed companies in accordance with
SEBI (Buyback of Securities) Regulations, 1998
Other Conditions:
A QFI can open only one demat account with any one of the DPs. Purchase and sale
of equity shares will be made through that DP only.
In case of jointly held demat accounts, each of the joint holders has to meet the
as a QFI.
115
DPs need to have adequate systems to ensure the compliance of the same and
perform KYC due diligence for each of the joint holders.
The DP has to carry out necessary due diligence and obtain appropriate declarations
and undertakings from QFI to ensure that no other demat account is held by any
of the QFI as a QFI or in any other capacity such as NRI, before opening a demat
account.
not allowed to open more than one demat account as QFI. For this purpose, the DP
has to carry out necessary due diligence and obtain appropriate declarations and
undertakings from QFI.
A QFI can open trading accounts with one or more SEBI registered stock brokers
allowed to open demat account as QFI.
the QFI, it has to bring the same to the notice of its DP, forthwith. The DP will
assess the eligibility of that QFI afresh, before allowing it to undertake any further
transactions.
The DP has to open a separate single rupee pool bank account with a designated AD
in India.
The DP has to ensure that funds of each and every QFI in the rupee pool account
are clearly segregated from each other at all times. Further, the DP has to maintain
appropriate records including audit trails on an ongoing basis regarding such
segregation.
The DP can open a demat account for the QFI only after ensuring compliance with
all the requirements as per PML Act, rules and regulations, FATF standards and SEBI
circulars issued in this regard, from time to time. It will also ensure that QFI comply
with all these requirements on an ongoing basis.
The DP has to ensure that every QFI transacts only through one designated overseas
bank account and such overseas bank account which QFI has designated for the
purpose is based in a country which is compliant with FATF standards and is a
116
The DP has to capture, the details of the overseas bank account designated by the
QFI and ensure that all inward bound investments are received from that overseas
overseas account.
The DP has to ask QFI to submit necessary information for the purpose of obtaining
purpose. Each QFI needs to obtain a separate and distinct PAN.
those mentioned in the common PAN cum KYC form to ensure compliance with PML
rules and regulations, FATF standards and SEBI circulars issued from time to time.
available with the DP.
The DP has to ensure that equity shares held by QFI are free from all encumbrances
including pledge or lien etc. at all times.
The DP shall, at all times, ensure compliance with laws, rules and regulations of the
jurisdictions where the QFI are based.
The DP has to ensure that the interests of other clients of DP are not adversely
affected in any manner due to transactions done on behalf of QFI.
or investigations for which action may have been taken or is in the process of
The DP has to mandate the QFI to furnish the details of any such penalty, pending
basis.
In case a QFI desires to change the DP with whom he holds the demat account, he
is allowed to operate a new demat account with another DP only after closure of the
earlier demat account. At the time of opening a new demat account with a different
earlier DP and the details of the shareholdings in the earlier demat account.
117
Simultaneously, the QFI has to issue transfer instructions to the earlier DP with a
copy to the new DP.
The funds of the QFI lying in the rupee pool account of the earlier DP, are to be
remitted back to the designated overseas bank account of the concerned QFI. At any
point of time, a QFI can operate through only one demat account with a DP.
The following investment restrictions are prescribed for the QFIs:
o The QFI can transact in Indian equity shares only on the basis of taking and
giving delivery of shares purchased or sold.
o Each transaction by QFI has to be cleared and settled on gross basis.
declaration and undertaking to this effect is to be obtained by DP from the QFI.
o The DP has to provide on a daily basis, QFI wise, ISIN wise and company wise
respective depositories on the same day i.e the day on which the transaction
was carried out, before the time stipulated by the depositories.
periodically and also provide information regarding change in paid up equity
capital in any listed company, immediately.
o The QFI and DP have to ensure that the total shareholding held by a QFI does
of time. This investment limit is applicable to each class of equity shares having
separate and distinct ISIN.
o The depositories have to put in place appropriate systems and procedures to
the QFI.
o The depositories need to administer and monitor, so as to ensure, that aggregate
capital of the company at any point of time, in respect of each equity share class
having separate and distinct ISIN.
wise aggregate shareholding of QFIs to public, on daily basis.
o The information regarding ISIN wise and company wise aggregate QFI
shareholding has to also be provided by the depositories to the RBI in a manner
and format as stipulated by the Reserve Bank of India from time to time.
118
o When the aggregate shareholding of all the QFIs in a company reaches 8% of the
equity paid up capital, the company’s name along with ISIN has to be published
in caution list by the depositories and no fresh purchases can be allowed without
prior approval of the depositories. The same is to be informed by the depositories
company is removed from the caution list.
o For fresh purchases by QFI in equity shares of companies in the caution list,
prior approval of the depositories is to be obtained. The QFI needs to make such
request for prior approval to the concerned depository through the DP specifying
to that QFI, number of shares to be purchased and the ISIN, by way of any mode
other. The concerned depository has to provide the details of prior approval
requests received by it to the other depository.
o After market hours, the depository has to give prior approval to request for
served basis in co-ordination with the other depository, based on time of receipt
of the prior approval requests by the depositories,. The validity of the approval
in respect of any ISIN, the depositories have to jointly notify the respective
DPs regarding the breach along with the names of the QFI due to whom the
provide the required information so as to enable the depositories to identify
any other information as may be required by the depositories.
cent for whatsoever reason, the QFI due to whom the limit is breached has to
before June 30, 2012, so as to incorporate another class of investor to disseminate
QFI shareholding in equity shares.
119
transactions in the equity shares of companies in the caution list, if they wish to
buy without the prior approval of depositories. However, QFI who have obtained
prior approval of the depositories may purchase equity shares in the normal
towards services relating to monitoring and administering of investment limits
of QFI.
o Purchases
The QFI will place a purchase order with the DP mentioning the name of
the company and ISIN, number of equity shares, name of the stock broker
and remit foreign inward remittances from the designated overseas bank
account of QFI through normal banking channel in any permitted currency
(freely convertible) directly to the single rupee pool bank account of the DP
maintained with a designated AD category - I bank.
The DP in turn will forward the purchase order to the SEBI registered stock
broker with whom QFI has opened trading account and remit the money to the
broker’s account after receipt of funds from QFI and as per the instructions
of QFI.
If for any reasons, the QFI is not able to purchase equity shares within
of foreign inward remittance through normal banking channels from the
designated overseas bank account of the QFI into the single rupee pool bank
account), the DP has to immediately remit the money back to the designated
overseas bank account of the QFI.
The DP has to ensure that equity shares purchased on behalf of QFI are
credited into the demat account of that QFI on the pay-out date.
In case of QFI’s participation in public issues, the QFI has to provide
instruction to the DP to make application for public issue. The DP, after
obtaining necessary instructions from the QFI and subject to availability of
funds on account of that QFI in the rupee pool account, will make application
on behalf of such QFI and remit money to the issuer company.
o Sale
ISIN, number of equity shares and name of the stock broker, the DP has to
120
place order for sale of equity shares only after verifying availability of such
equity shares in demat account of that QFI.
behalf of QFI, the same has to be retained in single rupee pool bank account
The QFI can instruct the DP to make fresh purchase of equity shares out
of sale proceeds on account of sale of equity shares provided that such
of the sale proceeds in the single rupee pooled bank account) of receipt of
money in the pooled bank account.
In case no purchase is made within said period, the money has to be
remitted by the DPs to the designated bank overseas account of the QFI
bank account.
o Dividend and other Corporate Actions
In case of dividend received on account of QFI, the DP has to remit the same
(including the date of credit to the single rupee pool account) from the date
of receipt of money in the DP’s rupee pooled bank account, unless any fresh
purchase of equity shares is made out of such dividend receipts.
In case of QFI participation in corporate actions such as buy back, delisting
etc. wherein the pool account maintained with DP is credited with funds, such
funds have to be remitted back to the designated bank overseas account
purchase of equity shares is made out of such funds.
The transactions of QFIs, for all purposes, have to be treated at par with that of
Indian non-institutional investors with regard to margins, voting rights, public issues
etc.
10.10 KYC Registration Agency (KRA)
across intermediaries in the securities markets. Further, to avoid duplication of KYC
process with every intermediary, SEBI has provided for a KRA system where the KYC
records in the securities markets are centralised. This new system was made applicable
121
for new clients who opened accounts with the intermediaries from January 1, 2012.
Highlights of the KRA system are as follows:
o After doing the initial KYC of the new clients, the intermediary has to forthwith
upload the KYC information on the system of the KRA and send the KYC documents
i.e. KYC application form and supporting documents of the clients to the KRA
and maintain the proof of dispatch.
o In case a client’s KYC documents sent by the intermediary to KRA are not
complete, the KRA will inform the same to the intermediary who has to forward
provided they are in conformity with details sought in the uniform KYC form
While uploading these clients’ data the intermediary has to ensure that there is
no duplication of data in the KRA system.
o The intermediaries have to maintain electronic records of KYCs of clients and
keeping physical records is not necessary.
o The intermediary has to promptly provide KYC related information to KRA, as
and when required.
o The intermediary needs to have adequate internal controls to ensure the security
o KRA system should provide KYC information in data and image form to the
intermediary.
o KRA has to send a letter to the client within 10 working days of the receipt of the
and maintain the proof of dispatch.
o KRA(s) should develop systems, in co-ordination with each other, to prevent
duplication of entry of KYC details of a client and to ensure uniformity in formats
made in the KYC data, by the intermediary in its system.
122
o KRA has to ensure that a comprehensive audit of its systems, controls, procedures,
safeguards and security of information and documents is carried out annually by
an independent auditor. The Audit Report along with the steps taken to rectify
the KRA has to send the Action Taken Report to SEBI within 3 months.
other necessary information is obtained while the remaining process of KRA is in
progress.
o It is mandatory for KYC Registration Agencies (KRAs), Stock Brokers, Depository
Participants (DPs), Mutual Funds (MFs), Portfolio Managers (PMs), Venture
Capital Funds (VCFs) and Collective Investment Schemes (CIS) to carry out IPV
of their clients.
o The intermediary has to ensure that the details like name of the person doing
the KYC form at the time of IPV.
o The IPV carried out by one SEBI registered intermediary can be relied upon by
another intermediary.
o In case of Stock brokers, their sub-brokers or Authorised Persons (appointed by
can perform the IPV.
o In case of Mutual Funds, their Asset Management Companies (AMCs) and the
Securities Market (NISM) or Association of Mutual Funds (AMFI) and have under
However, in case of applications received by the mutual funds directly from
the clients (i.e. not through any distributor), they may also rely upon the IPV
performed by the scheduled commercial banks.
in the current KRA system, in a phased manner, as follows:
16, 2012, the intermediaries have to forthwith upload their KYC details in the KRA
123
system. They also need to send original KYC documents to the KRA on continuous
basis and complete the process within prescribed time limits.
Printouts of scanned documents can be sent to the KRAs instead of original documents,
certifying that the intermediary has retained the originals.
The process has to be completed by March 31, 2013.
that intermediary which downloads the data of that client from the KRA system, to
update the missing information, do IPV as per requirements (if not done already)
and send the relevant supporting documents, if any, to the KRA. Thereafter, the KRA
system will indicate the records as updated.
While SEBI has standardised the KYC in areas that are under its control, banks
his Budget Speech in 2012, has proposed a central KYC depository for the entire
124
AAA - Instruments with this rating are considered to have the highest degree of safety
risk.
AA - Instruments with this rating are considered to have high degree of safety regarding
A - Instruments with this rating are considered to have adequate degree of safety regarding
BBB - Instruments with this rating are considered to have moderate degree of safety regarding
BB - Instruments with this rating are considered to have mode rate risk of default regarding
B - Instruments with this rating are considered to have high risk of default regarding timely
C - Instruments with this rating are considered to have very high risk of default regarding
Short term debt instruments: The instruments with original maturity of upto one year
A1 – Instruments with this rating are considered to have very strong degree of safety
A2 – Instruments with this rating are considered to have strong degree of safety regarding
A3 – Instruments with this rating are considered to have moderate degree of safety
as compared to instruments rated in the two higher categories.
125
A4- Instruments with this rating are considered to have minimal degree of safety regarding
susceptible to default.
D –
one year
AAA (SO) - Instruments with this rating are considered to have the highest degree of safety
risk.
AA (SO) - Instruments with this rating are considered to have high degree of safety regarding
A (SO) - Instruments with this rating are considered to have adequate degree of safety
regarding timely serv
BBB (SO) - Instruments with this rating are considered to have moderate degree of safety
risk.
BB(SO) - Instruments with this rating are considered to have moderate risk of default
B(SO) - Instruments with this rating are considered to have high risk of default regarding
C (SO) - Instruments with this rating are considered to have very high likelihood of default
one year
126
Rating symbols s
A1 (SO) – Instruments with this rating are considered to have very strong degree of safety
A2 (SO) - Instruments with this rating are considered to have strong degree of safety
A3 (SO) - Instruments with this rating are considered to have moderate degree of safety
as compared to instruments rated in the two higher categories.
A4 (SO) - Instruments with this rating are considered to have minimal degree of safety
risk and are susceptible to default.
maturity.
Long term debt mutual fund schemes: The debt mutual fund schemes that have an original
AAAmfs – Schemes with this rating are considered to have the highest degree of safety
regarding timely receipt of payments from the investments that they have made.
AAmfs – Schemes with this rating are considered to have the high degree of safety regarding
timely receipt of payments from the investments that they have made.
Amfs – Schemes with this rating are considered to have the adequate degree of safety
regarding timely receipt of payments from the investments that they have made.
BBBmfs - Schemes with this rating are considered to have the moderate degreeof safety
regarding timely receipt of payments from the investments that they have made.
BBmfs - Schemes with this rating are considered to have moderate risk of default regarding
timely receipt of payments from the investments that they have made.
Bmfs - Schemes with this rating are considered to have high risk of default regarding timely
receipt of timely receipt of payments from the investments that they have made.
Cmfs - Schemes with this rating are considered to have very high risk of default regarding
timely receipt of timely receipt of payments from the investments that they have made.
127
Short term debt mutual fund schemes: The debt mutual fund schemes that have an original
maturity of upto one year.
A1mfs - Schemes with this rating are considered to have very strong degree of safety
regarding timely receipt of payments from the investments that they have made.
A2mfs - Schemes with this rating are considered to have strong degree of safety regarding
timely receipt of payments from the investments that they have made.
A3mfs - Schemes with this rating are considered to have moderate degree of safety regarding
timely receipt of payments from the investments that they have made.
A4mfs - Schemes with this rating are considered to have minimal degree of safety regarding
timely receipt of payments from the investments that they have made.
References
Alice, Schroder, “
Cunningham, Lawrence A., “How to think like Benjamin Graham and Invest like Warren
Buffett
Graham, Benjamin, “The Intelligent Investor
Business Essentials, 2003)
Lynch, Peter, “One Up on Wall Street
Porter, Michael, “
(The Free Press, 1980)
Porter, Michael, “Competitive Advantage: Creating & Sustaining Superior Performance
Free Press, 1985)
Prahalad, CK, “The Fortune at the Bottom of the Pyramid: Eradicating Poverty through
Sankaran, Sundar, Indian Mutual Funds Handbook,
Sankaran, Sundar, Wealth Engine, [

128
NOTES

129
NOTES

130
NOTES