Embed Size (px)
Citation preview

Financial Management –Arlington’s Best Practices &
Reserves
March 2015

Core Financial Strengths
• Strong reserve levels• Fully funded pension plan• Funding plans in place for retiree health care• Conservative financial forecasting on both
revenues and expenses– Performance is within best practices & rating agency expectations
• Moderate debt levels & demonstrated reinvestment in infrastructure
• Triple-Aaa bond ratings
2

Why Is Prudent Financial Management Important?
• Triple-Aaa bond ratings result in the lowest interest rates possible on County bonds, saving taxpayer money
• Triple-Aaa bond ratings ensure:– Market access during volatile financial market conditions– Facilitate County’s ability to provide credit support for key economic development
or other high profile projects if appropriate
• Provides foundation for innovation & service delivery expansion
• Ensures the County meets its long-standing commitment to retirees and current employees
– National headlines in Rhode Island & California
• Strong balance sheet & moderate levels allow for capital investment & reinvestment
3
Revenue Forecasts

Revenue – Budget Vs. Actual
• Conservative projections during volatile economic times
• Other factors in budget vs. actual results – June payment; tax rate changes
• Certain revenue sources are highly variable and difficult to project:
– Affordable housing developer site plan contributions / loan repayments
– State & federal grants• County does not lose money; gets carried over to future year
5
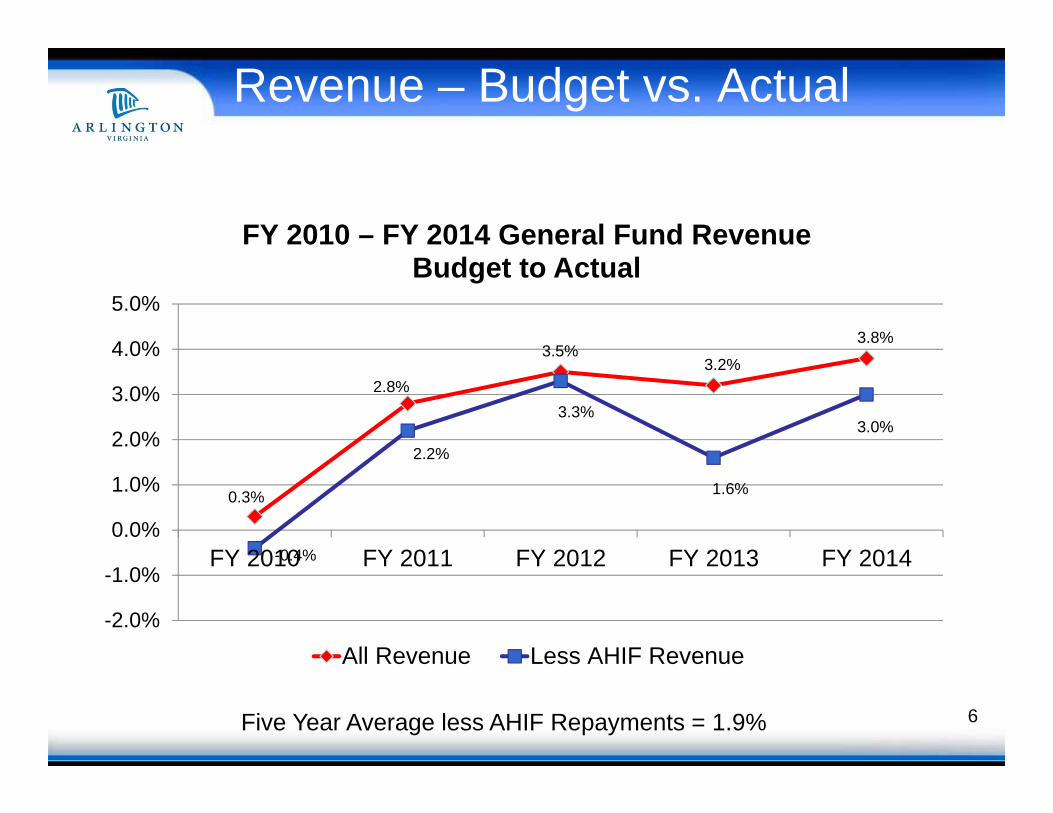
Revenue – Budget vs. Actual
0.3%
2.8%
3.5%3.2%
3.8%
-0.4%
2.2%
3.3%
1.6%
3.0%
-2.0%
-1.0%
0.0%
1.0%
2.0%
3.0%
4.0%
5.0%
FY 2010 FY 2011 FY 2012 FY 2013 FY 2014
FY 2010 – FY 2014 General Fund RevenueBudget to Actual
All Revenue Less AHIF Revenue
6Five Year Average less AHIF Repayments = 1.9%

Revenue – Budget vs. Actual
$(3.9)
$21.5
$32.6
$16.4
$32.4
$7.0
$5.4
$2.2
$17.4
$8.0
-$10.0-$5.0$0.0$5.0
$10.0$15.0$20.0$25.0$30.0$35.0$40.0$45.0
FY 2010 FY 2011 FY 2012 FY 2013 FY 2014
$ m
illio
ns
All Other Revenue AHIF Repayments
7

CY '09 CY '10 CY '11 CY '12 CY'13 CY'14 CY'15Commercial 2.5% -11.3% 12.6% 14.3% 2.9% 5.4% 1.3%Residential -1.1% -2.5% 1.7% 1.3% 1.0% 6.1% 5.4%Total Growth 0.5% -6.6% 6.4% 7.3% 2.0% 5.8% 3.4%
-15%
-10%
-5%
0%
5%
10%
15%
20%Commercial Residential Total Growth
Assessment Base Percent ChangeResidential vs. Commercial
2009-2014(year-over-year percent change)
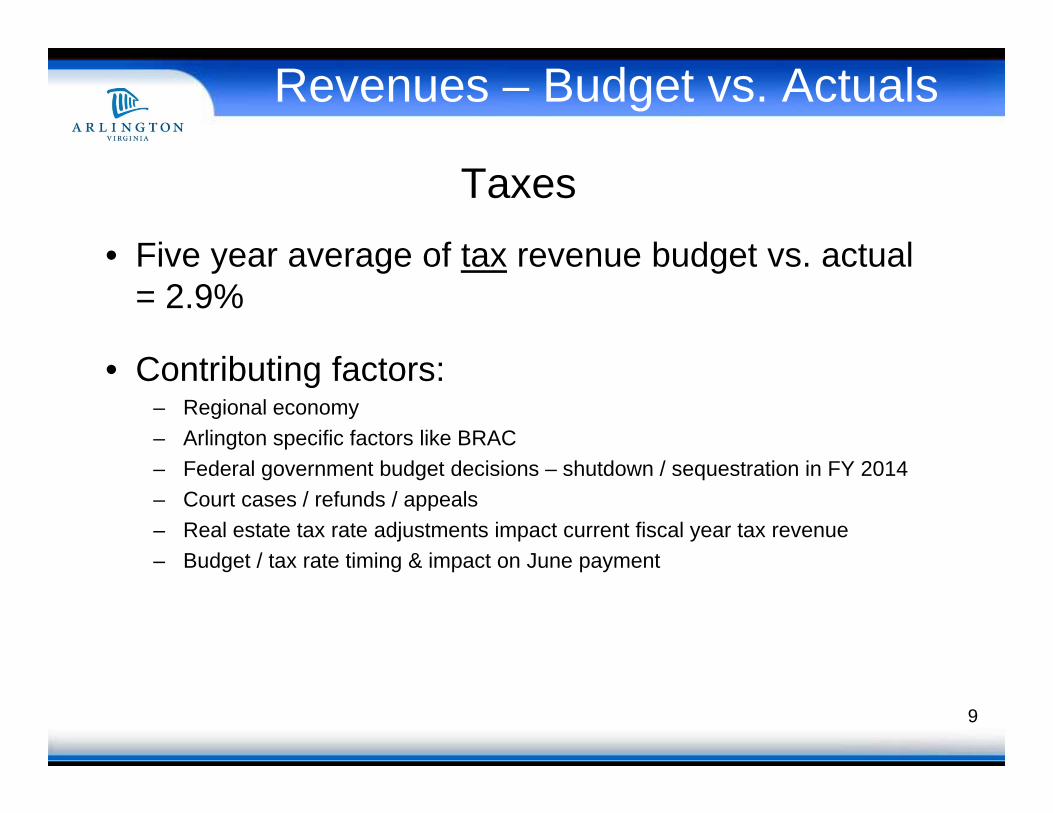
Revenues – Budget vs. Actuals
Taxes• Five year average of tax revenue budget vs. actual
= 2.9%
• Contributing factors:– Regional economy– Arlington specific factors like BRAC– Federal government budget decisions – shutdown / sequestration in FY 2014– Court cases / refunds / appeals– Real estate tax rate adjustments impact current fiscal year tax revenue– Budget / tax rate timing & impact on June payment
9

Impact of Budget, Assessment & Tax Rate Timing on Revenue
• October 2012 – budget planning & guidance• January 2013 – real estate assessments released• February 2013 – County Manager proposes budget• April 2013 – County Board adopts FY 2014 budget
• July 1, 2013 – FY 2014 begins
• Fall 2013 – federal government shutdown & sequestration• January 2014 – real estate assessments known – IMPACTS JUNE
2014 PAYMENT / JUNE REVENUES• April 2014 – County Board adopts FY 2015 budget & SETS TAX RATE
WHICH IMPACTS JUNE PAYMENT & 2014 REVENUES
• June 2014 – real property tax payment due• June 30, 2014 – FY 2014 ends 10
FY 2014 Budget Process

Revenue – Budget Vs. Actual
Tax Revenue
• FY 2014 - Stronger than expected real property assessments– FY 2014 budget that was adopted in April 2013 assumed 2% growth on January 1, 2014; actuals
were 5.8% - generated $25 million for June 14 payment – did not revise budget– Appropriated by Board into FY 2015 for capital investments (paving, parks) and AHIF– Experienced losses in other taxes due to federal government shutdown
• FY 2013 - Real estate tax rate adjusted during fiscal year & strong unexpected vehicle personal property
– Change in real estate tax rate generated $10 million in unbudgeted tax revenue in the fiscal year– Vehicle personal property assessments and the resulting tax revenue were higher than expected
• FY 2012 – Real estate tax rate adjusted during fiscal year & higher tax revenues as economy experienced modest recovery
– Change in real estate tax rate generated $4 million in unbudgeted tax revenue in the fiscal year– Most other taxes higher than budgeted
11

Revenue – Budget Vs. Actual
Non-Tax Revenue• Non-Tax Revenue – Wide range of fees, charges for
services, state and federal funding, fine and interest revenue sources
– Revenue sources impacted by:• Macro economic forces (interest rates)• State legislation• Federal funding levels for grants• Demand for services (Parks programs, parking meter usage, DHS client services)• Court fines and sale of land/easements• AHIF loan repayments
– Since FY 2010, budget to actual in this category has ranged from negative $6 million to +$15.5 6 million
12

Expenditure Forecasts
13

Expenditures
14
9.4%8.6%
8.3% 8.2%
9.7%
7.8%
6.2%6.7%
5.9%6.4%
0.0%
2.0%
4.0%
6.0%
8.0%
10.0%
12.0%
2010 2011 2012 2013 2014
Budget vs. Actual
All GF Expenditures Excluding Unspent AHIF
All General Fund Expenditures

Where Do Expenditure Savings Come From?
15
$0
$10
$20
$30
$40
$50
$60
$70
$80
$90
2010 2011 2012 2013 2014
$ m
illio
ns
Schools County Operations Debt & Capital Unspent Contingents Studies, Planning & Misc.
FY 2010 – 2014 General Fund Budget to Actual ExpendituresNet of Unspent AHIF Funds

Where Do Expenditure Savings Come From?
• Schools ($19.8 million – $43.4 million)– Savings driven by personnel, health care, debt service, utilities, etc.– Unique situations like VRS holiday– Savings are directed by School Board to budget and / or enrollment
contingents and one-time expenditures like capital projects, technology
• Contingents ($3.5 million - $21.3 million)– Using one-time $, County has funded variety of budget stabilization and
compensation contingents– Substantial reserves set-aside in FY 2010 following the sharp economic
downturn at the end of CY 2009– If not used, CB allocates to other priorities at close-out
• Debt & Capital ($4.6 million - $11.2 million)– Refunding of bonds – driven by interest rate environment– Multi-year capital projects – primarily technology
• Studies, Planning & Miscellaneous ($3.9 million - $8.5 million)– Metro, one-time studies 16

County Operation Savings
FY 2010 – FY 2014
• Departmental savings range from $13 to $25 million, or 4% of County operations budget
• Only includes County operations– Excludes Metro, debt service, PAYG, Schools
• Portion of “savings” reflects unspent grants and seized asset funds
– Ranges from $6-8 million– Unspent grant or seized asset funds are carried over to next year if
unspent17

County Operation Savings
Personnel service savings
• Personnel saving realized for a variety of reasons– Hiring freezes and slowdowns– Certain jobs difficult to fill based on market competition– Positions held vacant for departmental reorganizations– Positions held in anticipation of budget cuts affecting positions
• Largest savings in personnel are in Police, DHS, & DES• Would require specific service reductions to achieve savings
18
Fiscal Year $ Savings
% of Total Personnel Budget
2010 4.4 million 1%2011 9.4 million 3%2012 5.2 million 2%2013 7.8 million 2%2014 6.1 million 2%

County Operation Savings
• Non-personnel savings range from $7 to $17 million
– Less unspent seized assets & grants, totals $4-13 million
• Sources of savings vary significantly each year
19

Where has the County BoardAllocated Excess One-time Funds?
• Board policies / dedicated funding:– Schools – revenue sharing– AHIF – Seized assets – legally restricted– Capital – AIRE – residential utility tax– Increases to the General Fund Operating Reserve to maintain the County
triple AAA rating• Other one-time appropriations made at close-out:
– Compensation contingents & market studies– Technology projects (e.g. ConnectArlington)– Planning & housing studies– Additional AHIF and Housing grant funding– Capital investments – paving, parks land acquisition– Economic stabilization contingents
20

Summary
• Year-end available savings come from many sources and can be difficult to predict
– Utilizing in future budgets would require identifying specific program savings
• County’s historical budget practices are intentionally conservative
• Budget & close-out process are intended to be fully transparent with Board approval of all dollars
• AAA ratings & related considerations – Conservative forecasting is considered a credit and management strength– Using one-time funds for one-time expenditures is considered sound financial
practice – avoids structural imbalance– Fairfax County is on negative outlook in part due to reserve levels and
structural balance – County Executive has recommended to Board of Supervisors that reserve be raised from 5% to 10% of GF expenditures 21

Cash Balances
22

Cash Balances
• All dollars are allocated to County Board-approved project, service or policy
• Cash balances vary significantly during the fiscal year due to tax payment schedules
– No short-term borrowing required
23

Cash Balances as of June 30, 2014
24
Multi-Year Capital Projects
49%
Reserves7%
Schools(Operating & Capital)
12%
Affordable Housing Investment Fund
8%
County Board Budget Allocations to County
& Schools9%
Other - BIDS, Fiduciary funds, accrued payroll,
vendor payments for future years
15%

Capital Projects
• Capital projects naturally cannot be executed in a single year
– Depending on type of project, can be 2-5 years in length
• Majority of capital funds are legally restricted in use
• Transportation Capital - $122 million– NVTA local share (“30%”)– 12.5 cent dedicated commercial real estate tax– Must maintain dedicated tax or lose 30% funding
• Stormwater - $20 million• Utilities - $62 million• General capital (bonds & PAYG) - $176 million 25

Other Cash Balance Components
• Schools - $103 million– Capital projects given enrollment pressures and operating
reserves / future budget allocations
• AHIF - $66 million – intentional build-up of funds to address future projects
• Future years’ budget allocations to County & Schools -$79 million
• Reserves - $66 million– Per Board policy and critical to maintaining Triple-AAA ratings– Operating reserve - $58 million– Economic & stabilization contingent - $3 million– Self insurance reserve - $5 million
• Other – BIDS, trust & agency, cash for vendor / payroll payments given peak June cashflows 26

Why have Cash Balances Grown?
• New dedicated, legally restricted funds– Transportation – local and regional– Stormwater– BIDs
• Growth in reserves from 2% to 5% to meet rating agency feedback
• Larger capital program – Schools and County
27
Key Takeaways
• Prudent financial management has resulted in Triple-Aaa bond ratings
– Low interest rates on debt
• County’s strong pension & balance sheet have provided flexibility for service delivery and investments during good and bad economic times
– All dollars are allocated to specific programs or projects
• Financial practices and reserve levels are consistent with other Triple-Aaa’s
28