Embed Size (px)
Citation preview
Lwanga Elizabeth Nanziri and Matthew Olckers
Financial literacy in South Africa
NIDS Discussion Paper 2019/9Version 1
Working Paper Series Number 242
About the Author(s):
Lwanga Elizabeth Nanziri: https://sites.google.com/view/elnanziriMatthew Olckers: https://www.matthewolckers.com/
Acknowledgements:Funding for this research from the Department of Planning, Monitoring and Evaluation is gratefullyacknowledged.
Recommended citationNanziri, L.W., Olckers, M. (2019). Financial Literacy in South Africa. Cape Town: SALDRU, UCT. (SALDRU Working Paper Number 242 Version 1/ NIDS Discussion Paper 2019/9).
ISBN: 978-1-928516-03-3
© Southern Africa Labour and Development Research Unit, UCT, 2019
Working Papers can be downloaded in Adobe Acrobat format from www.opensaldru.uct.ac.za. A limited amount of printed copies are available from the Senior Administrative Offi cer: SALDRU, University of Cape Town, Private Bag, Rondebosch, 7701, Tel: (021) 650 1808, Fax: (021) 650 5697, Email: [email protected]

Financial Literacy in South Africa Lwanga Elizabeth Nanziri and Matthew Olckers
Saldru Working Paper 242 NIDS Discussion Paper 2019/9
University of Cape Town, January 2019
Abstract We analyse measures of financial literacy, included in the NIDS survey for the first time in Wave 5. South Africa follows patterns found in other countries. Less educated and low income respondents display low levels of financial literacy. Most countries have large gender gaps in financial literacy while the gender gap is absent in South Africa. Controlling for a number of socio-demographic variables, financial literacy is positively related to ownership of a pension and of mutual funds, stocks, or shares.
Keywords: financial literacy, gender, pension, mutual funds JEL codes: D12, D14
2
1 Introduction
Financial literacy, the ability to understand financial concepts and make basic financial calculations, has been shown to explain stock market participation (van Rooij, Lusardi and Alessie, 2011), differences in portfolio returns (Bianchi, 2018), and wealth inequality (Lusardi, Michaud and Mitchell, 2017). Given South Africa’s extremely high levels of income and wealth inequality, financial literacy may become a central policy concern. The most popular approach to measure financial literacy is to ask between three and five multiple choice questions which test numeracy, understanding of compound interest, understanding of inflation, and understanding of risk diversification (Lusardi and Mitchell, 2014). These questions have been included in many household surveys worldwide (Lusardi and Mitchell, 2011a). In Wave 5 of the National Income Dynamics Study (NIDS), conducted in 2017, the questions have been included in a South African nationally representative panel survey for the first time. In this paper, we provide a review of existing data on financial literacy and then compare the NIDS data to existing research. In most countries, female, less educated, and low income respondents display lower levels of financial literacy. We find similar results in South Africa except for gender. South African men and women display the same level of financial literacy. Even within households, we find no statistically significant difference between men and women. Identifying subpopulations with low levels of financial literacy is only useful if financial literacy improves economic well-being. We find evidence that financial literacy is important for wealth accumulation. Controlling for a number of socio-demographic variables, financial literacy is positively related to ownership of a pension and of mutual funds, stocks, or shares.
2 Related Literature
2.1 International literature Annamaria Lusardi and Olivia Mitchell first introduced multiple choice questions as a means of measuring financial literacy in the 2004 wave of the Health and Retirement Study in the United States. Lusardi and Mitchell designed the questions with four principles in mind: simplicity, relevance, brevity, and capacity to differentiate (Lusardi and Mitchell, 2011b). Since Lusardi and Mitchell experimented with the questions in 2004, many surveys round the world have used the same questions. Several patterns have emerged. Table 1 summarises these patterns. In most studies, female, less educated, and low-income respondents answer fewer financial literacy questions correctly. The relationship with age is generally hump shaped, with young and old respondents answering fewer questions correctly. In the Netherlands, age displays little correlation with financial literacy while in Russia, Chile, and Romania there is a negative rather than hump-shaped relationship with age.

3
The method and form of the questions differs slightly across countries. To generate cross-country comparisons, several organisations have conducted international financial literacy surveys. For instance, in 2015 the OECD’s International Network for Financial Education (INFE) conducted the same survey in 30 countries, including South Africa (Atkinson & Messy, 2011; Atkinson & Messy, 2012; Atkinson, 2016). The number of correct answers varied substantially across countries. South Africa placed last among the 30 countries for the share of the sample who answered at least five of the seven basic financial questions correctly. In 2014, the S&P Global FinLit Survey, conducted surveys in over 140 countries (Klapper, Lusardi & van Oudheusden, 2016). Relative to other countries, South Africa performed better in the S&P Global FinLit Survey than in the OECD surveys. The researchers define financial literacy as answering at least three of four questions correctly. In South Africa, 42 percent of respondents reach this benchmark in comparison to 35 in Brazil, 38 in Russia, 24 in India, and 28 in China. The richest countries, as measured by gross domestic product per capita (GDP), generally have higher rates of financial literacy. Interestingly, there is no relationship between GDP and financial literacy in the poorer half of countries. The positive relationship only kicks in for the richer half. Within countries, female, less-educated, and low-income respondents display lower levels of financial literacy. However, the surveys find no differences across gender in South Africa and China. Results of both global and single country surveys of financial literacy show large gender gaps in most countries. Three leading explanations are advanced as to why women are less financially literate that men. First, the gap may be generated by differences in education, age, and income between men and women in the samples. However, the gap persists even controlling for demographic and economic characteristics (Fonseca, et al., 2012, Bucher-Koenen, et al., 2017). Second, within households, men may specialize in managing finances and so accumulate greater financial literacy (Hsu, 2015). This theory cannot explain why single women are less financial literate than single men (Brown & Graf, 2013; Bucher-Koenen et al. (2017). Third, differences in labour market participation may explain the gender gap. However, Sweden has high rates of labour market participation for women and yet the gender gap persists (Almenberg & Save-Soderbergh, 2011). As mentioned above, the S&P Global FinLit Survey found no differences in financial literacy between men and women in South Africa and China. East Germany (Bucher-Koenen & Lusardi, 2011) and Russia (Klapper & Panos,2011) also lack a gender gap in financial literacy. Detailed analysis of these countries may reveal how policymakers may close the financial literacy gender gap. 2.2 Previous research on South Africa Both the S&P Global FinLit Survey and the OECD INFE surveys include South Africa. The S&P Global FinLit Survey does not provide detail on specific countries whereas the South African data form the OECD INFE survey provides considerable detail.1
1 The OECD INFE questions were included as a module of the South African Social Attitudes Survey. See Roberts, Struwig & Gordon (2016) for a descriptive report.

4
Less educated and poor respondents answered fewer financial quiz questions correctly (Roberts, Struwig & Gordon, 2016). Even though levels of financial literacy are low, over half the respondents confirmed that they were confident enough in their own knowledge to make financial decisions without financial advice. Most South Africans lack precautionary savings. Fifteen percent of respondents could not cover a week’s expenses if they lost their main source of income. Most respondents resort to credit or borrowing from friends and family to manage income fluctuations. Regarding long-term saving, 40 percent had no retirement plan and only 14 percent were confident in their retirement plan. Before the OECD INFE survey was conducted in South Africa, no nationally representative survey measured financial literacy using the direct approach pioneered by Lusardi and Mitchell. As a substitute for a direct measure, Nanziri & Leibbrandt (2018) constructed an index of financial literacy using FinScope surveys for the period 2005 to 2009. Scores on the index are strongly related to education and income. Less educated and low income respondents have low values on Nanziri & Leibbrandt’s (2018) financial literacy index.
3 Data
3.1 Setting South Africa has a highly sophisticated financial sector, comparable to developed countries. The array of financial products includes savings accounts, credit cards, overdraft facilities, student loans, mutual funds, mortgages, vehicle financing, retirement annuities, and offshore accounts. The Johannesburg Stock Exchange (JSE) is the 16th largest in the world―larger than Taiwan, Brazil, or Spain.2 In South Africa’s case, a highly sophisticated financial sector does not imply economic prosperity. Gross national income per capita is ten times smaller than the United States and South Africa has one of the highest levels of income and wealth inequality in the world. Much of South Africa’s economic challenges stem from decades of racial discrimination by the Apartheid government. Before 1994, the use of financial services was restricted to less than 15% of the population categorised as "white" by the Apartheid government. Informal alternatives, such as rotating saving and credit associations (ROSCAs) or ‘Stokvels’ as they are known in South Africa, filled some of the gap in access to financial services. Stokvels are helpful for short term loans and saving but cannot replace other formal financial services such as housing loans and mutual funds. The Apartheid system left a substantial gap in financial access. As part of the reconstruction and development of post-Apartheid South Africa, a Financial Sector Charter was developed to ensure access to financial services.3 The ‘Charter’ mandated the development of a low-cost account, the Mzansi account, and the extension of credit to those who were previously excluded from the formal financial system. The South African government also delivers several social grants directly into recipients’ bank accounts - the South African Social Security
2 Using 2017 data from the World Federation of Exchanges Annual Statistics Guide, available at http://www.world-exchanges.org/home/index.php/statistics/annual-statistics 3 See Reconstruction and Development Plan (1994) for more information.
5
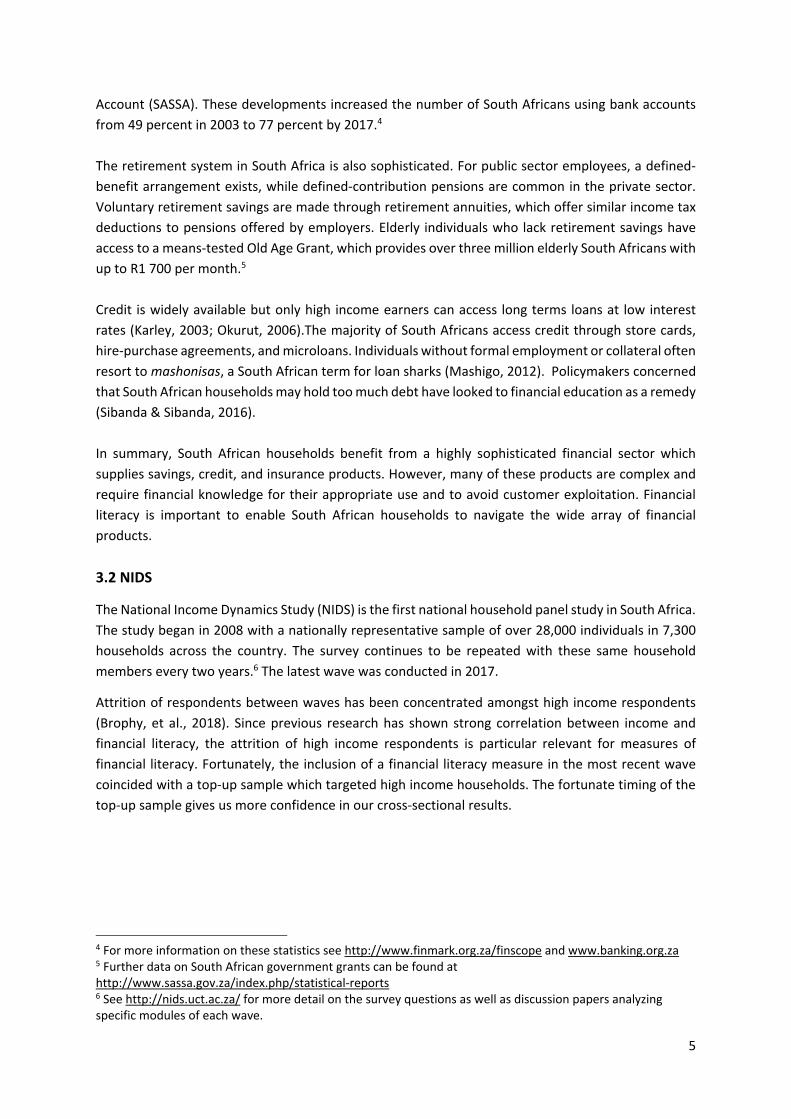
Account (SASSA). These developments increased the number of South Africans using bank accounts from 49 percent in 2003 to 77 percent by 2017.4
The retirement system in South Africa is also sophisticated. For public sector employees, a defined-benefit arrangement exists, while defined-contribution pensions are common in the private sector. Voluntary retirement savings are made through retirement annuities, which offer similar income tax deductions to pensions offered by employers. Elderly individuals who lack retirement savings have access to a means-tested Old Age Grant, which provides over three million elderly South Africans with up to R1 700 per month.5 Credit is widely available but only high income earners can access long terms loans at low interest rates (Karley, 2003; Okurut, 2006).The majority of South Africans access credit through store cards, hire-purchase agreements, and microloans. Individuals without formal employment or collateral often resort to mashonisas, a South African term for loan sharks (Mashigo, 2012). Policymakers concerned that South African households may hold too much debt have looked to financial education as a remedy (Sibanda & Sibanda, 2016). In summary, South African households benefit from a highly sophisticated financial sector which supplies savings, credit, and insurance products. However, many of these products are complex and require financial knowledge for their appropriate use and to avoid customer exploitation. Financial literacy is important to enable South African households to navigate the wide array of financial products. 3.2 NIDS
The National Income Dynamics Study (NIDS) is the first national household panel study in South Africa. The study began in 2008 with a nationally representative sample of over 28,000 individuals in 7,300 households across the country. The survey continues to be repeated with these same household members every two years.6 The latest wave was conducted in 2017.
Attrition of respondents between waves has been concentrated amongst high income respondents (Brophy, et al., 2018). Since previous research has shown strong correlation between income and financial literacy, the attrition of high income respondents is particular relevant for measures of financial literacy. Fortunately, the inclusion of a financial literacy measure in the most recent wave coincided with a top-up sample which targeted high income households. The fortunate timing of the top-up sample gives us more confidence in our cross-sectional results.
4 For more information on these statistics see http://www.finmark.org.za/finscope and www.banking.org.za 5 Further data on South African government grants can be found at http://www.sassa.gov.za/index.php/statistical-reports 6 See http://nids.uct.ac.za/ for more detail on the survey questions as well as discussion papers analyzing specific modules of each wave.
6
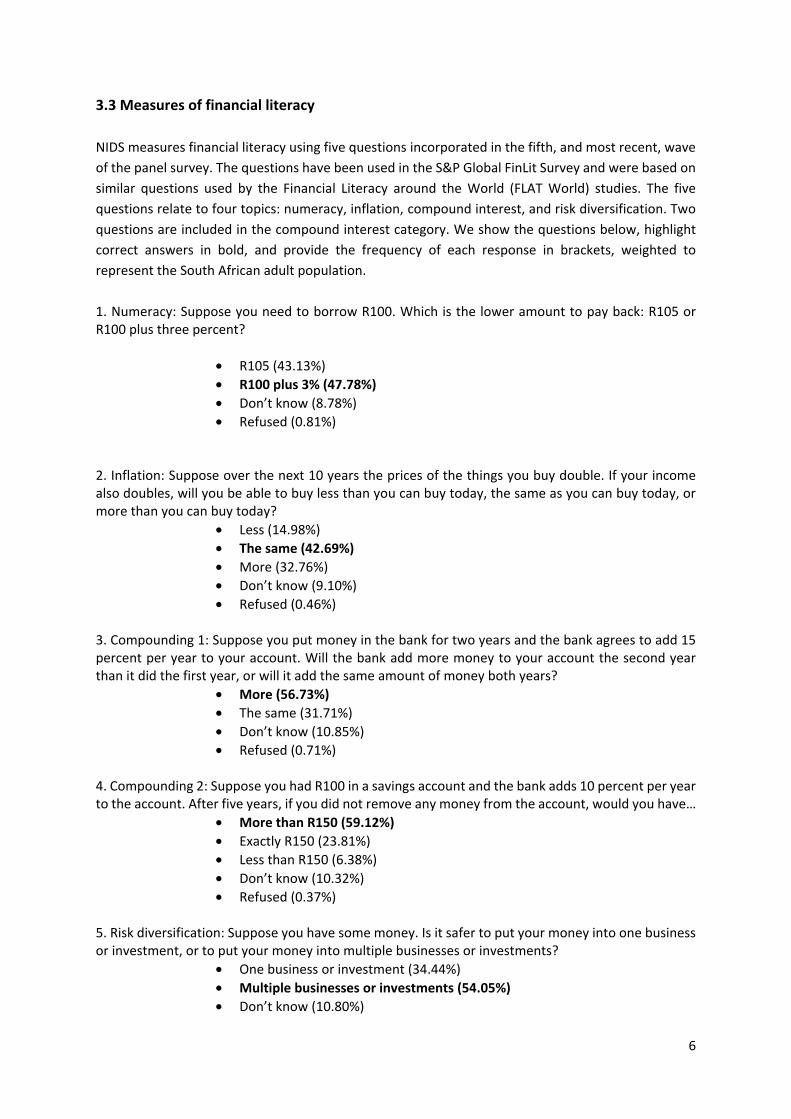
3.3 Measures of financial literacy NIDS measures financial literacy using five questions incorporated in the fifth, and most recent, wave of the panel survey. The questions have been used in the S&P Global FinLit Survey and were based on similar questions used by the Financial Literacy around the World (FLAT World) studies. The five questions relate to four topics: numeracy, inflation, compound interest, and risk diversification. Two questions are included in the compound interest category. We show the questions below, highlight correct answers in bold, and provide the frequency of each response in brackets, weighted to represent the South African adult population. 1. Numeracy: Suppose you need to borrow R100. Which is the lower amount to pay back: R105 or R100 plus three percent?
• R105 (43.13%) • R100 plus 3% (47.78%) • Don’t know (8.78%) • Refused (0.81%)
2. Inflation: Suppose over the next 10 years the prices of the things you buy double. If your income also doubles, will you be able to buy less than you can buy today, the same as you can buy today, or more than you can buy today?
• Less (14.98%) • The same (42.69%) • More (32.76%) • Don’t know (9.10%) • Refused (0.46%)
3. Compounding 1: Suppose you put money in the bank for two years and the bank agrees to add 15 percent per year to your account. Will the bank add more money to your account the second year than it did the first year, or will it add the same amount of money both years?
• More (56.73%) • The same (31.71%) • Don’t know (10.85%) • Refused (0.71%)
4. Compounding 2: Suppose you had R100 in a savings account and the bank adds 10 percent per year to the account. After five years, if you did not remove any money from the account, would you have…
• More than R150 (59.12%) • Exactly R150 (23.81%) • Less than R150 (6.38%) • Don’t know (10.32%) • Refused (0.37%)
5. Risk diversification: Suppose you have some money. Is it safer to put your money into one business or investment, or to put your money into multiple businesses or investments?
• One business or investment (34.44%) • Multiple businesses or investments (54.05%) • Don’t know (10.80%)

7
• Refused (0.71%) The distribution of responses matches the South African OECD INFE survey conducted in 2015. In both NIDS and the OECD INFE survey respondents found the inflation question the most difficult to answer.7 We find this result puzzling. Pooling all 30 countries included in the OECD INFE surveys, 63 percent answered the inflation question correctly in comparison to only 25 percent of South Africans (Atkinson, 2016). In the S&P Global FinLit Survey and in most FLAT World studies, inflation is well understood (Klapper, Lusardi & van Oudheusden, 2016). In Table 1, we have provided the frequency of correct responses by category for the FLAT World studies. Notice that Chile is an exception. Only 18 percent of respondents in Chile answered the inflation question correctly in comparison to 47 and 41 percent on the interest and risk questions.8 We define an individual as financial literate if he or she provides correct answers in at least three of the four financial literacy categories―the approach used in the S&P FintLit Survey. In the interest compounding category, where we have two questions, we count the category if the individual selected the correct answer for at least one of the questions. According to this measure, we estimate that 40.57 percent of South Africans are financially literate, which is very similar to the S&P FintLit Survey estimate of 42 percent.
4 Financial literacy and demographics
4.1 Differences by education, income, wealth, employment, and age As in other countries, we find large variation in financial literacy among respondents. In Table 2, for each question we show the percentage of respondents who provided a correct answer and the percentage who responded “don’t know” split by age, gender, education, Apartheid era classifications, income, wealth, and employment status. We also show the percentage of respondents who provided correct answers in at least three of the four financial literacy categories. The South African case follows most patterns found in other countries. Financial literacy increases sharply with educa on, income, and wealth―a consistent pa ern found in the studies listed in Table 1. In the education categories, we find sharp increases in financial literacy if the respondent completed matric and then again if the respondent completed a university degree or diploma. Matric is a standardised set of exams which students take after completing seven years of primary school and five years of high school. Entrance to university is usually conditional on passing the matric examinations. Interestingly, respondents who hold technical qualifications (without a matric) display levels of financial literacy comparable to matriculants. The differences in financial literacy by education level are expected. Financial literacy may be taught as a component of school
7 The OECD INFE survey asked different questions and opted for numerical responses rather than multiple choice so we do not attempt to provide deeper comparisons between the two surveys. 8 The NIDS questions are identical to S&P FinLit Survey but different from the FLAT World studies so we are cautious of making a direct comparison with Chile. We would like to check the NIDS results against the S&P FinLit Survey but Klapper, Lusardi & van Oudheusden’s (2016) report only provides an index rather than the question level response rates.

8
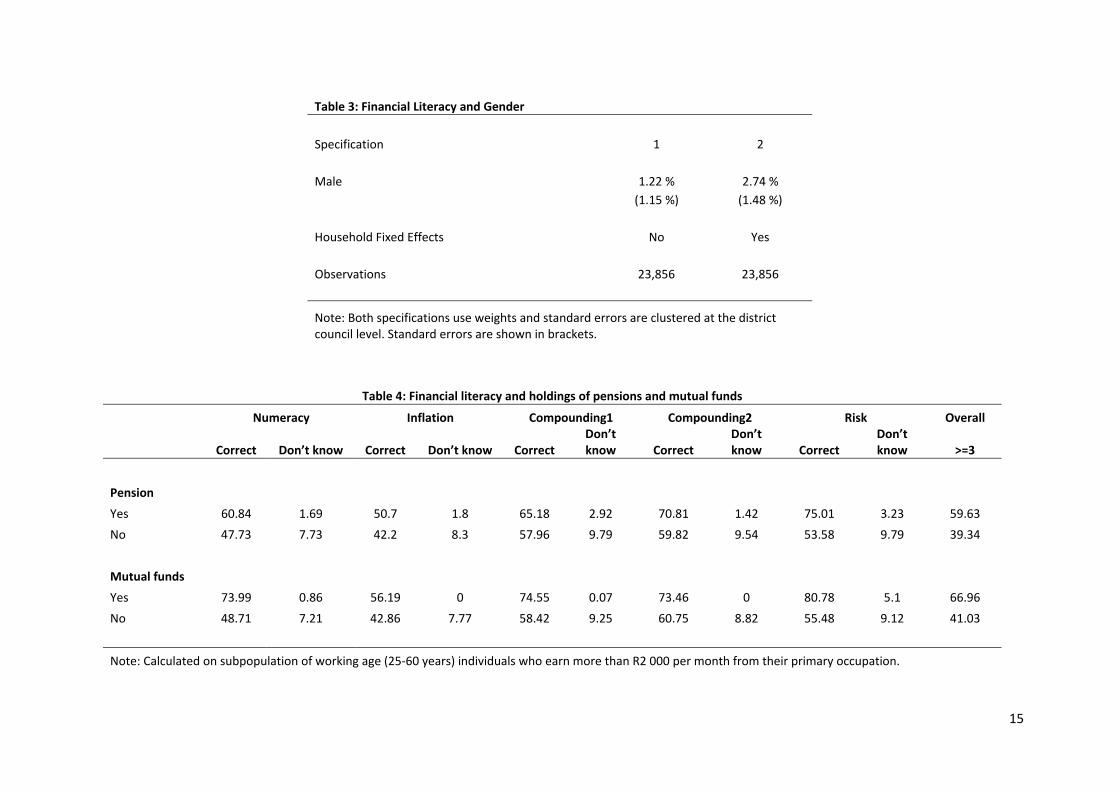
subjects such as accounting or economics, and skills in mathematics are necessary for many financial calculations. We find large differences in financial literacy by household income and wealth. For income, 63.3 percent of respondents living in households with income of more than R30 000 per month are financially literate in comparison to 34.1 percent in households with less than R5 000 income per month. 59.5 percent of respondents in the top household wealth decile are financially literate in comparison to 37.6 in the bottom 90 percent. Since financial literacy enables individuals to find investments with higher returns (Clark, Lusardi, and Mitchell, 2017; Bianchi, 2018), individuals with high income and wealth may see greater benefits to acquiring financial literacy (Jappelli & Padula, 2013, Lusardi, Michaud, and Mitchell, 2017). The greater benefit stems from a greater need to smooth consumption. A household with a high income during working years needs to save more to maintain the same income during retirement. The more a household needs to save, the more benefit the household receives from higher investment returns. Employees within the financial sector are more financially literate than those employed in other sectors. Familiarity with financial topics is a requirement for most jobs in the financial sector so we expect this difference. However, we cannot assume jobs in the financial sector provide financial literacy. It may be that individuals who have a greater ability to learn financial topics may have a stronger preference for jobs in the financial sector. Since respondents who were categorised as “white” by the Apartheid government were privileged with greater access to education, employment, and investment opportunities, we observe large differences in financial literacy by Apartheid era racial classifications. The United States, which has a similar history of racial discrimination, also shows large differences in financial literacy by racial categories (Lusardi and Mitchell, 2011c). Financial literacy declines linearly with age, as found in most emerging economies (Klapper, Lusardi & van Oudheusden’s, 2016). In contrast, most developed countries display a “hump-shaped” profile ― the youngest and oldest are less financially literate than middle-aged respondents. 4.2 No difference by gender We find no difference in financial literacy by gender. Although men provide a slightly higher percentage of correct answers, the difference is not statistically different from zero. Even within households, we find no statistically significant difference in financial literacy related to gender. We run the following regression, using weights and accounting for the complex survey design: = + + We add household fixed effects to isolate within-household differences in financial literacy between men and women. The results are shown in Table 3. Once we isolate within household variation, the point estimate increases from 1.22 % to 2.74 % but the standard error is still large. Men are more financially literature than women within some households but this difference is not widespread across South Africa.

9
The lack of a gender gap in financially literacy in South Africa is surprising given that most countries show large differences and there is no obvious reason why South Africa would be different. Across the 130 countries included in the S&P FinLit Survey, only South Africa and China do not show a gender gap in financial literacy (Klapper, Lusardi & van Oudheusden’s, 2016). With a different measure of financial knowledge, the OECD INFE surveys do find a statistically significant difference between men and women in South Africa. However, the gender gap is absent in 11 of the 30 countries included in the OECD INFE surveys (Atkinson, 2016). For the studies involving individual countries, listed in Table 1, the gender gap is absent in only Russia (Klapper & Panos (2011) and East Germany (Bucher-Koenen & Lusardi (2011). A number of factors could explain why South African men and women have similar levels of financial literacy. Gender roles in South Africa could differ to other countries. South Africa may have a higher share of female headed households, due in part to the AIDS epidemic (Schatz et al, 2011). Or, South African households may not have sufficient wealth to benefit from one member specialising in financial activities. Some or all of these reasons could play a role. We leave further analysis to future research.
5 Financial literacy and economic well-being
5.1 Preparation for retirement The South African government provides an old age grant of R1 700 per month to individuals over 60 years old, if the individual's income and wealth is below a threshold. Over 3 million individuals receive the old age grant.9 If an individual's monthly wage is close to this amount, there is little motivation to accumulate private retirement savings. Therefore, we focus on a subpopulation of working-age individuals whose wage is greater than R2 000 to study the relationship between financial literacy and private retirement savings. We define working-age as between 25 and 60 years. In Table 4, we compare the share of correct responses and the share of individuals who answered "don't know" to the question on whether they have a private pension and those who did not. We also compare individuals who indicated they hold mutual funds, stocks, or shares to those who did not. Despite South Africa's developed financial market, only a small group of South Africans hold these investment products. Just 10.59 percent of the working-age subpopulation indicated they have a pension and only 1.53 percent indicated they hold mutual funds, stocks, or shares. Table 4 shows a clear pattern. Holders of pensions or mutual funds are far more likely to answer financial literacy questions correctly and far less likely to answer "don't know". The difference in correct responses is particularly large for the risk question. An important benefit of mutual funds is to diversify risk and it appears that holders of mutual funds understand this benefit. As in previous studies, we find that financial literacy matters for retirement preparation even after controlling for a number of socio-demographic variables. In Table 5, we use a logit model to explain
9 South African grant statistics are available from http://www.sassa.gov.za/
10
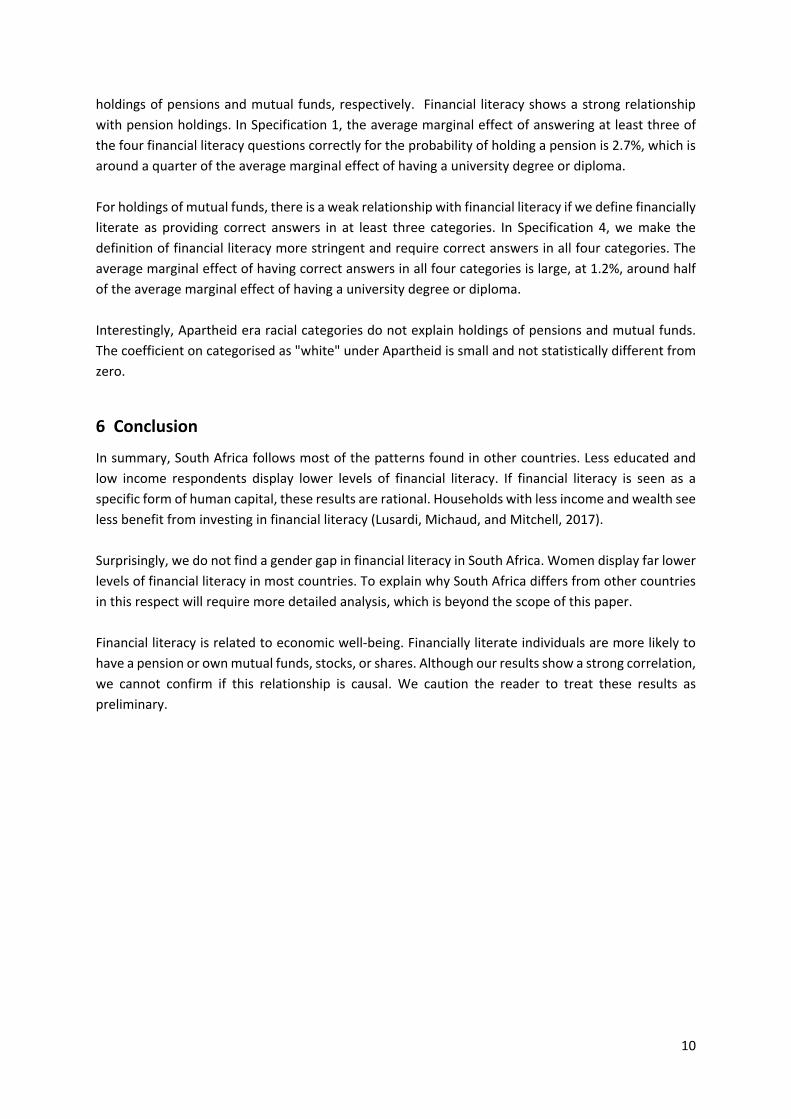
holdings of pensions and mutual funds, respectively. Financial literacy shows a strong relationship with pension holdings. In Specification 1, the average marginal effect of answering at least three of the four financial literacy questions correctly for the probability of holding a pension is 2.7%, which is around a quarter of the average marginal effect of having a university degree or diploma. For holdings of mutual funds, there is a weak relationship with financial literacy if we define financially literate as providing correct answers in at least three categories. In Specification 4, we make the definition of financial literacy more stringent and require correct answers in all four categories. The average marginal effect of having correct answers in all four categories is large, at 1.2%, around half of the average marginal effect of having a university degree or diploma. Interestingly, Apartheid era racial categories do not explain holdings of pensions and mutual funds. The coefficient on categorised as "white" under Apartheid is small and not statistically different from zero.
6 Conclusion
In summary, South Africa follows most of the patterns found in other countries. Less educated and low income respondents display lower levels of financial literacy. If financial literacy is seen as a specific form of human capital, these results are rational. Households with less income and wealth see less benefit from investing in financial literacy (Lusardi, Michaud, and Mitchell, 2017). Surprisingly, we do not find a gender gap in financial literacy in South Africa. Women display far lower levels of financial literacy in most countries. To explain why South Africa differs from other countries in this respect will require more detailed analysis, which is beyond the scope of this paper. Financial literacy is related to economic well-being. Financially literate individuals are more likely to have a pension or own mutual funds, stocks, or shares. Although our results show a strong correlation, we cannot confirm if this relationship is causal. We caution the reader to treat these results as preliminary.

11
References Almenberg, J. and Säve-Söderbergh, J., 2011. Financial literacy and retirement planning in Sweden. Journal of
Pension Economics & Finance, 10(4), pp.585-598. Atkinson, A. & Messy, F.A., 2011. Assessing financial literacy in 12 countries: an OECD/INFE international pilot
exercise. Journal of Pension Economics & Finance, 10(4), pp.657-665. Atkinson, A. & F. Messy, 2012. Results of the OECD / International Network on Financial Education (INFE) Pilot
Study, OECD Working Papers on Finance, Insurance and Private Pensions, no. 15. Atkinson, A. 2016. OECD/INFE International Survey of Adult Financial Literacy Competencies. OECD Report Bianchi, M., 2018. Financial literacy and portfolio dynamics. The Journal of Finance, 73(2), pp.831-859. Brophy, T., Branson, N., Daniels, R.C., Leibbrandt, M., Mlatsheni, C., & Woolard, I., 2018. National Income
Dynamics Study panel user manual. Release 2018. Version 1. Cape Town: Southern Africa Labour and Development Research Unit.
Brown, M. and Graf, R., 2013. Financial literacy and retirement planning in Switzerland. Numeracy, 6(2), p.6. Bucher-Koenen, T. and Lusardi, A., 2011. Financial literacy and retirement planning in Germany. Journal of
Pension Economics & Finance, 10(4), pp.565-584. Bucher-Koenen, T., Lusardi, A., Alessie, R. and Van Rooij, M., 2017. How financially literate are women? An
overview and new insights. Journal of Consumer Affairs, 51(2), pp.255-283. Clark, R., Lusardi, A. and Mitchell, O.S., 2017. Financial knowledge and 401 (k) investment performance: A case
study. Journal of Pension Economics & Finance, 16(3), pp.324-347. Fonseca, R., Mullen, K.J., Zamarro, G. and Zissimopoulos, J., 2012. What explains the gender gap in financial
literacy? The role of household decision-making. Journal of Consumer Affairs, 46(1), pp.90-106. Hsu, J.W., 2016. Aging and strategic learning: The impact of spousal incentives on financial literacy. Journal of
Human Resources, 51(4), pp.1036-1067. Jappelli, T. and Padula, M., 2013. Investment in financial literacy and saving decisions. Journal of Banking &
Finance, 37(8), pp.2779-2792. Karley, N.K., 2003. Challenges in mortgage lending for the under-served in South Africa. Housing Finance
International, 18(1), pp.27-33. Klapper, L., Lusardi, A. & van Oudheusden, P., 2016. Financial literacy around the world: Insights from Standard
& Poor’s Rating Services Global Financial Literacy Survey. Klapper, L. and Panos, G.A., 2011. Financial literacy and retirement planning: the Russian case. Journal of
Pension Economics & Finance, 10(4), pp.599-618. Lusardi, A., Michaud, P.C. and Mitchell, O.S., 2017. Optimal financial knowledge and wealth inequality. Journal
of Political Economy, 125(2), pp.431-477. Lusardi, A. and Mitchell, O.S., 2011a. Financial literacy around the world: An overview. Journal of Pension
Economics & Finance, 10(4), pp.497-508. Lusardi, A., & Mitchell, O.S. 2011b. Financial Literacy and Planning: Implications for Retirement Well-being. In,
Financial Literacy: Implications for Retirement Security and the Financial Marketplace. Oxford University Press.
Lusardi, A. and Mitchell, O.S., 2011. Financial literacy and retirement planning in the United States. Journal of Pension Economics & Finance, 10(4), pp.509-525.
Lusardi, A. and Mitchell, O.S., 2014. The economic importance of financial literacy: Theory and evidence. Journal of Economic Literature, 52(1), pp.5-44.
Mashigo, P., 2012. The lending practices of township micro-lenders and their impact on the low-income households in South Africa: a case study for Mamelodi township. New Contree: A journal of historical and human sciences for Southern Africa, (65), pp.23-46.
Nanziri, E. L.; Leibbrandt, M. 2018. Measuring and profiling financial literacy in South Africa. South African Journal of Economic and Management Sciences, 21 (1). pp.1-17
Okurut, F.N., 2006. Access to credit by the poor in South Africa: Evidence from household survey data 1995 and 2000. Stellenbosch Economic Working Papers, 13/06. Roberts, B., Struwig, J., and Gordon, S (2016). Financial literacy in South Africa: Results from the 2015 South African Social Attitudes Survey round. Report prepared by the Human Sciences Research Council on behalf of the Financial Services Board. Pretoria: Financial Services Board.
Schatz, E., Madhavan, S. and Williams, J., 2011. Female-headed households contending with AIDS-related hardship in rural South Africa. Health & place, 17(2), pp.598-605.
Sibanda, S. & Sibanda, T. 2017. Financial Education in South Africa - Overview of key initiatives and actors. International Labour Office, Social Finance Programme. ISBN: 9789221310785

12
van Rooij, M., Lusardi, A. and Alessie, R., 2011. Financial literacy and stock market participation. Journal of Financial Economics, 101(2), pp.449-472.

13
Table 1: Nationally representative household surveys on financial literacy
Who is financially illiterate? Frequency of correct
responses
Country Year of
data Sample
Size Gender Age Education Income Interest Inflation Risk Citation
Netherlands 2005, 2010 1 665 Female No difference
Less educated - 85 77 52
Alessie, van Rooij, and Lusardi (2011)
Italy 2006 3 992 Female Young (<35) and old
(>65) Less
educated - 40 59 52 Fornero and Monticone (2011)
United States 2009 1 488 Female
Young (<35) and old (>65)
Less educated - 65 64 52 Lusardi and Mitchell (2011)
Germany 2009 1 059 Female (a) Young (<35) and old
(>65) Less
educated - 82 78 61 Bucher-Koenen & Lusardi (2011)
Russia 2009 1 400 No
difference Older Less
educated - 36 51 13 Klapper & Panos (2011)
Chile 2009 14 500 Female Old (>65) Less
educated Low
income 47 18 41 Garabato Moure (2015)
New Zealand 2009, 2010 1 250 Female
Young (<35) and old (>65)
Less educated - 86 81
76 (b)
Crossan, Feslier & Hurnard (2011)
Sweden 2010 1 032 Female Young (<35) and old
(>65) Less
educated Low
income 49 60 69 Almanberg & Save-Soderbergh (2011)
Japan 2010 5 386 Female Young (<35) Less
educated Low
income 71 59 56 Sekita (2011)
Switzerland 2011 1 500 Female Young (<35) and old
(>65) Less
educated Low
income 79 78 74 Brown & Graf (2013)
France 2011 3 616 Female Young (<35) and old
(>65) Less
educated - 48 61 67 Arrondel, Debbich, and Savignac (2013)
Romania 2011 1 030 Female Old (>65) Less
educated - 41 32 14 Beckmann (2013)
Australia 2012 1 024 Female Young (<35) Less
educated - 83 69 55 Agnew, Bateman, and Thorp (2013)
Canada 2012 6 805 Female Young (<35) and old
(>65) Less
educated - 78 66 59 Boisclair, Lusardi, and Michaud (2017)
Finland 2014 1 477 Female Young (<35) and old
(>65) Less
educated Low
income 58 77 66 Kalmi & Ruuskanen (2017)
Notes: (a) Female in West Germany but no difference in East Germany. (b) Combined responses in the risk question in New Zealand because the correct answer was ambiguous.
Tables

14
Table 2: The Distribution of Financial Literacy by Demographics Numeracy Inflation Compounding 1 Compounding 2 Risk Overall Correct Don’t know Correct Don’t know Correct Don’t know Correct Don’t know Correct Don’t know >=3 Age category 0 - 35 48.9 6.2 43.7 6.5 57.7 8.1 60.5 7.0 57.2 8.8 42.3 35 - 55 47.8 9.1 42.6 9.8 57.3 11.6 60.1 10.9 54.6 10.5 40.3 55 - 65 44.1 16.2 39.9 16.9 52.5 20.4 52.8 20.7 44.7 20.2 36.5 65 + 44.0 20.4 39.2 21.2 52.3 24.6 53.1 23.2 41.2 24.7 34.7 Gender Male 48.3 8.0 43.0 8.9 58.8 10.0 59.5 9.9 56.0 9.9 41.2 Female 47.2 10.0 42.4 10.1 55.0 13.0 58.8 11.4 52.3 12.9 40.0 Education No schooling 36.6 28.9 30.1 31.1 36.5 33.3 39.7 33.1 27.8 33.9 23.4 Primary 38.0 18.7 35.5 21.7 48.1 24.6 47.0 23.8 36.9 22.8 26.5 High school 44.8 8.4 41.2 9.1 56.8 11.3 59.8 10.2 51.2 11.9 37.9 Technical 52.8 6.0 45.1 5.1 59.1 6.4 59.8 6.3 61.9 6.1 45.0 Matric 53.6 4.6 48.5 4.4 60.6 5.8 65.2 5.2 61.5 5.7 48.3 Degree or diploma 59.2 3.3 49.1 2.5 66.0 4.5 68.2 2.7 73.7 3.8 56.1 Apartheid era categories African 46.1 9.6 41.1 10.4 55.4 12.1 57.1 11.4 52.1 12.2 38.0 Coloured 45.0 8.4 43.0 8.7 57.2 12.4 60.0 10.6 54.1 12.8 40.5 Asian/Indian 58.5 2.6 51.1 1.5 67.7 5.0 70.6 3.1 52.7 6.6 45.8 White 66.3 6.0 57.9 3.3 67.9 6.5 77.7 4.5 76.3 4.1 67.7 Income 0- 44.0 10.8 39.4 11.4 54.4 13.5 55.9 12.5 47.5 14.3 34.1 5000- 48.3 9.2 43.0 10.1 55.5 11.9 58.5 11.3 53.3 11.6 40.2 15000- 51.3 7.7 45.8 6.6 60.2 9.2 60.3 8.5 61.1 7.8 46.9 30000- 58.0 2.9 52.0 2.9 68.0 4.4 75.3 2.8 77.8 3.6 63.3 Wealth Bottom 90% 46.6 9.6 41.4 10.4 55.0 12.4 57.2 11.7 50.9 12.6 37.6 Top 10% 55.5 5.8 50.8 4.4 67.6 6.2 71.4 4.4 74.0 4.7 59.5 Employment Not employed 45.5 11.2 40.2 12.1 54.7 14.2 57.3 13.3 49.7 14.6 37.3 Employed in non-financial sector 50.3 6.5 46.2 6.6 58.4 8.8 61.2 7.4 58.1 7.7 43.6 Employed in the financial sector 53.1 3.5 49.7 3.5 62.5 4.6 64.4 3.5 69.8 5.9 52.8
15
Table 3: Financial Literacy and Gender Specification 1 2
Male 1.22 % 2.74 %
(1.15 %) (1.48 %)
Household Fixed Effects No Yes
Observations 23,856 23,856
Note: Both specifications use weights and standard errors are clustered at the district council level. Standard errors are shown in brackets.
Table 4: Financial literacy and holdings of pensions and mutual funds
Numeracy Inflation Compounding1 Compounding2 Risk Overall
Correct Don’t know Correct Don’t know Correct Don’t know Correct
Don’t know Correct
Don’t know >=3
Pension Yes 60.84 1.69 50.7 1.8 65.18 2.92 70.81 1.42 75.01 3.23 59.63 No 47.73 7.73 42.2 8.3 57.96 9.79 59.82 9.54 53.58 9.79 39.34
Mutual funds Yes 73.99 0.86 56.19 0 74.55 0.07 73.46 0 80.78 5.1 66.96 No 48.71 7.21 42.86 7.77 58.42 9.25 60.75 8.82 55.48 9.12 41.03 Note: Calculated on subpopulation of working age (25-60 years) individuals who earn more than R2 000 per month from their primary occupation.

16
Table 5: Average marginal effects of financial literacy on pension and mutual fund holdings
Dependent variable Has pension Has mutual funds, stocks, or
shares Mean of dependent variable 10.59 % 1.53 %
(0.72 %) (0.23 %)
Specification 1 2 3 4
Financial literacy measure Correct in at least three categories 2.7 .43
(.8) (.32) Correct in all four categories 2.9 1.2
(1.0) (.5)
Socio-demographic controls Age .13 .13 .01 .01
(.04) (.04) (.02) (.02) Female -3.7 -3.7 -.32 -.29
(.8) (.8) (.33) (.33) Married .75 .73 -.44 -.49
(.84) (.86) (.38) (.39) Degree or diploma from university 8.3 8.2 2.5 2.4
(1.4) (1.5) (.6) (.5) Categorised as "white" under Apartheid 1.0 .9 .5 .3
(1.1) (1.2) (.5) (.4) Household Income (base < R5 000) R5 000 - R15 000 6.5 6.7 -.32 -.32
(.9) (.9) (.34) (.35) R15 000 - R30 000 16.3 16.4 1.1 .011
(1.7) (1.8) (.6) (.6) R30 000 + 18.5 (18.8) 2.6 2.7
(2.1) (2.2) (1.0) (1.1) Household Wealth (base bottom 90) Top 10 5.6 5.9 .6 .7
(1.2) (1.2) (.4) (.4)
Number of observations 12,337 12,337 12,337 12,337
Note: Calculated on subpopulation of working age (25-60 years) individuals who earn more than R2 000 per month from their primary occupation. We use weights and account for the complex survey design.

The Southern Africa Labour and Development Research Unit (SALDRU) conducts research directed at improving the well-being of South Africa’s poor. It was established in 1975. Over the next two decades the unit’s research played a central role in documenting the human costs of apartheid. Key projects from this period included the Farm Labour Conference (1976), the Economics of Health Care Conference (1978), and the Second Carnegie Enquiry into Poverty and Development in South Africa (1983-86). At the urging of the African National Congress, from 1992-1994 SALDRU and the World Bank coordinated the Project for Statistics on Living Standards and Development (PSLSD). This project provide baseline data for the implementation of post-apartheid socio-economic policies
through South Africa’s fi rst non-racial national sample survey.
In the post-apartheid period, SALDRU has continued to gather data and conduct research directed at informing and assessing anti-poverty policy. In line with its historical contribution, SALDRU’s researchers continue to conduct research detailing changing patterns of well-being in South Africa and assessing the impact of government policy on the poor. Current research work falls into the following research themes: post-apartheid poverty; employment and migration dynamics; family support structures in an era of rapid social change; public works and public infrastructure programmes, fi nancial strategies of the poor; common property resources and the poor. Key survey projects include the Langeberg Integrated Family Survey (1999), the Khayelitsha/Mitchell’s Plain
Survey (2000), the ongoing Cape Area Panel Study (2001-) and the Financial Diaries Project.
www.saldru.uct.ac.zaLevel 3, School of Economics Building, Middle Campus, University of Cape Town
Private Bag, Rondebosch 7701, Cape Town, South AfricaTel: +27 (0)21 650 5696Fax: +27 (0) 21 650 5797Web: www.saldru.uct.ac.za


![WHAT DRIVES YOUTH UNEMPLOYMENT AND WHAT … · (J-PAL); Vimal Ranchhod, Cecil Mlatsheni and Callie Ardington (Southern Africa Labour and Development Research Unit [SALDRU], UCT);](https://img.pdfslide.us/doc/110x75/5f0c97297e708231d4362947/what-drives-youth-unemployment-and-what-j-pal-vimal-ranchhod-cecil-mlatsheni.jpg)