Embed Size (px)
Citation preview
Financial Literacy and Planning: Implications for Retirement Wellbeing
Annamaria Lusardi Department of Economics
Dartmouth College Hanover, NH 03755 Tel: (603) 646-2099
E-mail: [email protected]
Olivia S. Mitchell Department of Insurance & Risk Management The Wharton School, Univ. of Pennsylvania
3620 Locust Walk, St. 3000 SH-DH Philadelphia, PA 19104
Tel: (215) 898-0424 E-mail: [email protected]
October 2006 The research reported herein was pursuant to a grant from the US Social Security Administration (SSA) funded as part of the Retirement Research Consortium (RRC) and the Pension Research Council at the Wharton School. Without implicating them, we are grateful for comments provided by Alberto Alesina, Rob Alessie, Maristella Botticini, John Campbell, Andrew Caplin, Sewin Chan, Gary Engelhardt, Alan Gustman, Mike Hurd, Arie Kapteyn, Mauro Mastrogiacomo, Mary Beth Ofstedal, William Rodgers, Chris Snyder, Maarten van Rooij, Arthur van Soest, Steve Utkus; and seminar participants at Dartmouth, Harvard, Rand, the NBER Macroeconomics and Individual Decision Making Conference, the 7th Annual Joint Conference of the Retirement Research Consortium, Washington, D.C., the conference on “Individual Behavior with Respect to Retirement Saving,” Turin, Italy, the 8th Annual Research Conference on “Pensions in an Ageing Society,” Dutch Central Bank, The Netherlands, the conference on “Increasing the Effectiveness of Financial Education: Lessons from Economics and Psychology,” Dartmouth College, the 2006 American Economic Association Meeting in Boston. Mark Christman and Jason Beeler provided excellent research assistance. Opinions and errors are solely those of the authors and not of the institutions with whom the authors are affiliated. The findings and conclusions of this paper do not represent the views of the SSA, any agency of the Federal Government, or the RRC.
Financial Literacy and Planning: Implications for Retirement Wellbeing
Annamaria Lusardi and Olivia S. Mitchell
Abstract
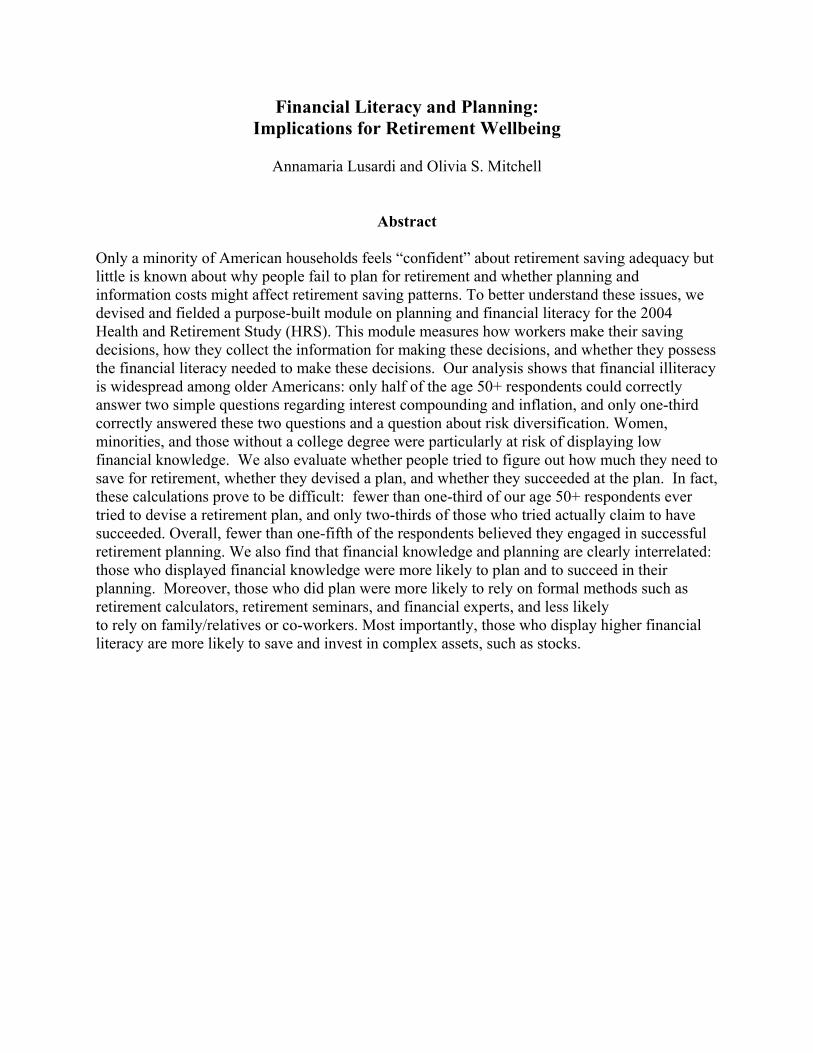
Only a minority of American households feels “confident” about retirement saving adequacy but little is known about why people fail to plan for retirement and whether planning and information costs might affect retirement saving patterns. To better understand these issues, we devised and fielded a purpose-built module on planning and financial literacy for the 2004 Health and Retirement Study (HRS). This module measures how workers make their saving decisions, how they collect the information for making these decisions, and whether they possess the financial literacy needed to make these decisions. Our analysis shows that financial illiteracy is widespread among older Americans: only half of the age 50+ respondents could correctly answer two simple questions regarding interest compounding and inflation, and only one-third correctly answered these two questions and a question about risk diversification. Women, minorities, and those without a college degree were particularly at risk of displaying low financial knowledge. We also evaluate whether people tried to figure out how much they need to save for retirement, whether they devised a plan, and whether they succeeded at the plan. In fact, these calculations prove to be difficult: fewer than one-third of our age 50+ respondents ever tried to devise a retirement plan, and only two-thirds of those who tried actually claim to have succeeded. Overall, fewer than one-fifth of the respondents believed they engaged in successful retirement planning. We also find that financial knowledge and planning are clearly interrelated: those who displayed financial knowledge were more likely to plan and to succeed in their planning. Moreover, those who did plan were more likely to rely on formal methods such as retirement calculators, retirement seminars, and financial experts, and less likely to rely on family/relatives or co-workers. Most importantly, those who display higher financial literacy are more likely to save and invest in complex assets, such as stocks.
2
Introduction American workers are increasingly responsible for securing their own retirement. Yet
only a minority of American households feels “confident” about retirement saving adequacy, and
one third of adults in their 50s say they have failed to develop any kind of retirement saving plan
at all (Lusardi 1999, 2003; Yakoboski and Dickemper, 1997). What explains this low level of
retirement preparedness? Why do people do such a poor job, when it comes to designing and
carrying out retirement saving plans? This paper explores the hypothesis that poor planning may
be a primary result of financial illiteracy. That is, we evaluate whether those who report that they
are unable to plan for retirement and/or who cannot carry out their retirement saving plans are
also those who are most unaware of fundamental economic concepts driving economic wellbeing
during the lifetime and in old age.
Previous studies offer few insights regarding the reasons why people do not plan for
retirement, nor do they illuminate the roles that planning and information costs might play in
affecting retirement saving decisions.1 To gain better insight into these issues, we have devised
and fielded a purpose-built module on planning and financial literacy for the 2004 Health and
Retirement Study (HRS). The module includes questions that measure how workers make their
saving decisions, how they collect the information for making these decisions, and whether they
possess the financial literacy needed to make these decisions.
Approach and Data
The theoretical framework used to model consumption/saving decisions posits that
rational and foresighted consumers derive utility from consumption over their lifetimes. In the
simplest format, the consumer has a lifetime expected utility, which is the expected value of the
3
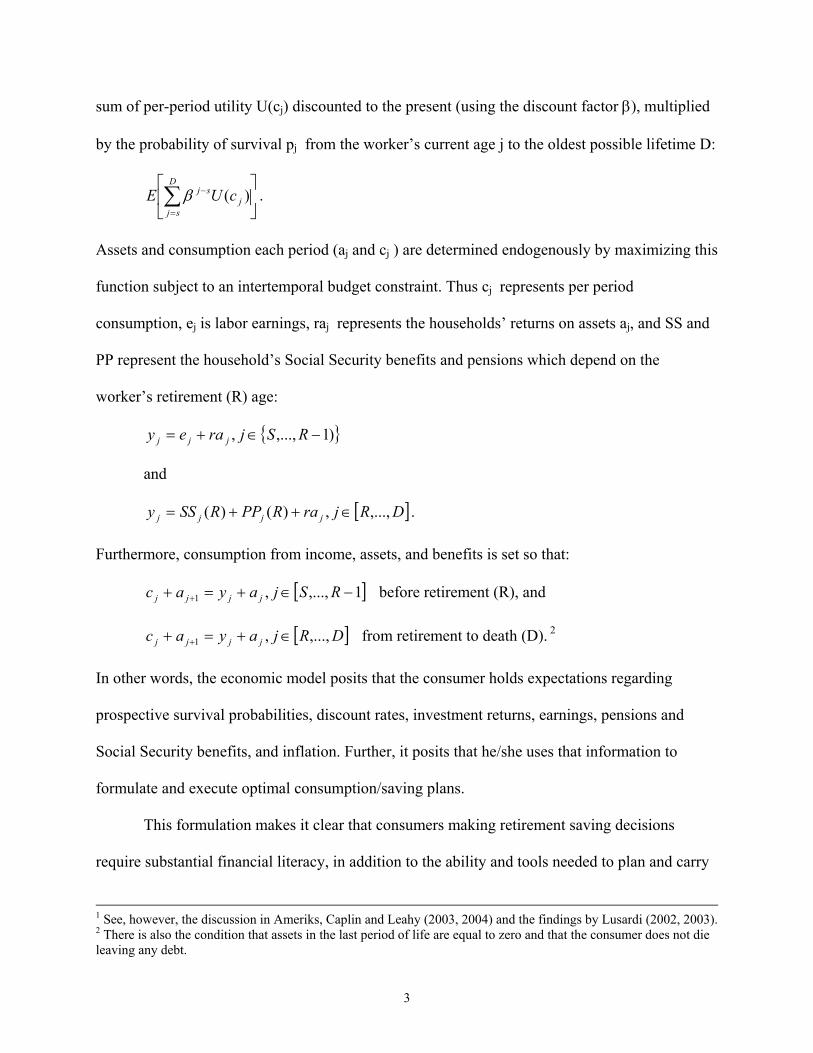
sum of per-period utility U(cj) discounted to the present (using the discount factor β), multiplied
by the probability of survival pj from the worker’s current age j to the oldest possible lifetime D:
∑=
− )( j
D
sj
sj cUE β .
Assets and consumption each period (aj and cj ) are determined endogenously by maximizing this
function subject to an intertemporal budget constraint. Thus cj represents per period
consumption, ej is labor earnings, raj represents the households’ returns on assets aj, and SS and
PP represent the household’s Social Security benefits and pensions which depend on the
worker’s retirement (R) age:
{ })1,...,, −∈+= RSjraey jjj
and
[ ]DRjraRPPRSSy jjjj ,...,,)()( ∈++= .
Furthermore, consumption from income, assets, and benefits is set so that:
[ ]1,...,,1 −∈+=+ + RSjayac jjjj before retirement (R), and
[ ]DRjayac jjjj ,...,,1 ∈+=+ + from retirement to death (D). 2
In other words, the economic model posits that the consumer holds expectations regarding
prospective survival probabilities, discount rates, investment returns, earnings, pensions and
Social Security benefits, and inflation. Further, it posits that he/she uses that information to
formulate and execute optimal consumption/saving plans.
This formulation makes it clear that consumers making retirement saving decisions
require substantial financial literacy, in addition to the ability and tools needed to plan and carry
1 See, however, the discussion in Ameriks, Caplin and Leahy (2003, 2004) and the findings by Lusardi (2002, 2003). 2 There is also the condition that assets in the last period of life are equal to zero and that the consumer does not die leaving any debt.
4
out retirement saving plans. Whether and how “real people” behave when confronted with this
challenge– that is, whether individuals seem to have knowledge of and the capability to plan and
implement these complex planning tasks – is a topic of substantial current interest.3 This subject
is particularly important in view of the fact that workers are increasingly being given
responsibility to save, manage their pension investments, and draw down their retirement assets
in the defined contribution pension environment. Accordingly, what is critically needed is new
information permitting analysts to investigate the links between financial literacy, the sources of
information that households rely on for their economic decision-making, and planning.
The Health and Retirement Study (HRS), a nationally representative longitudinal dataset
of Americans over the age of 50, has been designed to address these questions by tracking health,
assets, liabilities, and patterns of wellbeing in older households.4 Beginning in 1992, a 90-
minute core questionnaire has been administered every two years to age-eligible respondents and
their spouses. In addition, a random sample of respondents has also been subjected to very short
experimental modules in each wave, aimed at helping researchers assess additional topics of
substantive interest. For the 2004 HRS wave, we designed and administered a special module on
retirement planning, seeking to assess respondents’ level financial literacy along with their
efforts to budget, calculate, and develop retirement saving plans, in relatively few questions.
In particular, our module includes three questions on financial literacy, as follows:
- Suppose you had $100 in a savings account and the interest rate was 2% per year.
After 5 years, how much do you think you would have in the account if you left the
money to grow: more than $102, exactly $102, less than $102?
3 See for example Clark and D’Ambrosio (2002); Clark et al. (2003, 2004), EBRI (1996, 2001), Duflo and Saez (2003, 2004), Hancock (2002). 4 http://hrsonline.isr.umich.edu/
5
- Imagine that the interest rate on your savings account was 1% per year and inflation
was 2% per year. After 1 year, would you be able to buy more than, exactly the same
as, or less than today with the money in this account?
- Do you think that the following statement is true or false? “Buying a single company
stock usually provides a safer return than a stock mutual fund.”
The first two questions, which we refer to as “Compound Interest” and “Inflation,” help us
evaluate whether respondents display knowledge of fundamental economic concepts for saving
decisions as well as possess competence with basic financial numeracy. The third question,
which we dub “Stock Risk,” evaluates respondents’ knowledge of risk diversification, a crucial
element of an informed investment decision.
The module also asks respondents to discuss what they do to calculate their retirement
saving needs. Other surveys, including those devised by EBRI in its Retirement Confidence
Survey (RCS) and questionnaires developed by TIAA-CREF have previously asked respondents
whether they “plan for retirement,” a question we replicate here.5 More insight into this issue is
also afforded by our additional queries investigating not only whether people ever assessed their
retirement saving needs, but also what followed from such assessment. The questions about
retirement planning calculations are as follows:
- Have you ever tried to figure out how much your household would need to save for
retirement?
- Did you develop a plan for retirement saving?
- How often were you able to stick to this plan: Would you say always, mostly, rarely,
or never?
5 See Ameriks, Caplin and Leahy (2003), and the RCS questionnaire.

6
Finally, we also seek to assess what planning tools people rely on to devise and carry out
their retirement saving plans. Specifically, we inquired whether respondents contacted friends,
relatives, or experts, and whether they used retirement calculators. In addition, we asked whether
respondents tracked their spending and set spending budgets. The specific question phrasing is as
follows:
- Tell me about the ways you tried to figure out how much your household would need.
o Did you talk to family and relatives?
o Did you talk to co-workers or friends?
o Did you talk to co-workers or friends?
o Did you use calculators or worksheets that are computer or Internet-based?
o Did you consult a financial planner or advisor or an accountant?
The module also asks to respondents:
- How often do you keep track of your actual spending: would you say always, mostly,
rarely, or never?
- How often do you set budget targets for your spending: would you say always,
mostly, rarely, or never?
In what follows, we tabulate the prevalence of financial literacy, retirement calculations,
and the planning tools people report they deploy to devise and execute their plans. In addition,
we evaluate whether those who lack insight into simple economic facts also prove to be those
who have particular difficulty devising plans and carrying them out in practice. The idea is to
evaluate whether those who are more financially literate are also more likely to plan and be
successful planners.
7
Descriptive Findings
In this section we present preliminary findings from our 2004 HRS module which
included 1,269 respondents. As sample weights are currently unavailable, the statistics and
findings below refer only to unweighted data.
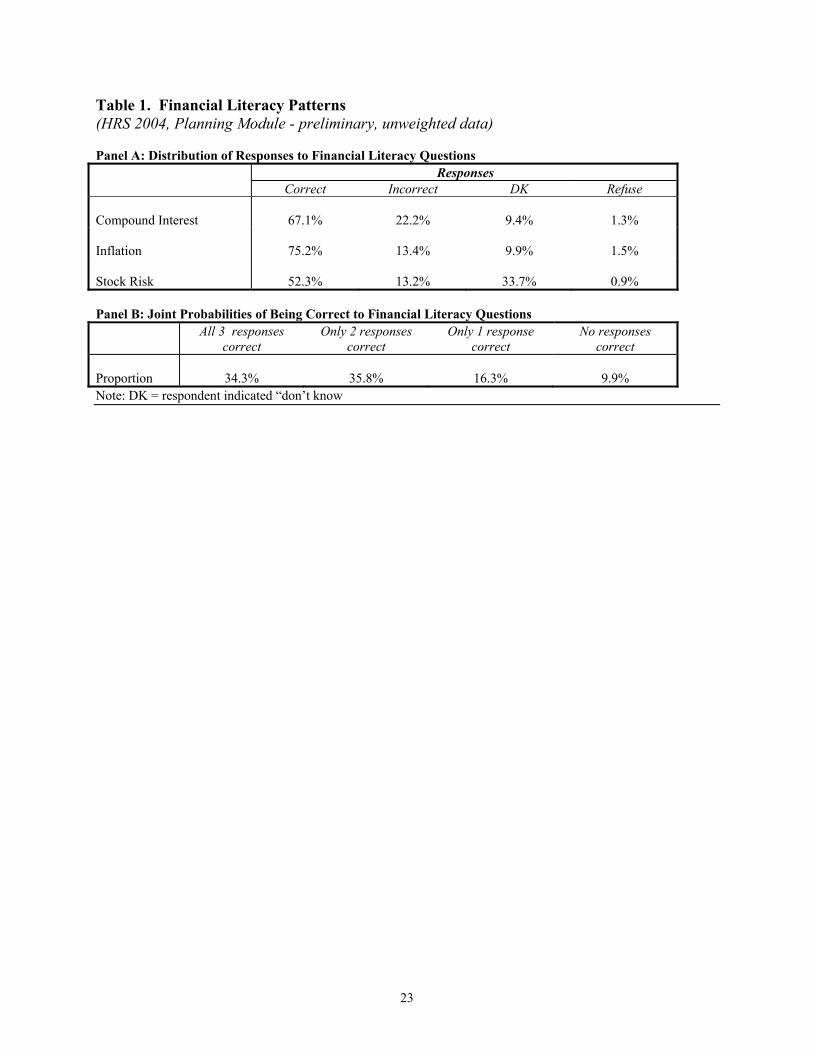
Financial Literacy. Turning first to financial literacy, the simple tabular results are far from
comforting (Table 1). The compound interest question has a 67% correct response rate; this is an
easy question and it is rather astounding that one-third of the sample cannot respond correctly,
particularly because the sample includes older respondents (mostly respondents in their 50s and
60s), who had probably dealt already with interest rate calculations. The inflation question has a
higher correct response rate, with three-quarters (75%) answering correctly that they would be
able to buy less after a year if the interest rate were 1% and inflation were 2%. By contrast, only
52% of the respondents understand correctly that holding a single company stock implies a
riskier return than a stock mutual fund.
We further distinguish between those offering correct answers and those giving an
incorrect answer or responding “don’t know” (abbreviated DK). The proportion of incorrect or
DK responses varies according to the question. For example, regarding interest compounding,
only 9% did not know but over one-fifth (22%) gave an incorrect answer. On the inflation
question, 10% did not know, while 13% gave a wrong answer. The question about stock risk
elicited the most DKs: 34% of the sample did not know, while a smaller fraction (13%) gave a
wrong answer.
Since the first two questions are key to respondent financial numeracy, it is disturbing
that only slightly over half (56%) of the sample get both questions right. This is a remarkably
low figure if we contemplate the complex financial calculations that households on the verge of
8
retirement have most likely engaged in over their lifetimes. Also disturbing is the fact that only
one-third (34%) of respondents correctly answer all three questions. Another interesting finding
is that the “DK” responses are highly correlated: that is, financial illiteracy is systematic across
areas examined. For instance, there is a 70% correlation between those who cannot answer both
the interest compounding question and the inflation question. Erroneous answers are more
scattered, with mistakes having a correlation of only 11%.
These results reinforce survey findings about financial literacy from Bernheim (1995,
1998), Hogarth and Hilgerth (2002), and Moore (2003), who report that most respondents do not
understand basic financial concepts, particularly those relating to bonds, stocks, mutual funds,
and the working of compound interest; they also report that people often fail to understand loans
and, particularly, mortgages.6 Such findings extend beyond the US: for instance, Miles (2004)
shows that UK borrowers display poor understanding of mortgages and interest rates. Christelis,
Jappelli, and Padula (2005) use SHARE surveys conducted in several European countries to
show that respondents there also score low on financial numeracy and literacy scales.7 In 2005,
the National Council on Economic Education (NCEE) conducted a study of high school students
and working-age adults, and showed a general lack of knowledge of fundamental economic
concepts, confirming the findings of several studies from the Jump$tart Coalition for Personal
Financial Literacy, which surveys US high school students (Mandell, 2004)). It is noteworthy
that our three financial literacy questions reveal a similar lack of knowledge, even though these
questions are quite a bit simpler and addressed to older respondents who might have been
expected to be more finally sophisticated, given lifetime exposure to financial contracts (e.g.
6 Other surveys also find similar results, in particular concerning knowledge regarding properties of bonds, stocks, and mutual funds (cf Agnew and Szykman 2005) 7 We have also inserted the module questions into a survey of Dutch households to permit a direct comparison of American and Dutch respondents in the near future.
9
mortgages, bank accounts, credit cards, etc.). Nevertheless, the news is not positive: financial
literacy levels are low among older Americans.
Lack of literacy and financial sophistication can have important consequences. For
instance, Calvert, Campbell, and Sodini (2006) show that households with greater financial
sophistication are more likely to participate in risky assets markets and invest more efficiently.8
Hilgerth, Hogarth, and Beverly (2003) also demonstrate a strong link between financial
knowledge and financial behavior.
Who Is Financially Literate? Though these figures are rather grim, they obscure important
heterogeneity in financial knowledge across demographic groups. Specifically we are interested
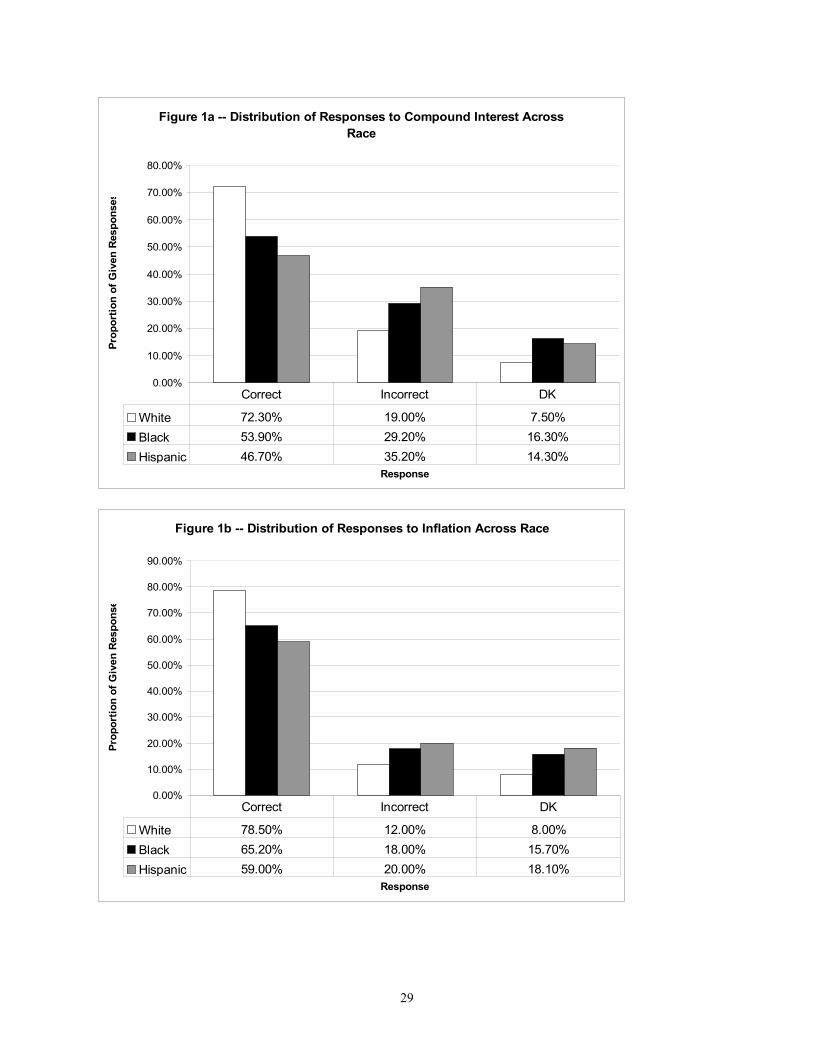
in whether the patterns differ by race and educational attainment, and Figures 1a-c report some
of our findings. There are large differences between Whites, Blacks, and Hispanics.9 Blacks and
particularly Hispanics are much less likely to correctly answer the question about interest
compounding: fewer than half of the Hispanics gave a correct answer, and a sizable fraction of
the remainder simply stated they did not know the answer. This is a potentially important result
in view of the fact that many Hispanics do not hold even basic assets, such as checking accounts
(Hogarth, Anguelov, and Lee, 2004). A similar pattern emerges with the question about inflation,
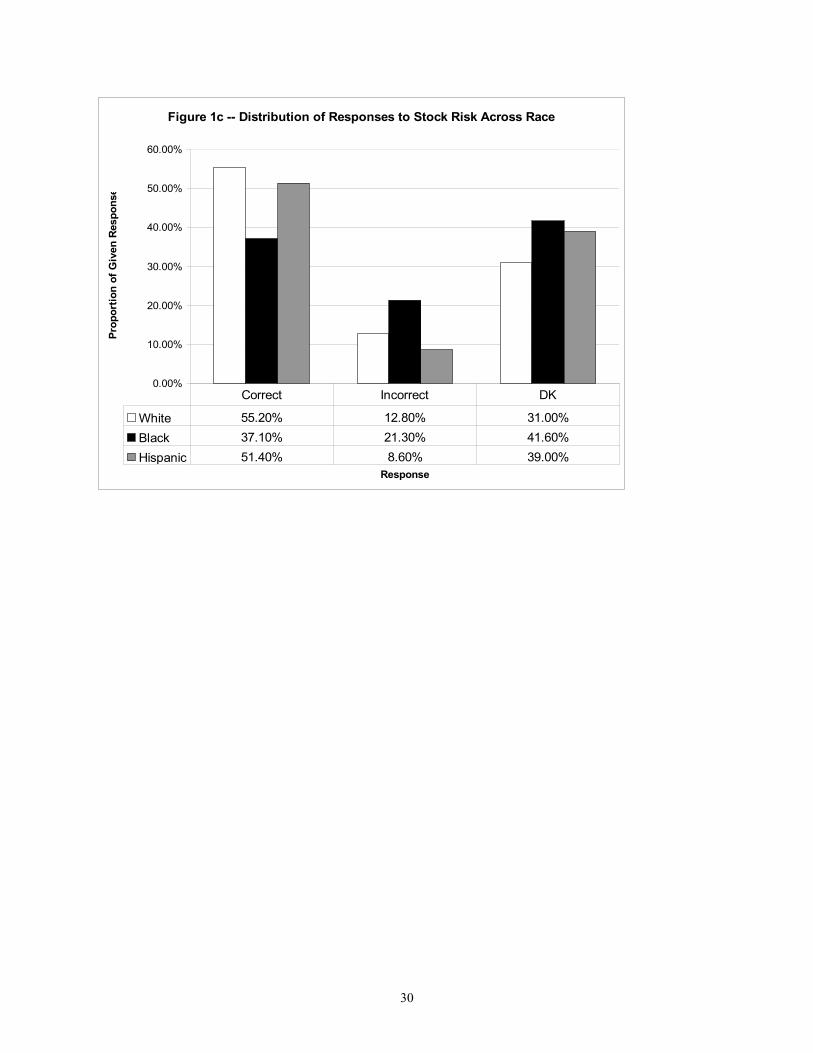
where again Hispanics are those least likely to answer correctly. As far as risk diversification is
concerned, Hispanics and Blacks both display difficulty answering this question: only one third
(37%) of the Blacks responded correctly while more than 40% of Blacks did not know the
answer to this question. This may shed further light on why so many Blacks do not hold stocks
(c.f. Haliassos and Bertaut 1995).
8 See also Campbell (2006) for an excellent examination of household financial decisions. 9 The remaining racial groups are very small and for brevity we do not include them in the figures. We also do not include those who “refuse” to answer the questions, since they are a very small group.
10
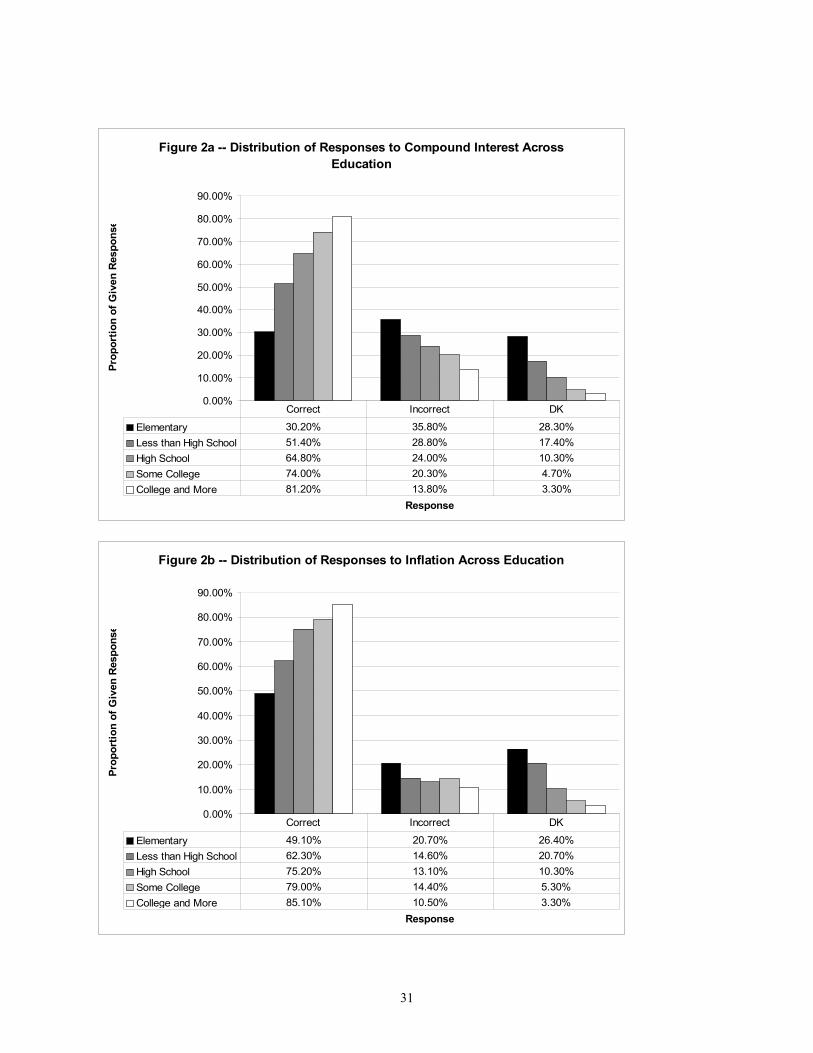
Differences in financial knowledge across education groups (Figures 2a-c) confirm our
expectation that financial literacy is highly correlated with schooling. Most importantly, financial
illiteracy is acute among those with less than a high school degree. Fewer than one-third of
respondents with elementary education correctly answer the question about interest
compounding, and one-third simply stated they did not know. The proportion of correct answers
to the question about interest compounding increases gradually with education, while the
proportion of both incorrect answers and DKs falls. A similar pattern is revealed in answers to
the inflation question, where again those without a high school education are much more likely
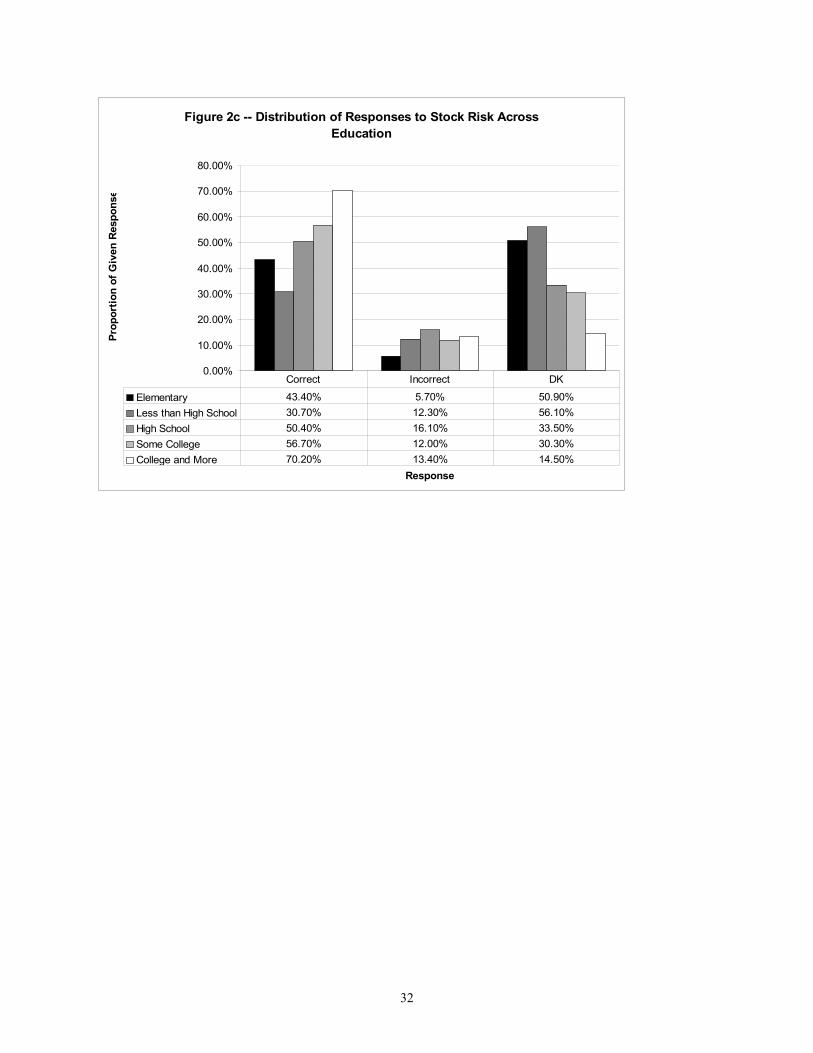
to be incorrect or unable to answer the question. The question about risk diversification reveals
that only those who have a college degree display a high proportion of correct answers.
Nevertheless, even here, almost one-third of those with a college degree do not know the answer
or answer incorrectly to this question. For the less-educated, the proportion of DK is particularly
high; over half of those with less than high school education report they do not know the answer
to these questions.
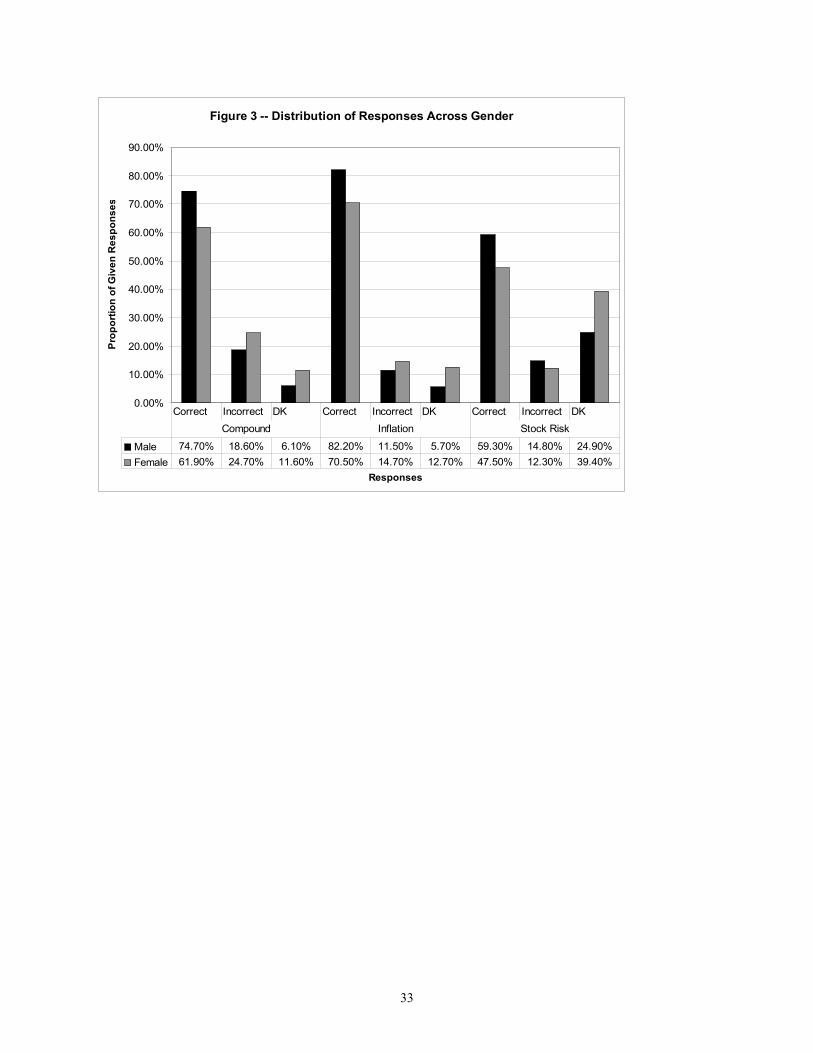
Looking at the pattern of responses across gender, the results show that women are
generally less financially knowledgeable than are men (Figure 3). For women, the proportion of
correct answers is significantly lower across the three questions; females are approximately 10
percentage points less likely than males to answer correctly to both the question about interest
compounding and inflation. Concerning risk diversification, women are less likely to respond
correctly to the question compared to men, and are more likely to not know the answer rather
than answering incorrectly.
For brevity, we do not report the distribution of financial literacy results across other
demographic factors such as age, marital status, and immigration status. Yet some findings are
11
worth highlighting: for instance, the leading edge of the Baby-Boomers (those age 51-56 in
2004) are much less knowledgeable about inflation, perhaps a result of their limited historical
exposure to inflation, or the fact they were in their 20s in the high inflation period during the
1970s and early 1980s. Demographic differences remain statistically significant even when we
perform a multivariate analysis of pattern of responses and include controls for race, sex, marital
status, educational attainment, place of birth, Baby-boomer cohort, and age. Thus, for example,
Blacks and Hispanics, are still less likely to answer correctly to interest compounding and
inflation questions (Blacks are also less likely to answer correctly the question about risk
diversification), even after accounting for educational attainment.
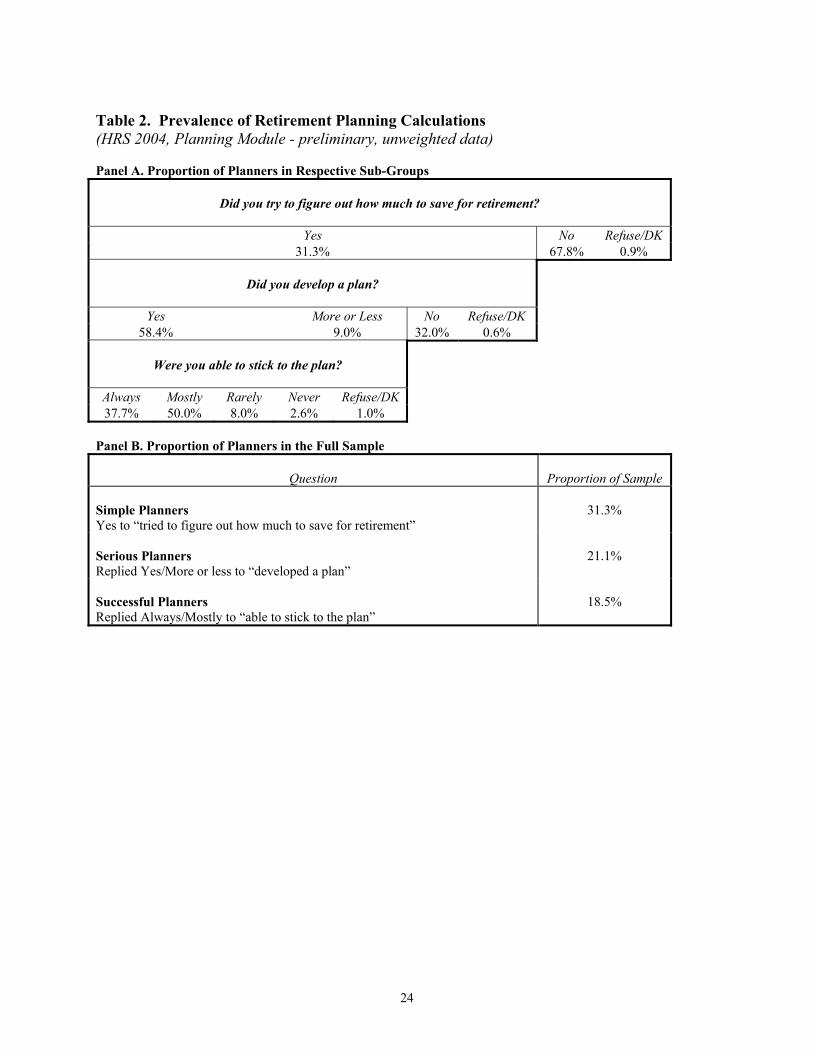
Prevalence of Retirement Planning Calculations. We now turn to evaluating other
predictions of the canonic economic model, namely that people will look ahead and calculate
how much they need to save for retirement. Accordingly, the module asks HRS respondents
whether they ever tried to figure out how much they need to save for retirement; Table 2
provides the results. Fewer than one-third of the sample respondents (31%) indicated that they
actually attempted to do a retirement saving calculation; these we call the Simple Planners. The
small size of this group confirms Lusardi’s analysis (1999, 2002, 2003) of previous HRS waves,
where she found that many people have given little thought to retirement even when they are just
a few years away from leaving the workforce. Our results also confirm findings from the
Retirement Confidence Survey and TIAA-CREF, which indicated that few undertake retirement
planning, even among the educated (Yakobosky and Dickempers, 1997; Ameriks, Caplin and
Leahy, 2003). It is also consistent with the work of Mitchell (1988) and Gustman and Steinmeier
(2004) who found that workers display little knowledge about their Social Security and pension
benefits, two of the most important components of retirement wealth. In fact, close to half of

12
workers in the HRS sample analyzed by Gustman and Steinmeier (2004) could not report their
type of pension plan, and an even larger portion was ignorant of future Social Security benefits.10
A key advantage of our module, compared to previous core HRS questions and other
surveys, is that we can probe respondents further to inquire about the outcomes of their
calculations. Thus Panel A of Table 2 shows that only 58% of those who tried to develop a plan
actually did so, while another handful “more or less” developed a plan (9%). Both of these we
refer to below as the Serious Planners. The high failure rate, so far as developing a plan is
concerned, underscores the fact that retirement projections are difficult to do. If we consider
those who responded yes to the question, as many as half of simple planners did not succeed in
developing a plan, another disappointing finding. Furthermore, of the subset of serious planners,
only one-third (38%) was always able to stick to its plan, while half were “mostly” able to stick
to their plans (below we call these respondents Successful Planners). In the sample as a whole,
this represents a meager 19% overall rate of successful planning. Of course, households may
face unexpected shocks making them deviate from plans, but the fact remains that few
respondents do what the economic models suggest that they should. In other words, planning for
retirement is difficult, few do it, and fewer still think they get it right.
To further evaluate what planning means and what people actually do when planning for
retirement, we ask respondents to indicate which tools they use in this process. To the extent that
they use crude or inaccurate tools, this may explain the low planning success rates in the
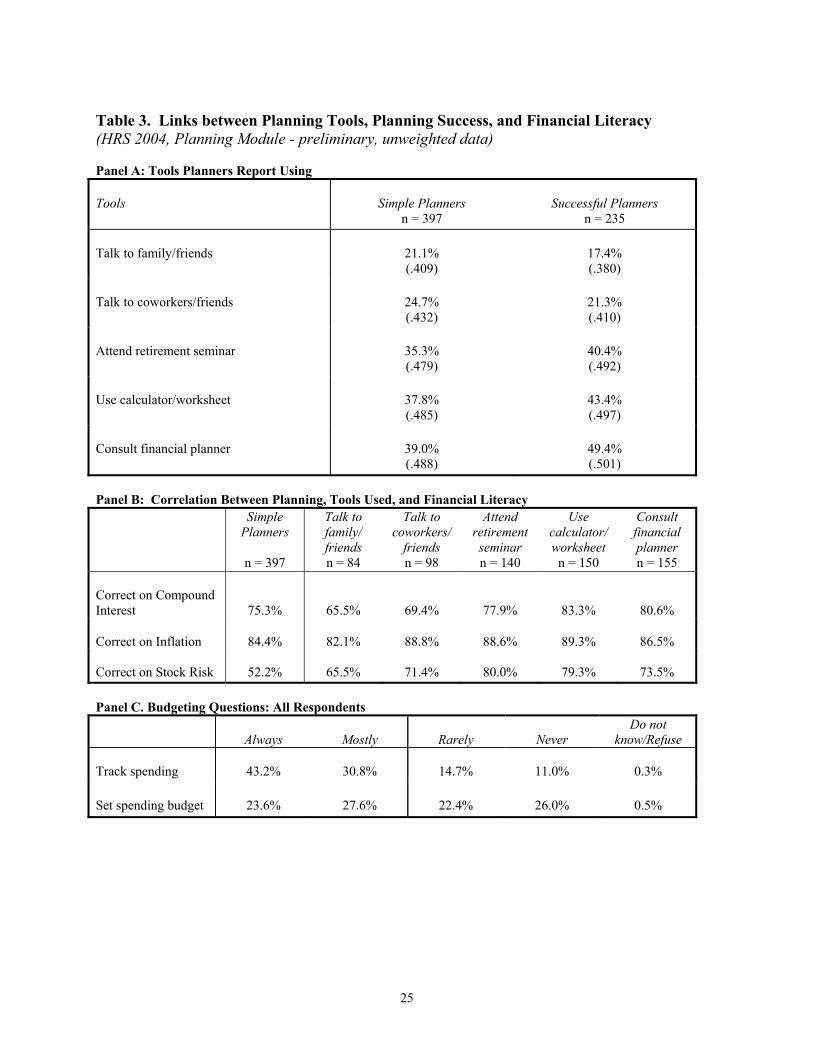
population. Panel A of Table 3 shows that respondents use a wide variety of tools to calculate
their retirement needs (note that these questions are asked only of those who reported they
attempted a retirement saving calculations). The results show that between one-quarter and one-
10 There is also mounting evidence that knowledge about pensions and Social Security affects retirement decisions (Chan and Huff Stevens (2003), Mastrobuoni (2005)).
13
fifth of respondents talked to family/relatives or co-workers/friends, while one-third or more
used formal means such as retirement calculators, retirement seminars, or financial experts.
Successful Planners were more likely to use formal means (over 40%), whereas Simple Planners
– some of whom tried and failed – tended to rely on less formal approaches. The table also
shows that financial literacy is correlated with planning tools, even though unevenly. The list of
tools does not exhaust what people might do; in fact, as many as one quarter of the self-reported
planners indicated that they did not use any of the listed tools.
Those who were correct regarding compound interest and inflation were more likely to have
attended a retirement seminar, suggesting that such seminars may provide information (without
further control variables we cannot hold constant other background variables). Those
knowledgeable about risk diversification also tend to use formal rather than informal tools for
planning. Turning to the sample as a whole, Panel B of Table 3 reveals for the planners what the
correlations were between their level of financial literacy and the tools they used in their
planning efforts. Those who used more sophisticated tools were always more likely to get the
literacy questions right, as compared to those who relied on personal communications;
furthermore, the knowledge gap was relatively the greatest for the compound interest question.
Panel C shows that a very large segment – almost three-quarters (74%) of the respondent pool –
indicates that it always or mostly tracks its spending, and over half (51%) always or mostly tries
to set spending budget targets. This is impressive given the low level of planning for retirement.
It is not clear whether those undertaking the spending budget efforts do so simply to get through
the month without running out of money, or whether these efforts indicate a larger consciousness
of retirement saving needs and plans.
14
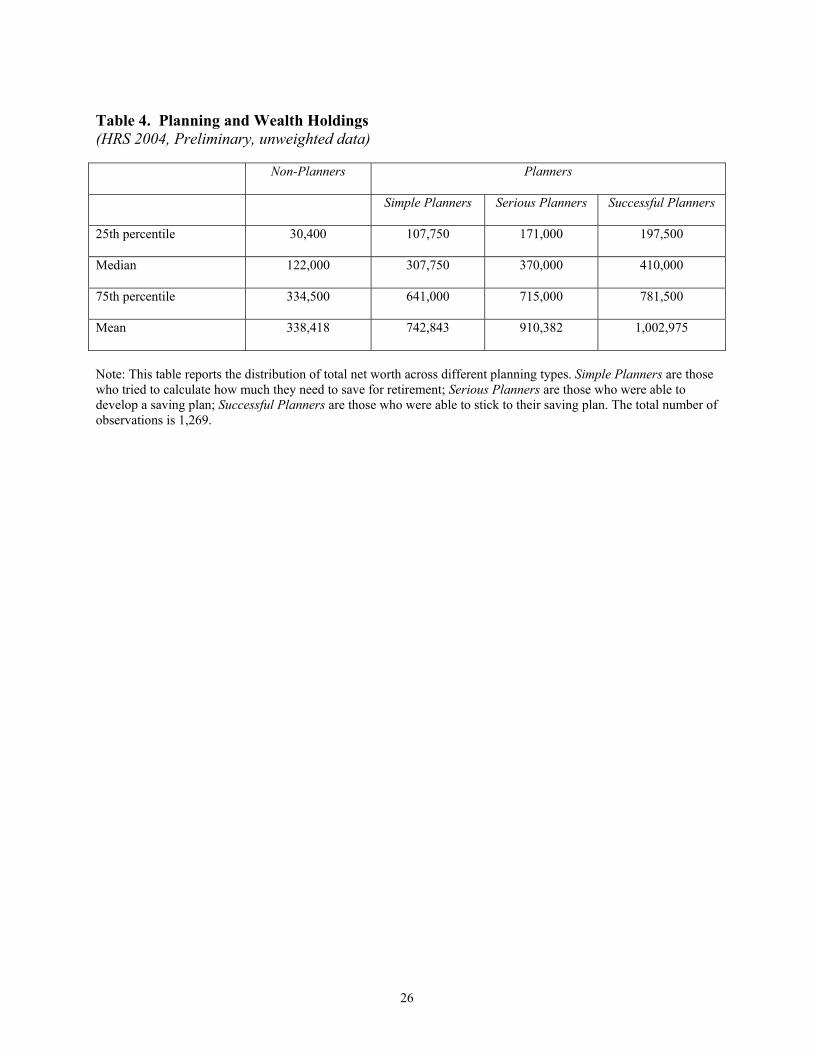
Planning has important implications for wealth accumulation (Lusardi 1999, 2002, 2003).
Table 4 reports the distribution of total net worth across different planning types. Note that, at the
median, planners accumulate three times the amount of wealth than non-planners. Moreover, the
amount of planning also matters: Those who are able to develop a plan and those who can stick
to the plan accumulate much more wealth than simple planners.
Planning and Financial Literacy
One reason people fail to plan for retirement, or do so unsuccessfully, may be because
they are financially illiterate. In this case, they may fail to appreciate the role of (or may have a
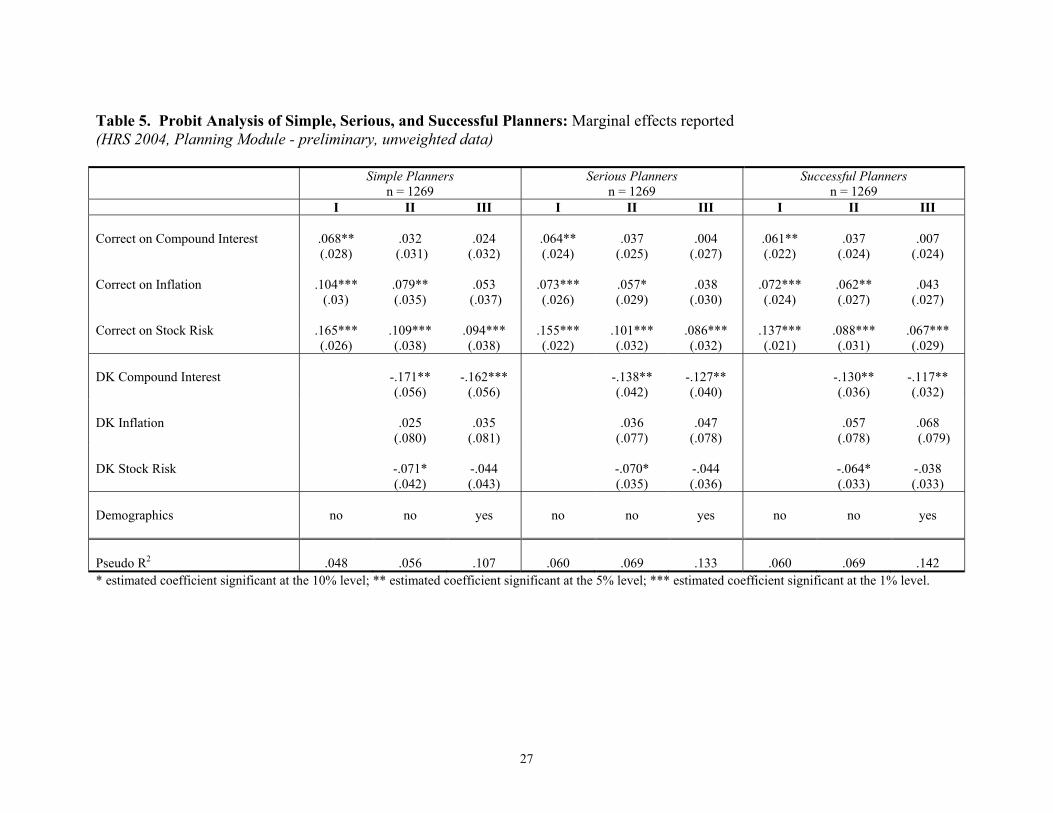
hard time solving problems with) compound interest, inflation, and risk. Table 5 reports a
multivariate analysis to shed some light on the importance of financial literacy and the
relationship with planning.11 The three dependent variables show who was a planner, who
developed a plan, and who was able to stick to a plan. Column I in each case takes on a value of
1 if the respondent was correct regarding the literacy variables (else, = 0); Column II adds an
indicator equal to 1 if the respondent indicated he did not know the answer to the question (else,
= 0); and Column III has the same dependent variable but adds controls for demographics and
specifically age, race, gender, educational attainment, and a dummy for being a Baby-boomer.
We use a Probit analysis as the outcomes are qualitative (0,1) variables, and we report marginal
effects.
The regression estimates suggest several interesting findings. First, financial literacy is
strongly and positively associated with planning, and the results are statistically significant at
conventional levels. That is, planners of all types are much more likely to give a correct answer
11 We are aware the causality may also go the other way: that is, those who plan also develop financial literacy and an ability to do retirement calculations. We will address causality more formally in future versions of the paper.
15
to our basic questions about financial literacy (Columns I). Second, knowledge about risk
diversification best differentiates between sophisticated and unsophisticated respondents. Not
only does it have a much larger estimated marginal effect than being able to correctly answer the
interest and the inflation questions, but it also remains statistically significant even after
accounting for the demographic characteristics of the respondent. Third, lack of knowledge also
matters. Even with respect to those answering incorrectly, those who cannot answer the
questions are much less likely to plan and to succeed in their planning effort (Columns II). What
appears most crucial is a lack of knowledge about interest compounding, which makes sense
since basic numeracy is crucial for doing calculations about retirement savings
Column III in Table 5 reports the estimates when we account for demographic
characteristics. As reported above, it is useful to note that some indicators of financial literacy
remain statistically significant even after we account for many demographic characteristics. This
means, for example, that financial literacy affects planning above and beyond the effect of
education. Thus, the information provided in the financial literacy variables may prove very
useful in explaining the differences we observe among households in their behavior toward
retirement savings, to which we now turn.
Wealth Accumulation and Financial Literacy
If financial illiteracy leads to poor or no planning, it may also affect wealth accumulation.
Lusardi (2003) shows that those who plan accumulate more wealth before retirement and are
more likely to invest in stocks. Moreover, planners are more likely to experience a satisfying
retirement, perhaps because they have higher financial resources to rely on after they stop
working.
16
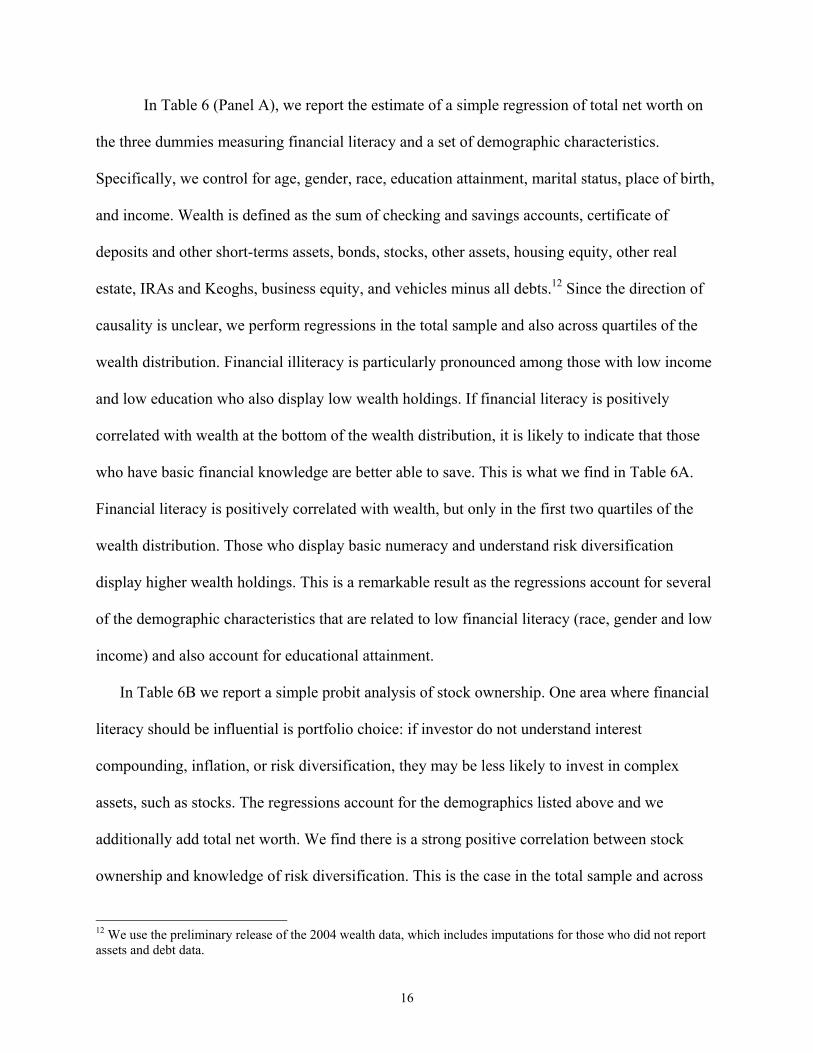
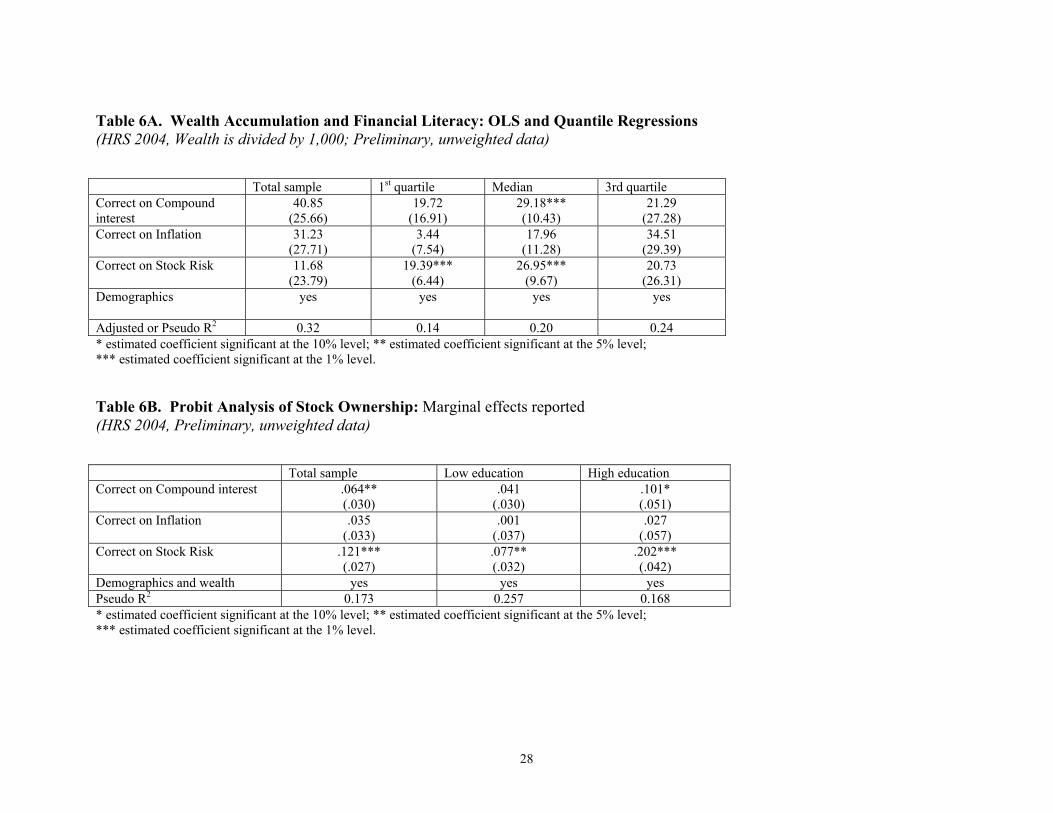
In Table 6 (Panel A), we report the estimate of a simple regression of total net worth on
the three dummies measuring financial literacy and a set of demographic characteristics.
Specifically, we control for age, gender, race, education attainment, marital status, place of birth,
and income. Wealth is defined as the sum of checking and savings accounts, certificate of
deposits and other short-terms assets, bonds, stocks, other assets, housing equity, other real
estate, IRAs and Keoghs, business equity, and vehicles minus all debts.12 Since the direction of
causality is unclear, we perform regressions in the total sample and also across quartiles of the
wealth distribution. Financial illiteracy is particularly pronounced among those with low income
and low education who also display low wealth holdings. If financial literacy is positively
correlated with wealth at the bottom of the wealth distribution, it is likely to indicate that those
who have basic financial knowledge are better able to save. This is what we find in Table 6A.
Financial literacy is positively correlated with wealth, but only in the first two quartiles of the
wealth distribution. Those who display basic numeracy and understand risk diversification
display higher wealth holdings. This is a remarkable result as the regressions account for several
of the demographic characteristics that are related to low financial literacy (race, gender and low
income) and also account for educational attainment.
In Table 6B we report a simple probit analysis of stock ownership. One area where financial
literacy should be influential is portfolio choice: if investor do not understand interest
compounding, inflation, or risk diversification, they may be less likely to invest in complex
assets, such as stocks. The regressions account for the demographics listed above and we
additionally add total net worth. We find there is a strong positive correlation between stock
ownership and knowledge of risk diversification. This is the case in the total sample and across
12 We use the preliminary release of the 2004 wealth data, which includes imputations for those who did not report assets and debt data.
17
education groups. Basic numeracy also plays a role, but mostly for those with high education
(defined as having more than a high school degree). Again, the results are noteworthy since we
account not only for education but also for total net worth in the regressions. These findings may
help explain the “puzzle” of why so few households hold stocks (Haliassos and Bertaut, 1995).
Moreover, they may shed light on another puzzling finding in household surveys, such as the
Survey of Consumer Finances. When asked how much risk respondents are willing to take, a
large majority (more than 60%) state they are unwilling to take any financial risk. This finding
may capture not only high risk aversion but also the fact that many respondents do not know or
understand risk diversification.
Implications and Conclusions
As an increasingly large group of the US population moves into retirement, it is crucial to
learn whether families knows how to plan for retirement and whether they can execute these
plans effectively. How people react when confronted with this challenge – that is, whether
individuals seem to have knowledge of and the capability to plan and implement these complex
planning tasks – is a topic of substantial current interest.
Our module for the 2004 HRS is useful in addressing this issue as it first asks about
people’s basic financial literacy, that is, whether they understand compound interest rates and the
effects of inflation, along with the more nuanced concept of risk diversification. We find that
only half of the respondents correctly answer two simple questions regarding interest
compounding and inflation, and only one-third correctly answer these two questions and a
question about risk diversification. In other words, financial illiteracy is widespread among
older Americans. Second, we evaluate whether people tried to figure out how much they need to
18
save for retirement, whether they devised a plan, and whether they succeeded at the plan. We
find that retirement calculations are not an easy task: only 31% of these older people had ever
tried to devise a retirement plan, and only two thirds of these succeeded. For the sample as a
whole, only 19% engaged in successful retirement planning. Third, we find that financial
knowledge and planning are clearly interrelated. Fourth, we evaluate the planning tools people
use. The respondents who did plan were less likely to talk to family/relatives or co-
workers/friends than they were to use formal means such as retirement calculators, retirement
seminars, or financial experts. Fifth, keeping track of spending and budgeting habits appears
conducive to retirement saving.
Inasmuch as planning is an important predictor of saving and investment success, we may
have uncovered an important explanation for why household wealth holdings differ, and why
some people enter retirement with very low wealth (Venti and Wise 2001, Lusardi 1999). Our
preliminary empirical analysis finds that financial literacy has an effect on both savings and
portfolio choice.
Our work has important implications on several public policy frontiers. Throughout the
1990s, there was been an explosion of products and programs for financial planning. The
government has recently fostered several programs to spur financial education, and employers
are increasingly offering retirement seminars to their workers (Lusardi 2004). Some researchers
contend that these programs have only minimal effects on saving, but our work suggests that this
may be due to the lack of well-targeted content. For example, if financial illiteracy is widespread
among particular employees, a one-time financial education lesson is likely to be insufficient to
influence planning and saving decisions. Similarly, education programs targeted specifically to

19
particular subgroups may be better suited to address large differences in preferences and saving
needs.
20
References Agnew, Julie and Lisa Szykman. 2005. “Asset Allocation and Information Overload: The
Influence of Information Display, Asset Choice and Investor Experience”. Journal of Behavioral Finance 6: 57-70.
Ameriks, John, Andrew Caplin and John Leahy. 2003. “Wealth Accumulation and the Propensity to Plan”. Quarterly Journal of Economics 68: 1007-1047.
Ameriks, John, Andrew Caplin and John Leahy. 2004. “Absent-Minded Consumer.” Working paper 10216. NBER.
Bernheim, Douglas. 1995. “Do Households Appreciate their Financial Vulnerabilities? An Analysis of Actions, Perceptions, and Public Policy”. In Tax Policy and Economic Growth. Washington, DC: American Council for Capital Formation.
Bernheim, Douglas. 1998. “Financial Illiteracy, Education and Retirement Saving”. In Living with Defined Contribution Pensions, edited by Olivia Mitchell and Sylvester Schieber. Philadelphia: University of Pennsylvania Press.
Browning, Martin and Annamaria Lusardi. 1996. "Household Saving: Micro Theories and Micro Facts". Journal of Economic Literature 34: 1797-1855.
Chan, Sewin and Ann Huff Stevens, (2003), “What You Don’t Know Can’t Help You: Knowledge and Retirement Decision Making.” Mimeo, New York University.
Calvert, Laurent, John Campbell and Paolo Sodini (2006), “Down or Out: Assessing the Welfare Costs of Household Investment Mistakes.” Mimeo, Harvard University.
Campbell, John (2006), “Household Finance.” Presidential address to the American Finance Association, Harvard University.
Clark, Robert, Madeleine D’Ambrosio. 2002. “Saving for Retirement: The Role of Financial Education”. Working paper 4-070102-A. TIAA-CREF Institute.
Clark, Robert, Madeleine D’Ambrosio, Ann McDermed, and Kshama Sawant. 2003. “Financial Education and Retirement Saving”. Working Paper 11-020103. TIAA-CREF Institute.
Clark, Robert, Madeleine D’Ambrosio, Ann McDermed, and Kshama Sawant. 2004. “Sex Differences, Financial Education and Retirement Goals”. In Pension Design and Structure: New Lessons from Behavioral Finance, edited by Olivia Mitchell and Stephen Utkus. Oxford: Oxford University Press.
Christelis, Dimitris, Tullio Jappelli, and Mario Padula. 2005. “Health Risk, Financial Information and Social Interaction: the Portfolio Choice of European Elderly Households”. Working paper. University of Salerno.
Employee Benefits Research Institute. 1996. “Participant Education: Actions and Outcomes”. Issue Brief 169 (January).
Employee Benefits Research Institute. 2001. “Retirement Confidence Survey (RCS), Minority RCS, and Small Employer Retirement Survey”. Issue Brief 234 (June).
Duflo, Esther and Emmanuel Saez. 2003. “The Role of Information and Social Interactions in Retirement Plan Decisions: Evidence from a Randomized Experiment”. Quarterly
21
Journal of Economics 118: 815-842.
Duflo, Esther and Emmanuel Saez. 2004. “Implications of Pension Plan Features, Information, and Social Interactions for Retirement Saving Decisions”. In Pension Design and Structure: New Lessons from Behavioral Finance, edited by Olivia Mitchell and Stephen Utkus. Oxford: Oxford University Press.
Gustman, Alan and Tom Steinmeier. 1999. “Effects of Pensions on Savings: Analysis with Data from the Health and Retirement Study”. Carnegie-Rochester Conference Series on Public Policy 50: 271-324.
Gustman, Alan and Tom Steinmeier. 2004. “What People Don’t Know about their Pensions and Social Security”. In Private Pensions and Public Policies, edited by William Gale, John Shoven and Mark Warshawsky, Washington, DC: Brookings Institution: 57-125.
Gustman, Alan, Olivia Mitchell, Andrew Samwick and Thomas Steinmeier. 1999. “Pension and Social Security Wealth in the Health and Retirement Study”. In Wealth, Work and Health, edited by James Smith and Robert Willis. Ann Arbor: University of Michigan Press.
Haliassos, Michael and Carol Bertaut.1995. “Why Do So Few Hold Stocks?” Economic Journal,
105: 1110-1129.
Hancock, John. Financial Services. 2002. “Insights into Participant Investment Knowledge and Behavior”. Eighth Defined Contribution Plan Survey.
Hilgert, Marianne, Jeanne Hogarth, and Sondra Beverly. 2003. "Household Financial
Management: The Connection between Knowledgee and Behavior," Federal Reserve Bulletin, 309-322.
Hogarth, Jeanne, Chris Anguelov, and Jinkook Lee. 2004. “Why Don’t Households Have a
Checking Account?” The Journal of Consumer Affairs, 38: 1-34.
Hogarth, Jeanne and Marianne Hilgert. 2002. "Financial Knowledge, Experience and Learning
Preferences: Preliminary Results from a New Survey on Financial Literacy," Consumer Interest Annual, 48.
Lusardi, Annamaria. 1999. "Information, Expectations, and Savings for Retirement". In Behavioral Dimensions of Retirement Economics, edited by Henry Aaron. Washington, D.C.: Brookings Institution Press and Russell Sage Foundation.
Lusardi, Annamaria. 2002. “Preparing for Retirement: The Importance of Planning Costs”. National Tax Association Proceedings 2002: 148-154.
Lusardi, Annamaria. 2003. “Planning and Saving for Retirement”. Working paper. Dartmouth College.
Lusardi, Annamaria. 2004. “Savings and the Effectiveness of Financial Education”. In Pension Design and Structure: New Lessons from Behavioral Finance, edited by Olivia Mitchell and Stephen Utkus. Oxford: Oxford University Press.
Mandell, Lewis. 2004. “Financial Literacy: Are We Improving?” Washington, D.C.: Jump$tart Coalition for Personal Financial Literacy.
22
Mastrobuoni, Giovanni (2005), “Do Better-Informed Workers Make Better Retirement Choice? A Test Based on the Social Security Statement.” Mimeo, Princeton University.
Miles, David. 2004. “The UK Mortgage Market: Taking a Longer-Term View”. UK Treasury.
Mitchell, Olivia. 1988. “Worker Knowledge of Pensions Provisions”. Journal of Labor Economics 6: 28-29.
Mitchell, Olivia S. and James Moore.1998. “Can Americans Afford to Retire? New Evidence on Retirement Saving Adequacy”. Journal of Risk and Insurance 65: 371-400.
Mitchell, Olivia S., James Moore, and John Phillips. 2000. “Explaining Retirement Saving Shortfalls”. In Forecasting Retirement Needs and Retirement Wealth edited by O. S. Mitchell, B. Hammond, & A. Rappaport. Philadelphia, PA: Univ. of Pennsylvania Press: 139-166.
Moore, Danna. 2003. “Survey of Financial Literacy in Washington State: Knowledge, Behavior, Attitudes, and Experiences”. Technical report 03-39, Social and Economic Sciences Research Center, Washington State University.
Moore, James, and Olivia S. Mitchell. 2000. “Projected Retirement Wealth and Saving Adequacy”. In Forecasting Retirement Needs and Retirement Wealth, edited by O.S. Mitchell, B. Hammond, and A. Rappaport. Philadelphia, PA: Univ. of Pennsylvania Press.
National Council on Economic Education. 2005. “What American Teens and Adults Know About Economics.”
Scholz, John Karl, Ananth Sheshadri, and Surachai Khitatrakun. 2003. “Are Americans Saving Optimally for Retirement?”. Working paper. University of Wisconsin Department of Economics.
Venti, Steven and David Wise. 2001. “Choice, Chance, and Wealth Dispersion at Retirement”. In Aging Issues in the United States and Japan, edited by S. Ogura, T. Tachibanaki and D. Wise. Chicago: University of Chicago Press.
Venti, Steven. 2005. “Choice, Behavior and Retirement Saving”. Forthcoming in Oxford Handbook of Pensions and Retirement Income, edited by G. Clark, A. Munnell and M. Orzsag. Oxford: Oxford University Press.
Yakoboski, Paul and Jennifer Dickemper. 1997. “Increased Saving but Little Planning. Results of the 1997 Retirement Confidence Survey”. EBRI Issue Brief 191.
23
Table 1. Financial Literacy Patterns (HRS 2004, Planning Module - preliminary, unweighted data) Panel A: Distribution of Responses to Financial Literacy Questions
Responses Correct Incorrect DK Refuse
Compound Interest
67.1%
22.2%
9.4%
1.3%
Inflation
75.2%
13.4%
9.9%
1.5%
Stock Risk
52.3%
13.2%
33.7%
0.9%
Panel B: Joint Probabilities of Being Correct to Financial Literacy Questions All 3 responses
correct Only 2 responses
correct Only 1 response
correct No responses
correct Proportion
34.3%
35.8%
16.3%
9.9%
Note: DK = respondent indicated “don’t know
24
Table 2. Prevalence of Retirement Planning Calculations (HRS 2004, Planning Module - preliminary, unweighted data) Panel A. Proportion of Planners in Respective Sub-Groups
Did you try to figure out how much to save for retirement?
Yes No Refuse/DK
31.3% 67.8% 0.9%
Did you develop a plan?
Yes More or Less No Refuse/DK 58.4% 9.0% 32.0% 0.6%
Were you able to stick to the plan?
Always Mostly Rarely Never Refuse/DK 37.7% 50.0% 8.0% 2.6% 1.0%
Panel B. Proportion of Planners in the Full Sample
Question
Proportion of Sample Simple Planners Yes to “tried to figure out how much to save for retirement”
31.3%
Serious Planners Replied Yes/More or less to “developed a plan”
21.1%
Successful Planners Replied Always/Mostly to “able to stick to the plan”
18.5%
25
Table 3. Links between Planning Tools, Planning Success, and Financial Literacy (HRS 2004, Planning Module - preliminary, unweighted data) Panel A: Tools Planners Report Using Tools
Simple Planners
n = 397
Successful Planners
n = 235 Talk to family/friends
21.1% (.409)
17.4% (.380)
Talk to coworkers/friends
24.7% (.432)
21.3% (.410)
Attend retirement seminar
35.3% (.479)
40.4% (.492)
Use calculator/worksheet
37.8% (.485)
43.4% (.497)
Consult financial planner
39.0% (.488)
49.4% (.501)
Panel B: Correlation Between Planning, Tools Used, and Financial Literacy Simple
Planners
n = 397
Talk to family/ friends n = 84
Talk to coworkers/
friends n = 98
Attend retirement seminar n = 140
Use calculator/ worksheet n = 150
Consult financial planner n = 155
Correct on Compound Interest
75.3%
65.5%
69.4%
77.9%
83.3%
80.6% Correct on Inflation
84.4%
82.1%
88.8%
88.6%
89.3%
86.5%
Correct on Stock Risk
52.2%
65.5%
71.4%
80.0%
79.3%
73.5%
Panel C. Budgeting Questions: All Respondents
Always
Mostly
Rarely
Never Do not
know/Refuse Track spending
43.2%
30.8%
14.7%
11.0%
0.3%
Set spending budget
23.6%
27.6%
22.4%
26.0%
0.5%
26
Table 4. Planning and Wealth Holdings (HRS 2004, Preliminary, unweighted data) Non-Planners Planners
Simple Planners
Serious Planners Successful Planners
25th percentile 30,400
107,750 171,000 197,500
Median 122,000
307,750 370,000 410,000
75th percentile
334,500 641,000 715,000 781,500
Mean
338,418 742,843 910,382 1,002,975
Note: This table reports the distribution of total net worth across different planning types. Simple Planners are those who tried to calculate how much they need to save for retirement; Serious Planners are those who were able to develop a saving plan; Successful Planners are those who were able to stick to their saving plan. The total number of observations is 1,269.
27
Table 5. Probit Analysis of Simple, Serious, and Successful Planners: Marginal effects reported (HRS 2004, Planning Module - preliminary, unweighted data) Simple Planners
n = 1269 Serious Planners
n = 1269 Successful Planners
n = 1269 I II III I II III I II III Correct on Compound Interest
.068** (.028)
.032
(.031)
.024
(.032)
.064** (.024)
.037
(.025)
.004
(.027)
.061** (.022)
.037
(.024)
.007
(.024) Correct on Inflation
.104***
(.03)
.079** (.035)
.053
(.037)
.073*** (.026)
.057* (.029)
.038
(.030)
.072*** (.024)
.062** (.027)
.043
(.027) Correct on Stock Risk
.165*** (.026)
.109*** (.038)
.094*** (.038)
.155*** (.022)
.101*** (.032)
.086*** (.032)
.137*** (.021)
.088*** (.031)
.067*** (.029)
DK Compound Interest
-.171** (.056)
-.162***
(.056)
-.138** (.042)
-.127** (.040)
-.130** (.036)
-.117** (.032)
DK Inflation
.025
(.080)
.035
(.081)
.036
(.077)
.047
(.078)
.057
(.078)
.068
(.079) DK Stock Risk
-.071* (.042)
-.044 (.043)
-.070* (.035)
-.044 (.036)
-.064* (.033)
-.038 (.033)
Demographics
no
no
yes
no
no
yes
no
no
yes
Pseudo R2
.048
.056
.107
.060
.069
.133
.060
.069
.142
* estimated coefficient significant at the 10% level; ** estimated coefficient significant at the 5% level; *** estimated coefficient significant at the 1% level.
28
Table 6A. Wealth Accumulation and Financial Literacy: OLS and Quantile Regressions (HRS 2004, Wealth is divided by 1,000; Preliminary, unweighted data) Total sample 1st quartile Median 3rd quartile Correct on Compound interest
40.85 (25.66)
19.72 (16.91)
29.18*** (10.43)
21.29 (27.28)
Correct on Inflation 31.23 (27.71)
3.44 (7.54)
17.96 (11.28)
34.51 (29.39)
Correct on Stock Risk
11.68 (23.79)
19.39*** (6.44)
26.95*** (9.67)
20.73 (26.31)
Demographics
yes yes yes yes
Adjusted or Pseudo R2 0.32 0.14 0.20 0.24 * estimated coefficient significant at the 10% level; ** estimated coefficient significant at the 5% level; *** estimated coefficient significant at the 1% level. Table 6B. Probit Analysis of Stock Ownership: Marginal effects reported (HRS 2004, Preliminary, unweighted data) Total sample Low education High education Correct on Compound interest
.064** (.030)
.041 (.030)
.101* (.051)
Correct on Inflation .035 (.033)
.001 (.037)
.027 (.057)
Correct on Stock Risk
.121*** (.027)
.077** (.032)
.202*** (.042)
Demographics and wealth yes yes yes Pseudo R2 0.173 0.257 0.168 * estimated coefficient significant at the 10% level; ** estimated coefficient significant at the 5% level; *** estimated coefficient significant at the 1% level.
29
Figure 1a -- Distribution of Responses to Compound Interest Across Race
0.00%
10.00%
20.00%
30.00%
40.00%
50.00%
60.00%
70.00%
80.00%
Response
Prop
ortio
n of
Giv
en R
espo
nses
White 72.30% 19.00% 7.50%Black 53.90% 29.20% 16.30%Hispanic 46.70% 35.20% 14.30%
Correct Incorrect DK
Figure 1b -- Distribution of Responses to Inflation Across Race
0.00%
10.00%
20.00%
30.00%
40.00%
50.00%
60.00%
70.00%
80.00%
90.00%
Response
Prop
ortio
n of
Giv
en R
espo
nse
White 78.50% 12.00% 8.00%Black 65.20% 18.00% 15.70%Hispanic 59.00% 20.00% 18.10%
Correct Incorrect DK
30
Figure 1c -- Distribution of Responses to Stock Risk Across Race
0.00%
10.00%
20.00%
30.00%
40.00%
50.00%
60.00%
Response
Prop
ortio
n of
Giv
en R
espo
nse
White 55.20% 12.80% 31.00%Black 37.10% 21.30% 41.60%Hispanic 51.40% 8.60% 39.00%
Correct Incorrect DK
31
Figure 2a -- Distribution of Responses to Compound Interest Across Education
0.00%
10.00%
20.00%
30.00%
40.00%
50.00%
60.00%
70.00%
80.00%
90.00%
Response
Prop
ortio
n of
Giv
en R
espo
nse
Elementary 30.20% 35.80% 28.30%Less than High School 51.40% 28.80% 17.40%High School 64.80% 24.00% 10.30%Some College 74.00% 20.30% 4.70%College and More 81.20% 13.80% 3.30%
Correct Incorrect DK
Figure 2b -- Distribution of Responses to Inflation Across Education
0.00%
10.00%
20.00%
30.00%
40.00%
50.00%
60.00%
70.00%
80.00%
90.00%
Response
Prop
ortio
n of
Giv
en R
espo
nse
Elementary 49.10% 20.70% 26.40%Less than High School 62.30% 14.60% 20.70%High School 75.20% 13.10% 10.30%Some College 79.00% 14.40% 5.30%College and More 85.10% 10.50% 3.30%
Correct Incorrect DK
32
Figure 2c -- Distribution of Responses to Stock Risk Across Education
0.00%
10.00%
20.00%
30.00%
40.00%
50.00%
60.00%
70.00%
80.00%
Response
Prop
ortio
n of
Giv
en R
espo
nse
Elementary 43.40% 5.70% 50.90%Less than High School 30.70% 12.30% 56.10%High School 50.40% 16.10% 33.50%Some College 56.70% 12.00% 30.30%College and More 70.20% 13.40% 14.50%
Correct Incorrect DK
33
Figure 3 -- Distribution of Responses Across Gender
0.00%
10.00%
20.00%
30.00%
40.00%
50.00%
60.00%
70.00%
80.00%
90.00%
Responses
Prop
ortio
n of
Giv
en R
espo
nses
Male 74.70% 18.60% 6.10% 82.20% 11.50% 5.70% 59.30% 14.80% 24.90%Female 61.90% 24.70% 11.60% 70.50% 14.70% 12.70% 47.50% 12.30% 39.40%
Correct Incorrect DK Correct Incorrect DK Correct Incorrect DKCompound Inflation Stock Risk