Embed Size (px)
Citation preview

EURO
PEAN
CEN
TRAL
BAN
K FI
NANC
IAL
INTE
GRAT
ION
IN E
UROP
E AP
RIL
2014
F I NANC IAL INTEGRAT ION IN EUROPEAPR I L 2014

FINANCIAL INTEGRATION IN EUROPE
APR IL 2014
In 2014 all ECB publications
feature a motif taken from
the €20 banknote.

© European Central Bank, 2014
Address Kaiserstrasse 29 60311 Frankfurt am Main Germany
Postal address Postfach 16 03 19 60066 Frankfurt am Main Germany
Telephone +49 69 1344 0
Website http://www.ecb.europa.eu
Fax +49 69 1344 6000
All rights reserved. Reproduction for educational and non-commercial purposes is permitted provided that the source is acknowledged.
ISSN 1830-7140 (print)ISSN 1830-7159 (online)EU catalogue number QB-AJ-14-001-EN-C (print)EU catalogue number QB-AJ-14-001-EN-N (online)

3ECB
Financial integration in EuropeApril 2014
PREFACE 8
KEy MEssAGEs 9
EXECUTIVE sUMMARy 11
CHAPTER IRECENT DEVELOPMENTs IN FINANCIAL INTEGRATION IN THE EURO AREA 13
1 Introduction 132 Money markets 133 Bond markets 174 Equity markets 245 Banking markets 28
CHAPTER II EUROPEAN INsTITUTIONAL REFORM 37
THE sINGLE REsOLUTION MECHANIsM: THE NECEssARy NEXT sTEP TOWARDs BANKING UNION 37
1 Introduction 372 The first step: the single supervisory mechanism 373 A necessary second step: the single resolution mechanism 394 Progress on the bank recovery and resolution directive and the deposit guarantee
schemes directive 445 Challenges ahead – establishing the SRM 47
CHAPTER IIIEUROsysTEM ACTIVITIEs FOR FINANCIAL INTEGRATION 49
1 The legislative and regulatory framework for the financial system 492 Catalyst for private sector activities 533 Knowledge of the state of financial integration 564 Central bank services that foster integration 60
sPECIAL FEATUREs
A. GEOGRAPHICAL sEGMENTATION OF THE EURO AREA MONEy MARKET: A LIQUIDITy FLOW APPROACH 651 Introduction 652 Offsetting flow in the euro area 673 The impact of geographical segmentation of liquidity on very short-term rates 724 Modelling the relationship between short-term rates and excess liquidity in the euro
area on an aggregated basis 765 Modelling the relationship between very short-term rates and excess liquidity in
domestic markets 796 Conclusion 84
CONTENTs

4ECBFinancial integration in EuropeApril 20144
B. DIVERGENCE IN FINANCING CONDITIONs OF sMALL AND MEDIUM-sIZED ENTERPRIsEs (sMEs) IN THE EURO AREA 851 SME dependence on banks 852 SME bank financing conditions across euro area Member States 863 Role of financial and non-financial firm characteristics 894 Policy initiatives to promote SME financing in the euro area 92
C. INITIATIVEs TO PROMOTE CAPITAL MARKET INTEGRATION IN THE EUROPEAN CORPORATE BOND AND EQUITy MARKETs 971 Legal and regulatory obstacles in the life cycle of corporate bonds and equities 992 Other legal aspects impacting capital market integration 1063 Crisis management, resolution and insolvency frameworks 1094 Supervisory and enforcement frameworks 110
D. EUROsysTEM CONTRIBUTION TO FINANCIAL INTEGRATION IN THE AREAs OF sECURITIEs AND COLLATERAL 1131 The Eurosystem contribution to integrated securities settlement in Europe: T2S 1152 Developments in Eurosystem collateral management services 122
sTATIsTICAL ANNEX s1

5ECB
Financial integration in EuropeApril 2014 5
ABBREVIAT IONS
ABBREVIATIONsCOUNTRIEsAT Austria IT Italy BE Belgium JP Japan BG Bulgaria LT LithuaniaCH Switzerland LU LuxembourgCY Cyprus LV LatviaCZ Czech Republic MT MaltaDK Denmark NL NetherlandsDE Germany PL PolandEE Estonia PT PortugalIE Ireland RO RomaniaES Spain SE SwedenFI Finland SI SloveniaFR France SK SlovakiaGR Greece UK United KingdomHR Croatia US United StatesHU Hungary
OTHERsABS Asset-backed securityACI Financial Markets AssociationAMEX American Stock ExchangeBCBS Basel Committee on Banking SupervisionBIC Bank identifier codeBIS Bank for International SettlementsBRRD Bank Recovery and Resolution DirectiveCBPP Covered Bond Purchase ProgrammeCCBM Correspondent central banking modelCCBM2 Collateral Central Bank ManagementCCP Central counterpartyCDO Collateralised debt obligationCDS Credit default swapCEBS Committee of European Banking SupervisorsCEPR Centre for Economic Policy ResearchCESAME Clearing and Settlement Advisory and Monitoring Expert GroupCESR Committee of European Securities RegulatorsCFS Center for Financial StudiesCGFS Committee on the Global Financial SystemCLS Continuous Linked SettlementCPSS Committee on Payment and Settlement SystemsCSD Central securities depositoryCSM Clearing and settlement mechanismDGSD Deposit Guarantee Schemes DirectiveDTCC The Depository Trust & Clearing CorporationDVP Delivery versus paymentEAA Euro area accounts

6ECBFinancial integration in EuropeApril 20146
EBA European Banking AuthorityEBF European Banking FederationEBRD European Bank for Reconstruction and DevelopmentECB European Central BankEcofin Council Council of Economic and Finance MinistersECP Euro commercial paperECSDA European Central Securities Depositories AssociationEEA European Economic AreaEFMLG European Financial Markets Lawyers GroupEFSF European Financial Stability FacilityEIOPA European Insurance and Occupational Pensions AuthorityEMIR European Market Infrastructure RegulationEMU Economic and Monetary UnionEONIA Euro overnight index averageEPC European Payments CouncilERF European Resolution FundESA European Supervisory AuthoritiesESCB European System of Central BanksESM European Stability MechanismESMA European Securities and Markets AuthorityESRB European Systemic Risk BoardEU European UnionEUREPO Repo market reference rate for the euroEURIBOR Euro interbank offered rateFISCO Clearing and Settlement Fiscal Compliance expert groupFRFA Fixed-rate full allotmentFSB Financial Stability BoardFSOC Financial Stability Oversight CouncilGDP Gross domestic productIBAN International bank account numberICMA International Capital Market AssociationICPF Insurance corporations and pension fundsICSD International central securities depositoryIMF International Monetary FundIOSCO International Organization of Securities CommissionsISDA International Swaps and Derivatives Association, Inc.ISLA International Securities Lending AssociationLCG Legal Certainty GroupLTRO Longer-term refinancing operationLVPS Large-value payment systemM&A Merger and acquisitionMBS Mortgage-backed securityMFI Monetary financial institutionMiFID Markets in Financial Instruments DirectiveMMF Money market fundMRO Main refinancing operationsNASDAQ National Association of Securities Dealers Automated QuotationsNCB National central bankNFC Non-financial corporations

7ECB
Financial integration in EuropeApril 2014 7
ABBREVIAT IONS
NTMA National Treasury Management AgencyNYSE New York Stock ExchangeOECD Organisation for Economic Co-operation and DevelopmentOIS Overnight index swapOJ Official Journal of the European UnionOMT Outright Monetary TransactionsOTC Over the counterPHA Proprietary home accountRepo Repurchase AgreementRMBS Residential mortgage-backed securityRTGS Real-time gross settlementSCT SEPA credit transferSDD SEPA direct debitSEPA Single Euro Payments AreaSIFMA Securities Industry and Financial Markets AssociationSMP Securities Markets ProgrammeSRA Single Resolution AuthoritySRM Single Resolution MechanismSSM Single Supervisory MechanismSSP Single shared platformSTEP Short-term European paperTARGET Trans-European Automated Real-time Gross settlement Express Transfer systemTR Trade repositoriesT2S TARGET2-SecuritiesUNIDROIT International Institute for the Unification of Private LawWFE World Federation of Exchanges

8ECBFinancial integration in EuropeApril 201488
The ECB’s annual report on financial integration in Europe contributes to the advancement of the European financial integration process by analysing its development and the related policies.
The Eurosystem has a keen interest in the integration and efficient functioning of the financial system in Europe, especially in the euro area, as reflected in the Eurosystem’s mission statement. Financial integration fosters a smooth and balanced transmission of monetary policy throughout the euro area. In addition, it is relevant for financial stability and is among the reasons behind the Eurosystem’s task of promoting well-functioning payment systems. Without prejudice to price stability, the Eurosystem also supports the objective of completing the EU Single Market, of which financial integration is a key aspect.
In September 2005 the ECB published a first set of indicators of financial integration and an accompanying report assessing the state of euro area financial integration. Since then the work on financial integration has evolved and has resulted in the publication of a yearly report.
PREFACE

9ECB
Financial integration in EuropeApril 2014 9
KEY MESSAGES
OVERALL AssEssMENT OF FINANCIAL INTEGRATION
• Thepositivedevelopmentoffinancialmarketintegrationthatstartedinmid-2012continuedin most of the financial market segments in 2013. The redenomination risk, linked to the perception of a possible euro area break-up, seems to have essentially vanished recently. This was the result of monetary policy actions, continuous progress towards the establishment of the Banking Union and a steady reform process in a number of euro area countries.
• Nonetheless,significantfinancialfragmentationstillremainsintheeuroarea,especiallyinsome market segments. Further progress towards financial integration and stability cannot be taken for granted but should be underpinned by sustained policy action, especially on two fronts: effective implementation of the Banking Union in all its components and continuous effort, at the national level, towards fiscal consolidation and structural reforms aiming also at reducing competitiveness imbalances.
MONEy MARKETs
• Theintegrationofmoneymarketsintheeuroareaimprovedsomewhatin2013,particularlyin the secured segment, but overall fragmentation is still evident. The improvement was visible in the substantial decline in excess liquidity, as banks reduced their liquidity buffers and regained confidence, as well as from price- and quantity-based indicators.
BOND MARKETs
• Bondmarketintegrationinallmarketsegments(government,non-financialcorporatesandbanks) shows signs of slight improvement, although the degree of fragmentation is still higher than before the crisis.
• In the government bond market, both price- and quantity-based indicators show a clearimprovement in the level of integration.
• Corporatebondmarketsmirroredthedevelopmentsseeninthegovernmentbondmarkets.Price indicators suggest that the importance of the country effect stabilised to some degree in 2013. Quantity-based indicators point to persistent, but slightly receding, fragmentation.
EQUITy MARKETs
• The levelofequitymarket integration improved in2013.Thecross-countryheterogeneityaccording to price-based indicators (e.g. stock market returns) declined, and the negative trend in quantity-based indicators levelled off. However, most of the indicators still remain somewhat distant from pre-crisis levels.
KEy MEssAGEs

10ECBFinancial integration in EuropeApril 20141010
BANKING MARKETs
• Bankingmarketsshowedalimiteddegreeofimprovementinfinancialintegrationtowardsthe end of 2013. The large dispersion of borrowing costs for non-financial corporations across euro area countries, in particular for SMEs, is one of the main concerns for euro area economic recovery, but also for monetary and macro-prudential policy. This is compounded by a structurally reduced level of cross-border lending to non-financial corporations.
• SpecificpolicymeasurestodirectlyfosterSMEfinancingintheeuroareahavebeeninitiatedat the national and European levels. The introduction of the Banking Union is expected to contribute indirectly to the return of cross-border credit flows.

11ECB
Financial integration in EuropeApril 2014 1111
executive summary
EXECUTIVE sUMMARyChapter I summarises recent developments in the financial integration of four key financial market segments, notably money, bond, equity and banking markets in the euro area. The key findings are included in the key messages.
Chapter II focuses on the Single Resolution Mechanism (SRM), which is the necessary next step towards a Banking Union. The SRM to be established will consist of a single resolution authority with access to a single bank resolution fund. The Single Supervisory Mechanism (SSM) and the SRM are at the core of the Banking Union and will be complemented by more harmonised legal frameworks for both national deposit guarantee schemes (DGSD) and the recovery and resolution of banks (BRRD) at the level of all EU Member States. The Chapter looks at the main benefits of the proposed SRM for financial stability and financial integration, the main features of the SRM proposal, and the remaining challenges to SRM completion.
Chapter III provides an overview of the main activities that the Eurosystem has pursued in 2013 with a view to advancing financial integration in the euro area. It describes in detail the provision of ECB advice on the legal framework for securities services. Furthermore, it looks at the role that the ECB and the Eurosystem play as a catalyst in the field of enhancing knowledge, raising awareness and monitoring the state of financial integration (i.a. the provision of financial market statistics and financial integration indicators). Finally, it emphasises the latest developments regarding central bank services that foster financial integration (TARGET2 and TARGET2-Securities).
Special Feature A, entitled “Geographical segmentation of the euro area money market: a liquidity flow approach”, explores to what extent intra-euro area cross-border flows offset country-specific liquidity shocks in the context of fragmented money markets. The main finding is that the sovereign crisis appears to have contributed to the emergence of a geographical segmentation of liquidity and that euro area money markets currently do not completely effectively reallocate central bank liquidity from counterparties with a liquidity surplus to counterparties with liquidity needs. Although the most recent data showed liquidity allocation gradually improving, flows would take time to normalise, as re-establishing liquidity lines is a more protracted process than cancelling them. The decline in excess liquidity associated with persisting segmentation could help maintain some very short-term rate sensitivity to domestic liquidity, especially in the euro area member states, which are the more prone to domestic liquidity shocks.
Special Feature B, entitled “Divergence in financing conditions of small and medium-sized enterprises (SMEs) in the euro area”, finds that the ongoing state of fragmentation in banking markets has become a serious obstacle to SME access to financing, with implications for the economic recovery in distressed countries. The major causes of fragmentation along national borders have been the deterioration of the economic situation and the sovereign crisis in distressed countries. To mitigate this effect, public policies at both the national and the European level have been initiated. The Special Feature provides an overview of existing and possible new measures, and calls for more coordination of public policy support at the national level by joint European initiatives.
Special Feature C, entitled “Initiatives to promote capital market integration in the corporate bond and equity markets”, concludes that more integrated European markets for corporate bonds and equity markets would give firms a broader choice of financing. While there has been considerable progress on harmonising rules needed for the transparency (price formation) and integrity of the securities markets (notably market abuse), the European bond and equities markets still require
12ECBFinancial integration in EuropeApril 201412
further integration in other equally important areas, such as the harmonisation of Member States’ substantive laws relating to rights in securities or to corporate insolvency. Moreover, harmonised rules are necessary to apply and enforce day-to-day supervision of securities markets and instruments in the same manner across the Union. The identified obstacles to the full integration of corporate bond and equity markets need to be eliminated in order to successfully complement the Banking Union project, as these markets form an integral part of the EU financial system.
Special Feature D, entitled “The Eurosystem contribution to financial integration in the areas of securities and collateral”, finds that Eurosystem initiatives lead to the strengthening of financial integration within the domain of securities and collateral management in the euro area. It focuses on TARGET2-Securities (T2S), the integrated platform of the Eurosystem for settlement of securities in central bank money, and forthcoming enhancements to the Eurosystem’s Correspondent Central Banking Model (CCBM). The T2S project will bring cross-border efficiency and integration regarding not only securities settlement, but also cross-border holding of securities and asset servicing. T2S will help achieve a high degree of harmonisation and thus will contribute to financial integration, with all its benefits (e.g. reduced cost of cross-border settlement, collateral and liquidity savings, and reduction of back office costs, making Europe a better place to trade and invest). The CCBM has supported integration of financial markets in the euro area by providing a well-functioning cross-border collateral delivery mechanism since its establishment in 1999. The enhancements to the CCBM which will be introduced in the course of 2014 (namely the removal of the repatriation requirement and support of cross-border triparty collateral management services) will further support this integration by allowing for increased efficiency of counterparties’ collateral management in both central bank credit operations and market operations.
The Statistical Annex includes a set of 34 standard indicators, as well as five development indicators. Each financial integration indicator is described, including how it is technically derived and which message it conveys in terms of financial integration. Some of the indicators in the Statistical Annex are also used to describe recent financial integration developments in Chapter 1. Finally, the Statistical Annex includes an explanation of how each euro area country has been classified either as a distressed or as a non-distressed country.

13ECB
Financial integration in EuropeApril 2014
CHAPTER IRECENT DEVELOPMENTs IN FINANCIAL INTEGRATION IN THE EURO AREA
In 2013, despite an unprecedented improvement of the financial integration in euro area financial markets in most market segments, a relatively high degree of fragmentation still remains. The main concern – the perceived risks of redenomination, linked to the threat of a possible euro area break-up – was successfully mitigated by non-standard Eurosystem measures; further progress towards the establishment of the euro area regulatory and supervisory architecture, including the set-up of the single supervisory mechanism (SSM) and the single resolution mechanism (SRM); and by the economic and fiscal convergence process, initiated by the implementation of structural reforms in euro area countries, in particular in distressed countries. However, in many market segments, financial integration has not yet returned to pre-crisis levels. This development can be shown for example by the strong divergence of bank lending rates across euro area countries, in particular for SMEs. Moreover, the continuity of the financial integration recovery process cannot be taken for granted and could easily revert again, as the resurgence of domestic economic uncertainties in some distressed countries in the course of 2013 has shown. By breaking the nexus between sovereigns and banks, trust in the euro area banking sector can be strengthened. Further progress towards the implementation of the new regulatory and supervisory architecture can support this decoupling process.
1 INTRODUCTION
This chapter reviews the main developments regarding financial integration in the euro area during 2013. It focuses on the most important segments of the financial markets, namely the money, bond, equity and banking markets. The analysis is based on a number of indicators that can capture the financial integration perspective. For this reason, some indicators illustrate financial market development by means of a country grouping – distressed and non-distressed country groups – which is based on long–term sovereign interest rates for bonds with a remaining maturity of approximately ten years. The methodology of the country groupings is further described in the Statistical Annex. In addition, it is important to note that some indicators do not necessarily reflect solely market fragmentation, but also credit or liquidity risks, for example in the sovereign or corporate bond markets.
2 MONEy MARKETs
During the year of 2013, money market integration in the euro area – referring to unsecured and secured interbank lending – increased somewhat, with more and more trades in the money market taking place on a cross-border basis. This is reflected by the gradual decline of excess liquidity as well as an improvement of quantity- and price-based indicators. Fragmentation of money markets in the euro area is however still quite evident, coming from very high levels in the years before.
In the previous year, money markets were characterised by high levels of excess liquidity, which resulted from the conduct of two three-year longer-term refinancing operations (LTRO) in December 2011 and February 2012. These operations were conducted in an environment of high market stress and unprecedented levels of fragmentation along national borders. As a result of these operations, excess liquidity increased substantially from levels of €200-300 billion up to €800 billion, leading to interest rates in the unsecured money markets close to the ECB’s deposit

14ECBFinancial integration in EuropeApril 20141414
facility rate. The intermediation of the Eurosystem increased and to some extent replaced the market. The substitution was supported by some temporary changes in the Eurosystem liquidity management framework, in particular by the introduction of tenders with fixed rate and full allotment (see Special Feature A, Section IV).
As of January 2013, banks have had the option to start repaying the liquidity obtained in the three-year LTROs. Gradual repayments have taken place over the course of the year in an environment of reduced uncertainty, and in which renewed market access allowed banks to be less dependent on central bank funding. Particularly after President Draghi’s speech in July 2012 in London1 and the announcement of the outright monetary transactions (OMT) in September 2012, market conditions have improved noticeably. Counterparties have started to reduce and deleverage their balance sheets. Interest rate dispersion in the secured money market has converged to levels which had been reached only before the start of the financial crisis. Interbank lending volumes increased again, in both the secured and unsecured market, the latter having been under pressure since the start of the financial crisis.
Counterparties were making use of the opportunity to reduce their Eurosystem liabilities, particularly on the first repayment date for each operation respectively. After the initial repayments, average weekly repayments declined to around €4-5 billion. Through the end of the year, counterparties have repaid €446 billion out of €990.8 billion borrowed in the three-year LTROs (VLTRO).2 Early repayments corresponded to counterparties reducing their need for central bank reserves, taking advantage of improved market access to reduce reliance on Eurosystem refinancing and sending a strong and positive signal to the market. Those counterparties that enlarged their market-based funding most were also among the largest repayers. The early repayments were a significant determinant of the overall decline in excess liquidity during the year (see Chart 1), but other factors also played a role in the decline in excess liquidity, such as the increase in liquidity absorption by autonomous factors, in particular banknotes.3 However, having taken into consideration the pivotal role of early VLTRO repayments and the motives for them, as well as the limited effect of other liquidity-absorbing factors, the decline in excess liquidity largely reflects a decline in precautionary liquidity hoarding of euro money markets and a reduction in market fragmentation.
In May 2013, the Governing Council decided to cut the rate on the main refinancing operation
1 http://www.ecb.europa.eu/press/key/date/2012/html/sp120726.en.html2 The initial borrowed amount in the two three-year longer-term refinancing operations totalled €1,018.7 billion. There are a number of
technical factors that can affect the outstanding amount of an allotted tender. Among them, the loss of counterparty eligibility status may lead to the repayment of outstanding amounts.
3 Although government deposits are part of autonomous factors and display a strong seasonality pattern, their liquidity-absorbing effect has been limited on average.
Chart 1 Reduction in excess liquidity and early VLTRO repayments
(cumulative changes, in € billion)
-600
-400
-200
0
200
400
600
-600
-400
-200
0
200
400
600
excess liquiditygovernment depositsother net autonomous factorsother liq. prov. operationsLTRO repayments
Jan. Mar. May July Sep. Nov. Jan.2013 2014
Source: ECB calculations.

15ECB
Financial integration in EuropeApril 2014 15
I Recent developments
In f InancIal IntegRatIon In the euRo aRea
15
(MRO) to 50 basis points, narrowing the spread to the rate on the deposit facility to 50 basis points.4 Shortly after, the Governing Council introduced its framework of forward guidance.5 In November 2013, the Governing Council narrowed the policy corridor further by cutting the MRO rate by 25 basis points and leaving the deposit facility at 0 per cent. Also, it was decided to prolong the framework of fixed rate full allotment for all operations as long as it is needed, and at least until 7 July 2015.
PRICE-BAsED INDICATORs
The general improvement in money market integration during 2013 is reflected in the dispersion of money market rates, consistently across markets and maturities.
In the unsecured euro money market, the decline in dispersion was most pronounced for overnight rates. After interest rate dispersion in the Eonia O/N market had been at elevated levels at the end of 2012, interest rate dispersion declined over the year (Chart 2) as some banks could regain market access. In May, in the wake of tapering discussions in the US, dispersion in the EONIA rate rose somewhat. The implied increase in market fragmentation reflected the differing exposure of banking systems in the euro area to the US financial market. However, towards the year’s end, market dispersion continued its decline. The dispersion in EURIBOR rates declined more steadily over the year 2013 (Chart 2) for both maturities (1 and 12 months), confirming a development that had started in 2012. Such dispersion is the result of many factors, including banks’ access to the market.6
4 Banks can obtain liquidity from the ECB at the MRO rate, provided they post an adequate level of collateral, while banks with excess liquidity can deposit it at the central bank at the deposit facility rate.
5 http://www.ecb.europa.eu/press/pressconf/2013/html/is130704.en.html6 Another explaining factor for the different developments of EONIA, EURIBOR and EUREPO could be that while the EONIA rate is a
volume-weighted rate over a full day, the EURIBOR and EUREPO are a reference rate based on an expert assessment at a given point in time during a day. This should reflect lending rates from one generic prime bank to another generic prime bank and not the funding/lending rate of one particular bank to its counterparties.
Chart 2 Cross-country standard deviation of average unsecured interbank lending rates across euro area countries (EONIA, EURIBOR)(61-day moving average: basis points)
0
5
10
15
20
25
0
5
10
15
20
25
1999 2001 2003 2005 2007 2009 2011 2013
overnight 1-month maturity 12-month maturity
Sources: EBF-Euribor and ECB calculations.
Chart 3 Cross-country standard deviation of average interbank repo rates across euro area countries (EUREPO)(61-day moving average; basis points)
10
9
8
7
6
5
4
3
2
1
0
10
9
8
7
6
5
4
3
2
1
02003 2005 2007 2009 2011 2013
1-month maturity12-month maturity
Sources: EBF-Euribor and ECB calculations.

16ECBFinancial integration in EuropeApril 20141616
Also in the secured euro money market, dispersion of EUREPO has come down (Chart 3). Notably, for both short- and long-term maturities, dispersion in rates decreased. At the end of 2013, they even reached levels not seen since before 2007, i.e. before the start of the financial crisis. Thus, the secured market is leading the unsecured market in terms of market integration, which is in line with the structural shift between these markets since the financial crises. Secured markets became the preferred money market for European monetary financial institutions, with a share of about 40% of cumulative turnover in euro money markets in the second quarter of 2013 (ECB Euro Money Market Survey).
QUANTITy-BAsED INDICATORs
According to the ECB’s Euro Money Market Survey (conducted in Q2 2013), the relative geographical break down of money market transactions (secured and unsecured) has been rather stable over the decade for both country groups, with an increase in the share of domestic transactions in 2012 (Chart 4). The year 2013 marked a slight improvement in cross-border lending in non-distressed countries. While the relative share of domestic lending declined, the relative share in secured and unsecured domestic transactions from non-distressed countries to other euro area countries increased. In 2013, intra euro area transactions accounted for almost 60% of all lending. This reflects a renewed increase in banks’ willingness to engage in cross-border lending, and thus a re-integration of intra euro area money markets. The relative increase in cross-border lending also helps to offset the liquidity demand and reduce the reliance on central bank liquidity (see Special Feature A: Geographical Segmentation of the Euro Area Money Market: A Liquidity Flow Approach).
In distressed countries, the relative share of intra-euro area lending declined against an increase in extra-euro area lending, while the relative share of domestic lending stagnated. The persistently
Chart 4 Geographical counterparty breakdown for secured and unsecured transactions
(percentage of total transactions)
othereuro areadomestic
Distressed countries Non-distressed countries
0
20
40
60
80
100
0
20
40
60
80
100
2002 2004 2006 2008 2010 20120
20
40
60
80
100
0
20
40
60
80
100
2002 2004 2006 2008 2010 2012
Sources: ECB, Euro Money Market Survey.

17ECB
Financial integration in EuropeApril 2014 17
I Recent developments
In f InancIal IntegRatIon In the euRo aRea
17
high (almost 60%) share of domestic lending reflects the ongoing concerns about the sovereign debt crisis which affected mostly counterparties from countries under stress.7
UsING TARGET2 PAyMENT DATA TO ANALysE MONEy MARKET TRANsACTIONs
Despite their fundamental importance, relatively little is known about actual transactions in interbank markets since, for the most part, banks trade short-term debt over the counter. Hence, information about the functioning of euro interbank markets has relied on limited data from electronic trading platforms, or on surveys.
An indirect method of obtaining detailed and comprehensive data on unsecured overnight interbank loan transactions is to use data from payment systems to reconstruct the unsecured overnight interbank loans that are responsible for the observed payments.8 When banks trade liquidity in central bank money, the comprehensive data from payment systems that settle in central bank money can be used to identify overnight interbank transactions. Examining the TARGET2 payment data in their entirety makes monitoring euro area-wide developments possible. Since the underlying information is at the level of individual transactions, it can be aggregated at different levels to examine specific questions.
Chart 5 shows that the share of cross-border unsecured overnight interbank activity declined after the Lehman Brothers bankruptcy in September 2008. It then recovered gradually before declining markedly during the intensification of the sovereign debt crisis. This suggests that not only did the unsecured overnight euro area money market shrink, it also fragmented. However, the data also shows that the situation started to improve again as from the beginning of 2013.
3 BOND MARKETs
In 2013 euro area bond market (i.e. for sovereigns, non-financial corporates and banks) fragmentation receded further. This was the result of several factors. First, the disparity in economic sentiment across euro area countries declined,9 driven by improvements in macroeconomic data releases but also by the implementation of structural reforms in
7 The share of domestic transactions could be upwardly biased, since transactions with central counterparties are likely to be attributed to a domestic counterparty (the CCP), also when the third party is indeed a foreign. Because CCP transactions have risen in importance in the second half of the sample period, they might have affected the domestic share for this period.
8 As an example, see Arciero, L., Heijmans, R., Heuver, R., Massarenti, M., Picillo, C. and Vacirca, F., “How to measure the unsecured money market? The Eurosystem’s implementation and validation using TARGET2 data”, DNB Working Paper, No 369, De Nederlandsche Bank, January 2013. See also ECB Monthly Bulletin article on “TARGET balances and monetary policy operations”, May 2013.
9 Although the high share of domestic lending still reflects the ongoing concerns about the sovereign debt crisis.
Chart 5 share of cross-border overnight money market transactions identified in TARGET2(percentage)
20
30
40
50
60
70
20
30
40
50
60
70
May Nov. May Nov. May Nov. May Nov. May Nov. Nov.May
cross-border share
2011 2012 20132008 2009 2010
Source: TARGET2 money market transactions, based on ECB methodology refined in 2013. Notes: Intra-group transactions were excluded; if transactions have a zero interest rate, they are not identified as a loan.
18ECBFinancial integration in EuropeApril 20141818
distressed countries and the progresses on euro area architecture reform.10 Second, the ECB’s announcement of Outright Monetary Transactions (OMTs) in September 2012 had long-lasting effects throughout 2013. This announcement gradually restored market confidence and countered the self-fulfilling process of market fragmentation, which peaked in the summer of 2012 and which impaired monetary policy transmission. Third, accommodative monetary policy stances persisted in all major economies. The prospect of low yields in AAA-rated bond markets contributed to a search for yield in lower-rated bonds. This drove sovereign spreads of distressed countries lower and may have contributed to a lower fragmentation of the European sovereign debt market. However, some resurgence of domestic uncertainties in a limited number of distressed countries in 2013 slowed down somewhat the bond market integration.
sOVEREIGN BOND MARKETs
Overall, euro area sovereign bond markets remained segmented in 2013. However, the degree of segmentation was much smaller than in 2012.
In order to concretely illustrate the degree of remaining sovereign bond market segmentation, the following analysis first considers simple differences in yields. As a next step, it studies how far these differences can be explained by differences in actual risk and related premia which should normally not be seen as signs of market segmentation.11 Thereafter, evidence from quantities, i.e. turnover in the secondary and in the primary market and cross-border holdings, are considered.
PRICE-BAsED INDICATORs OF sOVEREIGN BOND MARKETs
Chart 6 depicts the dispersion of euro area sovereign bond yields at the ten-year and two-year maturities, as characterized by the median, the interquartile range (i.e. the range between the third and the first quartile), and the range between the highest and the lowest yield. The chart also shows the yields of some distressed countries as well as the average for the euro area.
The chart shows that a pronounced divergence in yields emerged in 2009. At that point in time, market participants began to perceive a tangible credit risk on some euro area sovereigns. Some sovereign bond yields that had already been driven up by country-specific fiscal and macro risks became additionally contaminated by self-reinforcing premia relating to market fragmentation and perceived risks of redenomination12 (i.e. perceived risk of a euro area break-up). However, the size of these self-reinforcing premia, and therefore also the divergence in government bond yields, declined significantly after the announcement of OMT in 2012. Still, the cross-country difference remained higher in 2013 than in the period 2000-2009. This may not necessarily reflect remaining market fragmentation, but rather continued differences in economic and fiscal outlook across countries as well as a possible under-appreciation of sovereign risk before 2009.
In this context, it is noted that the euro area sovereign ratings continue to show a relatively low average level and a large dispersion compared with the period before 2009 (Chart 7). Moreover, although the average euro area sovereign rating increased slightly and dispersion fell during
10 In particular, in October 2013 the European Council adopted the regulation for the Single Supervisory Mechanism (SSM), providing the ECB with direct supervisory powers over the largest euro area banks and harmonising the regulation throughout the euro area.
11 For instance, Battistini, Pagano and Simonelli (2013) found that dispersion of sovereign yields purged from risk premia points towards more limited market segmentation than shown by conventional measures.
12 Estimation of the premia relating to the risk of redenomination of a given euro-denominated asset into a devalued legacy currency is a difficult task. However, under certain assumptions estimates can be achieved from differences between domestic and USD-denominated CDS premia.

19ECB
Financial integration in EuropeApril 2014 19
I Recent developments
In f InancIal IntegRatIon In the euRo aRea
19
2013, rating agencies have signalled a negative watch for several euro area countries, both for distressed and non-distressed countries.
Overall, it now appears more plausible than was the case in the summer of 2012 to conclude that the current heterogeneity observed in the euro area is a reflection of differences in underlying credit risk. Concomitantly, the above-mentioned self-reinforcing premia relating to market fragmentation and perceived redenomination risks have also declined significantly from the peak levels observed in the summer of 2012.
Similar conclusions emerge when considering credit default swap (CDS) premia on sovereigns (Charts 10 and 15 in the Statistical Annex).
The price differential between euro area sovereign bonds, however, is not only driven by differences in credit risk premia, but also by differences in market liquidity. In particular during crisis times, the price on more liquid assets, notably German government bonds, is significantly higher than that on less liquid
Chart 6 Dispersion of Euro area sovereign bond yields
(percentage points)
min-max rangeinterquartile rangeaverage euro areaIreland
SpainItalyPortugal
10-year maturity 2-year maturity
0
5
10
15
20
0
5
10
15
20
2007 2008 2009 2010 2011 2012 20130
5
10
15
20
0
5
10
15
20
2007 2008 2009 2010 2011 2012 2013
Sources: Thomson Reuters and ECB.Notes: The data used are based on euro area country composition as in 2011. The yields for Greece, Cyprus, Estonia, Luxembourg, Malta and Slovenia are excluded owing to infrequent or a lack of observations.
Chart 7 sovereign debt rating developments and dispersion in the euro area
7
6
5
4
3
2
1
standard deviation (left-hand scale)average sovereign rating (right-hand scale)
AAA
AA+
AA
AA-
A+
A
A-1999 2001 2003 2005 2007 2009 2011 2013
Sources: Thomson Reuters and ECB.Notes: The chart shows Standard & Poor’s ratings for long-term sovereign debt. The right-hand side scale represents the simple average rating expressed as letter grades. The left-hand side scale represents the standard deviation of ratings expressed as numerical notches.

20ECBFinancial integration in EuropeApril 20142020
assets. The premium on liquid assets can be quantified from the spread between sovereign and agency bonds,13 which bear the same credit risk and only differ in terms of liquidity. Such quantification is illustrated in Chart 8 using French and German bonds. The decline in the liquidity premium is another factor contributing to the reduction in sovereign bond spreads illustrated above.
QUANTITy-BAsED INDICATORs OF sOVEREIGN BOND MARKETs
More information on the integration of sovereign bond markets can be extracted from cross-border holdings of government bonds. Another element pointing to some remaining fragmentation of euro area sovereign bond markets is the continued low share of euro area MFI cross-border holdings (i.e. non-domestic but within euro area) of government bonds (Chart 9). This share has been steadily declining since 2006, although it seems to have stabilised at a low level in 2013. While the initial decline in 2006 was mainly due to portfolio reallocations from domestic sovereign bonds into bonds issued outside the euro area, the decline over the last three years was led by an increase in MFI holdings of domestic government securities. Such increases were also observed for countries where the holdings of domestic government bonds were already at high levels before the crisis. The elevated levels in banks’ exposure to risks from domestic sovereign bonds are one important dimension of the tight bank-sovereign linkages (Chart 15 in the Statistical Annex) that operate in both directions: improvements/worsening in the perception of sovereign risk translate into banks.
Overall, the quantity-based indicator points to continued fragmentation of the euro area sovereign bond market. However, the recent stabilisation in the cross-border holdings of government bonds may indicate a trend reversal towards reduced fragmentation. This would be consistent with the positive reading of the price indicators.
13 Government-guaranteed agency yields are constant-maturity yields of estimated curves for the German agency KfW (Kreditanstalt für Wiederaufbau (for France: Caisse d’Amortissement de la Dette Sociale). As the bonds issued by KfW (CADES) are fully guaranteed by the state, their credit risk is equal to that of the government bonds.
Chart 8 spreads between agency bonds and sovereign bonds for Germany and France at ten-year maturity(5-day moving averages of daily data; basis points)
0
10
20
30
40
50
60
70
80
90
0
10
20
30
40
50
60
70
80
90
2009 2010 2011 2012 2013
GermanyFrance
Sources: Thomson Reuters and ECB.Note: Zero-coupon spreads between agency and government bond yields.
Chart 9 share of MFI cross-border holdings of debt securities issued by euro area and EU corporates and sovereigns(percentage of total holdings, excluding the Eurosystem)
0
5
10
15
20
25
30
35
40
45
0
5
10
15
20
25
30
35
40
45
1999 2001 2003 2005 2007 2009 2011 2013
other euro area government and corporate bondsother euro area corporate bonds other euro area government bonds rest of EU government and corporate bonds
Source: ECB.Note: Outstanding amounts are classified by the residency of the issuer. Eurosystem holdings are excluded.

21ECB
Financial integration in EuropeApril 2014 21
I Recent developments
In f InancIal IntegRatIon In the euRo aRea
21
CORPORATE BOND MARKETs
Corporate bond markets are closely related to government bond markets, because government bond prices are typically used as a benchmark for the pricing of corporate bonds. As a result, euro area corporate bond market developments regarding segmentation have mirrored those seen in the government bond markets.
To illustrate the degree of corporate bond market segmentation, the first part considers simple price-based indicators. As a second step, it is shown which proportion of variance in corporate bond yields can be explained by rating effects, country effects or sector effects. Thereafter, evidence from quantity-based indicators (i.e. issuance of debt securities by banks and NFCs) is considered.
PRICE-BAsED INDICATORs OF CORPORATE BOND MARKETs
As illustrated in Chart 10, the cross-country dispersion of corporate bond yields, for both covered bank bonds and bonds issued by NFCs, has moved rather closely together with the cross-country dispersion in government bond yields. In particular, Chart 10 shows that the cross-country dispersion in NFC bond yields declined substantially and in tandem with the dispersion of government bond yields in the second half of 2012, following the ECB’s announcement on OMT.
The implications of the economic and sovereign debt crisis for the corporate bond markets are also illustrated by the increased frequency of corporate rating downgrades that it triggered. In this respect, Chart 11 displays a measure for the downgrading intensity,14 distinguishing distressed
14 Rating downgrading intensity is defined as the number of downgraded issues minus the number of upgraded issues as a proportion of all outstanding bonds over a rolling window of six months. Lines are smoothed by one-year moving averages.
Chart 10 Cross-country dispersion in bond yields among non-financial corporations and banks in the euro area(daily data; standard deviation, percentage points)
0
1
2
3
4
0
1
2
3
4
2007 2008 2009 2010 2011 2012 2013
uncovered corporate bonds issued by non-financial corporationcovered bondssovereign bonds
Sources: Datastream Thomson Reuters and ECB calculations.Note: The chart shows standard deviations for Barclay’s country indices for corporate bonds (issued by non-financial corporations), IBOXX country indices for covered bonds (issued by banks) and country 10-year benchmark government bonds yields. Due to data availability, data only include observations for Germany, Portugal, Spain, Finland, and France.
Chart 11 six-months rating downgrading intensity per country of risk
(percentages, smoothed by 1-year moving average)
-15
-5
5
15
25
35
45
55 55
-15
-5
5
15
25
35
45
1999 2001 2003 2005 2007 2009 2011 2013
average for non-distressed countriesaverage for distressed countries
all countries
Sources: ECB calculations, Merrill Lynch and Bloomberg.Note: Rating downgrading intensity = (number of corporate issuer downgrades for 6 months – number of corporate issuer upgrades for 6 months)/average number of rated issues during 6 months. Line for all countries depicts average values for 14 countries, as specified in Chart 13.

22ECBFinancial integration in EuropeApril 20142222
and non-distressed countries. The Chart shows that the downgrading intensity for non-distressed countries has increased less than for distressed countries. Specifically, for non-distressed countries the downgrading intensity remained at low levels until 2011, and it only reached a peak value of 17% in 2012, when the sovereign crisis intensified. The downgrading intensity for distressed countries increased far more rapidly and reached a peak value of 52% in 2012. Since mid-2012 the downgrading intensities for both groups of countries have declined – very intensively in the case of distressed countries, although they remain in positive territory.
To complement these two indicators, an econometric analysis is carried out to assess the extent to which corporate bond yields can be explained by various risk factors, notably corporate ratings, sectors or the country of the issuer. The magnitude and the significance of the latter (country effect) can be interpreted as a price-based indicator of market fragmentation. For that purpose, cross-sectional regressions are carried out by relating corporate bond yield spreads (relative to Euribor swap rates) to dummies for country, rating and sectors, as well as several other bond-specific variables such as maturity, liquidity and coupon.15
Chart 12 shows the proportion of variance in corporate bond yields that can be explained by the various components of regression, while Chart 13 plots the estimates of the country effects. Chart 12 confirms that in the first years of the EMU the bulk of total variance explained in the regressions (up to around 55%) could be attributed to the rating effect. However, with the start of the financial crisis in 2007, the proportion of variance, attributed to the pure country effect increased. In 2011
15 More details can be found in Krylova, “Determinants of corporate euro-denominated bond spreads”, ECB WP, forthcoming, 2014.
Chart 12 Proportion of cross-sectional variance of corporate bond yield spreads explained by various regressors(percentage)
-15-10-505
10152025303540455055
-15-10-50510152025303540455055
2000 2002 2004 2006 2008 2010 2012
explained by regression
explained by sector effectexplained by rating effect
explained by country effect
Sources: ECB calculations, Merrill Lynch and Bloomberg.Notes: Cross-sectional regression relates corporate bond yield spreads (with respect to the Euribor swap spreadwith identical time to maturity) to a constant, the bond’s coupon, time to maturity and liquidity and a set of dummies, distinguishing between 14 countries, 10 rating categories and 2 sectors (financial and non-financial) for 174 monthly time intervals from 1999 to 2013 for a sample of more than 5,000 Eurobonds.
Chart 13 Cross-sectional regression of corporate bond yield spreads: estimated country effect(basis points)
-120
-60
0
60
120
180
240
360
300
-120
-60
0
60
120
180
240
360
300
2000 2002 2004 2006 2008 2010 2012
ATAUBECH
DEDKESFR
GBITJPNL
SEUS
Sources: ECB calculations, Merrill Lynch and Bloomberg.Notes: Cross-sectional regression relates corporate bond yield spreads (with respect to the Euribor swap spreadwith identical time to maturity) to a constant, the bond’s coupon, time to maturity and liquidity and a set of dummies, distinguishing between 14 countries, 10 rating categories and 2 sectors (financial and non-financial) for 174 monthly time intervals from 1999 to 2013 for a sample of more than 5,000 Eurobonds.

23ECB
Financial integration in EuropeApril 2014 23
I Recent developments
In f InancIal IntegRatIon In the euRo aRea
23
and in 2012 this effect was more important than the rating effect, witnessing tangible fragmentation. Moreover, the magnitude of the country effects, presented in Chart 13, increased significantly in the first half of 2012, notably for the two distressed countries included in the regression.16 However, both charts suggest that the importance of the country effect diminished in the second half of 2013.
QUANTITy-BAsED INDICATORs OF CORPORATE BOND MARKETs
Corporate bond market integration can also be analysed using cross-border MFI holdings of corporate bonds and issuance of corporate bonds across sectors and countries.
Cross-border MFI holdings of corporate bonds also point to remaining fragmentation. The share of cross-border holdings of EU corporate debt out of total holdings of corporate debt securities declined, but at a slower pace, as did the share of cross-border EU sovereign bonds (Chart 9 in the government bond section). Regarding securities issued by MFIs (Chart 14), since the onset of the crisis, euro area MFIs have tended to decrease their relative share of securities issued by other euro area MFIs, which has mirrored the upward trend of the share of MFIs securities issued domestically. In 2013, these two opposite trends levelled off somewhat, which can be interpreted as a stabilisation of the process of bank bond market fragmentation.
Regarding the state of issuance, covered bank bonds were characterised by low issuance in 2012 and 2013 in the euro area (Chart 15). This is related to many factors that only partially reflect market fragmentation. The various factors include risk perception, the impact of new regulation, deleveraging in view of weak credit demand, and the Eurosystem’s provision of three-year funding in late 2011. However, a slight improvement was observed in the issuance of covered bonds by banks in distressed countries in the second half of 2013.
16 Corporate bonds of Greece, Ireland and Portugal were excluded from the regression sample as they are not present in the index during the whole period of analysis.
Chart 14 share of euro area MFI holdings of debt securities issued by MFIs by residency of the issuers(percentage of total holdings, excl. Eurosystem)
0
10
20
30
40
50
60
70
80
90
0
10
20
30
40
50
60
70
80
90
2000 2002 2004 2006 2008 2010 2012
domesticother monetary union Member Statesrest of EU
Source: ECB. Note: Outstanding amounts are classified by the residency of the issuer. Eurosystem holdings are excluded.
Chart 15 Volume of covered bank bond issuance at country level
(EUR millions)
0
50
100
150
200
250
0
50
100
150
200
250
2003 2005 2007 2009 2011 2012
non-distresseddistressed
Sources: Dealogic DCM Analytics and ECB calculations.Notes: Based on data available until December 2013.Retained and self-funded deals are not included. Euro area member states with a very small issuance are not shown.

24ECBFinancial integration in EuropeApril 20142424
Regarding the net issuance of corporate bonds by non-financial corporations,17 a notable increase has been observed at the aggregate euro area level (Chart 16), in particular in the high-yield segment. In fact, this increase has been sufficient to offset a decline in the net flow of bank loans that has also been observed at the aggregate level. However, this development masks significant differences across countries. In particular, the positive net issuance of corporate bonds is concentrated in the non-distressed countries, where there has been no decrease in the net flow of bank loans. In contrast, there has been a strong decrease in the net flow of bank loans in distressed countries, where the net issuance of corporate bonds is only moderately positive. As a consequence, there may be some concerns regarding the financing of the real economy.
Overall, both price- and quantity-based indicators point to persistent, but slightly receding, fragmentation of the corporate bond market in 2013.
4 EQUITy MARKETs
The degree of cross-country heterogeneity in stock market returns declined in 2013 compared with 2012. As mentioned in the previous section on bond markets, this may be related to lower disparity in economic sentiment across euro area countries, as well as progress on structural reforms, the ECB’s OMT announcement and global liquidity conditions which supported a search-for-yield attitude.
The reduced cross-country heterogeneity in stock market returns is consistent with some relative improvements in other price-based indicators18 and the levelling off in the negative trend of
17 This statistic, however, does not include debt securities issued by NFCs via ad hoc conduits, mainly established in a few selected countries (e.g. Luxembourg, Spain and the Netherlands)
18 However, some price-based indicators have not yet reflected this improvement because of their low frequency of calculation.
Chart 16 NFCs debt security, bank loans and quoted share issuance
(EUR billions; annual sums)
-150
-50
50
150
250
350
450
550
650
750
-150
-50
50
150
250
350
450
550
650
750
2001 2005 20072003 2009 2011 2013 2002 20042000 2006 2008 2010 2012 2001 20052003 20092007 2011 2013
non-distressed countries
distressed countries
euro area
corporate bondsbank loansquoted sharestotal
Source: ECB.Notes: non-distressed countries: BE, DE, FR, NL and AT, distressed countries: IE, GR, ES, IT and PT.

25ECB
Financial integration in EuropeApril 2014 25
I Recent developments
In f InancIal IntegRatIon In the euRo aRea
25
quantity-based indicators of stock market integration. The following section looks first at price-based indicators and then at quantity-based indicators.
PRICE-BAsED INDICATORs
Chart 17 shows the dispersion of euro area stock market index returns, as characterised by the interquartile range (i.e. the range between the third and the first quartile) and the range between the highest and the lowest index return in the period from 1999 to 2013. While the introduction of the euro was followed by a period of convergence of stock market returns, heterogeneity in stock market returns started to increase in 2008, but increased more significantly in 2010-2012 following the start of the euro area sovereign debt crisis. However, since the OMT announcement in September 2012, heterogeneity has declined substantially and in 2013 almost reached pre-crisis levels. However, heterogeneity in stock market returns is only a first rough measure of market integration. The following considers other indicators used to measure price divergence and common shocks/country specific shocks explaining euro area equity returns.
A first indicator – the “segmentation index” – presented in Chart 18 measures equity market segmentation by comparing the degree of heterogeneity in the valuation of the main industries between each of the two country groups (distressed or non-distressed) and the euro area average. A larger value indicates a higher level of market segmentation, while a zero value implies perfect integration. From this chart, it can be seen that until 2011, distressed and non-distressed countries presented a similar degree of segmentation, both being particularly strongly affected by the Lehman Brothers crisis. However, since 2011, while market segmentation for non-distressed countries has, according to this indicator, fluctuated around the long-term average, market segmentation for
Chart 17 Equity market index returns in the euro area
(in percentage per annum)
0.0
0.2
0.4
0.6
-0.6
-0.4
-0.2
-0.6
-0.4
-0.2
0.0
0.2
0.4
0.6
interquartile rangemin-max range
median
1999 2001 2003 2005 2007 2009 2011 2013
Sources: Thomson Reuters and ECB calculations.Notes: The chart represents minimum, maximum, interquartile range and median for equity market index returns. Countries considered are Austria, Belgium, Ireland, Italy, Finland, France, Germany, Greece, Netherlands, Portugal and Spain.
Chart 18 Equity market segmentation in distressed and non-distressed countries
0.045
0.040
0.035
0.030
0.025
0.020
0.015
0.005
0.000
0.045
0.040
0.035
0.030
0.025
0.020
0.015
0.005
0.0001995 1997 1999 2001 2003 2005 2007 2009 2011 2013
non-distressed countriesdistressed countries
Sources: Thomson Reuters and ECB calculations.Notes: For technical details on the calculation of this indicator, see notes to Chart 17 in the Statistical Annex. The country groupings are further described in the Statistical Annex.

26ECBFinancial integration in EuropeApril 20142626
distressed countries reacted strongly to the euro area crisis, peaking in May 2012 at a level close to that observed during the Lehman Brothers episode. However, after President Draghi’s speech in London on 26 July 2012 and the announcement of OMTs in September 2012, the index for distressed countries declined substantially, although it still remains above its long-term average.
A second indicator presents the dispersion in equity returns across sectors and across countries in the euro area.19 Chart 11 in the Statistical Annex shows a long-term perspective to highlight the fact that since 2010 the gap between cross-country and cross-sectoral dispersions has significantly increased to levels comparable with pre-EMU levels, a period characterised by a low level of stock market integration and a strong dominance of country factors.20
However, when looking at the latest developments in 2013 (Chart 19) the situation has improved somewhat, with country dispersion declining toward lower levels, although a gap still exists with sector dispersion. This suggests that, recently, country considerations have somehow declined modestly as break-up fears receded and euro area economies slowly returned to growth.
The third indicator, presented in Chart 20, shows the explanatory power of the first three common factors extracted from daily stock returns based on country indices.21 There is an overall positive trend in the explanatory power of the common factors between 1993 and 2010, indicating
19 The first indicator shows how a group of countries can diverge from its average in terms of expected earnings yield, while the second indicator compares the divergence between sector dispersion and country dispersion at the euro area level.
20 While Chart 11 in the Statistical Annex focuses on long-term trends with a long time span (1976-2013), chart 20 focuses more on short-term developments with a shorter time span (1999-2013) and a different smoothing technique.
21 An explanatory power of close to 100% indicates that the country-specific shocks are irrelevant and that stock prices are driven by the first three common factors. The explanatory power of the first common factor is not so different from the first three common factors taken together. This choice of three common factors is based on the methodology of Pukthuanthong and Roll (2009). For more details, see the Statistical Annex.
Chart 19 Country and sector dispersions in euro area equity returns
(percentages)
0.00
0.01
0.02
0.03
0.04
0.05
0.06
0.07
0.00
0.01
0.02
0.03
0.04
0.05
0.06
0.07
1999 2001 2003 2005 2007 2009 2011 2013
countrysector
Sources: Thomson Reuters and ECB calculations.Notes: the cross sectional dispersions are smoothed with a three-month moving average. In Chart 11 of the Statistical Annex, the same dispersions are filtered using the Hodrick-Prescott smoothing technique. For more details on the calculation of this indicator, see notes to Chart 11 in the Statistical Annex.
Chart 20 Equity market integration based on common factor portfolios in euro area countries
0.0
0.1
0.2
0.3
0.4
0.5
0.6
0.7
0.8
0.9
0.0
0.1
0.2
0.3
0.4
0.5
0.6
0.7
0.8
0.9
1989 1992 1995 1998 2001 2004 2007 2010 2013
distressed countriesnon-distressed countries
Sources: Thomson Reuters and ECB calculations.Note: For the technical details on the calculation of this indicator, see the notes to Chart 16 in the Statistical Annex.

27ECB
Financial integration in EuropeApril 2014 27
I Recent developments
In f InancIal IntegRatIon In the euRo aRea
27
increased integration. However, since 2011, the explanatory power of the common factors has decreased from 84% to 67%, its lowest level since 2005. This indicates a potential emergence of domestic risk factors and reduced integration.22 The reason for the decline in 2012 was that the equity markets of distressed countries strongly underperformed compared with those of non-distressed countries, while in 2013, the equity markets of distressed countries have been catching up, with some of them outperforming the equity markets of non-distressed countries.
In the same vein, a fourth indicator,23 presented in Chart 21, shows the proportion of variance in euro area country equity returns explained by US and common euro area stock market shocks during different time periods. Since July 2012, common euro area shocks have accounted for about 34% of the total volatility on average,24 which is below the average level from January 2008 to July 2012. As a result, country-specific shocks (i.e. the non-explained part of the variance) have been the main driver explaining euro area stock market volatility since July 2012. Overall, despite the improvements seen after President Draghi’s speech in London on 26 July 2012, in which he reiterated the Eurosystem’s resolve to preserve the euro, there has been a small decline in the impact of common euro area shocks on euro area stock markets, potentially reflecting the predominance of country-specific shocks for distressed countries. This gives some indication of increased segmentation on average in euro area equity markets since July 2012.
QUANTITy-BAsED INDICATORs
Quantity-based indicators such as cross-border holdings of equity issued by euro area residents and equity funds’ assets developments also provide evidence on the state of equity market integration.
The percentage of euro area investment funds’ cross-border holdings of equity issued in other euro area countries has declined since the beginning of the financial crisis in 2008. In 2012 it reached a level comparable to that of 2001 (Chart 22), fuelled by euro area break-up fears. However, after President Draghi’s speech in London on 26 July 2012, the declining trend levelled off. The decline observed since 2008 in euro area investment funds’ holdings of equity issued in other euro area countries has not prevented a continued increase in the overall intra-euro area relative cross-border holdings of equity issued by euro area residents (Chart 23). The continuous increase of these
22 However, the decline in the explanatory power of the common factors may also reflect the heterogeneity in the composition of country indices, and the fact that some sectors are more prone to reflect crisis tensions than others.
23 The third indicator shows how much of the local equity returns are explained by common factors, while the fourth indicator disentangles common shocks (US and euro area shocks) and country-specific shocks explaining local equity returns in the euro area. The higher the magnitude of the common euro area shocks, the more integrated local equity markets are.
24 By comparison, shocks stemming from the United States explain around 25% of euro area stock market volatility, which has not moved significantly since 2008.
Chart 21 Proportion of variance in euro area country equity returns explained by euro area and Us stock market shocks
0.00
0.05
0.10
0.15
0.20
0.25
0.30
0.35
0.40
0.45
0.50
0.00
0.05
0.10
0.15
0.20
0.25
0.30
0.35
0.40
0.45
0.50
1 2 3 4 5 61 1986-19912 1992-19983 1999-2003
4 2004-20075 2008-20126 2012-2014
euro area shocks US shocks
Sources: Thomson Reuters and ECB calculations.Notes: For details on the estimation methodology, see the notes to Chart 12 in the Statistical Annex. For this chart, the cut-off for 2012 is the London speech on 26 July 2012.

28ECBFinancial integration in EuropeApril 20142828
relative cross-border holdings to a level of 44% in 2012, compared to just 22% in 2001, confirms that the advent of the euro area led to a continuous integration of equity markets. In addition, euro area cross-border holdings were more resilient during the crisis than non-euro area cross-border holdings, which led to some increases of the relative share of euro area cross-border holdings of equities in 2011 and 2012.
A broader analysis of financial integration in corporate bond and equity markets is presented in the Special Feature C, “Initiatives to promote further capital market integration in the corporate bond and equity markets”.
5 BANKING MARKETs
Although the latest trend in the integration of banking markets – referring to banks’ lending activities and deposit gathering is mainly positive, indicators show only a very limited degree of improvement in financial integration since the peak of the sovereign debt crisis in mid-2012. Some banks have resumed their cross-border activities, but the level of integration in the banking markets remains lower than before the financial crisis. The main concern continues to be the huge divergence of borrowing costs for non-financial corporations across euro area countries, in particular for SMEs, which puts a high burden on the recovery of weak euro area economies and on monetary and macroprudential policy. In this environment of fragmentation, confidence needs to be restored in the banking sector. One important element in this regard is the introduction of the Banking Union, which is expected to contribute to the return of cross-border credit flows to the real economy and
Chart 22 Euro area investment fund holdings of equity issued in other euro area countries and the rest of the world(percentages)
0
10
20
30
40
50
60
70
0
10
20
30
40
50
60
70
1999 2001 2003 2005 2007 2009 2011 2013
other euro area countriesrest of the world
Source: ECB. Last observation: Q3 2013.
Chart 23 Cross-border holdings of equity issued by euro area residents
(percentages)
0
10
20
30
40
50
intra-euro area extra euro area
19972001200220032004
20052006200720082009
201020112012
0
10
20
30
40
50
Sources: IMF 1 , Thomson Reuters and ECB calculations. Notes: Intra-euro area is defined as the relative share of equity issued by euro area residents and held by residents of other euro area countries (excluding central banks). Extra-euro area is defined as the relative share of euro area equity held by non-euro area residents of the euro area (excluding central banks). Last observation: 2012

29ECB
Financial integration in EuropeApril 2014 29
I Recent developments
In f InancIal IntegRatIon In the euRo aRea
29
to a decline in bank lending rates in distressed countries. In addition to this, policy initiatives at the national and European levels are aimed at fostering SME financing in the euro area.
PRICE-BAsED INDICATORs
The prices of certain financial services in the euro area countries can give insights into the state of financial integration. For this purpose, composite indicators of the cost of borrowing for non-financial corporations, as well as for house purchases by households, are used. Both indicators are based on a new methodology as described in the August 2013 ECB Monthly Bulletin.25 Chart 24 contains the unweighted average for distressed and non-distressed countries.
The composite indicator for non-financial corporations shows that the borrowing costs of distressed and in non-distressed countries have progressively diverged since the onset of the financial crisis. The dispersion between these two country groups increased to 160 basis points in 2012. Moreover, the spread between the average interest rate in distressed countries and the interest rate on the main refinancing operations (MROs) has widened, whereas the same spread to non-distressed countries remains relatively stable. These developments hint at some fundamental issues in the banking markets: banking markets are increasingly less integrated, as corporations do not have equal access to funding in all euro area countries because of national factors (e.g. country-specific macroeconomic risks which affect borrower risk), and the lending rates in distressed countries have partly decoupled from ECB’s MRO lending rates. However, the same fundamental issues are not evident in the household mortgage lending market. The composite indicator of household borrowing costs for home purchases shows almost no divergence between distressed and
25 ECB (2013), “Assessing the retail bank interest rate pass-through in the euro area at times of financial fragmentation”, Monthly Bulletin.
Chart 24 Composite indicator of the cost of borrowing for non-financial corporations and households(three-month moving averages; percentages)
standard deviation (right-hand scale)MRO rate
non-distressed countries (average)distressed countries (average)
Non-financial corporations Households (home purchases)
0.0
0.2
0.4
0.6
0.8
1.0
1.2
1.4
1.6
1.8
0
1
2
3
4
5
6
7
2003 2005 2007 2009 2011 20130.0
0.2
0.4
0.6
0.8
1.0
1.2
1.4
1.6
1.8
0
1
2
3
4
5
6
7
2003 2005 2007 2009 2011 2013
Sources: ECB and ECB calculations.Notes: The indicator for the total cost of borrowing is calculated by aggregating short- and long-term rates and by applying a weighting scheme based on the 24-month moving averages of new business volumes. The cross-country coefficient of variation is calculated over a fixed sample of 12 countries (distressed countries: ES, GR, IE, IT, PT; non-distressed: AT, BE, DE, FI, FR, LU, NL).

30ECBFinancial integration in EuropeApril 20143030
non-distressed countries. Also, the spread to MRO did not broaden much, so the low ECB interest rates have been transmitted to these bank lending rates to the same extent as observed in the past.
A closer look at bank lending rates to corporations reveals that the increased cross-country dispersion of bank interest rates also applies to small loans in the euro area. New ECB statistics can split data by the size of loans (up to €0.25 million; between €0.25 and €1 million; over €1 million). The result is that the smallest loans have the highest dispersion in interest rates (Chart 25). As these very small loans are typically used by small and medium-sized enterprises (SMEs) the fragmentation appears to affect these companies even more than larger companies. SMEs play an important role in many distressed euro area countries, so high interest rates could be one of the obstacles to economic recovery for these countries. Therefore, many policy initiatives at the country and European levels to promote SME financing in the euro area have been set up or expanded.
Chart 25 Cross-country standard deviations of MFI interest rates on new loans to non-financial corporations(unweighted three-month moving averages, basis points)
100
110
120
130
140
150
160
170
100
110
120
130
140
150
160
170
over €1 million
€0.25 million€0.25-€1 million
2010 2011 2012 2013
Sources: ECB and ECB calculations.Notes: Included countries: AT, BE, CY, DE, EE, ES, FI, FR, IE, IT, NL, PT, SI and SK.
Chart 26 Deposit rates for non-financial corporations and households
(three-month moving averages; percentages)
standard deviation (right-hand scale) non-distressed countriesdistressed countriesMRO rate
Non-financial corporations Households
0
1
2
3
4
5
0.0
0.2
0.4
0.6
0.8
1.0
1.2
1.4
2003 2005 2007 2009 2011 20130
1
2
3
4
5
2003 2005 2007 2009 2011 20130.0
0.2
0.4
0.6
0.8
1.0
1.2
1.4
Sources: ECB and ECB calculations.

31ECB
Financial integration in EuropeApril 2014 31
I Recent developments
In f InancIal IntegRatIon In the euRo aRea
31
An overview on these initiatives and further information on the SME lending markets is provided in Special Feature B, “Divergence in financing conditions of small and medium-sized enterprises (SMEs) in the euro area”, in this Financial Integration Report.
Another perspective on financial integration in euro area banking markets is given by the development of interest rates on MFI deposits for non-financial corporations and households (Chart 26). The deposit rates closely followed the ECB MRO rate before the outbreak of the financial crisis. After that, the deposit rates, both for non-financial corporations and households in both country groups, diverged from MRO rates, whereby the interest rates in distressed countries rose more strongly than in non-distressed countries. This fragmentation points to an impaired access to funding markets for MFIs in distressed countries, as MFIs have to offer high interest rates for their customers. The latest data shows that the spread in the deposits rates between both country groups in both sectors narrowed to a large extent. Overall, the decreasing deposit rates in 2013 suggest an easing of funding conditions of MFIs in the euro area.
QUANTITy-BAsED INDICATORs
Banks can provide credit either locally through their affiliates or across borders. A growing euro area business activity through one of these channels would mean that banking markets are more integrated and that the benefits of a more harmonised market, for example lower costs for households and non-financial corporations due to a high level of competition, can be exploited. Further benefits of integrated markets, but also potential costs, are described in detail in the Financial Integration Report 2012.
As regards local affiliates, the share of subsidiaries and branches of non-domestic euro area banks to all banks remained stable in the years between the second half of 2009 and the first half of 2013. However, since 2010, the total number of foreign (= non-domestic euro area) affiliates in euro area countries has declined, and was lower in the first half of 2013 than at the end of 2009. The decrease in the number of foreign affiliates is in line with the overall trend of reducing bank affiliates. At the same time, these foreign affiliates’ share of both total assets and total loans declined in this period, reaching a level of around 14% in the first half of 2013 (Chart 27). These numbers for the euro area can hide huge differences between countries. Large countries mainly have shares below 10%; most of the small countries have shares of more than 80%. The development of the dispersion of total assets of foreign branches and subsidiaries of euro area banks across euro area countries is depicted in Chart 22 of the Statistical Annex.
Looking at the cross-border bank lending markets, the development has been similar.
Chart 27 Foreign affiliates
(total numbers (left-hand scale); percentage (right-hand scale))
22
21
20
19
18
17
16
15
14
13
12
2009 2010 2011 2012 2013H2 H1 H2 H1 H2 H1 H2 H1
number of foreign institutions (left-hand scale)
foreign share of total assetsforeign share of total loans
share of foreign insitutions
740
730
720
710
700
690
680
670
660
Source: ECB (CBD).

32ECBFinancial integration in EuropeApril 20143232
The share of cross-border interbank loans to total loans decreased following the Lehman crisis from over 35% to less than 25% (Chart 28). Cross-border loans to households as share of total loans to households are negligible and remain at around 1%. Also, cross-border loans to non-financial corporations, which account for around 7.5% of all loans to non-financial corporations, have been stable. However, the growth of loans to non-financial corporations decreased further in 2013 in both distressed and non-distressed countries (Chart 29 in the Statistical Annex).
Further distinguishing claims26 of banks in distressed and non-distressed countries shows (Chart 29) that claims to all sectors in non-distressed countries contracted only to a limited extent, whereas claims to all sectors in distressed countries fell sharply in the same period. However, this negative development came to a halt in 2012 and has recovered slightly
26 See BIS on consolidated banking statistics (http://www.bis.org/statistics/bankstatsguide.pdf).
Chart 28 share of cross-border loans for different sectors in the euro area
(monthly; percentage)
0
5
10
15
20
25
30
35
40
0
5
10
15
20
25
30
35
40
2003 2005 2007 2009 2011 2013
MFIs (excluding ESCB)householdsnon-financial corporations
Source: ECB (BSI).Notes: Cross-border loans include loans to other euro area Member States for all maturities and currencies.
Chart 29 Claims of euro area banks on different sectors
(December 2009 = 100; quarterly)
public sectorbanking sectornon-bank private sector
Non-distressed countries Distressed countries
0
20
40
60
80
100
120
140
160
0
20
40
60
80
100
120
140
160
2010 2011 2012 20130
20
40
60
80
100
120
0
20
40
60
80
100
120
2010 2011 2012 2013
Source: BIS (CBS).Notes: Composition of country groups: distressed countries = ES, IE, IT, PT; non-distressed countries = AT, BE, DE, FI, FR, NL. Data are not available for domestic claims of the respective countries. Claims are averages within country groups.

33ECB
Financial integration in EuropeApril 2014 33
I Recent developments
In f InancIal IntegRatIon In the euRo aRea
33
since then. These two charts show that the geographic origin of the counterparty, although within the same currency area, has become increasingly important.
Turning to the liability side of banks, the primary source of funding for banks in Europe is deposits, representing over 50% of their liabilities. Since 2002, domestic deposits by non-MFIs increased more in distressed countries than in non-distressed countries (Chart 30). Deposits of non-MFIs in both country groups to MFIs in other euro area countries show a similar trend, although the fluctuation is higher due to much lower volumes (cross-border deposits account for only 3% of total non-MFI deposits in distressed countries, and 7% for non-distressed countries in January 2014).
Looking at deposits of MFIs to MFIs (Chart 31), the increase of domestic deposits was much higher in distressed countries than in non-distressed countries, in particular in crises periods (i.e. Lehman crisis; sovereign debt crisis). Furthermore, cross-border deposits of MFIs in both country groups increased more than domestic deposits of MFIs before the Lehman crisis, which can be interpreted as a positive sign of more integration. However, with the Lehman crisis in 2008, this development came to an end in non-distressed countries, but not for MFIs in distressed countries. One reason for this development might be that MFIs in non-distressed countries were more vulnerable to exposures linked to the Lehman collapse than MFIs in distressed countries. The share of cross-border MFI deposits to all MFI deposits is now similar for all euro area countries (January 2014: distressed countries: 25%; non-distressed countries: 21%), but only at relatively low levels (as in 2004 respectively 2005).
Overall, the development of national retrenchment of assets and liabilities might be due to a number of reasons: less confidence in foreign banking markets in the course of the financial crisis; revised bank business strategies; deleveraging; changes in risk appetites; higher funding costs; or the difficult macro environment. Moreover, political and regulatory incentives to focus on the domestic
Chart 30 Deposits of non-MFIs
(Jan. 2002 = 100; monthly)
80100120140160180200220240260280300320340360380400420
400420
80100120140160180200220240260280300320340360380
2002 2004 2006 2008 2010 2012
distressed countries – domestic counterpart
non-distressed countries – domestic counterpart
distressed countries – counterpart: other euro areaMember States
non-distressed countries – counterpart: other euro area Member States
Sources: ECB (BSI).
Chart 31 Deposits of MFIs
(Jan. 2002 = 100; monthly)
80100120140160180200220240260280300320340360380400420
80100120140160180200220240260280300320340360380400420
2002 2004 2006 2008 2010 2012
distressed countries – domestic counterpart
non-distressed countries – domestic counterpart
distressed countries – counterpart: other euro area Member States
non-distressed countries – counterpart: other euro areaMember States
Sources: ECB (BSI).

34ECBFinancial integration in EuropeApril 20143434
core business27 or even the ring-fencing of local bank capital and liquidity28 might also explain this development. It is expected that the European Banking Union will restore confidence in the euro area banking system, which will help to increase cross-border activities and thus financial integration.
Also the provision of payment services is an integral part of banking business. The provision of retail payment services proved to be a resilient activity during the financial crisis, providing reliable and regular revenues to banks. The integration of the previously highly fragmented European retail payments market allows for efficiency gains and supports a well-functioning single market, with positive effects on the real economy and society at large. Greater European integration reduces the cost of multi-country operations for both payment service providers and users, and encourages competition across national borders.
An example of integration taking place in relation to euro payment services is the migration from national to common retail payment instruments that enable citizens, corporates and public administrations to make payments in Europe under the same conditions and with the same service levels, irrespective of their country of residence. In the context of the Single Euro Payments Area (SEPA) project, national credit transfers and direct debits in the euro area should be replaced with their SEPA-compliant alternatives as from 1 February 2014 (see Chapter III, Section 1). In early February 2014 the EU legislators decided to introduce an additional grace period of 6 months until 1 August 2014 for those stakeholders who faced serious challenges in their preparations for SEPA-migration. Non-euro area EU countries will follow suit by 31 October 2016 at the latest.
The positive effects of the SEPA migration have only just started to materialise. For example, multi-country corporates no longer need a payment service provider in each of the countries in which they are active, but have started to consolidate their handling of payment flows in euro and related treasury services, hence reducing operational complexity and increasing competition in corporate banking.
The migration in the euro area was characterised by a “big bang” style, as shown by Chart 32, especially in some countries and especially concerning direct debits. The chart shows the share of euro area SCT and SDD transactions as a percentage of the total volume of all credit transfers and direct debits processed by clearing and settlement mechanisms located in the euro area.
As part of the integration process, some clearing and settlement mechanisms for retail payments have taken steps to become pan-European
27 Zimmer, D., M. Blaschczok (2012), “European Commission’s control of State aid to banks: Competition protection or market design?”, Working Paper, University of Bonn.
28 Joint Committee (August 2013), Report on risks and vulnerabilities in the EU financial system.
Chart 32 Credit transfer and direct debit transactions processed in sEPA format in the euro area(percentages of total transactions)
0
10
20
30
40
50
60
70
80
90
100
0
10
20
30
40
50
60
70
80
90
100
2008 1) 2009 2010 2011 2012 2013 2014
credit transfer transactions processed in SEPA format (percentage of total credit transfer transactions) direct debit transactions processed in SEPA format (percentage of total direct debit transactions)
Feb. Oct. June Feb. Oct. June Feb. Feb.Oct. June
Source: ECB.1) 28 Jan. 2008 – 29 Feb. 2008

35ECB
Financial integration in EuropeApril 2014 35
I Recent developments
In f InancIal IntegRatIon In the euRo aRea
35
service providers by expanding their service offering to non-domestic participants and/or by enlarging reachability for their participants by entering into interoperability agreements with other clearing and settlement mechanisms. It is expected that the links established under these interoperability agreements will be further deployed after full SEPA migration.


37ECB
Financial integration in EuropeApril 2014
EUROPEAN INsTITUTIONAL REFORM
THE sINGLE REsOLUTION MECHANIsM: THE sECOND PILLAR OF BANKING UNION
On 15 October 2013 the Council of the European Union adopted the Regulation on the Single Supervisory Mechanism (SSM). This is the start of a new era for the supervision of banks in the euro area and in other Member States that may wish to join Banking Union. Political agreement on the second pillar of Banking Union – the Single Resolution Mechanism (SRM) and the Single Resolution Fund – was reached on 20 March 2014. The SSM, which is based on a common set of rules stipulated in the Capital Requirements Regulation and the Capital Requirements Directive (CRR/CRD IV or so-called single rule book), and the SRM will be complemented by harmonised underlying legal frameworks for both national deposit guarantee schemes and the recovery and resolution of banks at the level of all EU Member States.
1 INTRODUCTION
The financial crisis revealed the need for a more integrated regulatory and supervisory framework for banks in Europe. A major reform agenda is now underway to address this need. This chapter outlines some of the measures which have been agreed to strengthen the architecture of Economic and Monetary Union and contribute to establishing an integrated financial framework.1
The first section of this chapter reviews how the SSM will contribute to fostering financial integration, and provides an update on the ECB’s preparations to undertake its new responsibilities.2 The second section looks at the agreement of 20 March 2014 on the SRM, reached between the European Parliament and the Council. In addition, it outlines the rationale for the establishment of a SRM, and provides an overview of its central components. Adoption of the Regulation is expected to take place in April 2014, with many aspects applying as early as 1 January 2015. Full entry into force of the Regulation will take place as of 1 January 2016.
The legislative process on common legal frameworks for both the recovery and resolution of banks and deposit guarantee schemes in all EU Member States are close to being completed with formal adoption of the agreements on 15 April 2014. These two initiatives are briefly addressed in the third section. The fourth section concludes with an outlook on the challenges that lie ahead.
2 THE FIRsT sTEP: THE sINGLE sUPERVIsORy MECHANIsM
2.1 ROLE OF THE ssM
The SSM Regulation has its roots in the euro area summit of 29 June 2012, which called on the European Commission to present proposals for setting up a SSM as a precondition for possible direct recapitalisation of banks by the European Stability Mechanism (ESM). Following intensive trialogue negotiations during January and February 2013, co-legislators reached agreement on the legislative package on 19 March 2013.
1 http://www.consilium.europa.eu/uedocs/cms_data/docs/pressdata/en/ec/134320.pdf2 The SSM encompasses all Member States of the euro area and all EU non-euro area Member States which enter into a close cooperation
agreement with the ECB.
CHAPTER I I

38ECBFinancial integration in EuropeApril 20143838
The European Council formally adopted the Regulation on 15 October 2013, which entered into force on 3 November 2013.3 The supervisory powers of the ECB will become fully effective and operational one year after the entry into force of the Regulation on 4 November 2014. New rules adapting the operating rules of the European Banking Authority (EBA) to this new framework will enter into force in parallel.
The establishment of the SSM is expected to provide significant benefits to financial stability and contribute to fostering financial integration within the European Union. A strong and independent supranational supervisor will contribute to ensuring the smooth functioning of EMU and restoring confidence in the banking sector. This is key to countervailing the financial fragmentation that was observed during the crisis. Euro area countries will automatically participate in the SSM. Non-euro area Member States can choose to participate in the SSM if their governments decide to enter into “close cooperation” with the ECB.
Three features of the SSM will be especially relevant in overcoming past deficiencies. First, the single supervisor will apply a single approach to supervision by harmonising practices and methodologies, which will increase comparability across borders and reduce compliance costs for banks. Under the SSM, every bank will be supervised according to a single supervisory model and use the same data reporting template. These approaches will ensure high quality supervisory standards and a harmonised and consistent implementation of prudential regulation. Second, single supervision under the aegis of the ECB will credibly address long-standing home-host coordination problems. Such arrangements regarding the consolidated supervision of cross-border banking groups operating in the euro area become superfluous under the SSM, while they will simplify the interplay among supervisors for cross-border groups extending beyond the SSM. Third, owing to the supranational structure of decision-making, the predominance of “national bias” should be diminished.
THE ECB’s PREPARATORy WORK
In taking up this new supervisory task, the ECB has worked intensively together with the national authorities responsible for supervision in the following key areas.
The first key area involved mapping the euro area banking system, in the form of a catalogue comprising all supervised entities falling within the scope of the SSM, with details of the internal structure and composition of all euro area banking groups. The data collected served as a basis for the ECB’s selection of the institutions that would be subject to the SSM comprehensive assessment. The data are also being used in the classification of supervised entities as potentially significant or less significant banks prior to the start of SSM operations.
The second key area focused on the development of a draft Framework Regulation that will govern the practical arrangements for implementing Article 6 of the SSM Regulation, in particular the methodology for assessing the significance of credit institutions. The draft Framework Regulation also defines the procedures for cooperation between the ECB and the NCAs within the SSM. The Framework Regulation was opened for public consultation in early 20144 and will be published on 4 May 2014.
3 The European Parliament was consulted on the SSM Regulation and adopted it in on 16 September 2013.4 https://www.ecb.europa.eu/ssm/consultations/html/framework.en.html

39ECB
Financial integration in EuropeApril 2014 39
I I EuropEan Inst ItutIonal
rEform
39
Third, the supervisory model of the SSM was developed, including all processes, procedures and the methodology for banking supervision, to ensure harmonised and high quality supervision for all credit institutions covered by the SSM. This work also focused on the cooperation between the ECB and the NCAs within the SSM through the definition of processes and procedures for supervision. A key concept which has been developed in the Supervisory Manual is that of Joint Supervisory Teams (JSTs), which will be responsible for the day-to-day supervision of significant institutions. These teams will operate under the management of a JST Coordinator working for the ECB.
Fourth, a single supervisory reporting template was created based on existing financial reporting (FINREP) and common reporting (COREP) templates. It will provide a unique data set to be applied by all banks in SSM-participating countries. Particular focus was placed on the different accounting rules applicable in the various euro area jurisdictions.
Fifth, before assuming its new supervisory responsibilities, the ECB is conducting a comprehensive assessment of the banks that it will supervise directly. The exercise covers 128 banks, or roughly 85% of euro area bank assets, and comprises three different components, namely a risk assessment, an asset quality review and a stress test. A dedicated Communication on the comprehensive assessment was issued on 23 October 2013,5 which laid out key information on the three components, scope and timeline. On 3 February 2014 the ECB confirmed the stress test parameters for the comprehensive assessment.6
Overall, the main challenge for the ECB is to design – in a very limited span of time – a solid framework, underpinning an effective and efficient supervisory activity for the years to come. Given the good progress that has been made so far in the preparatory work, the ECB is on schedule to take up its new tasks in November 2014.
3 A NECEssARy sECOND sTEP: THE sINGLE REsOLUTION MECHANIsM
3.1 THE BENEFITs OF THE sRM
Banking Union also requires appropriate powers and tools to promptly address non-viable banks when necessary. That is why the new supervisory framework needs to be complemented by a robust and integrated European resolution framework, i.e. a Single Resolution Mechanism (SRM) for all Member States participating in the SSM.
National authorities often lacked the tools to deal effectively with bank failures during the crisis. In addition, the voluntary cooperation between national resolution authorities that existed in this period was not appropriate to efficiently coordinate and take decisions on cross-border bank failures. This inadequate framework for bank resolution increased the costs of bank resolution. Between 1 October 2008 and 1 October 2013 the European Commission took more than 400 decisions authorising State aid measures to the financial sector, with over €4.5 trillion of taxpayers’ money authorised by the Commission as State support, of which €1.6 trillion has been used to save banks in the EU.7 The absence of a common European mechanism for bank resolution further intensified the destabilising link between banks and their sovereigns. 5 https://www.ecb.europa.eu/pub/pdf/other/notecomprehensiveassessment201310en.pdf 6 http://www.ecb.europa.eu/press/pr/date/2014/html/pr140203.en.html 7 See the Communication from the European Commission on Banking Union: http://eur-lex.europa.eu/ LexUriServ/LexUriServ.do?uri=
COM:2012:0510:FIN:EN:PDF; and the European Commission State Aid Scoreboard 2013: http://ec.europa.eu/competition/state_aid/scoreboard/financial_economic_crisis_aid_en.html

40ECBFinancial integration in EuropeApril 20144040
A robust SRM is therefore necessary to address these shortcomings. Together, both the SSM and SRM should contribute to breaking the nexus between banks and sovereigns. As outlined in the previous section, the SSM will provide coherent and unbiased supervision that will help ensure a high degree of stability and transparency across the financial system. However, bank failures can never be ruled out completely. Therefore a robust SRM will support and complement supervision, and constrain cross-border externalities.
With both the SSM and SRM fully in place, the level of responsibility for supervision and resolution should become aligned in Banking Union. This will, in turn, ensure that incentives are aligned, avoiding potential distortions and conflicts of interest. The SSM coupled with a robust SRM will be able to better deal with failing cross-border banks, since all necessary supervisory information and a common toolkit will be available to centralised decision-makers. Furthermore, a single resolution authority will be better placed to take due account of contagion and spill-overs when making resolution decisions.
Overcoming the institutional fragmentation of national resolution authorities as well as of underlying legal frameworks should help restore financial integration across the euro area and limit re-fragmentation in future crises. When a more harmonised and integrated financial framework with common rules and procedures across participating countries is established, it can be expected that the market for bank debt will begin to open up across the Banking Union. At the height of the financial turmoil, indicators pointed to significant fragmentation of euro area banks’ secured and unsecured funding markets based on their geographic origin. As a result, banks located in peripheral countries continued to lose market funding, while those in some other countries gained it and managed to issue bank debt at attractive yield levels. This heterogeneity was, in part, due to both sovereign risk and different creditor expectations regarding the consequences of an insolvency or resolution scenarios. Under Banking Union, buyers of bank debt will have a more homogenous set of expectations regarding how their claims will be treated in a potential resolution scenario, no matter in which Member State the bank is located.
Finally, the Bank Recovery and Resolution Directive (BRRD), as supplemented by the SRM for the Member States participating in the SSM, establishes procedures that will minimise the involvement of taxpayers’ money. The BRRD and the SRM Regulation provide for a clear hierarchy of claims in resolution financing (also see Box 1). Shareholders and other capital holders will be the first to absorb losses, followed by creditors, in accordance to the hierarchy of their claims in insolvency.8 If this loss-absorption is insufficient, resolution financing arrangements may provide resolution funding up to the amount of 5% of total liabilities, including own funds. A condition is, however, that at least 8% of total liabilities, including own funds, have previously been bailed in. Further support can only be provided under the condition that all unsecured, non-preferred liabilities, other than eligible deposits, have been written down or converted in full.
8 In this context, the BRRD determines that covered deposits have a higher ranking ahead of any other unsecured claim. This “super priority” will be subrogated to the Deposit Guarantee Scheme, which covers the losses that would otherwise have been borne by covered depositors. Therefore, although covered deposits are fully excluded from bail-in, the DGS will contribute to resolution if the bail-in tool would need to be applied so high in the creditor ranking. Deposits which exceed the coverage level, but are generally eligible for deposit protection, will have also have preference, but would rank below the covered deposits. Provided that they are deposits from natural persons and micro, small and medium-sized enterprises, thus only absorbing losses after subordinated and unsecured, non-preferred creditors have done so.

41ECB
Financial integration in EuropeApril 2014 41
I I EuropEan Inst ItutIonal
rEform
41
3.2 MAIN FEATUREs OF THE sRM9
The ECB welcomes the political agreement reached on the SRM on 20 March 2014. The agreement contains three essential elements for effective resolution, namely: (a) a single system; (b) a single authority; and (c) a single fund.
sCOPE AND TAsKs
The SRM follows an integrated approach, whereby all banks of all EU Member States that participate in the SSM fall under the SRM.10 Any Member State outside the euro area that opts to join the SSM will automatically also fall under the SRM.
The powers of the SRM will cover all resolution tasks, for example: assessing the resolvability of banks, drawing up resolution plans, deciding on resolution schemes for failing banks and deciding whether to make use of the Single Resolution Fund (SRF) in such cases. The tasks are shared between the Single Resolution Board (SRB) at the European level, which is directly responsible for all banks under direct ECB supervision and all cross-border banks, and national resolution authorities, which are responsible for the other banks as well as the implementation of all resolution actions. National resolution authorities should also assist the SRB in resolution planning and in the preparation of resolution decisions for the banks under direct SRB responsibility.
The SRB may, at any time, decide to exercise directly all the relevant powers under the SRM Regulation with regard to any of the indirectly supervised banks. In addition, the SRB will be directly involved whenever resolution of indirectly supervised banks implies use of the SRF. The agreement reached on the SRM Regulation also gives Member States the option to voluntarily decide to make the SRB responsible for all banks established in their territory.
THE ssM AND sRM
The ECB has stressed the importance of distinct and separate roles and responsibilities for supervisory authorities and resolution authorities. This, however, does neither preclude nor obviate close and effective cooperation between the authorities, both before a bank is put in resolution and in the resolution phase. In its new role as supervisor, the ECB will closely cooperate with the SRB as stipulated in the SSM Regulation and the forthcoming SRM Regulation.
First, whereas the supervisor has the sole responsibility with regard to early intervention measures, it is very important that the supervisor and resolution authority communicate closely, inter alia, by ensuring that the recovery and resolution plans, and resulting actions thereof, are compatible with each other.
Second, regular reporting and on-site inspections will primarily be submitted to and conducted by the supervisor. However, it will be important to share necessary information with the resolution authority to ensure an open communication between the two authorities, and thereby avoid unwarranted and uncoordinated investigatory activities in a way which would negatively impact market confidence and financial stability.
9 The regulation will undergo technical finalisation before adoption. The following is the ECB’s understanding of the main elements of the political agreement on the SRM/SRF reached on 20 March2014.
10 The SRM would apply to credit institutions established in participating Member States, parent undertakings established in one of the participating Member States, including financial holding companies and mixed financial holding companies when subject to consolidated supervision carried out by the ECB, and investment firms and financial institutions established in participating Member States when they are covered by the consolidated supervision of the parent undertaking carried out by the ECB.
42ECBFinancial integration in EuropeApril 20144242
Third, the important tasks of: (i) drawing up resolution plans; (ii) making resolvability assessments; and (iii) determining the levels of the Minimum Requirement of Eligible Liabilities and own funds (MREL) for bail-in will be carried out by the SRB in consultation with the competent authorities, including the ECB. Enhancing the resolvability of banks, while preserving critical financial services to the economy, forms a key part of the supervisory process. This implies a strong supervisory involvement in drawing up the resolution plans in general, and it is clear that the ECB will have to work very closely with the SRB on all these issues.
Finally, the agreed Regulation assigns a major role to the ECB in deciding whether a bank is “failing or likely to fail”. The determination of this first condition for entering into resolution will be made by the ECB, after consulting the SRB. The SRB may also make this determination, but it must first inform the ECB of its intention and allow the ECB three calendar days to make its own assessment. In this context, the ECB will provide the SRB with any relevant information without delay in the aim of aligning views and ensuring that the SRB can make an informed final assessment.
THE sINGLE REsOLUTION BOARD
The SRB convenes in two different compositions: the plenary and executive sessions. The plenary session encompasses all members of the SRB, which includes a Chair, four independent full-time members, who shall act independently and objectively in the interest of European Union as a whole, two permanent observers appointed by the European Commission and the ECB, respectively, and one member appointed by each participating Member State, representing the national resolution authorities. The executive session only consists of the Chair, the four independent full-time members and the two observers of the Commission and the ECB. However, when deliberating on the resolution of a bank or group, the executive session of the SRB will also involve in the decision-making process the members appointed by the Member States which are directly concerned.
The executive session will prepare all decisions concerning resolution procedure and adopt those decisions. Owing to the institution-specific nature of the information contained in the resolution plans, decisions concerning the drawing up, assessment and approval of the resolution plans will be taken by the SRB in its executive session. Each member, including the Chair but excluding the observers, will have one vote. If the executive session is not able to reach a joint agreement by consensus within a deadline set by the Chair, the Chair and the four permanent members will take a decision by a simple majority. By reaching a decision either by consensus or by a majority decision by the Chair and the four independent full-time members, efficient decision-making in the interest of the Union as a whole should be ensured.
The plenary session will take decisions by simple majority when it discusses issues of a general nature, such as the annual work programme, the budget or the rules of procedure. Each member will have one vote, and in case of a tie, the Chair will have the casting vote. However, whenever a resolution scheme would require the use of the SRF above a threshold of €5 billion, any member of the plenary may, in accordance with a strict deadline, request the plenary session to decide instead of the executive session.11 In such cases, the decision will be taken by a simple majority of the plenary members, but also representing at least 30% of contributions to the SRF.
11 When the use of the SRF relates to liquidity support, the support should be a lower weight of only 0.5 against this threshold. Once the net accumulated use of the SRF in the last consecutive 12 months reaches the threshold of €5 billion per year, the plenary should evaluate the application of the resolution tools, including the use of the SRF, and provide guidance which the executive session should follow in subsequent resolution decisions.

43ECB
Financial integration in EuropeApril 2014 43
I I EuropEan Inst ItutIonal
rEform
43
Further, any decisions which involve the raising of ex post contributions from the banks, voluntary borrowing between financing arrangements, on alternative financing means, as well as on the mutualisation of national financing arrangements, shall be taken by the plenary session. During the transitional period until the SRF is fully mutualised, such a decision requires a majority of two-thirds of the plenary members, representing at least 50% of contributions to the SRF. In the steady state, after eight years, such a decision requires a majority of two-thirds of the plenary members, representing at least 30% of contributions to the SRF.
DECIsION-MAKING IN REsOLUTION
The procedure related to the adoption of a resolution scheme for a failing bank, which involves both the Commission and the Council, provides for the necessary operational independence of the SRB. If all the conditions for resolution are met, the SRB will adopt a resolution scheme for the institution or group in question, which is immediately thereafter transmitted to the Commission. The resolution scheme adopted by the Board enters into force only if, within a period of 24 hours after its adoption by the SRB, there are no objections from the Council or the Commission, or if it is approved by the Commission.
The Council becomes involved in the decision-making only at the explicit request of the Commission. Within 12 hours of the transmission of the resolution scheme, the Commission may propose to the Council to object to the resolution scheme. The grounds on which the Council may object to the resolution scheme are strictly limited to the existence of a public interest and to material modifications by the Commission of the amount of the use of the SRF as proposed by the SRB.12 The Council should, within 24 hours from the transmission of the resolution scheme by the SRB, either approve the scheme or object to the Commission’s proposal by a simple majority decision, without amending it. The Council or the Commissions shall provide reasons for the exercise of their power of objection. The SRB shall within eight hours modify the resolution scheme accordingly and instruct the national resolution authorities, which should take all necessary measures to implement the resolution scheme. This implies that a resolution decisions can be made over a weekend, even when a scheme is modified by the Commission/Council. If the Council objects to the placing of an institution under resolution on the ground that the public interest criteria is not fulfilled, the relevant entity shall be wound up in an orderly fashion in accordance with the applicable national law.
THE sINGLE REsOLUTION FUND
Another important element of the SRM will be the Single Resolution Fund (SRF). An objective of Banking Union is to break the link between sovereigns and the banking sector and the establishment of the SRF will facilitate this. Furthermore, a consistent approach towards resolution financing should help avoid the distortion of competition in the internal market as a result of divergent national practices and fiscal abilities.
The SRF will be financed by bank contributions raised at national level and will be pooled at Union level in accordance with an intergovernmental agreement on the transfer and progressive mutualisation of those contributions into a single fund. According to the political agreement reached, the target level for the SRF will be 1% of covered deposits of all SSM banks, to be reached in eight years.
12 A modification in the amount of the SRF of 5% or more compared with the original proposal of the SRF is considered material.

44ECBFinancial integration in EuropeApril 20144444
During a transitional period of eight years, the contributions collected at national level will be allocated to different (national) compartments corresponding to each participating Member State. The national compartments will be subject to progressive mutualisation and will cease to exist at the end of the transitional period. Meanwhile, when there is a need to draw on the SRF in the transition period, national compartments of the affected Member States will be used first, up to a predefined limit set for each year in the transition period. This limit will decrease during the transition period, starting at 100% in the first year, the limit will be 60% and 40% for the second and third year, respectively, and thereafter decrease by 6.67% annually for the subsequent years.13 As a second step, only if the first step was insufficient, all compartments will contribute up to predefined limit, also set for each year in the transition period. The pace of mutualisation is substantially frontloaded, starting at 40% in the first year, 60% in the second year and thereafter will increase by 6,67% annually until it reaches 100%.14 As a third step, if the previous steps were insufficient, the remaining resources in the national compartments of the affected Member States will be used. If these three steps are still insufficient, ex post contributions from the institutions in the affected Member States will be used. If these are not immediately accessible, including for reasons relating to financial stability, the SRB may exercise its power to contract for the SRF borrowings or other forms of support or to make temporary transfers between compartments.
There is a clear commitment in the Regulation that the SRB, in cooperation with the Member States, will take the necessary steps to develop appropriate methods and modalities to enhance the borrowing capacity of the SRF – including, where possible, public financial arrangements – immediately after the entry into force of the Regulation. This borrowing capacity should be in place by the date on which the Regulation, becomes fully applicable, i.e. 1 January 2016 at the latest, subject to ratification of the intergovernmental agreement by sufficient number of Member States. Thus it is expected that the political agreement will be followed by concrete and meaningful steps in this area in the very near future.
4 PROGREss ON THE BANK RECOVERy AND REsOLUTION DIRECTIVE AND THE DEPOsIT GUARANTEE sCHEMEs DIRECTIVE
The BRRD provides a harmonised resolution framework for implementation by the Member States in their national laws. Another legislative act also important for Banking Union, and more specifically for the SRM, is the recast Directive on Deposit Guarantee Schemes (DGSD). Both directives are addressed at all EU Member States, but will particularly help to strengthen the governance of Economic and Monetary Union.
4.1 BANK RECOVERy AND REsOLUTION
In June 2012 the European Commission adopted a legislative proposal that intends to set a single EU-wide framework for the recovery and resolution of banks. On 12 December 2013 at the trialogue negotiations between the European Parliament, European Commission and EU Member States on the BRRD, an agreement was reached. The framework equips authorities with the tools for the prevention of banking crises, early intervention and the resolution of banks if they are failing or likely to fail. In resolution, the key objectives are to manage bank failures within and across Member States while keeping critical bank functions operational, protecting public finances, safeguarding financial stability and involving shareholders and debtors appropriately. 13 The decrease per year will be spread evenly per quarter.14 The increase per year will be spread evenly per quarter.

45ECB
Financial integration in EuropeApril 2014 45
I I EuropEan Inst ItutIonal
rEform
45
The political agreement brought forward the implementation of the bail-in tool from the initial plan of 2018 to 1 January 2016, at the latest. It also confirmed the establishment of the depositor preference principle across the European Union. Insured depositors (those with less than €100,000 in the bank) are exempted from the risk of losses in bank failures. Uninsured depositors would be affected last, if needed, amongst the class of unsecured creditors in resolution.
Box 1
THE REsOLUTION TOOLs IN THE BRRD
When the trigger conditions for resolution are satisfied, resolution authorities will have the power to apply the following resolution tools.
• Sale of (part of) the business: the sale of business tool enables resolution authorities to effect a sale of the institution or the whole or part of its business on commercial terms, without requiring the consent of the shareholders or complying with procedural requirements that would otherwise apply. As far as possible in the circumstances, the resolution authorities should market the institution or the parts of its business that are to be sold.
• Establishment of a bridge institution: the bridge institution tool enables resolution authorities to transfer instruments, assets, rights and liabilities to a publicly controlled, new “bridge entity”. This can ensure the continuity of critical functions and avoid significant adverse effects on financial stability until a sale of business can be conducted. The resolution authority has to ensure that the total value of liabilities transferred does not exceed the total value of rights and assets transferred or provided by other sources. The bridge institution must be licensed in accordance with the Capital Requirements Directive and will operate as a commercial concern within any limits prescribed by the State aid framework. The operations of a bridge institution are temporary, the aim being to sell the bridge institution or its business to the private sector when market conditions are appropriate.
• Asset separation: the purpose of the asset separation tool is to enable resolution authorities to transfer impaired or problem assets to an asset management vehicle in order to allow them to be managed and worked out over time. In order to minimise competitive distortions and risks of moral hazard, this tool should only be used in conjunction with another resolution tool.
• Bail-in: the bail-in tool will enable resolution authorities to write down or convert into equity the claims of a broad scope of creditors. Under the agreed BRRD, the order by which creditors within the scope of the bail-in tool would be affected is the following: subordinated liabilities, unsecured and non-preferred liabilities, eligible deposits from natural persons and micro, small and medium-sized enterprises, and finally, the deposit guarantee scheme (DGS). The DGS would step in and make the contribution for covered deposits (i.e. eligible deposits up to €100,000) if needed, given that covered deposits are excluded from bail-in. Besides covered deposits, in particular secured liabilities, certain liabilities in relation to client assets, client money or fiduciary relationship, certain liabilities to other institutions or to systems/operators of systems pursuant to Directive 9/26/EU or their participants with a maturity of less than seven days and certain employee-related liabilities are excluded from the scope

46ECBFinancial integration in EuropeApril 20144646
4.2 DEPOsIT GUARANTEE sCHEMEs
In July 2010 the European Commission adopted a legislative proposal that aims to revise the regulation of national Deposit Guarantee Schemes (DGSs). Owing to the interactions with the proposed Bank Recovery and Resolution Framework, the negotiations between the Council and the European Parliament were paused in summer 2011.
Political agreement was reached on the DGSD on 17 December 2013. The DGSD will enter into force once it has been signed by both the Parliament and the Council and published in the Official Journal, which is expected to take place some weeks after formal adoption at the European Parliament’s April plenary session. Member States will have one year after entry into force to transpose it into national law.
The DGSD ensures that deposits in all Member States will continue to be guaranteed up to €100,000 per depositor and bank. The DGSD will also ensure faster pay-outs with specific repayment deadlines, which would be gradually reduced from 20 to 7 working days. It will also ensure strengthened financing of the DGS, notably by requiring a significant level of ex-ante funding (0.8% of covered deposits) to be met in ten years. A maximum of 30% of the funding could be made up of payment commitments. In case of insufficient ex ante funds, the DGS would collect immediate ex post contributions from the banking sector, and, as a last resort, the DGS would have access to alternative funding arrangements, such as loans from public or private third parties.
of bail-in. However, in exceptional circumstances, certain liabilities may be excluded or partially excluded if: (i) it is not possible to bail them in within a reasonable time, (ii) it is strictly necessary and proportionate to achieve the continuity of critical functions and core business lines, (iii) is strictly necessary and proportionate to avoid giving rise to widespread contagion, or (iv) if bailing them in would cause a destruction of value such as the losses borne by other creditors would be higher than if these liabilities are excluded from the bail-in. In order to avoid this flexibility from being used to shield creditors from losses, the resolution fund cannot be used to cover for excluded liabilities until an amount of at least 8% of the total liabilities, including own funds, of a bank have been bailed in. The Commission has the right to object or require amendments if the requirements for such exemptions are not met, provided that the exemption would require a contribution by the Fund or an alternative financing source.
In order to apply those tools, resolution authorities will have the necessary powers, such as to take control of an institution that is failing or likely to fail; take over the role of shareholders and managers; transfer rights, assets and liabilities; and amend, alter, close out and terminate (financial) contracts.
Government stabilisation tools1 also exist, to be applied as a last resort by Member State governments. These consist of a public equity support tool and a temporary public ownership tool, which shall be used only when the resolution authority has assessed and exploited the other resolution tools to the maximum extent practicable whilst maintaining financial stability, as determined by the competent ministry or the government after consulting the resolution authority. 1 Notably, these government stabilisation tools do not exist in the SRM Regulation.

47ECB
Financial integration in EuropeApril 2014 47
I I EuropEan Inst ItutIonal
rEform
47
There would also be a voluntary mechanism of mutual borrowing between DGSs from different EU countries.
Finally, with the transposition of the BRRD into national legislation this year, harmonised depositor preference will be introduced in the EU as of 1 January 2015. Covered depositors will be preferred over all other unsecured creditors, thereby protecting the DGS as is subrogates this preferred ranking in insolvency and resolution.
5 CHALLENGEs AHEAD – EsTABLIsHING THE sRM
The ECB welcomes the political agreement reached on the SRM on 20 March 2014. The negotiations between the European Parliament and the European Council have produced a framework that could provide for an SRM that is efficient and credible. It is a great progress for Banking Union that two pillars – SSM and SRM – are now coming into place. Nevertheless, there are some challenges ahead when establishing the SRM.
The prompt setting-up of the SRM will be a key priority this year. It should be established in less than a year, as the Regulation will enter into force this year and many of the articles in the Regulation will apply as of 1 January 2015. The setting up of a functioning SRM in such a short time will be confronted with implementation challenges, involving – among other things – the appointment of a Chair and another four full-time members to the Single Resolution Board. Another challenge will be to develop the appropriate methods and modalities to enhance the borrowing capacity of the SRF. These should be developed for the SRF immediately after the entry into force of the Regulation (1 January 2015), and be in place by the date of (full) application of the Regulation (1 January 2016 at the latest). Given that the Regulation clarifies that the SRB and the Member States should do this, a commitment has been made which requires concrete and meaningful steps to be taken in the very near future. In the context of the resolution fund, it will also be necessary to rather urgently determine the modalities for the contributions from the banks to the SRF, which should be risk-based.
Once in place, the SRB will immediately be responsible for conducting resolvability assessments and adopting resolution plans for all directly supervised and cross-border banks, being able to draw on preparatory work and input from national resolution authorities. It will also exercise oversight of the resolution plans drawn up by the national resolution authorities for all other banks, including their assessment of the resolvability of the institutions concerned. This will no doubt be a challenging task in the years to come. However, the SSM will collaborate closely with the SRB in contributing to the development of credible resolution plans.


49ECB
Financial integration in EuropeApril 2014
CHAPTER I I IEUROsysTEM ACTIVITIEs FOR FINANCIAL INTEGRATION
The Eurosystem distinguishes between four types of activity through which it contributes to the enhancement of financial integration: (i) advising on the legislative and regulatory framework for the financial system and direct rule-making; (ii) acting as a catalyst for private sector activities by facilitating collective action; (iii) enhancing knowledge, raising awareness and monitoring the state of European financial integration; and (iv) providing central bank services that also foster European financial integration. The following sections provide an overview of the Eurosystem’s contributions in these areas, focusing on the initiatives pursued during 2013.
1 THE LEGIsLATIVE AND REGULATORy FRAMEWORK FOR THE FINANCIAL sysTEM
While the Eurosystem considers financial integration to be first and foremost a market-driven process, the legislative and regulatory framework for the financial system clearly plays an important facilitating role. An EU harmonised legislative and regulatory framework removes national barriers to financial integration, supports cross-border access and competition, and fosters cross-border financial transactions.
Against this background and in line with their advisory and regulatory functions,1 the ECB and the Eurosystem monitor and actively contribute to the development of the EU legislative and regulatory framework.
More specifically, the ECB and the Eurosystem provide input for strategic policy deliberations, such as on the overall EU financial services policy or on the further development of the EU framework for financial regulation and supervision. Examples of such input are the publication of Eurosystem position papers on the websites of the ECB and NCBs, and informal discussions with the regulatory and supervisory committees. Furthermore, the ECB and the Eurosystem provide both formal opinions and informal input for EU and national legislation in the area of financial services. The ECB may also contribute to ex post evaluation of regulatory measures.
EU LEGAL FRAMEWORK FOR RETAIL PAyMENTs
Especially since the introduction of the euro, a series of EU legal acts have helped frame the European retail payments market. Among others, the so-called Payment Services Directive (PSD)2 entered into force in 2007, providing a harmonised legal basis for the Single Euro Payments Area (SEPA).
Since then, the invention of new business models, advances in technology and the emergence of new market actors have impacted the way payments are made, calling for a review of the PSD. In line with its Green Paper of January 2012, “Towards an integrated European market for card, internet and mobile payments”3, on 24 July 2013 the European Commission adopted a legislative 1 According to the Treaty and the Protocol on the Statute of the European System of Central Banks and of the European Central Bank, the
ECB must be consulted, within its field of competence, on any proposed Union act or any draft legislative provision proposed by national authorities. Such proposed Union acts include implementing and delegated acts adopted by the Commission on the basis of Articles 290 and 291 of the Treaty, and also in the case where they endorse technical standards developed by the European Supervisory Authorities in accordance with the relevant Union legislation. Furthermore, the ECB has the right to issue regulations in certain areas, for example in the field of payment systems and statistics.
2 Directive 2007/64/EC of the European Parliament and of the Council of 13 November 2007 on payment services in the internal market, amending Directives 97/7/EC, 2002/65/EC, 2005/60/EC and 2006/48/EC and repealing Directive 97/5/EC, OJ L 319, 5.12.2007, p. 1-36.
3 To which the Eurosystem responded in March 2012.

50ECBFinancial integration in EuropeApril 20145050
package comprising the proposals for the PSD2 and for a Regulation on the interchange fees for card-based payment transactions. The ECB opinions on the two legal acts were published in February 2014.4,5 The legislative package followed shortly after the publication, on 8 May 2013, of a proposal for a Directive on the transparency and comparability of payment account fees, payment account switching and access to a basic payment account. Consulted in September 2013 on this legislative proposal, the ECB released its opinion in November 2013.6
The forthcoming legal acts aim to foster financial inclusion and achieve a more integrated, innovative and competitive European retail payments market.
In particular, innovative payment solutions are expected to leverage the SEPA-compliant credit transfers and direct debits that are replacing pre-existing national equivalents according to the SEPA migration end-date Regulation.7 The regulation set a 1 February 2014 deadline for the migration to SEPA of euro-denominated payments in euro area countries.8 However, despite an acceleration, the European Commission considered the migration unlikely to be fully completed by 1 February 2014. Therefore, on 9 January the European Commission published a proposal for an EU regulation allowing payment services providers to continue accepting payments in the national formats for an additional transitional period of six months. Although not challenging the Commission’s proposal, in a press release of 9 January the ECB urged all market participants to complete the transition to the SEPA standards by the original deadline. The ECB opinion on the legal proposal was issued on 22 January 2014.9 The regulation was approved by the European Parliament and the Council in February 2014.
REVIEW OF THE REGULATORy FRAMEWORK FOR PAyMENT sTATIsTICs
The collection of European statistics on payments and payments systems has long been based on Guideline ECB/2007/9 of 1 August 2007 on monetary, financial institutions and markets statistics.10 The Guideline is binding for National Central Banks, but not for reporting agents, which might result in suboptimal consistency and harmonisation across countries. To increase the quality and reliability of the data, the ECB prepared a Regulation11 that is binding for reporting agents as well, and revised the Guideline to complement the Regulation, especially in terms of its application by the NCBs. Moreover, the new regulatory framework takes account of the changes brought about by the implementation of the Single Euro Payments Area (SEPA), including the relevant European legislation in the field. This results for instance in new indicators or amended methodology, more accurate geographical breakdowns at the counterparty level, changes needed to extend reporting to new entrants on the payments market and innovations. The new legal framework will take effect from data referring to the second half of 2014.
4 Opinion of the European Central Bank of 5 February 2014 on a proposal for a directive of the European Parliament and of the Council on payment services in the internal market (CON/2014/9).
5 Opinion of the European Central Bank of 5 February 2014 on a proposal for a regulation of the European Parliament and of the Council on interchange fees for card-based payment transactions (CON/2014/10).
6 Opinion of the European Central Bank of 19 November 2013 on a proposal for a directive of the European Parliament and of the Council on the comparability of fees related to payment accounts, payment account switching and access to payment accounts with basic features (CON/2013/77).
7 Regulation (EU) No 260/2012 of the European Parliament and of the Council of 14 March 2012 establishing technical and business requirements for credit transfers and direct debits in euro and amending Regulation (EC) No 924/2009, OJ L 92, 30.03.2012, pp. 22-37.
8 Non-euro area EU countries will follow suit after the deadline of 31 October 2016.9 Opinion of the European Central Bank of 22 January 2014 on a proposal for a regulation on the postponement of SEPA migration date
(CON/2014/3).10 OJ L 341, 27.12.2007, p. 1.11 Regulation (EU) No 1409/2013 of the European Central Bank of 28 November 2013 on payments statistics (ECB/2013/43), in OJ L
352, 24.12.2013, pp. 18-44. NCBs of Member States whose currency is not the euro should apply the new legal framework, based on a Recommendation (ECB/2013/44), in OJ C5, 9.1.2014, p.1.

51ECB
Financial integration in EuropeApril 2014 51
I I I EUROSYSTEM ACT IV IT IES
FOR F INANCIAL INTEGRATION
51
EU LEGAL FRAMEWORK FOR CENTRAL sECURITIEs DEPOsITORIEs
On 7 March 2012 the European Commission issued a proposal for a regulation “on improving securities settlement in the European Union and on central securities depositories (CSDs)”. The Central Securities Depository Regulation (CSDR) establishes an EU framework for the authorisation, supervision, cross-border service provision, and outsourcing to a public entity, as well as prudential and organisational requirements for CSDs. It has a major impact on the EU legal framework for financial market infrastructures. The ECB strongly supported the Commission’s proposal to strengthen the legal framework applicable to CSDs, in particular in the advent of TARGET2-Securities (T2S) and its implications on the provision of securities settlement services. In its opinion, the ECB recommended an adequate involvement of the members of the ESCB in view of their statutory competence as overseers and central banks of issue.
The ECB supported a timely adoption of the CSDR and of the related technical standards before the go-live of the T2S platform in 2015, as this would facilitate the CSDs’ connection to T2S from a legal and regulatory perspective and increase legal soundness in cross-border transactions, while fostering harmonisation and improving the CSDs’ competitive environment. In this respect, the ECB welcomed the fact that political agreement on CSDR was reached in a mid-December 2013 trialogue meeting.
THE FORTHCOMING EU LEGIsLATION FOR RECOVERy AND REsOLUTION OF FINANCIAL MARKET INFRAsTRUCTUREs
The European Commission’s public consultation on the possible recovery and resolution framework for financial institutions other than banks closed on 28 December 2012. The summary of replies was published in March 2013. Taking into account the contributions and the well-advanced status of related international (CPSS-IOSCO and FSB) work streams, the European Commission initiated the next phase of recovery and resolution rulemaking aiming at setting the principles for recovery and resolution of CCPs, and then preparing the regulatory proposal. It is envisaged to cover other types of financial market infrastructures (i.e. CSDs) later on. The ECB welcomed the recovery and resolution rulemaking at the EU level, and emphasised the importance of central banks’ involvement throughout the EU legislative process.
EU LEGAL FRAMEWORK FOR OTC DERIVATIVEs, CENTRAL COUNTERPARTIEs AND TRADE REPOsITORIEs
The Regulation on OTC derivatives, central counterparties and trade repositories (also referred to as the European Market Infrastructure Regulation (EMIR)) entered into force in August 2012. In 2013 the implementation of EMIR progressed further. In March 2013 the technical standards specifying the practical implementation of the EMIR rules entered into force, which triggered the timelines for the authorisation process of central counterparties and trade repositories. By mid-September 2013, CCPs in Europe had to apply for authorisation, and national competent authorities started their assessment of whether the provided information was complete or whether additional information was required. Within six months after having received a complete application, the national competent authorities will have to inform the concerned CCPs whether authorisation is granted or not. Owing to its role as central bank of issue for the euro, the Eurosystem is participating in this review process for CCPs with major euro-denominated business as a member of the CCP colleges of authorities that are established under EMIR for all EU CCPs. NCBs may additionally participate in CCP colleges due to the supervisory or oversight functions they have. Following the authorisation of a CCP for a certain service, the determination of the mandatory clearing
52ECBFinancial integration in EuropeApril 20145252
obligation for the concerned products will be made. Depending on the eventual timing of the CCP authorisations, it is expected that the first clearing obligations could take effect by the end of 2014.
In addition, EMIR introduces a new recognition procedure for CCPs established outside the EU (so-called third country equivalence under EMIR). This recognition is a requirement for any EU clearing member wishing to use non-EU CCPs. The non-EU CCPs had to apply by mid-September 2013 to obtain such recognition. In the meantime, these CCPs can continue to provide services to EU clearing members already active at those CCPs. By 15 June 2014 a decision on the recognition is due.12
ESMA, who is responsible for the authorisation of Trade Repositories (TRs), took a registration decision for the first four EU TRs in November 2013. Two other TRs registered in the meantime. As a result, the reporting start date for each asset class for which a TR was registered was set at 12 February 2014. In line with the CPSS-IOSCO principles for financial market infrastructures, jointly adopted by central banks and securities regulators at the global level, the ECB expects that appropriate cooperative relations between supervisors and central banks will also be established for TRs.
DEVELOPMENT OF AN INTERNATIONAL REFERENCE DATA UTILITy
The Global Legal Entity Identifier System (GLEIS) fulfils a basic technical prerequisite for the effective measurement of risk in a globally [and digitally] integrated financial market. It will provide a global infrastructure of standardised reference data for fast and precise identification of parties to financial transactions, supporting the near-time, flexible [measurement and] analysis of complex markets necessary for effective risk management. The GLEIS is a first step towards the Reference Data Utility covering entities and instruments, which was originally envisaged. The European Parliament’s Committee on Economic and Monetary Affairs expressly welcomed the LEI in its Report on Shadow Banking (2012/2115(INI)) of 25 October 2012 and called for its expansion to also cover financial instruments and contracts.
On 4 November 2012, the G20 endorsed the LEI Charter, establishing the Regulatory Oversight Committee (ROC), which now leads the Global LEI initiative. The ROC’s mission is to uphold the governance principles of, and to oversee, the GLEIS.
The ROC launched the pre-LEI System, for identification of counterparties in derivatives transactions in reporting to trade repositories. The pre-LEI system is also useful for designing the future processes of the GLEIS. The pre-LEI system is made up of “pre-Local Operating Units” (“pre-LOUs”), each one sponsored by a member of the ROC and endorsed by the ROC. Each pre-LOU issues “pre-LEIs” to legal entities requiring them, and validates the data.
The ROC has recently agreed on global acceptance of pre-LEIs, whereby any pre-LEI issued by a pre-LOU that meets set principles should be accepted for financial reporting worldwide. The pre-LEI System will remain operational until the Global LEI Foundation (GLEIF) is established and the Central Operating Unit (COU, operated by the GLEIF) takes over operational governance of the system. Once established, the COU will prepare the operational premises for the GLEIS and conclude contracts with Local Operating Units (LOUs); pre-LEIs will in principle be converted into LEIs.
12 For example: http://ec.europa.eu/internal_market/financial-arkets/docs/derivatives/130513_equivalence-procedure_en.pdf

53ECB
Financial integration in EuropeApril 2014 53
I I I EUROSYSTEM ACT IV IT IES
FOR F INANCIAL INTEGRATION
53
Until then, the ROC may provide additional guidance to pre-LOUs, to ensure high quality and precise entity identification. As of March 2014, 22 organisations were being sponsored by ROC members worldwide, 14 of them issuing pre-LEIs, of which 11 in the EU. Also, some further pre-LOUs were being set up and planning to apply for endorsement by the ROC. As of end-March 2014, more than190,000 entities from 150 countries were registered.13
The ROC decided that the GLEIF should be established as a foundation under Swiss law; the FSB has agreed to be the founder. The process for establishing the GLEIF and appointing its initial Board of Directors is progressing. That Board of Directors will take over the responsibility of establishing the COU and leading the GLEIS in its operational development. The acquisition of funding to finance the start-up of the COU will be one of the next key tasks.
Meanwhile, ESMA and EBA have announced that pre-LEIs issued by any pre-LOU endorsed by the ROC should be used by financial entities in Europe for reporting to securities regulators and banking supervisors. In the US, all pre-LEIs are now accepted for reporting OTC derivatives transactions to CFTC. Hong Kong, Japan, Singapore and Australia are drawing up similar regulations on derivatives, likely to come into effect in 2014.
The ECB is a member of the ROC and of the ROC Executive Committee, and holds the Vice-Chair of the ROC’s Committee on Evaluation and Standards (CES).
2 CATALysT FOR PRIVATE sECTOR ACTIVITIEs
While public authorities are responsible for providing an adequate framework conducive to financial integration, progress in European financial integration ultimately depends on privatesector initiatives making full use of cross-border business opportunities. Competition among marketplayers isamajordriving force in this regard. Inaddition,progressmade in thefieldoffinancial integration also depends on effective collective action, notably where heterogeneousmarket practices and standards need to be overcome. However, possible coordination problems may hamper such cooperative approaches among market participants. In such cases, public sector supportforprivatesectorcoordinationeffortsmayhelptoovercomepossibledifficulties.
Given its institutional characteristics, the Eurosystem is particularly well placed to play an active roleasacatalystforprivatesectoractivitiesinthefieldofEuropeanfinancialintegration.TheECBis both a public authority with a pan-European remit and, in its capacity as the central bank of the euroarea,anactivemarketparticipant,withknowledgeofandbusinesscontacts in thefinancialmarkets.Overthepastfewyears,theECBhasactedasacatalystinmanyfields.
In 2013 the catalytic activities of the ECB and the Eurosystem focused mainly on the following initiatives.
sTRUCTURED FINANCE MARKETs
With the goal of reviving the European structured finance market, recognising its role as a funding channel for issuers/originators so as to foster the provision of loans to the economy and, consequently, long-term economic growth throughout the euro area, the ECB acts as a catalyst 13 Information on organisations being sponsored by ROC members and issuing pre-LEIs, as well as on registered entities, can be found on
the LEI ROC website: http://www.leiroc.org
54ECBFinancial integration in EuropeApril 20145454
in a number of initiatives related to this market segment. In particular, the ECB supports the development of sound and high-quality products that could attract a wide array of investors from the private sector with a medium- to long-term investment horizon. In this vein, the ECB played a role in some initiatives related to asset-backed securities (ABSs) and covered bonds because it recognised the importance of these markets in Europe. In general, the ECB aims at supporting initiatives that increase transparency and aim at becoming best practices in these market segments so as to promote high-quality assets that can help increase euro area financial integration.
As regards ABSs, in 2013 the Eurosystem ABS loan-level initiative, aimed at increasing transparency for such structures, was officially phased in as loan data reporting became mandatory for transactions backed by residential mortgages and by loans to small and medium-sized enterprises on 3 January 2013; and those backed by commercial mortgages on 1 March 2013. The Eurosystem loan-level initiative moreover covers four additional asset classes (consumer finance ABSs, leasing ABSs, auto loan ABSs and credit card ABSs), whose reporting requirements were phased in in early 2014 (between January and April). Such loan-level reporting is now an eligibility criterion for the Eurosystem collateral framework. With this requirement, the ECB demonstrates its interest in supporting transparent and simpler ABS instruments backed by specific and homogenous pools of underlying assets so as to promote lending to the households and companies throughout the euro area. In February 2014, the European Datawarehouse, the market-led single loan level data repository, contained information on roughly 700 ABS transactions, representing around €800 billion in terms of nominal amount (both senior and junior tranches).
Furthermore, the ECB continued to monitor the Prime Collateralised Securities (PCS) initiative, which was promoted by the Association for Financial Markets in Europe (AFME) and the European Financial Services Round Table (EFR). This initiative is reflected in a label (PCS Label) with the aim of enhancing and promoting quality, transparency, simplicity and standardisation throughout the ABS market in the EU. In late-February 2014, 44 ABS transactions from eight different European countries, representing €64 billion in terms of nominal amount were PCS-compliant. The PCS promoters aim at fostering the adoption of the label in additional European jurisdictions, while maintaining current quality levels, so as to enlarge the scope of the initiative. The ECB acts as an observer in the PCS Association.
For covered bonds, the ECB acted as an observer in the Covered Bond Label initiative, which was developed by the European Covered Bond Council (ECBC). This initiative, which was in 2013 aligned with Article 129 of the Capital Requirements Regulation (CRR), aims at improving standards and increasing transparency in the European covered bond market, thereby fostering further integration of this market segment. As of January 2014, 81 covered bond programs, representing €1.4 trillion in terms of nominal amount, complied with the Covered Bond Label Convention.
sTEP+
The STEP+ initiative, which is carried out by the ACI – The Financial Markets Association and the European Banking Federation (EBF), aims at revitalising the unsecured European money market by enhancing the current functioning of the Short-Term European Paper (STEP) market. The STEP initiative was launched in 2006 with the aim of fostering the integration and transparency of the European markets for short-term paper. To recall, the Eurosystem supported the STEP initiative from its genesis by playing the catalyst role and now provides statistics on this market, which are available on the ECB’s website. The ECB acts as an observer in the STEP+ Steering Committee. In

55ECB
Financial integration in EuropeApril 2014 55
I I I EUROSYSTEM ACT IV IT IES
FOR F INANCIAL INTEGRATION
55
January 2014, STEP-compliant securities amounted to €399.4 billion. Because of structural market features, French issues represent the major share of the market. Notably, there could be observed some issuances in distressed countries as well, which indicates that there is also some access to the STEP market in distressed countries.
RETAIL PAyMENTs INITIATIVEs
The Eurosystem has long supported the realisation of SEPA, the single euro payments area (covering the 28 EU Member States, plus Iceland, Norway, Liechtenstein, Monaco, Switzerland and San Marino). On 1 February 2014 the initiative reached a turning point: as of that date, existing national euro credit transfer and direct debit schemes in the euro area were to be replaced by the SEPA-compliant alternatives, as foreseen by the so-called SEPA migration end-date regulation (see Section 1). In order to promote timely migration, during 2013 the Eurosystem increased its monitoring and supporting activities in this field. It published two migration reports, in March and October, describing the state-of-play of migration and providing guidance to the market. Growing communication efforts were made to raise awareness, especially among citizens and smaller and medium-sized companies. Qualitative and quantitative information was collected to continually monitor the preparedness of national communities and their pace of migration. As during the year the SEPA indicators witnessed a likely “big bang” style of migration, the Eurosystem warned against the related risks to the wider supply chain, including “big billers”, public administrations, businesses and citizens. In December 2013, the indicators showed that SEPA credit transfers accounted for 73.8% of all credit transfers in the euro area, while SEPA direct debits represented 41.0% (see Chart 32 in Chapter I).
The migration to the new payment schemes provides a solid base for further development and integration of retail payments in euro; the SEPA migration end-date of 1 February 2014 therefore marked the start of a new phase in the European retail payments integration process. In this context, there will still be a need to address retail payment issues in their broadest sense at the European level by means of a European dialogue between banks, other payment service providers and end-users of payment services, even after 1 February 2014. Against this background, in December 2013, the ECB announced the establishment of a Euro Retail Payments Board (ERPB) for the governance of euro retail payments in the EU, as the body that succeeds the SEPA Council which was set-up in 2010 for an initial period of three years.14 Progress is still ongoing in the field of SEPA for cards. At the second Forum on SEPA Cards Standardisation, held in February 2013, the Eurosystem pointed out that further standardisation and interoperability are needed, and encouraged initiatives in this direction. Advancement in security was acknowledged, while more effort should be put in functional certification. In the field of cards, the Eurosystem has also undertaken work on related innovation, especially “m-POS”, i.e. mobile phones used as card acceptance devices. The Eurosystem intends to monitor the market, raise awareness and foster dialogue among stakeholders.
The basic SEPA payment instruments are based on common business practices, technical standards and security requirements, and lay the foundation for innovative pan-European solutions. In this connection, the Eurosystem also analysed the payment initiation services offered by non-account-holding third party providers (TPPs) and the evolution of e-commerce payments. In relation to payment initiation services and following on to the first meeting of November 2012, the Eurosystem
14 The SEPA Council was a stakeholders’ forum, co-chaired by the ECB and the European Commission, intended to promote an integrated euro retail payments market by ensuring the proper involvement of all parties and by fostering consensus on the next steps towards the realisation of SEPA. Chaired by the ECB, the ERPB has replaced its predecessor with a wider mandate, larger composition and a strong output-driven approach.

56ECBFinancial integration in EuropeApril 20145656
held meetings with TPPs in March and April 2013. This helped clarify the notion of payment account access, which was accommodated in the European Commission’s proposal for review of the Payment Services Directive (PSD) in July (see Section 1). These meetings also suggested that there might be market demand for further standardisation between TPPs and account-holding institutions. Regarding e-commerce payments, a competitive market is developing, in which online payment integrators provide e-merchants with all-encompassing solutions that combine the maximum number of payment methods within one system. The Eurosystem observes that dialogue with those new market players might be useful to promote harmonisation and avoid lock-in effects from materialising in this sector. More generally, in fact, most pilot projects or innovative solutions deployed have failed to cross national borders: the Eurosystem is concerned that this might reproduce the fragmentation that the SEPA initiative aims to overcome.
The European forum on the security of retail payments (SecuRe Pay)15 continued to focus on the extent to which payment initiation services may threaten security. In January 2013, while publishing final recommendations on the security of internet payments, the forum launched a public consultation on access to payment accounts services as provided by third-party providers, for account information and payment initiation purposes. A public note on security of payment account access services was published in March 2014. In November 2013 the forum published its third report, on the security of mobile payments, for public consultation.
Beyond common payment instruments, retail payment clearing and settlement infrastructures represent an enabling factor to the realisation of an integrated retail payments market. In its catalyst role, the Eurosystem published criteria for their SEPA-compliance in 2008. Since then the relevant market and regulatory framework have undergone changes. To take account thereof, the Eurosystem released updated criteria in September 2013.
In 2013 the European Commission published three proposals for legal acts on retail payments (see Section 1). All three proposals aim at more integrated, competitive and efficient payment services, in line with consumers’ needs. The proposals were therefore highly welcome.
At the global level, within the Committee on Payment and Settlement Systems (CPSS), the ECB and some ESCB central banks contributed, inter alia, to the work on “non-banks in retail payments”. This work is meant to gather and share knowledge between overseers and regulators from all over the world on the evolution of the environment in which banks have traditionally been the incumbents, and are now faced with new entrants. Issues such as cooperation and competition between banks and non-banks in the different segments of the value chain, regulatory and self-regulatory initiatives, risks and opportunities are to be addressed in an upcoming report. This can help identify common as well as diverging trends among jurisdictions or geographical areas, with a view to fostering a harmonised approach to a borderless market.
3 KNOWLEDGE OF THE sTATE OF FINANCIAL INTEGRATION
The ECB is in a unique position to provide in-depth economic analysis and comprehensive statistics regarding the state of financial integration in the euro area and its development. The ECB is also able to sponsor coordinated analytical research – together with other members of the Eurosystem and academics – and can make use of its experience and knowledge as an active market participant. 15 The forum is a voluntary cooperation initiative between relevant authorities within the EEA. It deals with the issue of security in retail
payments and makes recommendations where necessary.
57ECB
Financial integration in EuropeApril 2014 57
I I I EUROSYSTEM ACT IV IT IES
FOR F INANCIAL INTEGRATION
57
Enhancing knowledge and raising awareness regarding the need for European financial integration, and measuring the progress achieved in this regard, therefore form a major part of the ECB’s contribution to fostering financial integration.
In the course of 2013, the activities of the Eurosystem with respect to enhancing knowledge, raising awareness and monitoring the state of financial integration focused mainly on the following initiatives.
ECB AND EUROPEAN COMMIssION jOINT CONFERENCE ON FINANCIAL INTEGRATION AND sTABILITy
Under the heading “Financial integration and stability: the impact of ongoing reforms on financial integration and stability”, the European Commission organised this joint conference with the ECB on 25 April 2013. This conference serves not only as a platform for high-level panels and keynote speeches on financial integration, but also for the presentation of the ECB’s 2013 report on Financial Integration in Europe and the European Commission’s report on European Financial Stability and Integration 2012. The conference is an annual event, with the venue alternating between the ECB and the European Commission. The next conference will be organised by the ECB and will take place on 28 April 2014 at the premises of the ECB in Frankfurt.
ECB AND EUROPEAN COMMIssION jOINT CONFERENCE ON POsT-TRADE HARMONIsATION AND FINANCIAL INTEGRATION IN EUROPE
A conference entitled “Post-trade harmonisation and financial integration in Europe” was jointly organised by the ECB and the European Commission on 19 March 2013 in Frankfurt. The objective of the conference was to discuss the numerous initiatives that are underway – at the legislative, operational and business levels – in the EU with regard to post-trading infrastructures and their impact on EU financial integration.
More specifically, the distinguished group of speakers that took part in the event debated questions such as: will the ongoing legislative initiatives, e.g. MiFID2/MiFIR, EMIR, the CSD Regulation and the securities law legislation, contribute to improving the functioning of financial markets? What is the impact on collateral management and availability during a time of increasing collateral needs? How is the implementation of the Eurosystem’s TARGET2-Securities (T2S) project contributing to financial integration? What is the role of the involved stakeholders, especially as far as harmonisation of market rules and practices is concerned? And, finally, what opportunities can all these initiatives help to create for market participants in the context of an integrated post trade environment?
CONFERENCE – RETAIL PAyMENTs AT A CROssROADs: ECONOMICs, sTRATEGIEs AND FUTURE POLICIEs
On 21 and 22 October 2013 the ECB held a joint conference with the Banque de France on the challenges awaiting the institutions and the market with the SEPA migration end-date approaching, as well as in the wake thereof. The title “Retail payments at a crossroads: Economics, strategies and future policies” gives a flavour of the topics addressed. Top-level representatives of public authorities, market players and academia convened as speakers and participants to discuss policies and theoretical approaches to the many questions at stake. The debate revolved around the relevance of retail payments for the real economy and society, and touched upon financial inclusion, the underlying economics and the related competition issues. The conference was concluded by a forward-looking analysis of retail payments integration at not only the European, but also the global level.

58ECBFinancial integration in EuropeApril 20145858
This was the third conference on retail payments organised by the ECB in cooperation with a National Central Bank, following the previous event hosted by the Oesterreichische Nationalbank in Vienna in 2011 and that held jointly by the ECB and De Nederlandsche Bank in Frankfurt in 2009.
INDICATORs OF FINANCIAL INTEGRATION IN THE EURO AREA
Quantitative measures of financial integration provide essential tools for monitoring the status of financial integration in Europe and the progress achieved. Since September 2005, the ECB has published statistical indicators of integration in the euro area financial markets. These price and quantity-based indicators cover the money market, the government and corporate bond markets, the equity market and the banking sector. Market infrastructure indicators are included as well. The report also presents indicators of financial development. In fact, while financial integration is an important factor in increasing the efficiency of a financial system, the latter also depends on each financial system’s own degree of development.
Also in this issue of the report, many indicators are again presented for all the euro area countries together, and then split between countries with the highest, lowest and intermediate rates of long-term sovereign interest rates for bonds with a remaining maturity of approximately ten years. This provides more granular information.
The indicators are updated and published semi-annually on the ECB website. The last update was carried out in December 2013 and the next one will take place in May 2014.
PROVIsION OF FINANCIAL MARKET sTATIsTICs
Increasing transparency fosters integration, as it facilitates the comparison of products across the economic area. Since July 2007 the ECB has been publishing nominal yield curves of AAA-rated euro-denominated euro area central government bonds with a residual maturity ranging from three months to 30 years. The ECB publishes zero-coupon (spot, forward and par) yield curves for the euro area. In addition, the ECB releases daily yield curves covering all euro area central government bonds and publishes the spreads between both curves. Data based on the same sources and methodology used for the daily estimations stretch back to 6 September 2004.16
From an ECB monetary policy perspective, the main benefit of the euro area yield curves is that it provides a proper empirical representation of the term structure of euro area interest rates, which can be interpreted in terms of market expectations of monetary policy, economic activity and inflation. Publishing a consistent and comparable set of yield curves based on euro-denominated central government bonds also provides reference information for the wider public and financial market participants, who previously had to rely on references to bonds of individual issuers.
The financial crisis has led to an increasing use of country-specific bank lending rate information in the regular assessment of euro area economic conditions and in the analysis of the bank lending rate channel of the monetary policy transmission mechanism. In order to assess the effectiveness of the monetary policy pass-through across the euro area countries, it is necessary to use an accurate and comparable measure of the borrowing costs for firms and households in those countries. This is now achieved through the publication of the new cost-of-borrowing indicators based on MFI interest rate statistics, which are considered the most relevant source of information for bank lending rates
16 The yield curves and a description of the methodology used to estimate them can be found on the ECB website.

59ECB
Financial integration in EuropeApril 2014 59
I I I EUROSYSTEM ACT IV IT IES
FOR F INANCIAL INTEGRATION
59
in the euro area. Four basic categories of lending rates per country are used in the calculations: short-term and long-term lending rates both to non-financial corporations and to households for home purchase. This new measure enhances cross-country comparability and the assessment of integration of retail banking markets in the euro area, which until now have been limited owing to the differing impact of overdrafts on short-term lending rates.
Sincetheintroductionoftheeuro,andinparticularduetotherecentturmoilinfinancialmarkets,the demand both from the public and from institutions for timely and accurate statistical data on euro money market activity has increased. To this end, since the year 2000 the ECB has conducted an annual survey of euro money market activities during the second quarter of each year. For the 2013 survey, 161 banks in the EU and in Switzerland participated voluntarily. The data include cumulative quarterly turnover for a variety of market segments (the unsecured market, repo market, derivatives market and short-term securities market) broken down into several maturity buckets (from overnight to more than ten years). The data are released to the general public as the “Euro Money Market Survey”. In 2013 the aggregated figures on money market activity were published for the first time. In addition, for each even-numbered year, the “Euro Money Market Study” presents an in-depth analysis of money market activity.17
The ECB is responsible for providing statistics on the Short-Term European Paper (STEP) market. Apart from daily yields and spreads on new issues, the ECB statistics include daily data on aggregated outstanding amounts and new issues broken down by sector, maturity, rating and currency. Outstanding amounts and currency breakdowns are also shown at the level of each individual issuance programme. This set of statistics enlarges the information available to help investors base their decisions. For instance, it allows investors to assess their concentration risk, measuring their exposure to a specific programme as a share of the programme’s overall size.
sTATIsTICs ON INsTITUTIONAL INVEsTORs
In 2013 the ECB, together with the NCBs of the participating member states, and in most cases also the NCBs of the non-euro area countries, continued the production of an enhanced set of statistics addressed to MFIs concerning balance sheet items and interest rate statistics, as well as statistics on MFI securitisation and the balance sheets of financial vehicle corporations (FVCs) engaged in securitisation transactions. Moreover, the ECB continued to publish harmonised statistics on investment fund assets and liabilities. These consist of two separate datasets: one covering investment funds as part of the “other financial intermediaries” sector, and the other covering money market funds as part of the MFI sector. The statistical definition of MMFs, used in the data collection for monetary statistics, is aligned to the supervisory definition as adopted by the Committee of European Securities Regulators (the predecessor of the European Securities and Markets Authority, or ESMA). The motivation behind the adoption and implementation of a EU-wide definition was the protection of investors by setting out clear-cut quantitative and qualitative criteria18 to be applied by any fund marketing itself as a MMF. In addition to this, the ECB also regularly publishes euro area balance sheet statistics for credit institutions (which together with money market funds constitute almost the whole of the MFI sector excluding the Eurosystem).
Besides regularly publishing data, in 2013 the ECB and the NCBs concluded a merits and costs procedure for the update of the legal acts underlying the data collection in these statistical domains.
17 The Euro Money Market Study and the Euro Money Market Survey are available on the ECB website. Statistical data can be retrieved.18 Such criteria aim to restrict the various types of risk associated with money market funds, i.e. interest rate, liquidity, credit and credit
spread risk.

60ECBFinancial integration in EuropeApril 20146060
The amendments were mainly required to align the legal framework to the changes in Regulation (EU) No 549/2013 of the European Parliament and of the Council of 21 May 2013 on the European system of national and regional accounts in the European Union19 (ESA 2010). In addition, some amendments were in response to user requirements for monetary policy, financial stability purposes, and to contribute to other statistical outputs. Data collection will commence according to the new legal acts as from early 2015.
Regarding insurance corporations and pension funds (ICPFs) statistics, in 2013 the ECB continued the regular publication of quarterly statistics for ICPFs in the euro area under a “short-term” approach. The statistics, derived mainly from supervisory sources, contain information on the assets and liabilities of insurance corporations and pension funds (ICPFs) resident in the euro area; the main aggregates are also available separately for insurance corporations and pension funds. In parallel to this, in 2013 the ECB commenced a merits and costs procedure aimed at a “steady-state” approach for harmonised statistics on the insurance sector. Subject to the outcome of the procedure, a new regulation for statistical requirements on insurance undertakings will be introduced using, to the extent possible, supervisory data sources in order to minimise the reporting burden on insurance undertakings. For this purpose, the ECB is closely cooperating with the European Insurance and Occupational Pensions Authority (EIOPA) on the integration of statistical and new Solvency II supervisory reporting requirements.
The regular production of these statistics contribute to a better, more harmonised measurement of activity in the financial sector as a whole, including that of non-bank financial corporations across the euro area countries, as well as in some other EU Member States. This ensures greater transparency and comparability in the assessment of developments in this sector and each sub-sector.
Moreover, work is now ongoing to develop a security-by-security dataset on securities holdings of euro area/EU investors and of selected Reporting Banking Groups, which represents a further important improvement in data availability as from 2014. In particular, in March 2013 the ECB adopted the Guideline ECB/2013/7, which defines the procedures that NCBs need to follow in order to report to the ECB statistical information derived from the data collected under the new ECB Regulation (EU) No 1011/2012, covering both holdings by sectors and holdings by selected Reporting Banking Groups. These requirements on holdings by sectors apply to security-by-security data on holdings of securities by euro area (financial and non-financial) investors, as well as on holdings by non-euro area investors of securities issued by euro area residents which are kept in custody in the euro area. The requirements on holdings by Reporting Banking Groups, currently covering the 25 largest banking groups with head office resident in the euro area, are consistent with those on holdings by sector and include additional information on the group. For certain groups the information will be reported by individual affiliates, while in other cases the data will be reported aggregated at the group level, possibly distinguishing between the entities resident in the country of the head office, in the other euro area countries and outside the euro area. The data collection started in March 2014 with reference to data for December 2013.
4 CENTRAL BANK sERVICEs THAT FOsTER INTEGRATION
Financial market integration needs to be complemented and supported by the integration of the underlying market infrastructures. The provision of central bank services is another way in which the Eurosystem seeks to promote financial integration in this area. Although the main purpose of 19 OJ L 174, 26.6.2013, p. 1.

61ECB
Financial integration in EuropeApril 2014 61
I I I EUROSYSTEM ACT IV IT IES
FOR F INANCIAL INTEGRATION
61
such services is the pursuit of the Eurosystem’s basic central banking tasks, the Eurosystem pays close attention to ensuring that such services, where possible, are specified in such a way that they are also conducive to supporting the financial integration process.
During 2013 the ECB and the Eurosystem focused their activities in the area of central bank services on the following initiatives.
TARGET2
TARGET2 plays an important role in the integration of euro large-value payments, including money market operations. TARGET2 is based on a single technical platform, also referred to as the single shared platform (SSP). The SSP is used for processing euro payments and managing accounts opened for financial institutions with their central banks. The SSP also supports other systems operating in euro (i.e. ancillary systems), settling the cash positions of their participants in central bank money. With TARGET2 the entire European user community benefits from the same comprehensive, advanced real-time gross settlement services. TARGET2 offers access to credit institutions and ancillary systems.
At present, 24 central banks of the EU and their respective national user communities use the single shared platform of TARGET2: the 18 euro area NCBs, the ECB, and five NCBs from non-euro area EU Member States.
With the creation of TARGET2, the Eurosystem made a crucial contribution to European financial integration. Being the first market infrastructure completely integrated and harmonised at the European level, TARGET2 has eliminated the fragmented situation that previously existed in the management of central bank liquidity and the real-time settlement of euro payments. The move to a single platform represented a significant step towards a more efficient, competitive, safe and fully integrated European payments landscape, offering all market participants equal conditions and services regardless of their location. The harmonised service level of TARGET2, offered with a single price structure, ensures a level playing field for all participants across Europe.
TARGET2 also provides a harmonised set of cash settlement services in central bank money for all kinds of ancillary systems, such as retail payment systems, money market systems, clearing houses and securities settlement systems. The main advantage for ancillary systems is that they are able to settle their cash positions in TARGET2 via a standardised technical interface and standardised settlement procedures, thus allowing a substantial harmonisation of business practices.
At the time when TARGET2 was introduced, in order to facilitate the technical migration of banking communities, it was agreed that some NCBs could maintain for a transitional period local systems – referred to as proprietary home account (PHA) applications – in which some payments settlement could still take place. This period has recently come to an end and all TARGET2 participants now settle their transactions directly in the single platform. In order to support the transition from the PHAs, the Eurosystem introduced in November 2010 the internet-based access to TARGET2. This consists of an alternative direct access to the main TARGET2 services without requiring a connection to the SWIFT network. The Eurosystem developed this internet-based access to meet the needs of small and medium-sized banks that wished to hold an account with their NCB (e.g. for refinancing operations, fulfilment of reserve requirements or for limited payment traffic). By offering technical access to TARGET2 to a wider range of market participants, the internet-based access may contribute to the integration of the central bank liquidity management of European banks.

62ECBFinancial integration in EuropeApril 20146262
The TARGET2 system functioned smoothly in 2013. The system’s market share remained stable, with 91% of the total value and 60% of the total number of euro denominated large-value payments being executed via TARGET2. The average number of payments processed by the system each day in 2013 was 363,099, while the average daily value was €1,935 billion. These figures position TARGET2 as one of the most important systems for large-value and time-critical payments in the world, alongside Fedwire in the United States and Continuous Linked Settlement (CLS), the international system for settling foreign exchange transactions. In 2013 the overall level of TARGET2 availability reached 100%.
Observations made with regard to the use of the harmonised and advanced TARGET2 services (payment prioritisation, liquidity reservation, sender limits, liquidity pooling, etc.) confirm that they are actively used by a wide range of participants and that they contribute to the smoother settlement of transactions. TARGET2 and its new features have both enabled and driven organisational changes in credit institutions that operate in several European countries, by allowing them to rationalise their back office functions and consolidate their euro liquidity management.
In October 2012 the Eurosystem adopted its revised strategy for ISO 20022 in TARGET2, aimed at migrating to the new international ISO 20022 standard in November 2017. The compliance with the new messaging standard will further foster financial integration, improving interoperability with other market infrastructures based on ISO 20022, such as T2S. Further information on the ISO 20022 strategy for TARGET2 can be found on the TARGET2 dedicated website.20
TARGET2-sECURITIEs (T2s)
T2S is a major infrastructure project of the Eurosystem which aims to overcome the current fragmentation in the securities settlement layer of the European post trading landscape by providing a single IT platform capable of settling securities transactions in central bank money across borders, CSDs and currencies.
The deep fragmentation of the EU post trade market today, coupled with the existence of procedures that have not yet been harmonised across national settlement systems, results in high costs and inefficiencies, as identified in the Giovannini Reports on “Cross-border Clearing and Settlement Arrangements in the EU” (2001 and 2003).21 This is particularly evident in cross-border securities transactions, and ultimately creates a considerable competitive disadvantage for European capital markets.
The T2S platform will help solve this problem by offering harmonised and commoditised delivery-versus-payment (DvP) settlement in central bank money, both in euro and in any other participating currency (by agreement with the respective NCBs). This service will be offered at the same price for all participating CSDs making no differentiation between domestic and cross-border transactions.
Until now, 24 European CSDs have joined T2S, covering 21 European markets. The Danmarks Nationalbank had already entered in 2012 into a contractual agreement with the Eurosystem to make the Danish krone available in T2S as of 2018. The high level of CSD participation in T2S, including nearly 100% of the securities volumes currently settled in the euro area, will lead to significant economies of scale and lower settlement costs, and will ensure a wide reach for the T2S
20 www.target2.eu 21 See Giovannini Group, “Second Report on EU Clearing and Settlement Arrangements”, April 2003, available on the European
Commission website (http://ec.europa.eu).

63ECB
Financial integration in EuropeApril 2014 63
I I I EUROSYSTEM ACT IV IT IES
FOR F INANCIAL INTEGRATION
63
harmonisation achievements. These benefits could further increase in the future, as T2S remains open to any other European markets and currencies that may decide to join at a later stage.
The project is currently in the internal testing phase, and the platform is due to go live in June 2015. The participating CSDs will connect to the new platform in four waves between June 2015 and February 2017. For more details on the project’s progress, please refer to the ECB’s latest Annual Report or visit the T2S website.22
The T2S project is designed to make cross-border settlement as efficient and safe as domestic settlement. From the beginning, the Eurosystem has aimed to avoid the cementation of national specificities into the system’s operational blueprint, in line with the market’s request to keep T2S “lean”, i.e. limited to pure settlement and neutral vis-à-vis participating markets and infrastructures. No specific functionalities have therefore been developed in T2S to support national specificities. Instead, processes have been identified that allow markets to continue to support their different needs using a basic T2S functionality. Participation in T2S will increase the incentives to remove specificities and reach wider harmonisation in order to be more competitive in the European arena.
The Eurosystem is assisting CSDs and markets in their adaptation to T2S, encouraging the reshaping of current infrastructure in order to make full use of T2S’s potential in terms of integration and harmonisation of securities settlement in Europe.
Designing a common settlement service is in itself a driver of harmonisation. The implementation of T2S will establish, among other things, the use of a single system with the same operating hours and deadlines, and the use of harmonised communication standards (based on the ISO 20022 global standard). In addition, the T2S Advisory Group, a forum comprising senior market and public authority members which provides advice to the Eurosystem on T2S-related issues, is working with priority on post trade harmonisation.
The T2S Advisory Group has defined a set of top priorities and functional targets for harmonisation activities and indicated the specific actors who are responsible for the definition, monitoring and implementation of standards in each activity. The priority issues currently being monitored and managed by the T2S Advisory Group include, among others, harmonised rules for settlement finality in T2S, the implementation of the T2S corporate actions standards, the possibility for foreign intermediaries to hold securities in omnibus accounts, and the definition of market practices in T2S. The objective is for all T2S markets to implement harmonised standards and market practices before connecting to T2S, so as to ensure safe and efficient cross-border settlement in T2S.
The process is transparent and results are published annually by the T2S Advisory Group in the T2S harmonisation progress reports, providing a detailed analysis of the status of each harmonisation activity and the compliance status of each T2S market. The latest progress report (Fourth T2S Harmonisation Progress Report23), the results of which were shared with the T2S Board and the Governing Council of the ECB, was published on 19 March 2014.
In addition, the prospect of connected EU securities infrastructures via T2S has prompted market participants to further work on contributing to the regulatory initiatives which support financial integration, most notably the CSD Regulation. In this context, two T2S task forces are working to coordinate the adoption of some CSD Regulation provisions across T2S markets, namely the 22 See the T2S website (http://www.T2S.eu).23 Available at www.harmonisation.t2s.eu.

64ECBFinancial integration in EuropeApril 20146464
implementation of a common settlement period of T+2 and the application of an EU settlement discipline regime.
Finally, it is with the prospect of the implementation of EU legislation on securities market infrastructures and the introduction of T2S in 2015 that the European Post Trade Group (EPTG) was set up in 2012. The group, a joint initiative on post trade harmonisation by the private and public sectors (European Commission, ECB and ESMA), is a successor to the European Commission’s Clearing and Settlement Advisory and Monitoring Expert Group (CESAME) and Expert Group on Market Infrastructures (EGMI). The EPTG is focusing its attention on post trade harmonisation items which are currently not covered by public authority initiatives (T2S, the Contact Group on Euro Securities Infrastructures (COGESI) and the CSDR). These items include, among others, the work on cross-border shareholder transparency and registration procedures.
EUROsysTEM COLLATERAL MANAGEMENT
Since its implementation in 1999, the correspondent central banking model (CCBM) has fostered financial market integration by enabling all euro area counterparties to use a common set of eligible marketable assets as collateral in Eurosystem credit operations, regardless of the location of the underlying assets or the counterparty. In line with the introduction of non-marketable assets in the common set of eligible assets in 2007, specific procedures for the cross-border use of such assets under the CCBM were developed.
The CCBM is the main channel for the cross-border use of collateral in Eurosystem credit operations. At the end of 2013 it accounted for 54.9% of the collateral used across borders and 13.3% of the total collateral provided to the Eurosystem. In 2014, the Eurosystem will implement enhancements to the CCBM that will further foster financial integration by facilitating more efficient mobilisation of collateral on a cross-border basis. The first enhancement is the removal of the requirement to repatriate (marketable) assets from investor CSDs to issuer CSDs before mobilisation as collateral through the CCBM. The second enhancement is the support of tri-party collateral management services on a cross-border basis (currently such services are only supported domestically in the context of Eurosystem credit operations). These enhancements to the CCBM are scheduled to go live in May 2014 and September 2014 respectively.

65ECB
Financial integration in EuropeApril 2014
A. GEOGRAPHICAL sEGMENTATION OF THE EURO AREA MONEy MARKET: A LIQUIDITy FLOW APPROACH1
The Special Feature explores to what extent intra-euro area cross-border flows offset country-specific liquidity shocks in the context of fragmented financial markets. The main objective is to determine how efficiently the market allocates liquidity; in particular, how actively investors take advantage of arbitrage opportunities across the euro area. The main finding is that geographical segmentation against the backdrop of the financial and sovereign crisis jammed the smooth reallocation of central bank liquidity between euro area jurisdictions. The absence of a unified liquidity market compromised a crucial engine of monetary policy transmission, as short-term rates became more sensitive to domestic liquidity conditions than to the excess liquidity aggregated at the euro area level. In this context, country-specific factors, influencing liquidity independently from the monetary authorities and market participants’ demand for refinancing, gained a disproportionate importance in determining very short-term rates in member states. Segmentation rose with the sovereign crisis, suggesting that credit risk perception in a context of limited information on banks’ situations was the main cause of geographically segmented liquidity. The sharp increase in Eurosystem intermediation in 2012 compensated for the segmented liquidity market. Although the most recent data showed liquidity allocation gradually improving, flows would take time to normalise as re-establishing liquidity lines is a more protracted process than cancelling them.
1 INTRODUCTION
Market fragmentation is a challenge for monetary policy implementation in monetary unions. Central bank liquidity or, simply, liquidity is defined as the aggregated balances of financial institutions’ accounts on the liability side of the central banks’ balance sheets. Normally, central banks could actively manage this liquidity at the aggregate level based on a unified market, which reallocates liquidity from banks with a liquidity surplus to banks with a liquidity deficit.2 Active liquidity management allows central banks to steer very short-term interest rates across member states’ domestic money markets because these rates and central banks’ liquidity have a well-established relationship. However, market integration finds a natural obstacle along the national borders in monetary unions, which could hamper liquidity allocation among member states. This Special Feature explores how effectively the market reallocated excess liquidity in the euro area from 2003 to 2013 and the consequences of a hampered liquidity market on very short-term rates in different euro area countries.
David Hume (1711-1776) explored a similar issue more than two centuries ago. He argued that a shock in the stock of gold in one country at the time of the gold standard should trigger offsetting capital inflows from other countries sharing the same monetary standard – a mechanism also known as the “price-specie flow mechanism.” It works as follows: a decline in the stock of gold in a country (country A) should increase the local interest rate. Capital would flow from country B to country A as investors in country B take advantage of the higher interest rate in country A. The “species” flows between the two countries would increase the interest rate in country B while reducing it in country A until the two converge to the same level. As a result, the currency flows from country B to country A offset the initial liquidity drop in country A.1 Authors: Romain Veyrune, Karolis Liaudinskas and Zoe Sprokel.2 Excess liquidity is defined as counterparties’ deposits at the deposit facility plus current account holdings in excess of those contributing
to the minimum reserve requirements. On the other hand, a liquidity surplus or deficit represents the net claim of counterparties with the Eurosystem, which includes, on the asset side, the counterparties’ total deposits with the Eurosystem and, on the liability side, all outstanding refinancing.
sPECIAL FEATUREs

66ECBFinancial integration in EuropeApril 2014
The international monetary system has changed considerably since the 18th century, but internal liquidity flows still matter for a unified monetary policy in a monetary union. Exchange rate arrangements have become more flexible and capital controls more frequent, and gold does not have the status of central bank liquidity any more. However, currency flows (i.e. liquidity flows) between member states usually remain unhampered in monetary unions, as the members of the union share the same currency and do not impose capital account restrictions amongst themselves. As a result, the same mechanism as the one described by the “price-specie flow” should still apply among members of the monetary union.
In the modern world, liquidity flows between the members of a monetary union are still expected to offset domestic liquidity shocks. Country-specific liquidity factors outside of the monetary authorities’ control, which are called autonomous factors,3 constantly fluctuate and influence counterparties’ liquidity needs. National banking sectors affected by a drop in liquidity due to domestic factors will experience some increase in short-term rates, which attracts liquidity flows from the rest of the monetary union. As such, liquidity flows across member states are expected to react to domestic liquidity developments and offset them without the need for the central bank to intervene in the market. This is considered to be a strong mechanism for prices to converge in financial markets, although differences may persist due to other factors, such as credit risk perception.
However, country-specific risk factors, or the way they are perceived by investors, could distort liquidity flows among monetary union members. During the last phase of the recent crisis, concerns about financial institutions’ strength affected countries’ sovereign ratings, as the contingent liability of supporting failing banks would lie on the national fiscal authorities. At the same time, sovereign downgrades contributed to the stress on domestic banks, as they often invested heavily in sovereign debt. This negative feedback loop resulted in a tendency to renationalise money markets, reducing the offsetting influence of cross-border liquidity flows on domestic liquidity shocks. It also triggered safe haven flows4 inside the euro area, which led to a “wrong-way” allocation of liquidity from member states with a liquidity deficit to member states with a liquidity surplus.
This Special Feature is divided in two sections. The first section estimates the sensitivity of intra-euro area flows to domestic liquidity shocks in the period between 2003 and 2013. It aims at assessing how effectively the market has been smoothing domestic liquidity shocks before and after the start of the financial crisis in 2008 with a view to improving our understanding of market functioning before and during the financial and sovereign crisis. The second section explores the impact of liquidity segmentation on very short-term rates in France, Germany, Italy and Spain.
3 Autonomous liquidity factors are defined as the items in the consolidated balance sheet of the Eurosystem, apart from monetary policy operations, that provide or withdraw liquidity and thus affect the current account balances which credit institutions hold with the Eurosystem. They are not under the control of the Eurosystem and generally reflect domestic factors, such as fluctuation of banknotes in circulation and government deposits with the Eurosystem.
4 Safe haven flows are investment decisions motivated by credit risk considerations. In these circumstances, assets perceived as safer would be in high demand even though their return is low and even, at times, negative.

67ECB
Financial integration in EuropeApril 2014
SPECIAL FEATURE A
2 OFFsETTING FLOW IN THE EURO AREA
THE MODEL
The term “offset coefficient” is borrowed from Kouri and Porter (1974).5 Their work focused on the autonomy of monetary policy in a fixed exchange rate system, such as Bretton Woods. They elaborated the concept of sterilisation and offset coefficients. The sterilisation coefficient measures the extent to which a drop in foreign reserves’ has an impact on domestic liquidity – and, thus, on short-term interest rates – is “sterilised” or compensated by an increase in the central bank refinancing of the banking sector. Countering upward pressures on short-term interest rates, in turn, triggers capital outflows. How much capital outflows react to the sterilisation of changes in foreign reserves is measured by the offset coefficient. Summing up the two coefficients indicates how much autonomy the monetary policy could have in a fixed exchange rate arrangement.
Our approach is a variation of the Kouri and Porter offset coefficient: our “offset coefficient” measures to what extent cross-border flows actually offset localised liquidity shocks due to domestic factors. As a result, instead of assessing the degree of monetary policy autonomy, our main objective is to determine how efficiently the market allocates liquidity, in particular how actively banks take advantage of arbitrage opportunities, across the euro area.
The relationship between the domestic liquidity shocks due to autonomous factors and the changes in net intra-Eurosystem claims, i.e. the offset coefficient, is estimated using the following model on the basis of a panel consisting of 17 euro area countries for the period of 2001 to 2013.
∆IntraEAt,c = α + αc + β∆AFt,c + α г∆USDt,c + et,c
Where:
– ΔIntraEAt,c are the daily changes in net intra-Eurosystem claims for country c on the day t. They represent the sum of a national banking sector’s transactions with the rest of the euro area that have an impact on the central bank liquidity held by banks. They have many different origins: the payments of current account transactions, transfers without counterparties, other non-financial transactions, and cross-border financial transactions. The data are extracted from the euro area National Central Banks’ balance sheet.
– ΔAFt,c are the corresponding daily domestic liquidity shocks for country c on the day t. They are measured by the change in net domestic autonomous factors, which have been defined above.
– ΔUSDt,c are the changes in the USD dollar operation outstanding amounts. They have been introduced in the estimations of the offset coefficients to control for banks’ demand for US dollar funding from the Eurosystem, which amounts to treating them as an autonomous factor.
– αc control for time-invariant country-specific factors, such as country sizes and structural banking sectorfeatures.αisthepanelconstant.
Theoffsetcoefficientβmeasurestheextenttowhichtheincrease(decrease)intotalautonomousfactors within one country explains the inflows (outflows) from (to) other euro area countries.
5 Kouri, P. and Porter, M. (1974), International Capital Flows and Portfolio Equilibrium, Journal of Political Economy, pp. 444-470.

68ECBFinancial integration in EuropeApril 2014
In a well-functioning market, one would expect a sudden increase in domestic liquidity need, i.e. a liquidity shock due to domestic factors, to be financed by inflows from other countries, thus the offsettingcoefficientβshouldbecloseto-1.Thenegativesignisduetothefactthatnetintra-euroarea claims are computed as a net asset while autonomous factors are usually a net liability in the euro area. In contrast, in a highly fragmented market, a liquidity shock due to autonomous factors is more likely to be financed by counterparties’ own liquidity buffers or by the Eurosystem, which woulddriveβcloserto0.
REsULTs
Weestimatedaseriesof theoffsetcoefficientsβbyrolling themodeloverperiodsof300dayswithanincrementalstepofoneday.Chart33presentstheoffsetcoefficientβanditsdevelopmentthrough time along with excess liquidity, comparing market distribution of liquidity with Eurosystem intermediation. Chart 34 compares the offset coefficient with two other indicators of market stress: the sovereign spread between Italy/Spain and Germany, which reflects tensions related to the sovereign crisis, and the dispersion of EONIA contributions, which is expected to reflect financial sector tensions more specifically than the sovereign yield spreads. The grey area around the coefficient is the confidence interval of the estimates, which increases either if the coefficient fluctuates through time or if cross-country differences increase. As such, an increase in the confidence interval would point at more fragmented markets. Chart 35 compares the standard offset coefficient with the one not corrected for changes in the Eurosystem USD refinancing operation outstanding amounts in order to explain some results noted after the collapse of Lehman Brothers in 2008, which are counterintuitive at first sight otherwise.
Chart 33 Offset coefficients and excess liquidity
0100
-100
2003004005006007008009001,0001,1001,2001,3001,4001,5001,600
-1.4
0.0
-0.2
-0.4
-0.6-0.66
-0.8
-1.0
-1.2
2003 2005 2007 2009 2011 2013
Lehman Brothers collapse
OMTannouncement
95% confidence interval (left-hand scale)excess liquidity in EUR billion (right-hand scale)offset coefficient (left-hand scale)1)
Source: ECB.1) Regression coefficient controling for USD operations.
Chart 34 Offset coefficients and other indicators of market stress
0.0
-0.2
-0.4
-0.6
-0.8
-1.0
-1.4
-1.2
25
20
15
10
5
0
95% confidence interval (left-hand scale)offset coefficient (left-hand scale) 1) Italy-Germany spread (right-hand scale) 2)
EONIA deviation (right-hand scale) 2)
Spain-Germany spread (right-hand scale) 2)
2003 2005 2007 2009 2011 2013
LehmanBrotherscollapse
OMT announcement
-0.66
Sources: Banco de Espana, ECB, MTS and BrokerTec.1) Regression coefficient controling for USD operations.2) Cumulative change of the 300-day moving average since 2003 in percentage.

69ECB
Financial integration in EuropeApril 2014
SPECIAL FEATURE A
The long-term equilibrium coefficient is slightly lower than -0.66, meaning that, on average and on a long period, every 1 euro increase (decrease) in liquidity need due to domestic factors is offset by a 66 cent inflow (outflow) from the rest of the Eurosystem. The rest is absorbed either by counterparties’ liquidity buffers or by their recourse to the Eurosystem.
The period under review (2003 to 2013) was broken down into three periods: early 2003 to October 2008, October 2008 to mid-2011, and mid-2011 to end-February 2014. These dates were chosen for the following reasons:
• The first period stands for normal market conditions. In the pre-crisis monetary policy implementation framework, the Eurosystem’s overall supply of liquidity was determined on the basis of an estimate of the banking sector’s aggregate liquidity needs. The latter primarily depended on the minimum reserve requirements imposed by the Eurosystem as well as on developments in autonomous liquidity factors. This was the neutral liquidity allotment.
• The second period represents the first stage of the financial crisis that concerned mainly banks. The start date selected here coincides with the introduction of the fixed rate full allotment, which was implemented in the aftermath of the Lehman Brother collapse because counterparties’ demand for Eurosystem refinancing became volatile and increasingly difficult to forecast accurately. Under the fixed rate and full allotment, the liquidity supply has been determined by banks’ aggregated demand for Eurosystem refinancing.
• The third period relates to the sovereign crisis in the euro area in addition to the financial crisis. Banks requested a record high amount of Eurosystem refinancing, mainly supplied through two three-year refinancing operations in 2011 and 2012. The demand for refinancing declined after the announcement of OMT in September 2012 as market conditions improved.
During the first period, the coefficient remained close to its long-term average with very limited volatility and cross-country disparities, i.e. the estimates have narrow confidence intervals. As the Eurosystem implemented a neutral liquidity allotment, there was no persistently large level of excess liquidity. During this period, the market effectively reallocated central bank liquidity across counterparties and euro area jurisdictions without extensive recourse to Eurosystem intermediation. The confidence interval increased somewhat in 2007 as the Eurosystem modified its liquidity allotment to accommodate counterparties efforts to front-load their reserve requirements. While excess liquidity remained neutral on average over the maintenance periods, the increased volatility in excess liquidity observed on a day-to-day basis leads to the first sign of weakening in the offset coefficient.
During the second period, the coefficient fluctuated significantly more, but did not increase so much or for so long as after the start of the sovereign crisis (third phase). The confidence interval of the estimated offset coefficients became relatively large during the financial crisis, pointing at widely spread market tensions. However, the confidence interval became narrow again in 2011. Afterward, the offset coefficient followed a clear increasing trend, pointing at a less efficient allocation of liquidity across member states. This could be interpreted as a sign of rising liquidity segmentation in the wake of the sovereign crisis.
In October 2008, after the Lehman Brothers collapse, the “uncorrected” offset coefficient decreased substantially below its long-term average, as if the market had been smoothing

70ECBFinancial integration in EuropeApril 2014
domestic liquidity shocks better. At that time, the Eurosystem provided large amounts of US dollar funding to euro area banks through repo operations because of euro area banks’ large demand for US dollar funding. In the absence of these operations, the demand for Eurosystem refinancing in euro would have likely increased substantially in order to satisfy the need for US dollar funding. After an increase in 2009, the coefficient recovered in 2010 because markets showed signs of normalisation as euro area authorities designed backstop strategies for their banks.
In Chart 35, the blue line shows the offset coefficient controlling for changes in Eurosystem US dollar repo operations, while the red line represents the offset coefficient as previously estimated. Once controlling for USD operations, the coefficient is higher than the coefficient previously estimated. This suggests that the decrease in the coefficient noted after the collapse of Lehman Brothers would have not been as large for an unchanged supply of USD by the Eurosystem.
During the third phase, the sovereign crisis gave a geographical dimension to fragmentation,6 which was not present during the first stage of the financial crisis. The coefficient moved above -0.66 for a sustained period and reached its highest point in October 2012, reflecting hampered liquidity markets. Chart 33 shows that the decrease in the influence of cross-border flows to smooth domestic liquidity shocks was accompanied by a large increase in excess liquidity (also plotted in Chart 33), which reflects more dependence on Eurosystem refinancing.
The coefficient pointed at an improvement in market functioning during the second half of 2012. The narrowing of the confidence interval is also a sign of market normalisation. The turning point appears to have been the announcement of Outright Monetary transaction (OMT),7 as the offset coefficient gradually decreased shortly after the time of the announcement. The initial decrease started despite the prevailing high level of excess liquidity and accelerated when counterparties were given the option to repay early their borrowing from the three-year longer-term refinancing operations starting from the beginning of 2013. Based on the most recent observation, the coefficient is moving toward its long-term average but has not yet recovered its pre-crisis level, reflecting persisting although receding geographical fragmentation.
In Chart 34, the most obvious correlation is between the sovereign yield spread and the offset coefficient, as both indicators reflect geographical fragmentation. The two measures partially 6 Market fragmentation initially referred to the reluctance of market participants to trade with each other regardless of the counterparty
location. 7 OMT is a monetary policy operation consisting of possible purchases of government bonds that were introduced in September 2012 as
an effective backstop to counter severe market disruptions that impaired the transmission mechanism of monetary policy, put at risk the singleness of monetary policy, and threatened stability in the euro area.
Chart 35 Offset coefficients and UsD refinancing operations
0
50
100
150
200
250
-0.66
-1.0
-0.9
-0.8
-0.7
-0.6
-0.5
-0.4
-0.3
-0.2
-0.1
0.0
Lehman Brothers collapse
OMTannouncement
USD operations in EUR billion (right-hand scale)
regression coefficient controling for USD operations (left-hand scale)
regression coefficient (left-hand scale)
2003 2005 2007 2009 2011 2013
Source: ECB.

71ECB
Financial integration in EuropeApril 2014
SPECIAL FEATURE A
overlap with measures of market stress more directly related to the financial sector, such as the dispersion of EONIA contributions. In particular, financial sector stress seems to have started before the increase in sovereign yield spreads. The rise in excess liquidity also largely compressed the spreads, which then did not reflect the actual level of market stress.
Box 2 shows that the improvement in market functioning led to a decline in Eurosystem market intermediation. From July 2011 to July 2012, excess liquidity flowed out of euro member states experiencing already a liquidity deficit to member states with a liquidity surplus against the backdrop of safe haven flows caused by the sovereign crisis. Once OMT was announced, these flows partially reversed. As liquidity started flowing in the “right direction,” counterparties’ reliance on the Eurosystem gradually declined, especially since they were given the opportunity to repay early their borrowing from three-year refinancing operations.
Box 2
BANK RELIANCE ON EUROsysTEM REFINANCING AND EURO AREA CROss-BORDER LIQUIDITy FLOWs
Intra-Eurosystem flows suggest that euro area money market functioning has improved substantially since the OMT announcement, supporting the decreasing dependence of counterparties on Eurosystem refinancing. The chart illustrates the “dependency” of the euro area banking sector on the Eurosystem in relation to intra-Eurosystem flows.
The “dependency” is derived from the net claim of a banking sector on the Eurosystem, that is to say, the difference between the sum of the banks’ accounts with the Eurosystem and the sum of refinancing provided by the Eurosystem. The change in the banking sector’s net claims is shown in the vertical axis of the chart. The euro area banking sectors are then split between those with a positive net claim or liquidity surplus (marked in blue in the chart) and those with a negative net claim or liquidity deficit (marked in red in the chart).
Intra-Eurosystem flows are the sum of a national banking sector’s transactions with the rest of the euro area that have an impact on the central bank liquidity that banks hold. The sum of intra-Eurosystem flows is shown in the horizontal axis of the chart.
In a well-functioning market, domestic banking sectors with a liquidity deficit vis-à-vis the Eurosystem (marked in red in the chart) should receive liquidity from the rest of the euro area and thereby reduce their reliance on the Eurosystem. The opposite should be true for banking sectors with a liquidity surplus (marked in blue in the chart).
From July 2011 to July 2012, intra-Eurosystem flows showed strong signs of market segmentation, with cash-rich banking sectors obtaining liquidity from the rest of the euro area and increasing their net claims on the Eurosystem (i.e. building up liquidity buffers), while other banking sectors increased their dependency on the Eurosystem’s refinancing operations, resulting in a decline in their net claims on the Eurosystem. This is consistent with the market turmoil and safe haven flows experienced at the time.

72ECBFinancial integration in EuropeApril 2014
3 THE IMPACT OF GEOGRAPHICAL sEGMENTATION OF LIQUIDITy ON VERy sHORT-TERM RATEs
With neutral liquidity conditions, very short-term rates remained close to the ECB minimum bid rate8. Since the fixed rate and full allotment was introduced in 2008, counterparties have been able to obtain, for precautionary reasons, more refinancing than they would need on aggregate to satisfy the liquidity needs arising from autonomous factors and reserve requirements. As a result, excess liquidity increased and reached historically high levels after the allotment of the two three-year long-term refinancing operations in 2011 and 2012. The EONIA was no longer anchored to the MRO rate and became volatile in the interest rate corridor. As excess liquidity reached a record high level in 2012, EONIA decreased to its lowest level, a few basis points above the ECB deposit facility rate (Chart 36).
8 Very short-term rates were steered through the weekly provision of liquidity in the MRO to a level close to the MRO minimum bid rate. In addition, the ECB’s marginal lending and deposit facilities ensured that short-term money market rates – typically overnight interbank rates – remained in a certain corridor. Finally, the averaging provision in the fulfilment of the minimum reserve requirements serves as a tool to limit fluctuations of short-term rates.
From July 2012 to October 2013, intra-Eurosystem flows showed some signs of reversal in terms of market segmentation. Following the OMT announcement, liquidity distribution in the euro area has improved, as banking sectors with a liquidity deficit benefited from intra-Eurosystem inflows (i.e. from enhanced market access), which were in turn used to reduce their dependency on Eurosystem refinancing. On the other hand, cash-rich banking sectors have taken advantage of the repayment option since January 2013 in order to decrease their net claims on the Eurosystem (i.e. reducing their liquidity buffers).
Intra-Eurosystem flows and dependency on the Eurosystem
(in percentage of NCB’s balance sheet)
40
30
20
10
0
10
20
30
40
40
30
20
10
0
10
20
30
40
-40 -30 -20 -10 0 10 20 30 40
countries with deficitcountries with surplus
banks’ net claims on the Eurosystem 1)
July 2012 - February 2014
July 2012 - February 2014
net intra-Eurosystem flows
July 2011 - July 2012
July 2011 - July 2012
Intra-Eurosystem inflows with lower dependency on Eurosystem
Intra Eurosystem outflows with higher dependency
on the Eurosystem
Source: ECB.1) (CA+DF+FTO-MRO-LTROs-MLF-ELA).

73ECB
Financial integration in EuropeApril 2014
SPECIAL FEATURE A
Charts 37 to 40 provide an overview of liquidity segmentation between four euro area member states. Counterparties in the four countries together have more liquidity than needed to cover reserve requirements. In other words, the four domestic markets experienced excess liquidity. However, the stock of excess liquidity is unevenly distributed across countries. It is larger in Germany and, to a lesser extent, France than it is in Italy or Spain. Moreover, German counterparties have a large liquidity surplus with the Deutsche Bundesbank, which is a net claim on their NCB. Counterparties’ liquidity position is more balanced with the Banque de France. The Banca d’Italia and Banco de España have a large net claim on their counterparties, reflecting the counterparties’ liquidity deficits vis-à-vis their NCBs.
This section will focus on overnight and tomorrow next repo rates as an indicator of very short-term rates in the four domestic markets. Repo rates present advantages compared to alternative short-term unsecured rates, such as EONIA, because the turnover of repo markets resisted the crisis better than unsecured markets. In addition, repo data are publicly available on
Chart 36 EONIA, ECB interest rate corridor, and excess liquidity
(in percentages; EUR billion)
-200
0
200
400
600
800
1,000
0
1
2
3
4
5
6
7
2000 2002 2004 2006 2008 2010 2012
excess liquidityeoniadeposit facility ratemarginal lending facility rateMRO rate
Source: ECB.
Chart 37 German counterparties’ position with the Eurosystem
(EUR billion)
50
0
100
150
200
250
350
300
400
450
July Aug. Oct. Nov. Jan. Feb. Apr. May July Aug. Sep. Nov. Dec. Feb.2012 2013 2014
50
0
100
150
200
250
350
300
400
450
excess liquiditynet banks’ claims against Eurosystem
Source: ECB.
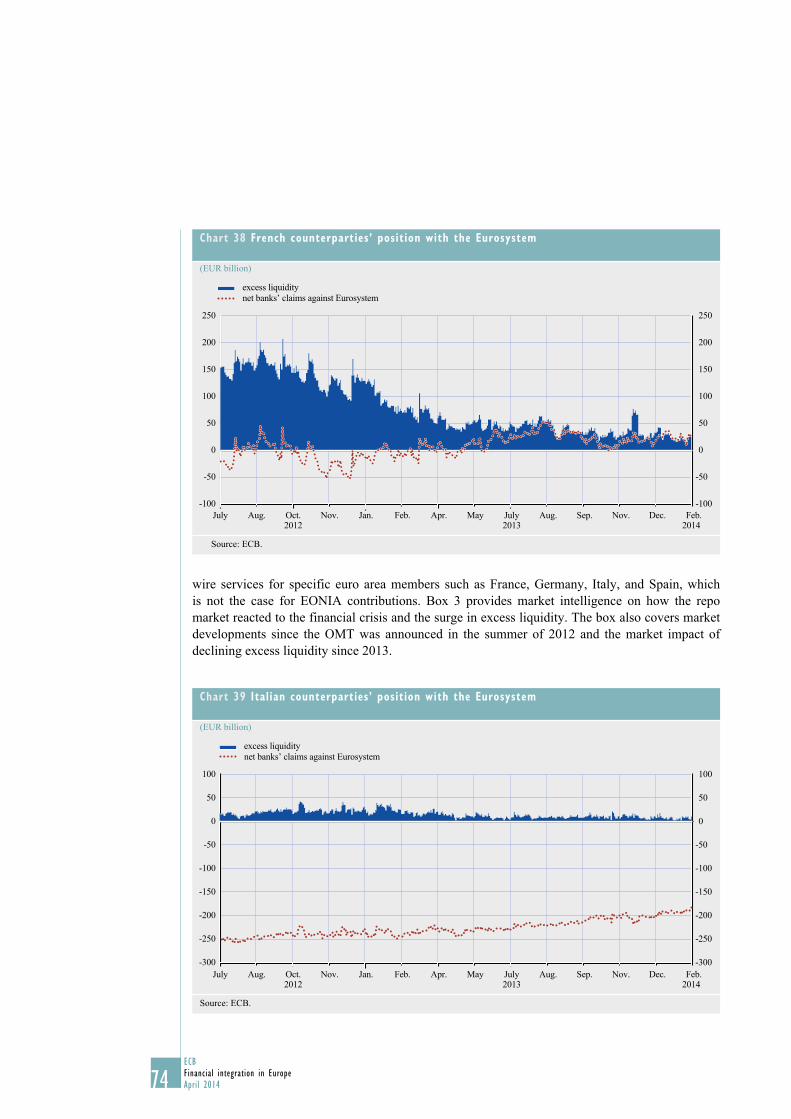
74ECBFinancial integration in EuropeApril 2014
Chart 38 French counterparties’ position with the Eurosystem
(EUR billion)
-100
-50
0
50
100
150
200
250
-100
-50
0
50
100
150
200
250
July Aug. Oct. Nov. Jan. Feb. Apr. May July Aug. Sep. Nov. Dec. Feb.2012 2013 2014
excess liquiditynet banks’ claims against Eurosystem
Source: ECB.
wire services for specific euro area members such as France, Germany, Italy, and Spain, which is not the case for EONIA contributions. Box 3 provides market intelligence on how the repo market reacted to the financial crisis and the surge in excess liquidity. The box also covers market developments since the OMT was announced in the summer of 2012 and the market impact of declining excess liquidity since 2013.
Chart 39 Italian counterparties’ position with the Eurosystem
(EUR billion)
-300
-250
-200
-150
-100
0
50
-50
100
-300
-250
-200
-150
-100
0
50
-50
100
July Aug. Oct. Nov. Jan. Feb. Apr. May July Aug. Sep. Nov. Dec. Feb.2012 2013 2014
excess liquiditynet banks’ claims against Eurosystem
Source: ECB.
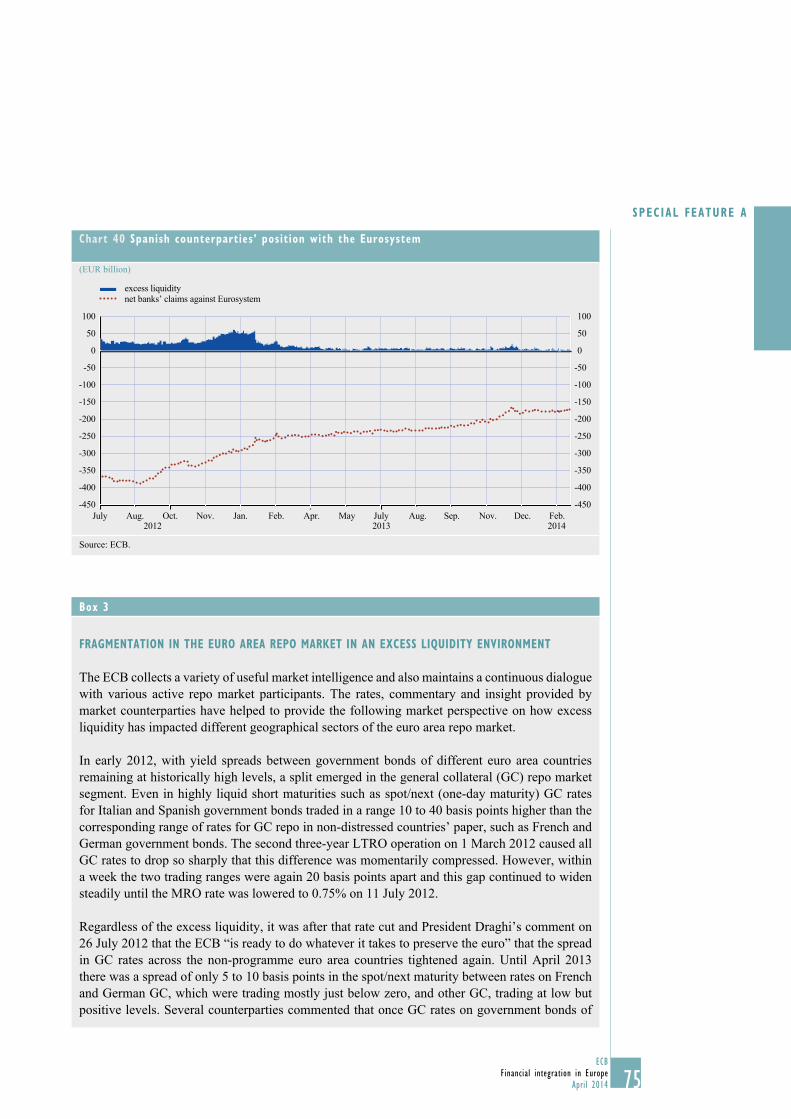
75ECB
Financial integration in EuropeApril 2014
SPECIAL FEATURE A
Box 3
FRAGMENTATION IN THE EURO AREA REPO MARKET IN AN EXCEss LIQUIDITy ENVIRONMENT
The ECB collects a variety of useful market intelligence and also maintains a continuous dialogue with various active repo market participants. The rates, commentary and insight provided by market counterparties have helped to provide the following market perspective on how excess liquidity has impacted different geographical sectors of the euro area repo market.
In early 2012, with yield spreads between government bonds of different euro area countries remaining at historically high levels, a split emerged in the general collateral (GC) repo market segment. Even in highly liquid short maturities such as spot/next (one-day maturity) GC rates for Italian and Spanish government bonds traded in a range 10 to 40 basis points higher than the corresponding range of rates for GC repo in non-distressed countries’ paper, such as French and German government bonds. The second three-year LTRO operation on 1 March 2012 caused all GC rates to drop so sharply that this difference was momentarily compressed. However, within a week the two trading ranges were again 20 basis points apart and this gap continued to widen steadily until the MRO rate was lowered to 0.75% on 11 July 2012.
Regardless of the excess liquidity, it was after that rate cut and President Draghi’s comment on 26 July 2012 that the ECB “is ready to do whatever it takes to preserve the euro” that the spread in GC rates across the non-programme euro area countries tightened again. Until April 2013 there was a spread of only 5 to 10 basis points in the spot/next maturity between rates on French and German GC, which were trading mostly just below zero, and other GC, trading at low but positive levels. Several counterparties commented that once GC rates on government bonds of
Chart 40 spanish counterparties’ position with the Eurosystem
(EUR billion)
100
50
0
-50
-100
-150
-200
-250
-300
-350
-400
-450
100
50
0
-50
-100
-150
-200
-250
-300
-350
-400
-450July Aug. Oct. Nov. Jan. Feb. Apr. May July Aug. Sep. Nov. Dec. Feb.
2012 2013 2014
net banks’ claims against Eurosystemexcess liquidity
Source: ECB.

76ECBFinancial integration in EuropeApril 2014
non-distressed countries turned negative, cash providers in the repo market started to bid for less liquid collateral from other jurisdictions in order to continue to achieve a positive return.
Another type of repo market fragmentation relates to those banks from distressed jurisdictions who attempt to trade in repo with collateral consisting of government bonds from their own sovereign. Counterparties in Italy and Spain offering their domestic government bonds as collateral have, for example, continued to quote reverse repo rates substantially above those offered by counterparties from non-distressed jurisdictions for the same collateral. Market participants considered that the correlation between the banking sectors in distressed jurisdictions and their sovereign issuers remained high, not least because some of these banks supposedly used three-year LTRO funds, inter alia, to increase their holdings of domestic government debt.
In response to this development, many repo market participants therefore reportedly either: (i) refused to trade bilaterally with counterparties in these countries and, in some cases, traded via Central Clearing Counterparties (CCPs) instead; (ii) refused to accept these counterparties’ domestic government debt as collateral; or (iii) demanded a higher initial margin and/or rate premium in return for accepting the unfavourable correlation between the risk of the counterparty and the collateral. For maturities of one month, for example, the premium for such correlation risk paid by Spanish banks offering Spanish GC appears to have been at least 10 basis points throughout 2012 and 2013.
The heightened importance of the CCPs was highlighted when Italian GC rates across all channels and maturities shifted higher in summer 2013 after risk control measures at a key CCP were updated. This development illustrates that even CCPs are not necessarily immune against the phenomenon of receding repo market liquidity when the risks of the counterparty and the collateral are correlated. Thus, risk measures at the level of individual institutions can play an important role in the propagation of liquidity shocks.
Although excess liquidity in the euro area money markets started to decline from 30 January 2013 onwards, after banks started to repay the three-year LTROs, no immediate impact on euro area repo markets was observed. Not until October 2013, when the level of excess liquidity declined significantly below EUR 200 billion, did GC repo rates and volatility in short-term GC markets start to increase. Interestingly, this shift was seen across all major euro area repo markets, leading GC rates from non-distressed jurisdictions to return to slightly positive levels again in all repo maturities.
The rest of the section is organised as follows. The first part will explore whether the reaction function of very short-term rate to excess liquidity was uniform across the four euro area jurisdictions from 2006 to 2013. The period is determined by available short-term repo rate data. The second part aims at measuring changes in the sensitivity of local short-term rates in the four jurisdictions to domestic liquidity conditions.
4 MODELLING THE RELATIONsHIP BETWEEN sHORT-TERM RATEs AND EXCEss LIQUIDITy IN THE EURO AREA ON AN AGGREGATED BAsIs
Under the assumption that liquidity flows seamlessly across euro area members, the reaction function of domestic very short-term rates to the euro area aggregated excess liquidity should

77ECB
Financial integration in EuropeApril 2014
SPECIAL FEATURE A
be very similar across countries. Differences between countries in terms of very short-term rate sensitivity to aggregate liquidity would reflect market segmentation as well as differences in the lowest levels reached by very short-term rates for high aggregated excess liquidity.
This Special Feature presents the relationship between very short-term rates and excess liquidity as a logistic function. The logistic function is a functional form commonly used in statistics. It models processes in which the dependent variable, i.e. short-term interest rate, converges to the bottom (the top) of a corridor when the explanatory variable, i.e. excess liquidity, increases (decreases). In addition, the dependent variable should hit the middle of the corridor, i.e. the MRO rate in a symmetric corridor, when the explanatory variable is zero.
VSTRt,c = DFR0 +* β0 + β0 '
1β1 ELt
et,c+*
,1+e
VSTRt,c are very short-interest rate (here overnight and tomorrow next repo rates) spreads with the ECB deposit facility rate for country c (France, Germany, Italy, and Spain) on day t9 normalised for a constant 100 basis point corridor. ELt is the aggregated excess liquidity in the euro area on a daily basis. β0 represents the rate towards which very short-term rates should converge when excess liquidity increases. Theoretically, it should be the ECB deposit facility rate. However, repo rates could move below but close to the deposit facility in particular if the collateral used is in high demandas,forinstance,Germancollateralduringthesovereigncrisis.Assuch,β0 can be slightly negative.Finally,β1 reflects the sensitivity of short-term rates to excess liquidity.10 It should be positive. The higher the coefficient, the larger the impact of a given change in excess liquidity on short-term rates will be.
Thecoefficientβ0' controls for the cut in the ECB deposit facility rate to zero. DFR0 is a dummy variable that takes the value 1 when the deposit facility rate is equal to zero. As mentioned above, very short-term rates in the repo market could move slightly below the ECB deposit facility rate for very high level of excess liquidity. However, as investors are reluctant to accept negative interest rates (even for high levels of excess liquidity) the possible negative spread between the ECB deposit facility rate and very short-term repo rates would be lower for a zero deposit facility rate.
REsULTs
The estimates show that very short-term rates in domestic markets react differently to changes in euro area excess liquidity on an aggregated basis. This could be interpreted as a sign of geographical segmentation. For the same liquidity conditions at the aggregate level, rates in some jurisdictions could be higher than others, reflecting credit risk. However, liquidity conditions are also fragmented. This alone would be enough to tilt upward the relationship in the jurisdictions experiencing less ample liquidity conditions.
Charts 41 to 43 present the estimated relationship between aggregated excess liquidity and very short-term rates between 2006 and 2013. The logistic function has the expected characteristics in terms of coefficient sign (positive). The spread between very short-term rates and the floor of the corridor is higher once the ECB deposit facility rate has been cut to zero. This explains why the
9 The regular spikes in interest rates at specific dates, such as month-end or quarter-end, have been removed from the time series. These effects are related to balance sheet presentation considerations, as some counterparties prefer to present larger cash positions at particular calendar dates.
10 The coefficient is the result of a non-linear estimate. Therefore, it could change with the level of excess liquidity and could not be interpreted as a constant elasticity.

78ECBFinancial integration in EuropeApril 2014
curves on charts 9 to 11 are split as excess liquidity increases, reflecting different levels of spread convergence depending on whether the ECB deposit facility was larger or equal to zero.
Chart 41 compares the estimates for France and Germany. The German curve is taken as a benchmark as German short-term rates show the highest sensitivity to excess liquidity and converge toward the lowest levels. The relationship for France and Germany appears very similar; their sensitivity to excess liquidity is practically the same. However, German rates have tended to converge toward lower levels than French rates since the ECB deposit facility rate was cut to zero.
Charts 42 and 43 compare the German curve with the Italian and Spanish ones. The sensitivity appears noticeably lower, meaning that very short-term rates tend to move less in Italy and Spain than in Germany for any change in the aggregated excess liquidity. The convergence rate also appears higher, suggesting that the same levels of excess liquidity did not push short-term rates as low in Italy and Spain as in Germany. In fact, excess liquidity remained concentrated in Germany and, to a lesser extent,
Chart 41 Relationship of excess liquidity to short-term rate, 2006-2013
-0.2
-0.1
0.0
0.1
0.2
0.3
0.4
0.5
0.6
0.7
0.8
0.9
-0.2
-0.1
0.0
0.1
0.2
0.3
0.4
0.5
0.6
0.7
0.8
0.9
Average Excess liquidity in France
Average Excess liquidity in Germany
y-axis: repo rate spread to deposit facility normalized by the size of the corridor
x-axis: excess liquidity in EUR billions
FranceGermany
-100 0 100 200 300 400 500 600 700 800 900
Sources: ECB, MTS, and BrokerTec.
Chart 42 Relationship of excess liquidity to short-term rate, 2006-2013
-0.2
-0.1
0.0
0.1
0.2
0.3
0.4
0.5
0.6
0.7
0.8
0.9
-0.2
-0.1
0
0.1
0.2
0.3
0.4
0.5
0.6
0.7
0.8
0.9
0.0
0.8
-100 1000 200 300 400 500 600 700 800 900
Average Excess liquidity in Italy
Average Excess liquidity in Germany
y-axis: repo rate spread to deposit facility normalized by the size of the corridor
x-axis: excess liquidity in EUR billions
ItalyGermany
Sources: ECB, MTS, and BrokerTec.
Chart 43 Relationship of excess liquidity to short-term rate, 2006-2013
-0.2
-0.1
0.0
0.1
0.2
0.3
0.4
0.5
0.6
0.7
0.8
0.9
-0.2
-0.1
0.0
0.1
0.2
0.3
0.4
0.5
0.6
0.7
0.8
0.9
SpainGermany
y-axis: x-axis:
repo rate spread to deposit facility normalized by the size of the corridor
excess liquidity in EUR billions
-100 0 100 200 300 400 500 600 700 800 900
Average Excess liquidity in Spain
Average Excess liquidity in Germany
Sources: ECB, Banco de Espana.

79ECB
Financial integration in EuropeApril 2014
SPECIAL FEATURE A
in France, as reflected by the respective average excess liquidity between 2006 and 2013. As a result, higher short-term rates in the corridor have been able to persist in Italy and Spain because of the liquidity segmentation and limited arbitrage across jurisdictions.
5 MODELLING THE RELATIONsHIP BETWEEN VERy sHORT-TERM RATEs AND EXCEss LIQUIDITy IN DOMEsTIC MARKETs
Under the assumption that liquidity flows seamlessly across euro area members states, local very short-term rates should not react to domestic liquidity shocks due to autonomous factors. An increase in the sensitivity of local short-term rates to domestic liquidity conditions could be interpreted as a sign of the geographical segmentation of excess liquidity.
To model the relationship between very short-term rates and domestic liquidity, the same logistic function presented above is used. Unlike before, euro area aggregated excess liquidity is replaced with the excess liquidity reported by the four NCBs (Banco de España, Banque de France, Banca d’ItaliaandDeutscheBundesbank).Thistime,however,thecoefficientβ1 is estimated by rolling the model over the period on a 300-day basis with a step of one day. As result, a time series of the coefficient is produced, which indicates how the sensitivity of local very short-term rates to domestic excess liquidity has evolved through time. Charts 44 to 47 plot the coefficients from 2006 to 2013 along with the confidence interval of the estimates.
From 2006 to October 2008, the influence of domestic excess liquidity on very short-term rates is zero. During this period, the Eurosystem applied a neutral liquidity allotment to steer very short-term rates close to its main refinancing operation minimum bid rate. The Eurosystem managed to keep liquidity conditions neutral at the euro area aggregated level and very short-term rates in euro area jurisdictions close to its reference rate. This could be considered a reflection of market functioning in normal times.
Chart 44 short-term rate sensitivity to excess liquidity in Germany
-0.00006
-0.00004
-0.00002
0.0
0.00002
0.00004
0.00006
0.00008
0.00010
0.00012
0.00014
-0.00006
-0.00004
-0.00002
0.0
0.00002
0.00004
0.00006
0.00008
0.00010
0.00012
0.00014
Fixed rate full allotment LTRO2 OMT announcement
Apr. Oct. Apr. Oct. Apr. Oct. Apr. Oct. Apr. Oct. Apr. Oct. Apr. Oct.Oct.2006 2007 2008 2009 2010 2011 2012 2013
95% confidence intervalsensitivity of very short-term rate to local excess liquidity
Source: ECB.

80ECBFinancial integration in EuropeApril 2014
The coefficient picked up sharply after the introduction of the fixed rate and full allotment in 2008 in all four countries. The market experienced several bouts of tension and liquidity conditions departed from neutral, with limited but volatile excess liquidity. The sensitivity of local very short-term rates to domestic liquidity increased the most in countries under financial stress and with limited excess liquidity, such as Italy (Chart 46) and Spain (Chart 47). The sensitivity of very short-term rates to domestic liquidity increased as counterparties accumulated precautionary liquidity buffers, leading to a generalised decline in very short-term rates on the market. The sensitivity of very short-term rates to domestic liquidity declined again in 2010 as some form of normality
Chart 45 short-term rate sensitivity to excess liquidity in France
-0.00006
-0.00004
-0.00002
0.0
0.00002
0.00004
0.00006
0.00008
0.00010
0.00012
0.00014
-0.00006
-0.00004
-0.00002
0.0
0.00002
0.00004
0.00006
0.00008
0.00010
0.00012
0.00014
Oct.2006 2007 2008 2009 2010 2011 2012 2013
Apr. Oct. Apr. Oct. Apr. Oct. Apr. Oct. Apr. Oct. Apr. Oct. Apr. Oct.
Fixed rate fullallotment
OMT announcementLTRO 2
95% confidence intervalsensitivity of very short-term rate to local excess liquidity
Source: ECB.
Chart 46 short-term rate sensitivity to excess liquidity in Italy
-0.00006
-0.00004
-0.00002
0.0
0.00002
0.00004
0.00006
0.00008
0.00010
0.00012
0.00014
-0.00006
-0.00004
-0.00002
0.0
0.00002
0.00004
0.00006
0.00008
0.00010
0.00012
0.00014
Fixed rate fullallotment
OMT announcementLTRO 2
Oct.2006
Apr.2007
Oct. Apr.2008
Oct. Apr.2009
Oct. Apr.2010
Oct. Apr.2011
Oct. Apr. Oct.2012
Apr.2013
Oct.
95% confidence intervalsensitivity of very short-term rate to local excess liquidity
Source: ECB.

81ECB
Financial integration in EuropeApril 2014
SPECIAL FEATURE A
prevailed in euro area markets. The rate sensitivity to domestic liquidity increased again with the sovereign crisis.
More revealing about liquidity segmentation is the contrast between German and French very short-term rate reactions to domestic liquidity compared to Italian and Spanish rates.
• On one hand, the very short-term rate sensitivity to domestic liquidity declined to zero in France and Germany soon after the allotment of the second three-year refinancing operation in March 2012 as their domestic markets became saturated with excess liquidity. The decline in excess liquidity since January 2013 due to the repayments seems to have resulted in an increase in both German and French very-short term rates sensitivity to changes in excess liquidity at the very end of the period under review (Chart 44 and 45).
• On the other hand, the very short-term rate sensitivity to domestic liquidity remained elevated in Spain and Italy after the allotment of the two three-year operations (Charts 46 and 47). The coefficient gradually declined in both countries and reached a low point during the second half of 2012 after the OMT announcement, supporting the assumption that the OMT presence supported market normalisation. In both cases, however, the coefficient remained significantly above zero despite the prevailing high level of excess liquidity on an aggregated basis, reflecting tighter liquidity conditions compared to other euro area jurisdictions. Overall, Italian very short-term rates appear slightly more sensitive to local liquidity conditions than Spanish ones (Chart 46) despite a comparable liquidity deficit with the Eurosystem.
In Italy, very short-term rates’ sensitivity to domestic liquidity is boosted by structurally higher autonomous factor shocks. Charts 48 to 51 show the distribution of absolute changes in autonomous factors scaled by the size of each NCB’s balance sheet from 2006 to 2013. The size and frequency of autonomous factor shocks are structural matters related, for instance, to each National Treasury liquidity management practices and net financial asset management practices. The impact on
Chart 47 short-term rate sensitivity to excess liquidity in spain
0.00006
0.00004
0.00002
0.0
0.00002
0.00004
0.00006
0.00008
0.00010
0.00012
0.00014
0.00006
0.00004
0.00002
0.0
0.00002
0.00004
0.00006
0.00008
0.00010
0.00012
0.00014
Fixed rate full allotment
OMT announcementLTRO 2
2006 2007 2008 2009 2010 2011 2012 2013
95% confidence intervalsensitivity of very short-term rate to local excess liquidity
Oct. Apr. Oct. Apr. Oct. Apr. Oct. Apr. Oct. Apr. Oct. Apr. Oct. Apr. Oct.
Source: ECB.
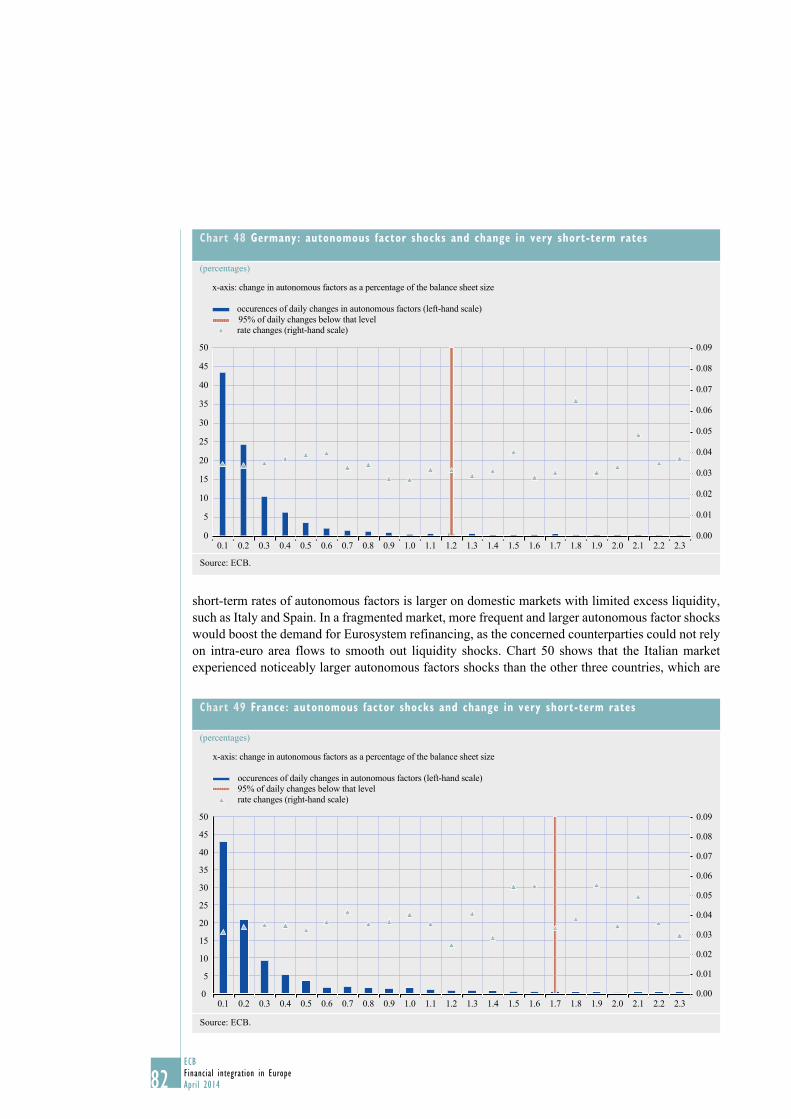
82ECBFinancial integration in EuropeApril 2014
short-term rates of autonomous factors is larger on domestic markets with limited excess liquidity, such as Italy and Spain. In a fragmented market, more frequent and larger autonomous factor shocks would boost the demand for Eurosystem refinancing, as the concerned counterparties could not rely on intra-euro area flows to smooth out liquidity shocks. Chart 50 shows that the Italian market experienced noticeably larger autonomous factors shocks than the other three countries, which are
Chart 48 Germany: autonomous factor shocks and change in very short-term rates
(percentages)
0.00
0.01
0.02
0.03
0.04
0.05
0.06
0.07
0.08
0.09
0
5
10
15
20
25
30
35
40
45
50
0.1 0.2 0.3 0.4 0.5 0.6 0.7 0.8 0.9 1.0 1.1 1.2 1.3 1.4 1.5 1.6 1.7 1.8 1.9 2.0 2.1 2.2 2.3
occurences of daily changes in autonomous factors (left-hand scale)95% of daily changes below that levelrate changes (right-hand scale)
x-axis: change in autonomous factors as a percentage of the balance sheet size
Source: ECB.
Chart 49 France: autonomous factor shocks and change in very short-term rates
(percentages)
0.09
0.08
0.07
0.06
0.05
0.04
0.02
0.03
0.01
0.00
95% of daily changes below that levelrate changes (right-hand scale)
occurences of daily changes in autonomous factors (left-hand scale)
x-axis: change in autonomous factors as a percentage of the balance sheet size
0.1 0.30.2 0.60.50.4 0.7 0.8 1.00.9 1.1 1.2 1.3 1.4 1.5 1.6 1.7 1.8 2.01.9 2.1 2.2 2.3
50
45
40
35
30
25
20
15
10
5
0
Source: ECB.
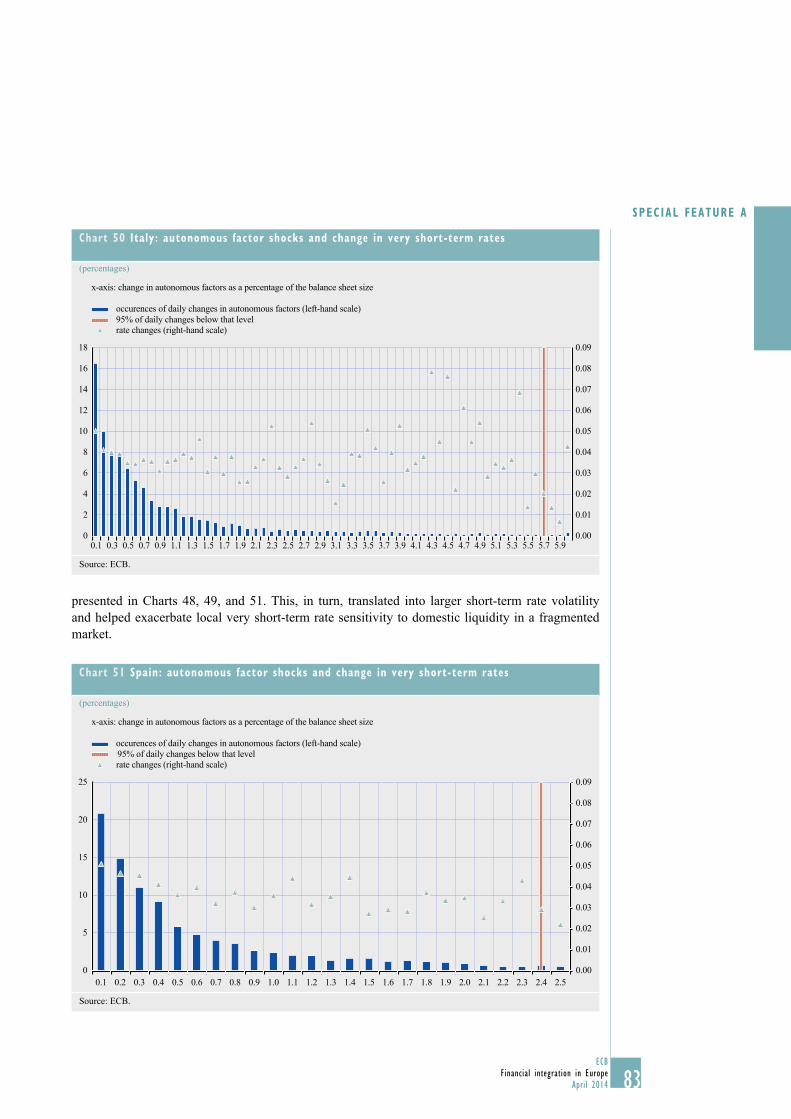
83ECB
Financial integration in EuropeApril 2014
SPECIAL FEATURE A
presented in Charts 48, 49, and 51. This, in turn, translated into larger short-term rate volatility and helped exacerbate local very short-term rate sensitivity to domestic liquidity in a fragmented market.
Chart 50 Italy: autonomous factor shocks and change in very short-term rates
(percentages)
0.00
0.01
0.02
0.03
0.04
0.05
0.06
0.07
0.08
0.09
0
2
4
6
8
10
12
14
16
18
0.1 0.3 0.5 0.7 0.9 1.1 1.3 1.5 1.7 1.9 2.1 2.3 2.5 2.7 2.9 3.1 3.3 3.5 3.7 3.9 4.1 4.3 4.5 4.7 4.9 5.1 5.3 5.5 5.7 5.9
x-axis: change in autonomous factors as a percentage of the balance sheet size
occurences of daily changes in autonomous factors (left-hand scale)95% of daily changes below that levelrate changes (right-hand scale)
Source: ECB.
Chart 51 spain: autonomous factor shocks and change in very short-term rates
(percentages)
0.00
0.01
0.02
0.03
0.04
0.05
0.06
0.07
0.08
0.09
0
5
10
15
20
25
0.1 0.2 0.3 0.4 0.5 0.6 0.7 0.8 0.9 1.0 1.1 1.2 1.3 1.4 1.5 1.6 1.7 1.8 1.9 2.0 2.1 2.2 2.3 2.4 2.5
occurences of daily changes in autonomous factors (left-hand scale)95% of daily changes below that levelrate changes (right-hand scale)
x-axis: change in autonomous factors as a percentage of the balance sheet size
Source: ECB.

84ECBFinancial integration in EuropeApril 2014
6 CONCLUsION
Intra-euro area liquidity flows have only offset to some extent the country-specific liquidity shocks that regularly affect member states’ domestic markets. In other words, euro area markets currently do not fully effectively reallocate central bank liquidity from counterparties with a liquidity surplus to counterparties with liquidity needs. The sovereign crisis appears to have contributed to the emergence of a geographically segmented liquidity market along national borders. Accordingly, the intermediation of the Eurosystem increased and to some extent replaced the market. The substitution was helped by some temporary changes in the Eurosystem liquidity management framework, in particular by the introduction of tenders with fixed rate and full allotment.
Liquidity segmentation increased the sensitivity of domestic very short-term rates to local liquidity developments in euro area members states. This is a clear departure from before the financial crisis, when very short-term rates across the euro area were steered close to the Eurosystem policy rate with little or no difference between member states. Furthermore, domestic liquidity shocks have been more important in determining the volatility of short-term rates.
Recent data indicate that liquidity segmentation is receding. Since the announcement of OMT, central liquidity has been flowing more in the direction of jurisdictions with a liquidity deficit, reflecting a gradual normalisation of market functioning. However, the decline in excess liquidity associated with persisting, albeit receding, segmentation could help maintain some very short-term rate sensitivity to domestic liquidity, especially in the euro area member states that are the more prone to domestic liquidity shocks.
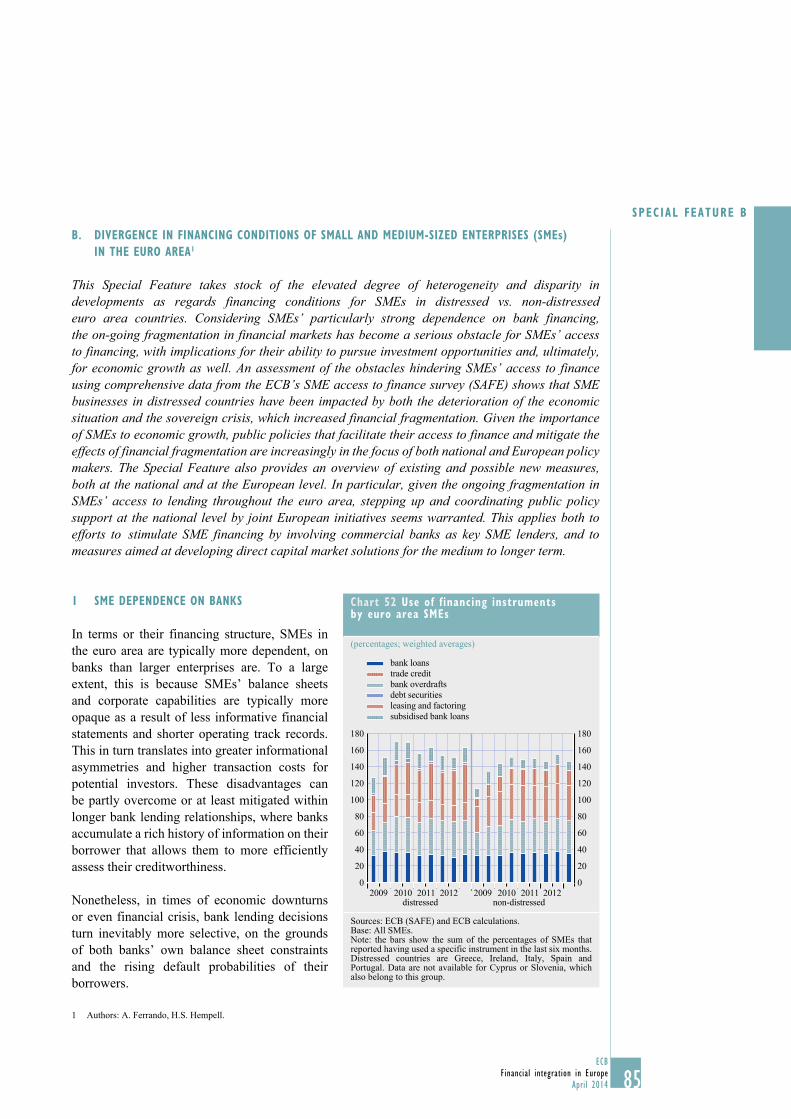
85ECB
Financial integration in EuropeApril 2014
SPECIAL FEATURE b
B. DIVERGENCE IN FINANCING CONDITIONs OF sMALL AND MEDIUM-sIZED ENTERPRIsEs (sMEs) IN THE EURO AREA1
This Special Feature takes stock of the elevated degree of heterogeneity and disparity in developments as regards financing conditions for SMEs in distressed vs. non-distressed euro area countries. Considering SMEs’ particularly strong dependence on bank financing, the on-going fragmentation in financial markets has become a serious obstacle for SMEs’ access to financing, with implications for their ability to pursue investment opportunities and, ultimately, for economic growth as well. An assessment of the obstacles hindering SMEs’ access to finance using comprehensive data from the ECB’s SME access to finance survey (SAFE) shows that SME businesses in distressed countries have been impacted by both the deterioration of the economic situation and the sovereign crisis, which increased financial fragmentation. Given the importance of SMEs to economic growth, public policies that facilitate their access to finance and mitigate the effects of financial fragmentation are increasingly in the focus of both national and European policy makers. The Special Feature also provides an overview of existing and possible new measures, both at the national and at the European level. In particular, given the ongoing fragmentation in SMEs’ access to lending throughout the euro area, stepping up and coordinating public policy support at the national level by joint European initiatives seems warranted. This applies both to efforts to stimulate SME financing by involving commercial banks as key SME lenders, and to measures aimed at developing direct capital market solutions for the medium to longer term.
1 sME DEPENDENCE ON BANKs
In terms or their financing structure, SMEs in the euro area are typically more dependent, on banks than larger enterprises are. To a large extent, this is because SMEs’ balance sheets and corporate capabilities are typically more opaque as a result of less informative financial statements and shorter operating track records. This in turn translates into greater informational asymmetries and higher transaction costs for potential investors. These disadvantages can be partly overcome or at least mitigated within longer bank lending relationships, where banks accumulate a rich history of information on their borrower that allows them to more efficiently assess their creditworthiness.
Nonetheless, in times of economic downturns or even financial crisis, bank lending decisions turn inevitably more selective, on the grounds of both banks’ own balance sheet constraints and the rising default probabilities of their borrowers.
1 Authors: A. Ferrando, H.S. Hempell.
Chart 52 Use of financing instruments by euro area sMEs
(percentages; weighted averages)
0
20
40
60
80
100
120
140
160
180
2009 2010 2011 2012 2009 2010 2011 20120
20
40
60
80
100
120
140
160
180
distressed non-distressed
bank loans
bank overdrafts
leasing and factoring
trade credit
debt securities
subsidised bank loans
Sources: ECB (SAFE) and ECB calculations.Base: All SMEs.Note: the bars show the sum of the percentages of SMEs that reported having used a specific instrument in the last six months. Distressed countries are Greece, Ireland, Italy, Spain and Portugal. Data are not available for Cyprus or Slovenia, which also belong to this group.

86ECBFinancial integration in EuropeApril 2014
As SMEs are typically perceived to have a higher probability of default than larger firms and, additionally, to be more informationally opaque, they are more likely than larger firms to be penalised by banks in times of heightened bank risk aversion. In addition, it is predominantly larger firms that have the option of substituting alternative sources of financing, in particular debt issuance, for bank lending. For SMEs, by contrast, trade credit, leasing and factoring are closer substitutes for bank loans (see Chart 52). As these latter alternative financing sources are, however, closely related to the SMEs’ business activity, the potential for substitution may largely be constrained by a decline in turnover levels; this applies specifically to SMEs located in distressed countries.
2 sME BANK FINANCING CONDITIONs ACROss EURO AREA MEMBER sTATEs
The increased heterogeneity in SME bank financing conditions across euro area member states in recent years is presented by drawing on data from the ECB’s SME access to finance survey (SAFE)2 and from MFI interest rate statistics. More specifically, comparing the interest rates charged on small loans (serving as a proxy for SME loans) across countries reveals considerable differences across countries, with rates substantially higher for SMEs in distressed countries as compared to other countries. Likewise, an indicator of the obstacles faced in obtaining bank loans constructed on the basis of the SAFE results suggests substantially higher financing obstacles for SMEs domiciled in distressed countries than for SMEs located in other euro area countries. These aggregate country data suggest, particularly for SMEs located in distressed countries, that their financing conditions are likely influenced not only by borrowers’ risk but also by domestic sovereign spreads and domestic macroeconomic weaknesses.
EVIDENCE FROM BANK LENDING RATEs
To assess the difference in bank financing conditions faced by SMEs as compared to larger firms, differences in bank lending rates for smaller firms and larger firms provide the first useful indications. More specifically, this difference may be approximated by the spread between bank lending rates charged for small loans and larger loans, with small loans (i.e. the category of loans up to 1 million euro) serving as a rough proxy for SME loans.
Indeed, this comparison reveals a substantial increase in this spread for the euro area beginning with start of the financial crisis in 2008-2009. Followed by some improvements in 2010, the spread rose again in the course of 2011, remaining at elevated levels throughout the last two years (see Chart 53a). At the same time, there was an increasing divergence across countries, with rates substantially higher for SMEs in distressed countries as compared to other countries. Hence, in distressed countries, not only was the absolute level of lending rates for loans to enterprises substantially higher than it was for firms in non-distressed countries, but the premia SMEs had to pay on top of the rates charged for larger enterprises had additionally increased over the respective time period. This increase in divergence across countries was particularly pronounced from 2011 to 2012, likely reflecting the particular impact of the sovereign debt crisis on banks’ financing costs in distressed countries, which they passed through to their SME customers. Only in the last quarter of 2013, the spread for SMEs in distressed countries started to decline. This is likely to reflect an overall improvement in the economic environment and outlook in some of these countries also displayed in replies to the BLS concerning banks’ risk perceptions for SMEs described further below.
2 See http://www.ecb.europa.eu/stats/money/surveys/sme/html/index.en.html

87ECB
Financial integration in EuropeApril 2014
SPECIAL FEATURE b
As a €1 million threshold is in some respects considered too high for approximating loans to SMEs, Chart 53b) provides the respective development for spreads between lending rates for very small loans of up to €0.25 million and the rates for loans of above €1 million. These data are available starting in mid-2010, and spreads approximating SME loans by very small loans of up to €0.25 million instead of up to €1 million, against the rate for loans of above €1 million, display a similar pattern, with spreads increasing noticeably on loans to SMEs domiciled in distressed countries, albeit at higher overall levels. These higher levels are likely to reflect generally higher risk premia charged for smaller and more opaque customers. As for the spreads for small loans up to a €1 million threshold, the spread for very small loans of up to €0.25 million in distressed countries started to decline notably in the last quarter of 2013 likely reflecting an improved economic outlook in some of these countries.
The extent to which these increasing spreads reflect a stronger increase in credit risk associated with smaller firms as compared to larger firms in an environment of macro-economic stress and sovereign debt tensions is generally difficult to assess with the available aggregate time series. Nonetheless, empirical evidence on the interest rate pass-through for overall loans to non-financial corporations suggest that, for distressed countries, macroeconomic risk and borrower risk, as well as of sovereign spreads, contributed significantly to the increase in corporate lending rates between the first quarter of 2011 and the first quarter of 2013.3 These contributions partly counterbalanced the impact of declining market reference rates. Hence, this suggests that macroeconomic risk and borrower risk, as well as financial fragmentation, play an important role in the divergence of lending rates across distressed and non-distressed euro area countries, likewise impacting lending conditions for SMEs more specifically.
3 See article on “Assessing the retail bank interest rate pass-through in the euro area at times of financial fragmentation”, Monthly Bulletin, ECB, August 2013, pp. 89.
Chart 53 spread between bank lending rates on (very) small and larger loans to enterprises across distressed and non-distressed euro area countries(basis points; three-month moving averages)
euro area*distressednon-distressed
a) Spread between small and large loans b) Spread between very small and large loans
2003 2005 2007 2009 2011 20130
50
100
150
200
250
0
50
100
150
200
250
100
120
140
160
180
200
220
240
260
280
100
120
140
160
180
200
220
240
260
280
June Dec. June Dec. June Dec. June Dec.2010 2011 2012 2013
Source: ECB.Notes: “distressed” countries are Ireland, Greece, Spain, Italy, Cyprus, Portugal and Slovenia. Small loans are loans of up to €1 million, while large loans are those above €1 million. Aggregation is based on new business volumes. * The euro area series is calculated as weighted average of country spreads.

88ECBFinancial integration in EuropeApril 2014
Likewise, the importance of credit risk considerations as determining factors for the tightening of credit standards is indicated by survey evidence from the Eurosystem’s bank lending survey (BLS) (see Chart 54). Among these factors, banks’ risk perceptions were dominated by deteriorations in the general economic outlook as well as in firm- and industry-specific risks. According to these data, respective credit risk factors have been substantially more pronounced for SMEs in distressed countries as compared to non-distressed countries. These differences were particularly pronounced as the financial crisis and the sovereign debt crisis were peaking, with risk perceptions levelling off more or less in parallel in the course of 2013.
EVIDENCE FROM THE sME ACCEss TO FINANCE sURVEy (sAFE)
The SME access to finance survey (SAFE) is an important source for assessing the financing obstacles of euro area SMEs. In particular, the information on the application and the outcome of applications for bank loans (and bank overdraft) is an important and rather objective criterion for assessing whether SMEs have been constrained in taking up external financing via banks.
Chart 55 reports a composite indicator of financing obstacles for distressed and non-distressed euro area countries.4 This includes the percentages of SMEs that were rejected when applying for a bank loan, received only a limited part of the amount for which they had applied, or did not take up the loan because borrowing cost were too high. In addition, firms that did not apply for a bank loan because they feared rejection (discouraged borrowers), possibly based on the firm’s past experience, are also included.
4 In this section the distressed countries are Greece, Ireland, Italy, Spain and Portugal. Data are not available for Cyprus or Slovenia.
Chart 54 Banks’ risk perceptions for sMEs as factors contributing to a tightening of credit standards(net percentages)
-20
0
20
40
60
80
-10
10
30
50
70
90
-40
-20
0
20
40
60
80
100
120
140
160
180
2009 2010 2011 2012 2013
general economic outlook
industry and firm specific outlookrisk on collateral demanded
compound risk perceptions for SMEs (right-hand scale)
a) distressed b) non-distressed
-20
0
20
40
60
80
-10
10
30
50
70
90
-40
-20
0
20
40
60
80
100
120
140
160
180
2009 2010 2011 2012 2013
general economic outlook
industry and firm specific outlookrisk on collateral demanded
compound risk perceptions for SMEs (right-hand scale)
-20
0
20
40
60
80
-10
10
30
50
70
90
-40
-20
0
20
40
60
80
100
120
140
160
180
2009 2010 2011 2012 2013
Sources: Eurosystem Bank Lending Survey (BLS); ECB calculations.Note: Compound risk perceptions calculated as averages across the three risk factors (general economic outlook, industry and firm specific outlook, risk on collateral demanded).

89ECB
Financial integration in EuropeApril 2014
SPECIAL FEATURE b
Since the beginning of the survey, on average, 16% of SMEs in distressed countries have reported financing obstacles. For non-distressed countries, the percentage is around 9%. The level and pattern of financing obstacles have been quite heterogeneous between the two groups of countries, with SMEs in distressed countries suffering a more volatile pattern.5 Looking at the latest survey, which refers to the period from April to September 2013, it can be seen that the percentage of SMEs that did not apply because of a possible rejection (8% in distressed countries and 6% in non-distressed ones) appears relatively significant in relation to the actual loan rejections (4% of all SMEs in the first group, compared with 2% in the second one), and the percentages are quite high in distressed countries with respect to non-distressed countries. At the same time, it needs to be kept in mind that a considerable percentage of SMEs did not apply because of sufficient internal funds (47% of all SMEs in the euro area) or for other reasons (21%).
3 ROLE OF FINANCIAL AND NON-FINANCIAL FIRM CHARACTERIsTICs
As seen in the previous section, the level and pattern of financing obstacles faced by SMEs have not been homogeneous across distressed and non-distressed countries. Chart 56 shows the percentages of firms reporting a deterioration in a set of factors affecting the availability of external financing between distressed and non-distressed countries. These factors are related to the credit history of the firms, their own capital, and the firms’ outlook in terms of sales, profitability and business plans. Considering external factors, the survey includes the question about the impact of the general economic activity as perceived by firms and the importance of the access to public support, including guarantees. More firms in distressed countries have reported that the deterioration of these factors have an impact on the availability of external financing. More than 50% of the respondents in distressed countries argued that the general economic outlook is an important factor, followed by their financial situation (35%). For firms in non-distressed countries, the percentages are lower, at 37% and 24%, respectively. Firms’ credit histories play a more important role for firms in distressed countries (21%) than in non-distressed ones (10%), reflecting differences in underlying credit risk.
The development of these factors over time closely follows the different phases of the sovereign debt crisis (Chart 56). In particular, firms reported a drop in the impact of the deterioration of these factors in the survey referring to the period April to September 2012, which includes the period of
5 For example, in the last ECB survey wave (referring to the period from April to September 2013) financing obstacles were reported by SMEs to be very high in Greece, Ireland, Spain and the Netherlands (with around 20% of participating firms encountering obstacles), more moderate in Belgium and Portugal (around 10%) and lowest in Germany, Finland and Austria (around 4%), reflecting the considerable heterogeneity in borrowing conditions.
Chart 55 Financing obstacles of sMEs to receiving a bank loan in distressed and non-distressed countries(percentages)
0
5
10
15
20
25
0
5
10
15
20
25
2010 2011 2012 2010 2011 2012distressed non-distressed
rejectedcost too highlimited partdiscouraged
Sources: ECB (SAFE) and ECB calculations. Base: All SMEs. Notes: Financing obstacles are defined as the sum of the percentages of SMEs that applied for a bank loan, but were rejected, received only a limited part of the amount for which they had applied, or did not take up the loan because borrowing cost were too high. In addition, it includes the percentage of SMEs that did not apply because of fear of rejection (discouraged borrowers).
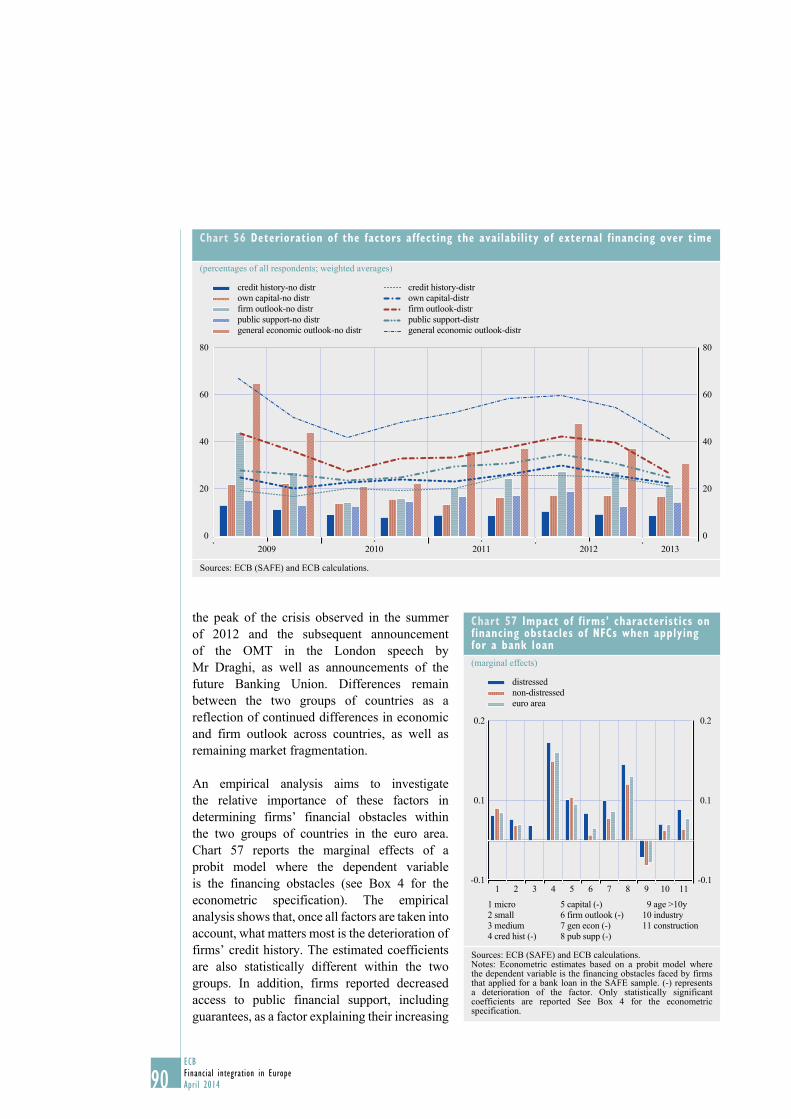
90ECBFinancial integration in EuropeApril 2014
the peak of the crisis observed in the summer of 2012 and the subsequent announcement of the OMT in the London speech by Mr Draghi, as well as announcements of the future Banking Union. Differences remain between the two groups of countries as a reflection of continued differences in economic and firm outlook across countries, as well as remaining market fragmentation.
An empirical analysis aims to investigate the relative importance of these factors in determining firms’ financial obstacles within the two groups of countries in the euro area. Chart 57 reports the marginal effects of a probit model where the dependent variable is the financing obstacles (see Box 4 for the econometric specification). The empirical analysis shows that, once all factors are taken into account, what matters most is the deterioration of firms’ credit history. The estimated coefficients are also statistically different within the two groups. In addition, firms reported decreased access to public financial support, including guarantees, as a factor explaining their increasing
Chart 56 Deterioration of the factors affecting the availability of external financing over time
(percentages of all respondents; weighted averages)
80
0
20
40
80
60
0
20
40
60
2009 2010 2011 2012 2013
credit history-distrown capital-distrfirm outlook-distrpublic support-distrgeneral economic outlook-distr
credit history-no distrown capital-no distrfirm outlook-no distr public support-no distrgeneral economic outlook-no distr
Sources: ECB (SAFE) and ECB calculations.
Chart 57 Impact of firms’ characteristics onfinancing obstacles of NFCs when applying for a bank loan(marginal effects)
0.2
-0.1
0.1
0.2
-0.1
0.1
1 2 3 4 5 6 7 8 9 10 11
1 micro2 small3 medium4 cred hist (-)
5 capital (-)6 firm outlook (-) 7 gen econ (-)8 pub supp (-)
9 age >10y10 industry11 construction
distressednon-distressedeuro area
Sources: ECB (SAFE) and ECB calculations.Notes: Econometric estimates based on a probit model where the dependent variable is the financing obstacles faced by firms that applied for a bank loan in the SAFE sample. (-) represents a deterioration of the factor. Only statistically significant coefficients are reported See Box 4 for the econometric specification.

91ECB
Financial integration in EuropeApril 2014
SPECIAL FEATURE b
difficulty in obtaining bank loans. However, the estimated coefficients are not different among the two groups. Micro firms (up to 10 employees) and small firms (up to 50 employees) face a higher probability of encountering financing obstacles than large firms. The age of the firm also matters, as younger firms are more likely to face financing obstacles than older firms.
Box 4
AN EMPIRICAL ANALysIs OF THE FACTORs AFFECTING sME FINANCING OBsTACLEs IN DIsTREssED AND NON-DIsTREssED COUNTRIEs
The probability of firms facing financing obstacles is modelled as a linear function of the characteristics available from the survey data.1
where ‘Finance_Obstacles’ are the responses by firm i in country-group k, at time t that faces actual financing obstacles. ‘FirmCharacteristic’ is a vector of variables related to major firm attributes (e.g. firm size, sectoral dummies and firm age). ‘FirmFinancialfactors’ is the set of factors that summarises the financial conditions of the firm as well as the perceptions of risk related to general economic conditions. ‘Country’ is a vector of country dummies to control for country-specific impacts on firms’ responses when the analysis is run for the euro area as a whole. Given that the dependent variable is dichotomous, the equation is estimated using a
1 See for instance, A. Ferrando and N. Griesshaber (2011), “Financing obstacles among euro area firms: who suffers the most”. ECB WP 1293 and A. Ferrando and K. Mulier (2013), “Firms’ financing constraints: do perceptions match the actual situation?” ECB WP 1577.
Finance_Obstaclesi,k,t= k
kk∑
jj∑θ country + Φ (FirmCharacteristicj)i,k,t
jj∑Φ+ j(FirmFinacialf actors) i,k,t i,k,t+ u
Table A
distr=1 distr==0 Statistical difference distressed non-distressed euro area distressed/non-distressed
Micro 0.0313*** 0.0400*** 0.0345*** Yes Small 0.0264** 0.0186*** 0.0196*** No Medium 0.0185* 0.0009 0.0082 No Cred hist (-) 0.1222*** 0.0990*** 0.1103*** Yes Capital (-) 0.0505*** 0.0540*** 0.0451*** Yes Firm outlook (-) 0.0341*** 0.0068* 0.0152*** Yes Gen econ (-) 0.0500*** 0.0273*** 0.0358*** No Pub supp (-) 0.0950*** 0.0704*** 0.0798*** No Age >10y -0.0218*** -0.0316*** -0.0285*** Yes
Sector dummies Yes Yes Yes Wave dummies Yes Yes Yes
Observations 25,348 29,240 54,588 Pseudo-R^2 9% 10% 12%
Robust standard errors in parentheses*** p<0.01, ** p<0.05, * p<0.1Note: the statistical difference between the estimated coefficients of distressed and non-distressed countries is based on a t-test.

92ECBFinancial integration in EuropeApril 2014
4 POLICy INITIATIVEs TO PROMOTE sME FINANCING IN THE EURO AREA
As described in the previous section, SMEs are – particularly in crisis periods and during prolonged recessions – prone to experiencing great difficulty in obtaining funding. A mutually reinforcing destabilisation resulting from structurally stronger impediments to SMEs’ access to finance and banks’ higher risk aversion would justify stepping up policies to support SMEs. As a result, several euro area governments have introduced additional measures or expanded existing measures to support SME financing during the current crisis (see Table 1).
The first part of the section focuses on recent government support schemes without reviewing in depth the intervention modes that were traditionally in place before the crisis, especially in large countries. The second part considers other important measures involving EU-level institutions that have been implemented or are envisaged to support the corporate sector.
probit model. The disturbance parameter, ui,k,t is assumed to have a normal distribution and we use the standard maximum likelihood estimation method. The variables summarising the financial characteristics are dummy variables constructed using the survey questionnaire content. The first variable, credit hist (see Table A below), takes value one when a firm replies that its credit history has deteriorated over the preceding six months; capital is about the deterioration of a firm’s capital; firm outlook is about the financial situation of a firm in terms of sales and profitability. Similarly, Gen econ is a dummy variable indicating a deterioration of the general economic activity as perceived by firms (equal to 1, 0 otherwise). Pub sup is a dummy variable equal to 1 when a firm indicates that access to public support, including guarantees, has deteriorated as a factor linked to the availability of external financing. Table A reports the marginal effects of the econometric specification for distressed, non-distressed countries and for the euro area as a whole. The last column includes the results of a t-test that compares the regression coefficients of the two country-groups to test the null hypothesis that they are equal.
Table 1 Overview of government measures to support sME access to credit introduced since 2011
AT BE EE ES FI FR DE GR IE IT CY LU MT NL PT SK SI
Loans and grants Grants and credit lines X X X X X X X X X Low interest loans X X X X X X X Reduction of credit risk X X X X X X
Public guarantees on bank loans Up to 80% X X X X X X
Between 50% and 80% X X X X X X X X X Unspecified X
Equity Equity funding X X X X X X X Incentives to issue equity X
Bonds Fostering SME issuance X X
Sources: NCBs, Centre for Strategy & Evaluation Services Evaluation of Member State (2012), “Policies to facilitate access to finance for SMEs”, report conducted on behalf of the European Commission, June. OECD (2012), “National Scoreboard in Financing SMEs and Entrepreneurs 2013: An OECD Scoreboard”.

93ECB
Financial integration in EuropeApril 2014
SPECIAL FEATURE b
GOVERNMENT sUPPORT sCHEMEs TO IMPROVE sME ACCEss TO FINANCE
The measures show different approaches between countries which reflect various degrees of engagement by public agencies, as well the depth of existing supporting schemes. While Germany, France and Spain have a comprehensive system of public support programmes – mostly at the national and regional levels, with a variety of financing types – in other countries the government intervention is traditionally more limited, as in Finland. In some cases, the programmes are channelled through organisations specifically set up for the purpose of supporting SMEs, but the majority is provided through financial institutions that also deliver other financial (and sometimes non-financial) support. In several – mainly small – countries, the government involvement is in cooperation with international institutions, in particular the EIB and EIF, which often provide the initial funds and guarantees. This is the case in Slovakia and Cyprus.
Most measures aim to improve SME access to bank credit by transferring part of the borrower credit risk from the originating bank to the sovereign. The risk transfer takes place via (1) public guarantees on bank loans or (2) by granting subordinated loans to companies. Both measures can relieve binding regulatory capital constraints and thereby promote bank lending. Similarly, most measures offer loans at a below-market interest rate to increase the take-up. In some cases, the non-price terms and conditions are also better (lower collateral requirements). The measures can be broadly categorised according to their main support direction: i) lowering the risk and opacity in SME financing; or ii) providing capital or liquidity support to SMEs and promoting the development of market-based funding sources.
POLICy MEAsUREs TO LOWER THE RIsK AND OPACITy IN sME FINANCING
Most countries have expanded credit guarantees to SMEs for the purpose of inducing banks to reopen their lending facilities, thereby reducing the additional risk that banks need to take on their balance sheet when granting new loans. The amount of funds was increased substantially and eligibility constraints were eased, a higher percentage of each loan was guaranteed, and applications were processed more rapidly. In Italy, the Central Guarantee Fund has been the main instrument aimed at facilitating access to credit for SMEs. An alternative instrument used to overcome banks’ reluctance to lend to SMEs has been the development of a credit rating system for SMEs in Austria.
POLICy MEAsUREs TO PROVIDE CAPITAL OR LIQUIDITy sUPPORT TO sMEs AND TO PROMOTE THE DEVELOPMENT OF MARKET-BAsED FUNDING sOURCEs
Alternative policies in Italy included the three government-sponsored debt moratoria and the collective credit agreements between major Italian banks and the most important SME associations. Under the moratorium, with the bank’s agreement, SMEs could delay the repayment of medium-term bank loans for one year without penalties. France shortened payment delays in public procurement contracts and adopted stricter rules for payment compliance among firms, while in Italy, the government accelerated the payments of general government arrears to the private sector in the two years 2013 and 2014. Spain introduced a similar programme in 2012 and shortened the maximum limit on periods for payments related to commercial transactions between firms and between firms and the public sector. In Finland, Finnvera, a public financial company, has more recently focused on SMEs needs related to working capital and export credits by acquiring the funds needed for its clients from the market under its Euro Medium-Term Note Programme. In Portugal, Greece and Malta public guarantees were also used to extend working capital loans.

94ECBFinancial integration in EuropeApril 2014
With respect to public intervention directed to SME needs across the various stages of their life, public intervention to stimulate the chronic shortage of capital supply into new seed, start-up and early-stage VC funds has been channelled through public/private co-investment VC funds managed by private sector fund managers.6 Innovative instruments have included, for example, Germany, Italy and France’s promotion of investment in SME equity to cope with the undercapitalization problem. Government investment in SME equity and the promotion of SME recapitalization has taken various forms, particularly participation in new investment funds and private equity investments targeted to SMEs. Italy and France leveraged the resources of the Cassa Depositi e Prestiti and Caisse des Depots, respectively, together with those of major banks. Italy also granted a deduction from taxable income of the notional return on new equity capital and introduced a scheme to promote the issuance of SME debt securities (‘mini-bonds’).
sHORT AssEssMENT OF GOVERNMENT MEAsUREs sUPPORTING sME ACCEss TO FINANCING
Direct comparisons of whether one support measure is better or worse than another are complicated by various factors: First, the various schemes differ in terms of target group and objectives. For example, the clients they serve range from start-ups with no employees at time of contact to well-established companies moving out of SME status due to growth and expansion. The expected rates of return and default rates also vary in terms of what is considered acceptable in the industry. Second, since many of the schemes have only been set up recently, the cost effectiveness cannot be properly assessed. While it is possible to identify the running costs of a scheme, the total costs crucially depend on whether loans are repaid or guarantees are called, on interactions with other complementary measures and on the economic impact. In general, these will only be known after the scheme had some years of operation. Nevertheless, a few general principles can be identified: loan schemes and – in particular – guarantees tend to have a much larger impact in terms of the number of firms affected, while venture capital and similar schemes are more targeted and restricted to specific groups of firms.
In terms of loan scheme usage, data from the SAFE confirm that a higher percentage of firms in distressed countries reported that they used grant or subsidized bank loans than in non-distressed countries, particularly between 2009 and 2010 (see Chart 58). However, firms are still reporting that the availability of external financing has also been limited due to a deterioration in access to financial support (see Chart 59). This points to the fact that while a range of government support measures exists for alleviating SMEs’ access to finance, it is still difficult to reach the policy targets, i.e. the SMEs.
6 See “Report of the Chairman of the Expert Group on the Cross-border Matching of Innovative Firms with Suitable Investors”, DG-Enterprise, 2012.
Chart 58 Use of grants or subsidised bank loans over the past six months by sMEs in distressed and non-distressed countries(percentages of all respondents, weighted averages)
8
12
16
20
24
8
12
16
20
24
distressednon-distressedeuro area
2009 2010 2011 2012 2013
Sources: ECB (SAFE) and ECB elaborations.

95ECB
Financial integration in EuropeApril 2014
SPECIAL FEATURE b
OTHER POLICy INITIATIVEs AT THE EUROPEAN LEVEL
Despite a range of policy initiatives at the national level, substantial fragmentation in SME financing across euro area countries and in particular for SMEs located in distressed countries persists, as displayed in section II above. As the implied dispersion in financing conditions are likely influenced not only by borrower risk but also by domestic sovereign spreads and domestic macroeconomic weaknesses, pan-European policy initiatives to promote SME financing could help mitigate discrepancies and foster integration in this market segment. In this regard, at the European level, the European Investment Bank (EIB) has substantially increased its lending activity in support of SMEs following its capital increase agreed by the European Council in 2012. More specifically, the EIB and the European Investment Fund (EIF) contributed €21.9 billion to SMEs in 2013.
Looking ahead, the Multiannual Financial Framework (MFF) for the years 2014-2020 allows for an investment by the European Union of around €1 trillion prioritising sustainable growth, jobs and competitiveness, with SMEs benefiting to a significant extent from these measures. In particular, in the 2014-2020 budget, financial instruments including loans, guarantees, equity and other risk-sharing instruments can be used more broadly and will be implemented in cooperation with the EIB, European Investment Fund (EIF) and national promotional banks. More specifically, following a decision by the European Council in October 2013, the Commission and the EIB are planning to expand their joint risk-sharing financial instruments to leverage private sector and capital market investments in SMEs.
In addition, the European Commission published a Green Paper on long-term financing of the economy in April 2013 to initiate a broad debate on avenues to foster the supply the real economy with long-term financing, with a particular focus on the financing of European SMEs, among other things. More specifically, the initiative aimed at improving and diversifying financial intermediation for long-term investment. The consultation on the Green Paper ended in June 2013 and the follow-up may include new or adapted regulations, a stronger promotion of best practices and specific follow-ups with individual Member States in the context of the European semester. As a follow-up, the Economic and Financial Committee (EFC) entrusted a High Level Expert Group (HLEG) on SME and infrastructure financing with the mandate of providing respective recommendations. Concerning SME financing, the respective Report by the HLEG7 includes short- and medium-term recommendations regarding regulatory reform, bankruptcy and enforcement rules; transparency in credit ratings; the promotion of pooled investment vehicles and the collaboration of national
7 See “Finance for Growth”, Report of the High Level Expert Group (HLEG) on SME and Infrastructure Financing, 11 December 2013, http://europa.eu/efc/working_groups/hleg_2013_en.htm.
Chart 59 Availability of external financing, Change in access to public financial support, including loan guarantees, across distressed and non-distressed countries(percentages of all respondents; weighted averages)
-40
-30
-20
-10
0
-40
-30
-20
-10
0
2009 2010 2011 2012
distressednon-distressedeuro area
Sources: ECB (SAFE) and ECB elaborations.

96ECBFinancial integration in EuropeApril 2014
development banks to address financial fragmentation from the supply side. More specifically, the recommendations for SME access to financing include the facilitation of credit analyses via public and private databases, and they strongly support the development of capital market options for SME financing. Such options include, in particular, the securitisation of SME loans as a complement and alternative to traditional bank financing supplemented by a range of recommendations to facilitate such development both in the regulatory sphere and by risk-sharing policy initiatives. The Commission in its communication in March 20148 took up a range of these proposals concerning the improvement of credit information on SMEs, the revival of the dialogue between banks and SMEs and the assessment of best practices on helping SMEs to access capital markets.
In this context, complementing policy initiatives at the national and European level, the ECB has taken measures that support both bank funding and the financing of SMEs. In the area of Eurosystem collateral eligibility, a number of temporary measures have been taken over the last few years, with a particular focus on SMEs. Such measures include lowering rating requirements in December 2011 followed by a further move in June 2012 for some asset-backed securities (ABS), including those backed by SME loans, and setting up the Additional Credit Claims (ACC) framework to allow the acceptance of performing credit claims (including those granted to SMEs) that do not fulfil the eligibility criteria applied in the permanent framework. Likewise, in terms of its collateral framework, in July 2013, the Governing Council decided to introduce measures that could support SME financing, like a reduction of ABS rating requirements (from triple-A to single-A) and of ABS haircuts (from 16% to 10%). Lowering haircuts for collateral consisting of – or based on – SME loans allows euro area banks to borrow more using the same amount of collateral. Consequently, such measures incentivise banks to extend more credit to SMEs. Looking ahead, the ECB will continue to investigate how to catalyse recent initiatives by European institutions to improve funding conditions for SMEs (in particular as regards the possible acceptance of SME-linked ABS guaranteed mezzanine tranches as Eurosystem collateral, in line with established guarantee policies).
In sum, against the background of the ongoing fragmentation in SME access to lending throughout the euro area, coordinating public policy support at the national level by joint European initiatives seems warranted for a variety of reasons. First, it would stimulate SME financing by involving commercial banks; second, it would aim at developing direct capital market solutions for the medium to longer term, and it would overcome or at least mitigate persisting fragmentation in this market segment.
8 See “Commission roadmap to meet the long-term financing needs of the European economy”, http://europa.eu/rapid/press-release_IP-14-320_en.htm, and “Communication from the Commission to the European Parliament and the Council on Long-Term Financing of the Economy“, http://ec.europa.eu/internal_market/finances/docs/financing-growth/long-term/140327-communication_en.pdf, Brussels, 27 March 2014.

97ECB
Financial integration in EuropeApril 2014
SPECIAL FEATURE C
C. INITIATIVEs TO PROMOTE CAPITAL MARKET INTEGRATION IN THE EUROPEAN CORPORATE BOND AND EQUITy MARKETs 1
This Special Feature analyses the extent to which European corporate bond and equity markets remain fragmented along national lines. It identifies areas where some progress has been made towards more integration in each of these markets, and points out other important areas where additional work fostering financial integration is required. It suggests that the identified obstacles to the full integration of European corporate bond and equity markets need to be eliminated in order to successfully complement the EU Banking Union project, as these markets form an integral part of the EU financial system.
INTRODUCTION
The aim of integrating financial markets is to ensure that all participants in the given market are subject to the same set of rules, are treated equally and have equal access to that market. In this sense, an integrated market can be defined as a situation where there are no frictions that discriminate between economic agents in their access to – and their investment of – capital, particularly on the basis of their location. Therefore financial integration is achieved when participants have equal access to the market, de facto and de jure2. Markets in the same financial asset can be considered to be fully integrated if the assets are priced identically on those markets.
Whilst there are factors at work that will not be easily removed by legislation even at the Union level, such as the different economic and market situations in individual Member States (for example, the ownership, structure and role of their capital market and banking systems vary greatly) and the role of language and geography, it is important nevertheless to note that prior to the financial crisis, EU financial market integration had progressed rapidly. This was in line with global trends, and it has also been promoted by the introduction of the euro. This integration of international capital markets is vital for the efficient allocation of capital, which enhances economic growth and contributes to the sharing of risk on an international, regional and sectoral level. The advent of the European Economic and Monetary Union (EMU) is regarded as a crucial driving force of European financial integration. The abolition of currency risks with the introduction of the euro together with increased bond standardisation3 are widely seen as the main factors behind increased European bond market integration.4
However, while increased integration, primarily of bond markets, has contributed to a better allocation of capital across the EU Member States and improved sharing of risks, both equity and bond markets remain fragmented in Europe along national lines. The equity markets, for example, remain characterised by a marked home bias and the ownership of listed companies in the euro area is still in the main domestic.5 There is also a low degree of cross-border bank mergers and
1 Authors:Svoboda,M.,WeeninkH.,Głuch,D.,Lefterov,A.,Posch,M.,Grill,M.andFöll,P.2 See the speech by B. Coeuré, “The way back to financial integration”, delivered at the Conference organised by the Banco de España and
the Reinventing Bretton Woods Committee, Madrid, 12 March 2013. The speech is available at www.ecb.europa.eu.3 See for example the introduction of standardised collective action clauses into issue documentation for euro area government bonds
pursuant to the Eurogroup Statement of November 2011, as enshrined in the ESMA Treaty (Recital 11) as of 1 January 2013. 4 Schulz, A. and Wolff, G., “Sovereign bond market integration: the euro, trading platforms and globalization”, 2008.5 See the Note presented at the informal ECOFIN on 14 September 2013 in Vilnius, “The neglected side of banking union: reshaping
Europe’s financial system”, by A. Sapir and G. Wolff, Bruegel, Figure 5, “Proportion of equity held in euro-area countries that is of domestic origin, 2010”on page 7.

98ECBFinancial integration in EuropeApril 2014
acquisitions6 as opposed to corporates in general. The degree of cross-border ownership of listed shares in the euro area is significantly lower than would be expected in a fully integrated market, in which investors would spread their investments across the entire euro area to reap the benefits of diversification. Finally, there is evidence that the share of cross-border holdings of euro area corporate debt in total holdings of corporate debt securities held by euro area financial institutions declined further in 2012.7
This Special Feature analyses some of the main legal and regulatory obstacles which underpin the fragmentation of corporate bond and equity markets across EU jurisdictions and it looks at the efforts undertaken to remove them.
Section 1 describes the legal obstacles in each of the phases of the life cycle of a bond or share (i.e., admission to trading, intermediation and clearing and settlement), and assesses the main EU initiatives to address and remove those obstacles. In each of these phases, it is important to appreciate the very different legal natures and characteristics of bonds and equities. They are both securities, in other words types of financial assets8. However, a bond holder provides funding to the issuer of the bond in return for a right to be repaid and to receive interest until repayment, whereas a shareholder owns a bundle of rights, some economic, e.g. dividends, others governance related, i.e. voting rights. These differences have an impact on efforts to integrate the markets in these financial instruments. For example, due to their governance features equities are more linked to the legal system under which the issuer is incorporated. The efforts to harmonise the market in covered bonds, a category of corporate bonds subject to a special legal framework, are described in Box 6.
In addition to the legal aspects related to the life cycle of securities, capital markets remain underdeveloped as a result of insufficiently harmonised corporate governance rules, which continue to vary significantly across Member States due partly also to different national taxation regimes and other factors. Section 2 therefore examines the need for further harmonisation of corporate governance and taxation frameworks and it highlights the lack of progress in the harmonisation of different national rules and procedures in these areas.
Section 3 reviews the other frameworks that are required for an integrated European securities market, namely common legal frameworks for crisis management and insolvency. These frameworks are all important components of integration, since in order to have equal access to the given market in a bond or share, investors must have common rules to assess the risk of the issuer exiting that market and reneging on its obligations. Finally, in the absence of a central supervisor of capital markets in the Union, the existing national discretion in the application of supervisory standards can also have an impact on market participants and, by extension, contribute to insufficiently harmonised capital markets. It is in this context that Section 4 considers the existing supervisory and enforcement frameworks. The conclusion summarises what has been done in each area and what remains to be done in order to achieve truly integrated markets for corporate bonds and equities.
6 See the Note mentioned in footnote 5, Figure 3, “Total number of EA17 banks being bought by banks from the same Euro area Member State, other Euro area Member States, non Euro area EU Member States, and by banks from outside the EU (rest of world)” on p. 5.
7 See “Financial integration in Europe”, April 2013, ECB publications, p. 28, and Chart 11 on p. 26. See also in the same report, Chapter I: “Recent developments in financial integration in the Euro Area”.
8 This feature only concerns corporate bonds and ordinary shares issued or admitted to trading on a regulated securities market or other trading venue.

99ECB
Financial integration in EuropeApril 2014
SPECIAL FEATURE C
1 LEGAL AND REGULATORy OBsTACLEs IN THE LIFE CyCLE OF CORPORATE BONDs AND EQUITIEs
NON-HARMONIsED RULEs ON THE CREATION (IssUE), CORPORATE ACTIONs AND REDEMPTION/CANCELLATION OF CORPORATE BONDs AND EQUITIEs
The EU has in general not attempted to harmonise rules on how securities are legally created – in other words their legally prescribed characteristics – nor on how they may be cancelled and withdrawn from the market, nor on the corporate actions which may affect the bond or shareholder, such as a merger or a capital increase of the issuer. These matters continue to be regulated by the domestic law of the jurisdiction where the issuer is incorporated or resident and the rules of the relevant market. Certain areas have however been the subject of harmonisation efforts. As regards issuers that are listed companies, the EU company law directives9 have minimally harmonised significant shareholder rights in respect of registered capital, as divergent levels of protection were seen as an obstacle to the free movement of capital and an impediment to deeper, more liquid capital markets. In the context of efforts to harmonise post-trading infrastructures (section 1.3 below), considerable work has been done on agreeing standardised EU corporate action procedures in various established industry working groups.10
There have also been intensive efforts to harmonise the regulatory requirements that national securities supervisors impose during the phases of the life cycle of the bond or equity, i.e. admission to the market, trading (including intermediation) and post trade clearing and settlement. The main phases of this life cycle are dealt with in the following sections (1.1 on admission to trading, 1.2 on intermediation and 1.3 on clearing and settlement, as well as efforts to adopt an EU securities law). Before discussing these phases of securities’ life cycle, Box 5 summarises the EU regulatory approach in this area.
9 The most significant are the Second Council Directive 77/91/EEC on the coordination of safeguards which, for the protection of the interests of members and others, are required by Member States of companies within the meaning of the second paragraph of Article 58 of the Treaty, in respect of the formation of public limited liability companies and the maintenance and alteration of their capital, with a view to making such safeguards equivalent (‘2nd Company law directive’), and most recently Directive 2007/36/EC on the exercise of certain rights of shareholders in listed companies (Shareholder Rights Directive). Many of these protections would be derogated from by institutions which are in resolution under the Proposal for a Directive establishing a framework for the recovery and resolution of credit institutions and investment firms and amending Council Directives 77/91/EEC and 82/891/EC, Directives 2001/24/EC, 2002/47/EC, 2004/25/EC, 2005/56/EC, 2007/36/EC and 2011/35/EC, and Regulation (EU) No 1093/2010 (further only ‘BRRD’).
10 E.g. the Corporate Actions Joint Working Group (CAJWG)’s proposed standards as presented to CESAME in 2009.
Box 5
REGULATORy CONVERGENCE
Initially directives were the main legal instrument used to further harmonise investor rights and facilitate the provision of cross-border investment services throughout the Union. However, as they require transposition into national laws, directives may not always achieve these objectives. This is due to national derogations and discrepancies which will invariably appear in the transposition process, sometimes in the form of greater leniency towards domestic entities, and sometimes in the form of ‘super-equivalence’ rules (‘gold-plating’), whereby national legislation requires a stricter standard than provided for in EU legislation.
Consequently, in order to achieve further regulatory convergence in the corporate bond and equity markets, a number of regulatory techniques have been employed. First, the Lamfalussy process

100ECBFinancial integration in EuropeApril 2014
in the securities sector1 led to the adoption of four ‘Level 1’ directives,2 complemented by ‘Level 2’ measures. Decisive steps in the direction of stronger regulatory convergence have been evidenced both by the EU legislator’s increased preference for maximum harmonisation in the financial services sector, as well as the creation of the European Supervisory Authorities (ESAs) with their respective competences, in particular EBA for banks, ESMA for securities markets and EIOPA for insurance and pension funds.
In this regard the Council has emphasised the importance of a European single rule book applicable to all financial institutions in the Single Market.3 This has led to a pronounced shift in the preference of the legislator from the earlier minimum harmonisation towards maximum harmonisation 4. As a first step, in 2011-12 the Commission put forward several proposals to replace and/or complement existing directives with directly applicable regulations in the securities sector, namely to replace the Directive on Markets in Financial Instruments Directive (MiFID 1) 5 – partly with a Regulation 6 (MiFIR) and a new recast Directive (MiFID 2) 7. In the area of market integrity, the Commission proposed to replace the Market Abuse Directive (MAD) 8 with a Market Abuse Regulation (MAR)9 and to amend MAD.10 For the banking directives, in 2013 the Commission repealed the Capital Requirements Directives,11 replacing them with the Capital Requirements Regulation (CRR)12 and an amended Directive 13 (the “CRR/CRD IV package”) in line with the new global standards for bank capital. For market infrastructure, regulation has advanced into previously unregulated areas such as OTC derivatives and CCPs with the European Market Infrastructure Regulation (EMIR) 14 and the proposed Central Securities Depositories Regulation (CSDR) 15).
The innovation of the technical standards drafted by the ESAs and endorsed by the Commission has been one of the decisive steps in regulatory convergence in the more detailed areas of securities legislation – beyond the general principles. Precise and harmonised technical rules have
1 Final Report of the Committee of Wise Men on the Regulation of European Securities Markets Brussels, 15 February 2001.2 These were the Directive on Markets in Financial Instruments, the Market Abuse Directive, the Prospectus Directive, and the
Transparency Directive. These directives are cited later in this feature.3 Council, Presidency Conclusions, Brussels, 18-19 June 2009.4 Maximum harmonisation is most often achieved via regulation, an EU legal instrument which is directly applicable and binding in
its entirety. It should be noted, however, that regulations are not always synonymous with full harmonisation in the given area. For example, to achieve unanimity for its adoption in the Council, important exemptions from the scope of the regulation may be necessary. Conversely, whilst directives leave more discretion to the Member States as to how they are implemented than regulations, they may include much more detailed harmonising provisions in a particular area than could be achieved in a regulation.
5 Directive 2004/39/EC on markets in financial instruments amending Council Directives 85/611/EEC and 93/6/EEC and Directive 2000/12/EC and repealing Council Directive 93/22/EEC.
6 Proposal for a Regulation on markets in financial instruments and amending Regulation 648/2012 on OTC derivatives, central counterparties and trade repositories - General approach of 18 June 2013.
7 Proposal for a Directive on markets in financial instruments repealing Directive 2004/39/EC. 8 Directive 2003/6/EC on insider dealing and market manipulation (market abuse).9 Proposal for a Regulation on insider dealing and market manipulation (market abuse).10 Proposal for a Directive of the European on criminal sanctions for insider dealing and market manipulation.11 Directive 2006/48/EC relating to the taking up and pursuit of the business of credit institutions, as amended (Recast Banking Directive)
and Directive 2006/49/EC on the capital adequacy of investment firms and credit institutions (recast) (Recast Capital Adequacy Directive).
12 Regulation (EU) No 575/2013 on prudential requirements for credit institutions and investment firms and amending Regulation (EU) No 648/2012.
13 Directive 2013/36/EU on access to the activity of credit institutions and the prudential supervision of credit institutions and investment firms, amending Directive 2002/87/EC and repealing Directives 2006/48/EC and 2006/49/ECfurther only ‘CRD IV’. It entered into force, along with the CRR, on 17 July 2013.
14 Regulation (EU) No 648/2012 on OTC derivatives, central counterparties (CCPs) and trade repositories (TRs), which entered into force on 16 August 2012.
15 Proposal for a Regulation on improving securities settlement in the European Union and on central securities depositories and amending Directive 98/26/EC (proposed CSDR), which is currently before the Council and the Parliament.

101ECB
Financial integration in EuropeApril 2014
SPECIAL FEATURE C
1.1 ADMIssION TO TRADING AND PUBLICITy REQUIREMENTs
There have been several phases of EU securities regulation in this area. The focus was initially on investor protection, but the approach to harmonisation has shifted over time. In an initial phase,11 the (then) EC used directives in an attempt to harmonise rules for access to official stock exchanges and listing particulars across the Union.12 These instruments aimed to provide equivalent protection for investors at the European level so as to help large corporate issuers list their securities on stock exchanges in other Member States and thereby contribute to establishing a European capital market. This approach proved inadequate to ensure full mutual recognition for issuers, as differences in national regulatory requirements were still too large. The ability for issuers to freely issue securities outside their home jurisdiction (i.e. freedom of issuance) also remained subject to legal barriers.
The second phase, and the push for the single market and liberalisation of financial services generally,13 which was based on mutual recognition and home country control, saw the introduction of the Prospectus Directive,14 which replaced these instruments. This directive required all issuers of securities offered to the public or admitted to trading on a regulated market to issue a prospectus with detailed harmonised content approved by their home state supervisor.15 The regulatory focus was also broadened to cover other areas such as the disclosure of significant shareholdings (the Transparency Directive).
In the third phase, heralded in by the Financial Services Action Programme (FSAP),16 the focus moved to ensuring convergence of supervisory practices and responding to technological advancements in the market. Thus, the Prospectus Directive has been progressively revised and updated, most recently to adapt it to listed small and medium-sized issuers, whilst guaranteeing the same level of investor protection, and to set minimum common standards for sanctions, which remain at the national level.
The Transparency Directive has also improved the harmonisation of on-going reporting and disclosure obligations of issuers of securities admitted to trading on a regulated market.17 and it has improved the clarity of disclosure of corporate ownership. It also defined a clear and transparent assessment procedure, and specified a list of strictly prudential assessment criteria.
11 This phase lasted from at least 1966 and the Segre report on the ‘unsatisfactory’ EC securities market at that time until the 1985 Commission White Paper on the Internal Market.
12 Notably the Listing Particulars Directives 80/390/EEC and 89/298/EEC, as amended, and later consolidated into Directive 2001/34/EC on the admission of securities to official stock exchange listing and on information to be published on those securities. These directives have been consolidated into the Prospectus Directive.
13 See the Commission’s White paper on the Internal Market of 1992. 14 Now consolidated into the Directive 2003/71/EC on the prospectus to be published when securities are offered to the public or admitted to
trading and amending Directive 2001/34/EC, as amended by Directive 2010/73/EU. The prospectus regime includes also an implementing regulation, as amended, and a delegated act.
15 However, the regime has notable exemptions, e.g. non-equity securities issued by a Member State or by one of a Member State’s regional or local authorities, by public international bodies of which one or more Member States are members, by the European Central Bank, or by the central banks of the Member States are not covered by this Directive and thus remain unaffected by this Directive.
16 The European Commission’s Financial Service Action Plan (1999) 232 of 11 May 1999. 17 See Directive 2004/109/EC, which also amended Directive 2001/34/EC, as amended by Directive 2010/73/EU. The proposed CSDR,
Chapter IV, article 47 also contains some, albeit limited, provisions on freedom of issuance.
consequently been introduced in areas previously governed solely by the guidelines of the Level 3 Committees, or in some cases even left to national discretion. The role of the European Securities Market Authority (ESMA) in particular in advancing regulatory convergence in the securities field is discussed in Section 4.
102ECBFinancial integration in EuropeApril 2014
However, the aim should be to achieve a single set of regulatory requirements for securities issuers. In particular, there needs to be greater regulatory convergence in the way key requirements of the prospectus and transparency regimes are applied by national supervisors. For example, the current exemptions from the prospectus regime18 and how they are applied by supervisors could be further reviewed. There also needs to be a better alignment of the disclosure requirements under the prospectus regime with those under other EU legislation (e.g. MiFID), as they overlap. The national laws on the issuance of covered bonds also remain largely un-harmonised; progress with harmonisation in that market is addressed in Box 6.
18 The Prospectus Directive exempts certain categories of securities from its scope. These are inter alia securities included in an offer where the total consideration of the offer is less than 2.5 Million EUR as calculated over a period of 12 months, units in open-ended collective investment schemes and non-equity securities issued in a continuous or repeated manner by credit institutions provided that these securities meet certain specified conditions. Debt issued by government, other public authority or public international body or securities guaranteed by them also exempted from the regime. This is in contrast to the retail payments area, where some progress on harmonising standards has been achieved, see for example SEPA.
Box 6
COVERED BONDs MARKET HARMONIsATION
There are also efforts being made to improve the harmonisation of covered bond1 markets. The covered bond market remains an important segment of privately issued bonds on the EU capital markets.2 The national covered bond frameworks are, however, very heterogeneous across the Member States, and covered bonds can have many different legal forms and structures depending on the jurisdiction where they were issued. However, for the purposes of a capital requirements assessment of these structures, Directive 2006/48/EC laid down a set of criteria regarding high quality covered bonds in the EU. Thus, Directive 2006/48/EC already foresaw a preferential treatment of exposures in the form of covered bonds where the cover pool of assets met certain eligibility requirements.
The CRR takes this concept of preferential treatment one step further, as covered bonds may only be subject to the preferential treatment for the purposes of the capital adequacy assessment if certain transparency requirements are met. The institution investing in the covered bonds is obliged to be able to demonstrate to the competent authorities that it receives portfolio information at least on a prescribed list of matters relating to the structure and the cover pool. It follows from the high quality – and therefore likely liquid – nature of covered bonds, that these instruments qualify as liquid assets towards the diversified buffer of liquid assets that institutions should hold to cover liquidity needs in a short-term liquidity stress.
The ECB has supported a push for more clearly defined key information to become available to investors for covered bonds and other less standardised securities, such as asset backed securities. The ECB has also advocated a comprehensive liability regime concerning the information in the 1 Covered bonds are debt obligations that give their holders recourse to the issuing entity (or an affiliated entity of the issuer) upon
default; covered bondholders also have recourse to a pool of collateral (known as the ‘cover pool’) separate from the issuer’s other assets. See the EC Financial Stability and Integration Report 2012 [Box 1.4.3]. They can be divided essentially into two basic categories, legislative (statutory) covered bonds and structured covered bonds. Also, it should be noted that covered bonds are eligible assets for the purpose of collateralising monetary policy instruments; they qualify as debt instruments. See in particular Sections 6.2.1.1.1 and 6.2.3.2 of the General Documentation annexed to the Guideline on monetary policy instruments and procedures (ECB/2011/14).
2 See the ECBC European covered bond fact book, 8th edition, of September 2013.
103ECB
Financial integration in EuropeApril 2014
SPECIAL FEATURE C
1.2 INTERMEDIATION (sECURITIEs TRADING)
MiFID 1 – a product of the third phase of EU securities regulation – is a core pillar of EU financial market integration, providing a homogeneous regulatory framework for securities trading based on the ‘single passport’ principle. In response to market and technological developments, the Commission has proposed to amend and broaden the MIFID 1 regime. The ECB has supported this reform.19 These revisions will result in the reallocation of part of the current MiFID provisions to MiFIR that will aim at ‘maximum harmonization’. As in other pieces of EU financial services regulation (e.g. the CRDIV/CRR package), the fact that some elements of MiFID have to be placed in a directive and others in a regulation reflects the need to achieve a uniform set of rules in some areas, while allowing for national specificities in others. MiFID 2 and MiFIR strengthen the harmonised regulation of markets in financial instruments in that they increase their transparency, provide for a right of access to market platforms, better protect investors and reduce unregulated areas of market activity, whilst granting increased powers to supervisors.
Market integrity is also an important component of an integrated capital market. The Union has contributed to this by harmonising the national rules on insider dealing and other market abuse practices, through the MAD, which obliges issuers and those who work for them to disclose insider information and to notify and disclose directors’ dealings. As already mentioned (see Box 5), MAD will be replaced with updated proposals that will govern these ad hoc disclosure duties and extend the market abuse regime to other financial crimes such as benchmark manipulation, which will have harmonised definitions.
To achieve an integrated market as regards disclosure and reporting by market participants, however, the Union should strive for a more coherent regime which would group all market
19 See ECB opinion CON/2012/21.
summary, which would strengthen investor protection as well as being useful for regulators.3 This would also ensure comparability not only between asset classes but also between securities within asset classes.
According to the CRR, the Commission will have to review the covered bonds prudential treatment in the banking regulation by the end of 20144. This review will include notably the scope and the quality of the underlying assets eligible to collateralize these instruments.
Nonetheless, to establish a harmonised legal framework for covered bonds in the EU would be challenging. Not only different national covered bond legislations would need to be changed and harmonised, but also related laws such as insolvency and mortgage laws. The latter legislation is closely linked to public policy such as taxation and housing policy, to which Member States are sensitive because they touch on sovereignty. Currently, different bank business models and activities underlying the instruments partly reflect local specific features (such as the structure of the real estate market), and would be difficult to standardise in a single codex. Future regulatory developments in the field of covered bonds are uncertain. For instance, the International Organization of Securities Commissions (IOSCO) stresses that the economic justifications for covered bonds being treated by regulators differently from asset-backed securities may need closer assessment.5
3 See ECB opinion CON/2010/6.4 See CRR Article 503.5 IOSCO Final Report: “Global Developments in Securitisation Regulation”, dated 16 November 2012 – FR09/12 – p. 47.
104ECBFinancial integration in EuropeApril 2014
participants’ disclosure obligations, whether needed for transparency (price formation) or market integrity purposes, into a single comprehensive regime. The comprehensive, harmonised approach used under the proposed MAR may serve as a model for this.
1.3 CLEARING AND sETTLEMENT
The introduction of the euro undoubtedly spurred the development of increasingly integrated and consolidated securities market infrastructures. Nonetheless, the pace of progress on integration in the post-trading industry has been slow.20 The reasons behind the slower integration progress in the clearing and settlement of securities (as compared to trading) range from technical and market practice issues to taxation and legal issues.
European authorities have a strong interest in the integration of European securities infrastructure. In the Commission’s case, this relates to its responsibility for creating an internal market in financial services and ensuring that the euro is underpinned by an efficiently functioning financial system. For the ECB, the sound, safe and efficient functioning of financial market infrastructures directly relates to its basic tasks, such as the sound execution of monetary policy, the smooth functioning of payment systems and the preservation of financial stability.
Under a mandate of the Commissioners of Economic and Monetary Affairs and Taxation, the Giovannini Group,21 which was composed of financial market experts from the public sector and from the private sector, ranging from the settlement industry itself to credit institutions and industry associations, identified 15 barriers to integration of cross-border clearing and settlement in its first report of November 2001.22 This first report provided a diagnosis of the problems in the EU post-trading securities industry and identified the sources of these problems. Of the issues identified, ten barriers related to market practices, two to taxation and three to legal certainty. As a second step, the Giovannini Group attempted to provide a consistent strategy for removing the 15 barriers identified. Its second report,23which was published in April 2003, suggested a strategy for removing these barriers to integration within three years and proposed a sequence of actions to remove the barriers, allocating responsibility for each action between the private sector and national governments.
Both reports were widely endorsed by public authorities and, as a result, clearing and settlement was included as a priority in the Lisbon Agenda. A number of initiatives have been undertaken to dismantle the identified barriers. Whereas the Commission’s Clearing and Settlement Advisory and Monitoring Expert Group (CESAME and later CESAME2) coordinated and monitored the overall approach, the Clearing and Settlement Fiscal Compliance (FISCO) expert group and Legal Certainty Group dealt with the tax and legal issues relating to the integration of European clearing and securities settlement, respectively. The Legal Certainty Group published a report 24 in 2008 containing 15 recommendations addressing barriers with respect to the legal effects of book entries, differences in national law affecting corporate actions and restrictions on the location of securities. The work on post-trading harmonisation started by CESAME and CESAME2 has
20 See“Integrationofsecuritiesmarket infrastructures in theeuroarea”byH.SchmiedelandA.Schönenberger,ECBOccasionalPaperSeries no. 33, July 2005.
21 Named after its chairman, Alberto Giovannini.22 The Giovannini Group, Cross-Border Clearing and Settlement Arrangements in the European Union, Brussels, November 2001, available
at www.ec.europa.eu.23 The Giovannini Group, Second Report on EU Clearing and Settlement Arrangements, Brussels, April 2003, available at www.ec.europa.
eu.24 Second Advice of the Legal Certainty Group, Solutions to Legal Barriers related to Post-Trading within the EU, August 2008, available at
www.ec.europa.eu.

105ECB
Financial integration in EuropeApril 2014
SPECIAL FEATURE C
been brought forward by the Expert Group on Market Infrastructures (EGMI) and, currently, the European Post Trade Group (EPTG), a joint initiative between the European Commission, the ECB, ESMA, and the industry. The EPTG includes in its action list key harmonisation topics as such as withholding tax procedures and the work on registration procedures and shareholder identification. The EPTG plans to publish an annual report in Q1 2014 including the action points it is pursuing within its harmonisation agenda.
In addition, the European financial market infrastructure has been and is still undergoing fundamental change. The European Code of Conduct for Clearing and Settlement, which increases transparency of prices and services in the cross-border securities industry, was agreed in 2006. The Committee on Payment and Settlement Systems and IOSCO published new and more demanding international standards for payment, clearing and settlement systems in April 2012, and the EMIR has also been adopted which, inter alia, establishes stringent organizational, business conduct and prudential requirements for central counterparties in the EU. As mandated by EMIR, ESMA has published guidelines and recommendations for the interoperability arrangements of CCPs.25
The Eurosystem’s main contribution to integrated securities settlement in Europe, namely TARGET2-Securities (T2S), is considered by the securities services industry as the key catalyst for harmonisation in post trade rules and procedures. For T2S markets (i.e. 21 EU markets), this initiative aims at creating a single integrated framework for post trade services and at making cross-border securities transactions as safe and as efficient as domestic ones. Within T2S, securities market infrastructures will operate in accordance with a single delivery-versus-payment (or DVP) settlement model, single communication protocol, matching fields, timelines and deadlines, settlement finality rules, corporate actions processing rules, and static data. The Special Feature starting on page [112] contains more details on this initiative.
The proposed CSDR, which is expected to be adopted in early 2014, is also particularly relevant to post trade harmonisation efforts in Europe. The proposed regulation will establish a single regulatory framework, within which CSDs will operate safely and efficiently. This is important for EU cross-border settlement among CSDs in the EU in general, but it is particularly important for regulatory harmonisation in the context of cross-border CSD settlement in T2S. It will, inter alia, provide for a harmonized settlement cycle, a settlement discipline regime and rules covering settlement finality, and will provide for non-discriminatory market access and freedom of issuance.
However, other important initiatives such as the Commission’s long awaited proposals for Securities Law Legislation (SLL) have repeatedly been delayed. The SLL, once adopted, would provide for a harmonised legal framework for intermediated securities, including conflict-of-laws aspects,26 aiming at eliminating barriers due to inconsistent definitions of securities ownership. It would also provide for better protection of investor rights enshrined in their securities. The Commission has launched two consultations (in 2009 and 2010) on the legal initiative, but has not yet published a legislative proposal.
In summary, much has been achieved to eliminate or mitigate barriers to integration of the EU post-trading infrastructure. The period of three years recommended for removal of all 15 barriers in the second Giovannini Report was certainly over-ambitious. Substantial progress has been achieved regarding the removal of technical Giovannini barriers, and the advent of T2S has been instrumental
25 Guidelines and Recommendations for establishing consistent, efficient and effective assessments of interoperability arrangements, ESMA/2013/322, available at www.esma.europa.eu.
26 I.e. aspects relating to any question on which law is applicable with respect to proprietary aspects in relation to financial instruments.
106ECBFinancial integration in EuropeApril 2014
in that respect. Of definite concern is the fact that more than ten years after the publication of the report, it is still not clear when some of the remaining barriers, in particular relating to legal certainty, will be addressed.
2 OTHER LEGAL AsPECTs IMPACTING CAPITAL MARKET INTEGRATION
As noted in the introduction, complete capital market integration will only be achieved if the national frameworks for corporate governance and taxation are also further integrated. Section 2.1 focuses on corporate governance rules within firms (see also Box 7 as regards remuneration policies) and Section 2.2 addresses corporate tax rates and collection systems. Limited integration has been achieved in some of these areas.
Box 7
REMUNERATION POLICIEs IN FINANCIAL INsTITUTIONs
Convergence of remuneration policies and practices for certain financial institutions is one of the aims of the proposed revision of the UCITS Directive and the recently adopted CRD IV.
The proposed amendments to the UCITS framework1 aim to ensure that remuneration of fund managers does not encourage excessive risk-taking. The remuneration policy should be better linked with the long-term interest of investors and the achievement of the investment objectives of the UCITS. The UCITS management company would also be required to disclose the amount of remuneration for the financial year with appropriate detail in the annual report of the UCITS fund. The ECB considered these to be positive developments.2
The stricter rules on remuneration introduced by CRD IV are broadly similar to the above proposals as regards UCITS. The directive introduced clear principles on governance and on the structure of remuneration policies, in particular aiming to align remuneration policies with the risk appetite, values and long-term interests of the credit institution or investment firm. Sound remuneration policies will serve to discourage excessive risk-taking.3 The CRD IV rules have been complemented by the work of ESMA on the remuneration of relevant staff of investment firms, credit institutions and fund management companies when providing investment services.4
The progress of integration in the field of remuneration is already encouraging,5 and it was recently complemented in the context of the Commission’s proposals on structural measures to improve the resilience of banks6 , aiming to implement the recommendations of the High-level Expert Group report on Bank Structural Reform (‘Liikanen report’).7
1 Proposal for a directive amending Directive 2009/65/EC on the coordination of laws, regulations and administrative provisions relating to undertakings for collective investment in transferable securities (UCITS IV) as regards depositary functions, remuneration policies and sanctions.
2 See ECB opinion CON/2013/4.3 See also ECB opinion CON/2009/94. 4 Guidelines on remuneration policies and practices (MiFID), 11 June 2013, ESMA/2013/606, available at www.esma.europa.eu.5 See Bank Structural Reform – Position of the Eurosystem on the Commission’s Consultation Document, 24 January 2013, available at
www.ecb.europa.eu. 6 Proposal for a Regulation on structural measures improving the resilience of EU credit institutions; see recital 20 and Article 7 thereof
relating to remuneration policies and rules.7 Report of the High-level Expert Group on Bank Structural Reform, October 2012, available at www.ec.europa.eu.

107ECB
Financial integration in EuropeApril 2014
SPECIAL FEATURE C
2.1 CORPORATE GOVERNANCE
Corporate governance – like property rights in securities – is an area that is still largely left to national legal systems. Certain inroads have, however, been made in this domain where investors in publicly traded companies were considered as requiring minimum protections. Thus, the second Company law directive coordinated national provisions regarding the formation and maintenance, increase or reduction of the share capital of public companies in order to ensure minimum equivalent protection for both shareholders and creditors. The ‘Shareholder Rights’ Directive27 established minimum requirements in order to facilitate the exercise of shareholder rights at general meetings of listed companies, particularly on a cross-border basis. The Directive on takeover bids,28 established a minimum framework of common principles and general requirements for the conduct of takeover bids involving EU companies whose securities are admitted to trading on a regulated market.
Even so, corporate governance standards remain predominantly a preserve of soft, i.e. non-binding, domestic law. However, there has been some targeted EU legislation in this area. The Accounting Directive 29 requires listed companies to publish an annual corporate governance statement which refers to the corporate governance code that is applied by the company and explains whether, and to what extent, the company complies with that code.30 The regulation on the European Company Statute (“Societas Europaea”, SE) 31 adopted in 2001 is an example of an optional governance regime for EU-established publicly traded companies; however, its take-up has been limited, with the application of the Statute proving to be problematic since the Statute retains multiple references to national law.32 For example the SE and its subsidiaries remain subject to national tax regimes. In the area of collective investment schemes, progress has been made on harmonising rules governing, inter alia, the key information document for investors and for corporate actions such as mergers and changes of legal form.33
Further integration of the corporate governance rules of EU listed companies is required.34 The Commission has identified several lines of action that are fundamental to putting in place modern legislation for sustainable and competitive companies.35 There is a particular need for measures aimed at increasing long-term shareholder engagement, via amendments to the Shareholder Rights Directive and improving the visibility of shareholdings in Europe. The Commission has also undertaken to improve the quality of corporate governance reports, and in particular the quality of explanations to be provided by companies that depart from their commitments under applicable corporate governance codes.
27 Directive 2007/36/EC on the exercise of certain rights of shareholders in listed companies. 28 Directive 2004/25/EC on takeover bids.29 Directive 2013/34/EU 2013 on the annual financial statements, consolidated financial statements and related reports of certain types of
undertakings, amending Directive 2006/43/EC and repealing Council Directives 78/660/EEC and 83/349/EEC.30 Article 20 of Directive 2013/34/EU. 31 Council Regulation (EC) No 2157/2001 on the Statute for a European company.32 Report from the Commission to the European Parliament and the Council on the application of Council Regulation 2157/2001 of
8 October 2001 on the Statute for a European Company (SE), COM(2010) 676 final. These issues were also highlighted by a majority of respondents in their responses to the Commission consultation on the future of European company law. See European Commission, “Summary of Responses to the Public Consultation on the Future of European Company Law”, July 2012.
33 See Directive 2009/65/EC on the coordination of laws, regulations and administrative provisions relating to undertakings for collective investment in transferable securities (UCITS), as amended by UCITS IV.
34 See the European Commission’s Consultation on the future of European Company Law, 20 February 2012.35 See Communication from the Commission: “Action Plan: European company law and corporate governance – a modern legal framework
for more engaged shareholders and sustainable companies”, available at www.ec.europa.eu.

108ECBFinancial integration in EuropeApril 2014
Whilst such codes of conduct are primarily voluntary in nature, many EU Member States now require issuers to have a code of conduct as a pre-condition for listing their securities on the public securities markets, and in some Member States the code is legally binding.36
2.2 CORPORATE TAXATION
The levels of corporate taxation and the procedures for collecting tax from issuers of publicly listed securities are not regulated at the EU level. The differing levels of tax, but also tax structure and administrative procedures across Member States, influence firms’ decisions to invest across borders. They also impact firms’ ability to access bank funding. For example, there is some evidence that corporate bond financing substituted for bank financing during the financial crisis, when banks were unwilling or unable to lend,37 but this was not the case in all Member States, which may be due also to differences in the national tax frameworks.38
The EU has attempted to coordinate approaches in some areas of corporate (income) taxation (and accounting standards) relevant to capital markets. In particular, the EU has abolished all indirect taxes on the raising of capital, namely the capital duty, stamp duty on securities, and duty on restructuring operations.39 In early 2011, the Commission proposed a common system for calculating the tax base of businesses operating in the EU, the Common Consolidated Corporate Tax Base (CCCTB), so that companies would benefit from a “one-stop-shop” system for filing their tax returns and would be able to consolidate all the profits and losses they incur across the EU. The Commission has also recently considered new policies in the field of corporate taxation,40 acknowledging that most Member States’ systems favour debt over equity, e.g. by making interest payments deductible for issuers, and that investments should be “financing neutrality”. In the area of clearing and settlement, the Commission has adopted a Recommendation on withholding tax relief procedures41 following the recommendations of the FISCO expert group.42 The national procedures for verifying investors’ entitlement to relief from withholding tax on cross-border securities income remain diverse and cumbersome.43 The Commission suggests that the procedures should be simplified and that Member States should apply the withholding tax relief to which an investor is entitled at source (i.e. at the time of payment of the securities income), rather than by refund. In cases where this is not possible, authorities should apply quicker and simpler tax refund procedures, including the use of common formats for refund applications which could be filed electronically.
36 For example, all companies with a Premium Listing of equity shares on a public securities market in the UK are required under the Listing Rules to report on how they have applied the Corporate Governance Code, as amended in 2012 (formerly the Combined Code), in their annual report and accounts. The Code sets out standards of good practice in relation to board leadership and effectiveness, remuneration, accountability and relations with shareholders. Also, The Stewardship Code for Institutional Investors (UK, September 2012) asks investors to disclose their policy on stock lending, and the Kay review of equity markets and long-term decision making (UK, July 2012) sets out ‘good practice statements’ for company directors, asset managers and asset holders, forming the basis for industry-led standards. In Germany, the local governance code is legally binding.
37 See ECB monthly Bulletin, October 2013, p. 21. See also De Fiore, F. and Uhlig, H. (2011), “Bank finance versus bond finance”, Journal of Money, Credit and Banking, 43(7), 1399-1421, and Adrian, Colla, and Shin (2012), “Which financial frictions? Parsing the evidence of the financial crisis of 2007-09”, in NBER Macroeconomics Annual 2012.
38 The Giovannini report, February 2001, stated that “...the pan-EU investor is required to access many national systems that …operate within different tax and legal frameworks. The additional cost that is associated with this fragmented infrastructure represents a major limitation on the scope for cross-border securities trading in the Union.”
39 See Council Directive 2008/7/EC concerning indirect taxes on the raising of capital.40 See Commission Green Paper on Long-Term Financing, available at www.ec.europa.eu.41 C (2009)7924 final.42 See Reports of the EU Clearing and Settlement Fiscal Compliance Experts’ Group (FISCO) (2006-2007) (IP/07/1569).43 There are currently some 60 different withholding tax relief forms being used by national authorities across the EU. Source: FISCO,
DG Markt.

109ECB
Financial integration in EuropeApril 2014
SPECIAL FEATURE C
Further tax regime integration will need to be achieved through EU legislation.44 However, voting rules for adopting EU legal instruments enshrined in the current Treaty impede this. Contrary to most EU financial services legislation which is based on Article 114 TFEU (approximation of laws) and adopted through a ‘fast track’ co-decision procedure with majority voting in the Council, EU tax legislation must be adopted under Article 113 TFEU which requires a unanimous vote in the Council.
3 CRIsIs MANAGEMENT, REsOLUTION AND INsOLVENCy FRAMEWORKs
A basic tenet of insolvency law is that the insolvency of a market participant remains largely a matter of the domestic law of the entity concerned.45 As long as insolvency law – as well as rules on crisis management and resolution – remain national in character, it will be difficult for cross-border investors to properly evaluate which risks they assume when they invest in equities or bonds issued by legal entities in other EU jurisdictions. A full harmonisation of capital markets should therefore also address these important obstacles to integration.
Until recently, the EU hardly intervened in this area. Although it took some 30 years to adopt, the Insolvency Regulation 46 does provide a minimally harmonised procedure at the EU level for the insolvency of EU-established legal entities (with the exception of financial institutions). Notwithstanding this regulation, many issues of substance, such as determining priority (i.e. the order of payment to notified creditors from the insolvency estate), remain anchored in national insolvency law.47 In addition, the Directive on the reorganisation and winding up of credit institutions 48 (Winding Up Directive) establishes a Union-wide procedure for the mutual recognition of insolvency proceedings that have been initiated by administrative or judicial authorities in respect of credit institutions and their branches situated in the Union.
Furthermore, as regards credit institutions and investment firms, in June 2012 the Commission proposed, in the form of a directive, a comprehensive framework for dealing with banks and investment firms in financial distress in the Union (BRRD). A political agreement on the BRRD was reached in December 2013 and the BRRD should come into effect as of 1 January 2015. This framework directive will provide national authorities with common powers and instruments to pre-empt bank crises and to resolve any financial institution in an orderly manner in the event of failure, whilst preserving essential bank operations. It establishes a range of instruments to tackle potential bank crises at three stages: preparatory and preventative, early intervention and resolution. The BRRD also serves as an essential element of the ‘single rulebook’ for resolution of credit institutions applicable to all 28 Member States, including under the Banking Union project pursuant to the SRM regulation. The ECB strongly supports the aims of the BRRD.49
44 For example, tax remains a clear obstacle to the cross-border activity of unit trusts and other collective investment funds. See also “Analysis of the Tax Implications of UCITS IV”, a 2010 report by EFAMA / KPMG, which advocates an EU directive to ensure the tax-neutral treatment of mergers of EU based funds, available at www.kpmg.com.
45 I.e., the law of the jurisdiction where the legal entity has been incorporated.46 Council Regulation (EC) 1346/2000 on insolvency proceedings.47 It is noted that the Settlement Finality Directive 98/26/EC provides harmonised protection for nationally designated payment and
settlement systems and for central banks against the effects of insolvency of a counterparty or of a system participant.48 Directive 2001/24/EC on the reorganisation and winding up of credit institutions; Directive 2001/17/EC applies a similar procedural
mutual recognition regime to the insolvency of insurance undertakings.49 See ECB Opinion CON/2012/99.

110ECBFinancial integration in EuropeApril 2014
In addition to a more harmonised framework for the resolution of credit institutions, a similar insolvency framework would need to be applicable to all market participants – notably corporate issuers, as they are the object of cross-border securities investment – and not just banking institutions. The European Commission has recently proposed a regulation on structural measures improving the resilience of EU credit institutions50 and is expected to adopt a proposal for a framework for crisis management and resolution of some types of systematically important non-bank financial institutions (in particular CCPs) by end 2014, which is consistent with ECB recommendations for the adoption of a comprehensive regime for the resolution of CSDs.51Behind these initiatives are mainly concerns regarding financial stability in parts of the financial system other than the banking sector and the level playing field between banks and non-bank entities.
Further harmonisation of substantive insolvency rules for all EU established corporates is required, however, most importantly as regards the creditors’ rights against the estate of the insolvent corporate. As mentioned at the outset,52 risk is currently not shared across internal EU borders, and access to new finance – because it remains largely national – remains constrained by the financial shocks in the particular Member State where the issuer is incorporated. A common EU insolvency framework would help to share the risk of corporate failure across the EU.
4 sUPERVIsORy AND ENFORCEMENT FRAMEWORKs
The supervision of securities markets and of their participants is still very heterogeneous across the EU. Although the establishment of ESMA has been a major step towards a more harmonised framework (see Box 5), the day-to-day supervision of securities market participants is still left largely in the hands of national competent authorities. National discretion in the application of standards set at the EU level and varying degrees of supervisory scrutiny have led to regulatory arbitrage and to an increased concentration of securities market participants in a few jurisdictions.
With its role in setting standards, ESMA does contribute actively to the protection of investors in EU securities markets or to promoting a level playing field for financial services providers. First, it ensures the consistent treatment of investors across the Union, enabling an adequate level of investor protection through effective regulation and supervision. Second, it promotes equal conditions of competition for financial service providers, as well as ensuring the effectiveness and cost efficiency of supervision for supervised companies. In particular, its contribution to drafting technical standards , as well as its work on developing guidelines and recommendations, addressed to competent authorities and financial market participants, gives ESMA a significant role in establishing a harmonised supervisory framework in securities markets.53
The establishment of the SSM also represents a significant (indirect) move towards a common supervisory framework in securities markets. Many securities market participants are also significant credit institutions. The major activities of credit institutions in securities markets include investment services such as prime brokerage and agent lending activities, as well as proprietary trading.
50 See box 7.51 See ECB Opinion CON/2012/62.52 See the Note by A. Sapir and G. Wolff delivered at the informal ECOFIN on 14 September 2013, Vilnius, referred to in footnote 5.53 The exercise of ESMA’s powers has been seen by some as “quasi rule-making powers”; see for example the EFMLG letter “Issues of
Legal Uncertainty and the European Market Infrastructure Regulation” of 16 August 2013, available at: www.efmlg.org.
111ECB
Financial integration in EuropeApril 2014
SPECIAL FEATURE C
For banks falling under the scope of the SSM, the ECB will be the competent supervisory authority. When carrying out its supervisory tasks, the ECB will use a single set of rules based on the CRD IV/CRR. The harmonised implementation and application of this set of rules represents a move away from minimum harmonisation and the home-host supervisory split towards maximum harmonisation and the single supervisory approach. In addition, non-bank entities that form part of a banking group will be, to some extent, subject to the single supervisory approach. On a consolidated level, the ECB will play a role in the supervision of these non-bank participants. The envisaged cooperation between the ECB and the ESAs, as well as the competent authorities of Member States responsible for markets in financial instruments, will enable the ECB to contribute to a consistent approach to the relevant regulatory rules.54
However, many hurdles remain on the way to a common supervisory framework for securities market participants. A significant number of market participants will remain outside the scope of the SSM, as they do not form part of a banking group. This includes independent broker-dealers and financial intermediaries. For those supervised entities, a patchwork of national supervisory frameworks will continue to exist. Moreover, for parts of the shadow banking sector, it may even be that no adequate framework is in place that provides for sufficient supervision of their activities in securities markets. The recent Commission proposal aimed at increasing transparency of securities financing transactions55 is a step in the direction of a common approach to address these deficiencies.
CONCLUsION
Corporate bond financing is an important substitute for bank financing in a financial crisis, when banks may be unwilling or unable to lend, but such substitution has not been operating uniformly across the Union. A more integrated European market for corporate bonds would help firms to raise funding. The raising of funding by issuing equity to investors across borders is also generally considered to be a more stable source of financing.56 The close integration of European, and indeed euro area, corporate bond and equity markets would therefore be beneficial.
While there has been considerable progress on harmonising rules needed for the transparency (price formation) and integrity of the securities markets (notably market abuse), the European corporate bond and equities markets still require further integration in other equally important areas which would permit more effective risk sharing between corporate issuers and investors, irrespective of their location.
In this respect, it is crucial to harmonise the Member States’ laws relating to rights in securities, as this will enable investors to assess the risk of capital investment in a bank or other corporate in another EU Member State on the same basis. The Commission has been reviewing the complex area of securities laws in the EU for several years to address the legal barriers to the efficient functioning of EU securities markets identified by the Giovannini report in 2005. The work on an EU securities law is continuing. The requirement of more integration also applies to insolvency law. In this context, a resolution framework equivalent to the BRRD should be developed to cover some systemically-important non-bank financial institutions. Moreover, the ECB recommends that a comprehensive regime for the resolution of CSDs should be adopted.
54 See Article 3(1) of Council Regulation (EU) No 1024/2013 conferring specific tasks on the European Central Bank concerning policies relating to the prudential supervision of credit institutions, which foresees close cooperation by the ECB with ESAs and, where necessary, the conclusion of Memoranda of Understanding between the ECB and the competent authorities of Member States responsible for markets in financial instruments.
55 Proposal for a regulation on reporting and transparency of securities financing transactions.56 See the speech by B. Coeuré referred to in footnote 2.

112ECBFinancial integration in EuropeApril 2014
As regards corporate governance, there is a clear move to common legally binding standards (for example on remuneration policies) for issuers who wish to access securities markets. However, many of the other significant initiatives are Member State-led with the blessing of the Commission. A second priority is therefore to achieve further harmonisation on corporate governance. Concerning taxation, there is still relatively little progress towards a unified legal regime, mainly as a result of Treaty-based restrictions. The withholding tax and relief collection procedures for intermediated securities held by non-resident investors – another Giovaninni legal barrier – are still diverse and fragmented, although the Commission has issued a recommendation to simplify these procedures). The area of corporate (income) taxation remains firmly a national competence, and difficult to address in view of the applicable Treaty voting rules. These restrictions also hold back the pace of progress towards an integrated EU market infrastructure, where there has been progress in dismantling some identified operational and technical barriers to integration. Further tax regime integration is therefore needed at the EU level.
Finally, the day-to-day supervision of securities markets and instruments remains largely under national competence. A level playing field in European capital markets will require harmonised rules which are applied and enforced in an identical manner across the Union. In this respect, it is noted that the SSM represents a significant (indirect) move towards a common supervisory framework in securities markets, as many securities market participants are also significant credit institutions. However, a significant number of market participants will remain outside the scope of the SSM, as they do not form part of a banking group.
The completion of the single market as regards integrated European corporate bond and equities markets remains an important objective for EU legislators, as this would contribute to the stability of the EU. What is clear is that the full integration of EU securities market will not occur unless these frameworks are also harmonised, as the legal environment for investment in EU listed securities will continue to differ significantly depending on whether the investor is domestic or non-resident.

113ECB
Financial integration in EuropeApril 2014
SPECIAL FEATURE D
D. THE EUROsysTEM CONTRIBUTION TO FINANCIAL INTEGRATION IN THE AREAs OF sECURITIEs AND COLLATERAL1
This Special Feature outlines the initiatives by the Eurosystem aimed at strengthening financial integration within the domain of securities and collateral management in the euro area. It focuses on TARGET2-Securities (T2S), the Eurosystem integrated platform for settlement of securities in central bank money, which is planned to go live in June 2015. In particular, the article seeks to identify possible ways of measuring the contribution of T2S to the integration of European securities markets, as well as to illustrate the main benefits that T2S is expected to generate for European financial market participants. Moreover, it examines forthcoming enhancements to the Eurosystem’s Correspondent Central Banking Model (CCBM), to be introduced in view of further improving the Eurosystem’s collateral management services and bringing benefits to the market.
INTRODUCTIONTwo trends describe developments in the European securities settlement infrastructure over the past decade. On the one hand, there has been considerable progress in integrating settlement systems at the national level, resulting in improved efficiency on a national basis. On the other hand, however, inefficiencies resulting from fragmentation and lack of harmonisation have remained in place, making the processes of cross-border securities settlement significantly more complex and costly than domestic settlement.
Over the years since 1999, great attention has been drawn to the persistence of barriers to an integrated financial market due to different national practices in post-trading. As described in Special Feature C of the present report, by the early 2000s, the reports issued by the Giovannini Group had already identified barriers to efficient securities clearing and settlement.2 Such fragmentation poses serious obstacles to market access for intermediaries across countries and to efficient collateral management, and ultimately represents a limitation on cross-border investment and portfolio diversification in the EU. Many of these barriers are still in place today, despite the many public and private sector initiatives undertaken in the last decade.
As a result of the aforementioned barriers, the provision of post-trading services remains fragmented along national lines, with securities still settled in over 30 different systems in the EU. The inefficiency and high cost of cross-border securities (including collateral) transactions in Europe is caused by a lack of harmonisation across countries on a legal, fiscal, operational and technical level, which subsequently requires some form of intermediation, most commonly through the use of custodians. The 2001 Giovannini report showed that a typical cross-border equity transaction would require the involvement of as many as 11 intermediaries (compared with only 5 for an equivalent domestic transaction) and a minimum of 14 instructions per trade between parties. This results in operational risks and costs for the securities services industry in the EU. In addition, there are opportunity costs linked to the cross-border activity that is simply foregone because of complexity and barriers. This situation is not aligned with the needs of a single currency, and is also not consistent with the high level of integration achieved in central bank money settlement with
1 Authors: F. van Echelpoel, G. Kalogeropoulos, A. Nuzzolo, J. Ryzner.2 The Giovannini Group was formed in 1996 to advise the European Commission on issues relating to EU financial integration and the
efficiency of euro-denominated financial markets. The Group, composed of financial market participants and chaired by Professor Alberto Giovannini, produced two reports on “Cross-Border Clearing and Settlement Arrangements in the European Union”, in 2001 and 2003. The reports are available at http://ec.europa.eu/internal_market/financial-markets/docs/clearing/first_giovannini_report_en.pdf and http://ec.europa.eu/internal_market/financial-markets/docs/clearing/second_giovannini_report_en.pdf respectively.

114ECBFinancial integration in EuropeApril 2014
the introduction of TARGET in 1999 and, subsequently, the implementation of the single platform system TARGET2 in 2007.
In view of the success of TARGET2, and considering the potential efficiency that could derive from holding both securities and central bank money accounts in an integrated technical environment, in 2008 the Eurosystem decided to develop a single platform for providing securities settlement services to CSDs: TARGET2-Securities (T2S). This decision was based on the market support for the initiative and the large benefits expected from the integration of the European securities infrastructure, as shown by the outcome of a wide market consultation. T2S is planned to go live in June 2015 and, once migration of all participating CSDs to the new platform is completed in early 2017, as currently planned, market integration in the securities field will have made a quantum leap. For more information on the status of the T2S project, please refer to Chapter III of this report (Eurosystem activities for financial integration).
The introduction of T2S will make cross-border settlement identical – in terms of cost, risk and technical processing – to domestic settlement. Its ultimate objective is to make securities settlement safer and more efficient while increasing competition and business opportunities. Users of the new T2S platform will be able to settle securities in multiple CSDs from a single cash account in central bank money, and to move securities more easily and quickly across borders to where they are needed for collateralisation (and other) purposes. As a result, the market expects liquidity and collateral savings to be among the main benefits generated by T2S. Other crucial benefits the market expects to reap from T2S derive from the harmonisation of standards and market practices that the new platform is driving, and that will reduce complexity in the post-trade layer of the European securities markets. These aspects are described more thoroughly in the first part of this Special Feature.
The fragmentation that has so far characterised securities markets also has an impact on the mobilisation across borders of assets as collateral for Eurosystem credit operations, and thus on the collateral/liquidity available to counterparts in the various countries. At the time of the introduction of the euro in 1999, and due to fragmentation at the infrastructure level and the fact that the network of links3 between securities settlement systems (SSSs) was incomplete, there were no adequate market arrangements available that could ensure that all assets eligible for Eurosystem credit operations could be used on a cross-border basis by all Eurosystem eligible counterparties. For this reason the Eurosystem introduced the Correspondent Central Banking Model (CCBM) together with the euro introduction, as an interim solution to facilitate the cross-border use of collateral in Eurosystem credit operations. In the run-up to T2S, and in order to increase the efficiency of counterparties’ collateral management in central bank operations, the Eurosystem will also introduce enhancements to the CCBM by removing the existing repatriation requirement and by supporting triparty collateral management services on a cross-border basis. These enhancements will be introduced in May and September 2014, respectively, and will bring benefits for both Eurosystem counterparties (which provided the Eurosystem with collateral of around €2.3 trillion in Q3 2013) and the euro repo market more generally (which had a value of around €3.6 trillion in December 20134).3 Links consist of a set of procedures and arrangements between securities settlement systems (SSSs) for the cross-border transfer of
securities though a book-entry process. For the purposes of their use in Eurosystem credit operations, the links concerned must have been assessed by the Eurosystem under the “Framework for the assessment of securities settlement systems and links to determine their eligibility for use in Eurosystem credit operations” (User Assessment Framework). Eligible links may take the form of direct or relayed links. See the ECB website for more details on the user assessment framework, eligible SSSs and eligible links: http://www.ecb.europa.eu/paym/coll/coll/html/index.en.html .
4 Source: ICMA European repo market survey number 26 conducted on 12 December 2013. It is noted that the values measured by the survey are gross figures, which means that they have not been adjusted for the double counting of the same transactions between pairs of survey participants. These figures do not include central bank credit operations.

115ECB
Financial integration in EuropeApril 2014
SPECIAL FEATURE D
This Special Feature is divided in two sections. The first section presents T2S and the second section explains developments in Eurosystem collateral management services, with a focus in each section on the respective contributions to financial integration in the areas of securities and collateral.
1 THE EUROsysTEM CONTRIBUTION TO INTEGRATED sECURITIEs sETTLEMENT IN EUROPE: T2s
I.I A sINGLE PLATFORM FOR sECURITIEs sETTLEMENT IN CENTRAL BANK MONEy
T2S will deliver the technical integration required by a single market and currency, with all connected CSDs offering to their users DvP settlement of securities transactions in central bank money on one technical platform, with harmonised operating times and deadlines, operational rules and communication messages. All connected markets will benefit from night-time and intraday securities settlement in central bank money and state-of-the-art optimisation features, including auto-collateralisation.5
Thus far, 24 European CSDs6 (comprising 19 CSDs based in the euro area and 5 from non-euro countries) based in 21 European markets have entered into a contractual agreement with the Eurosystem to outsource their securities accounts to T2S for settlement purposes. They account for almost 100% of euro volumes currently settled in the euro area. On the cash side, 19 central banks will open dedicated cash accounts in euro for their participants in T2S, so that settlement of securities against central bank money will take place in an integrated manner; in addition, the Danish central bank will also join T2S for settlement in Danish krone as of 2018.
The coverage of T2S may further grow in future, as other European central banks (and possibly currencies) and CSDs may yet decide to join the platform.
However, an integrated platform for securities settlement cannot on its own deliver a fully integrated market. The commitment of EU authorities and the industry to increasing the level of harmonisation in post-trading is essential. To contribute to this process, T2S stakeholders (i.e. the Eurosystem, market infrastructures, market participants, public authorities) are working to define and implement common standards and practices in a number of areas in order to maximise the efficiency of cross-border settlement in T2S and ensure market access and equal conditions to all intermediaries. The T2S harmonisation agenda includes some elements important to eliminating barriers to financial integration (see next section).
5 Auto-collateralisation is a credit operation that is triggered when a buyer does not have sufficient funds to settle a securities transaction, in order to improve its cash position. The credit provided can be secured using either the very same securities that are being purchased (“auto-collateralisation on flow”) or securities already held by the buyer (“auto-collateralisation on stock”).
6 The list of the CSDs that have signed up for T2S thus far is available on the T2S website at http://www.ecb.europa.eu/paym/t2s/stakeholders/csd/html/index.en.html.
Map of T2s markets, i.e. markets where at least one CsD has signed up for T2s
Source: www.t2s.eu

116ECBFinancial integration in EuropeApril 2014
I.2 MEAsURING THE T2s CONTRIBUTION TO FINANCIAL INTEGRATION
This section aims to identify possible ways of measuring the impact of T2S on the integration of European securities markets.
The advent of the new integrated platform is already triggering significant changes in the industry, for example with the emergence of new actors in the market.7
Effects are also already observable in terms of the harmonisation of market practice and standards in the post-trading layer of the securities industry. In fact, the T2S project is creating high momentum for markets and authorities to pursue increased cross-border efficiency and integration regarding not only securities settlement, but also cross-border holding of securities and asset servicing. The degree of harmonisation that T2S will help to achieve represents a very good measure of the project’s contribution to financial integration. This section first illustrates the main objectives – and current results – of the T2S harmonisation agenda; it then goes on to highlight further possible ways of measuring the impact of T2S on financial integration which could be pursued in the future.
T2s AND POsT TRADE HARMONIsATIONThe 2001 Giovannini report pointed to the existence of 15 barriers (related to technical requirements/market practice, taxation, and legal certainty)8 preventing efficient clearing and settlement in the EU. T2S will automatically eliminate three of them in the T2S markets as far as settlement is concerned, namely: national differences in information technology and interfaces (Giovannini barrier 1), absence of intraday settlement finality (Giovannini barrier 4), and national differences in operating hours/settlement deadlines (Giovannini barrier 7).
In addition, T2S is contributing to breaking down another three Giovannini barriers, i.e. national clearing and settlement restrictions that require the use of multiple systems (Giovannini barrier 2), differences in national rules relating to corporate actions (part of Giovannini barrier 3), and practical impediments to remote access to national clearing and settlement systems (Giovannini barrier 5).
Finally, T2S is also acting as a catalyst in the removal of the Giovannini barrier related to domestic withholding tax regulations serving to disadvantage foreign intermediaries (Giovannini barrier 11), and in the transition of T2S markets to a harmonised settlement period of T+2 (Giovannini barrier 6).
All these activities are part of the T2S harmonisation agenda. More specifically, the T2S stakeholders have compiled a list of 24 areas (“T2S harmonisation activities”) in which T2S markets need to adopt convergent standards and market practices in order to reap the full benefits of the new European securities settlement model in terms of efficiency and safety at the cross-border level. These activities comprise, for instance, messaging standards, static data, legal harmonisation, corporate actions processing standards, and tax-related issues. The full list, alongside with information on the current status of each activity in all T2S markets, is provided below in Box 8.
7 For instance, two CSDs have been formed in the last few years with a view to participating in T2S, namely LUX CSD, set up in 2010, to provide an access point to T2S for the Luxembourg market and its cross-border business, and BNY Mellon CSD, based in Belgium, focusing on investor CSD business and also targeting issuer CSD activities with Eurobonds and funds. Moreover, it is noteworthy that – subject to regulatory approval – another new CSD has recently been set up by the London Stock Exchange, as announced in July 2013. The new CSD, expected to be operational in the first half of 2014 and based in Luxembourg, is not expected to connect directly to T2S, but will use Monte Titoli, the Italian CSD, as an operational engine and interface to T2S.
8 The full list of barriers to efficient cross-border clearing and settlement in the EU, as identified by the Giovannini Group. is available in the 2001 Giovannini Report at http://ec.europa.eu/internal_market/financial-markets/docs/clearing/first_giovannini_report_en.pdf.

117ECB
Financial integration in EuropeApril 2014
SPECIAL FEATURE D
A number of key T2S harmonisation activities are linked to the CSD Regulation. The implementation of the CSD Regulation will deliver harmonisation in a number of key areas for T2S, establishing a harmonised framework for CSDs to outsource their settlement services to T2S, a harmonised settlement discipline regime (i.e. an EU rule for managing securities settlement fails), a common T+2 settlement cycle, the freedom for issuers to choose where to issue their securities, and improved market access for intermediaries and interoperability between infrastructures. In fact, T2S and the CSD Regulation go hand in hand to deliver a safe, efficient and competitive securities settlement model for Europe (see also Special Feature C). The ECB has expressed its strong support for the timely implementation of the CSDR prior to the launch of T2S.9
As of 2013, results of the T2S harmonisation monitoring exercise are published by the T2S Advisory Group10 in the yearly T2S Harmonisation Progress Reports11 in the form of implementation status colours assigned to individual national markets. This solid and transparent methodology is producing concrete results, and T2S markets are making good progress toward harmonisation. Nevertheless, further work is required as some obstacles to harmonisation are still in place and their removal becomes more urgent while the T2S go-live date draws closer.
In addition, a number of obstacles to efficiency and harmonisation identified in the T2S context but impacting the EU market more widely have been escalated for analysis and follow-up to the European Post Trade Group, an EU-wide forum for post trade harmonisation formed by the Commission, the ECB, the European Securities and Markets Authority (ESMA) and the industry. Issues that have been highlighted as requiring further attention include registration procedures, cross-border shareholder transparency, and CSD rules for account segregation.
The objective of the T2S harmonisation agenda is to achieve full harmonisation in all 24 T2S harmonisation activities. The number of T2S harmonisation standards actually implemented in all T2S markets at the end of the T2S migration period will be an important measure of the degree of integration brought about by T2S, either directly or in its catalyst function.
9 See: http://www.ecb.europa.eu/ecb/legal/pdf/en_con_2012_62_f_sign.pdf.10 The T2S Advisory Group, made up of representatives from all T2S stakeholders, i.e. participating CSDs, banks and national central banks,
provides advice to the Eurosystem on T2S-related issues to ensure that T2S is developed and implemented according to market needs. 11 So far, the T2S Advisory Group has issued four harmonisation progress reports, the first one in July 2011 and the most recent one in
March 2014.
Box 8
sTATUs DAsHBOARD OF THE T2s HARMONIsATION ACTIVITIEs (sOURCE: FOURTH T2s HARMONIsATION PROGREss REPORT, PUBLIsHED ON 19 MARCH 20141)
The dashboard below lists the 24 T2S harmonisation activities selected by T2S stakeholders as necessary to ensure safe and efficient cross-CSD settlement in T2S (priority 1 activities), or to enhance its competitive environment and ensure a level playing field for all intermediaries (priority 2 activities).
1 The Fourth T2S Harmonisation Progress Report is available on the ECB website at www.harmonisation.t2s.eu. It includes information on the current status of all T2S harmonisation activities in all T2S markets.

118ECBFinancial integration in EuropeApril 2014
For each of the 24 harmonisation activities, and with more urgency with regard to the 17 activities marked as first priorities, the T2S Community is committed to implementing common standards/market practice.
Harmonised standards are already agreed by the T2S stakeholders or established by wider EU legislation/harmonisation for 16 out of 24 activities (green definition status in the table). For one
status update per T2s Harmonisation activity (status: 13/02/2014)
Activities – Priority 1 Definition Monitor Compliance
1
T2S messages
T2S ISO 20022 messages G G G2 T2S mandatory matching fields G G G3 Interaction for registration G G G4 Interaction for tax info G G G5 Interaction for CSD ancillary services G G G6 Schedule of settlement day G G G7 T2S corporate actions standards G G R8
Legal harmonisation
Settlement finality I (moment of entry) R X X9 Settlement finality II (irrevocability of transfer
order) G G G
10 Settlement finality III (irrevocability of transfers) G G G11 Outsourcing IT services R X X12 Settlement discipline regime R X X13 Settlement cycles Y X X14 CSD account structures Availability of Omnibus Accounts G G B15 Restrictions on Omnibus Accounts G G G16 T2S accounts numbering Securities accounts numbering G G G17 Dedicated cash accounts numbering G G G
Activities – Priority 2 Definition Monitor Compliance
18 Legal harmonisation Location of securities account/conflicts of law R X X19 Corporate actions market standards CA market (CAJWG) standards G G Y20 Place of issuance R X X21 Tax procedures Withholding tax procedures G R X22 Shareholder Transparency –
registration R X X
23 Market access R X X24 Securities amount data G G G
Colour Descriptions
B Compliance columnAll T2S markets are already in full compliance with the agreed standard and no further monitoring is required.
G
Definition columnA common standard/rule/market practice has been defined and endorsed by T2S stakeholders or EU authorities.Monitoring columnA clear and agreed monitoring and reporting framework is in place and all T2S markets regularly report their compliance status for the given standard.Compliance columnConsidering the overall status of all T2S markets, no obstacles are identified to achieving compliance with the agreed standard before migration to T2S.
Y
Definition columnThe definition of a common standard is underway.Monitoring columnThe definition of a reporting and monitoring framework is underway.Compliance columnSome markets are facing issues that may prevent compliance with the agreed standard before migration to T2S.
RDefinition columnNo standard has been defined yet.Compliance columnA considerable number of markets are facing issues that may prevent compliance with the agreed standard before migration to T2S.
X Process not started yet.

119ECB
Financial integration in EuropeApril 2014
SPECIAL FEATURE D
OTHER POssIBLE MEAsUREs OF THE T2s IMPACT ON FINANCIAL INTEGRATION Additional possible measures of the level of market integration achieved across T2S markets relate to the cost of settlement services, the establishment and use of cross-border settlement connectivity (links between CSDs), and levels of post trade matching and settlement efficiency of securities transactions.
Regarding costs, in T2S all CSDs will be charged the same fees for settlement services, with no distinction between domestic and cross-border transactions (see Box 9 on “Main benefits of T2S for users”). CSDs in turn will negotiate fees with their users. In a fully integrated market, there should also be no price difference between domestic and cross-border transactions for end-users across all participating markets. The extent to which this benefit will materialise and be passed on by CSDs and other intermediaries across the holding chain will represent an important indication of the level of financial integration achieved. Some CSDs have just started going public on their T2S fee structure policy, but this should be revisited as we approach the launch of T2S and of course when T2S is in production.
Regarding the establishment and use of cross-border securities settlement connections (links between CSDs in technical terms), T2S will provide the conditions for the establishment of new links and for an increase in the use of existing ones. T2S offers the integrated technical environment to enable such services (e.g. real time delivery versus payment settlement in central bank money throughout the business day). In addition, the issuer CSDs must offer, at a minimum, omnibus accounts to their foreign participants (investor CSDs and intermediaries) so as to support the concept of CSD interoperability and cross-CSD settlement in T2S.
Today, not all CSDs in Europe are interconnected through links. The use of these links is very limited, at least from the direct insight of the Eurosystem: their eligibility and use for Eurosystem credit operations (see section 2 of this Special Feature).
T2S is expected to lead to an increase in the number and usage of links between CSDs. Some CSDs have expressed their intention to establish links with all other CSDs that participate in T2S, signalling a trend for increased settlement of securities issued in other CSDs. Also, regarding the number of links that will be used for Eurosystem credit operations, early indications from CSDs
activity, the process of defining a common standard is underway (yellow definition status). The definition of harmonised standards remains pending for the other seven activities (red definition status), most of which are linked to the EU adoption of the CSD Regulation.
All T2S markets regularly report on the status of their compliance with the 15 currently monitored standards (see compliance column). For 13 activities, most T2S markets either already comply or see no obstacles to implementing standards before connecting to T2S (blue or green compliance status). These include the use of T2S messages based on the global ISO20022 standards and the provision of omnibus accounts to foreign participants, which is a key precondition for the creation of cross-border links. Finally, in two cases the overall assessment of T2S markets still identifies some delays or obstacles to implementation (yellow or red compliance status).
The objective of the T2S harmonisation agenda is to achieve full compliance in all T2S markets in the 24 activities; the target date for the first priorities is the migration to T2S of the relevant market.

120ECBFinancial integration in EuropeApril 2014
from the first T2S migration wave point to a substantial increase in the number of eligible links. The total number of links in T2S, the number of Eurosystem eligible links in T2S, and the extent to which they will be used will help estimate the proportion of cross-border settlement in T2S, which ultimately represents a major indication of the project’s contribution to an integrated securities settlement market.
Finally, an additional evaluation of the level of market integration achieved across T2S markets could be a comparison of matching rates regarding intra-CSD transactions (transactions between counterparties who are participants in the same CSD) and cross-CSD transactions (transaction where counterparties hold accounts in different CSDs). Full integration would mean equal matching efficiency (depending on the rate of early matching) and settlement efficiency (depending on the rate of transactions settled by the end of the intended settlement date) for all transactions in T2S.
I.3 T2s PROjECT sTATUs AND WAy FORWARD
The T2S project, which is being carried out in close cooperation with CSDs and market participants, is approaching a crucial phase. The T2S software, now fully developed, is being tested internally and will be delivered to CSDs for testing with their user communities in October 2014.
The new platform is scheduled to go live in June 2015, and the participating CSDs will connect to it in four subsequent waves. By the time migration to T2S is completed, as planned, in February 2017, post-trading in Europe is expected to have a new shape and to have achieved a significantly higher level of market integration.
The work of the ECB and the T2S stakeholders will continue to focus on the support of the T2S harmonisation agenda. In parallel, and as we approach the T2S launch date, there needs to be an evaluation of how the indicators mentioned above could be further substantiated.
Box 9
QUANTIFyING T2s BENEFITs FOR MARKET PARTICIPANTs
Reduced cost of cross-border settlement – A reduction in fees for cross-border settlement of securities has been one of the main goals of the T2S project from its outset. Due to the current dispersion of settlement services over a multitude of platforms and to the high need for intermediation, settling across borders today costs many times more than settling within the same country. With T2S, cross-border and domestic transactions will be processed in the same way, and the same fees will be charged to CSDs for both intra-CSD and cross-CSD transactions.
According to the ECB’s T2S Economic Impact Assessment, which was based on data provided by market participants in 2008, the average cost of domestic CSD settlement in the euro area was 73 cent in 2008. The price for cross-border transactions is estimated as being much higher. In T2S, CSDs will be charged 15 eurocent per Delivery-versus-Payment instruction (a transaction includes two instructions); additionally, matching on the T2S platform will cost 3 eurocent per instruction. The final fee for CSD users will also include the network communication costs (negotiated by individual CSDs directly with the T2S-licensed network providers) and any

121ECB
Financial integration in EuropeApril 2014
SPECIAL FEATURE D
potential CSD add-ons1 (although several CSDs have already publicly announced that they will reduce their settlement costs after their migration to T2S, adding little or nothing to the T2S fees).
Collateral and liquidity savings – Besides the expected reduction of the costs of cross-border transactions, which also depends on the strategy chosen by CSDs and on the extent to which they decommission their legacy IT systems, market participants are expecting much wider benefits from T2S, especially as far as collateral and liquidity savings are concerned.
T2S will enable users to pool their collateral and liquidity, as well as to facilitate their cross-border mobilisation, thus realising significant savings.
Today, cross-border collateral management is inefficient because of the existence of several pools and interfaces; the need for intermediaries to maintain multiple precautionary buffers of collateral in several markets leads in many cases to over-collateralisation. T2S will make it possible for banks to have a single buffer for the entirety of their European business in the currencies settled by T2S. A single pool of assets and liquidity will automatically net short and long positions in various markets, thus potentially generating significant collateral savings.2 This has been a major reason for the market’s backing of the T2S project, as also revealed by the T2S Economic Impact Analysis in 2008. At the time, the ECB conducted a survey of market participants who were asked to estimate the monetary value of the savings in collateral that T2S would deliver. For the euro area markets, the monetary value of collateral savings to be made each year by the banking industry was estimated to be around €50 million.3
Moreover, at a time when collateral management has become particularly important owing to the crisis and the ensuing regulation, the increased velocity of cross-border collateral transfers in T2S represents a key benefit for users.
Reduction of back office costs – The reduction in custodians’ back office costs is one of the key sources of efficiency gains resulting from harmonised, borderless settlement. In the current fragmented environment, where local settlement procedures differ significantly, custodians tend to maintain separate back offices in order to interact with each CSD, or else employ a local sub-custodian to carry out the task on their behalf. Provided that market practices and standards are harmonised across T2S markets as foreseen in the T2S harmonisation agenda (see above, the section “Measuring the T2S contribution to financial integration”), the single technical T2S platform will make it much easier for custodians to consolidate these separate back offices into a central back office and achieve a very high degree of automation. As regards the financial impact of T2S, the ECB’s Economic Impact Assessment, published in 2008, estimated that T2S would result in annual back office cost savings of €48 million per year.
Making Europe a better place to trade and invest – The ultimate goal of the T2S project is to contribute to making Europe a better place to trade and invest, not only by making securities settlement safer and more efficient, but also by enhancing freedom of choice in the securities settlement industry in Europe. This will be achieved by increasing transparency, openness and
1 The T2S pricing policy was defined by the Governing Council of the ECB in November 2010: please see the related press release at http://www.ecb.europa.eu/press/pr/date/2010/html/pr101119.en.html. The full T2S price list for CSDs is available on the T2S website at http://www.ecb.europa.eu/paym/t2s/pricing/list/html/index.en.html.
2 See the T2S video “T2S – a single gateway for your collateral management” at http://www.youtube.com/watch?v=dbyma82l-rQ&list=PL347E929CBF4A76F7&index=2.
3 ECB, T2S Economic Impact Assessment, 7 May 2008 (http://www.ecb.europa.eu/paym/t2s/pdf/eco_impact_080523.pdf).

122ECBFinancial integration in EuropeApril 2014
2 DEVELOPMENTs IN EUROsysTEM COLLATERAL MANAGEMENT sERVICEs
Ahead of the go-live of T2S, and against a background of increased focus on more optimal mobilisation, use and management of collateral assets, the Eurosystem is introducing enhancements to its collateral management services. These enhancements relate in particular to the CCBM and aim to benefit both the Eurosystem and the market more generally.
2.1 THE CCBM AND THE BENEFITs THEREOF FOR EUROsysTEM COUNTERPARTIEs AND FINANCIAL INTEGRATION
All Eurosystem credit operations (including monetary policy operations and intraday credit operations) should be based on adequate collateral, namely marketable and non-marketable assets fulfilling certain eligibility criteria. This means that Eurosystem counterparties may obtain credit from the NCB of the Member State in which they are located by making use of eligible assets issued in another euro area country.12
The CCBM, as introduced by the Eurosystem in 1999, establishes procedures enabling Eurosystem counterparties to receive credit from their home central bank (HCB) against eligible assets held in another euro area country. To do so, Eurosystem counterparties transfer such assets to a correspondent central bank (CCB), typically the national central bank of the country where the assets are issued. The CCB then holds the collateral on behalf of the HCB (i.e. the CCB acts as a custodian for the HCB). The credit can be extended by the HCB once it has been notified by the CCB that the collateral has been received.
12 For further details regarding the Eurosystem framework for eligible collateral, see Chapter 6 of the ECB publication “The implementation of monetary policy in the euro area: General documentation on Eurosystem monetary policy instruments and procedures”.
competition between CSDs, penetrating the largely monopolistic national environment that they currently operate in.
With over 40 CSDs active in the EU today, the range of different national regulations and market practices have created a very opaque settlement industry that is difficult for investors to navigate. Although the publication of settlement tariffs was made compulsory in the European Code of Conduct for clearing and settlement in 2006, T2S endeavours to increase comparability with a fully transparent and uniform price list. Moreover, T2S will separate the settlement “infrastructure” from the “service”, giving customers in T2S more freedom of choice as regards where they want to trade and settle. Following delivery of the system, CSDs will need to compete to be their customers’ preferred gateway to T2S, and in doing so must become open about what they are able to offer. T2S aims to ensure that customers will no longer be prevented from crossing national borders owing to technical and market practice restrictions.
As a result, T2S will considerably facilitate access to European securities markets for non-European investors. Non-Europeans typically access European markets through global/regional custodians, which in turn rely on an extensive web of local custodians. The process is complex and costly. T2S will simplify the entry point to the EU market, leading to savings for non-Europeans as well.

123ECB
Financial integration in EuropeApril 2014
SPECIAL FEATURE D
Equal conditions to access Eurosystem monetary policy and intraday credit operationsThe CCBM fully supports equal treatment conditions by allowing for any marketable or non-marketable asset eligible for use in Eurosystem credit operations under the Single List of collateral to be equally used by all Eurosystem counterparties, regardless of the location of the underlying assets or the counterparties.
The CCBM has supported integration of financial markets in the euro area by providing a well-functioning cross-border delivery mechanism, thereby encouraging Eurosystem counterparties to diversify their collateral portfolios to include increased volumes of non-domestic assets which can be used in both market operations and central bank credit operations alike.
More flexibility for liquidity managementThe CCBM supports liquidity management for euro area counterparties by ensuring that the full range of eligible collateral can be used in collateralised liquidity operations with the Eurosystem. In contrast to market alternatives which have rather early cut-off times in many cases, the availability of the CCBM until 16.00 CET each day, and possibly later on a best efforts basis, adds to the flexibility for Eurosystem counterparties in carrying out their liquidity management activities.
The relative use of cross-border collateral via the CCBM increased continuously from 1999 until the advent of the financial crisis in mid-2007, by which point, in value terms, around 40% of all collateral was being delivered to the Eurosystem cross-border via the CCBM (in total, slightly more than half of all collateral was delivered cross-border at that stage). This trend was subsequently reversed, and by end-2013, collateral mobilised via the CCBM accounted for only 13% of the total value of collateral delivered to the Eurosystem. Nevertheless, despite the decrease of the relative reliance on cross-border collateral over recent years, the CCBM continues to be the most heavily used channel for cross-border mobilisation of marketable assets. While the use of the alternative solution of eligible links between securities settlement systems (SSSs) has increased, overall the use of links still remains low and covers only 6.5% of the total collateral delivered to the Eurosystem in 2013.
Chart 60 presents the evolution of collateral mobilised cross-border via the CCBM and eligible links in Eurosystem credit operations since 1999, together with the share of cross-border collateral as a percentage of total collateral delivered to the Eurosystem during this time.
2.2 ENHANCEMENTs TO CCBM WILL PROVIDE FURTHER BENEFITs FOR EUROsysTEM COUNTERPARTIEs AND FINANCIAL INTEGRATION
REMOVAL OF REPATRIATION REQUIREMENTWhile the CCBM has performed well over the years and continues to be more used by Eurosystem counterparties than the links alternative, it currently includes one feature which restricts its overall efficiency, namely
Chart 60 Evolution of collateral mobilised via the CCBM and eligible links
(EUR billions; share of cross border collateral)
0
10
20
30
40
50
60
0
100
200
300
400
500
600
700
800
1999 2001 2003 2005 2007 2009 2011 2013
CCBMeligible linkspercentage of cross-border collateral
Source: ECB.

124ECBFinancial integration in EuropeApril 2014
the repatriation requirement. The repatriation requirement has been an intrinsic feature of the existing CCBM since its initial introduction in 1999 and specifies that assets need to be transferred back to the original issuer CSD before they can be brought to the Eurosystem as collateral via the CCBM. In the years since 1999, however, significant legal and industry developments have taken place, most notably the harmonisation of law through EU legal acts such as the Settlement Finality Directive and the Financial Collateral Directive, which pave the way for removing the repatriation requirement. Technical and operational advancements on the Eurosystem side over the years also support a move in this direction. Against this background, the Eurosystem committed in 2012 to removing the repatriation requirement in May 2014, thereby allowing counterparties to opt for a more consolidated approach to the management of their collateral assets and to maximise the benefits related to the use of cross-border triparty collateral management services in Eurosystem credit operations.
sUPPORT OF CROss-BORDER TRIPARTy COLLATERAL MANAGEMENT sERVICEsThe Eurosystem is also preparing for the support of cross-border use of triparty collateral management services via the CCBM in 2014, thereby making such services equally available to all euro area counterparties. Triparty collateral management services allow institutions to manage their collateral assets via a triparty service provider, i.e. a triparty agent, which acts on behalf of the collateral giver and collateral taker to mobilise and manage collateral assets in a streamlined and efficient manner. In essence, a range of operational activities are assigned by the collateral giver/taker to the triparty agent, thereby reducing the burden on the back office of the respective collateral giver/taker. The range of services provided by triparty agents in this respect includes collateral allocation, valuation and substitution, with the collateral allocation processes operated in a highly sophisticated and automated manner, based on complex algorithms that take into account the economic value of the collateral assets in a client’s portfolio. Triparty collateral management services may be used both in operations with the Eurosystem and in operations among financial market participants.
Today, triparty services are only available domestically to Eurosystem counterparties in a small number of countries (Germany, Luxembourg, France and Italy). During September 2014, the Eurosystem will go live with the support of three models of cross-border triparty collateral management services via the CCBM, thereby extending the use of such services to all euro area counterparties, regardless of the location of the counterparty or the respective triparty services. The three models supported by the Eurosystem are based on the triparty solutions offered by Clearstream Banking Frankfurt (Model 1), Clearstream Banking Luxembourg (Model 2) and the Euroclear Group (Model 3).13 Any future cross-border offerings by triparty agents for use in Eurosystem credit operations (e.g. the offering of Monte Titoli) shall be aligned with one of these three models.
With the removal of the repatriation requirement and integration of triparty services in the CCBM, the Eurosystem is establishing conditions to support:
– more efficient collateral management – counterparties will be in a position to manage their collateral holdings in a more flexible and cost-efficient manner, for use in both Eurosystem credit operations and the private repo market. More specifically, counterparties will have the possibility to consolidate their holdings at one or a few (international) central securities depositories ((I)CSDs)/triparty agents. For triparty services to be of interest for market participants in the context of Eurosystem credit operations, the latter need to be able to hold in the respective
13 The main differences between the three available models relate to the technical and operational setup, such as message types and operational procedures.

125ECB
Financial integration in EuropeApril 2014
SPECIAL FEATURE D
triparty collateral pools, not only assets issued in the local CSD of the triparty service provider but also, via eligible settlement links, assets issued in other CSDs; this will be facilitated by the removal of the repatriation requirement. In addition, with the removal of the repatriation requirement, EEA non-euro area issued securities denominated in euro and which fulfil all other Eurosystem eligibility criteria could, in principle, be used for Eurosystem credit operations.14
– more liquid collateral pools – the optimisation benefits related to the integration of triparty services under the CCBM are of particular importance in view of the increasing demand for collateral assets and related need for more liquid collateral pools. The use of triparty collateral management services provided by (I)CSDs creates a linkage which allows counterparties to flexibly switch their collateral between central bank refinancing and interbank market financing. Such arrangements help to reduce the risk of liquidity constraints stemming from a lack of accessible collateral and thus in turn lend support to a smooth functioning of the market. The incorporation of these services under the CCBM provides further impetus for ongoing market efforts to establish interoperability between the individual triparty arrangements. Triparty settlement interoperability aims to bring together borrowers and lenders, regardless of where the underlying liquidity or collateral is held, thereby avoiding the build-up of collateral/liquidity silos in the market.
On an overall basis, looking at the increased support of triparty collateral management services at domestic level in Eurosystem credit operations in recent years, as well as taking into account the removal of the repatriation requirement and support of cross-border triparty collateral management services in 2014, it is clear that the conditions are being set to incentivise the establishment of new links and upgrade the functioning of existing links. With the introduction of T2S following a phased migration approach between 2015 and 2017, there will be even greater incentives, and improved possibilities, for SSSs to establish links between each other, as links shall operate in a more standardised and automated manner due to the fact that most CSDs will be using the same platform (T2S). If the increase in links materialises to the extent expected with T2S, the need for the CCBM may be greatly reduced, consistent with the original vision of the Eurosystem to have the CCBM only as an “interim solution” until adequate euro area-wide market solutions become available.
14 For such assets to be used in Eurosystem credit operations, the respective non-euro area EEA issuer CSDs must establish links with euro area CSDs in order to fulfil the Eurosystem condition that the eligible assets are held and settled in a euro area CSD. Such a condition is necessary in order to minimise legal risks by assuring that potential perfection and realisation of collateral are subject to the law of a euro area Member State. The respective non-euro area EEA issuer CSDs and any link(s) they may establish with euro-area CSD(s) as investor CSD(s) would have to be positively assessed by the Eurosystem under its User Assessment Framework before being eligible for use in Eurosystem credit operations.
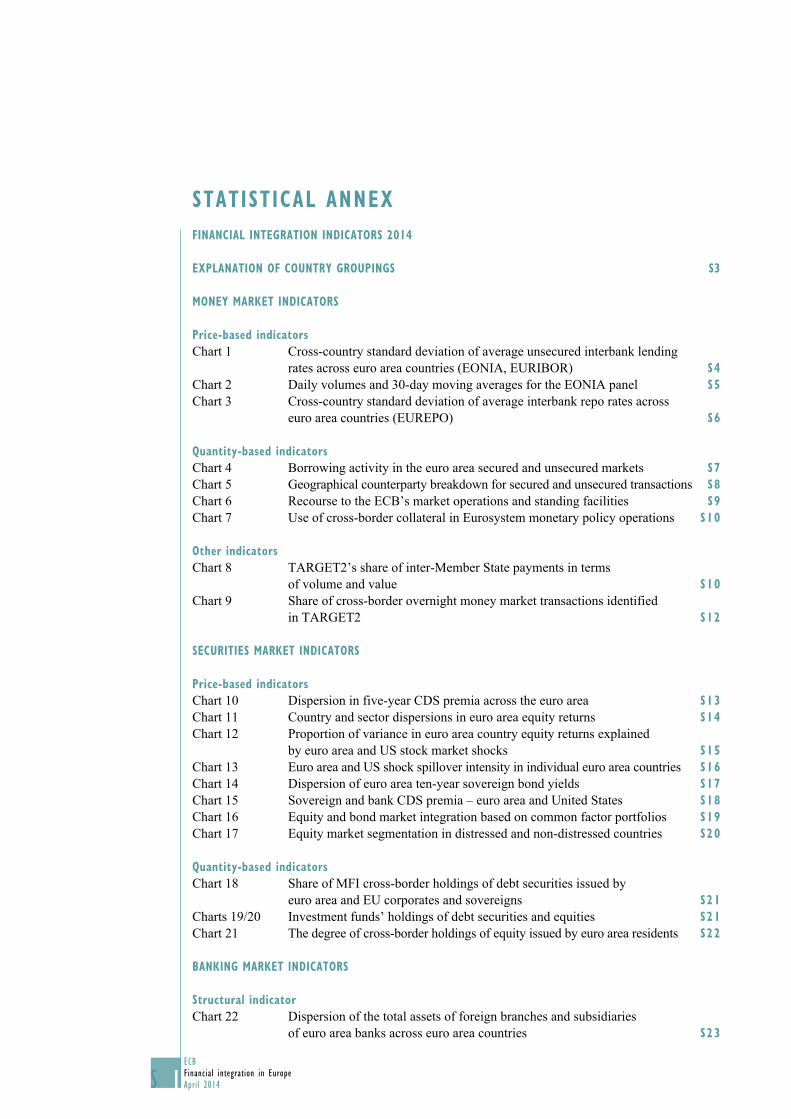
1ECBFinancial integration in EuropeApril 20141S
FINANCIAL INTEGRATION INDICATORs 2014
EXPLANATION OF COUNTRy GROUPINGs s3
MONEy MARKET INDICATORs
Price-based indicatorsChart 1 Cross-country standard deviation of average unsecured interbank lending
rates across euro area countries (EONIA, EURIBOR) s4Chart 2 Daily volumes and 30-day moving averages for the EONIA panel s5Chart 3 Cross-country standard deviation of average interbank repo rates across
euro area countries (EUREPO) s6
Quantity-based indicatorsChart 4 Borrowing activity in the euro area secured and unsecured markets s7Chart 5 Geographical counterparty breakdown for secured and unsecured transactions s8Chart 6 Recourse to the ECB’s market operations and standing facilities s9Chart 7 Use of cross-border collateral in Eurosystem monetary policy operations s10
Other indicatorsChart 8 TARGET2’s share of inter-Member State payments in terms
of volume and value s10Chart 9 Share of cross-border overnight money market transactions identified
in TARGET2 s12
sECURITIEs MARKET INDICATORs
Price-based indicatorsChart 10 Dispersion in five-year CDS premia across the euro area s13Chart 11 Country and sector dispersions in euro area equity returns s14Chart 12 Proportion of variance in euro area country equity returns explained
by euro area and US stock market shocks s15Chart 13 Euro area and US shock spillover intensity in individual euro area countries s16Chart 14 Dispersion of euro area ten-year sovereign bond yields s17Chart 15 Sovereign and bank CDS premia – euro area and United States s18Chart 16 Equity and bond market integration based on common factor portfolios s19Chart 17 Equity market segmentation in distressed and non-distressed countries s20
Quantity-based indicatorsChart 18 Share of MFI cross-border holdings of debt securities issued by
euro area and EU corporates and sovereigns s21Charts 19/20 Investment funds’ holdings of debt securities and equities s21Chart 21 The degree of cross-border holdings of equity issued by euro area residents s22
BANKING MARKET INDICATORs
structural indicatorChart 22 Dispersion of the total assets of foreign branches and subsidiaries
of euro area banks across euro area countries s23
sTATIsTICAL ANNEX

2ECB
Financial integration in EuropeApril 2014 S 2
STAT IST ICAL ANNEX
S
Activity-based indicatorsCharts 23 to 26 Activity-based indicators: MFI loans, holdings and deposits s24Chart 27 Interest rates on new loans to euro area non-financial corporations s25Chart 28 Interest rates on MFI deposits for households in the euro area s26Chart 29 MFI loans to non-financial corporations s26Chart 30 Standard deviation of banks’ CDS premia by country group s27
survey-based indicatorChart 31 Changes in credit standards s28
Price-based indicatorsChart 32 Cross-country standard deviation of MFI interest rates on new loans
to non-financial corporations s28Chart 33 Cross-country standard deviation of MFI interest rates on loans
to households s29
Other indicatorsChart 34 Credit transfer and direct debit transactions processed in SEPA format
in the euro area s30
DEVELOPMENT INDICATORs
Chart 35 Size of capital markets s31Chart 36 Debt securities issued by non-financial corporations s32Charts 37/38 Venture capital finance and private equity investments s32Chart 39 Pricing of global and regional information in the stock market s33

3ECBFinancial integration in EuropeApril 20143S
EXPLANATION OF THE COUNTRy GROUPINGs In this year’s financial integration report, some financial integration indicators show not only the average across all euro area countries, but also a distinction between two groups of countries. The reason is that some financial integration phenomena can only be presented effectively when financial market developments of country groups are compared with each other. A simple average across all countries could hide or blur important financial integration developments for some indicators in the Statistical Annex, in particular in the money markets.
To make the distinction between country groups, a clear financial market criterion was selected in order to achieve an objective result which does not involve discretion. The grouping of countries is based on long-term sovereign interest rates for bonds with a remaining maturity of approximately ten years. The calculation of the average spread against the German long term sovereign interest rate has used monthly data between January 2007 and November 2013. This factual criterion, which is simple and should thus be interpreted with due caution, leads to the following country groups:
• Countrieswith the highest sovereign interest rates:Cyprus,Greece, Ireland, Italy, Portugal,Slovenia and Spain. In the Statistical Annex, this group of countries is called “countries under financial stress” or “distressed countries”.
• Countrieswiththelowestandintermediaterates:Austria,Belgium,Estonia,Finland,France,Germany, Luxembourg, Malta, the Netherlands and Slovakia. In the Statistical Annex, this group of countries is called “non-distressed countries”.
Some financial integration indicators broken down by country grouping do not incorporate all the countries mentioned above, as data is sometimes not available for all countries. Where this is the case, the description of the respective indicator explains which countries are included.

4ECB
Financial integration in EuropeApril 2014 S 4
STAT IST ICAL ANNEX
S
MONEy MARKET INDICATORs
PRICE-BAsED INDICATORs
Chart 1
Cross-country standard deviation of average unsecured interbank lending rates across euro area countries (EONIA/EURIBOR)
Non-technical descriptionThe analysis of the dispersion of interbank rates across countries contributes to the assessment of the state of integration and to the possible segmentation of markets. However, an increase in the standard deviation of rates cannot be automatically interpreted as sign of decreasing financial integration, given that other factors, like liquidity and the interplay with sovereign debt markets, also have an impact on the standard deviation.
DescriptionThe EBF makes available (daily) business frequency data for a panel of individual institutions for both unsecured and secured short-term interbank debt and deposits. These data cover the EONIA and the EURIBOR (unsecured lending) as well as the EUREPO for various maturities.1 Data on the EONIA SWAP INDEX are also available. For each dataset, the indicator is the unweighted standard deviation Dt of average daily interest rates prevailing in each euro area country. Reported rates are considered to be the national rates of country c if the reporting bank is located there. However, the counterparty of the transaction is not known, and the reported interest rate could thus potentially refer (in part) to transactions with a bank outside country c. The number of euro area countries (nt ) is the number of countries that had adopted the euro in the reference period:
Dt = 1nt
— ∑c
( rc,t – rt )2 (1)
1 For further information, see the EURIBOR. See also “The contribution of the ECB and the Eurosystem to European financial integration” in the May 2006 issue of the ECB’s Monthly Bulletin.
Chart 1 Cross-country standard deviation of average unsecured interbank lending rates across euro area countries (EONIA/EURIBOR)(61-day moving average: basis points)
overnight1-month maturity12-month maturity
Non-distressed countries 1)
2001 2003 2007 2009 2011 20131999 20050
5
10
15
20
25
0
5
10
15
20
25
Distressed countries 2)
0
5
10
15
20
25
0
5
10
15
20
25
2001 2003 2007 2009 2011 20131999 2005
All countries 3)
0
5
10
15
20
25
0
5
10
15
20
25
2001 2003 2007 2009 2011 20131999 2005
Sources: EBF and ECB calculations.1) Here: AT, BE, DE, FI, FR, LU, NL.2) Here: ES, GR, IE, IT, PT.3) Here: AT, BE, DE, ES, FI, FR, GR, IE, IT, LU, NL, PT.

5ECBFinancial integration in EuropeApril 20145S
where rc,t is the unweighted average of the interest rate ri,tc reported by each of the panel banks mc at
time t in country c:
= 1mc∑r c
i,trc,t
n
i=1 (2)
The euro area average rt is calculated as the unweighted average of the national average interest rates rc,t. The data are smoothed by calculating a 61 (business) day centred moving average of the standard deviation, transformed into monthly figures and taking the end-of-month observation of the smoothed series. For indicative series prices (EURIBOR, EUREPO), the data are corrected for obvious outliers. The computed indicator has a monthly frequency.
Additional informationThe EONIA is the effective overnight reference rate for the euro. The banks contributing to the EONIA are the same as the EURIBOR panel banks (composed of banks resident in the euro area and in other EU Member States, as well as some international banks). The EURIBOR is the rate at which euro interbank term deposits are offered by one prime bank to another within the euro area.
Chart 2
Daily volumes and 30-day moving averages for the EONIA panel
Non-technical descriptionA lower daily number of banks trading in the EONIA interbank market, besides being a signal of possible increasing fragmentation of the market, has an impact on the values of the indicators calculated above.
DescriptionThis chart shows the number of banks in the EONIA panel for which a price is available on a given date. The centred 30-day moving average is also displayed.
Chart 2 Daily volumes and 30-day moving averages for the EONIA panel
(EUR million)
010,00020,00030,00040,00050,00060,00070,00080,00090,000
010,00020,00030,00040,00050,00060,00070,00080,00090,000
1999 2001 2003 2005 2007 2009 2011 2013
daily volumes (EUR millions)daily volumes: moving average (30 days)
Sources: EBF and ECB calculations.

6ECB
Financial integration in EuropeApril 2014 S 6
STAT IST ICAL ANNEX
S
Chart 3
Cross-country standard deviation of average interbank repo rates across euro area countries (EUREPO)
Non-technical descriptionThe analysis of the dispersion of interbank rates across countries contributes to the assessment of the state of integration and to the possible segmentation of markets. However an increase in the standard deviation of rates cannot be automatically interpreted as sign of decreasing financial integration, given that other factors, like liquidity and the interplay with sovereign debt markets, also have an impact on the standard deviation.
DescriptionThe EBF makes available (daily) business frequency data for a panel of individual institutions for both unsecured and secured short-term interbank debt and deposits. These data cover the EONIA and the EURIBOR (unsecured lending) as well as the EUREPO for various maturities.1 Data on the EONIA SWAP INDEX are also available. For each dataset, the indicator is the unweighted standard deviation Dt of average daily interest rates prevailing in each euro area country. Reported rates are considered to be the national rates of country c if the reporting bank is located there. However, the counterparty of the transaction is not known, and the reported interest rate could thus potentially refer (in part) to transactions with a bank outside country c. The number of euro area countries nt is the number of countries that had adopted the euro in the reference period:
Dt = 1nt
— ∑c
( rc,t – rt )2 (1)
where rc,t is the unweighted average of the interest rate ri,t
c reported by each of the panel banks mc at time t in country c:
rc,t = — i,t1mc
∑n
i=1r c (2)
Chart 3 Cross-country standard deviation of average interbank repo rates across euro area countries (EUREPO)(61-day moving average; basis points)
0
1
2
3
4
5
6
7
8
9
10
0
1
2
3
4
5
6
7
8
9
10
2003 2004 2005 2006 2007 2008 2009 2010 2011 2012 2013
1-month maturity12-month maturity
Non-distressed countries 1)
0
1
2
3
4
5
6
7
8
9
10
0
1
2
3
4
5
6
7
8
9
10
2003 2004 2005 2006 2007 2008 2009 2010 2011 2012 2013
Distressed countries 2)
0
1
2
3
4
5
6
7
8
9
10
0
1
2
3
4
5
6
7
8
9
10
2003 2004 2005 2006 2007 2008 2009 2010 2011 2012 2013
All countries 3)
10
9
8
7
6
5
4
3
2
1
0
10
9
8
7
6
5
4
3
2
1
02003 2004 2005 2006 2007 2008 2009 2010 2011 2012 2013
Sources: EBF and ECB calculations.1) Here: AT, BE, DE, FI, FR, LU, NL2) Here: ES, GR, IE, IT, PT3) AT, BE, DE, ES, FI, FR, GR, IE, IT, LU, NL, PT

7ECBFinancial integration in EuropeApril 20147S
The euro area average rt is calculated as the unweighted average of the national average interest rates rc,t. The data are smoothed by calculating a 61 (business) day centred moving average of the standard deviation, transformed into monthly figures and taking the end-of-month observation of the smoothed series. For indicative series prices (EURIBOR, EUREPO), the data are corrected for obvious outliers. The computed indicator has a monthly frequency.
Additional informationThe EUREPO is the rate at which one bank offers, in the euro area and worldwide, funds in euro to another bank if in exchange the former receives from the latter the best collateral within the most actively traded European repo market.
QUANTITy-BAsED INDICATORs
Chart 4
Borrowing activity in the euro area secured and unsecured markets
Non-technical descriptionThis indicator shows the development of borrowing activity in the euro area, divided into unsecured and secured money markets, and distressed and non-distressed countries. Following the onset of the financial crisis, some segments of the money market developed differently to others. Several indicators show that, overall, the secured/repo market fared much better during the financial crisis than other segments of the interbank market, in particular the unsecured market. This result is not surprising given the fact that the collateralised nature of repo transactions makes them more resilient to heightened credit risk concerns than unsecured transactions. The two charts show that, as counterparty and liquidity risks significantly increased, recourse was indeed made to the secured money market as an alternative to the unsecured market. As expected, the negative development for distressed countries in the unsecured segment is more pronounced that for non-distressed countries. It is also worth pointing out that the transfer to secured markets started well before the outbreak of the financial crisis in 2007. This may reflect the fact that collateralised transactions are more complex in terms of legal and settlements issues, and that today’s non-distressed countries were sophisticated enough in early 2000 to conduct these types of transaction.
Chart 4 Borrowing activity in the euro area secured and unsecured markets
total borrowing activity on unsecured money market, average daily turnover, indexed on 2003=100
total borrowing activity on money market repo, average daily turnover, indexed on 2003=100
distressed countries
0
50
100
150
200
250
300
350
0
50
100
150
200
250
300
350
2003 2005 2007 2009 2011 2013
non-distressed countries
0
50
100
150
200
250
300
350
0
50
100
150
200
250
300
350
2003 2005 2007 2009 2011 2013
Source: ECB’s Euro Money Market Survey.

8ECB
Financial integration in EuropeApril 2014 S 8
STAT IST ICAL ANNEX
S
DescriptionThe data for these charts are related to the Euro Money Market Survey, conducted annually by the ECB with panel banks who report their activity in the different segments of the money market.
To compute the data, we first divided the banks in two sub-panels: distressed countries and non-distressed countries. Then for each sub-panel we add the total borrowing activity on unsecured markets (red line) and the total borrowing activity on repo markets (blue line). The initial numbers correspond to the average daily turnover in the second quarter of each year, with 2002 as the base year.
Chart 5
Geographical counterparty breakdown for secured and unsecured transactions
Non-technical descriptionThe charts display the shares in percentage points of different geographical locations of counterparties in transactions in the money markets. Secured and unsecured transactions are combined, but the development is mainly driven by secured transactions, as this market segment is larger than the unsecured market. The charts show that the share of domestic transactions is higher for distressed countries, while the share of transactions with other euro area countries is higher for non-distressed countries. Thus, non-distressed countries are more able to conduct cross-border transactions which highlight financial fragmentation between the groups of countries. So, for example, the increased exposure in 2012 to domestic counterparties for both groups reflects the continuing concerns about the sovereign debt crisis and its spillover to the respective banking systems.
DescriptionThe data for these charts are related to the Euro Money Market Survey, conducted annually by the ECB with panel banks who report their activity in the different segments of the money market. In the survey, the banks report their activity in the secured and unsecured segments and the nature of the counterparty: domestic, inside of the euro area or outside (other). These charts show the aggregation of the breakdown
Chart 5 Geographical counterparty breakdown for secured and unsecured transactions(percentage of total transactions)
othereuro areadomestic
a) distressed countries
0
20
40
60
80
100
0
20
40
60
80
100
2002 2004 2006 2008 2010 2012
b) non-distressed countries
0
20
40
60
80
100
0
20
40
60
80
100
2002 2004 2006 2008 2010 2012
Source: ECB’s Euro Money Market Survey.
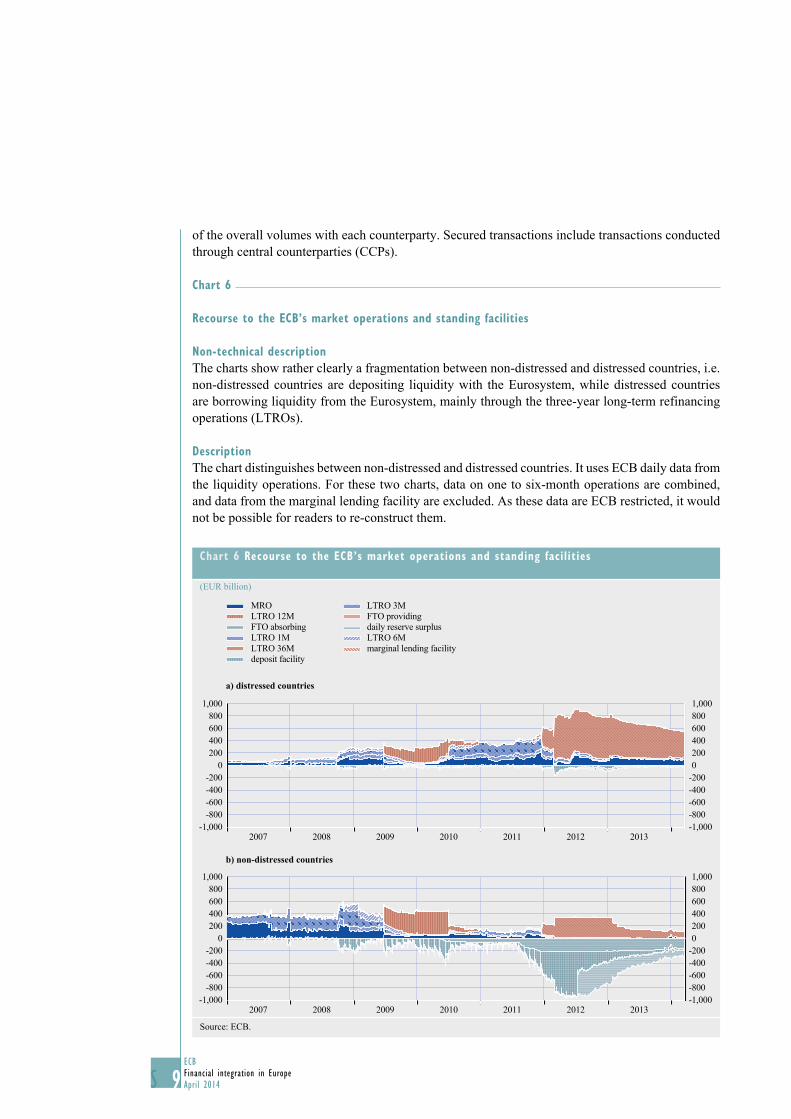
9ECBFinancial integration in EuropeApril 20149S
of the overall volumes with each counterparty. Secured transactions include transactions conducted through central counterparties (CCPs).
Chart 6
Recourse to the ECB’s market operations and standing facilities
Non-technical descriptionThe charts show rather clearly a fragmentation between non-distressed and distressed countries, i.e. non-distressed countries are depositing liquidity with the Eurosystem, while distressed countries are borrowing liquidity from the Eurosystem, mainly through the three-year long-term refinancing operations (LTROs).
DescriptionThe chart distinguishes between non-distressed and distressed countries. It uses ECB daily data from the liquidity operations. For these two charts, data on one to six-month operations are combined, and data from the marginal lending facility are excluded. As these data are ECB restricted, it would not be possible for readers to re-construct them.
Chart 6 Recourse to the ECB’s market operations and standing facilities
(EUR billion)
-1,000-800-600-400-200
0200400600800
1,000
-1,000-800-600-400-20002004006008001,000
MRO
LTRO 1M
LTRO 12M
LTRO 36M
FTO absorbing
deposit facility
LTRO 3M
LTRO 6M
FTO providing
marginal lending facility
daily reserve surplus
2007 2008 2009 2010 2011 2012 2013
a) distressed countries
-1,000-800-600-400-200
0200400600800
1,000
-1,000-800-600-400-20002004006008001,000
MRO
LTRO 1M
LTRO 12M
LTRO 36M
FTO absorbing
deposit facility
LTRO 3M
LTRO 6M
FTO providing
marginal lending facility
daily reserve surplus
2007 2008 2009 2010 2011 2012 2013
b) non-distressed countries
-1,000-800-600-400-200
0200400600800
1,000
-1,000-800-600-400-20002004006008001,000
2007 2008 2009 2010 2011 2012 2013
LTRO 6MMarginal Lending facility
MRO
LTRO 1M
LTRO 3MLTRO 12M
LTRO 36M
FTO ProvidingFTO Absorbing Daily reserve surplus
Deposit Facility
Source: ECB.

10ECB
Financial integration in EuropeApril 2014 S 10
STAT IST ICAL ANNEX
S
Chart 7
Use of cross-border collateral in Eurosystem monetary policy operations
Non-technical descriptionSince the start of the financial turmoil, there has been a trend away from posting cross-border collateral and towards greater use of domestic collateral in Eurosystem liquidity-providing operations, in particular for distressed countries. This trend has intensified since the onset of the euro area sovereign debt crisis. The greater use of domestic collateral can be attributed both to an increasing home bias among investors and to an increase in the use of self-originated marketable assets as collateral.
DescriptionThe chart distinguishes between distressed and non-distressed countries. It uses weekly data from the Use of Collateral Database (UCDB) and combines the residence information on the counterparty and the issuer of the asset.
Additional informationAn asset is regarded as being used on a cross-border basis when the issuer of the asset and the counterparty using it as collateral with the Eurosystem reside in different jurisdictions.
OTHER INDICATORs
Chart 8
TARGET2’s share of inter-Member state payments in terms of volume and value
Non-technical descriptionThe chart presents the share of cross-border payments in the overall traffic settled in TARGET2 (in both volume and value terms).
The share of cross-border volume grew in 2008 following the launch of the TARGET2 single shared platform, as the new system offered banks further opportunities to centralise their payments processing.
Chart 7 Use of cross-border collateral in Eurosystem monetary policy operations
(percentage of total collateral use)
distressed countriesnon-distressed countries
2008 2009 2010 2011 2012 2013
80
70
60
50
40
30
20
10
0
80
70
60
50
40
30
20
10
0
Source: ECB.
Chart 8 TARGET2’s share of inter-Member state payments in terms of volume and value(percentage of total payments)
05
1015202530354045
051015202530354045
value volume
19992000200120022003
20092010201120122013
20042005200620072008
Source: ECB.

11ECBFinancial integration in EuropeApril 201411S
As regards the share of cross-border payments in value terms, the drop observed in 2008 mainly results from a change in the calculation methodology. In subsequent years, the strained market activity following the financial crisis explains why it has not grown at the same pace as the cross-border share in volume terms.
DescriptionThe first indicator shows the share by volume of payments between EU Member States (inter-Member State payments) in the total number of payments processed in TARGET2. The graph shows a general increase in this indicator, in particular from 2008 onwards. Before 2008, in the decentralised TARGET1 system, multi-country banks (or banking groups) had accounts in most countries in which they operated. Consequently, a large share of the traffic they generated in TARGET1 was treated as “domestic”. In TARGET2, these banking groups concentrate their intraday liquidity management and their payment processing in one account, usually with the national central bank of the country in which they have their head office. For that reason, a higher share of their payments traffic is now “cross-border”.
The second indicator shows the share by value of payments between EU Member States (inter-Member State payments) in the total value of payments processed in TARGET2. With the exception of some irregular increases/decreases recorded in 2000, 2001 and 2008 (following closure of other euro payment systems or changes in the statistical method), a general increase can be observed up to 2007, reflecting the positive contribution of TARGET1 to the integration of large-value payment activities. However, from 2008 onwards, the share remains roughly stable, owing to a deterioration in market conditions with, in particular, fewer cross-border money market transactions being settled in TARGET2. While these money market transactions are relatively small in number, their average value is much higher than that of other payments, which is why market conditions affect the cross-border share in terms of value more than in terms of volume.
In spite of the fact that both indicators include transactions in connection with monetary policy operations, their impact on the trends is considered negligible. In principle, as such transactions are treated as “domestic”, they would typically increase the value of domestic payments, thereby reducing the cross-border share. However, the impact of these operations is extremely limited compared to the average daily turnover of TARGET2, which amounts €2.7 trillion. Even the LTROs do not significantly change the overall picture, as the value they generate in TARGET on one specific day is marginal when spread over an entire year.
Additional informationTARGET2 is the real-time gross settlement system for the euro. A second-generation system (TARGET2) operating on a single shared platform was launched in November 2007 and fully replaced the former decentralised system in May 2008.
In TARGET2, an “inter-Member State payment” is a payment between counterparties who maintain accounts with different national central banks participating in TARGET2. An “intra-Member State payment” is a payment between counterparties who maintain accounts with the same national central bank.

12ECB
Financial integration in EuropeApril 2014 S 12
STAT IST ICAL ANNEX
S
Chart 9
share of cross-border overnight money market transactions identified in TARGET2
Non-technical descriptionThe chart displays the percentage of the value of euro area unsecured overnight money market activity that is cross-border in nature and as identified in TARGET2 transactions data. Since the overnight money market is an immediate source of central bank money for banks, a decrease in cross-border lending can be a signal of market fragmentation. The autumn of 2008 and second half of 2011 are characterised by drops in cross-border lending. The chart shows a steady increase in overnight lending since the second half of 2012, reflecting a more financially integrated cross-border overnight market.
DescriptionThis chart uses interbank payment transactions in TARGET2 and applies a Furfine algorithm to identify unsecured overnight money market loans. Cross-border activity is defined as loans involving two banks holding TARGET2 accounts with different central banks participating in TARGET2. Intra-group activity and loans with a zero interest rate are excluded from the calculation. The calculation does not further distinguish between spot-next and tomorrow-next transactions. Total volume is aggregated on a weekly basis.
Chart 9 share of cross-border overnight money market transactions identified in TARGET2(percentage)
20
30
40
50
60
70
20
30
40
50
60
70
cross-border share
May Nov. May Nov. May Nov. May Nov. May Nov. Nov.May2011 2012 20132008 2009 2010
Source: TARGET2 money market transactions, based on ECB methodology refined in 2013.Notes: Intra-group activity and loans with a zero interest rate are excluded from the calculation. Total volume is aggregated on a weekly basis.

13ECBFinancial integration in EuropeApril 201413S
sECURITIEs MARKET INDICATORs
PRICE-BAsED INDICATORs
Chart 10
Dispersion in five-year CDs premia across the euro area
Non-technical descriptionWe consider here the dispersion of credit default swap (CDS) premia of different sectors to highlight the degree of dispersion of the cost of funding for different entities at euro area level (while the CDS premium primarily reflects the cost of insuring debt against default, the premium can also be regarded as a proxy for the cost of funding). The higher the dispersion is at industry level for the euro area (so removing possible country specialisations that could bias the dispersion), the lower the integration is for the financing of these entities (sovereigns, banks and telecoms) at euro area level.
DescriptionThese indicators are computed as the standard deviation of five-year CDS premia for different sectors at the euro area level. The three sectors considered are sovereigns, telecommunications and banks to constitute groups of homogenous entities with comparable credit risk at the euro area level.
Additional information/notesThe data do not include Greece and Ireland. Greece is excluded owing to very high sovereign CDS premia, and Ireland is excluded owing to the very high CDS premia of its telecommunications company.
“Sovereign” includes Austria, France, Germany, Italy, the Netherlands, Portugal and Spain. Commercial banks include ABN AMRO (NL), Alpha Bank (GR), Allied Irish Banks (IE), Banca Monte dei Paschi di Siena (IT), Banca Popolare di Milano (IT), Banco Comercial Português (PT), Banco Sabadell (ES), Banco Espirito Santo (PT), Banco Santander Central Hispano (ES), Erste Bank der österreichischen Sparkassen (AT), Bank of Ireland (IE), BayerischeHypoVereinbank(DE), BNP Paribas (FR), Commerzbank (DE), Crédit Agricole (FR), Deutsche Bank (DE), Dexia Group (BE), EFG Eurobank Ergasias (GR), Fortis NL (NL), Intesa Sanpaolo SPA (IT), Mediobanca (IT), Natixis (FR), National Bank of Greece (GR), Nordea Bank (FI), Piraeus Group Finance PLC (GR), Société Générale (FR) and UniCredito Italiano (IT).
“Telecom” includes Deutsche Telekom (DE), France Telecom (FR), Hellenic Telecommunications Organization(GR),KPN(NL),PortugalTelecom(PT),TelecomItalia(IT),Telefōnica(ES)andTelekom Austria (AT).
Chart10 Dispersion in five-year CDs premia across the euro area
(daily data; basis points)
0
100
200
300
400
500
600
700
0
100
200
300
400
500
600
700
2004 2005 2006 2007 2008 2009 2010 2011 2012 2013 2014
banks (excluding Ireland and Greece)sovereign (excluding Ireland and Greece)telecom (excluding Ireland and Greece)
Sources: Thomson Reuters and ECB calculations.

14ECB
Financial integration in EuropeApril 2014 S 14
STAT IST ICAL ANNEX
S
Chart 11
Country and sector dispersions in euro area equity returns
Non-technical descriptionThis chart presents the dispersion in equity returns, across sectors and across countries, in the euro area for a period of over 35 years to reflect structural changes in the aggregate euro area equity market. Under full financial segmentation, limited diversification opportunities for investors mean that they demand a high return for holding shares in undiversified firms, so cross-country dispersion (which reflects not only cross-border fragmentation, but also the different sectoral composition of each country’s economy) should be high relative to cross-sectoral dispersion (which also reflects the different performance of the underlying sectors). By contrast, in an integrated financial market, there is no financial premium on sectoral or geographical diversification and greater specialisation is affordable. This should reduce the gap between cross-country and cross-sectoral dispersions. Assuming sectoral compositions and performances remain constant over the sample period, three periods can be distinguished: 1) the pre-EMU period in which cross-country dispersion was significantly higher than cross-sectoral dispersion; 2) the pre-crisis EMU period after 1999 in which cross-country fragmentation has been eliminated and the two dispersions get closer; 3) the crisis period, in which fragmentation has increased, as shown by the increase in both dispersion indicators as of 2007.
DescriptionThis indicator is derived by calculating the cross-sectional dispersions in both sector and country index returns for the euro area countries. Data are calculated from January 1973 onwards. They include (reinvested) dividends and are denominated in euro. The indicator has a monthly frequency. The cross-sectional dispersions are filtered using the Hodrick-Prescott smoothing technique, which provides a smooth estimate of the long-term trend component of the series. The smoothing parameterλisequalto14,400.
Additional informationThis indicator is based on an approach first presented by Adjaouté and Danthine, see Adjaouté, K. and Danthine, J.P. (2003), “European Financial Integration and Equity Returns: A Theory-based Assessment”, in Gaspar, V. et al. (eds.), Second ECB Central Banking Conference: The transformation of the European financial system, ECB, May 2003.
Chart 11 Country and sector dispersions in euro area equity returns
(percentages)
0
1
2
3
4
5
6
0
1
2
3
4
5
6
1976 1981 1986 1991 1996 2001 2006 2011
sectorcountry
Sources: Thomson Reuters and ECB calculations.Note: cross-sectional dispersions are filtered.

15ECBFinancial integration in EuropeApril 201415S
Chart 12
Proportion of variance in euro area country equity returns explained by euro area and Us stock market shocks
Non-technical descriptionThis chart compares the extent to which local euro area equity markets are sensitive to US market shocks and euro area-wide shocks. Over the last decade, euro area-wide volatility has been the main determinant of local stock market volatility, but the share of US volatility incorporated in local euro area equity market volatility has intensified. Between 2004 and 2007 only 17% of euro area local equity market volatility could be attributed to US volatility, while this reached 25% in the period from 2008 to 2013 after the collapse of Lehman Brothers.
DescriptionThis chart presents the proportion of total domestic equity volatility of country stock returns explained by euro area and US shocks. To quote the original source,2 the rationale of the analysis is as follows: “An important implication of integration is that asset prices should only react to common news. If there are no barriers to international investment, purely local shocks can generally be diversified away by investing in assets from different regions. Local shocks should therefore not constitute a systematic risk.”
The source goes on to say: “For the purpose of examining integration in local euro area equity markets, we need to distinguish between global and euro area-wide effects on equity returns in the euro area. To this end, the return on US stock markets is used as a proxy for world news, while the return on a euro area-wide stock market index, corrected for US news, is used as the euro factor.”
Additional information/notesThe variance ratio is derived by assuming that country-specific shocks are uncorrelated across countries and that they similarly do not correlate with euro area and US benchmark indices.
The influence of euro area shocks may have been greater in very recent years.
For detailed calculations, see Baele et al. (2004).
To compare the relevance of euro area and US shocks for average changes in country returns, the indicators report the variance ratios, i.e. the proportion of total domestic equity volatility explained
2 Baele,L.,Ferrando,A.,Hördahl,P.,Krylova,E.andMonnet,C.,“Measuringfinancialintegrationintheeuroarea”,Occasional Paper Series, No 14, ECB, April 2004.
Chart 12 Proportion of variance in euro area country equity returns explained by euro area and Us stock market shocks
0.00
0.05
0.10
0.15
0.20
0.25
0.30
0.35
0.40
0.45
0.50
0.00
0.05
0.10
0.15
0.20
0.25
0.30
0.35
0.40
0.45
0.50
1 2 3 4 5 61 1986-19912 1992-19983 1999-2003
4 2004-20075 2008-20126 2012-2013
euro area shocks US shocks
Sources: Thomson Reuters and ECB calculationsNote: Calculations based on equity market indices at weekly frequency (1973-2013).

16ECB
Financial integration in EuropeApril 2014 S 16
STAT IST ICAL ANNEX
S
by euro area and US shocks respectively. The model-based indicator is derived by assuming that the total variance of individual country-specific returns is given by:
2 2σ = hc,t + ( β ) σeu,t + ( β ) σus,tt t
2eu us 2
c,t2 (5)
where hc,t is the variance of the local shock component. The euro area variance ratio is then given by:
VReuc,t
=( β ) σeu,tt
2 2eu
σ c,t2 (6)
and the US variance ratio by a corresponding equation. The conditional variances are obtained using a standard asymmetric GARCH (1,1) model.
For each period, the indicators report the unweighted average of the relative importance of euro area-wide factors, other than US equity market fluctuations, for the variance of individual euro area countries’ equity market indices (the “variance ratio”), and the unweighted average of the relative importance of US equity market fluctuations for the variance of euro area equity markets.
Data refer to Datastream market indices, and have been calculated on a weekly basis since January 1973.
Chart 13
Euro area and Us shock spillover intensity in individual euro area countries
Non-technical descriptionThis chart compares the extent to which local euro area equity markets are sensitive to US market shocks and euro area-wide shocks. Over the last decade, euro area-wide shocks have been transmitted almost one-to-one to local euro area equity markets, which can be interpreted as sign of strong integration of equity markets among euro area countries. Transmission of US shocks (which can be seen as a proxy for global shocks) has intensified since the collapse of Lehman Brothers: between 2004 and 2007 almost 40% of US shocks were transmitted to euro area markets, but this has risen to 60% since Lehman.
DescriptionEmpirical evidence suggests that equity returns are driven to a significant extent by global factors. For this reason, both euro area-wide shocks and US shocks (as a proxy for global factors) are included in the assessment of common news. To calculate the relative importance of euro area-wide and US stock market fluctuations for local stock market returns, the stock market returns of
Chart 13 Euro area and Us shock spillover intensity in individual euro area countries
0.0
0.2
0.4
0.6
0.8
1.0
0.0
0.2
0.4
0.6
0.8
1.0
1973-1985
1986-1991
1992-1998
1999-2003
2004-2007
2008-2014
euro area shock spillover intensities US shock spillover intensities
Sources: Thomson Reuters and ECB calculations.Note: Calculations based on equity market indices at weekly frequency (1973-2014).

17ECBFinancial integration in EuropeApril 201417S
individual countries are modelled as having both an expected component and an unexpected one, εc,t. The unexpected component is then decomposed into a purely local shock (ec,t) and a reaction to euro area news (εeu,t) and world (US) news (εus,t):
εc,t εeu,tec,t= +βeuct εus,t+ β
usc,t (7)
The expected return is obtained by relating euro area and US returns to a constant term and to the returns in the previous period. The conditional variance of the error terms is governed by a bivariate asymmetric GARCH (1,1) model.
β represents the country-dependent sensitivity to euro area or US market changes (of the unexpected component). The analysis is performed over the periods 1973-1985, 1986-1991, 1992-1998, 1999-2003, 2003-2008 and 2008-2013. The reported indicator is the cross-country unweighted average of country-specific sensitivities (betas). A reported beta close to one in the chart indicates that on average all euro area countries respond to the corresponding shock (from either the euro area or the United States). In a well-integrated euro area, the beta associated to the euro area shock should be close to one.
Additional informationTo distinguish global shocks from purely euro area shocks, it is assumed that euro area equity market developments are partly driven by events in the US market. It is furthermore assumed that the proportion of local returns that is not explained by common factors is entirely attributable to local news.
Chart 14
Dispersion of euro area ten-year sovereign bond yields
Non-technical descriptionThe chart presents the average evolution and dispersion of euro area sovereign bond yields. In a well-integrated market, there should be low dispersion, because investors will not demand such a high premium to compensate for the risk of idiosyncratic shocks, while in a fragmented market, dispersion is higher.
DescriptionThe shaded areas represent the min-max range and the interquartile range of individual bond yields for the country composition of the euro area as in 2011. The lines represent the yields for some distressed euro area countries. The yields for Greece, Cyprus, Estonia, Luxembourg, Malta and Slovenia are excluded owing to infrequent or a lack of observations.
Chart 14 Dispersion of euro area ten-year sovereign bond yields
(percentages)
0
2
4
6
8
10
12
14
16
18
0
2
4
6
8
10
12
14
16
18
1990 1995 2000 2005 2010
min-max rangeinterquartile rangeaverage distressedaverage euro area
Sources: Bloomberg and ECB calculations.

18ECB
Financial integration in EuropeApril 2014 S 18
STAT IST ICAL ANNEX
S
Chart 15
sovereign and bank CDs premia – euro area and United states
Non-technical descriptionA tight link between sovereign and bank creditworthiness is clearly visible in the high degree of correlation between sovereign CDS premia and bank CDS premia in euro area countries. This high correlation illustrates the self-reinforcing loop between bank and sovereign risks, with doubts about the solvency of the sovereigns feeding doubts about the solvency of the banks, and vice versa. Such dynamics are much weaker in the United States where the CDS premia of sovereigns and banks are less correlated.
The self-reinforcing loop between bank and sovereign risk, characterised by tight bank-sovereign linkages (in particular in non-AAA-rated euro area countries), is one of the causes of the increasing heterogeneity of sovereign bond yields (particularly the divergence between AAA-rated countries and non-AAA-rated countries). This phenomenon (tight bank-sovereign linkages on the periphery) has an impact on bond market integration in the euro area (and consequently on the integration of the funding markets for corporates and banks).
DescriptionThe euro area bank CDS premium is calculated as a weighted average of CDS premia for the main euro area banks (one bank per country weighted by the national capital key), and the euro area sovereign CDS premium is calculated as a weighted average of national sovereign CDS premia. For the United States, the bank CDS premium is calculated as the median of CDS premia for the eight largest US banks and the sovereign CDS premium is the CDS premium for the US sovereign. All the CDS premia considered are at the five-year maturity. Each point on the chart represents one day, while each colour represents one quarter (from 2010 Q1 to 2013 Q4). Any point on the diagonal line would indicate a one-for-one relationship between bank and sovereign CDS premia.
Chart 15 sovereign and bank CDs premia – euro area and United states
(basis points; Q1 2010 – Q1 2014)
x-axis: sovereign CDSy-axis: bank CDS
0
50
100
150
200
250
300
350
400
450
500
0
50
100
150
200
250
300
350
400
450
500
0 50 100 150 200 250 300 350
2010 Q12010 Q22010 Q32010 Q42011 Q1
2011 Q22011 Q32011 Q42012 Q12012 Q2
2012 Q32012 Q42013 Q12013 Q22013 Q3
2013 Q42014 Q1
euro area
0
50
100
150
200
250
300
350
400
450
500
0
50
100
150
200
250
300
350
400
450
500
0 50 100 150 200 250 300 350
2010 Q12010 Q22010 Q32010 Q42011 Q1
2011 Q22011 Q32011 Q42012 Q12012 Q2
2012 Q32012 Q42013 Q12013 Q22013 Q3
2013 Q42014 Q1
United States
0
50
100
150
200
250
300
0
50
100
150
200
250
300
0 10 20 30 40 50 60 70
Sources: Thomson Reuters and ECB Calculations.

19ECBFinancial integration in EuropeApril 201419S
Chart 16
Equity and government bond market integration based on common factor portfolios
Non-technical descriptionThis indicator measures integration in the euro area equity and government bond markets via the explanatory power of common factor portfolios. For each calendar year, these portfolios are formed on the basis of a principal component analysis and used in a simple regression framework to explain equity and bond market returns for each country. The measure is then computed as an average (median) R-square across countries. In general, a higher measure indicates a more integrated market, where 1 implies perfect integration and 0 entails no integration.
DescriptionThis measure of financial market integration for calendar year t is computed as the cross-sectional mean (median) R² that is obtained from estimating the following regression separately for each country i :
R =αi,t
K k k
k =1+ +∑ β εθi,t i,ti,t,τ i,t,τ (8)
Where R =αi,t
K k k
k =1+ +∑ β εθi,t i,ti,t,τ i,t,τ is the market return in country i on
trading day τ within year t, and R =αi,t
K k k
k =1+ +∑ β εθi,t i,ti,t,τ i,t,τ is the return
on the k-th common factor portfolio on the same day. The K common factor portfolios are obtained via principal component analysis, and it assumed throughout that K=3. The weights (eigenvectors) for the factor portfolios in year t are calculated using data from year t-1.
In order to obtain a measure that is comparable across years, we require daily return data (on broad equity market indices and ten-year benchmark bonds) to be available from the beginning of the sample.
Additional informationThe analysis is based on Pukthuanthong, K. and Roll, R., “Global market integration: An alternative measure and its application”, Journal of Financial Economics, Vol. 94, No 2, November 2009, pp. 214-232.
Chart 16 Equity and government bond market integration based on common factor portfolios
non-distressed countriesdistressed countries
Equity market 1)
0.0
0.1
0.2
0.3
0.4
0.5
0.6
0.7
0.8
0.90.9
1.0
0.0
0.1
0.2
0.3
0.4
0.5
0.6
0.7
0.8
0.90.9
1.0
1989 1993 1997 2001 2005 2009 2013
Government bond market 2)
0.0
0.2
0.4
0.6
0.8
1.0
1.2
0.0
0.2
0.4
0.6
0.8
1.0
1.2
1992 1995 1998 2001 2004 2007 2010 2013
Sources: Thomson Reuters and ECB Calculations.Note: Data cover the following countries:1) Distressed countries: ES, IE, IT, PT; non-distressed: AT, BE, DE, FI, FR, LU, NL.2) Distressed countries: ES, IE, IT; non-distressed: AT, BE, DE, FR, NL.
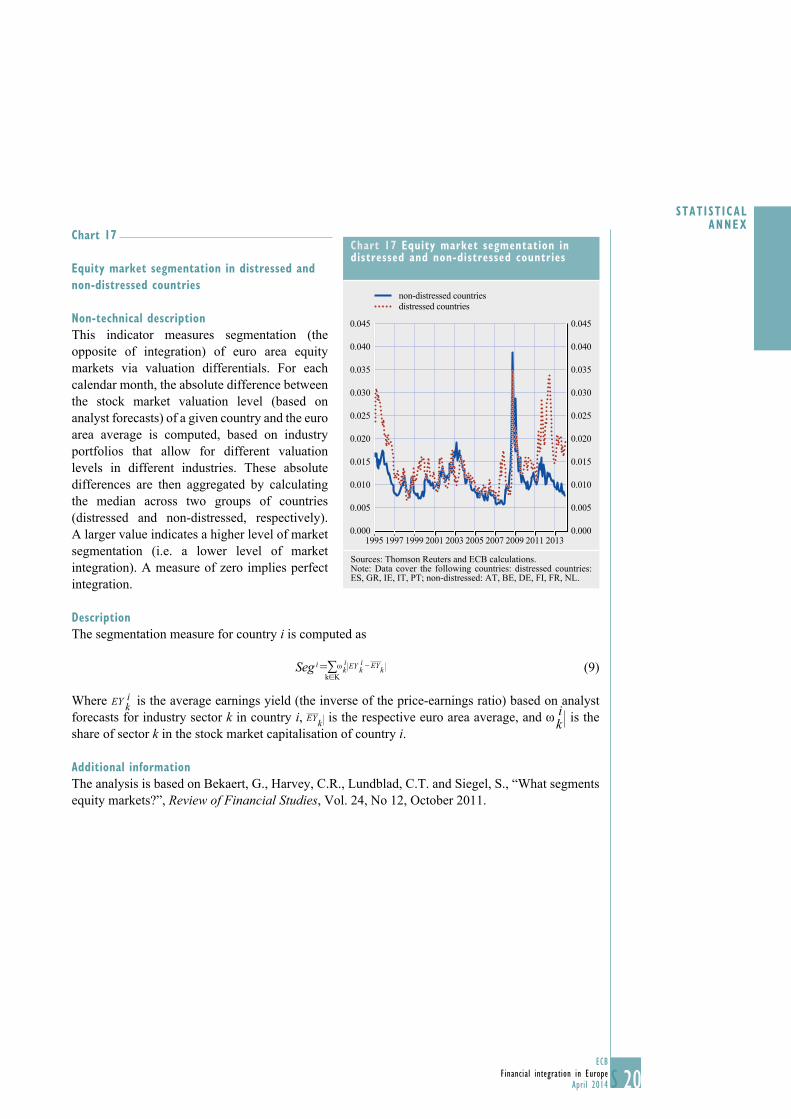
20ECB
Financial integration in EuropeApril 2014 S 20
STAT IST ICAL ANNEX
S
Chart 17
Equity market segmentation in distressed and non-distressed countries
Non-technical descriptionThis indicator measures segmentation (the opposite of integration) of euro area equity markets via valuation differentials. For each calendar month, the absolute difference between the stock market valuation level (based on analyst forecasts) of a given country and the euro area average is computed, based on industry portfolios that allow for different valuation levels in different industries. These absolute differences are then aggregated by calculating the median across two groups of countries (distressed and non-distressed, respectively). A larger value indicates a higher level of market segmentation (i.e. a lower level of market integration). A measure of zero implies perfect integration.
DescriptionThe segmentation measure for country i is computed as
Seg i = ∑k∈K
ωk k ki EY i – EY (9)
Where Seg i = ∑k∈K
ωk k ki EY i – EY is the average earnings yield (the inverse of the price-earnings ratio) based on analyst
forecasts for industry sector k in country i, Seg i = ∑k∈K
ωk k ki EY i – EY is the respective euro area average, and Seg i = ∑
k∈Kωk k k
i EY i – EY is the share of sector k in the stock market capitalisation of country i.
Additional informationThe analysis is based on Bekaert, G., Harvey, C.R., Lundblad, C.T. and Siegel, S., “What segments equity markets?”, Review of Financial Studies, Vol. 24, No 12, October 2011.
Chart 17 Equity market segmentation in distressed and non-distressed countries
1995 1997 1999 2001 2003 2005 2007 2009 2011 20130.000
0.005
0.010
0.015
0.020
0.025
0.030
0.035
0.040
0.045
0.000
0.005
0.010
0.015
0.020
0.025
0.030
0.035
0.040
0.045
non-distressed countriesdistressed countries
Sources: Thomson Reuters and ECB calculations.Note: Data cover the following countries: distressed countries: ES, GR, IE, IT, PT; non-distressed: AT, BE, DE, FI, FR, NL.

21ECBFinancial integration in EuropeApril 201421S
QUANTITy-BAsED INDICATORs
Chart 18
share of MFI cross-border holdings of debt securities issued by euro area and EU corporates and sovereigns
Non-technical descriptionCross-border holdings by euro area MFIs of bonds issued by non-financial borrowers (sovereign and corporate) of other euro area countries are a relevant quantity indicator of financial integration. The indicator points to decreasing integration in these markets in recent years.
Description See Charts 23 to 26 in the banking section.
Additional informationSee Charts 23 to 26 in the banking section.
Charts 19 and 20
Investment funds’ holdings of debt securities and equities
Non-technical descriptionThese two indicators are used to assess the contribution of institutional investors to financial integration in the euro area.
Chart 18 share of MFI cross-border holdings of debt securities issued by euro area and EU corporates and sovereigns(percentage of total holdings, excluding the Eurosystem)
0
5
10
15
20
25
30
35
40
45
0
5
10
15
20
25
30
35
40
45
1999 2001 2003 2005 2007 2009 2011 2013
other euro area government and corporate bondsother euro area corporate bonds other euro area government bonds rest of EU government and corporate bonds
Source: ECB.
Chart 19 Investment funds’ holdings of debt securities issued in other euro area countries and the rest of the world(percentage of total holdings of debt securities)
20
25
30
35
40
45
50
20
25
30
35
40
45
50
other euro area countriesrest of the world
1999 2001 2003 2005 2007 2009 2011 2013
Source: ECB.
Chart 20 Euro area investment fund holdings of equity issued in other euro area countries and the rest of the world(percentages)
0
10
20
30
40
50
60
70
0
10
20
30
40
50
60
70
other euro area countriesrest of the world
1999 2001 2003 2005 2007 2009 2011 2013
Source: ECB. Last observation: Q3 2013.

22ECB
Financial integration in EuropeApril 2014 S 22
STAT IST ICAL ANNEX
S
DescriptionThe first indicator shows the share of euro area investment funds’ total holdings of all securities other than shares (including money market paper) issued by residents of euro area countries other than the country in which the investment fund is located and by residents of the rest of the world (RoW). The second indicator provides the same measure for the share of euro area investment funds’ combined holdings of all shares and other equity (excluding investment fund shares/units) issued by residents of the euro area outside the country in which the investment fund is located and by residents of the rest of the world.
The compositions of the two areas are those prevailing during the reference period.
Additional informationThese two indicators are constructed on the basis of the balance sheets of euro area investment funds (other than money market funds, which are included in the MFI balance sheet statistics). A complete list of euro area investment funds is published on the ECB’s website. Further information on these investment fund statistics can be found in the Manual on investment fund statistics. Since December 2008 harmonised statistical information has been collected and compiled on the basis of Regulation ECB/2007/8 concerning statistics on the assets and liabilities of investment funds.
Chart 21
The degree of cross-border holdings of equity issued by euro area residents
Non-technical descriptionThis chart shows the degree of cross-border holdings of equity securities among euro area countries. This indicator measures the degree of stock market integration at the euro area level.
DescriptionIntra-euro area is defined as the share of equity issued by euro area residents and held by other euro area residents (excluding central banks):
Outstockij,t∑i∑
j ≠ i
∑i
∑i
∑i
MKTi,t TOutstocki,t - TInstocki,t+i,j ∈{euroareacountries}
(9)
where Outstockij denotes the value of equity issued by residents of euro area country i and held by residents of euro area country j; MKTi stands for stock market capitalisation in country i; TOutstocki is the total foreign equity held by country i and TInstocki is the total foreign liabilities of country i.
Chart 21 The degree of cross-border holdings of equity issued by euro area residents(percentages)
10
20
30
40
50
60
10
20
30
40
50
60
intra-euro area distressed countries non-distressed countries
1997 2001 2002 2003 2004
2005 2006 2007 2008 2009
2010 2011 2012
Sources: IMF, Thomson Reuters, ECB calculations.Notes: Intra-euro area is defined as the share of equity issued in the euro area residents and held by residents of other euro area countries (excluding central banks). Extra-euro area is defined as the share of euro area equity held by non-residents of the euro area (excluding central banks).

23ECBFinancial integration in EuropeApril 201423S
Extra-euro area is defined as the share of euro area equity held by non-residents of the euro area (excluding central banks). The measure takes the following form:
∑ ∑ Outstocki,r,ti r
r∑
r∑
r∑MKTr,t TOutstockr,t
+ — TInstockr,t
i∈r∈
{euro area countries}{rest of the world}
(10)
where Outstockir denotes the value of equity issued by residents of euro area country i and held by non-residents of the euro area r (rest of the world); MKTr stands for market capitalisation in country r; TOutstockr is the total foreign equity held by country r and TInstockr is the total foreign liabilities of country r. The computed indicator has an annual frequency.
BANKING MARKET INDICATORs
sTRUCTURAL INDICATOR
Chart 22
Dispersion of the total assets of foreign branches and subsidiaries of euro area banks across euro area countries
Non-technical descriptionThis indicator describes the development over time of the assets of foreign branches and subsidiaries of euro area banks within euro area countries other than the home country as a share of the total assets of the euro area banking sector, with higher shares implying higher cross-border activity. Overall, this share continues to be rather limited across the majority of countries. However, it is noteworthy that, owing to the crisis, the median degree of cross-border penetration of banking institutions has fallen in recent years.
DescriptionThe share of total assets of foreign branches and subsidiaries over total assets of the national banking system is calculated for each country of the euro area. Then, the level and dispersion of these country shares are described by the following measures: the first quartile (25th percentile), the median (50th percentile) and the third quartile (75th percentile).
These computed indicators have an annual frequency. The composition of the euro area is that applicable during the respective reference period.
Chart 22 Dispersion of the total assets of foreign branches and subsidiaries of euro area banks across euro area countries(percentage of the total assets of the euro area banking sector)
0
10
20
30
40
0
10
20
30
40
1999 2001 2003 2005 2007 2009 2011 2013
medianinterquartile (blue area)
Source: ECB.

24ECB
Financial integration in EuropeApril 2014 S 24
STAT IST ICAL ANNEX
S
ACTIVITy-BAsED INDICATORs
Charts 23 to 26
Activity-based indicators: MFI loans, holdings and deposits
Non-technical descriptionThis set of indicators displays the relevance of cross-border balance sheet connections for euro area monetary financial institutions (MFIs). The indicators show that euro area wholesale banking markets are far more integrated than retail markets.
Chart 23 MFI loans to non-MFIs: outstanding amounts by residency of counterparty
(percentage of total lending excluding the Eurosystem)
86
87
88
89
90
91
92
0
1
2
3
4
5
6
1999 2001 2003 2005 2007 2009 2011 2013
other euro area countries (left-hand scale)rest of EU (left-hand scale)domestic (right-hand scale)
Source: ECB.
Chart 24 MFI loans to MFIs: outstanding amounts by residency of counterparty
(percentage of total lending excluding the Eurosystem)
0
10
20
30
40
50
70
60
0
10
20
30
40
50
70
60
1999 2001 2003 2005 2007 2009 2011 2013
domesticother euro area countriesrest of EU
Source: ECB.
Chart 25 MFI holdings of securities issued by MFIs: outstanding amounts by residency of counterparty(percentage of total holdings)
0
5
10
15
20
25
30
35
0
5
10
15
20
25
30
35
1999 2001 2003 2005 2007 2009 2011 2013
other euro area countriesrest of EU
Source: ECB.
Chart 26 MFI deposits from MFIs: outstanding amounts by residency of counterparty
(percentage of total deposits excluding the Eurosystem)
0
10
20
30
40
50
70
60
0
10
20
30
40
50
70
60
2000 2002 2004 2006 2008 2010 2012 2013
domesticother euro area countriesrest of EU
Source: ECB.

25ECBFinancial integration in EuropeApril 201425S
DescriptionThe indicators in Charts 23 and 24 show loans granted by euro area MFIs (excluding the Eurosystem) to non-MFIs and other MFIs, broken down by residency of counterparty. The compositions of the euro area and the rest of the EU are those applicable during the respective reference periods. In Chart 25, a similar indicator is shown for securities issued by euro area MFIs and held by euro area and other EU MFIs. In Chart 26, a similar indicator is shown for deposits placed in the euro area by non-MFIs. Inter-MFI borrowing and lending is also conducted through CCPs. In cases where these CCPs are not themselves MFIs, these volumes are not included in the inter-MFI loans and deposits in Charts 24 and 26. (For more information, see Box 3 of the September 2012 issue of the ECB’s Monthly Bulletin.)
These indicators have a quarterly frequency.
Additional informationThese indicators are constructed on the basis of the national aggregated MFI balance sheet statistics reported to the ECB at monthly and quarterly frequencies. These data cover the MFI sector excluding the Eurosystem and also include data on money market funds (MMFs). It is not yet possible to derive indicators that strictly refer to banking markets. Consequently, as MMFs typically invest in inter-MFI deposits and short-term securities, the indicators displaying data for these assets are somewhat affected by the MMFs’ balance sheet items.
These balance sheet items are transmitted on a non-consolidated basis. This means that the positions with foreign counterparties include those with foreign branches and subsidiaries.
Chart 27
Interest rates on new loans to euro area non-financial corporations
Non-technical descriptionAn important aspect of the gains from increasing financial integration is that lower financing costs reached a significant level of convergence across countries. The strong convergence across countries in bank rates charged to non-financial corporations for new loans is clearly visible.
DescriptionThis indicator displays the average of MFI interest rates (MIRs) on new business reported to the ECB.
Additional information/notesThese statistics are based on MIRs on new business reported to the ECB at monthly frequency since January 2003.
Chart 27 Interest rates on new loans to euro area non-financial corporations
(percentages)
0
2
4
6
8
10
12
0
2
4
6
8
10
12
1997 1999 2001 2003 2005 2007 2009 2011 2013
average for the euro area (changing composition)average for distressed countriesaverage for non-distressed countries
Source: ECB.Note: All euro area countries, changing composition.
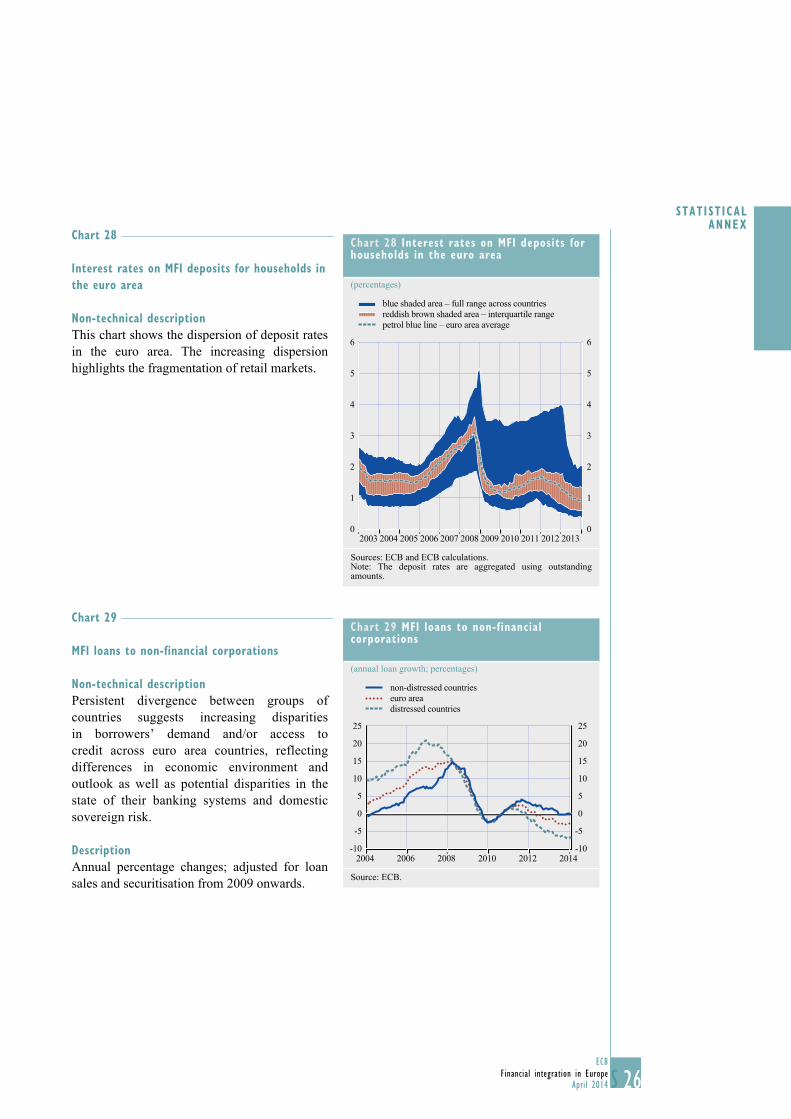
26ECB
Financial integration in EuropeApril 2014 S 26
STAT IST ICAL ANNEX
S
Chart 28
Interest rates on MFI deposits for households in the euro area
Non-technical descriptionThis chart shows the dispersion of deposit rates in the euro area. The increasing dispersion highlights the fragmentation of retail markets.
Chart 29
MFI loans to non-financial corporations
Non-technical descriptionPersistent divergence between groups of countries suggests increasing disparities in borrowers’ demand and/or access to credit across euro area countries, reflecting differences in economic environment and outlook as well as potential disparities in the state of their banking systems and domestic sovereign risk.
DescriptionAnnual percentage changes; adjusted for loan sales and securitisation from 2009 onwards.
Chart 28 Interest rates on MFI deposits for households in the euro area
(percentages)
0
1
2
3
4
5
6
0
1
2
3
4
5
6
2003 2004 2005 2006 2007 2008 2009 2010 2011 2012 2013
blue shaded area – full range across countries reddish brown shaded area – interquartile range petrol blue line – euro area average
Sources: ECB and ECB calculations. Note: The deposit rates are aggregated using outstanding amounts.
Chart 29 MFI loans to non-financial corporations
(annual loan growth; percentages)
-10
-5
0
5
10
15
20
25
-10
-5
0
5
10
15
20
25
2004 2006 2008 2010 2012 2014
non-distressed countries euro area distressed countries
Source: ECB.

27ECBFinancial integration in EuropeApril 201427S
Chart 30
standard deviation of banks’ CDs premia by country group
Non-technical descriptionThe cross-country variance of CDS premia charged by investors for bank debt should provide a signal on financial integration. It must, however, be kept in mind that CDS prices also depend on a range of other factors, such as risk, liquidity, and the correlation between CDS premia for banks and sovereign CDS premia.
DescriptionFor each group of countries, the indicator is the unweighted standard deviation of the average of banks’ daily CDS premia in each euro area country.
Additional informationThis indicator is based on CDS prices available for banks on the EONIA panel.
sURVEy-BAsED INDICATORs
Chart 31
Changes in credit standards
Non-technical descriptionPersistent divergence in the level of credit standards between groups of countries suggests ongoing disparities in borrowers’ access to credit across euro area countries.
DescriptionChanges in credit standards are given as net percentages of replies, i.e. percentage of banks indicating a tightening of credit standards minus percentage of banks indicating an easing of credit standards; country aggregate results are weighted by aggregate lending volumes.
Chart 30 standard deviation of banks’ CDs premia by country group
(basis points)
0
100
200
300
400
500
600
700
800
900
0
100
200
300
400
500
600
700
800
900
2004 2006 2008 2010 2012
distressed countriesnon-distressed countries
Sources: Bloomberg, Thomson Reuters, Credit Market Analysis Ltd (CMA) and ECB calculations. Note: Data cover the following countries: distressed countries: ES, GR, IE, IT, PT non-distressed countries: AT, BE, DE, FR, NL.

28ECB
Financial integration in EuropeApril 2014 S 28
STAT IST ICAL ANNEX
S
PRICE-BAsED INDICATORs
Chart 32
Cross-country standard deviation of MFI interest rates on new loans to non-financial corporations
Non-technical descriptionThe euro area cross-country dispersion of retail interest rates on loans and deposits from banks to non-financial corporations and households can be taken as an indicator of the degree of integration in the retail banking market. The dispersion of bank interest rates should be lower in the case of instruments that are more homogeneous across countries.
In this respect, it should be noted that differences in bank interest rates can be due to other factors, such as different conditions in national economies (credit and interest rate risk, firm size, industrial structure, degree of capital market development), institutional factors (taxation, regulation, supervision), and financial structures (degree of bank/capital market financing, competitiveness, etc.).
Chart 31 Changes in credit standards
(net percentage of banks indicating a tightening of standards)
standard deviation euro area countriesdistressed countriesnon-distressed countrieseuro area
Change in credit standards applied to the approval of loans or credit lines to enterprises
Change in credit standards applied to the approval of loans or credit lines to households for house purchases
-25
0
25
50
75
100
-25
0
25
50
75
100
2003 2005 2007 2009 2011 2013-25
0
25
50
75
100
-25
0
25
50
75
100
2003 2005 2007 2009 2011 2013
Sources: Eurosystem’s bank lending survey (BLS) and ECB calculations.
Chart 32 Cross-country standard deviation of MFI interest rates on new loans to non-financial corporations(unweighted, basis points)
0
20
40
60
80
100
120
140
0
20
40
60
80
100
120
140
2003 2005 2007 2009 2011 2013
floating rate and up to 1 year, up to and including€1 millionfloating rate and up to 1 year, over €1 million
Source: ECB.

29ECBFinancial integration in EuropeApril 201429S
DescriptionThe following general notation is used for each of the above categories of loan:
rc,t = the interest rate prevailing in country c in month t
bc,t = the business volume in country c in month t
wc,t=bc,tBt
is the weight of country c in the total euro area business volume B in month t where
Bt =∑ bc,tc
MFI interest rates in the euro area are computed as the weighted average of country interest rates rc,t, using the country weights wc,t.
rt = cwc,t rc,t∑ (11)
The euro area weighted standard deviation takes the following form:
Mt = ∑ (rc,t – rt )2 wc,tc
(12)
The monthly data are smoothed by calculating a three-month centred moving average of the standard deviation.
Additional informationThe price measures for credit market integration are based on MIRs on new business reported to the ECB at monthly frequency since January 2003.
For the purpose of measuring financial integration, it might be preferable to compute the dispersion as the standard deviation of unweighted interest rates at the level of individual MFIs. However, these data are not available at the ECB, and therefore standard deviations of weighted rates across euro area countries are calculated instead
Chart 33
Cross-country standard deviation of MFI interest rates on loans to households
Non-technical descriptionSee Chart 32 above.
DescriptionSee Chart 32 above.
Additional informationSee Chart 32 above.
Chart 33 Cross-country standard deviation of MFI interest rates on loans to households
(unweighted, basis points)
20
40
60
80
100
120
140
160
180
200
00
20
40
60
80
100
120
140
160
180
200
2003 2005 2007 2009 2011 2013
consumer credit: over 1 year and up to 5 yearshouse purchase: with floating rate and initial rate fixation up to 1 yearhouse purchase: with initial rate fixation over 5 years and up to 10 years
Source: ECB.
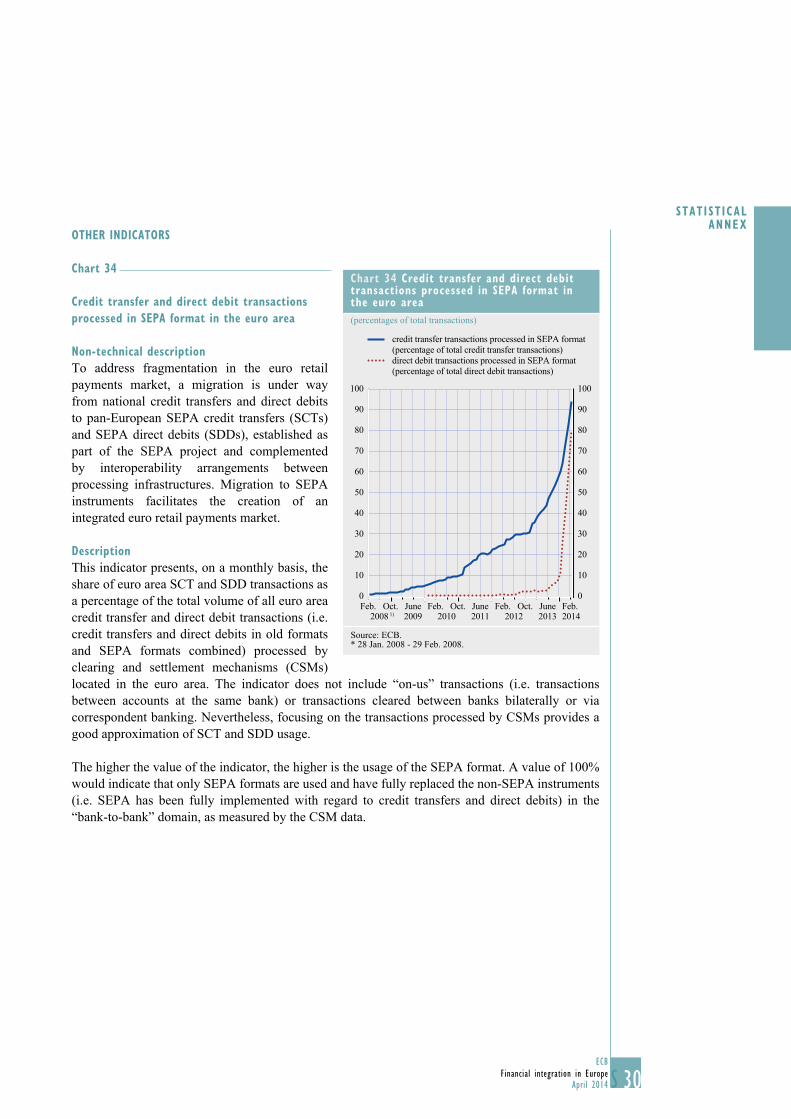
30ECB
Financial integration in EuropeApril 2014 S 30
STAT IST ICAL ANNEX
S
OTHER INDICATORs
Chart 34
Credit transfer and direct debit transactions processed in sEPA format in the euro area
Non-technical descriptionTo address fragmentation in the euro retail payments market, a migration is under way from national credit transfers and direct debits to pan-European SEPA credit transfers (SCTs) and SEPA direct debits (SDDs), established as part of the SEPA project and complemented by interoperability arrangements between processing infrastructures. Migration to SEPA instruments facilitates the creation of an integrated euro retail payments market.
DescriptionThis indicator presents, on a monthly basis, the share of euro area SCT and SDD transactions as a percentage of the total volume of all euro area credit transfer and direct debit transactions (i.e. credit transfers and direct debits in old formats and SEPA formats combined) processed by clearing and settlement mechanisms (CSMs) located in the euro area. The indicator does not include “on-us” transactions (i.e. transactions between accounts at the same bank) or transactions cleared between banks bilaterally or via correspondent banking. Nevertheless, focusing on the transactions processed by CSMs provides a good approximation of SCT and SDD usage.
The higher the value of the indicator, the higher is the usage of the SEPA format. A value of 100% would indicate that only SEPA formats are used and have fully replaced the non-SEPA instruments (i.e. SEPA has been fully implemented with regard to credit transfers and direct debits) in the “bank-to-bank” domain, as measured by the CSM data.
Chart 34 Credit transfer and direct debit transactions processed in sEPA format in the euro area(percentages of total transactions)
0
10
20
30
40
50
60
70
80
90
100
0
10
20
30
40
50
60
70
80
90
100
2008 1) 2009 2010 2011 2012 2013 2014
credit transfer transactions processed in SEPA format (percentage of total credit transfer transactions) direct debit transactions processed in SEPA format (percentage of total direct debit transactions)
Feb. Oct. June Feb. Oct. June Feb. Feb.Oct. June
Source: ECB.* 28 Jan. 2008 - 29 Feb. 2008.
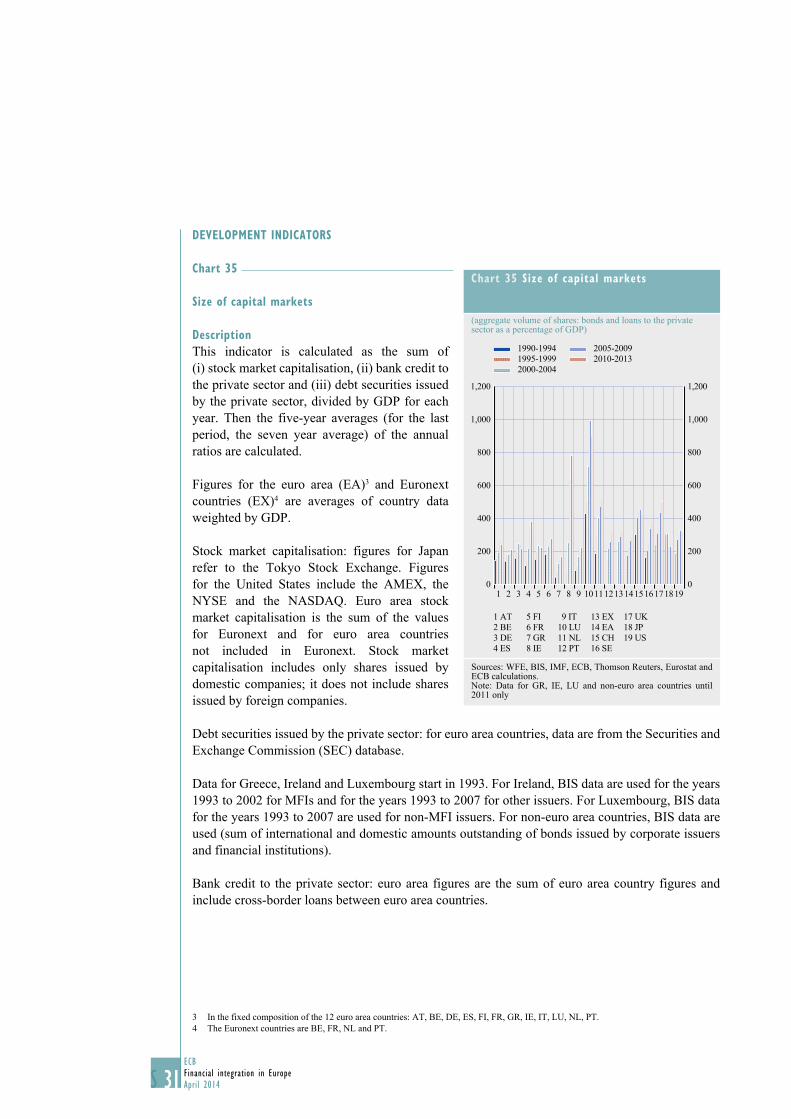
31ECBFinancial integration in EuropeApril 201431S
DEVELOPMENT INDICATORs
Chart 35
size of capital markets
DescriptionThis indicator is calculated as the sum of (i) stock market capitalisation, (ii) bank credit to the private sector and (iii) debt securities issued by the private sector, divided by GDP for each year. Then the five-year averages (for the last period, the seven year average) of the annual ratios are calculated.
Figures for the euro area (EA)3 and Euronext countries (EX)4 are averages of country data weighted by GDP.
Stock market capitalisation: figures for Japan refer to the Tokyo Stock Exchange. Figures for the United States include the AMEX, the NYSE and the NASDAQ. Euro area stock market capitalisation is the sum of the values for Euronext and for euro area countries not included in Euronext. Stock market capitalisation includes only shares issued by domestic companies; it does not include shares issued by foreign companies.
Debt securities issued by the private sector: for euro area countries, data are from the Securities and Exchange Commission (SEC) database.
Data for Greece, Ireland and Luxembourg start in 1993. For Ireland, BIS data are used for the years 1993 to 2002 for MFIs and for the years 1993 to 2007 for other issuers. For Luxembourg, BIS data for the years 1993 to 2007 are used for non-MFI issuers. For non-euro area countries, BIS data are used (sum of international and domestic amounts outstanding of bonds issued by corporate issuers and financial institutions).
Bank credit to the private sector: euro area figures are the sum of euro area country figures and include cross-border loans between euro area countries.
3 In the fixed composition of the 12 euro area countries: AT, BE, DE, ES, FI, FR, GR, IE, IT, LU, NL, PT.4 The Euronext countries are BE, FR, NL and PT.
Chart 35 size of capital markets
(aggregate volume of shares: bonds and loans to the private sector as a percentage of GDP)
0
200
400
600
800
1,000
1,200
0
200
400
600
800
1,000
1,200
1990-19941995-19992000-2004
2005-20092010-2013
1 2 3 4 5 6 7 8 9 10111213141516171819
1 AT2 BE3 DE4 ES
5 FI6 FR7 GR8 IE
9 IT10 LU11 NL12 PT
17 UK18 JP19 US
13 EX14 EA15 CH16 SE
Sources: WFE, BIS, IMF, ECB, Thomson Reuters, Eurostat and ECB calculations.Note: Data for GR, IE, LU and non-euro area countries until 2011 only

32ECB
Financial integration in EuropeApril 2014 S 32
STAT IST ICAL ANNEX
S
Chart 36
Debt securities issued by non-financial corporations
DescriptionThis indicator shows the outstanding amounts of debt securities issued by non-financial corporations, as a percentage of GDP for each year. Then the five-year averages (for the last period, the seven year average) of the annual ratios are calculated.
Data for the euro area countries (in the same composition as in Chart 1) come from the SEC database. For Ireland and Luxembourg, BIS data are used. Data for Greece, Ireland and Luxembourg start in 1993. For non-euro area countries, BIS data are used (the sum of international and domestic amounts outstanding of bonds issued by corporate issuers).
Charts 37-38
Chart 36 Debt securities issued bynon-financial corporations
(percentages of GDP)
0
10
20
30
40
50
0
10
20
30
40
50
5
15
25
35
45
5
15
25
35
45
1990-19941995-1999
2000-20042005-2009
2010-2013
1 2 3 4 5 6 7 8 9 10 11 12 13 14 15 16 17 18 191 AT2 BE3 DE
4 ES5 FI6 FR
7 GR8 IE9 IT
10 LU11 NL12 PT
19 US13 EX14 EA15 CH
17 UK18 JP
16 SE
Sources: BIS, ECB, Eurostat, IMF and ECB calculations. Note: Data for non-euro area countries until 2011 only.
Chart 37 Venture capital finance
(percentages of GDP)
0.00
0.02
0.04
0.06
0.08
0.10
0.12
0.00
0.02
0.04
0.06
0.08
0.10
0.12
1 2 3 4 5 6 7 8 9 10 11 12 13 14 15 16 171 AT2 BE3 DE
4 ES5 FI6 FR
7 GR8 IE9 IT
10 NL11 PT12 EA
13 CH14 DK15 SE
16 UK17 US
1996-19992000-2003
2004-20072008-2012
Sources: European Private Equity and Venture Capital Association, PricewaterhouseCoopers, Eurostat and ECB calculations.
Chart 38 Private equity investmentby independent funds
(percentage share of total private equity investments)
0.0
0.2
0.4
0.6
0.8
1.0
1.2
0.0
0.2
0.4
0.6
0.8
1.0
1.2
1996-19992000-2003
2004-20072008-2012
1 2 3 4 5 6 7 8 9 10 11 12 13 14 15 161 AT2 BE3 DE
4 ES5 FI6 FR
7 GR8 IE 9 IT
10 NL11 PT12 EA
13 CH14 DK15 SE
16 UK
Sources: European Private Equity and Venture Capital Association and ECB calculations.
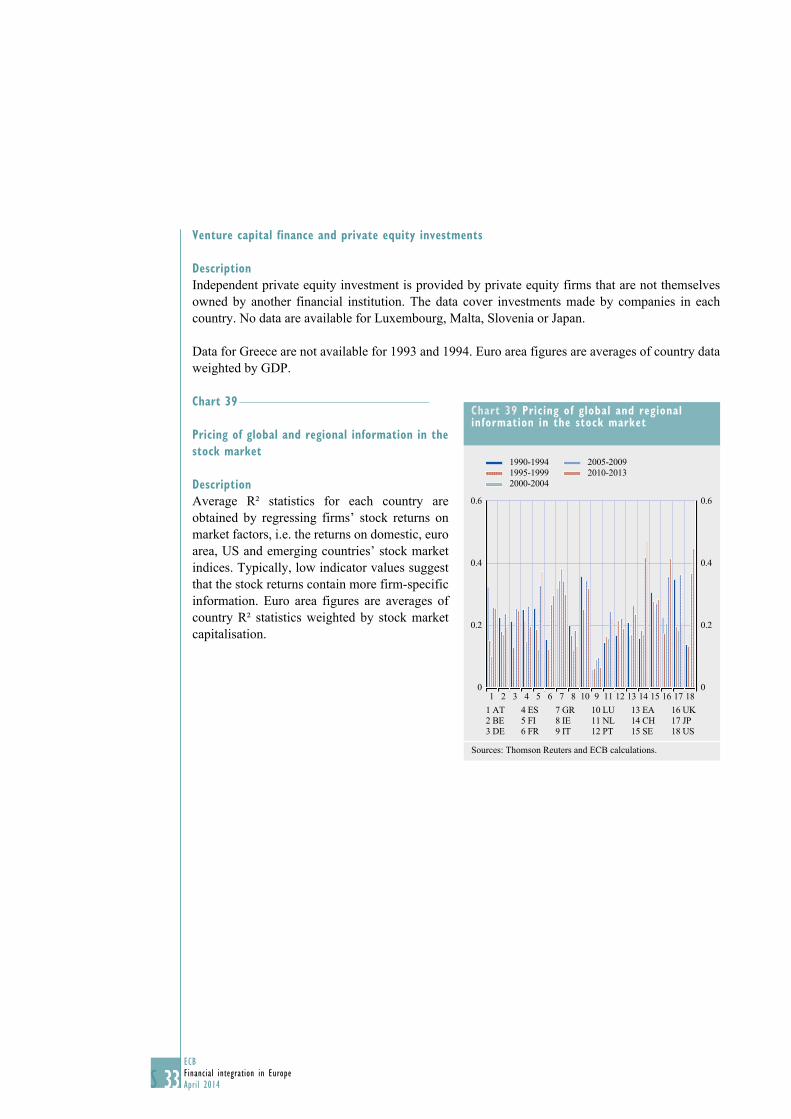
33ECBFinancial integration in EuropeApril 201433S
Venture capital finance and private equity investments
DescriptionIndependent private equity investment is provided by private equity firms that are not themselves owned by another financial institution. The data cover investments made by companies in each country. No data are available for Luxembourg, Malta, Slovenia or Japan.
Data for Greece are not available for 1993 and 1994. Euro area figures are averages of country data weighted by GDP.
Chart 39
Pricing of global and regional information in the stock market
DescriptionAverage R² statistics for each country are obtained by regressing firms’ stock returns on market factors, i.e. the returns on domestic, euro area, US and emerging countries’ stock market indices. Typically, low indicator values suggest that the stock returns contain more firm-specific information. Euro area figures are averages of country R² statistics weighted by stock market capitalisation.
Chart 39 Pricing of global and regionalinformation in the stock market
0
0.2
0.4
0.6
0
0.2
0.4
0.6
1 2 3 4 5 6 7 8 910 11 12 13 14 15 16 17 181 AT2 BE3 DE
4 ES5 FI6 FR
7 GR8 IE9 IT
10 LU11 NL12 PT
13 EA14 CH15 SE
16 UK17 JP18 US
1990-19941995-19992000-2004
2005-20092010-2013
Sources: Thomson Reuters and ECB calculations.


EURO
PEAN
CEN
TRAL
BAN
K FI
NANC
IAL
INTE
GRAT
ION
IN E
UROP
E AP
RIL
2014