Embed Size (px)
Citation preview
Reportby the Comptroller and Auditor General
HM Treasury
Financial institutions landscape
HC 418 SESSION 2015-16 10 SEPTEMBER 2015

Our vision is to help the nation spend wisely.
Our public audit perspective helps Parliament hold government to account and improve public services.
The National Audit Office scrutinises public spending for Parliament and is independent of government. The Comptroller and Auditor General (C&AG), Sir Amyas Morse KCB, is an Officer of the House of Commons and leads the NAO, which employs some 810 people. The C&AG certifies the accounts of all government departments and many other public sector bodies. He has statutory authority to examine and report to Parliament on whether departments and the bodies they fund have used their resources efficiently, effectively, and with economy. Our studies evaluate the value for money of public spending, nationally and locally. Our recommendations and reports on good practice help government improve public services, and our work led to audited savings of £1.15 billion in 2014.

Report by the Comptroller and Auditor General
Ordered by the House of Commons to be printed on 8 September 2015
This report has been prepared under Section 6 of the National Audit Act 1983 for presentation to the House of Commons in accordance with Section 9 of the Act
Sir Amyas Morse KCB Comptroller and Auditor General National Audit Office
4 September 2015
HC 418 | £10.00
HM Treasury
Financial institutions landscape
This report examines the landscape of financial institutions in government.
© National Audit Office 2015
The material featured in this document is subject to National Audit Office (NAO) copyright. The material may be copied or reproduced for non-commercial purposes only, namely reproduction for research, private study or for limited internal circulation within an organisation for the purpose of review.
Copying for non-commercial purposes is subject to the material being accompanied by a sufficient acknowledgement, reproduced accurately, and not being used in a misleading context. To reproduce NAO copyright material for any other use, you must contact [email protected]. Please tell us who you are, the organisation you represent (if any) and how and why you wish to use our material. Please include your full contact details: name, address, telephone number and email.
Please note that the material featured in this document may not be reproduced for commercial gain without the NAO’s express and direct permission and that the NAO reserves its right to pursue copyright infringement proceedings against individuals or companies who reproduce material for commercial gain without our permission.
Links to external websites were valid at the time of publication of this report. The National Audit Office is not responsible for the future validity of the links.
10598 09/15 NAO

The National Audit Office study team consisted of: Simon Reason, Vasilisa Starodubtseva, Imran Qureshi, Euan McMillan, Afnan Khokhar, under the direction of Matthew Rees.
This report can be found on the National Audit Office website at www.nao.org.uk
For further information about the National Audit Office please contact:
National Audit Office Press Office 157–197 Buckingham Palace Road Victoria London SW1W 9SP
Tel: 020 7798 7400
Enquiries: www.nao.org.uk/contact-us
Website: www.nao.org.uk
Twitter: @NAOorguk
Contents
Key facts 5
Summary 8
Part OneIntroduction 15
Part TwoGovernment’s exposure to the financial sector 17
Part ThreeFinancial institutions landscape 33
Appendix OneMethodology 46
Appendix TwoFurther information concerning Lloyds Banking Group and the Royal Bank of Scotland 47
Appendix ThreeIndex of previous NAO reports 52
Appendix FourClassification of public bodies 54
Appendix FiveFull listing of financial institutions 58
Appendix SixFinancial information for the policy-related institutions 62

Financial institutions landscape Key facts 5
Key facts
54number of fi nancial institutions in central government
£222bntotal assets of government owned policy-related institutions and fi nancial sector interventions
£109bnestimated value of the fi nancial sector interventions
4 institutions acquired in whole or part during the fi nancial crisis (Lloyds Banking Group, Royal Bank of Scotland, Bradford & Bingley and Northern Rock)
36 number of ‘policy-related’ institutions in this landscape – fi nancial statements are available for 30 institutions1
Three-fold increase in policy-related institutions since 2004
£62.6 billion anticipated cash proceeds from planned sales of shares, mortgage books and student loans by 2020
-£0.2 billion net cash proceeds: £94.6 billion in receipts from the sale and repayment of existing loans minus £94.8 billion from issuing new loans and other initiatives2
10,451 employees of 23 institutions, excluding the banks acquired as part of the fi nancial stability interventions
1 As at 31 March 2015.
2 From 2015-16 to 2020-21.

Figure 1 Financial institutions landscape
Government department
International financial institutions
European Investment Bank
International Monetary Fund
Bank of England
World BankAsian
Development Bank
African Development
Bank
European Bank for Reconstruction and Development
Bank for International Settlements
National Savings& Investments
Public sector entities
Wholly-owned government companies
Private sector companies/Contractual & Control Arrangements
UKAR Corporate
Services LtdRoyal Mint
Student LoansCompany
Royal Bank of Scotland Plc
Lloyds Banking Group Plc
Bradford &Bingley Plc
NRAMPlc
The HousingFinance
Corporation Ltd
Affordable Housing
Finance Plc
Financial Services Compensation
Scheme Ltd
Public Works Loan Board
Global Climate Partnership Fund
UK SovereignSukuk Plc
Help to Buy (HMT) Ltd
Guaranteed Export Finance Corporation plc
National Employment Savings Trust
(NEST)Corporation
Community Health Partnership Ltd
NEST Scheme
Salix Finance Ltd
Private Infrastructure Development
Group
Big Society Capital Ltd
NHS Property Services Ltd
The Carbon Trust Ltd
PensionProtection Fund
MyCSP LtdIntegrated
Debt Services Ltd
Infrastructure FinanceUnit Ltd
British Business Bank Plc
The Start-up Loans Company
UK GreenInvestmentBank Plc
Post OfficeLtd
Green Deal Finance
Company Ltd
22%
Government control
100%
24% 25%70%Funding
100%
9%
£1 of £7
Administers Guarantees
Guaranteed by government2
Commissioners for the Reduction
of the National Debt
Electricity Settlements
Company Ltd
Low Carbon Contracts
Company Ltd
Pool Reinsurance Company Ltd
UK Financial Investments
Ltd
Infrastructure UK
UK Debt Management
Office
The Shareholder Executive1
Guaranteed by government
GovernmentBankingService
64%Guaranteed by government Trust
CDC Group Plc
Homes and Communities
Agency
UK Asset Resolution (UKAR) Ltd
HMT DFIDDCLG CO DWPBIS DoH HMRCECGD DECC
Financial Sector Intervention
Government Department
Core Financing Institution
Policy-related Institution
International Financial Institution
Colour key
0% 19%
Government control
Now disolved Limited by guarantee
Notes
1 The Shareholder Executive’s portfolio is listed on page 19.
2 DCLG has issued an unconditional and irrevocable guarantee in relation to bonds issued by AHF plc. AHF Plc is the delivery partner for DCLG and it operates under licence.
3 This information is based on publicly available information at 31 March 2015.
Source: National Audit Offi ce analysis of departmental and institutional published annual reports and accounts

8 Summary Financial institutions landscape
Summary
1 Since the financial crisis began in 2008 the number of government interventions in financial markets has increased. These interventions include the acquisition of significant stakes in banks and the creation of many new financial institutions. It is not clear that any single area of government is taking a portfolio view of the institutions associated with these interventions, so we intend to highlight them in this report.
2 This report describes a landscape of 54 such institutions representing a total asset value of over £200 billion.3 This includes:
• the four financial institutions acquired (in part or in full) during the financial crisis –these cost £107.6 billion and have a current value of approximately £109 billion;4
• seven core-financing institutions;
• membership of seven international financial institutions; and
• ownership or contractual agreement with 36 ‘policy-related’ institutions.5
3 Between 2004 and 2014, the number of policy-related financial institutions increased three-fold, from 12 to 36 (Figure 2). These 36 institutions collectively administer £123 billion in total assets and £138 billion total liabilities.6 This landscape is evolving rapidly, for example several new institutions have been launched recently, several are growing rapidly, and others have been merged or closed to new applicants.
3 This excludes the sponsor departments, and subsidiaries, which may perform a similar range of activities.4 The current value figure of £109 billion consists of the total assets for UK Asset Resolution and the market value of
equity stakes in Lloyds Banking Group and the Royal Bank of Scotland. Market values may vary. 5 Policy-related institutions are institutions created to implement a specific policy objective. Several central government
departments also undertake financial transactions (eg issuing loans or guarantees), however, these have not been counted as additional institutions.
6 These figures include the student loan book which is reported on the BIS departmental accounts.

Financial institutions landscape Summary 9
4 Drawing on government guidance on financial transactions, and legislation on regulated financial sector activities, this report defines the financial institutions based on the following activities:7
• statutory compensation schemes and reinsurance, funded mainly or exclusively by industry levies;
• issuing financing guarantees – including arranging, distributing and administering guarantees and related insurance arrangements and indemnities;
• lending – including arranging, distributing and administering loans to a variety of customers and industries;
• investment and asset management – including managing equity investments, government property, pensions and related advisory services; and
• other services – for example, clearing houses associated with energy market reforms.
7 These activities are defined in the FSMA (see paragraph 2.38).
Figure 2Cumulative number of financial institutions
Number of institutions
Since the crisis there has been a significant growth in the number of policy-related institutions
Source: National Audit Office analysis of departmental and institutional published annual reports and accounts
0
10
20
30
40
50
60
2005 2006 2007 2008 2009 2010 2011 2012 2013 2014
4
36
54
7
7
4
32
50
7
7
4
28
46
7
7
4
22
40
7
7
2
17
33
7
7
2
16
32
7
7
14
27
7
6
14
27
7
6
14
27
7
6
2004
13
26
7
6
pre 2004
12
25
7
6
4
20
7
7
38
Financial Sector Interventions
Policy Related Institutions
International Financial Institutions
Core Financing Activities
10 Summary Financial institutions landscape
Scope
5 This landscape report identifies the characteristics of individual financial institutions, including their activities, sectors, customers, distribution methods, accountability models, regulatory considerations, ownership stakes, financial performance and funding arrangements. We have identified a number of institutions that perform an administrative function and therefore do not report the relevant financial instrument related to it in their financial statements. In these cases, the financial instrument is reported in the financial statements of the sponsor department (the largest such example concerns student loans).
6 In order to contain the scope of this report, we have excluded local government, social housing, local enterprise partnerships and special purpose vehicles set up to manage private finance initiative (PFI) and private finance 2 (PF2) transactions. We have also excluded organisations in Northern Ireland, Scotland and Wales. There are a number of sectors where we have included the largest institutions but excluded the smaller ones, for example property, pensions, insurance, leasing, financing aggregators and asset-backed vehicles.
7 The report is based on publicly available information at 31 March 2015. More detailed further financial information is included in Appendix Six.
Key findings
8 There has been a significant growth in the number of financial institutions over the past ten years, reaching a total of 54, including the four financial institutions government acquired (in whole or part) during the financial crisis. Alongside government interventions to maintain financial stability, the number of policy-related institutions has increased three-fold, from 12 to 36 since 2004. This is because the government has tended to establish separate companies to conduct financial transactions and perform related activities, eg administer consumer funding models such as student loans. State aid, a form of government intervention, only allows lending whereby there are demonstrable cases of market failure (paragraphs 1.1 to 1.4 and Figure 2).
9 The government’s exposure to the financial sector, measured by public sector net debt, was over £2 trillion between November 2008 and February 2014. Lloyds Banking Group was removed from the national statistics after the government sold some of its shares in March 2014. Royal Bank of Scotland (RBS) and UK Asset Resolution (UKAR) (which manages the legacy assets of Bradford & Bingley and Northern Rock) remain classified as being within the public sector (paragraphs 2.12 to 2.14, Figure 3 and Appendix Two).

Financial institutions landscape Summary 11
10 The government plans to reduce its exposure to some sectors but this may be offset by growth in policy-related activities. The Office for Budget Responsibility (OBR) estimates the government will receive around £94.6 billion between 2015 and 2020, from selling shares and selling or collecting loans it has issued. Outgoings from the issuance of new loans and other initiatives will total £94.8 billion over the same time period. In relation to the residential mortgage sector, the £2.7 billion proceeds from selling part of the UKAR portfolio is offset by Help to Buy schemes, which have grown to £3 billion (paragraphs 2.27 to 2.29 and Figure 6).
11 The government has announced plans to divest of a number of assets, which the OBR estimates will result in proceeds of £62.6 billion. These assets are: a portion of the student loans portfolio; the remaining shares in Lloyds Banking Group; a portion of the mortgage portfolio in UKAR and a proportion of its RBS shares. A government commissioned report8 estimates that the cost of the financial sector interventions was £107.6 billion, that receipts to June 2015 were £43.8 billion and if all the shares were sold at March 2015 values, there is an overall cash surplus of £14.3 billion (subsequent OBR data at July 2015 suggests the surplus is now £14.9 billion). The estimates do not take account of the cumulative cost of financing these investments, which is approximately £10.88 billion for Lloyds Banking Group and RBS9 (paragraphs 2.1, 2.2, Figure 6 and Appendix Two).
12 The student loan book is an increasingly important and material10 feature of the government balance sheet. Of the £64.1 billion lent to students, the government expects to recover £42.2 billion. The OBR forecasts that £84.4 billion of new student loans will be issued in the period of 2015–2020, and a total of £11.9 billion will be repaid on past loans during the same period. The government expects to generate about £11.5 billion of proceeds from sales of the pre 2012 student loan book. The total value of student loans is expected to reach £100 billion by 2018 (paragraphs 2.29, 3.11 to 3.13, Figure 6, Figure 10 and Appendix Six).
13 There are five policy-related institutions with assets or liabilities greater than £10 billion each, six with gross assets or liabilities greater than £2 billion each and three greater than £1 billion each. We estimate that, in addition to the student loan book, the government’s wholly-owned policy-related institutions held £70 billion of assets and £69 billion of liabilities at 31 March 2015. The OBR forecasts a further £10 billion increase in public sector net debt by 2020 due to the expansion of Help to Buy, Green Investment Bank, British Business Bank and other policy-related financial institutions (paragraphs 2.22 to 2.28, Figure 4, Figure 5, Figure 6 and Appendix Six).
8 Rothschild, The UK investment in the Royal Bank of Scotland, 10 June 2015, p. 11.9 The cumulative cost of financing these investments excludes UKAR.10 IAS 8 defines material as: “Omissions or misstatements of items are material if they could, individually or collectively,
influence the economic decisions that users make on the basis of the financial statements.”
12 Summary Financial institutions landscape
14 The policy-related institutions exhibit significant variety and span the public–private sector divide. The institutions undertake a variety of activities in numerous sectors and are sponsored by ten central government departments. Their delivery models include units of departments, arm’s length bodies, government companies and private sector delivery partners. Government ownership ranges from 0–100% (paragraphs 1.4, 2.5 and Figure 9).
15 There is rarely an accessible way to distinguish between a temporary market intervention and an enduring financial institution, or to identify the intended duration of taxpayer exposure. If the government decides to reduce its financial services portfolio, an orderly exit from the sector will take many years (paragraphs 2.3 and 2.9).
16 The government is the main, or only, source of capital for most of these institutions, but only two institutions paid a dividend in the last year. Sponsor departments can provide initial share capital, equity commitments and loans. It is hard to predict whether, or when, additional capital will be required to achieve commercial success or withstand adverse events. Many of the financial institutions do not operate with significant reserves (paragraphs 2.31 to 2.33).
17 Most government companies are categorised as central government bodies rather than public corporations and are therefore technically exempt from the requirement to generate a commercial return. Our review indicates that 16 have not been classified by the ONS at all. Historical financial information is available for 30 of 36 policy-related institutions (paragraphs 2.5, 2.33 and Appendix Six).
18 Financial institutions within central government are generally exempt from financial services regulation. We found 11 financial institutions to be listed on the Financial Conduct Authority register. The absence of the rest is explained by crown exemption and the administrative nature of their activities.11 Some administer financial transactions on behalf of their sponsor departments; others are responsible for direct or indirect distribution of financial services to a range of retail and institutional customers. Only two of the institutions, RBS and Lloyds, are subject to the Prudential Regulation Authority’s stress-testing (paragraphs 2.36 to 2.40 and Appendix Six).
Concluding remarks
Seven years after the financial crisis, the government has announced that it intends to accelerate its asset sale programme. The programme is unprecedented in scale and aims to reduce the government’s exposure to the financial sector. The one-off inflow of proceeds can be used to repay national debt, although the overall impact on government borrowing is uncertain, not least as the growth in some financial institutions may offset sale proceeds. We expect the government to demonstrate good practice when it disposes of these investments.
11 The US Government Accountability Office (GAO) found that shadow banking, such as various special purpose entities and non-bank mortgage origination companies lacked significant prudential regulation. See GAO, Bank Regulation: Lessons Learned and a Framework for Monitoring Emerging Risks and Regulatory Response, GAO-15-365, 25 June 2015.

Financial institutions landscape Summary 13
A diverse population of other public bodies has emerged in recent years to perform a range of activities commonly found in the financial sector, including lending, issuing financial guarantees and managing government investments. As a group, these institutions are becoming material to the government balance sheet and create a range of opportunities and risks. Some of these institutions appear to have survived the market conditions they were created to alleviate, and the rationale for their existence in the public sector is questionable. We consider that government should adopt a portfolio management approach alongside the traditional departmental oversight model to provide heightened assurance over the portfolio.
Issues this landscape report raises
19 The development of this landscape report has highlighted a number of issues that merit further discussion and more detailed review:
a How to assess value for money of the divestiture programme. We have reported on privatisations and asset sales after they have completed and we may return to this theme as the divestiture programme unfolds. To reach a conclusion on value for money it is important to assess the value generated through holding onto an asset versus selling it. It is also important to consider a range of factors, including valuation, the design and management of sale process and bidder dynamics during a sale process.
b How to manage policy initiatives over their full life cycle and ensure they last no longer than necessary. This may be informed by considering more explicitly the differences between temporary and enduring institutions, and how to assess whether an institution or government intervention should continue to operate. It may be appropriate to define the parameters for an exit at an early stage (eg formation of a policy-related institution) and keep these under review. This assessment may best be performed independently of the institution affected to minimise risk of bias.
c How to achieve the benefits of portfolio management at a reasonable cost. The advantages of taking a portfolio approach to the financial institutions landscape include: the ability to identify potentially offsetting effects, such as expansion and contraction; risk-modelling to measure and manage exposure to individual asset classes; and the ability to benchmark performance across institutions and within sectors, apply stress tests and develop scenarios. A range of analytical techniques could be applied to provide better assurance over the portfolio. Examples of operational performance metrics that could be used to compare bodies with similar responsibilities in the public and private sector include: investment performance; expense ratios; loan default; loss and recovery rates. It may be appropriate to consider reviews of start-ups and principal interventions including their implications for the existing policy landscape and other knock-on effects.

14 Summary Financial institutions landscape
d How to achieve an appropriate balance between minimising risks to the taxpayer, and avoiding inefficient use of government working capital or reserves. Some of these activities present risks to the taxpayer, which is understandable given their responsibilities to address market failures. Unplanned developments (eg a shortfall of income or deterioration of asset value) could spill over to departments, and place pressure on other planned expenditure in the context of tight budgets. However, the emergence of substantial capital reserves to minimise reversionary risk for an individual institution may be inefficient from an overall government balance sheet perspective.
e How to improve understanding of these institutions and their impact on the government’s finances. The differences in classification of public bodies and recording of financial transactions between the national statistics, whole of government accounts and financial statements of individual financial institutions creates a range of challenges in understanding the true scale and extent of activities. For example, approaches to value assets and liabilities, recognise and report contingent liabilities and other potential exposures, differ and some balances may be split across more than one public body.
Financial institutions landscape Part One 15
Part One
Introduction
Financial institutions included in this landscape
1.1 Since the financial crisis began in 2008 the number of government interventions in financial markets has increased. These interventions included the acquisition of significant stakes in, and creation of new, financial institutions. This report seeks to quantify the scale and scope of this landscape by identifying financial institutions within central government, departmental boundaries or that operate at arm’s length from central government. These include government companies, executive agencies, non-ministerial public bodies, public corporations and private sector companies explicitly linked to government through shareholding, contract, licence or guarantee. We found 54 such institutions.
1.2 Figure 1 on page 6 shows how the 54 financial institutions relate to their sponsor departments. It distinguishes between departments, executive agencies and companies.
1.3 We have identified four broad categories of institution:12
• core financing, such as the Bank of England (central bank), required to fund a sovereign state;
• international financial, for example the European Investment Bank;13
• financial sector interventions, including Royal Bank of Scotland (RBS), Lloyds Banking Group, Bradford & Bingley and Northern Rock;14 and
• policy-related which are institutions created to implement specific policy objectives. These take a variety of legal forms.
The full landscape is listed in Appendix Five and ranges from the Affordable Housing Finance Plc, to the World Bank. Appendix Six contains further financial information about the 30 policy-related institutions for which financial statements were available at 31 March 2015.
12 We have not included the sponsor departments in their own right, nor the subsidiaries.13 On 12 March 2015, the government announced its intention to become a prospective founding member of the Asian
Infrastructure Investment Bank (AIIB). This was accepted on 28 March 2015. AIIB is expected to be set up by the end of 2015.
14 Bradford & Bingley and Northern Rock were subsequently absorbed into UK Asset Resolution Limited.

16 Part One Financial institutions landscape
Financial services activities
1.4 We have applied a relatively broad definition of a financial institution based on the financial transactions and services they are involved in. We combined government guidance and legislation concerning financial transactions (covered further in paragraphs 1.5 to 1.6) and regulated financial services activities to define the following activities:
• statutory compensation schemes and other types of insurance arrangements funded mainly, or exclusively, by industry levies;
• issuing financing guarantees, including arranging and administrating guarantees and related insurance arrangements and indemnities;
• lending, including arranging and administration of loans to a variety of customer and industries;
• investment and asset management, including selling, buying and managing equity investments, government property, pensions and related advisory services; and
• other activities, such as clearing houses associated with energy market reforms.
Principal sources of public guidance
1.5 There are five sources of public guidance that are important to this landscape: the Office for National Statistics’ (ONS) Public Sector Classification Guide; HM Treasury’s Managing public money, and Consolidated budgeting guidance; the Financial Services and Markets Act (2000); and the Cabinet Office’s Categories of public bodies: a guide for Departments.15 We will refer back to this guidance, summarised at Appendix Four, throughout this report.
1.6 The ONS identifies an entity as a public financial corporation if its primary function is financial intermediation – acquiring financial assets and liabilities on its own account by engaging in financial transactions in the market. Three of the 36 policy-related institutions we have identified fall into this category (see Appendix Six).
15 Office for National Statistics, Public Sector Classification Guide, May 2015; HM Treasury, Consolidated budgeting guidance 2015 to 2016, March 2015; HM Treasury, Managing public money, July 2013; Financial Services and Markets Act (2000); and Cabinet Office, Categories of Public Bodies: a Guide for Departments, December 2012.

Financial institutions landscape Part Two 17
Part Two
Government’s exposure to the financial sector
Financial market interventions
2.1 To maintain financial stability, in 2008, the government invested £107.6 billion16 to acquire a controlling equity stake (84%) in Royal Bank of Scotland (RBS), a 43% stake in Lloyds Banking Group (Lloyds) and create UK Asset Resolution (UKAR). In 2010, it acquired the whole of Northern Rock, and Bradford & Bingley.17 As a result of these interventions, two companies were created: UKAR to manage the mortgage and loan portfolio of Northern Rock and Bradford & Bingley; and UK Financial Investments (UKFI) to manage HM Treasury’s shareholdings in Lloyds, RBS and UKAR on behalf of HM Treasury. UKFI manages the investments on a commercial basis and does not intervene in day-to-day management decisions of investee companies. It engages actively with UKAR in a manner similar to that in which a financial sponsor would engage with a wholly-owned portfolio company.18 The government plans to return £51.1 billion of these investments to the private sector in this parliament.
2.2 According to the Office for Budget Responsibility (OBR),19 if HM Treasury received all loan payments in full and sold the shares at their March 2015 values, it would realise an overall cash surplus of £14.9 billion.20 But these figures exclude the costs to HM Treasury of financing these interventions, and any offsetting interest and dividend receipts. If the interventions in Lloyds and RBS were financed through debt, the Treasury estimates that additional debt interest costs would have amounted to £22 billion to date. The Treasury has also received around £5 billion of interest over the same period (see Appendix Two).21
16 Rothschild, The UK investment in the Royal Bank of Scotland, 10 June 2015, p. 11.17 Some parts of Bradford & Bingley were transferred to Santander.18 This is including with respect to individual lending or remuneration decisions save, in the case of UKAR, to the extent
provided in the applicable Investee Company Framework Document. See Shareholder Relationship Framework Document, October 2014.
19 Office for Budget Responsibility, Economic and fiscal outlook, July 2015.20 The Rothschild report uses March 2015 OBR data to calculate a surplus of £14.3 billion.21 Office for Budget Responsibility, Economic and fiscal outlook, March 2015.

18 Part Two Financial institutions landscape
Growth in policy-related institutions
2.3 Some guidance is available on the establishment of new public bodies and the Cabinet Office publishes guidance on closing public bodies, in addition to providing a supplementary checklist for its 2010 public bodies reform programme.22
2.4 HM Treasury’s Managing public money states that:23
• each new arms-length body should have a specific purpose;
• demonstrate an advantage; and
• one should be sceptical about setting up new bodies.
2.5 Over the past decade departments have tended to establish government companies to perform financial activities rather than undertake these activities within the departmental boundary (Figure 2 on page 9 demonstrates the rate of growth). Of the 24 policy-related institutions created since 2004, 18 are Companies Act companies,24 two are arm’s-length bodies,25 one is an NDPB with a related trust scheme,26 one is incorporated overseas27 and one is a unit within HM Treasury.28 Of the 18 companies, 11 are wholly owned by government, three companies are limited by guarantee and one company is guaranteed by government.29 Of the 11 government owned companies, ONS classifies all but four as central government bodies (as opposed to public corporations). Departments provide funding to companies through financial transactions, including subscribing to their share capital or making loans to them.
2.6 An underlying theme in the growth of the financial institutions landscape is the increasing use of the government balance sheet. Growth contrasts with much of the public sector which is subject to reductions in expenditure. The government has created new financial institutions to implement numerous individual policies. For example, the change in policy for funding higher education from taxpayer-funded maintenance grants to consumer-funded student loans in 1989 resulted in the creation of the Student Loans Company Limited to administer the loans. Issuing of a loan adds to national debt and creates an asset at department or institutional level, reflecting the amount that is due to be recovered. Interest received on loans is recorded as income. The Department for Business, Innovation & Skills manages the student loan book on its own departmental accounts – the carrying value of the loan book stood at £42 billion at 31 March 2015; we discuss this further in Part Three.
22 Cabinet Office, Public Bodies: A Guide for Departments: Chapter 10: Dissolving a Public Body, June 2006 and Cabinet Office, Public Bodies Reform: checklist for departments, March 2012.
23 See Appendix Four.24 The government’s public bodies reform policy has placed controls on the formation of new NDPBs resulting in
a company becoming the preferred option for new public bodies.25 The Homes and Communities Agency (HCA) and the Pension Protection Fund (PPF).26 National Employment Savings Trust (NEST) Corporation’s website states it is a non-departmental public body,
and we also include the related NEST Scheme.27 Global Climate Partnership Fund.28 Infrastructure UK.29 The Start-Up Loans Company Limited, Salix Finance Limited and the Green Deal Finance Company Limited are limited
by guarantee. Affordable Housing Finance Plc is guaranteed by government.
Financial institutions landscape Part Two 19
2.7 A number of other public bodies have developed lending products and take full responsibility for the entire lending process; in our view this makes them financial institutions. For example several of the Homes and Communities Agency (HCA)’s policies to promote housing development are designed to be recoverable investments. We have included the HCA in the landscape, while acknowledging that it has various functions unrelated to financial institutions, which the HCA told us make up the majority of its headcount and staff costs and the majority of income and expenditure reported in the Statement of Comprehensive Net Expenditure (see appendix six for further information). Other examples of lending include: loans to the private sector by the Infrastructure Financing Unit; to the energy sector through the UK Green Investment Bank Plc; and to overseas development beneficiaries via CDC Group Plc. The government has provided loans to stimulate investment in other parts of the economy, such as the range of loans that the British Business Bank Plc provides to small and medium-sized enterprises via a network of distribution partners. All of these loans are made to address ‘market-failure’, for example where private sector organisations do not provide private capital.
2.8 Investment managers, such as UK Financial Investments Limited (a company HM Treasury owns) and the Shareholder Executive (a unit of the Department for Business, Innovation & Skills), were created to apply commercial skills to managing government investments in equity, debt and business interests.30 This trend applies to other asset classes, such as government property (eg NHS Property Services Limited). In some cases these investment managers are appointed through contractual arrangements with third party providers, and the government has invested in investment funds alongside private capital.
2.9 It is not always clear whether the interventions outlined in the preceding paragraphs are temporary or enduring. For example, in our report on the UK Guarantees scheme for infrastructure we found that HM Treasury originally intended the scheme to be a temporary intervention until December 2014. In June 2013, although financial markets had improved, the Treasury concluded that it was necessary to provide a long-term commitment to the energy market by extending the application deadline to December 2016. Our report found that the longest guarantee lasted 44 years. We recommended that, as market conditions improve, HM Treasury should ensure that it is rigorous and objective in ensuring that guarantees for projects are genuinely needed and that the projects supported bring significant public value.
30 On 20 May 2015, the government announced that responsibility for the Shareholder Executive will transfer from the Secretary of State for the Department for Business, Innovation & Skills (BIS) to the Chancellor of the Exchequer upon creation of the new vehicle. A new government-owned company (‘GovCo’) will be formed to oversee the activities of both the Shareholder Executive and UK Financial Investments.
Available at: www.gov.uk/government/news/machinery-of-government-shareholder-executive-and-uk-financial-investments
The Shareholder Executive’s portfolio of investments and/or governance relationships is: British Business Bank, CDC group, Channel 4, Companies House, Electricity Settlements Company, Eurostar (which has recently been sold), Green Investment Bank, Highways Agency, Insolvency Service, Land Registry, London and Continental Railways, Low Carbon Contracts Company, Met Office, NATS, Nuclear Decommissioning Authority, National Nuclear Laboratory, Nuclear Liabilities Fund, Ordnance Survey, Post Office Limited, Royal Mail Group, The Royal Mint, UK Export Finance, Urenco, Working Links, and British Nuclear Fuels Limited.

20 Part Two Financial institutions landscape
2.10 Financing guarantees have become more common and are issued to a range of beneficiaries, including infrastructure projects, small and medium-sized enterprises, home buyers and developers. They raise interesting accounting issues which impact many of these institutions – and are discussed further in the next section. In the case of the guarantees, they are disclosed in the Whole of Government Accounts; however, neither the associated contingent liabilities nor provisions31 are recorded in the national statistics. Therefore movements in guarantee contracts have no impact on the fiscal position unless they are called.32 In our report on the UK Guarantees scheme for infrastructure we noted that there could be an additional £80 billion of future guarantees issued by government. These schemes are administered by HM Treasury (including teams of commercial specialists within Infrastructure UK), the Department for Communities and Local Government (DCLG) and the Export Credit Guarantees Department (ECGD), trading as UK Export Finance.
Exposure measured by the National Statistics
2.11 The way the ONS classifies these organisations (see paragraph 1.6) has a significant impact on the national statistics.
2.12 ONS publish two public sector net debt measures, one that includes all public sector bodies (PSND) and one that covers the whole of the public sector excluding public sector banks (PSND-ex). Currently only RBS is classified as a deposit taking public financial institution (ie public sector bank) but in previous years, Lloyds, Bradford & Bingley plc and Northern Rock plc were all also classified as public sector banks.
2.13 Lloyds was reclassified in 2014 to the private sector (and so outside PSND entirely) following reductions in the government holding of shares. Northern Rock and Bradford & Bingley were reclassified in 2010 to the central government sector when they lost their banking licence, bringing them inside the PSND-ex measure. The debt of the Bank of England and all non-deposit taking public financial institutions are included in the PSND-ex measure.
2.14 PSND is defined as financial liabilities (except for payables) less liquid financial assets. Liquid assets includes notes and coins, bank deposits, government bonds, assets held by central government involved in debt, and reserves management. PSND does not measure illiquid assets (for example the Student Loans Company Limited), changes to provisions, or contingent liabilities. These would only feature in national statistics once cash payments have occurred. Given that an illiquid asset does not offset a liability in the national statistics, if an asset is sold in exchange for cash, the proceeds may reduce national debt at the point of sale. However, this may be more than, or less than the underlying cost, and the crystallisation of sale proceeds extinguishes any future stream of income (eg dividends or interest).
2.15 Figure 3 shows the impact of the financial sector interventions on PSND.
31 A provision is a liability for something that will happen but the timing and scale is uncertain; a contingent liability is a liability that might happen but the scale and timing is uncertain.
32 When a guarantee is called the guarantor (the provider of the guarantee) is liable for the agreed amounts.

Financial institutions landscape Part Two 21
Fig
ure
3P
ublic
sec
tor
net d
ebt a
nd p
ublic
sec
tor
net d
ebt e
xclu
ding
pub
lic s
ecto
r ban
ks
£ b
illio
n
The
imp
act
of
finan
cial
inst
itutio
ns o
n p
ublic
sec
tor
net
deb
t is
sub
stan
tial
No
tes
1 P
ublic
sec
tor
finan
ces
and
finan
cial
rep
orts
of b
anks
are
not
com
par
able
, as
a re
sult
of d
iffer
ence
s in
sta
tistic
al a
nd s
tatu
tory
rep
ortin
g ru
les,
and
the
scop
e of
wha
t is
req
uire
d to
be
rep
orte
d.
2 Th
e su
m o
f the
tw
o se
ries
equa
tes
to p
ublic
sec
tor
net d
ebt.
Sou
rce:
Offi
ce fo
r N
atio
nal S
tatis
tics,
Tre
atm
ent
of p
ublic
sec
tor
ban
ks in
pub
lic s
ecto
r fin
ance
s, 2
1 N
ovem
ber
201
4; O
ffice
for
Nat
iona
l Sta
tistic
s, P
ublic
Sec
tor
Fina
nces
, Jun
e 20
15
0
500
1,00
0
1,50
0
2,00
0
2,50
0 Jan-
07Ju
l-07
Jul-0
8Ju
l-09
Jul-1
0Ja
n-08
Jan-
09Ja
n-10
Jan-
11Ju
l-11
Jan-
12Ja
n-13
Jul-1
3Ju
l-12
Jan-
14Ju
l-14
Jan-
15
Pub
lic s
ecto
r ne
t deb
t exc
ludi
ng p
ublic
sec
tor
bank
s (P
SN
D-e
x)
Pub
lic s
ecto
r ba
nks
Onl
y R
BS
rem
ains
cl
assi
fed
as a
pub
lic
sect
or b
ank
Oct
ober
200
7: N
orth
ern
Roc
k is
cla
ssifi
ed a
s a
publ
ic s
ecto
r ba
nk
Sep
tem
ber
2008
: Bra
dfor
d &
Bin
gley
is
cla
ssifi
ed a
s a
publ
ic s
ecto
r ba
nk
Oct
ober
200
8: R
BS
and
H
BO
S a
re c
lass
ified
as
publ
ic s
ecto
r ba
nks
Janu
ary
2009
: Llo
yds
is
form
ed a
nd c
lass
ified
as
a pu
blic
sec
tor
bankJa
nuar
y 20
10: N
orth
ern
Roc
k sp
lit in
to N
orth
ern
Roc
k P
lc (p
ublic
sec
tor
bank
) and
Nor
ther
n R
ock
Ass
et
Man
agem
ent (
clas
sifie
d as
a c
entr
al g
over
nmen
t bod
y)
July
201
0: B
radf
ord
& B
ingl
ey
is re
clas
sifie
d as
a c
entr
al
gove
rnm
ent b
ody
Janu
ary
2012
: Nor
ther
n R
ock
Plc
sol
d to
Virg
in
Mon
ey H
oldi
ngs
(UK
) Ltd
(a p
rivat
e fin
anci
al c
orpo
ratio
n)
Mar
ch 2
014:
Llo
yds
is
recl
assi
fied
to th
e pr
ivat
e se
ctor
follo
win
g its
sha
re s
ales
22 Part Two Financial institutions landscape
Exposure measured by the Whole of Government Accounts
2.16 The Whole of Government Accounts (WGA) and individual departmental accounts are prepared according to International Financial Reporting Standards (IFRS). Unlike the national statistics, the WGA records both liquid and illiquid assets, provisions and contingent liabilities. Some contingent liabilities that are considered remote or unquantifiable are not recorded.
2.17 The WGA for 2013-1433 show that the government held assets of £1,337 billion and liabilities of £3,189 billion at March 2014. The government had £1,096 billion of borrowings. Assets includes £334 billion of financial assets including equity investments in Lloyds and RBS, loans and debt securities. For example, the government provided a £3.2 billion bilateral loan to Ireland in 2010.34
2.18 A number of provisions were recorded in the WGA during the financial crisis. The government guarantees and funding peaked at £1.162 trillion, consisting of £1.029 trillion in guarantee commitments and £0.133 trillion in cash outlays.35 This exposure has fallen significantly in subsequent years.
2.19 The most recent WGA (2013-14) identifies £63 billion in contingent liabilities within the public sector.36 Unlike a provision, a contingent liability is something that may happen in the future and the timing and scale are uncertain. The WGA also identifies £141.8 billion of provisions and £104.9 billion of remote contingent liabilities. Of this, £29.5 billion is callable capital subscription37 to the European Investment Bank (considered a remote quantifiable liability), and partly offset by an asset comprising an equity stake valued at £7.7 billion. However, there is also a £33.0 billion indemnity in support of Network Rail.38
2.20 The accounts also disclose the Equitable Life Compensation scheme, which was created to facilitate payments to eligible policyholders of this former life insurance and pensions organisation for losses arising as a consequence of regulatory failure. In 2013-14, a provision expense of £107 million was recorded, and the balance for the provision stood at £609 million.
2.21 There are other contingent liabilities, perceived to be unquantifiable. This includes Pool Reinsurance Company Limited, which is owned by the insurance industry, and provides reinsurance of claims arising from terrorism.39
33 National Audit Office, A snapshot of UK Finances: Whole of Government Accounts, available at: www.nao.org.uk/highlights/whole-of-government-accounts
34 HM Treasury, Bilateral loan to Ireland, 13 October 2014, available at: https://www.gov.uk/government/collections/bilateral-loan-to-ireland
35 The peak values have been taken from HM Treasury Annual Report and Accounts, Parliamentary supply estimates and NAO reports to Parliament. As each scheme and support facility was available at different times, the total peak support was not all available at a single point in time. See: National Audit Office, Taxpayer support for UK banks: FAQs, January 2015.
36 Contingent liabilities in 2012-13 were £87.9 billion. Most of the decrease is because liability for the European Investment Bank has been reclassified as a remote contingent liability.
37 A subscription consisting of capital which has not yet been paid, but can be paid if demanded to be so. 38 HM Treasury, Whole of Government Accounts, 31 March 2014.39 HM Treasury is exposed to a remote contingent liability for the risk of losses incurred exceeding available reserves.

Financial institutions landscape Part Two 23
Using the balance sheets of individual financial institutions to increase transparency of the overall balance sheet exposure
2.22 Neither the WGA nor national statistics contain a granular breakdown of the net assets or liabilities of each of the individual financial institutions. However, this can be reconstructed by supplementing the WGA with the gross assets, gross liabilities and net assets of each of the financial institutions for which financial information is available, based on the individual financial statements, where available (Figure 4 and Figure 5 on pages 24 and 25). These financial statements do not record the cost of financing these investments over time. For this reason we have produced a time series to calculate the cumulative financing cost of retaining the Lloyds and RBS investments (Appendix Two).
2.23 The equity stakes in Lloyds and RBS are financial assets in the WGA, shown in Figure 4, stated at their market value at 31 March 2015, which is subject to variations in market conditions. On the liability side of this balance sheet is the underlying cost of market interventions, net of amounts recovered in fees and sale proceeds, but excluding the notional interest expense associated with government borrowing (see Appendix Two).
2.24 The mortgage books of Bradford & Bingley and Northern Rock, as well as the student loan book, are assets that represent the estimated value of amounts due to government, adjusted for factors affecting the recoverability of these loans.40 The market value of these assets is not directly observable, but can be affected by economic factors (eg the housing market and graduate employment prospects). The liability reflects the cost of acquiring these mortgage books net of proceeds, and the gross expenditure on issuing student loans. These liabilities have not been adjusted for financing costs.
2.25 Several of the institutions included in Figures 4 and Figure 5, such as RBS, Lloyds and the Financial Services Compensation Scheme (FSCS) represent significant taxpayer exposure because the government may be liable for institutions’ liabilities should risks crystallise, as demonstrated by the government’s interventions in 2008–2010. In this regard, there is a potential downside risk to the government’s balance sheet if there was another financial crisis. There is also upside potential, eg from the changes in market values and higher than expected recovery rates on loans.
2.26 The assets and liabilities of the remaining 13 policy-related financial institutions which are 100% owned and for which financial information was available is shown as a single data point in Figure 4. The assets and liabilities of both 100% owned and non-100% owned policy-related financial institutions are broken down separately in Figure 5.
40 FSCS has a claim on a portion of the Bradford & Bingley mortgage book. The value to HM Treasury is net of what is due to FSCS.

24 Part Two Financial institutions landscape
Figure 4Assets and liabilities of policy-related financial institutions
£ billion
Reconstruction of balance sheet pre-consolidation in national accounts, depicting the largest 100% policy-related institutions, the two rescued banks and the European Investment Bank
Notes
1 Totals may not sum due to rounding.
2 UKAR, Student Loans Company Limited, PPF and FSCS have been included as their assets or liabilities are greater than £5 billion.
3 The PPF is not consolidated in the 2013-14 Whole of Government Accounts but is proposed to be consolidated in 2014-15 WGA.
4 The data presented is as of 31 March 2015. Year ends vary – see Appendix Six for further information.
5 EIB has been reclassified from a quantifiable contingent liability to a remote quantifiable contingent liability in the 2013-14 WGA accounts.
Source: National Audit Office analysis of departmental and institutional published annual reports and accounts
Assets
Market value of equity stake
Liabilities/borrowing
Government borrowing
Department asset
66
186
-59
-217
31 12
17
1835
8
-45
-11-64 -17
-32-30
7 -14 1
-22 0-2
-31
4
-22
-400
-300
-200
-100
0
100
200
300
UK AssetResolution
The RoyalBank ofScotalnd
LloydsBankingGroup
Student LoansCompanyLimited
Financial market interventions Policy-related insititutions International financial
insititution
FinancialServices
CompensationScheme
Remainder Total,includingRBS andLloyds
PensionProtection
Fund
EuropeanInvestment
Bank
100% owned policy-related institutions, Lloyds, and RBS account for £222 billion of assets and £249 billion of liabilities-
97109
151168 186
-104-115
-180 -197 -217
Net assets (non-cumulative)
-20
42

Financial institutions landscape Part Two 25
Figure 5Assets and liabilities of 25 policy-related financial institutions
Further breakdown of the assets and liabilities of remaining policy-related institutions, both 100% owned and non-100% owned
Notes
1 Excludes UKAR, Student Loans Company Limited, PPF and FSCS.
2 The liability figure presented for ECGD is the maximum exposure figure.
3 The information related to the HCA is taken from the group financial statements, which include both the financial institution and various other unrelated functions.
Source: National Audit Office analysis of departmental and institutional published annual reports and accounts
-6 -4 -2 0 2 4 6
Net assets (values shown in chart)Total assetsTotal liabilities
£ billion
Guarantees
UK Financial Investments Limited
UKAR Corporate Services Limited
British Business Bank Plc
Affordable Housing Finance Plc
Help to Buy (HMT) Limited
Green Deal Finance Company Limited
MyCSP Limited
The Start-Up Loans Company
The Carbon Trust
National Employment Savings Trust(NEST) Corporation
Salix Finance Limited
Guaranteed Export Finance Corporation Plc
National Employment Savings Trust(NEST) Scheme
Global Climate Partnership Fund
Big Society Capital Limited
Private Infrastructure Development Group
Infrastructure Finance Unit Limited
UK Green Investment Bank Plc
Export Credits Guarantee Department
Community Health Partnerships Limited
CDC Group Plc
Homes and Communities Agency
The Housing Finance Corporation Limited
NHS Property Services Limited
Pool Reinsurance Company Limited
3.06
4.09
0.07
0.98
0.01
0.34
0.30
0.07
0.46
0.33
0.05
0.04
0.02
-0.05
0.65
-13.39 (not to scale)
5.38
0.02
3.37
0.18
0.00
0.00
0.00
0.00
0.00
0.00

26 Part Two Financial institutions landscape
Future balance sheet projections
2.27 To consider how this balance sheet exposure may change in the coming years we have reviewed the government’s announcement on asset sales; the strategic plans of financial institutions in our population; and reviewed OBR Forecasts to 2019-20 (July 2015). Figure 6 summarises the results of that analysis.
2.28 The analysis shows that over the next five years, the government expects to receive a total of £94.6 billion in proceeds from a combination of repayments and selling assets (including shares and loan books). It expects to pay out £94.8 billion in new student loans and increased funding for policy-related financial institutions. By far the largest cash outflow concerns new loans. These are estimated at £84.4 billion over the five-year period.
Figure 6Government plans
Financial institution Expected cash flows March 2014
outlook(£bn)
Expected cash flows July 2015 outlook
(£bn)
Change over 15 months
Description
Receipts
Lloyds Banking Group 3.2 12.9 9.7 Trading plan and retail offer
Student Loans 9.4 11.5 2.1 Sale of loan portfolio
Student Loans 13.8 11.9 -1.9 Interest and repayments
B&B and NRAM 42.8 -42.8 Interest and repayments
UKAR 33.1 33.1 Interest and repayments and sale of £13 billion mortgage portfolio
RBS 25.2 25.2 Sale of three-quarters of stake
Receipts subtotal 69.2 94.6 25.4
Payments
Student Loans (87.1) (84.4) 2.7 New loans issued
Help to Buy, British Business Bank, Green Investment Bank and other
(21.0) (10.4) 10.6 New loans issued
Payments subtotal (108.1) (94.8) 13.3
Total cash movement expected (38.9) (0.2) 38.7
Notes
1 The March 2014 outlook shows the forecast from 2013-14 to 2018-19. The July 2015 outlook shows the forecast from 2015-16 to 2020-21. The Economic and Fiscal Outlook fi gures are usually released in March and December, however, following the Summer Budget in 2015, a supplementary outlook for July was released.
2 The fi gure presented for UKAR above does not consist of only cash proceeds, but consists of the planned sale of a securitisation vehicle, hence some of the benefi ts are cash proceeds while others are in the form of a transfer of liabilities to the private sector.
Source: Offi ce for Budgetary Responsibility, Economic and Fiscal Outlook, March 2014 and July 2015

Financial institutions landscape Part Two 27
Factors affecting the balance sheet projections
2.29 Over the next five years the net cash position would move -£0.2 billion if the asset sales proceed as forecast. We are not aware of any formal sensitivity analysis for these figures. However, we have identified a number of factors that could affect this outcome, including:
• Sale proceeds – these could be higher or lower than expected and depend on many things, such as the effectiveness of the sale process, market conditions and capacity at the time of the sale, and the business performance.
• Repayment schedule – several of the assets are related to loans. The asset values depend on variables such as student income, house prices and policy decisions, all of which affect the rate at which loans might be repaid.
• Changes in the education sector – the student loan book is the largest component of these assets. Changes in the number of students and the introduction of loans to replace grants will have a disproportionate impact.
• Trends in policy-related institutions and other potential interventions – £10.4 billion of cash payments in the OBR estimate relate to policy interventions, such as the Help to Buy scheme and the Green Investment Bank’s investments. Changes to policy will have an impact on cash flows.
• Unanticipated calls on guarantees, which would result in a cash outflow if there were insufficient reserves within the financial institution to meet these unexpected claims.
2.30 An important consideration in ensuring that loans and investments are recoverable and generate a positive return (including interest and principal) is management of risk. This is an issue we have returned to many times in our reports, for example:
• In our 2013 report on Student loan repayments we reported that unless the Department for Business, Innovation & Skills (BIS) developed a robust strategy for maximising the collection performance of student loans and improves its information on borrowers, it would not be well-placed to secure value for money.
• In our 2014 report on the Help to Buy equity loan scheme,41 we said that DCLG should continue to refine its financial modelling to produce more precise estimates of likely cash flows for the life of the scheme. Potential unplanned gains or losses in any one year could create a sizeable underspend or an unaffordable overspend. DCLG said that it is implementing this recommendation.
• In our 2015 report on the UK Guarantees scheme for infrastructure we found that it was good that HM Treasury had a formal governance process and commercial specialists to help evaluate, manage and set a price for risks to the taxpayer. We also found that there was no upper limit on risk and HM Treasury took a narrow view that guarantees are value for money if the fee it received for providing a guarantee covered the risk associated with it. We questioned whether this approach, on its own, could measure long-term risks to taxpayers reliably.
41 Comptroller and Auditor General, Department for Communities and Local Government, The Help to Buy equity loan scheme, Session 2013-14, HC 1099, National Audit Office, March 2014.

28 Part Two Financial institutions landscape
2.31 Some financial institutions generate income from industry levies. Others rely on their sponsor department for funding. Some of the financial institutions we have identified have limited reserves that could act as a buffer for the taxpayer if risks emerge. For example:
• the FSCS has matching assets and liabilities and operates without reserves;42
• the PPF has approximately £4 billion of reserves and an explicit objective to be self-financing by 2030; and
• Pool Reinsurance Company Limited has £5 billion in reserves and pays a fee to HM Treasury which was reviewed by the Government Actuary’s Department.
2.32 On occasion, departments may need to provide extra capital to their companies. For example, in our 2014 Investigation into NHS Property Services Limited we found it could not meet its commitments from its own resources and needed extra departmental funding.
Commercial returns of policy-related institutions
2.33 Based on a limited review of the financial statements for the institutions that have been established as companies, it appears that 11 operate on a not-for-profit basis. Only two of the 54 institutions, Royal Mint and Lloyds Banking Group paid a dividend to the government in the last year, of £4 million and £120 million respectively. How the organisations are funded and the markets they operate within are important for their classification, but also to ensure that the intervention leads to additionality,43 does not contravene state aid rules (as observed in Appendix Four) and does not crowd out other investment.
2.34 The ONS classified seven of the policy-related institutions as public corporations – all but three of these were created before 2004. The only new institutions to be classified as public financial corporations since 2004 are the National Employment Savings Trust (NEST) pension fund and its corresponding trustee corporation. HM Treasury’s Consolidated Budget Guidance provides a number of tests for public corporations and a potential source of reference for future evaluation. These tests include setting challenging targets for the return on capital employed and ensuring any subsidy is in line with state aid rules (Figure 7).
42 FSCS also has a £750 million facility with a consortium of banks to help manage liquidity in the face of major failures. Both the levy capability and the facility act as buffers for the taxpayer, if risks were to crystallise. Looking forward, FSCS will also start to accrue the entitlement to funds raised under the bank levy – which would also act as a buffer.
43 HM Treasury’s Green Book on appraisal and evaluation in central government describes additionality as the net impact of a government intervention after making allowances for what would have happened in the absence of the intervention.

Financial institutions landscape Part Two 29
Figure 7Central government guidance for public corporations (PCs)
Theme Guidance Reference
Return on capital employed
Departments are expected to set PCs clear objectives and challenging targets covering return on Capital Employed.1 dividend levels, efficiency, and quality of goods and services.
Departments must agree with Treasury an appropriate rate of return for each of their PCs. This anticipated level of return should be considered alongside other sources of income at spending reviews.
A PC should be set a target return to earn at least its WACC multiplied by the overall Capital Employed. In the case of PCs performing essentially government-type functions, 3.5 per cent real will normally be appropriate. A PC competing in the market should typically be expected to return a higher rate to reflect the prevailing market rate. Where a PC has a monopoly, departments should ensure that the rate of return set is not exploitative.
CBG 11.12, 11.17, 11.24-11.26
Dividend policy A dividend policy should be agreed between the PC and its department as shareholder. If the PC’s level of earnings do not allow it to pay the right level of interest and dividends, the department should pay a subsidy to the PC so that it can make those payments. The reason for this requirement is to make it transparent to Parliament and public that a PC is underperforming and needs a subsidy to be paid.
CBG 11.37, 11.38
Social policy Where a department wishes a PC to perform a social policy function then it should pay for that explicitly out of its budget rather than seeking to recover the costs by accepting PC underperformance or by over-charging PC customers.
Departments should ensure that payment of subsidies is compatible with EU state aid legislation.
CBG 11.41
CBG 11.44
Note
1 Capital employed comprises total equity, reserves, debt including all interest bearing liabilities and unfunded or underfunded pension liabilities. This may not always match the fi gures reported on a department’s balance sheet.
Source: HM Treasury, Consolidated budgeting guidance 2015 to 2016, March 2015

30 Part Two Financial institutions landscape
2.35 Given that a number of these institutions have been created only recently, it may be too early to conduct a substantive assessment of financial performance of all of them. We have therefore performed a limited review of the historical results. Figure 8 shows the income and expenditure of this portfolio in 2014-15. The FSCS generated income of £0.47 billion and a surplus of £43,000. The PPF has generated income of £5.20 billion, and a surplus of £1.18 billion. HCA has income of £0.25 billion and operational expenditure of £1.32 billion; the difference is mainly grant expenditure of £0.98 billion, which is fully funded by DCLG and is not directly related to any financial institution activity. The remaining wholly-owned institutions for which financial information was available44 are responsible for £13.4 billion assets (excluding the student loan book, which is on the BIS department accounts and excluding UKAR). These institutions reported income of £2.0 billion and expenditure of £1.7 billion, resulting in net profit of £0.3 billion.
44 There are 15 remaining institutions for which income and expenditure figures are available, and 14 remaining institutions for which asset and liabilities figures are available.
Figure 8Income and expenditure of policy-related institutions
£ billion Revenueor income
Operating expenditure before tax
Profit/(loss) before tax
Total assetson balance
sheet
Total liabilities on balance
sheet
Net assets/ (liabilities)
Wholly-owned
FSCS 0.80 0.80 0.00 17.19 17.19 0.00
PPF 5.20 4.02 1.18 35.25 31.62 3.64
HCA 0.25 1.32 (1.04) 4.55 0.46 4.09
Other 100% owned institutions (excluding UKAR)
1.97 1.65 0.32 13.37 5.41 7.96
Total for 100% owned (including UKAR)
10.46 9.07 1.43 136.50 113.76 22.74
Not wholly-owned
Pool Reinsurance 0.49 0.16 0.33 5.72 0.33 5.38
The Housing Finance Corporation Limited
0.19 0.19 0.00 3.44 3.42 0.02
Other non-100% owned institutions
0.47 0.18 0.29 1.80 0.57 1.23
Total for non-100% owned institutions
1.14 0.52 0.62 10.95 4.32 6.63
Notes
1 Totals may not sum due to rounding. See Appendix Six for more detailed fi nancial information.
2 The fi gures in this table include the administrative activities of the Student Loans Company Limited and exclude the loan book as this is reported on the BIS departmental accounts.
3 Assets and liabilities identifi ed above are balance sheet fi gures only.
4 The information related to the HCA is taken from the group fi nancial statements, which include both the fi nancial institution and various other unrelated functions. See paragraph 2.35 for further information. The HCA has provided an estimate of its fi nancial institution-related activity, see Appendix Six.
Source: National Audit Offi ce analysis of departmental and institutional published annual reports and accounts
Financial institutions landscape Part Two 31
Financial sector regulation and compensation
2.36 The four banks acquired during the financial crisis are regulated and authorised by the financial regulators. The government’s financial institutions are not formally subject to the regulatory regime and compliance obligations that apply to private sector institutions engaged in activities of a similar nature, but a number of them are also registered with both the Financial Conduct Authority (FCA) and the Prudential Regulation Authority (PRA) as a result of the activities that they undertake.
2.37 The financial services sector regulators exist to protect customers and investors and to maintain financial stability. PRA within the Bank of England (the Bank) is responsible for the prudential regulation and supervision of banks, building societies, credit unions, insurers and major investment firms.45
2.38 The FCA regulates financial services to protect consumers, enhance the integrity of the financial system and promote competition. The Financial Services and Markets Act 2000 (FSMA) describes a range of financial services activities, such as lending and investment management. The purpose of the Act is to specify the financial and investment activities that require private sector participants (eg individuals or companies) to register with the FCA before carrying on these activities. The FSMA also established the FSCS to provide a unified compensation scheme for all regulated financial services, including protecting depositors. The Pension Act 2004 created the PPF to compensate members of eligible defined benefit pension schemes. Government guarantee schemes generally derive statutory authorisation from legislation, eg the Infrastructure (Financial Assistance) Act 2012.
2.39 The Bank and the PRA conduct stress testing to assess the UK banking system’s capital adequacy. This assessment is then used to inform the system-wide policy interventions of the Financial Policy Committee at the Bank, and also the firm-specific supervisory actions of the PRA.46 The assumptions used in the stress testing include changes to growth rates, house price changes and employment rates. The result demonstrates the resilience of UK banks and building societies to deterioration in global economic conditions. The majority of financial institutions owned by the government that are covered in this NAO report are not formally within the scope of these stress tests.47 However, they operate in various sectors of the economy, and it may be feasible to apply equivalent techniques to examine their financial resilience to various risks. For example, the Bank has looked at the impact of a fall in house prices in the UK of around 20%. This scenario is relevant to Help to Buy.
45 The Bank of England defines prudential regulation as follows: “Prudential regulation relates primarily to the capital adequacy of a firm and its systems and controls”.
46 See Bank of England, Stress Testing the UK banking system: key elements of the 2015 stress test, March 2015, available at: www.bankofengland.co.uk/financialstability/Documents/stresstesting/2015/keyelements.pdf
47 Lloyds and RBS are within the scope of stress tests.

32 Part Two Financial institutions landscape
2.40 Some government institutions have statutory exemption or crown immunity from FSMA. Crown immunity may apply to government departments and their ministers48 but we are not aware of any guidance that extends the principle to other public bodies. The FSMA exemption order 49 applies to a number of institutions such as the Bank of England, Debt Management Office and the Student Loans Company Limited. Exemption from FSMA means that the government’s financial institutions are not required to comply with regulations regime and compliance obligations that apply to private sector institutions engaged in the same activity.50 UKFI and UKAR are not FCA authorised as they do not carry out regulated activities as defined by the Regulated Activities Order 2001 rather than due to being exempt.
48 Select Committee on Public Accounts, Minutes of Evidence, Appendix Three – Supplementary memorandum submitted by HM Treasury, December 2002.
49 Financial Services and Markets Act 2000 (Exemption) Order 2001.50 A recent study estimated the costs of compliance at between 5%–9% of revenue. Available at: www.apfa.net/
documents/publications/apfa-cost-of-regulation-june-2014.pdf

Financial institutions landscape Part Three 33
Part Three
Financial institutions landscape
Financial sector interventions
Sales of shares in Lloyds Banking Group (Lloyds)
3.1 At August 2015, UK Financial Investments (UKFI) has sold over £14.5 billion shares in Lloyds.51 Lloyds has also paid £120 million in dividends. UKFI began a trading plan to drip-feed shares into the market in December 2014. So far, this has resulted in the government’s share in Lloyds reducing from around 25% in March 2014 to less than 13% at August 2015. In the 2015 Budget, the Chancellor of the Exchequer announced plans to sell a further £9 billion of the government’s remaining shares during 2015-16. In June 2015, the government announced that the current trading plan will be extended to December 2015, and will feature a share sale open to retail investors.52
3.2 We reported on the value for money of the first Lloyds share sale.53 We assessed whether:
• the most appropriate sale method was chosen;
• the sale was timed and structured appropriately; the price obtained was reasonable; and
• there was a gain or shortfall for the taxpayer.
3.3 We concluded that UKFI conducted a thorough review of its options, choosing a sale process that maintained flexibility on timing and allowed the transaction to be completed quickly once the government had made the decision to sell. The sale took place when the shares were trading close to a 12-month high and at the upper end of estimates for the fair value of Lloyds’ business. Furthermore, the shares were sold at a relatively low discount to the market price compared with discounts seen in similar sales, and the after-market in the shares has remained steady. Taking into account the cost of borrowing the money to buy the shares, there was a shortfall to the taxpayer of at least £230 million, which should be seen as part of the cost of securing the benefits of financial stability during the financial crisis, rather than any reflection on the sale process, which UKFI managed effectively.
51 HM Treasury, Lloyds share sales have now raised £4.5 billion for the taxpayer, 24 August 2015.52 HM Treasury, Chancellor extends successful Lloyds trading plan, 1 June 2015.53 Comptroller and Auditor General, HM Treasury and United Kingdom Financial Investments Limited, The first sale of
shares in Lloyds Banking Group, 18 December 2013.

34 Part Three Financial institutions landscape
Update on Royal Bank of Scotland (RBS)
3.4 In early August 2015, the government sold around £2.1 billion of RBS shares. It continues to earn fees and dividends54 on its remaining 4 billion RBS shares. The Dividend Access Share (DAS) was a key element of the government’s support to RBS. Created in 2009 when RBS entered into both the Asset Protection Scheme (APS) and the Contingent Capital Facility, it offered HM Treasury preferential dividend rights.55 RBS left the APS in 2012, paying an exit fee of £2.5 billion. Additionally, an agreement has been reached on the retirement of DAS itself. In 2014, RBS paid an initial dividend of £0.3 billion, and must pay a further £1.2 billion to retire the DAS completely. In June 2015, NM Rothschild & Sons Limited produced a report for HM Treasury outlining a valuation of, and options for, the disposal of the government stake in RBS, anticipating proceeds of £2 billion by next year (which has now been achieved) and a total of £25 billion over this parliament (see Appendix Two).
UK Asset Resolution (UKAR) and the mortgage book sales
3.5 UKAR has now returned almost a third of the taxpayers’ original £48.7 billion support package.56 Northern Rock’s deposit taking business was sold to Virgin Money in 2011. In October 2014 UKAR sold a portfolio of performing residential mortgage loans for £2.7 billion. This was a premium of around £55 million over the book value at the end of May 2014. UKAR is exploring the potential for a further major disposal, in particular around Granite, which is a securitisation programme holding around £13 billion of mortgages. UKAR currently has around £15 billion in statutory debt that it owes to FSCS – for which it pays no interest. However, UKAR pays interest on the legacy loans received from HM Treasury. UKAR has a pool of liquidity which it lends, and on which it has a positive spread between the cost of borrowing and lending into mortgages.
3.6 Our approach when considering whether a sale of mortgages by an audited organisation, such as HM Treasury and UKFI, has demonstrated value for money is similar to that used for a sale of shares. We would examine the choice of method, structure and timing of any sale. Unlike a share sale, however, there is often limited data available on the prices other vendors have obtained for sales of mortgage assets against which we can compare performance. Where information is available, we would make such a comparison but also look closely at the valuation UKAR placed on the mortgage assets before the sale. We would review the assumptions used to arrive at the valuation, including estimates of:
• the timing of future cash flows;
• the extent of any losses under different economic scenarios; and
• the discount rate used to express future cash flows as a present value.
54 To date, dividends received from RBS are dividends from the Dividend Access Share.55 RNS London Stock Exchange, RNS Number 4848E, Royal Bank of Scotland Group Plc, 9 April 2014.56 HM Treasury has received a payment of £17.6 billion, of which £14.1 billion consists of government loan repayments.
UKAR Annual Report & Accounts, 31 March 2015, p. 10.

Financial institutions landscape Part Three 35
Policy-related institutions
3.7 We have identified 36 policy-related institutions. Appendix Five contains details of their financial performance and other operational details. Of these:
• five financial institutions each represent exposures exceeding £10 billion;
• six each represent exposures exceeding £2 billion; and
• three have, or will soon have exposures exceeding £1 billion.
3.8 We have published 30 reports that examine individual policies and the institutions responsible for implementing policies (Appendix Three).
3.9 Figure 9 on pages 36 and 37 provides an overview of the portfolio.
Five institutions each represent an exposure above £10 billion
3.10 The five institutions with gross assets or liabilities exceeding £10 billion are: Student Loans Company Limited (SLC) (although the loan book itself is reported on the Department for Business, Innovation & Skills (BIS) department balance sheet); the Export Credit Guarantees Department (ECGD); the Financial Services Compensation Scheme (FSCS); the Pension Protection Fund (PPF); and UKAR (discussed in paragraph 3.5).
The Student Loans Company Limited
3.11 The SLC is responsible for administering the student loan scheme. The student loan book itself (£42 billion in 2014-15) is reported on the balance sheet of BIS, its sponsor department. It represents the amount recoverable from graduates in employment. This balance is stated net of an impairment charge as the department anticipates a significant proportion of the face value of loans will not be repaid (currently 44%).57
3.12 At the end of 2014-15, SLC had outstanding loans of £64.1 billion. These included £10.4 billion lent in that year, an increase of 19% on the previous year. This proportion of the outstanding loans is attributed to the government administration in England. This represents 4.6 million borrowers. Of these, 2.7 million had accounts liable for repayment. The average debt for repayments ranges from £6,480 to £20,600.58 In November 2013, the government announced its intention to sell part of the loan book, and the OBR has estimated proceeds of £11.5 billion. In June 2015, the government announced its intention to replace maintenance grants with loans.
57 According to Consolidated Budgeting Guidance 2015-16, paragraphs 8.12 to 8.13, the impairment of the student loan book has two components: – a subsidy; and policy write-offs. Student loans are offered at a loan rate lower than government’s cost of capital. This means that over the lifetime of the loans there is an effective subsidy. The impairment is valued as the difference between the expected income from the loans and the costs of delivering them at government’s cost of capital (agreed as 2.2% for loans). The second impairment is to account for ‘policy’ write-offs. When loans are issued, it is the policy of the department that these will be written off in certain circumstances, eg death or disability of the debt owner or age of the debt, when it might be clear that the graduate will not meet the earnings threshold to repay the loan. These amounts are recognised at the point the loan is made. Where these debts are deemed to be policy write-offs, they will be recorded as capital transfers in the national accounts at the time the loan is formally written off; there is, however, no transaction in departmental accounts or budgets.
58 Student Loans Company, Student Loans in England, Financial Year 2014-15, 18 June 2015.

36 Part Three Financial institutions landscape
Figure 9Survey of the 36 policy-related institutions
Investment and asset management 17
Lending 17
Guarantees 11
Institution only 23Mixed 7
Retail only 6
Direct 14
Indirect 11
Mixed 11
Other 7
Statutory compensation and reinsurance 3
Note
1 Some financial institutions conduct more than one financial activity.
Source: National Audit Office analysis of departmental and institutional published annual reports and accounts
Institutions by activity1
Institution by customer base
Number of activities undertaken by insititution
Insitutions by distribution strategy
0
5
10
15
20
25
30
One Two Three Four
25
46
1
Property 8
Energy 7Business and Private investment 6
Pensions and insurance 6
International 4
Government Companies 16
Independent DeliveryPartners 13
Public Sector Entities 7
Other 4
Students 1
Wholly owned 23
0.01% to 99.9% owned 6
0% owned 7
Institutions by sector
Institution by ownership
Institutions by government ownership

Financial institutions landscape Part Three 37
Figure 9Survey of the 36 policy-related institutions
Investment and asset management 17
Lending 17
Guarantees 11
Institution only 23Mixed 7
Retail only 6
Direct 14
Indirect 11
Mixed 11
Other 7
Statutory compensation and reinsurance 3
Note
1 Some financial institutions conduct more than one financial activity.
Source: National Audit Office analysis of departmental and institutional published annual reports and accounts
Institutions by activity1
Institution by customer base
Number of activities undertaken by insititution
Insitutions by distribution strategy
0
5
10
15
20
25
30
One Two Three Four
25
46
1
Property 8
Energy 7Business and Private investment 6
Pensions and insurance 6
International 4
Government Companies 16
Independent DeliveryPartners 13
Public Sector Entities 7
Other 4
Students 1
Wholly owned 23
0.01% to 99.9% owned 6
0% owned 7
Institutions by sector
Institution by ownership
Institutions by government ownership

38 Part Three Financial institutions landscape
3.13 Figure 10 shows the unimpaired outstanding student loans and growth forecasts: the government has projected that the outstanding value of publicly owned student debt in England (in real terms at 2014-15 prices) will exceed £300 billion by 2040. In cash terms, this is around £1.1 trillion by 2050.59 The OBR has forecast that:
• student loans will increase the ratio of net debt to GDP; and
• the shortfall between the issuance of loans and cash repayments is anticipated to widen, from £11.2 billion in 2014-15 to £16.8 billion in 2019-20, an increase of 50%.60
These figures are anticipated to increase further as maintenance grants are phased out and replaced by loans.
Other institutions exceeding £10 billion
3.14 ECGD, trading as UK Export Finance, provides loans and guarantees to support exporters. It has net liabilities of £15 billion,61 and operates with an overall cap of £50 billion. It is subject to fluctuations in the currency market, making a foreign exchange gain of £34 million in 2014-15, and a loss of £32 million in 2013-14. This also affects its credit risk exposure, which increased in 2014-15 from £19.6 billion to £20.9 billion, primarily as sterling strengthened 11% against the US dollar.62
3.15 Two statutory compensation schemes have gross assets or liabilities exceeding £10 billion:
• FSCS is responsible for compensating depositors if their bank is unable to return deposits. It protects insurance policies, insurance broking, investment business and home finance. It is funded by levies on the financial institutions it insures. During the financial crisis the FSCS paid out total compensation of £23 billion. The largest component of this was £15.7 billion paid to depositors of Bradford & Bingley.63 During the financial crisis the government loaned £20.4 billion to the FSCS, of which £15.8 billion remained outstanding as of 31 March 2015, and is interest-bearing debt.64 FSCS has gross assets and gross liabilities of £17 billion each, and its net asset position is £nil. Its principal asset – recoveries receivable of £15.8 billion – relates to the 2008 banking defaults.65 The management of Bradford & Bingley expect full repayment of the FSCS support, but timing is uncertain.
59 These figures assume that fees increase in line with inflation and do not take account of sell-offs. See House of Commons Library, Student Loans Statistics, Standard Note SN/SG/1079, February 2015, available at: http://researchbriefings.files.parliament.uk/documents/SN01079/SN01079.pdf
60 Office for Budget Responsibility, Economic and fiscal outlook, July 2015.61 Of which £13.4 billion is off-balance sheet. The net liabilities figure of £15 billion is net of reinsurance.62 UK Export Finance, Annual Report and Accounts 2014-15, 17 June 2014, p. 39.63 Financial Services Compensation Scheme, Annual Report and Accounts 2014-15, July 2015, p. 64.64 Financial Services Compensation Scheme, Annual Report and Accounts 2014-15, p. 146.65 Financial Services Compensation Scheme, Annual Report and Accounts 2014-15, p. 136.

Financial institutions landscape Part Three 39
Fig
ure
10
Stu
dent
Loa
ns C
ompa
ny L
imite
d
£ b
illio
n
Cur
r ent
out
stan
din
g s
tud
ent
loan
s an
d t
he f
ore
cast
val
ue o
f th
e lo
an b
oo
k, in
bo
th r
eal a
nd n
om
inal
ter
ms
1,20
0
1,00
0
800
600
400
200 0
30
No
te
1 Fo
reca
st fi
gure
s d
epic
ted
are
estim
ates
as
of J
une
2014
. Deb
t out
stan
ding
figu
res
dep
icte
d ar
e as
of M
arch
201
5.
Sou
rce:
Nat
iona
l Aud
it O
ffice
ana
lysi
s of
dep
artm
enta
l acc
ount
s, a
nd H
ouse
of C
omm
ons
Deb
ate,
Vol
ume
582,
No.
9, 1
8 Ju
ne 2
014,
655
W-6
59W
Deb
t out
stan
ding
Fore
cast
val
ue o
f loa
n bo
ok (n
omin
al te
rms)
2009-10
2010-11
2011-12
2012-13
2013-14
2014-15
2015-16
2016-17
2017-18
2018-19
2019-20
2020-21
2021-22
2022-23
2023-24
2024-25
2025-26
2026-27
2027-28
2028-29
2029-30
2030-31
2031-32
2032-33
2033-34
2034-35
2035-36
2036-37
2037-38
2038-39
2039-40
2040-41
2041-42
2042-43
2043-44
2044-45
2045-46
2036-47
2047-48
2048-49
2049-50
Fore
cast
val
ue o
f loa
n bo
ok (r
eal t
erm
s)
3440
4654
65
1,10
0
300

40 Part Three Financial institutions landscape
• PPF compensates members of defined benefit pension schemes where there is an insolvency event relating to a statutory employer. It operates an investment portfolio with a net value of £22.6 billion.66 It reported net assets of £4 billion in 2014-15. Its board holds a wide range of investment assets and liabilities including UK government bonds, bonds issued by other governments and corporate entities, public equity and alternative investments. According to its strategic plan, the PPF will grow to £25.1 billion assets under management by 2017-18 and has set itself a target to be self-financing by 2030.67
Six institutions each represent an exposure exceeding £2 billion
3.16 The six policy-related institutions with gross assets or liabilities exceeding £2 billion are The Housing Finance Corporation (THFC), NHS Property Services, the Homes and Communities Agency (HCA), Community Health Partnerships, CDC Group and Pool Reinsurance Company Limited.
3.17 Two institutions are associated with support for property developers, landlords and house buyers in the form of loans, financing guarantees and investment:
• THFC is an independent, specialist, profit-for-purpose industrial and provident society. It has seven members, with the HCA holding £1 of its £7 share capital and having a representative on the board. THFC funds itself through the issue of bonds to private investors and by borrowing from banks. Borrowings total £3.4 billion in the form of bank debt, bonds and debentures, and it has lent £3.4 billion to 152 registered social housing providers. Its Standard and Poor’s (S&P) credit rating is A+ issued, stating that there is a ‘moderate’ likelihood of government support being provided, due to its subsidiary, Affordable Housing Finance Plc (AHF). This subsidiary is the delivery partner for the Affordable Housing Guarantees Scheme. AHF makes loans to registered providers of social housing borrowers and funds itself through the issue of bonds and borrowings from the European Investment Bank.68 THFC and AHF operate with minimal equity capital because their debts are secured against property assets.69 The government is proposing to extend right to buy to social housing tenants.
• The HCA is a DCLG-sponsored non-departmental public body. It seeks to create successful communities by making more homes and business premises available to those who need them. HCA makes recoverable investments in the form of loans or equity stakes. HCA has created a new business unit that aims to provide additional technical expertise and discipline of the type that would be expected in an organisation undertaking significant recoverable investment. DCLG and HCA agreed that the HCA will take over the administration of the Housing Guarantees Schemes which are intended to guarantee up to £10 billion of debt so that housing providers delivering new private rented and affordable homes can borrow more cheaply. These guarantees are and will continue to be issued by the Secretary of State at DCLG.
66 Figure provided is the combined value of the Fraud Compensation Fund and Pension Protection Fund. Pension Protection Fund, Annual Report and Accounts 2014-15, p. 68.
67 Pension Protection Fund, Strategic Plan 2015, May 2015, p. 19.68 See the UK Guarantees scheme for infrastructure report for details of bond issuance.69 According to THFC, its asset cover was 200% in 2013-14.
Financial institutions landscape Part Three 41
3.18 The HCA’s 2014-15 group statement of financial position contained £3.51 billion of non-current assets. Of these, £2.82 billion were classified as ‘available for sale financial assets’, which included £2.53 billion of home equity investments70 such as Help to Buy. The group statement of financial position also contained £0.48 billion of non-current loans. The fair value of non-current assets should continue to increase as government continues to invest in Help to Buy.
3.19 The government launched the Help to Buy Equity Loan Scheme71 in April 2013. This scheme is delivered by the HCA, who contract with developers and homeowners and carry the financial asset on its statement of financial position, while day-to-day administration of the customer interface is through a network of Help to Buy agents. DCLG has committed up to £3.7 billion to this scheme to 2016 and the Chancellor announced in the 2014 Budget that the scheme would continue until 2020.
3.20 The Help to Buy Mortgage Guarantee Scheme was launched in January 2014 and runs until December 2016. It is funded by HM Treasury, administered by UKAR Corporate Services Limited (part of UKAR) and distributed by a panel of 14 lenders. Its financial results are reported as Help to Buy (HMT) Limited. The government stated that it will make up to £12 billion of mortgage guarantees available over the life of this scheme. It estimated this would be enough to support up to £130 billion of high loan-to-value mortgages.
3.21 The fair value of the equity loan scheme has more than doubled to just over £2 billion at 31 March 2015, compared with just under £0.8 billion a year earlier. The value of the Help to Buy guarantee has increased to £987 million in March 2015 compared with just £17 million in December 2013.72 The government’s exposure to the residential mortgage market has increased through the equity loan and guarantee schemes. HMT and DCLG statistical releases indicate these schemes have supported 93,895 homebuyers to March 2015.
3.22 In March 2015, the government announced an expansion of the Help to Buy scheme from Autumn 2015 to include an individual savings account (ISA) component. Savers using this product will receive a 25% bonus of up to £3,000 against £12,000 of savings.
70 Home equity investments are as follows: £2.02 billion Help to Buy, £0.17 billion FirstBuy, £0.22 billion HomeBuy Direct and £0.12 billion First Time Buyers’ Initiative. Homes and Communities Agency, Annual Report and Financial Statements 2014-15, June 2015, p. 99.
71 Help to Buy Equity Loan: equity loan of up to 20% of the purchase price of a new-build house. This supplements the buyer’s own deposit, which mortgage lenders normally require to be at least 5%. Borrowers then raise a repayment mortgage of, typically, 75% of the property’s value. The scheme was launched in April 2013. The 20% equity loan is interest free for five years. From the start of the sixth year, borrowers pay a fee of 1.75% on the outstanding loan, increasing 1% above the retail prices index each year. This fee does not repay the loan capital. See: Comptroller and Auditor General, Department for Communities and Local Government, The Help to Buy equity loan scheme, Session 2013-14, HC 1099, National Audit Office, March 2014.
72 HM Treasury, Help to Buy mortgage guarantee scheme: quarterly statistics: October 2013 to March 2015.

42 Part Three Financial institutions landscape
3.23 There are two institutions responsible for investment and asset management in the NHS:
• NHS Property Services (the Service) is responsible for managing over £3 billion of NHS property. It generates income from rents and capital receipts from the sale of surplus land. It is financed via a loan from the Department of Health. In March 2014 we reported that the Department provided the Service with a start-up loan of £190 million to cover initial operational expenses, as is common when a company is set up; however, the Service had to borrow extra money from the Department to cover its short-term cash requirements.
• Community Health Partnerships (CHP) is the ‘head tenant’ for the NHS LIFT property portfolio (Local Improvement Finance Trusts – a form of public private partnership) largely consisting of primary and community care health centres, clinics and hospitals. It holds minority equity stakes in 49 ‘LIFT Companies’ and invests in equity and subordinated debt. In the year ended 31 March 2014 CHP’s property assets increased from £nil to £1,718.5 million as a result of the transfer of LIFT assets from the former primary care trusts. It reported gross assets of £2 billion and a matching liability. CHP’s income increased from £0.6 million to £313.9 million, most of which is income from property leases.
3.24 CDC Group describes itself as the UK’s Development Finance Institution, holding a portfolio of investments associated with overseas development activities with a fair value73 of £2,844 million at 31 December 2014. Changes in the value of these investments, which are generally illiquid and hard to value, represent a major contributor to its financial results. For example in the year ended 31 December 2014, CDC Group reported investment income of £14.7 million and £418.2 million income from unrealised gains.74
3.25 CDC Group is one example of a financial institution using indirect distribution through third party fund managers. Others that fall into this category include – the Green Investment Bank (GIB), British Business Bank (BBB), the HCA,75 Private Infrastructure Development Group,76 and Big Society Capital.77 GIB has taken this one stage further with an equity fund targeting £1 billion of total investment, into which it has contributed wind farm assets. Investment of government funds alongside private sector contributions can expand the amount of finance available for a particular initiative.
73 IFRS 13 defines fair value as: “the price that would be received to sell an asset or paid to transfer a liability in an orderly transaction between market participants at the measurement date”.
74 Unrealised gains are defined as gains which are recognised and acknowledged, such as an increase in the value of property, but not yet realised, as the property has not yet been sold but rather sits as an asset on the balance sheet.
75 The HCA’s use of indirect distribution via third party fund managers is limited to a commitment to invest £50 million into a new joint venture with Lloyds Bank plc, Housing Growth Partnership Limited. The HCA holds a 50% share in this entity, which was incorporated in March 2015, but had not made any investment by 31 March 2015.
76 PIDG is an international multilateral organisation. The UK is one member among eight. DFID’s share of all donors’ funding to PIDG is around 70%.
77 In the case of Big Society Capital, the third party intermediaries are direct recipients of BSC investment who then go on to lend to third sector business.

Financial institutions landscape Part Three 43
Three institutions exceed exposure of at least £1 billion each (or could do so)
3.26 The financial institutions landscape is evolving rapidly. This growth means that some of the financial institutions have, or will soon exceed, £1 billion in gross assets.
3.27 The UK Guarantees scheme for infrastructure has £1.7 billion of total exposure through the guarantees it has previously issued. It operates with an overall limit of £40 billion.78
3.28 The BBB’s mission is to change the structure of small business finance markets. It became operational in November 2014, after working out of BIS as a shadow organisation since 2013. It runs a range of lending, guarantees and investment activities to support smaller businesses, through private sector delivery partners. The BBB has inherited a number of programmes that Capital for Enterprise Limited, BIS and HMT previously managed, including the Start-Up Loans programme and the Enterprise Finance Guarantee. It has also introduced new programmes since its formation. As at 31 March 2015 the total assets of BBB were £736 million and total liabilities £88 million. It is aiming to facilitate £10 billion of finance to smaller businesses by 2019.
3.29 GIB’s purpose is to accelerate the UK’s transition to a greener, stronger economy. It is 100% government-owned with BIS as its sponsor. In 2014-15, GIB had net assets of £981 million. According to BIS, its sponsor department, GIB committed £723 million to green infrastructure in 2014-15 to 18 green infrastructure projects and four new lending programmes.79 In June 2013, the government announced it was allocating a further £800 million of funding to GIB for the 2015-16 year. This brought the total available for investments to £3.8 billion.80 The government previously committed to provide up to £3.8 billion of capital to invest in ‘green projects’ on commercial terms. In 2015, GIB established a £1 billion equity investment fund and contributed assets alongside third party investors. It has invested £1.8 billion in 46 projects covering sectors such as energy efficiency and offshore wind.81 Some of these investments are operated through a fund manager. In June 2015, the government announced plans to privatise GIB.
78 Comptroller and Auditor General, UK Guarantees scheme for infrastructure, Session 2014-15, HC 909, NationalAudit Office, January 2015.
79 Department for Business, Innovation & Skills, Annual Report and accounts 2014-15, p. 36.80 Department for Business, Innovation & Skills, Annual Report and accounts 2014-15, p. 33.81 Green Investment Bank, 2014-15 round up, available at: www.greeninvestmentbank.com/news-and-insight/2015/uk-
green-investment-bank-announces-first-close-on-world-s-first-offshore-wind-fund/

44 Part Three Financial institutions landscape
3.30 There are six other financial institutions involved in the energy sector,82 including the Low Carbon Contracts Company Limited, which the Department of Energy & Climate Change wholly own. It is the central counterparty body for Contracts for Difference (CFD) introduced by the government as part of the Energy Market Reform (EMR) programme. EMR is designed to attract £110 billion of investment to renew energy infrastructure. CFDs offer energy producers a guaranteed price for the electricity they produce based on a pre-agreed ‘strike price’. The Department of Energy & Climate Changes’ Main Estimate, published 29 April 2014, contained a provision of £28.8 billion for the fair value of liabilities incurred for CFDs expected to be signed.
3.31 The National Employment Savings Trust (NEST) was created as part of the government’s pension reforms. It is a low-cost, defined contribution workplace pension scheme. It was created so that employees could be auto-enrolled into a qualifying pension scheme. At 31 March 2015, there were over 2 million members and NEST was working with over 14,000 employers, with assets under management of £420 million. In comparison, there were 80,406 members at 31 March 2014.
3.32 NEST is growing rapidly while operating on a not-for-profit basis and a low charging model. In the 12 months ending 31 March 2015, NEST Corporation, the trustee of the NEST pension scheme, received the majority of its £18.5 million income in grants and incurred expenditure of £98.7 million. NEST Corporation signed a loan agreement with the Department for Work & Pensions (DWP) in November 2010 to fund operations. At 31 March 2015 it had a £387 million loan from DWP, which can scale up to £660 million by 2020. The loan is offered on commercial terms and the weighted average interest rate incurred on loan funding was 3%.83 The loan principal falls due for settlement on a series of repayment dates beginning on 21 October 2020.
3.33 Given that the NEST Corporation is seeking to run on a not-for-profit basis, and repay the DWP loans in full it will need to grow its assets under management significantly from the £420 million in 2015. For the NEST Corporation to be self-supporting we estimate it will need to reach assets under management of at least £20 billion.84
3.34 Along similar lines to Pool Reinsurance Company Limited, government plans to create an industry owned organisation called Flood Reinsurance Company Limited. It will be a not-for-profit flood reinsurance fund, which aims to ensure domestic properties in the UK at the highest risk of flooding can access affordable insurance cover.
82 Other financial institutions focused on the energy sector: Salix Finance Limited, Green Deal Finance Company Limited (the Green Deal is due to be terminated), Global Climate Partnership Fund, Low Carbon Contracts Company Limited, Electricity Settlements Company Limited, and The Carbon Trust.
83 National Employment Savings Trust Corporation, Annual report and accounts 2014-15, 14 July 2015, p 64.84 Our calculation is as follows: £20 billion (assets under management) x 0.5% (average management charge) =
£101 million income and financing. There are a series of assumptions within this calculation, including that the management charge does not grow as the assets under management increase.
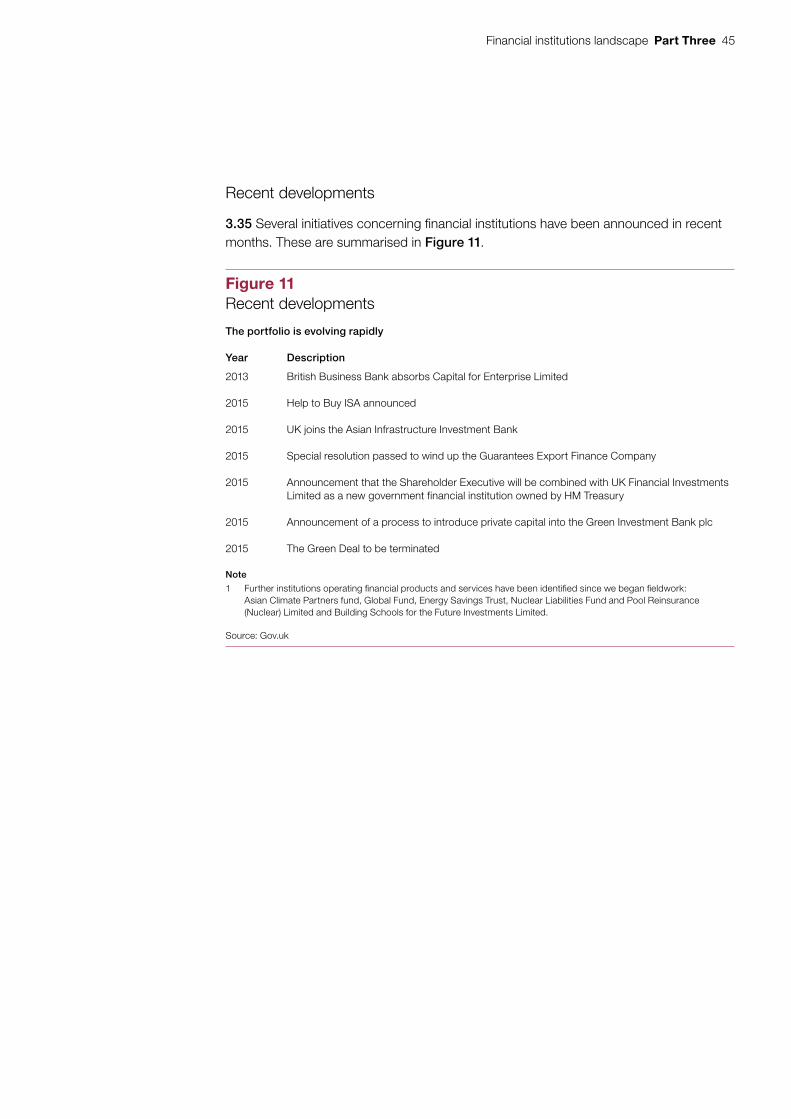
Financial institutions landscape Part Three 45
Recent developments
3.35 Several initiatives concerning financial institutions have been announced in recent months. These are summarised in Figure 11.
Figure 11Recent developments
The portfolio is evolving rapidly
Year Description
2013 British Business Bank absorbs Capital for Enterprise Limited
2015 Help to Buy ISA announced
2015 UK joins the Asian Infrastructure Investment Bank
2015 Special resolution passed to wind up the Guarantees Export Finance Company
2015 Announcement that the Shareholder Executive will be combined with UK Financial Investments Limited as a new government financial institution owned by HM Treasury
2015 Announcement of a process to introduce private capital into the Green Investment Bank plc
2015 The Green Deal to be terminated
Note
1 Further institutions operating fi nancial products and services have been identifi ed since we began fi eldwork: Asian Climate Partners fund, Global Fund, Energy Savings Trust, Nuclear Liabilities Fund and Pool Reinsurance (Nuclear) Limited and Building Schools for the Future Investments Limited.
Source: Gov.uk

46 Appendix One Financial institutions landscape
Appendix One
Methodology
Our audit approach
1 This study examines the landscape of financial institutions in government. We reviewed the following themes within the study:
• the scope of the financial institutions – both newly created and existing institutions – and the range of activities conducted;
• the scale and financial position of these institutions; and
• government and taxpayer exposure.
Our evidence base
2 We conducted the majority of the fieldwork for this study between October 2014 and March 2015, with additional financial information being updated in July 2015. We assessed each of the themes using a variety of methods, drawing only on publicly available published information. Our main methods were:
Documents reviewed:
• financial accounts and annual reports;85
• audit reports and legal documents – in order to understand monitoring and regulation arrangements in place;
• accountability models, distribution methods and funding arrangements; and
• previously published NAO reports concerning financial institutions.
Case studies and comparative analysis:
• We examined a selection of financial institutions in greater detail to develop our understanding of specific aspects of the portfolio.
Quantitative analysis of market data:
• We undertook quantitative analysis to understand the financial sector interventions carried out by government and the wider market conditions around these.
Interviews:
• We conducted interviews with HM Treasury officials, government departments, the Shareholder Executive, UK Financial Investments, UK Asset Resolution, and a number of financial institutions.
85 The analysis conducted uses the most up-to-date publicly available financial information at 31 March 2015, which provides the best estimate of the quantum of assets, liabilities, income and expenditure available. Financial figures were extracted directly from reports, and where necessary were converted into sterling.
Financial institutions landscape Appendix Two 47
Appendix Two
Further information concerning Lloyds Banking Group and the Royal Bank of Scotland
Share price performance of Lloyds Banking Group (Lloyds) and the Royal Bank of Scotland (RBS)
1 The share price performance of four UK banks – Barclays, HSBC, Lloyds and RBS – compared with the FTSE100 index is shown in Figure 12 overleaf and Figure 13 is on page 49. All four have increased since the lowest point in the market in January 2009. The share price of RBS is 90% below its level in January 2008, and Lloyds is 60% lower.
2 Figure 14 and Figure 15 on pages 50 and 51 compare the prevailing stock market price of Lloyds and RBS relative to the cost of the shares, net of disposals and dividends received. The cumulative cost of government borrowing is shown alongside the nominal value of the intervention. The cumulative financing cost associated with these investments, based on government borrowing costs, amounts to £3.13 billion for Lloyds, and £7.75 billion for RBS. This is illustrated by the interest expense ‘wedge’ in the charts.
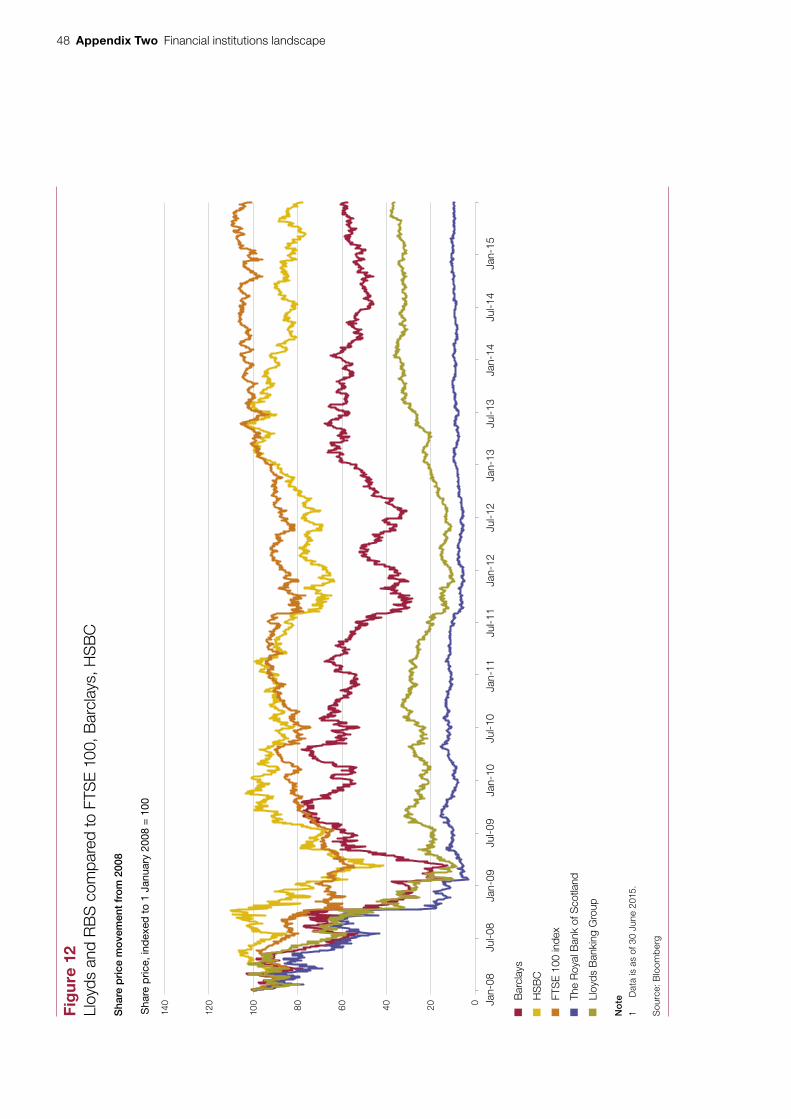
48 Appendix Two Financial institutions landscape
Fig
ure
12
Lloy
ds a
nd R
BS
com
pare
d to
FTS
E 10
0, B
arcl
ays,
HS
BC
Sha
re p
rice,
ind
exed
to
1 Ja
nuar
y 20
08 =
100
No
te
1 D
ata
is a
s of
30
June
201
5.
Sou
rce:
Blo
omb
erg
140
120
100 80 60 40 20 0
Sha
re p
rice
mo
vem
ent
fro
m 2
008
Bar
clay
s
HS
BC
FTS
E 1
00 in
dex
The
Roy
al B
ank
of S
cotla
nd
Lloy
ds B
anki
ng G
roup
Jul-0
8Ju
l-09
Jul-1
0Ja
n-08
Jan-
09Ja
n-10
Jan-
11Ju
l-11
Jan-
12Ja
n-13
Jul-1
3Ju
l-12
Jan-
14Ju
l-14
Jan-
15

Financial institutions landscape Appendix Two 49
Figure 13Ownership and value of fi nancial interventions
Investment manager
Rescued Institution
Share price:at cost
Share price:current
Equity stake at 31 March 2015
Market Value at 31 March 2015
UKFI Royal Bank of Scotland
502p (average) 351.5p 79% £30.8 billion4
Lloyds Banking Group
73.6p (average) 85.25p 22% £12.2 billion
Notes
1 Market value as per Figures 14 and 15.
2 Current share price is as of 30 June 2015.
3 As at the end of March 2015, the government held a total of four billion ordinary shares in RBS, equivalent to 64% of RBS’s voting share capital. In addition, the government held 51 billion B shares. In total, the government’s holding in RBS was equivalent to 79 per cent economic ownership.
4 Following the placing held in August 2015, the shareholding of HM Treasury reduced from 3,964,483,519 ordinary shares to 3,334,483,519 ordinary shares, representing approximately 51.5% of the ordinary share capital. Accordingly, the size of HM Treasury’s economic interest in the capital reduced to approximately 73%. The Placing Price was 330 pence per Placing Share. As a result, the proceeds from the sale was £2.1 billion.
Source: UK Financial Investments Limited Annual Report and Accounts 2013-14 and 2014-15, Bloomberg

50 Appendix Two Financial institutions landscape
Figure 14Lloyds Banking Group: market value of taxpayer shareholding and the cost of taxpayer investment
£ billion
Notes
1 Analysis conducted utilises a 2.87% annual interest rate.
2 Data is as of 30 June 2015.
3 Analysis does not include fees received from Lloyds relating to the interventions.
Source: Bloomberg, Update on UKFI Market Investments, March 2010
25
20
15
10
5
0
Market value of the stake in Lloyds compared with historical cost
Market value of shares held by taxpayer
Cost of government finance on the principal
Mar Jun
2010
Sep Dec Mar Jun
2011
Sep Dec Mar Jun
2012
Sep Dec Mar Jun
2013
Sep Dec Mar Jun
2014
Sep Dec Mar Jun
2015
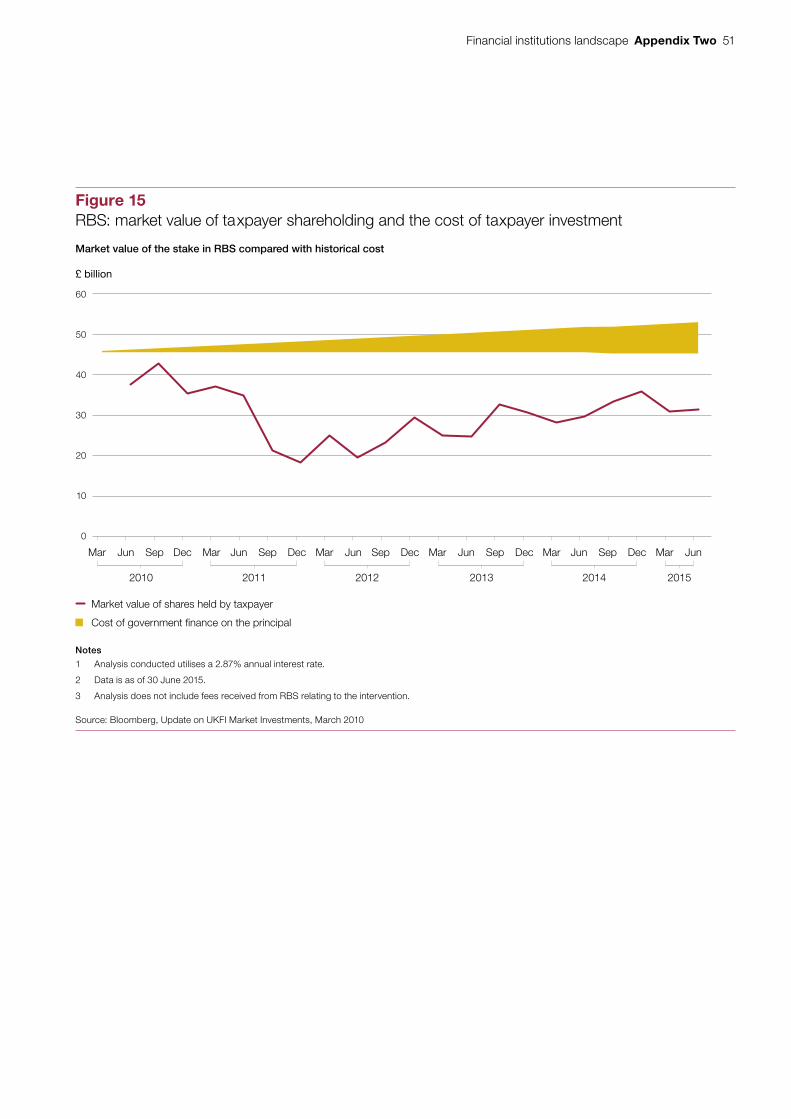
Financial institutions landscape Appendix Two 51
Figure 15RBS: market value of taxpayer shareholding and the cost of taxpayer investment
Market value of the stake in RBS compared with historical cost
£ billion
60
50
40
30
20
10
0
Notes
1 Analysis conducted utilises a 2.87% annual interest rate.
2 Data is as of 30 June 2015.
3 Analysis does not include fees received from RBS relating to the intervention.
Source: Bloomberg, Update on UKFI Market Investments, March 2010
Market value of shares held by taxpayer
Cost of government finance on the principal
Mar Jun
2010
Sep Dec Mar Jun
2011
Sep Dec Mar Jun
2012
Sep Dec Mar Jun
2013
Sep Dec Mar Jun
2014
Sep Dec Mar Jun
2015

52 Appendix Three Financial institutions landscape
Appendix Three
Index of previous NAO reports
1 We have published 30 reports concerning financial institutions in this landscape or closely-related policies.
No. Report Name Dept Report date Reference
1 UK Guarantees scheme for infrastructure HMT 28-Jan-15 HC 909, 2014-15
2 Follow-up: grants to the Big Society Network and the Society Network Foundation
CO 21-Nov-14 HC 840, 2014-15
3 Oversight of the Private Infrastructure Development Group
DfID 04-Jul-14 HC 265, 2014-15
4 Government grant services Various 03-Jul-14 HC 472, 2014-15
5 Early contracts for renewable electricity DECC 27-Jun-14 HC 172, 2014-15
6 Investigation into grants from the Big Lottery Fund and the Cabinet Office to the Big Society Network and the Society Network Foundation
CO 21-Jun-14 HC 572, 2014-15
7 The Privatisation of Royal Mail BIS 01-Apr-14 HC 1182, 2013-14
8 Investigation into NHS Property Services Limited
DoH 31-Mar-14 2014-15
9 The Help to Buy equity loan scheme DCLG 06-Mar-14 HC 1099, 2013-14
10 Managing debt owed to central government CG 10-Feb-14 HC 967, 2013-14
11 Student Loan Repayments BIS 28-Nov-13 HC 818, 2013-14
12 Supporting UK exporters overseas FCO 16-Oct-13 HC 732, 2013-14
13 Spinning-out MyCSP as a mutual joint venture
CO 12-Sep-13 HC 538, 2013-14
14 Managing the transition to the reformed health system
DoH 10-Jul-13 HC 537, 2013-14
15 HM Treasury: Planning for economic infrastructure
HMT 16-Jan-13 HC 595, 2012-13
16 Financial viability of the social housing sector: introducing the Affordable Homes Programme
DCLG 04-Jul-12 HC 456, 2012-13
No. Report Name Dept Report date Reference
17 The creation and sale of Northern Rock plc HMT 18-May-12 HC 20, 2012-13
18 The mortgage rescue scheme DCLG 20-Aug-11 HC 1030, 2010-11
19 Establishing social enterprises under the Right to Request Programme
DH 24-Jun-11 HC 1088, 2010-2012
20 Stewardship of the wholly-owned banks: buy-back of subordinated debt
HMT 18-Mar-11 HC 706, 2010-11
21 Maintaining the financial stability of UK banks: update on the support schemes
HMT 15-Dec-10 HC 676, 2010-11
22 Financing PFI projects in the credit crisis and the Treasury’s response
HMT 27-Jul-10 HC 287, 2010-11
23 The Customer First Programme: Delivery of student finance
BIS 19-Mar-10 HC 296, 2009-10
24 Department for Work & Pensions Pension Protection Fund
DWP 05-Feb-10 HC 293, 2009-10
25 Venture Capital support to small businesses BIS 10-Dec-09 HC 23, 2009-10
26 Investing for development: the Department for International Development’s oversight of CDC Group plc
DfID 05-Dec-08 HC 18, 2008-09
27 The Carbon Trust: accelerating the move to a low carbon economy
DECC 22-Nov-07 HC 7, 2007-08
28 The Shareholder Executive and Public Sector Businesses
BIS 28-Feb-07 HC 255, 2006-07
29 Supporting Small Business BIS 24-May-06 HC 962, 2005-06
30 PPP in practice: National Savings and Investments’ deal with Siemens Business Services, four years on
HMT 08-May-03 HC 626, 2002-03

Financial institutions landscape Appendix Three 53
No. Report Name Dept Report date Reference
1 UK Guarantees scheme for infrastructure HMT 28-Jan-15 HC 909, 2014-15
2 Follow-up: grants to the Big Society Network and the Society Network Foundation
CO 21-Nov-14 HC 840, 2014-15
3 Oversight of the Private Infrastructure Development Group
DfID 04-Jul-14 HC 265, 2014-15
4 Government grant services Various 03-Jul-14 HC 472, 2014-15
5 Early contracts for renewable electricity DECC 27-Jun-14 HC 172, 2014-15
6 Investigation into grants from the Big Lottery Fund and the Cabinet Office to the Big Society Network and the Society Network Foundation
CO 21-Jun-14 HC 572, 2014-15
7 The Privatisation of Royal Mail BIS 01-Apr-14 HC 1182, 2013-14
8 Investigation into NHS Property Services Limited
DoH 31-Mar-14 2014-15
9 The Help to Buy equity loan scheme DCLG 06-Mar-14 HC 1099, 2013-14
10 Managing debt owed to central government CG 10-Feb-14 HC 967, 2013-14
11 Student Loan Repayments BIS 28-Nov-13 HC 818, 2013-14
12 Supporting UK exporters overseas FCO 16-Oct-13 HC 732, 2013-14
13 Spinning-out MyCSP as a mutual joint venture
CO 12-Sep-13 HC 538, 2013-14
14 Managing the transition to the reformed health system
DoH 10-Jul-13 HC 537, 2013-14
15 HM Treasury: Planning for economic infrastructure
HMT 16-Jan-13 HC 595, 2012-13
16 Financial viability of the social housing sector: introducing the Affordable Homes Programme
DCLG 04-Jul-12 HC 456, 2012-13
No. Report Name Dept Report date Reference
17 The creation and sale of Northern Rock plc HMT 18-May-12 HC 20, 2012-13
18 The mortgage rescue scheme DCLG 20-Aug-11 HC 1030, 2010-11
19 Establishing social enterprises under the Right to Request Programme
DH 24-Jun-11 HC 1088, 2010-2012
20 Stewardship of the wholly-owned banks: buy-back of subordinated debt
HMT 18-Mar-11 HC 706, 2010-11
21 Maintaining the financial stability of UK banks: update on the support schemes
HMT 15-Dec-10 HC 676, 2010-11
22 Financing PFI projects in the credit crisis and the Treasury’s response
HMT 27-Jul-10 HC 287, 2010-11
23 The Customer First Programme: Delivery of student finance
BIS 19-Mar-10 HC 296, 2009-10
24 Department for Work & Pensions Pension Protection Fund
DWP 05-Feb-10 HC 293, 2009-10
25 Venture Capital support to small businesses BIS 10-Dec-09 HC 23, 2009-10
26 Investing for development: the Department for International Development’s oversight of CDC Group plc
DfID 05-Dec-08 HC 18, 2008-09
27 The Carbon Trust: accelerating the move to a low carbon economy
DECC 22-Nov-07 HC 7, 2007-08
28 The Shareholder Executive and Public Sector Businesses
BIS 28-Feb-07 HC 255, 2006-07
29 Supporting Small Business BIS 24-May-06 HC 962, 2005-06
30 PPP in practice: National Savings and Investments’ deal with Siemens Business Services, four years on
HMT 08-May-03 HC 626, 2002-03

54 Appendix Four Financial institutions landscape
Appendix Four
Classification of public bodies
1 There is a variety of entities in the public sector. They are variously referred to as public bodies, arm’s-length bodies (ALBs),86 non-departmental public bodies (NDPBs) or partners.
2 The systems for classifications do not classify bodies simply according to their legal form. Each government department contains a number of public bodies within its departmental group. The classifications given to each is determined by the classification body. The Office for National Statistics (ONS), HM Treasury and the Cabinet Office all classify public bodies for different purposes, for example for national statistics or budgeting.
3 These classifications do not map directly on to the Financial Services and Markets Act 2000 list of financial services activities, such as lending and investment management. This means they cannot be used to identify which public bodies are operating as financial institutions in government. FSMA regulates the provision of financial services by setting out the activities and transactions that only a regulated body can provide. All private sector providers should be registered with the FCA as it is an offence to engage in regulated activities without being registered or authorised by the FCA. However, not all public sectors financial institutions are FCA registered or authorised: while some institutions are expressly exempt under the exemption order, others may assume crown immunity87 will apply and do not register.
4 The ONS’s Public Sector Classification Guide88 distinguishes between four types of body: central government; public financial corporation; private non-financial corporation; and public insurance corporation.89 It is designed to help correctly record organisations in the national statistics.
5 The Cabinet Office’s Categories of Public Bodies90 distinguishes between departments, non-ministerial departments, executive agencies, non-departmental public bodies, advisory bodies, public corporations, and ‘other’ types of bodies (such as parliamentary bodies). It is designed to help departments when considering how to classify their public bodies.
86 This term is not used consistently. HM Treasury uses it to refer to all public bodies except the core department, its executive agencies and public corporations. Departmental reports use the term to indicate entities outside the core department’s boundary, which may include public corporations.
87 Crown immunity is claimed as a defence against an action for non-compliance with a law.88 Office for National Statistics, Public Sector Classification Guide, May 2015.89 These categorisations are themselves drawn from the European System of Accounts 2010, which can be found
at www.ec.europa.eu90 The Cabinet Office’s guidance on the administrative classification of public bodies is likely to be updated following
completition of its current review of the administrative classification system for public bodies.
Financial institutions landscape Appendix Four 55
6 HM Treasury’s Consolidated Budgeting Guidance 2015-16 explains how central government budgeting guidance applies to departments, ALBs and directly controlled companies.91 The document provides budgeting and accounting guidance for financial transactions including: loans issued, shares purchased and sold, financial guarantees and exchange rate movements and hedging. It also provides separate budgeting guidance for public corporations that are publicly owned or controlled ‘market bodies’ meaning their income comes mainly from trading activities.92
7 HM Treasury’s Managing public money distinguishes between central government departments, ALBs including NDPBs, trading funds, non-ministerial departments, local government and public corporations (PCs). It refers to use of the private sector (eg for outsourcing and private finance initiative). HM Treasury distinguishes between public corporations and self-financing public corporations; however, only one of the institutions we have identified – CDC Group plc – is in the self-financed category. The requirement to operate on commercial terms applies to a number of organisations such as the Green Investment Bank, and to the commercial subsidiary of the British Business Bank, called British Business Bank Investments Limited. The government has set a return target for the British Business Bank equivalent to the government’s cost of capital in the medium term. A question of state aid could arise if institutions are financed by subsidies or distorted prices.
8 Managing public money provides guidance on creating new public bodies, departmental oversight arrangements and creating liabilities. (Figure 16 overleaf).
91 HM Treasury, Consolidated budgeting guidance 2015 to 2016, March 2015, para 1.81.92 HM Treasury, Consolidated budgeting guidance 2015 to 2016, March 2015, para 1.79 and Chapter 11.

56 Appendix Four Financial institutions landscape
Figure 16Extracts from Managing public money
Theme Guidance Reference
Rationale to create an ALB
Each new arms-length body should have a specific purpose, distinct from its sponsor department and should demonstrate an advantage, such as separating implementation from policymaking; demonstrating the integrity of independent assessment; establishing a specialist identity for a professional skill; or introducing a measure of commercial discipline. It is sensible to be sceptical about setting up a new ALB, since it will often add to costs.
7.2.2
Departmental oversight arrangements for ALBs
Each central government organisation requires an accounting officer, usually its senior official, supported by a board structured in line with the Corporate Governance Code. Accounting officers in ALBs have similar responsibilities to departmental accounting officers and they must respect the legislation establishing the organisation and terms of the framework document. If the Committee of Public Accounts decides to investigate an ALB to be satisfied that the sponsor’s oversight is adequate, the accounting officers of both the ALB and its sponsor department should expect to be called as witnesses.
3.1 and 7.2.7
The Shareholder Executive may be a good way of managing departments’ responsibilities as shareholders.
7.7.1
Whatever the legal status of an ALB its sponsor department should have a mechanism for asserting an appropriate degree of control over it, especially in financial matters and in relation to issues of ethics in the use of public funds. A sponsor department cannot relinquish all responsibility for the business of its ALBs by delegation. It should have oversight arrangements appropriate to the risk, importance, quality and range of the ALB’s business.
A7.1.9 and 7.2.4
The greater the extent of public funding, the greater the degree of control called for. A7.1.9
Creating liabilities, including borrowing by ALBs
ALBs do not generally have powers to take on liabilities, because these would bind their sponsoring departments. Framework documentation should require the ALB to gain the sponsor department’s agreement to any commitment, including borrowing, into which it proposes to enter. Departments should also ensure that ALBs have systems to appraise and manage liabilities and report them to parliament. As with making decisions about other policies and projects, an organisation considering using unfamiliar financing techniques should evaluate them carefully, especially to assess value for money.
A5.4.4 and 5.12.2
Sponsor departments should define any contractual relationship with a corporate in a framework document. The financial performance expected should give the shareholder department a fair return on the public funds invested in the business.
7.7.2
Source: HM Treasury, Managing public money, July 2013; HM Treasury

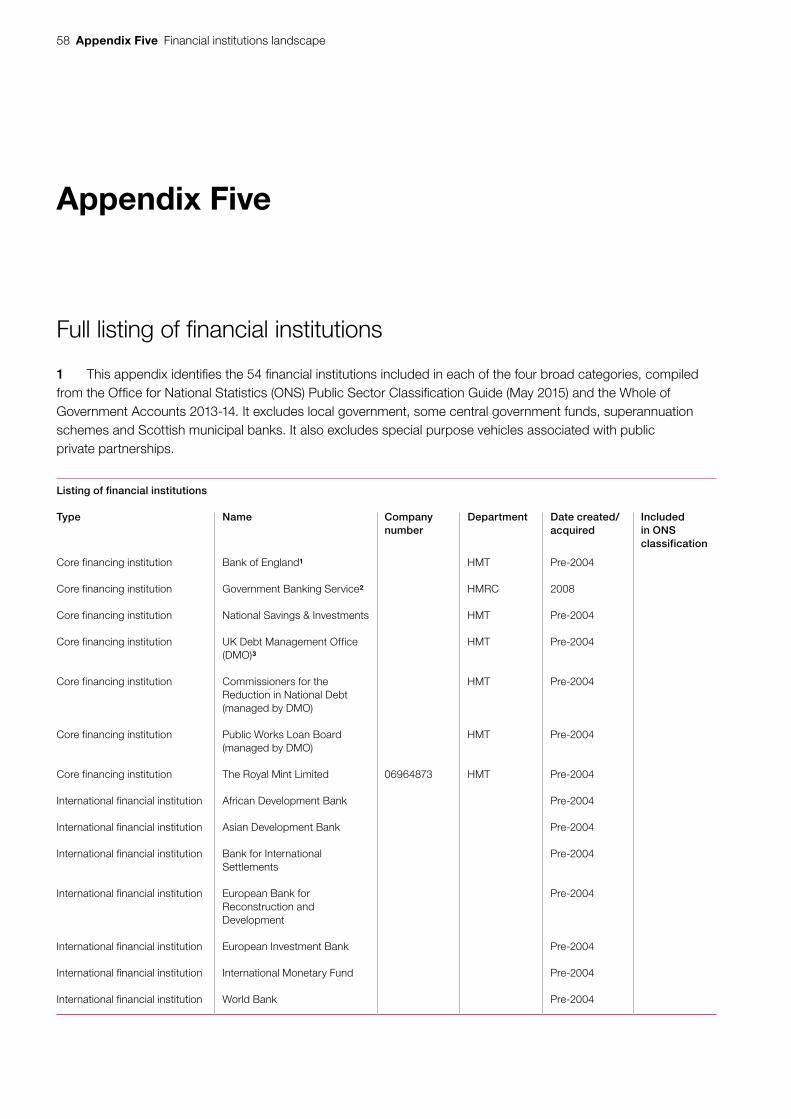
58 Appendix Five Financial institutions landscape
Appendix Five
Full listing of financial institutions
1 This appendix identifies the 54 financial institutions included in each of the four broad categories, compiled from the Office for National Statistics (ONS) Public Sector Classification Guide (May 2015) and the Whole of Government Accounts 2013-14. It excludes local government, some central government funds, superannuation schemes and Scottish municipal banks. It also excludes special purpose vehicles associated with public private partnerships.
Listing of fi nancial institutions
Type Name Companynumber
Department Date created/acquired
Included in ONS classification
Core financing institution Bank of England1 HMT Pre-2004
Core financing institution Government Banking Service2 HMRC 2008
Core financing institution National Savings & Investments HMT Pre-2004
Core financing institution UK Debt Management Office (DMO)3
HMT Pre-2004
Core financing institution Commissioners for the Reduction in National Debt (managed by DMO)
HMT Pre-2004
Core financing institution Public Works Loan Board (managed by DMO)
HMT Pre-2004
Core financing institution The Royal Mint Limited 06964873 HMT Pre-2004
International financial institution African Development Bank Pre-2004
International financial institution Asian Development Bank Pre-2004
International financial institution Bank for International Settlements
Pre-2004
International financial institution European Bank for Reconstruction and Development
Pre-2004
International financial institution European Investment Bank Pre-2004
International financial institution International Monetary Fund Pre-2004
International financial institution World Bank Pre-2004

Financial institutions landscape Appendix Five 59
Listing of fi nancial institutions
Type Name Companynumber
Department Date created/acquired
Included in ONS classification
Financial sector interventions The Royal Bank of Scotland Plc4 SC090312 HMT stake acquired 2008
Yes
Financial sector interventions Lloyds Banking Group Plc SC095000 HMT stake acquired 2008
Yes
Financial sector interventions Bradford & Bingley Plc5 03938288 HMT acquired 2010 Yes
Financial sector interventions NRAM plc (formerly Northern Rock (Asset Management) plc)
03273685 HMT acquired 2010 Yes
Policy-Related Institutions Affordable Housing Finance Plc 08434613 DCLG 2013
Policy-Related Institutions Big Society Capital Limited 07599565 CO 2011 Yes
Policy-Related Institutions British Business Bank Plc6 08616013 BIS 2012 Yes
Policy-Related Institutions CDC Group Plc 03877777 DfID Pre-2004 Yes
Policy-Related Institutions Community Health Partnerships Limited
04220587 DoH Pre-2004
Policy-Related Institutions Electricity Settlements Company Limited
08961281 DECC 2014 Yes
Policy-Related Institutions Export Credits Guarantee Department
ECGD Pre-2004 Yes
Policy-Related Institutions Financial Services Compensation Scheme Limited
03943048 HMT Pre-2004 Yes
Policy-Related Institutions Global Climate Partnership Fund
DECC 2009
Policy-Related Institutions Green Deal Finance Company Limited
07980777 DECC 2012
Policy-Related Institutions Guaranteed Export Finance Corporation Plc7
01980873 ECGD Pre-2004 Yes
Policy-Related Institutions Help to Buy (HMT) Limited 08676593 HMT 2013
Policy-Related Institutions HM Treasury UK Sovereign Sukuk Plc
09051219 HMT 2014 Yes
Policy-Related Institutions Homes and Communities Agency
DCLG 2008 Yes
Policy-Related Institutions Infrastructure Finance Unit Limited
06816271 HMT 2012

60 Appendix Five Financial institutions landscape
Listing of fi nancial institutions
Type Name Companynumber
Department Date created/acquired
Included in ONS classification
Policy-Related Institutions Infrastructure UK (a unit of HMT responsible for the UK guarantee scheme)
HMT 2012 Yes
Policy-Related Institutions Integrated Debt Services Limited8
09309759 CO 2014
Policy-Related Institutions Low Carbon Contracts Company Limited
08818711 DECC 2014 Yes
Policy-Related Institutions MyCSP Limited 07640786 CO 2011
Policy-Related Institutions National Employment Savings Trust (NEST) Corporation
DWP 2010 Yes
Policy-Related Institutions National Employment Savings Trust (NEST) Scheme
DWP 2010 Yes
Policy-Related Institutions NHS Property Services Limited 07888110 DoH 2013
Policy-Related Institutions Pension Protection Fund DWP 2005 Yes
Policy-Related Institutions Pool Reinsurance Company Limited
02798901 HMT Pre-2004
Policy-Related Institutions Post Office Limited9 BIS Pre-2004 Yes
Policy-Related Institutions Private Infrastructure Development Group
DfID Pre-2004
Policy-Related Institutions Salix Finance Limited 05068355 DECC 2004
Policy-Related Institutions Shareholder Executive (a unit of BIS)
BIS Pre-2004 Yes
Policy-Related Institutions Student Loans Company Limited
02401034 BIS Pre-2004 Yes
Policy-Related Institutions The Housing Finance Corporation Limited
IP25862R (on mutual public register)
DCLG Pre-2004
Policy-Related Institutions The Carbon Trust 04190230 DECC Pre-2004
Policy-Related Institutions The Start-Up Loans Company10
08117656 BIS 2012
Policy-Related Institutions UKAR Corporate Services Limited
08578384 HMT 2013
Policy-Related Institutions UK Asset Resolution Limited 07301961 HMT 2010 Yes

Financial institutions landscape Appendix Five 61
Listing of fi nancial institutions
Type Name Companynumber
Department Date created/acquired
Included in ONS classification
Policy-Related Institutions UK Financial Investments Limited
06720891 HMT 2008 Yes
Policy-Related Institutions UK Green Investment Bank Plc11
SC424067 BIS 2012 Yes
Notes
1 Bank of England Asset Purchase Facility.
2 Government Banking Service (GBS) is part of HMRC. It provides banking services for central government bodies. In addition, government departments are responsible for the fl ow of funds between parts of the public sector, which may involve lending. For example, the Department of Health lends to NHS Trusts. We have not included these activities.
3 DMO operates three guarantee schemes – National Loan Guarantee Scheme, Credit Guarantee Scheme and Asset-backed Securities Guarantee Scheme.
4 Subsidiaries: ABN Amro Bank NV, Adam and Company plc, Coutts & Co, National Westminster Bank plc, Ulster Bank Ltd, Ulster Bank Ireland Ltd, among other subsidiaries.
5 Subsidiaries: Mortgage Express (England), Aire Valley Finance (eight legal entities).
6 Subsidiaries: British Business Bank Investments Ltd (incorporated 18 June 2014), Capital for Enterprise (GP) Limited, Capital for Enterprise Fund Managers Limited, Capital for Enterprise Limited, British Business Finance Limited, British Business Finance Services Limited and British Business Aspire Hold Co Limited.
7 A special resolution to wind up the company was fi led on 15 January 2015.
8 Incorporated 13 November 2014.
9 Subsidiaries: First Rate Exchange Services Holdings Limited, First Rate Exchange Services Limited (a joint venture with the Bank of Ireland).
10 Now part of British Business Bank Plc.
11 Subsidiaries: K Energy Effi ciency Investments 1 L.P., UK GIB 1 Limited, UK GIB 2 Limited, UK GIB 3 Limited, UK GIB Financial Services Limited, UK GIB Rhyl Flats Investment Limited, UK Green Sustainable Waste and Energy Investments L.P., UK Waste Resources and Energy Investments L.P.
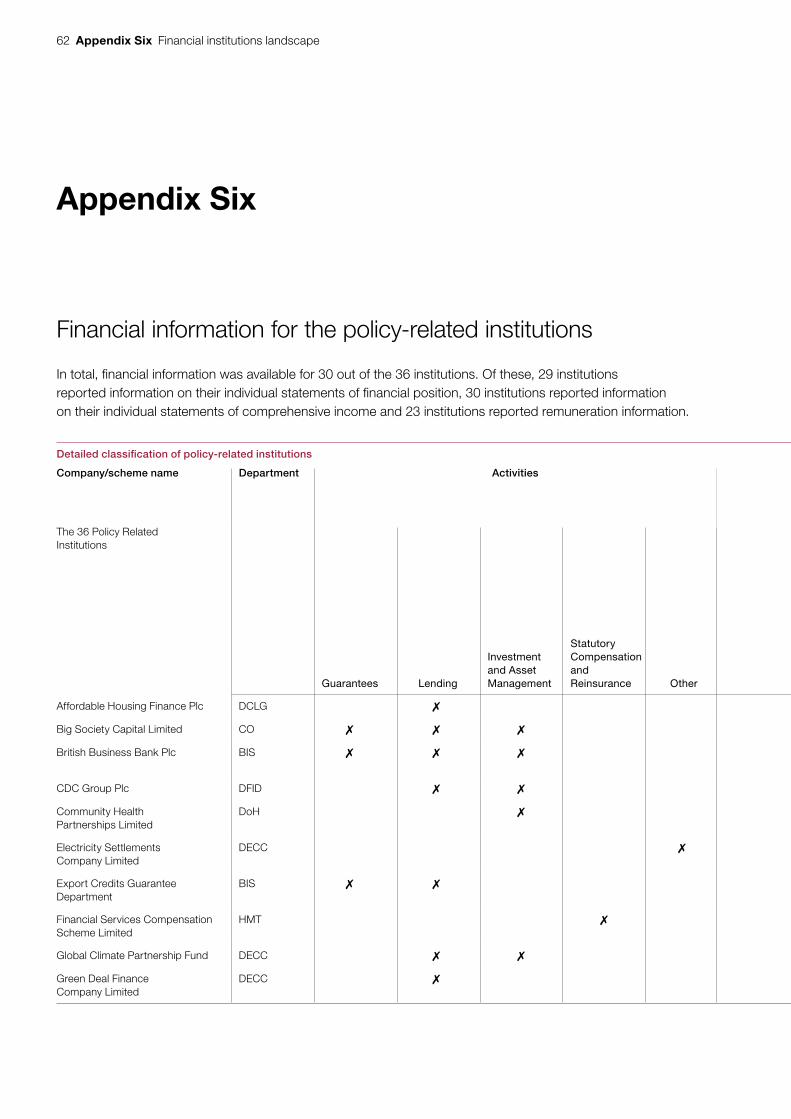
62 Appendix Six Financial institutions landscape
Appendix Six
Financial information for the policy-related institutions
In total, financial information was available for 30 out of the 36 institutions. Of these, 29 institutions reported information on their individual statements of financial position, 30 institutions reported information on their individual statements of comprehensive income and 23 institutions reported remuneration information.
Detailed classifi cation of policy-related institutions
Company/scheme name Department Activities Sector Customer Distribution Authorised/regulated by FCA
Consolidated in WGA
Financial accounts available and date1
ONS public sector classification guide
The 36 Policy Related Institutions
Guarantees Lending
Investment and Asset Management
Statutory Compensation and Reinsurance Other
Energy
Property
Pensions and Insurance
Graduates
International
Business and Private Investment
Other
Retail
Institutional
Mixed
Direct
Indirect
Mixed
Yes
No
Yes
No
Yes
No
CG
PFC
PNFC
PIC
See below for definitions6
Affordable Housing Finance Plc DCLG Property Institutional Direct Yes No Yes (31 Mar 2014) –
Big Society Capital Limited CO Other Institutional Indirect Yes No Yes (31 Dec 2014) CG2
British Business Bank Plc BIS Business and Private Investment
Institutional Indirect No Yes Yes (31 Mar 2014) CG
CDC Group Plc DFID International Institutional Mixed Yes Yes Yes (31 Dec 2014) PNFC6b
Community Health Partnerships Limited
DoH Property Institutional Indirect No Yes Yes (31 Mar 2014) –
Electricity Settlements Company Limited
DECC Energy Institutional Direct No Yes No CG
Export Credits Guarantee Department
BIS International Institutional Mixed No Yes Yes (31 Mar 2015) PNFC6b
Financial Services Compensation Scheme Limited
HMT Pensions and Insurance
Mixed Mixed No Yes Yes (31 Mar 2015) CG
Global Climate Partnership Fund DECC Energy Institutional Indirect No No Yes (31 Dec 2014) –
Green Deal Finance Company Limited
DECC Energy Retail Indirect No No Yes (31 Dec 2014) –

Financial institutions landscape Appendix Six 63
Detailed classifi cation of policy-related institutions
Company/scheme name Department Activities Sector Customer Distribution Authorised/regulated by FCA
Consolidated in WGA
Financial accounts available and date1
ONS public sector classification guide
The 36 Policy Related Institutions
Guarantees Lending
Investment and Asset Management
Statutory Compensation and Reinsurance Other
Energy
Property
Pensions and Insurance
Graduates
International
Business and Private Investment
Other
Retail
Institutional
Mixed
Direct
Indirect
Mixed
Yes
No
Yes
No
Yes
No
CG
PFC
PNFC
PIC
See below for definitions6
Affordable Housing Finance Plc DCLG Property Institutional Direct Yes No Yes (31 Mar 2014) –
Big Society Capital Limited CO Other Institutional Indirect Yes No Yes (31 Dec 2014) CG2
British Business Bank Plc BIS Business and Private Investment
Institutional Indirect No Yes Yes (31 Mar 2014) CG
CDC Group Plc DFID International Institutional Mixed Yes Yes Yes (31 Dec 2014) PNFC6b
Community Health Partnerships Limited
DoH Property Institutional Indirect No Yes Yes (31 Mar 2014) –
Electricity Settlements Company Limited
DECC Energy Institutional Direct No Yes No CG
Export Credits Guarantee Department
BIS International Institutional Mixed No Yes Yes (31 Mar 2015) PNFC6b
Financial Services Compensation Scheme Limited
HMT Pensions and Insurance
Mixed Mixed No Yes Yes (31 Mar 2015) CG
Global Climate Partnership Fund DECC Energy Institutional Indirect No No Yes (31 Dec 2014) –
Green Deal Finance Company Limited
DECC Energy Retail Indirect No No Yes (31 Dec 2014) –

64 Appendix Six Financial institutions landscape
Detailed classifi cation of policy-related institutions
Company/scheme name Department Activities Sector Customer Distribution Authorised/regulated by FCA
Consolidated in WGA
Financial accounts available and date1
ONS public sector classification guide
Guarantees Lending Investment and Asset Management
Statutory Compensation and Reinsurance
Other
Guaranteed Export Finance Corporation Plc
ECGD International Institutional Direct No Yes Yes (31 Mar 2014) PFC
Help to Buy (HMT) Limited HMT Property Retail Indirect No Yes Yes (30 Sep 2014) –6a
HM Treasury UK Sovereign Sukuk Plc
HMT Other Institutional Direct No No No CG
Homes and Communities Agency DCLG 3 Property Mixed Mixed No Yes Yes (31 Mar 2015) CG
Infrastructure Finance Unit Limited HMT Business and Private Investment
Institutional Indirect No Yes Yes (31 Mar 2014) –6a
Infrastructure UK (a unit of HMT responsible for the UK guarantee scheme)
HMT Business and Private Investment
Institutional Direct No Yes Yes4 (31 Mar 2015) CG
Integrated Debt Services Limited CO Other Mixed Mixed No No No –
Low Carbon Contracts Company Limited
DECC Energy Institutional Direct No Yes No CG
MyCSP Limited CO Pensions and Insurance
Mixed Mixed No No Yes (31 Mar 2014) –
National Employment Savings Trust (NEST) Corporation
DWP Pensions and Insurance
Mixed Mixed No Yes Yes (31 Mar 2015) PFC
National Employment Savings Trust (NEST) Scheme
DWP Pensions and Insurance
Mixed Mixed No No Yes (31 Mar 2015) PFC
NHS Property Services Limited DoH Property Institutional Direct No Yes Yes (31 Mar 2014) –
Pension Protection Fund DWP Pensions and Insurance
Mixed Mixed No No5 Yes (31 Mar 2015) PIC
Pool Reinsurance Company Limited HMT Pensions and Insurance
Institutional Direct Yes No Yes (31 Dec 2014) –
Post Office Limited BIS Other Retail Indirect No Yes No PNFC
Private Infrastructure Development Group
DFID International Institutional Indirect No No Yes (31 Dec 2013) –
Salix Finance Limited DECC Energy Institutional Direct No No Yes (31 Mar 2015) –
Shareholder Executive (a unit of BIS)
BIS Business and Private Investment
Institutional Direct No No No CG

Financial institutions landscape Appendix Six 65
Detailed classifi cation of policy-related institutions
Company/scheme name Department Activities Sector Customer Distribution Authorised/regulated by FCA
Consolidated in WGA
Financial accounts available and date1
ONS public sector classification guide
Guarantees Lending Investment and Asset Management
Statutory Compensation and Reinsurance
Other
Guaranteed Export Finance Corporation Plc
ECGD International Institutional Direct No Yes Yes (31 Mar 2014) PFC
Help to Buy (HMT) Limited HMT Property Retail Indirect No Yes Yes (30 Sep 2014) –6a
HM Treasury UK Sovereign Sukuk Plc
HMT Other Institutional Direct No No No CG
Homes and Communities Agency DCLG 3 Property Mixed Mixed No Yes Yes (31 Mar 2015) CG
Infrastructure Finance Unit Limited HMT Business and Private Investment
Institutional Indirect No Yes Yes (31 Mar 2014) –6a
Infrastructure UK (a unit of HMT responsible for the UK guarantee scheme)
HMT Business and Private Investment
Institutional Direct No Yes Yes4 (31 Mar 2015) CG
Integrated Debt Services Limited CO Other Mixed Mixed No No No –
Low Carbon Contracts Company Limited
DECC Energy Institutional Direct No Yes No CG
MyCSP Limited CO Pensions and Insurance
Mixed Mixed No No Yes (31 Mar 2014) –
National Employment Savings Trust (NEST) Corporation
DWP Pensions and Insurance
Mixed Mixed No Yes Yes (31 Mar 2015) PFC
National Employment Savings Trust (NEST) Scheme
DWP Pensions and Insurance
Mixed Mixed No No Yes (31 Mar 2015) PFC
NHS Property Services Limited DoH Property Institutional Direct No Yes Yes (31 Mar 2014) –
Pension Protection Fund DWP Pensions and Insurance
Mixed Mixed No No5 Yes (31 Mar 2015) PIC
Pool Reinsurance Company Limited HMT Pensions and Insurance
Institutional Direct Yes No Yes (31 Dec 2014) –
Post Office Limited BIS Other Retail Indirect No Yes No PNFC
Private Infrastructure Development Group
DFID International Institutional Indirect No No Yes (31 Dec 2013) –
Salix Finance Limited DECC Energy Institutional Direct No No Yes (31 Mar 2015) –
Shareholder Executive (a unit of BIS)
BIS Business and Private Investment
Institutional Direct No No No CG

66 Appendix Six Financial institutions landscape
Detailed classifi cation of policy-related institutions
Company/scheme name Department Activities Sector Customer Distribution Authorised/regulated by FCA
Consolidated in WGA
Financial accounts available and date1
ONS public sector classification guide
Guarantees Lending Investment and Asset Management
Statutory Compensation and Reinsurance
Other
Student Loans Company Limited BIS Graduates Retail Direct No Yes Yes (31 Mar 2015) CG
The Carbon Trust DECC Energy Institutional Mixed Yes No Yes (31 Mar 2014) –
The Housing Finance Corporation Limited
DCLG Property Institutional Direct Yes6c No Yes (31 Mar 2014) –
The Start-Up Loans Company Limited
BIS Business and Private Investment
Institutional Indirect No No Yes (31 Mar 2014) –
UK Asset Resolution Limited HMT Property Retail Direct No Yes Yes (31 Mar 2015) CG
UK Financial Investments Limited HMT Business and Private Investment
Institutional Direct No Yes Yes (31 Mar 2015) CG
UK Green Investment Bank Plc BIS Energy Institutional Mixed Yes Yes Yes (31 Mar 2015) CG
UKAR Corporate Services Limited HMT Property Retail Indirect No Yes Yes (31 Mar 2014) –6a
Notes
1 Financial account information available as at time of writing and the date of the latest accounts available. At the time of writing, fi nancial accounts for Electricity Settlements Company Limited and Low Carbon Contracts Company Limited had not yet been published.
2 Big Society Capital Limited is classifi ed as central government. This classifi cation is due to a change in guidance about indicators of private sector control and it was previously classifi ed as private sector. It is currently classifi ed as a private sector entity in HMG accounts.
3 DCLG and HCA agreed that the HCA will take over the administration of the Housing Guarantees Schemes which are intended to guarantee up to £10 billion of debt so that housing providers delivering new private rented and affordable homes can borrow more cheaply. These guarantees are and will continue to be issued by the Secretary of State at DCLG.
4 With the exception of fi nancial information on assets and liabilities.
5 The Pension Protection fund is not consolidated in the 2013-14 WGA but is proposed to be consolidated in the 2014-15 WGA.
6 CG: Central government; PFC: Public Financial Corporation; PNFC: Public Non-Financial Corporation; PIC: Public Insurance Corporation:
a The ONS has not formally classifi ed Help to Buy (HMT) Limited, UKAR Corporate Services Limited or Infrastructure Finance Unit Limited as it does not recognise these bodies as having suffi cient degree of autonomy to be considered as institutional units under the ESA framework: these institutions are all legal entities set up by HM Treasury to administer specifi c areas of policy but with no genuine autonomy. As a result, ONS consider all these institutions to be within the central government.
b Although both Export Credits Guarantee Department and CC Group Plc are currently recorded on the ONS classifi cation guide as PNFCs, they will shortly be reclassifi ed to PFC. Export Credit Guarantee Department is a central government department.
c THFC is an FCA registered society. It is not, however, authorised or regulated by the FCA.
Source: National Audit Offi ce analysis of departmental and institutional published annual reports and accounts, Financial Conduct Authority register, Offi ce for National Statistics Public Sector Classifi cation Guide, May 2015
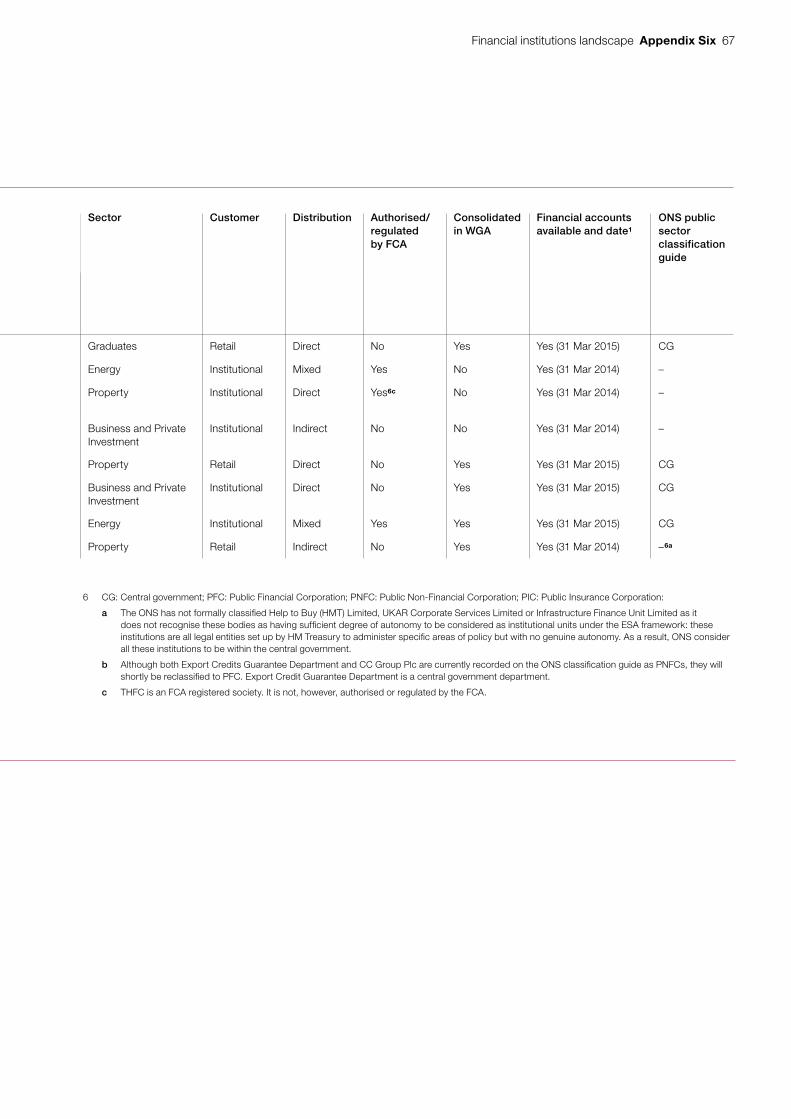
Financial institutions landscape Appendix Six 67
Detailed classifi cation of policy-related institutions
Company/scheme name Department Activities Sector Customer Distribution Authorised/regulated by FCA
Consolidated in WGA
Financial accounts available and date1
ONS public sector classification guide
Guarantees Lending Investment and Asset Management
Statutory Compensation and Reinsurance
Other
Student Loans Company Limited BIS Graduates Retail Direct No Yes Yes (31 Mar 2015) CG
The Carbon Trust DECC Energy Institutional Mixed Yes No Yes (31 Mar 2014) –
The Housing Finance Corporation Limited
DCLG Property Institutional Direct Yes6c No Yes (31 Mar 2014) –
The Start-Up Loans Company Limited
BIS Business and Private Investment
Institutional Indirect No No Yes (31 Mar 2014) –
UK Asset Resolution Limited HMT Property Retail Direct No Yes Yes (31 Mar 2015) CG
UK Financial Investments Limited HMT Business and Private Investment
Institutional Direct No Yes Yes (31 Mar 2015) CG
UK Green Investment Bank Plc BIS Energy Institutional Mixed Yes Yes Yes (31 Mar 2015) CG
UKAR Corporate Services Limited HMT Property Retail Indirect No Yes Yes (31 Mar 2014) –6a
Notes
1 Financial account information available as at time of writing and the date of the latest accounts available. At the time of writing, fi nancial accounts for Electricity Settlements Company Limited and Low Carbon Contracts Company Limited had not yet been published.
2 Big Society Capital Limited is classifi ed as central government. This classifi cation is due to a change in guidance about indicators of private sector control and it was previously classifi ed as private sector. It is currently classifi ed as a private sector entity in HMG accounts.
3 DCLG and HCA agreed that the HCA will take over the administration of the Housing Guarantees Schemes which are intended to guarantee up to £10 billion of debt so that housing providers delivering new private rented and affordable homes can borrow more cheaply. These guarantees are and will continue to be issued by the Secretary of State at DCLG.
4 With the exception of fi nancial information on assets and liabilities.
5 The Pension Protection fund is not consolidated in the 2013-14 WGA but is proposed to be consolidated in the 2014-15 WGA.
6 CG: Central government; PFC: Public Financial Corporation; PNFC: Public Non-Financial Corporation; PIC: Public Insurance Corporation:
a The ONS has not formally classifi ed Help to Buy (HMT) Limited, UKAR Corporate Services Limited or Infrastructure Finance Unit Limited as it does not recognise these bodies as having suffi cient degree of autonomy to be considered as institutional units under the ESA framework: these institutions are all legal entities set up by HM Treasury to administer specifi c areas of policy but with no genuine autonomy. As a result, ONS consider all these institutions to be within the central government.
b Although both Export Credits Guarantee Department and CC Group Plc are currently recorded on the ONS classifi cation guide as PNFCs, they will shortly be reclassifi ed to PFC. Export Credit Guarantee Department is a central government department.
c THFC is an FCA registered society. It is not, however, authorised or regulated by the FCA.
Source: National Audit Offi ce analysis of departmental and institutional published annual reports and accounts, Financial Conduct Authority register, Offi ce for National Statistics Public Sector Classifi cation Guide, May 2015

68 Appendix Six Financial institutions landscape
Assets and liabilities of policy-related institutions
Company/scheme name
Government ownership
Total assets on balance
sheet£
Total liabilities on balance
sheet£
Net assets/(liabilities)
£
Other assets identified
£
Other liabilities identified1
£
Affordable Housing Finance Plc
Guarantee2 477,000 246,000 231,000 208,400,000
British Business Bank Plc
100% 735,869,000 87,788,000 648,081,000 194,984,000
CDC Group Plc 100% 3,416,400,000 47,300,000 3,369,100,000
Community Health Partnerships Limited
100% 2,080,259,000 2,006,818,000 73,441,000
Export Credits Guarantee Department
100% 1,349,573,000 1,169,836,000 179,737,000 13,394,414,000
Financial Services Compensation Scheme Limited
100% 17,187,346,000 17,187,346,000 0
Help to Buy (HMT) Limited
100% 27,083,000 27,083,000 0 631,000,000
Homes and Communities Agency3
100% 4,547,097,000 455,159,000 4,091,938,000
Infrastructure Finance Unit Limited
100% 411,364,612 404,540,089 6,824,524
National Employment Savings Trust (NEST) Corporation
Government control4
80,709,000 415,277,000 (334,568,000)
NHS Property Services Limited
100% 4,020,266,000 958,137,000 3,062,129,000
Pension Protection Fund
Government control
35,251,100,000 31,615,400,000 3,635,700,000
Student Loans Company Limited
100% 75,682,000 104,395,000 (28,713,000) 42,176,000,000 64,144,000,000
UK Asset Resolution Limited
100% 66,142,300,000 59,089,200,000 7,053,100,000
UK Financial Investments Limited
100% 930,000 930,000 0
UK Green Investment Bank Plc
100% 1,165,323,000 183,964,000 981,359,000
UKAR Corporate Services Limited
100% 4,731,000 4,731,000 0
Total for the 100% government owned/implicit guaranteed companies
– 136,496,509,612 113,758,150,089 22,738,359,524 42,176,000,000 78,572,798,000

Financial institutions landscape Appendix Six 69
Assets and liabilities of policy-related institutions
Company/scheme name
Government ownership
Total assets on balance
sheet£
Total liabilities on balance
sheet£
Net assets/(liabilities)
£
Other assets identified
£
Other liabilities identified1
£
Big Society Capital Limited
0% 301,587,000 1,827,000 299,760,000
Global Climate Partnership Fund
19% 169,345,695 94,630,212 74,715,482
Green Deal Finance Company Limited
0% 31,609,540 77,152,690 (45,543,150)
Guaranteed Export Finance Corporation Plc
0% 118,025,000 117,863,000 162,000
MyCSP Limited 24% 30,688,000 11,121,000 19,567,000
National Employment Savings Trust (NEST) Pension scheme
0% 464,871,000 5,999,000 458,872,000
Pool Reinsurance Company Limited
0% 5,715,463,000 334,909,000 5,380,554,000
Private Infrastructure Development Group
70% funding 400,563,034 65,340,906 335,222,127
Salix Finance Limited 0% 131,171,378 79,871,020 51,300,358
The Carbon Trust 9% 76,751,000 39,163,000 37,588,000
The Housing Finance Corporation Limited
£1 of £7 3,439,160,000 3,422,595,000 16,565,000
The Start-Up Loans Company Limited
0% 73,462,099 73,393,094 69,005
Total for companies with a minority stake
– 10,952,696,745 4,323,864,923 6,628,831,823
Total for all companies
147,449,206,357 118,082,015,012 29,367,191,347 42,176,000,000 78,572,798,000
Total for all companies excluding UKAR
81,306,906,357 58,992,815,012 22,314,091,347 42,176,000,000 78,572,798,000
Notes
1 Other liabilities identifi ed refers to liabilities relating to the company/scheme but are not reported on the balance sheet of that institution, but rather elsewhere (eg on the fi nancial statement of the sponsor department).
2 DCLG has issued an unconditional and irrevocable guarantee in relation to bonds issued by AHF Plc. AHF Plc is the delivery partner for DCLG and it operates under licence.
3 The information related to the HCA is taken from the group fi nancial statements, which include both the fi nancial institution and various other unrelated functions.
4 NEST is a statutory corporation but its funding is dependent on DWP, and from the NEST annual report meets two of the ONS tests of control, namely: provision of funding accompanied by rights of control over how that funding is spent; and right to demand certain reports or information. DWP has no control or any responsibility over the scheme assets or performance of/return on the assets under management.
Source: National Audit Offi ce analysis of departmental and institutional published annual reports and accounts

70 Appendix Six Financial institutions landscape
Income and expenditure of policy-related institutions
Company/scheme name Government ownership
Revenue or income
£
Operating expenditure before tax
£
Profit/(loss)before tax1
£
Affordable Housing Finance Plc Guarantee 567,000 284,000 283,000
British Business Bank Plc 100% 17,348,000 9,521,000 7,827,000
CDC Group Plc 100% 448,600,000 30,800,000 417,800,000
Community Health Partnerships Limited 100% 329,755,000 326,286,000 3,469,000
Export Credits Guarantee Department 100% 171,980,000 42,528,000 129,452,000
Financial Services Compensation Scheme Limited
100% 795,504,000 795,461,000 43,000
Help to Buy (HMT) Limited 100% 8,035,000 8,035,000 0
Homes and Communities Agency2 100% 245,079,000 1,324,004,000 (1,039,032,000)3
Infrastructure Finance Unit Limited 100% 7,631,895 7,631,895 0
Infrastructure UK (a unit of HMT responsible for the UK guarantees scheme)
100% 5,048,000 8,429,000 (3,381,000)
National Employment Savings Trust (NEST) Corporation
Government control
18,542,000 98,692,000 (80,150,000)
NHS Property Services Limited 100% 791,486,000 946,900,000 (155,414,000)
Pension Protection Fund Government control
5,199,300,000 4,022,900,000 1,176,400,000
Student Loans Company Limited 100% 134,427,000 134,745,000 (318,000)
UK Asset Resolution Limited 100% 2,251,500,000 1,279,200,000 972,300,000
UK Financial Investments Limited 100% 3,558,000 3,558,000 0
UK Green Investment Bank Plc 100% 28,193,000 28,097,000 96,000
UKAR Corporate Services Limited 100% 1,824,000 1,806,000 18,000
Total for the 100% government owned/ guaranteed companies
– 10,458,377,895 9,068,877,895 1,429,393,000
Big Society Capital Limited 0% 2,925,000 4,623,000 (1,698,000)
Global Climate Partnership Fund 19% 5,788,320 3,543,249 2,245,0714
Green Deal Finance Company Limited 0% 1,021,488 15,139,049 (14,117,561)
Guaranteed Export Finance Corporation Plc 0% 8,362,000 8,361,000 1,000
MyCSP Limited 24% 42,149,000 36,905,000 5,244,000
National Employment Savings Trust (NEST) Pension Scheme
0% 302,962,000 6,519,000 296,443,000

Financial institutions landscape Appendix Six 71
Income and expenditure of policy-related institutions
Company/scheme name Government ownership
Revenue or income
£
Operating expenditure before tax
£
Profit/(loss)before tax1
£
Pool Reinsurance Company Limited 0% 485,459,000 156,021,000 329,438,000
Private Infrastructure Development Group 70% funding 24,751,373 11,882,945 12,868,428
Salix Finance Limited 0% 14,776,634 16,450,624 (1,673,990)
The Carbon Trust 9% 36,825,000 46,714,000 (9,889,000)
The Housing Finance Corporation Limited £1 of £7 190,660,000 186,006,000 4,654,000
The Start-Up Loans Company Limited 0% 25,676,004 25,606,999 69,005
Total for companies with a minority stake – 1,141,355,819 517,771,866 623,583,953
Total for all companies 11,599,733,714 9,586,649,761 2,052,976,953
Total for all companies excluding HCA and UKAR
9,103,154,714 6,983,445,761 2,119,708,953
Notes
1 For consistency, profi t/loss is reported before taxation. Revenue (income) minus operating expenditure (before tax) may not necessarily equate the profi t/loss before tax fi gure.
2 The information related to the HCA is taken from the group fi nancial statements, which include both the fi nancial institution and various other unrelated functions.
3 The loss is mainly grant expenditure of £983,159,000, which is fully funded by DCLG and is not directly related to any fi nancial institution activity.
4 Global Climate Partnership fund paid a dividend of circa £2,155,440 – of which the department received £0.
Source: National Audit Offi ce analysis of departmental and institutional published annual reports and accounts
Like many institutions mentioned in this report, the HCA undertakes non-financial services activities. It has provided us the following estimate of income and expenditure relating solely to its financial services activities. These figures are not disclosed in its published report and accounts, and we have not audited them.
Homes and Communities Agency – financial institution only
13,006,000 22,678,000 15,354,000 (includes interest
receivable of 24,173,000)
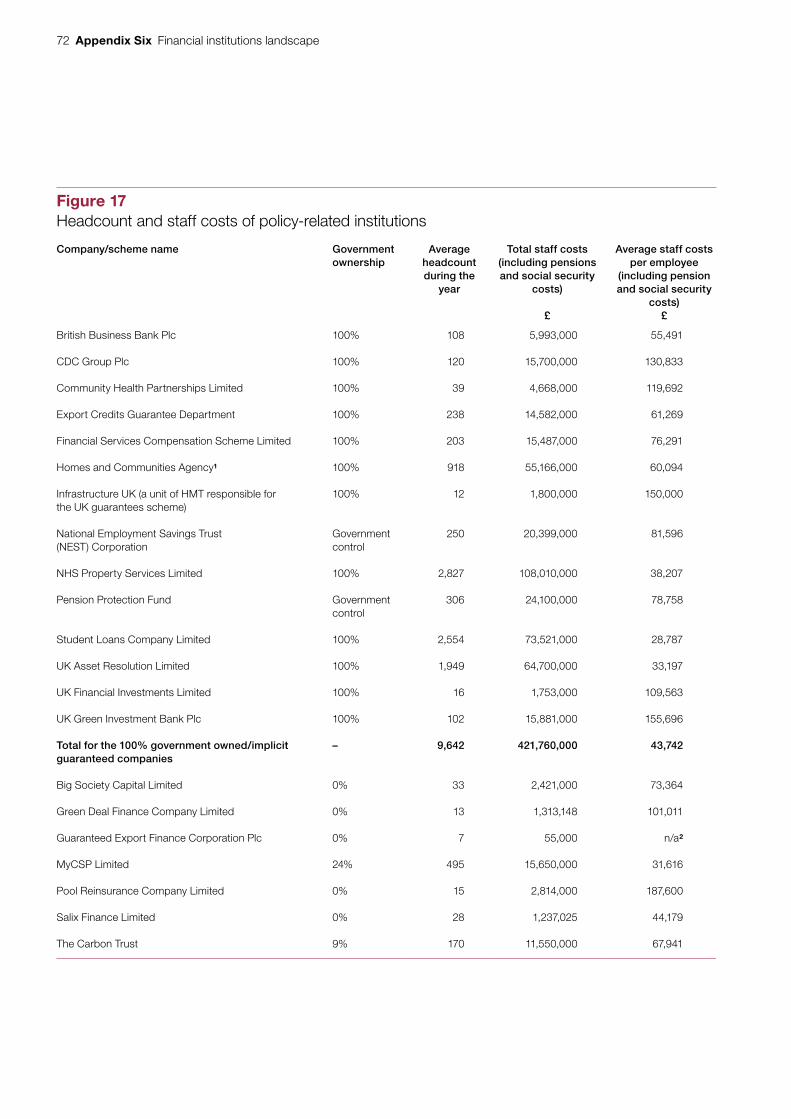
72 Appendix Six Financial institutions landscape
Figure 17Headcount and staff costs of policy-related institutions
Company/scheme name Government ownership
Average headcount during the
year
Total staff costs (including pensions and social security
costs)
£
Average staff costs per employee
(including pension and social security
costs)£
British Business Bank Plc 100% 108 5,993,000 55,491
CDC Group Plc 100% 120 15,700,000 130,833
Community Health Partnerships Limited 100% 39 4,668,000 119,692
Export Credits Guarantee Department 100% 238 14,582,000 61,269
Financial Services Compensation Scheme Limited 100% 203 15,487,000 76,291
Homes and Communities Agency1 100% 918 55,166,000 60,094
Infrastructure UK (a unit of HMT responsible for the UK guarantees scheme)
100% 12 1,800,000 150,000
National Employment Savings Trust (NEST) Corporation
Government control
250 20,399,000 81,596
NHS Property Services Limited 100% 2,827 108,010,000 38,207
Pension Protection Fund Government control
306 24,100,000 78,758
Student Loans Company Limited 100% 2,554 73,521,000 28,787
UK Asset Resolution Limited 100% 1,949 64,700,000 33,197
UK Financial Investments Limited 100% 16 1,753,000 109,563
UK Green Investment Bank Plc 100% 102 15,881,000 155,696
Total for the 100% government owned/implicit guaranteed companies
– 9,642 421,760,000 43,742
Big Society Capital Limited 0% 33 2,421,000 73,364
Green Deal Finance Company Limited 0% 13 1,313,148 101,011
Guaranteed Export Finance Corporation Plc 0% 7 55,000 n/a2
MyCSP Limited 24% 495 15,650,000 31,616
Pool Reinsurance Company Limited 0% 15 2,814,000 187,600
Salix Finance Limited 0% 28 1,237,025 44,179
The Carbon Trust 9% 170 11,550,000 67,941
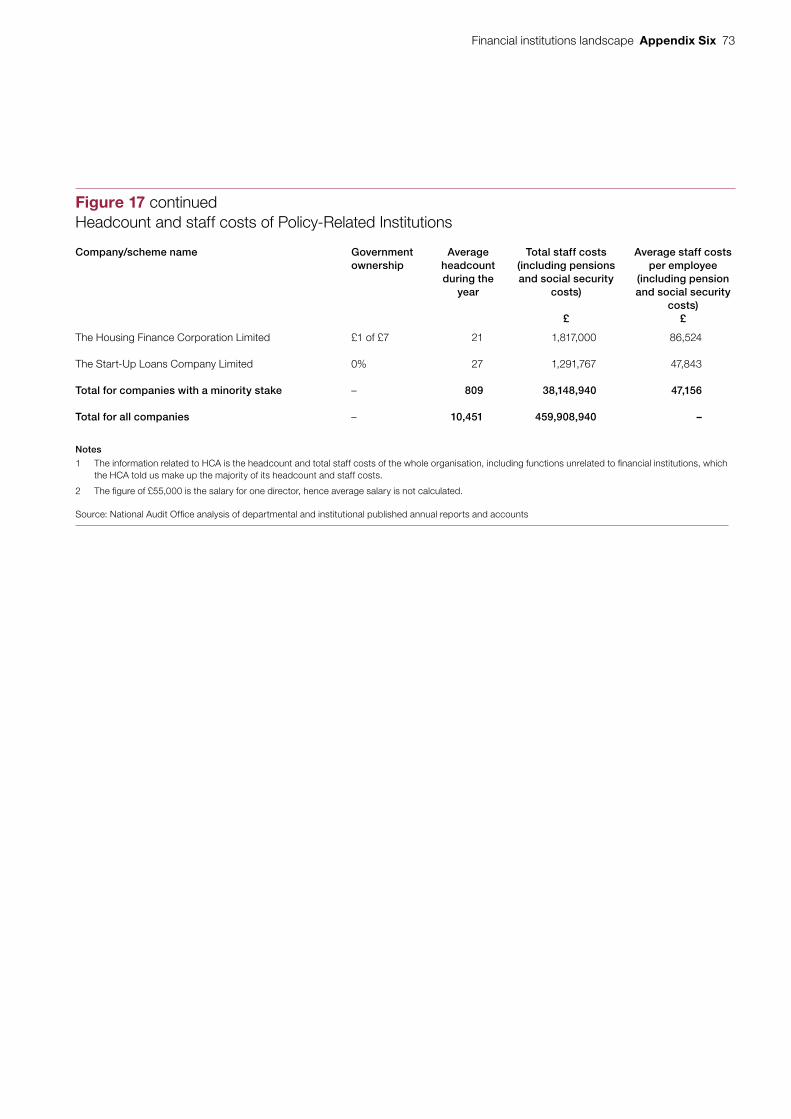
Financial institutions landscape Appendix Six 73
Company/scheme name Government ownership
Average headcount during the
year
Total staff costs (including pensions and social security
costs)
£
Average staff costs per employee
(including pension and social security
costs)£
The Housing Finance Corporation Limited £1 of £7 21 1,817,000 86,524
The Start-Up Loans Company Limited 0% 27 1,291,767 47,843
Total for companies with a minority stake – 809 38,148,940 47,156
Total for all companies – 10,451 459,908,940 –
Notes
1 The information related to HCA is the headcount and total staff costs of the whole organisation, including functions unrelated to fi nancial institutions, which the HCA told us make up the majority of its headcount and staff costs.
2 The fi gure of £55,000 is the salary for one director, hence average salary is not calculated.
Source: National Audit Offi ce analysis of departmental and institutional published annual reports and accounts
Figure 17 continuedHeadcount and staff costs of Policy-Related Institutions

This report has been printed on Evolution Digital Satin and contains material sourced from responsibly managed and sustainable forests certified in accordance with the FSC (Forest Stewardship Council).
The wood pulp is totally recyclable and acid-free. Our printers also have full ISO 14001 environmental accreditation, which ensures that they have effective procedures in place to manage waste and practices that may affect the environment.

£10.00
9 781786 040022
ISBN 978-1-78604-002-2
Design and Production by NAO Communications DP Ref: 10598-001