Embed Size (px)
Citation preview

Q1 2015Financial Information

Financial Information
03 Key Figures
06 Interim Consolidated Financial Information (unaudited)
29 SupplementalReconciliationsandDefinitions
06 Interim Consolidated Income Statements
07 Interim Condensed Consolidated
Statements of Comprehensive Income
08 Interim Consolidated Balance Sheets
09 Interim Consolidated Statements of Cash Flows
10 Interim Consolidated Statements of
Changes in Stockholders’ Equity
11 Notes to the Interim Consolidated
Financial Information

3 Q1 2015 | Financial Information
Change
($ in millions, unless otherwise indicated) Q1 2015 Q1 2014 US$ Like-for-like1
Orders 10,404 10,358 0% +15%
Revenues 8,555 9,471 -10% +3%
Operational EBITA2 949 1,039 -9% +5%
as % of operational revenues1 11.1% 11.0% +0.1 pts
Net income 564 544 +4%
Basic earnings per share ($) 0.25 0.24
Operational earnings per share1 ($) (constant currency basis) 0.31 0.29
Cash flow from operating activities 53 (45) n.a.1 For a reconciliation of non-GAAP measures see Supplemental Reconciliations and Definitions on page 29. 2 For a reconciliation of Operational EBITA to Income from continuing operations before taxes see Note 11 to the Interim Consolidated Financial Information (unaudited) on page 26.
Key Figures
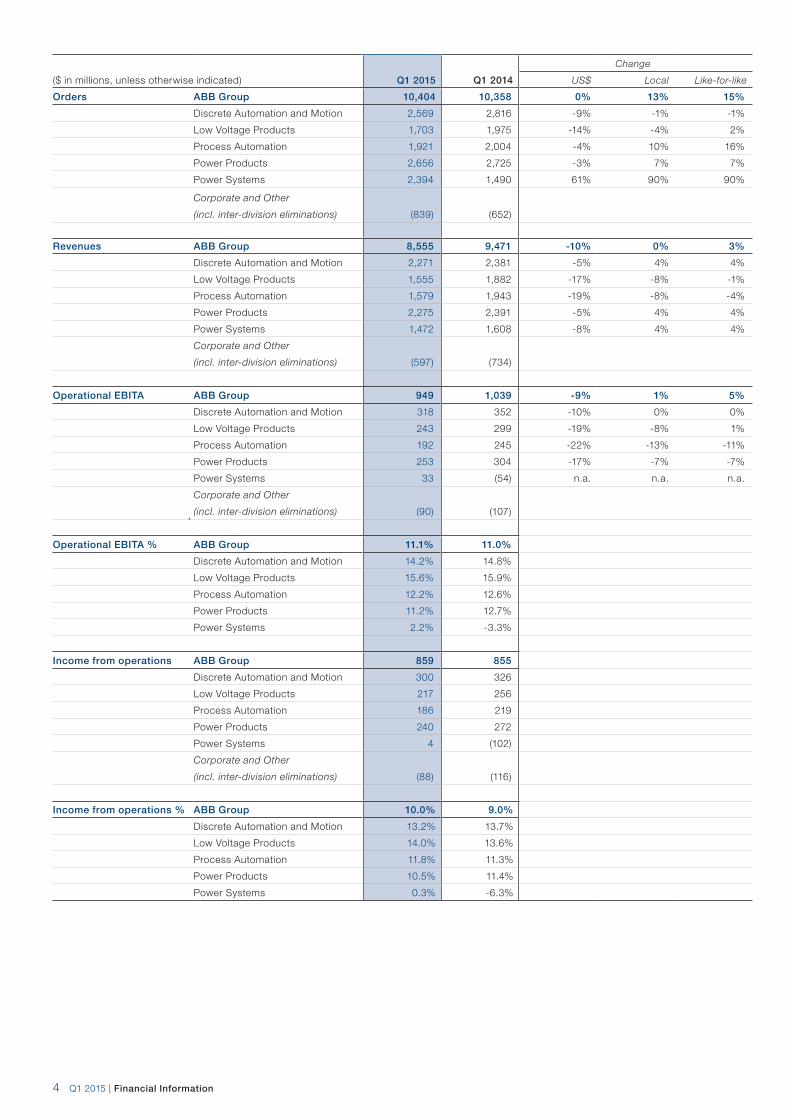
4 Q1 2015 | Financial Information
Change
($ in millions, unless otherwise indicated) Q1 2015 Q1 2014 US$ Local Like-for-like
Orders ABB Group 10,404 10,358 0% 13% 15%
Discrete Automation and Motion 2,569 2,816 -9% -1% -1%
Low Voltage Products 1,703 1,975 -14% -4% 2%
Process Automation 1,921 2,004 -4% 10% 16%
Power Products 2,656 2,725 -3% 7% 7%
Power Systems 2,394 1,490 61% 90% 90%
Corporate and Other
(incl. inter-division eliminations) (839) (652)
Revenues ABB Group 8,555 9,471 -10% 0% 3%
Discrete Automation and Motion 2,271 2,381 -5% 4% 4%
Low Voltage Products 1,555 1,882 -17% -8% -1%
Process Automation 1,579 1,943 -19% -8% -4%
Power Products 2,275 2,391 -5% 4% 4%
Power Systems 1,472 1,608 -8% 4% 4%
Corporate and Other
(incl. inter-division eliminations) (597) (734)
Operational EBITA ABB Group 949 1,039 -9% 1% 5%
Discrete Automation and Motion 318 352 -10% 0% 0%
Low Voltage Products 243 299 -19% -8% 1%
Process Automation 192 245 -22% -13% -11%
Power Products 253 304 -17% -7% -7%
Power Systems 33 (54) n.a. n.a. n.a.
Corporate and Other
(incl. inter-division eliminations) (90) (107)
Operational EBITA % ABB Group 11.1% 11.0%
Discrete Automation and Motion 14.2% 14.8%
Low Voltage Products 15.6% 15.9%
Process Automation 12.2% 12.6%
Power Products 11.2% 12.7%
Power Systems 2.2% -3.3%
Income from operations ABB Group 859 855
Discrete Automation and Motion 300 326
Low Voltage Products 217 256
Process Automation 186 219
Power Products 240 272
Power Systems 4 (102)
Corporate and Other
(incl. inter-division eliminations) (88) (116)
Income from operations % ABB Group 10.0% 9.0%
Discrete Automation and Motion 13.2% 13.7%
Low Voltage Products 14.0% 13.6%
Process Automation 11.8% 11.3%
Power Products 10.5% 11.4%
Power Systems 0.3% -6.3%

5 Q1 2015 | Financial Information
Operational EBITA
($ in millions, unless otherwise indicated) ABB
DiscreteAutomation and Motion
Low Voltage Products
ProcessAutomation
Power Products
Power Systems
Q1 15 Q1 14 Q1 15 Q1 14 Q1 15 Q1 14 Q1 15 Q1 14 Q1 15 Q1 14 Q1 15 Q1 14
Revenues 8,555 9,471 2,271 2,381 1,555 1,882 1,579 1,943 2,275 2,391 1,472 1,608
FX/commodity timing
differences in total revenues (37) 5 (34) (6) 4 1 (7) (4) (17) (4) 16 19
Operational revenues 8,518 9,476 2,237 2,375 1,559 1,883 1,572 1,939 2,258 2,387 1,488 1,627
Income (loss) from operations 859 855 300 326 217 256 186 219 240 272 4 (102)
Acquisition-related amortization 83 101 32 34 25 30 3 4 3 5 14 22
Restructuring and
restructuring-related expenses 26 47 3 1 6 8 1 20 11 8 4 8
Gains and losses from sale of businesses,
acquisition-related expenses and certain
non-operational items 11 11 – (3) 1 4 (1) 1 1 5 – 1
FX/commodity timing
differences in income from operations (30) 25 (17) (6) (6) 1 3 1 (2) 14 11 17
Operational EBITA 949 1,039 318 352 243 299 192 245 253 304 33 (54)
Operational EBITA margin (%) 11.1 11.0 14.2 14.8 15.6 15.9 12.2 12.6 11.2 12.7 2.2 -3.3
Orders received and revenues by region
($ in millions, unless otherwise indicated) Orders received Change Revenues Change
Q1 15 Q1 14 US$ Local
Like-
for-like Q1 15 Q1 14 US$ Local
Like-
for-like
Europe 3,962 3,891 2% 25% 27% 2,804 3,375 -17% 0% 2%
The Americas 2,739 2,763 -1% 4% 9% 2,652 2,732 -3% 2% 8%
Asia, Middle East and Africa 3,703 3,704 0% 7% 8% 3,099 3,364 -8% -2% 0%
ABB Group 10,404 10,358 0% 13% 15% 8,555 9,471 -10% 0% 3%

6 Q1 2015 | Financial Information
ABB Ltd Interim Consolidated Income Statements (unaudited)
Three months ended
($ in millions, except per share data in $) Mar. 31, 2015 Mar. 31, 2014
Sales of products 7,130 7,937
Sales of services 1,425 1,534
Total revenues 8,555 9,471
Cost of products (5,194) (5,794)
Cost of services (860) (950)
Total cost of sales (6,054) (6,744)
Gross profit 2,501 2,727
Selling, general and administrative expenses (1,309) (1,507)
Non-order related research and development expenses (330) (365)
Other income (expense), net (3) –
Income from operations 859 855
Interest and dividend income 19 17
Interest and other finance expense (71) (84)
Income from continuing operations before taxes 807 788
Provision for taxes (230) (225)
Income from continuing operations, net of tax 577 563
Income (loss) from discontinued operations, net of tax 4 (1)
Net income 581 562
Net income attributable to noncontrolling interests (17) (18)
Net income attributable to ABB 564 544
Amounts attributable to ABB shareholders:
Income from continuing operations, net of tax 560 545
Net income 564 544
Basic earnings per share attributable to ABB shareholders:
Income from continuing operations, net of tax 0.25 0.24
Net income 0.25 0.24
Diluted earnings per share attributable to ABB shareholders:
Income from continuing operations, net of tax 0.25 0.24
Net income 0.25 0.24
Weighted-average number of shares outstanding (in millions) used to compute:
Basic earnings per share attributable to ABB shareholders 2,251 2,301
Diluted earnings per share attributable to ABB shareholders 2,256 2,311
See Notes to the Interim Consolidated Financial Information
Interim Consolidated Financial Information

7 Q1 2015 | Financial Information
Three months ended
($ in millions) Mar. 31, 2015 Mar. 31, 2014
Total comprehensive income (loss), net of tax (84) 489
Total comprehensive income attributable to noncontrolling interests, net of tax (17) (15)
Total comprehensive income (loss) attributable to ABB shareholders, net of tax (101) 474
See Notes to the Interim Consolidated Financial Information
ABB Ltd Interim Condensed Consolidated Statements of Comprehensive Income (unaudited)
8 Q1 2015 | Financial Information
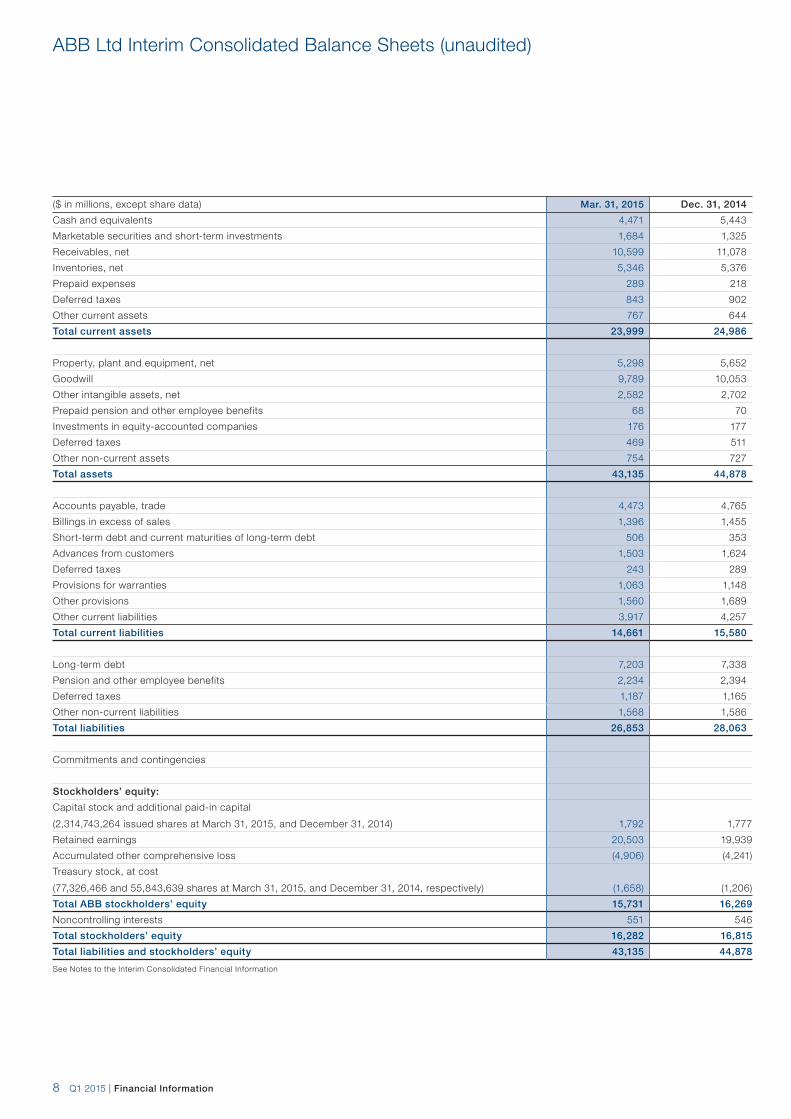
ABB Ltd Interim Consolidated Balance Sheets (unaudited)
($ in millions, except share data) Mar. 31, 2015 Dec. 31, 2014
Cash and equivalents 4,471 5,443
Marketable securities and short-term investments 1,684 1,325
Receivables, net 10,599 11,078
Inventories, net 5,346 5,376
Prepaid expenses 289 218
Deferred taxes 843 902
Other current assets 767 644
Total current assets 23,999 24,986
Property, plant and equipment, net 5,298 5,652
Goodwill 9,789 10,053
Other intangible assets, net 2,582 2,702
Prepaid pension and other employee benefits 68 70
Investments in equity-accounted companies 176 177
Deferred taxes 469 511
Other non-current assets 754 727
Total assets 43,135 44,878
Accounts payable, trade 4,473 4,765
Billings in excess of sales 1,396 1,455
Short-term debt and current maturities of long-term debt 506 353
Advances from customers 1,503 1,624
Deferred taxes 243 289
Provisions for warranties 1,063 1,148
Other provisions 1,560 1,689
Other current liabilities 3,917 4,257
Total current liabilities 14,661 15,580
Long-term debt 7,203 7,338
Pension and other employee benefits 2,234 2,394
Deferred taxes 1,187 1,165
Other non-current liabilities 1,568 1,586
Total liabilities 26,853 28,063
Commitments and contingencies
Stockholders’ equity:
Capital stock and additional paid-in capital
(2,314,743,264 issued shares at March 31, 2015, and December 31, 2014) 1,792 1,777
Retained earnings 20,503 19,939
Accumulated other comprehensive loss (4,906) (4,241)
Treasury stock, at cost
(77,326,466 and 55,843,639 shares at March 31, 2015, and December 31, 2014, respectively) (1,658) (1,206)
Total ABB stockholders’ equity 15,731 16,269
Noncontrolling interests 551 546
Total stockholders’ equity 16,282 16,815
Total liabilities and stockholders’ equity 43,135 44,878
See Notes to the Interim Consolidated Financial Information

9 Q1 2015 | Financial Information
ABB Ltd Interim Consolidated Statements of Cash Flows (unaudited)
Three months ended
($ in millions) Mar. 31, 2015 Mar. 31, 2014
Operating activities:
Net income 581 562
Adjustments to reconcile net income to net cash provided by (used in) operating activities:
Depreciation and amortization 295 333
Pension and other employee benefits 14 (28)
Deferred taxes 31 (13)
Net loss (gain) from sale of property, plant and equipment (10) (8)
Net loss (gain) from sale of businesses (4) –
Net loss (gain) from derivatives and foreign exchange (4) 54
Other 26 15
Changes in operating assets and liabilities:
Trade receivables, net (101) (102)
Inventories, net (360) (223)
Trade payables (21) (191)
Accrued liabilities (185) (217)
Billings in excess of sales 15 (158)
Provisions, net (73) (99)
Advances from customers (45) 59
Income taxes payable and receivable (51) 48
Other assets and liabilities, net (55) (77)
Net cash provided by (used in) operating activities 53 (45)
Investing activities:
Purchases of marketable securities (available-for-sale) (469) (84)
Purchases of short-term investments (459) (438)
Purchases of property, plant and equipment and intangible assets (176) (203)
Acquisition of businesses (net of cash acquired) and increases in cost- and equity-accounted companies (36) (3)
Proceeds from sales of marketable securities (available-for-sale) 12 14
Proceeds from maturity of marketable securities (available-for-sale) 275 68
Proceeds from short-term investments 176 23
Proceeds from sales of property, plant and equipment 6 10
Proceeds from sales of businesses (net of transaction costs
and cash disposed) and cost- and equity-accounted companies – 2
Other investing activities 98 62
Net cash used in investing activities (573) (549)
Financing activities:
Net changes in debt with original maturities of 90 days or less 164 988
Increase in debt 40 3
Repayment of debt (14) (13)
Delivery of shares – 1
Purchases of treasury stock (401) –
Dividends paid to noncontrolling shareholders (13) (7)
Other financing activities 7 9
Net cash provided by (used in) financing activities (217) 981
Effects of exchange rate changes on cash and equivalents (235) (6)
Net change in cash and equivalents – continuing operations (972) 381
Cash and equivalents, beginning of period 5,443 6,021
Cash and equivalents, end of period 4,471 6,402
Supplementary disclosure of cash flow information:
Interest paid 53 67
Taxes paid 256 198
See Notes to the Interim Consolidated Financial Information

10 Q1 2015 | Financial Information
ABB Ltd Interim Consolidated Statements of Changes in Stockholders’ Equity (unaudited)
Accumulated other comprehensive loss
($ in millions)
Balance at January 1, 2014 1,750 19,186 (431) 7 (1,610) 22 (2,012) (246) 18,678 530 19,208
Comprehensive income:
Net income 544 544 18 562
Foreign currency translation adjustments, net of tax of $(3) (73) (73) (73) (3) (76)
Effect of change in fair value of available-for-sale securities, net of tax of $0 2 2 2 2
Unrecognized income (expense) related to pensions and other postretirement plans, net of tax of $6 13 13 13 13
Change in derivatives qualifying as cash flow hedges, net of tax of $(4) (12) (12) (12) (12)
Total comprehensive income (loss) 474 15 489
Dividends paid to noncontrolling shareholders – (12) (12)
Share-based payment arrangements 20 20 20
Delivery of shares (9) 10 1 1
Balance at March 31, 2014 1,761 19,730 (504) 9 (1,597) 10 (2,082) (236) 19,173 533 19,706
Balance at January 1, 2015 1,777 19,939 (2,102) 13 (2,131) (21) (4,241) (1,206) 16,269 546 16,815
Comprehensive income:
Net income 564 564 17 581
Foreign currency translation adjustments, net of tax of $(1) (831) (831) (831) (831)
Effect of change in fair value of available-for-sale securities, net of tax of $0 3 3 3 3
Unrecognized income (expense) related to pensions and other postretirement plans, net of tax of $59 174 174 174 174
Change in derivatives qualifying as cash flow hedges, net of tax of $(3) (11) (11) (11) (11)
Total comprehensive income (loss) (101) 17 (84)
Dividends paid to noncontrolling shareholders – (12) (12)
Share-based payment arrangements 15 15 15
Purchases of treasury stock (452) (452) (452)
Balance at March 31, 2015 1,792 20,503 (2,933) 16 (1,957) (32) (4,906) (1,658) 15,731 551 16,282
See Notes to the Interim Consolidated Financial Information
Cap
ital s
tock
and
addi
tiona
l pai
d-in
cap
ital
Ret
aine
d ea
rnin
gsFo
reig
n cu
rren
cy
tran
slat
ion
adju
stm
ents
Unr
ealiz
ed g
ains
(los
ses)
on
avai
labl
e-fo
r-sa
le s
ecur
ities
Pen
sion
and
oth
er
post
retir
emen
t pla
n ad
just
men
ts
Unr
ealiz
ed g
ains
(los
ses)
of
cash
flow
hed
ge d
eriv
ativ
es
Tota
l acc
u mul
ated
oth
er
com
pre
hens
ive
loss
Trea
sury
sto
ck
Tota
l AB
B s
tock
hold
ers’
eq
uity
Non
cont
rolli
ng in
tere
sts
Tota
l sto
ckho
lder
s’ e
qui
ty

11 Q1 2015 | Financial Information
ABB Ltd and its subsidiaries (collectively, the Company) together form a leading global company in power and automa-tion technologies that enable utility and industry customers to improve their performance while lowering environmental impact. The Company works with customers to engineer and install networks, facilities and plants with particular emphasis on enhancing efficiency, reliability and productivity for customers who generate, convert, transmit, distribute and consume energy.
The Company’s Interim Consolidated Financial Information is prepared in accordance with United States of America generally accepted accounting principles (U.S. GAAP) for interim financial reporting. As such, the Interim Consolidated Financial Information does not include all the information and notes required under U.S. GAAP for annual consolidated financial statements. Therefore, such financial information should be read in conjunction with the audited consolidated financial statements in the Company’s Annual Report for the year ended December 31, 2014.
The preparation of financial information in conformity with U.S. GAAP requires management to make assumptions and estimates that directly affect the amounts reported in the Interim Consolidated Financial Information. The most signifi-cant, difficult and subjective of such accounting assumptions and estimates include:– assumptions and projections, principally related to future material, labor and project-related overhead costs, used in
determining the percentage-of-completion on projects,– estimates of loss contingencies associated with litigation or threatened litigation and other claims and inquiries, envi
ronmental damages, product warranties, regulatory and other proceedings,– assumptions used in the calculation of pension and postretirement benefits and the fair value of pension plan assets, – recognition and measurement of current and deferred income tax assets and liabilities (including the measurement of
uncertain tax positions),– growth rates, discount rates and other assumptions used in testing goodwill for impairment,– assumptions used in determining inventory obsolescence and net realizable value,– estimates and assumptions used in determining the fair values of assets and liabilities assumed in business combinations,– growth rates, discount rates and other assumptions used to determine impairment of long-lived assets, and– assessment of the allowance for doubtful accounts.
The actual results and outcomes may differ from the Company’s estimates and assumptions.
A portion of the Company’s activities (primarily long-term construction activities) has an operating cycle that exceeds one year. For classification of current assets and liabilities related to such activities, the Company elected to use the duration of the individual contracts as its operating cycle. Accordingly, there are accounts receivable, inventories and provisions related to these contracts which will not be realized within one year that have been classified as current.
In the opinion of management, the unaudited Interim Consolidated Financial Information contains all necessary adjust-ments to present fairly the financial position, results of operations and cash flows for the reported interim periods. Man-agement considers all such adjustments to be of a normal recurring nature.
The Interim Consolidated Financial Information is presented in United States dollars ($) unless otherwise stated. Certain amounts in the Consolidated Statements of Cash Flows reported for prior periods in the Interim Consolidated Financial Information have been reclassified to conform to the current period presentation. These reclassifications were within Net cash provided by operating activities.
Revenue from contracts with customersIn May 2014, an accounting standard update was issued to clarify the principles for recognizing revenues from contracts with customers. The update, which supersedes substantially all existing revenue recognition guidance, provides a single comprehensive model for recognizing revenues on the transfer of promised goods or services to customers in an amount that reflects the consideration that is expected to be received for those goods or services. Under the standard it is pos-sible that more judgments and estimates would be required than under existing standards, including identifying the sepa-rate performance obligations in a contract, estimating any variable consideration elements, and allocating the transaction price to each separate performance obligation. The update also requires additional disclosures about the nature, amount, timing and uncertainty of revenue and cash flows arising from contracts with customers.
The update is effective for the Company for annual and interim periods beginning January 1, 2017, and is to be applied either (i) retrospectively to each prior reporting period presented, with the option to elect certain defined practical expe-dients, or (ii) retrospectively with the cumulative effect of initially applying the update recognized at the date of adoption in retained earnings (with additional disclosure as to the impact on individual financial statement lines affected). The Company is currently evaluating the impact of this update on its consolidated financial statements.
Note 1The Company and basis of presentation
Note 2 Recent accounting pronouncementsApplicable for future periods
Notes to the Interim Consolidated Financial Information (unaudited)

12 Q1 2015 | Financial Information
Simplifying the presentation of debt issuance costsIn April 2015, an accounting standard update was issued to simplify the presentation of debt issuance costs. Under the update, the Company would present debt issuance costs related to a recognized debt liability in the balance sheet as a direct deduction from the carrying amount of that debt liability rather than as a non-current asset. The existing recogni-tion and measurement guidance for debt issuance costs is not affected by this accounting standard update which is effective for the Company for annual and interim periods beginning January 1, 2016, and is applicable retrospectively. Early adoption is permitted for financial statements that have not been previously issued. The Company does not believe that this update will have a material impact on its consolidated financial statements.
Cash and equivalents, marketable securities and short-term investments consisted of the following:
March 31, 2015
($ in millions) Cost basis
Gross
unrealized
gains
Gross
unrealized
losses Fair value
Cash and
equivalents
Marketable securities
and short-term
investments
Cash 1,617 1,617 1,617 –
Time deposits 3,189 3,189 2,768 421
Other short-term investments 227 227 – 227
Debt securities available-for-sale:
U.S. government obligations 135 3 (1) 137 – 137
Other government obligations 2 – – 2 – 2
Corporate 658 4 – 662 86 576
Equity securities available-for-sale 308 13 – 321 – 321
Total 6,136 20 (1) 6,155 4,471 1,684
December 31, 2014
($ in millions) Cost basis
Gross
unrealized
gains
Gross
unrealized
losses Fair value
Cash and
equivalents
Marketable securities
and short-term
investments
Cash 2,218 2,218 2,218 –
Time deposits 3,340 3,340 3,140 200
Other short-term investments 225 225 – 225
Debt securities available-for-sale:
U.S. government obligations 135 2 (1) 136 – 136
Other government obligations 2 – – 2 – 2
Corporate 734 4 (1) 737 85 652
Equity securities available-for-sale 98 12 – 110 – 110
Total 6,752 18 (2) 6,768 5,443 1,325
Included in Other short-term investments at March 31, 2015, and December 31, 2014, are receivables of $220 million and $219 million, respectively, representing reverse repurchase agreements. These collateralized lendings, made to a financial institution, have maturity dates of less than one year.
Included in “Other non-current assets” are certain held-to-maturity marketable securities. At March 31, 2015, the amor-tized cost, gross unrecognized gain and fair value (based on quoted market prices) of these securities were $86 million, $25 million and $111 million, respectively. At December 31, 2014, the amortized cost, gross unrecognized gain and fair value (based on quoted market prices) of these securities were $95 million, $14 million and $109 million, respectively. These securities are pledged as security for certain outstanding deposit liabilities and the funds received at the respec-tive maturity dates of the securities will only be available to the Company for repayment of these obligations.
Non-current assets
Note 2 Recent accounting pronouncements, continued
Note 3 Cash and equivalents, marketable securities and short-term investments Current assets

13 Q1 2015 | Financial Information
The Company is exposed to certain currency, commodity, interest rate and equity risks arising from its global operating, financing and investing activities. The Company uses derivative instruments to reduce and manage the economic impact of these exposures.
Due to the global nature of the Company’s operations, many of its subsidiaries are exposed to currency risk in their operating activities from entering into transactions in currencies other than their functional currency. To manage such currency risks, the Company’s policies require the subsidiaries to hedge their foreign currency exposures from binding sales and purchase contracts denominated in foreign currencies. For forecasted foreign currency denominated sales of standard products and the related foreign currency denominated purchases, the Company’s policy is to hedge up to a maximum of 100 percent of the forecasted foreign currency denominated exposures, depending on the length of the forecasted exposures. Forecasted exposures greater than 12 months are not hedged. Forward foreign exchange con-tracts are the main instrument used to protect the Company against the volatility of future cash flows (caused by changes in exchange rates) of contracted and forecasted sales and purchases denominated in foreign currencies. In addition, within its treasury operations, the Company primarily uses foreign exchange swaps and forward foreign exchange contracts to manage the currency and timing mismatches arising in its liquidity management activities.
Various commodity products are used in the Company’s manufacturing activities. Consequently it is exposed to volatility in future cash flows arising from changes in commodity prices. To manage the price risk of commodities, the Company’s policies require that the subsidiaries hedge the commodity price risk exposures from binding contracts, as well as at least 50 percent (up to a maximum of 100 percent) of the forecasted commodity exposure over the next 12 months or longer (up to a maximum of 18 months). Primarily swap contracts are used to manage the associated price risks of commodities.
The Company has issued bonds at fixed rates. Interest rate swaps are used to manage the interest rate risk associated with certain debt and generally such swaps are designated as fair value hedges. In addition, from time to time, the Company uses instruments such as interest rate swaps, interest rate futures, bond futures or forward rate agreements to manage interest rate risk arising from the Company’s balance sheet structure but does not designate such instru-ments as hedges.
The Company is exposed to fluctuations in the fair value of its warrant appreciation rights (WARs) issued under its man-agement incentive plan. A WAR gives its holder the right to receive cash equal to the market price of an equivalent listed warrant on the date of exercise. To eliminate such risk, the Company has purchased cash-settled call options which entitle the Company to receive amounts equivalent to its obligations under the outstanding WARs.
In general, while the Company’s primary objective in its use of derivatives is to minimize exposures arising from its business, certain derivatives are designated and qualify for hedge accounting treatment while others either are not designated or do not qualify for hedge accounting.
Foreign exchange and interest rate derivativesThe gross notional amounts of outstanding foreign exchange and interest rate derivatives (whether designated as hedges or not) were as follows:
Type of derivative Total notional amounts
($ in millions) March 31, 2015 December 31, 2014 March 31, 2014
Foreign exchange contracts 17,871 18,564 19,060
Embedded foreign exchange derivatives 2,972 3,013 2,958
Interest rate contracts 4,057 2,242 6,702
Derivative commodity contractsThe following table shows the notional amounts of outstanding commodity derivatives (whether designated as hedges or not), on a net basis, to reflect the Company’s requirements in the various commodities:
Type of derivative Unit Total notional amounts
March 31, 2015 December 31, 2014 March 31, 2014
Copper swaps metric tonnes 53,237 46,520 43,866
Aluminum swaps metric tonnes 5,225 3,846 3,873
Nickel swaps metric tonnes – – 12
Lead swaps metric tonnes 14,325 6,550 5,175
Zinc swaps metric tonnes 125 200 275
Silver swaps ounces 1,707,460 1,996,845 1,813,511
Crude oil swaps barrels 150,700 128,000 142,000
Equity derivativesAt March 31, 2015, December 31, 2014, and March 31, 2014, the Company held 59 million, 61 million and 66 million cash-settled call options indexed to ABB Ltd shares (conversion ratio 5:1) with a total fair value of $26 million, $33 mil-lion and $50 million, respectively.
Note 4 Derivative financial instruments
Currency risk
Commodity risk
Interest rate risk
Equity risk
Volume of derivative activity

14 Q1 2015 | Financial Information
As noted above, the Company mainly uses forward foreign exchange contracts to manage the foreign exchange risk of its operations, commodity swaps to manage its commodity risks and cash-settled call options to hedge its WAR liabili-ties. Where such instruments are designated and qualify as cash flow hedges, the effective portion of the changes in their fair value is recorded in “Accumulated other comprehensive loss” and subsequently reclassified into earnings in the same line item and in the same period as the underlying hedged transaction affects earnings. Any ineffectiveness in the hedge relationship, or hedge component excluded from the assessment of effectiveness, is recognized in earnings dur-ing the current period.
At March 31, 2015, and December 31, 2014, “Accumulated other comprehensive loss” included net unrealized losses of $32 million and $21 million, respectively, net of tax, on derivatives designated as cash flow hedges. Of the amount at March 31, 2015, net losses of $22 million are expected to be reclassified to earnings in the following 12 months. At March 31, 2015, the longest maturity of a derivative classified as a cash flow hedge was 54 months.
The amount of gains or losses, net of tax, reclassified into earnings due to the discontinuance of cash flow hedge accounting and the amount of ineffectiveness in cash flow hedge relationships directly recognized in earnings were not significant in the three months ended March 31, 2015 and 2014.
The pre-tax effects of derivative instruments, designated and qualifying as cash flow hedges, on “Accumulated other comprehensive loss” (OCI) and the Consolidated Income Statements were as follows:
Three months ended March 31, 2015
Type of derivative
designated as
a cash flow hedge
Gains (losses)
recognized in OCI
on derivatives
(effective portion)
Gains (losses) reclassified from OCI
into income (effective portion)
Gains (losses) recognized in income
(ineffective portion and amount
excluded from effectiveness testing)
($ in millions) Location ($ in millions) Location ($ in millions)
Foreign exchange contracts (22) Total revenues (13) Total revenues –
Total cost of sales 5 Total cost of sales –
Commodity contracts (2) Total cost of sales (3) Total cost of sales –
Cash-settled call options (4) SG&A expenses (1) (3) SG&A expenses (1) –
Total (28) (14) –
Three months ended March 31, 2014
Type of derivative
designated as
a cash flow hedge
Gains (losses)
recognized in OCI
on derivatives
(effective portion)
Gains (losses) reclassified from OCI
into income (effective portion)
Gains (losses) recognized in income
(ineffective portion and amount
excluded from effectiveness testing)
($ in millions) Location ($ in millions) Location ($ in millions)
Foreign exchange contracts (6) Total revenues 1 Total revenues –
Total cost of sales 3 Total cost of sales –
Commodity contracts (4) Total cost of sales (1) Total cost of sales –
Cash-settled call options (4) SG&A expenses (1) (1) SG&A expenses (1) –
Total (14) 2 –
SG&A expenses represent “Selling, general and administrative expenses”.
Net derivative losses of $11 million and net derivative gains of $1 million, both net of tax, respectively, were reclassified from “Accumulated other comprehensive loss” to earnings during the three months ended March 31, 2015 and 2014, respectively.
(1)
Note 4 Derivative financial instruments, continuedCash flow hedges

15 Q1 2015 | Financial Information
To reduce its interest rate exposure arising primarily from its debt issuance activities, the Company uses interest rate swaps. Where such instruments are designated as fair value hedges, the changes in the fair value of these instruments, as well as the changes in the fair value of the risk component of the underlying debt being hedged, are recorded as offsetting gains and losses in “Interest and other finance expense”. Hedge ineffectiveness of instruments designated as fair value hedges for the three months ended March 31, 2015 and 2014, was not significant.
The effect of derivative instruments, designated and qualifying as fair value hedges, on the Consolidated Income Statements was as follows:
Three months ended March 31, 2015
Type of derivative designated
as a fair value hedge
Gains (losses) recognized in income on derivatives
designated as fair value hedges
Gains (losses) recognized in income
on hedged item
Location ($ in millions) Location ($ in millions)
Interest rate contracts Interest and other finance expense 31 Interest and other finance expense (31)
Three months ended March 31, 2014
Type of derivative designated
as a fair value hedge
Gains (losses) recognized in income on derivatives
designated as fair value hedges
Gains (losses) recognized in income
on hedged item
Location ($ in millions) Location ($ in millions)
Interest rate contracts Interest and other finance expense 22 Interest and other finance expense (22)
Derivative instruments that are not designated as hedges or do not qualify as either cash flow or fair value hedges are economic hedges used for risk management purposes. Gains and losses from changes in the fair values of such deriva-tives are recognized in the same line in the income statement as the economically hedged transaction.
Furthermore, under certain circumstances, the Company is required to split and account separately for foreign currency derivatives that are embedded within certain binding sales or purchase contracts denominated in a currency other than the functional currency of the subsidiary and the counterparty.
The gains (losses) recognized in the Consolidated Income Statements on derivatives not designated in hedging relation-ships were as follows:
Type of derivative not designated as a hedge Gains (losses) recognized in income
Three months ended March 31,
($ in millions) Location 2015 2014
Foreign exchange contracts Total revenues (78) (23)
Total cost of sales (66) (10)
SG&A expenses (1) 12 1
Interest and other finance expense 177 4
Non-order related research and development (1) –
Embedded foreign exchange contracts Total revenues 27 10
Total cost of sales (17) –
Commodity contracts Total cost of sales (1) (22)
Interest rate contracts Interest and other finance expense (1) –
Total 52 (40)
SG&A expenses represent “Selling, general and administrative expenses”.
Fair value hedges
Derivatives not designated in hedge relationships
(1)
Note 4 Derivative financial instruments, continued

16 Q1 2015 | Financial Information
The fair values of derivatives included in the Consolidated Balance Sheets were as follows:
March 31, 2015
Derivative assets Derivative liabilities
($ in millions)
Current in
“Other current
assets”
Non-current in
“Other non-current
assets”
Current in
“Other current
liabilities”
Non-current in
“Other non-current
liabilities”
Derivatives designated as hedging instruments:
Foreign exchange contracts 7 10 22 19
Commodity contracts – – 3 –
Interest rate contracts – 116 – –
Cash-settled call options 17 8 – –
Total 24 134 25 19
Derivatives not designated as hedging instruments:
Foreign exchange contracts 322 65 488 103
Commodity contracts 13 1 18 3
Cash-settled call options 1 – – –
Embedded foreign exchange derivatives 130 49 52 35
Total 466 115 558 141
Total fair value 490 249 583 160
December 31, 2014
Derivative assets Derivative liabilities
($ in millions)
Current in
“Other current
assets”
Non-current in
“Other non-current
assets”
Current in
“Other current
liabilities”
Non-current in
“Other non-current
liabilities”
Derivatives designated as hedging instruments:
Foreign exchange contracts 9 9 20 16
Commodity contracts – – 3 –
Interest rate contracts – 85 – –
Cash-settled call options 21 11 – –
Total 30 105 23 16
Derivatives not designated as hedging instruments:
Foreign exchange contracts 156 25 369 72
Commodity contracts 4 – 19 3
Cash-settled call options 1 1 – –
Embedded foreign exchange derivatives 98 58 27 17
Total 259 84 415 92
Total fair value 289 189 438 108
Close-out netting agreements provide for the termination, valuation and net settlement of some or all outstanding trans-actions between two counterparties on the occurrence of one or more pre-defined trigger events.
Although the Company is party to close-out netting agreements with most derivative counterparties, the fair values in the tables above and in the Consolidated Balance Sheets at March 31, 2015, and December 31, 2014, have been pre-sented on a gross basis.
Note 4 Derivative financial instruments, continued

17 Q1 2015 | Financial Information
The Company’s netting agreements and other similar arrangements allow net settlements under certain conditions. As of March 31, 2015, and December 31, 2014, information related to these offsetting arrangements was as follows:
($ in millions) March 31, 2015
Type of agreement
or similar arrangement
Gross amount of
recognized assets
Derivative liabilities
eligible for set-off in
case of default
Cash collateral
received
Non-cash collateral
received Net asset exposure
Derivatives 560 (383) – – 177
Reverse repurchase
agreements 220 – – (220) –
Total 780 (383) – (220) 177
($ in millions) March 31, 2015
Type of agreement
or similar arrangement
Gross amount of
recognized liabilities
Derivative liabilities
eligible for set-off in
case of default
Cash collateral
pledged
Non-cash collateral
pledged Net liability exposure
Derivatives 656 (383) (2) – 271
Total 656 (383) (2) – 271
($ in millions) December 31, 2014
Type of agreement
or similar arrangement
Gross amount of
recognized assets
Derivative liabilities
eligible for set-off in
case of default
Cash collateral
received
Non-cash collateral
received Net asset exposure
Derivatives 322 (216) – – 106
Reverse repurchase
agreements 219 – – (219) –
Total 541 (216) – (219) 106
($ in millions) December 31, 2014
Type of agreement
or similar arrangement
Gross amount of
recognized liabilities
Derivative liabilities
eligible for set-off in
case of default
Cash collateral
pledged
Non-cash collateral
pledged Net liability exposure
Derivatives 502 (216) (3) – 283
Total 502 (216) (3) – 283
Note 4 Derivative financial instruments, continued

18 Q1 2015 | Financial Information
The Company uses fair value measurement principles to record certain financial assets and liabilities on a recurring basis and, when necessary, to record certain non-financial assets at fair value on a non-recurring basis, as well as to determine fair value disclosures for certain financial instruments carried at amortized cost in the financial statements. Financial assets and liabilities recorded at fair value on a recurring basis include foreign currency, commodity and inter-est rate derivatives, as well as cash-settled call options and available-for-sale securities. Non-financial assets recorded at fair value on a non-recurring basis include long-lived assets that are reduced to their estimated fair value due to impairments.
Fair value is the price that would be received when selling an asset or paid to transfer a liability in an orderly transaction between market participants at the measurement date. In determining fair value, the Company uses various valuation techniques including the market approach (using observable market data for identical or similar assets and liabilities), the income approach (discounted cash flow models) and the cost approach (using costs a market participant would incur to develop a comparable asset). Inputs used to determine the fair value of assets and liabilities are defined by a three-level hierarchy, depending on the reliability of those inputs. The Company has categorized its financial assets and liabilities and non-financial assets measured at fair value within this hierarchy based on whether the inputs to the valua-tion technique are observable or unobservable. An observable input is based on market data obtained from indepen-dent sources, while an unobservable input reflects the Company’s assumptions about market data.
The levels of the fair value hierarchy are as follows:Level 1: Valuation inputs consist of quoted prices in an active market for identical assets or liabilities (observable quoted
prices). Assets and liabilities valued using Level 1 inputs include listed derivatives which are actively traded such as commodity futures, interest rate futures and certain actively-traded debt securities.
Level 2: Valuation inputs consist of observable inputs (other than Level 1 inputs) such as actively-quoted prices for simi-lar assets, quoted prices in inactive markets and inputs other than quoted prices such as interest rate yield curves, credit spreads, or inputs derived from other observable data by interpolation, correlation, regression or other means. The adjustments applied to quoted prices or the inputs used in valuation models may be both observable and unobservable. In these cases, the fair value measurement is classified as Level 2 unless the unobservable portion of the adjustment or the unobservable input to the valuation model is significant, in which case the fair value measurement would be classified as Level 3. Assets and liabilities valued or disclosed using Level 2 inputs include investments in certain funds, reverse repurchase agreements, certain debt securities that are not actively traded, interest rate swaps, commodity swaps, cash-settled call options, forward foreign exchange contracts, foreign exchange swaps and forward rate agreements, time deposits, as well as financing receivables and debt.
Level 3: Valuation inputs are based on the Company’s assumptions of relevant market data (unobservable input).
Whenever quoted prices involve bid-ask spreads, the Company ordinarily determines fair values based on mid-market quotes. However, for the purpose of determining the fair value of cash-settled call options serving as hedges of the Company’s management incentive plan, bid prices are used.
When determining fair values based on quoted prices in an active market, the Company considers if the level of transac-tion activity for the financial instrument has significantly decreased, or would not be considered orderly. In such cases, the resulting changes in valuation techniques would be disclosed. If the market is considered disorderly or if quoted prices are not available, the Company is required to use another valuation technique, such as an income approach.
Note 5 Fair values

19 Q1 2015 | Financial Information
The fair values of financial assets and liabilities measured at fair value on a recurring basis were as follows:
March 31, 2015
($ in millions) Level 1 Level 2 Level 3 Total fair value
Assets
Available-for-sale securities in “Cash and equivalents”:
Debt securities—Corporate – 86 – 86
Available-for-sale securities in “Marketable securities and short-term investments”:
Equity securities – 321 – 321
Debt securities—U.S. government obligations 137 – – 137
Debt securities—Other government obligations – 2 – 2
Debt securities—Corporate – 576 – 576
Derivative assets—current in “Other current assets” – 490 – 490
Derivative assets—non-current in “Other non-current assets” – 249 – 249
Total 137 1,724 – 1,861
Liabilities
Derivative liabilities—current in “Other current liabilities” – 583 – 583
Derivative liabilities—non-current in “Other non-current liabilities” – 160 – 160
Total – 743 – 743
December 31, 2014
($ in millions) Level 1 Level 2 Level 3 Total fair value
Assets
Available-for-sale securities in “Cash and equivalents”:
Debt securities—Corporate – 85 – 85
Available-for-sale securities in “Marketable securities and short-term investments”:
Equity securities – 110 – 110
Debt securities—U.S. government obligations 136 – – 136
Debt securities—Other government obligations – 2 – 2
Debt securities—Corporate – 652 – 652
Derivative assets—current in “Other current assets” – 289 – 289
Derivative assets—non-current in “Other non-current assets” – 189 – 189
Total 136 1,327 – 1,463
Liabilities
Derivative liabilities—current in “Other current liabilities” – 438 – 438
Derivative liabilities—non-current in “Other non-current liabilities” – 108 – 108
Total – 546 – 546
The Company uses the following methods and assumptions in estimating fair values of financial assets and liabilities measured at fair value on a recurring basis:– Available-for-sale securities in “Cash and equivalents” and “Marketable securities and short-term investments”: If quoted market prices in active markets for identical assets are available, these are considered Level 1 inputs; however, when markets are not active, these inputs are considered Level 2. If such quoted market prices are not
available, fair value is determined using market prices for similar assets or present value techniques, applying an appropriate risk-free interest rate adjusted for nonperformance risk. The inputs used in present value techniques are observable and fall into the Level 2 category.
– Derivatives: The fair values of derivative instruments are determined using quoted prices of identical instruments from an active market, if available (Level 1). If quoted prices are not available, price quotes for similar instruments, appropriately adjusted, or present value techniques, based on available market data, or option pricing models are used. Cash-settled call options hedging the Company’s WAR liability are valued based on bid prices of the equiva-lent listed warrant. The fair values obtained using price quotes for similar instruments or valuation techniques repre-sent a Level 2 input unless significant unobservable inputs are used.
There were no significant non-recurring fair value measurements during the three months ended March 31, 2015 and 2014.
Note 5 Fair values, continued Recurring fair value measures
Non-recurring fair value measures

20 Q1 2015 | Financial Information
The fair values of financial instruments carried on a cost basis were as follows:
March 31, 2015
($ in millions) Carrying value Level 1 Level 2 Level 3 Total fair value
Assets
Cash and equivalents (excluding available-for-sale securities
with original maturities up to 3 months):
Cash 1,617 1,617 – – 1,617
Time deposits 2,768 – 2,768 – 2,768
Marketable securities and short-term investments
(excluding available-for-sale securities):
Time deposits 421 – 421 – 421
Receivables under reverse repurchase agreements 220 – 220 – 220
Other short-term investments 7 7 – – 7
Other non-current assets:
Loans granted 38 – 41 – 41
Held-to-maturity securities 86 – 111 – 111
Restricted cash deposits 182 60 137 – 197
Liabilities
Short-term debt and current maturities of long-term debt
(excluding capital lease obligations) 473 107 366 – 473
Long-term debt (excluding capital lease obligations) 7,097 6,004 1,428 – 7,432
Non-current deposit liabilities in “Other non-current liabilities” 206 – 245 – 245
December 31, 2014
($ in millions) Carrying value Level 1 Level 2 Level 3 Total fair value
Assets
Cash and equivalents (excluding available-for-sale securities
with original maturities up to 3 months):
Cash 2,218 2,218 – – 2,218
Time deposits 3,140 – 3,140 – 3,140
Marketable securities and short-term investments
(excluding available-for-sale securities):
Time deposits 200 – 200 – 200
Receivables under reverse repurchase agreements 219 – 219 – 219
Other short-term investments 6 6 – – 6
Other non-current assets:
Loans granted 41 – 44 – 44
Held-to-maturity securities 95 – 109 – 109
Restricted cash deposits 198 64 161 – 225
Liabilities
Short-term debt and current maturities of long-term debt
(excluding capital lease obligations) 324 115 209 – 324
Long-term debt (excluding capital lease obligations) 7,224 6,148 1,404 – 7,552
Non-current deposit liabilities in “Other non-current liabilities” 222 – 267 – 267
Disclosure about financial instruments carried on a cost basis
Note 5 Fair values, continued

21 Q1 2015 | Financial Information
The Company uses the following methods and assumptions in estimating fair values of financial instruments carried on a cost basis:– Cash and equivalents (excluding available-for-sale securities with original maturities up to 3 months), and Marketable
securities and short-term investments (excluding available-for-sale securities): The carrying amounts approximate the fair values as the items are short-term in nature.
– Other non-current assets: Includes (i) loans granted whose fair values are based on the carrying amount adjusted using a present value technique to reflect a premium or discount based on current market interest rates (Level 2 in-puts), (ii) held-to-maturity securities (see Note 3) whose fair values are based on quoted market prices in inactive mar-kets (Level 2 inputs), (iii) restricted cash whose fair values approximate the carrying amounts (Level 1 inputs) and re-stricted cash deposits pledged in respect of certain non-current deposit liabilities whose fair values are determined using a discounted cash flow methodology based on current market interest rates (Level 2 inputs).
– Short-term debt and current maturities of long-term debt (excluding capital lease obligations): Includes commercial paper, bank borrowings and overdrafts. The carrying amounts of short-term debt and current maturities of long-term debt, excluding capital lease obligations, approximate their fair values.
– Long-term debt (excluding capital lease obligations): Fair values of outstanding bonds are determined using quoted market prices (Level 1 inputs), if available. For other bonds and other long-term debt, the fair values are determined using a discounted cash flow methodology based upon borrowing rates of similar debt instruments and reflecting appropriate adjustments for non-performance risk (Level 2 inputs).
– Non-current deposit liabilities in “Other non-current liabilities”: The fair values of non-current deposit liabilities are determined using a discounted cash flow methodology based on risk-adjusted interest rates (Level 2 inputs).
The Company is engaged in environmental clean-up activities at certain sites arising under various United States and other environmental protection laws and under certain agreements with third parties. In some cases, these environmen-tal remediation actions are subject to legal proceedings, investigations or claims, and it is uncertain to what extent the Company is actually obligated to perform. Provisions for these unresolved matters have been set up if it is probable that the Company has incurred a liability and the amount of loss can be reasonably estimated. The lower end of an esti-mated range is accrued when a single best estimate is not determinable. The required amounts of the provisions may change in the future as developments occur.
If a provision has been recognized for any of these matters, the Company records an asset when it is probable that it will recover a portion of the costs expected to be incurred to settle them. Management is of the opinion, based upon information presently available, that the resolution of any such obligation and non-collection of recoverable costs would not have a further material adverse effect on the Company’s consolidated financial statements.
The Company is involved in the remediation of environmental contamination at present or former facilities, primarily in the United States. The clean-up of these sites involves primarily soil and groundwater contamination. A significant por-tion of the provisions in respect of these contingencies reflects the provisions of acquired companies. A portion of one of the acquired companies’ remediation liability is indemnified by a prior owner. Accordingly, an asset equal to that por-tion of the remediation liability is included in “Other non-current assets”.
Environmental provisions included in the Company’s Consolidated Balance Sheets were as follows:
($ in millions) March 31, 2015 December 31, 2014
Other provisions 29 37
Other non-current liabilities 108 109
Total 137 146
Provisions for the above estimated losses have not been discounted as the timing of payments cannot be reasonably estimated.
Antitrust In April 2014, the European Commission announced its decision regarding its investigation of anticompetitive practices in the cables industry and granted the Company full immunity from fines under the European Commission’s leniency program. In December 2013, the Company agreed with the Brazilian Antitrust Authority (CADE) to settle its ongoing investigation into the Company’s involvement in anticompetitive practices in the cables industry and the Company agreed to pay a fine of approximately 1.5 million Brazilian reals (equivalent to approximately $1 million on date of pay-ment). The Company’s cables business remains under investigation for alleged anticompetitive practices in certain other jurisdictions. An informed judgment about the outcome of these remaining investigations or the amount of potential loss or range of loss for the Company, if any, relating to these remaining investigations cannot be made at this stage.
In Brazil, the Company’s Gas Insulated Switchgear business is under investigation by the CADE for alleged anticompeti-tive practices. In addition, the CADE has opened an investigation into certain other power businesses of the Company, including flexible alternating current transmission systems (FACTS) and power transformers. An informed judgment about the outcome of these investigations or the amount of potential loss or range of loss for the Company, if any, relat-ing to these investigations cannot be made at this stage.
With respect to those aforementioned matters which are still ongoing, management is cooperating fully with the antitrust authorities.
Note 6 Commitments and contingenciesContingencies—Environmental
Contingencies—Regulatory, Compliance and Legal
Note 5 Fair values, continued

22 Q1 2015 | Financial Information
General In addition, the Company is aware of proceedings, or the threat of proceedings, against it and others in respect of pri-vate claims by customers and other third parties with regard to certain actual or alleged anticompetitive practices. Also, the Company is subject to other various legal proceedings, investigations, and claims that have not yet been resolved. With respect to the above mentioned regulatory matters and commercial litigation contingencies, the Company will bear the costs of the continuing investigations and any related legal proceedings.
Liabilities recognized At March 31, 2015, and December 31, 2014, the Company had aggregate liabilities of $144 million and $147 million, respectively, included in “Other provisions” and “Other non-current liabilities”, for the above regulatory, compliance and legal contingencies, and none of the individual liabilities recognized was significant. As it is not possible to make an informed judgment on the outcome of certain matters and as it is not possible, based on information currently available to management, to estimate the maximum potential liability on other matters, there could be material adverse outcomes beyond the amounts accrued.
General The following table provides quantitative data regarding the Company’s third-party guarantees. The maximum potential payments represent a “worst-case scenario”, and do not reflect management’s expected outcomes.
Maximum potential payments ($ in millions) March 31, 2015 December 31, 2014
Performance guarantees 230 232
Financial guarantees 74 72
Indemnification guarantees 50 50
Total 354 354
The carrying amount of liabilities recorded in the Consolidated Balance Sheets reflects the Company’s best estimate of future payments, which it may incur as part of fulfilling its guarantee obligations. In respect of the above guarantees, the carrying amounts of liabilities at March 31, 2015, and December 31, 2014, were not significant.
Performance guarantees Performance guarantees represent obligations where the Company guarantees the performance of a third party’s prod-uct or service according to the terms of a contract. Such guarantees may include guarantees that a project will be com-pleted within a specified time. If the third party does not fulfill the obligation, the Company will compensate the guaran-teed party in cash or in kind. Performance guarantees include surety bonds, advance payment guarantees and standby letters of credit. The significant performance guarantees are described below.
The Company retained obligations for guarantees related to the Power Generation business contributed in mid-1999 to the former ABB Alstom Power NV joint venture (Alstom Power NV). The guarantees primarily consist of performance guarantees and other miscellaneous guarantees under certain contracts such as indemnification for personal injuries and property damages, taxes and compliance with labor laws, environmental laws and patents. These guarantees have no fixed expiration date. In May 2000, the Company sold its interest in Alstom Power NV to Alstom SA (Alstom). As a result, Alstom and its subsidiaries have primary responsibility for performing the obligations that are the subject of the guaran-tees. Further, Alstom, the parent company and Alstom Power NV, have undertaken jointly and severally to fully indemnify and hold harmless the Company against any claims arising under such guarantees. Management’s best estimate of the total maximum potential amount payable of quantifiable guarantees issued by the Company on behalf of its former Power Generation business was $65 million at both March 31, 2015, and December 31, 2014. The Company has not experi-enced any losses related to guarantees issued on behalf of the former Power Generation business.
The Company is engaged in executing a number of projects as a member of consortia that include third parties. In cer-tain of these cases, the Company guarantees not only its own performance but also the work of third parties. The original maturity dates of these guarantees range from one to six years. At both March 31, 2015, and December 31, 2014, the maximum potential amount payable under these guarantees as a result of third-party non-performance was $156 million.
Financial guarantees and commercial commitments Financial guarantees represent irrevocable assurances that the Company will make payment to a beneficiary in the event that a third party fails to fulfill its financial obligations and the beneficiary under the guarantee incurs a loss due to that failure.
At March 31, 2015, and December 31, 2014, the Company had a maximum potential amount payable of $74 million and $72 million, respectively, under financial guarantees outstanding. Of these amounts, $12 million at both March 31, 2015, and December 31, 2014, was in respect of guarantees issued on behalf of companies in which the Company formerly had or has an equity interest. The guarantees outstanding have various maturity dates up to 2020.
In addition, in the normal course of bidding for and executing certain projects, the Company has entered into standby letters of credit, bid/performance bonds and surety bonds (collectively “performance bonds”) with various financial insti-tutions. Customers can draw on such performance bonds in the event that the Company does not fulfill its contractual obligations. The Company would then have an obligation to reimburse the financial institution for amounts paid under the performance bonds. There have been no significant amounts reimbursed to financial institutions under these types of arrangements in the three months ended March 31, 2015 and 2014.
Guarantees
Note 6 Commitments and contingencies, continued
23 Q1 2015 | Financial Information
Indemnification guarantees The Company has indemnified certain purchasers of divested businesses for potential claims arising from the operations of the divested businesses. To the extent the maximum potential loss related to such indemnifications could not be cal-culated, no amounts have been included under maximum potential payments in the table above. Indemnifications for which maximum potential losses could not be calculated include indemnifications for legal claims. The significant indem-nification guarantees for which maximum potential losses could be calculated are described below.
The Company issued to the purchasers of Lummus Global guarantees related to assets and liabilities divested in 2007. The maximum potential amount payable relating to this business, pursuant to the sales agreement, at each of March 31, 2015, and December 31, 2014, was $50 million.
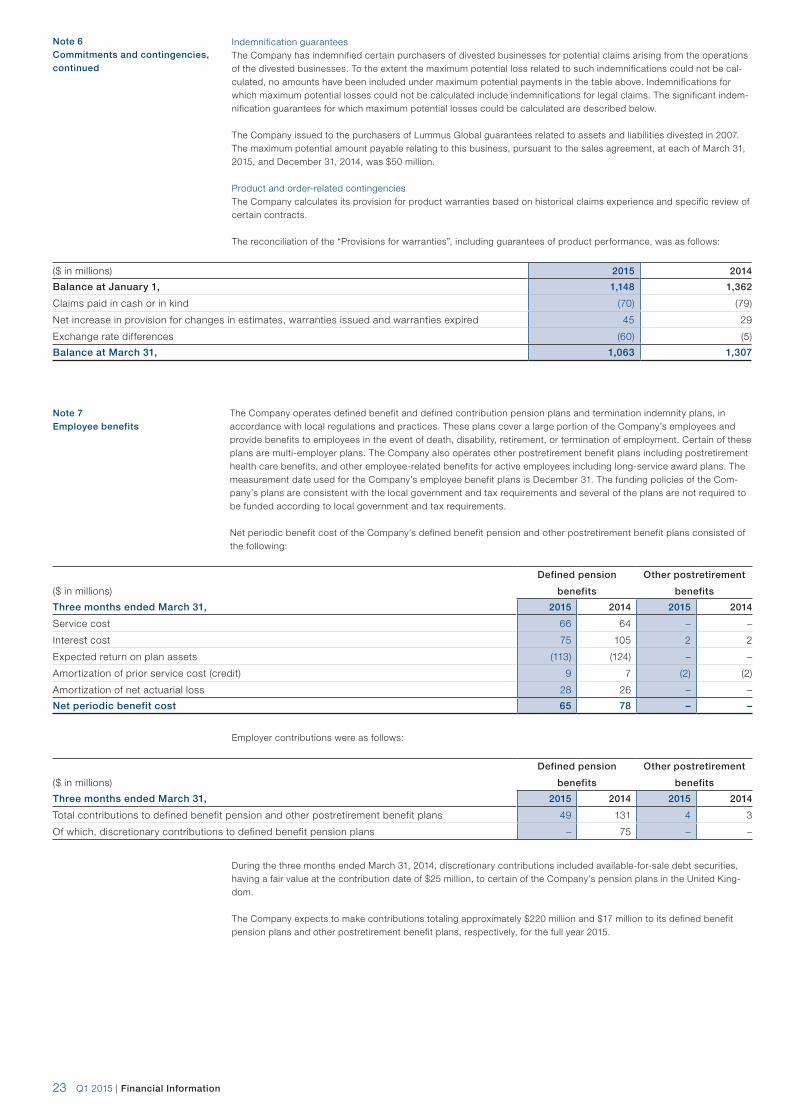
Product and order-related contingencies The Company calculates its provision for product warranties based on historical claims experience and specific review of certain contracts.
The reconciliation of the “Provisions for warranties”, including guarantees of product performance, was as follows:
($ in millions) 2015 2014
Balance at January 1, 1,148 1,362
Claims paid in cash or in kind (70) (79)
Net increase in provision for changes in estimates, warranties issued and warranties expired 45 29
Exchange rate differences (60) (5)
Balance at March 31, 1,063 1,307
The Company operates defined benefit and defined contribution pension plans and termination indemnity plans, in accordance with local regulations and practices. These plans cover a large portion of the Company’s employees and provide benefits to employees in the event of death, disability, retirement, or termination of employment. Certain of these plans are multi-employer plans. The Company also operates other postretirement benefit plans including postretirement health care benefits, and other employee-related benefits for active employees including long-service award plans. The measurement date used for the Company’s employee benefit plans is December 31. The funding policies of the Com-pany’s plans are consistent with the local government and tax requirements and several of the plans are not required to be funded according to local government and tax requirements.
Net periodic benefit cost of the Company’s defined benefit pension and other postretirement benefit plans consisted of the following:
($ in millions)
Defined pension
benefits
Other postretirement
benefits
Three months ended March 31, 2015 2014 2015 2014
Service cost 66 64 – –
Interest cost 75 105 2 2
Expected return on plan assets (113) (124) – –
Amortization of prior service cost (credit) 9 7 (2) (2)
Amortization of net actuarial loss 28 26 – –
Net periodic benefit cost 65 78 – –
Employer contributions were as follows:
($ in millions)
Defined pension
benefits
Other postretirement
benefits
Three months ended March 31, 2015 2014 2015 2014
Total contributions to defined benefit pension and other postretirement benefit plans 49 131 4 3
Of which, discretionary contributions to defined benefit pension plans – 75 – –
During the three months ended March 31, 2014, discretionary contributions included available-for-sale debt securities, having a fair value at the contribution date of $25 million, to certain of the Company’s pension plans in the United King-dom.
The Company expects to make contributions totaling approximately $220 million and $17 million to its defined benefit pension plans and other postretirement benefit plans, respectively, for the full year 2015.
Note 6 Commitments and contingencies, continued
Note 7 Employee benefits

24 Q1 2015 | Financial Information
In September 2014, the Company announced a share buyback program for the purchase of up to $4 billion of its own shares over a period ending no later than September 2016. The Company intends that approximately three quarters of the shares to be purchased will be held for cancellation (after approval from shareholders) and the remainder will be purchased to be available for delivery to employees under its employee share programs. Shares acquired for cancella-tion are acquired through a separate trading line on the SIX Swiss Exchange (on which only the Company can purchase shares), while shares acquired for delivery under employee share programs are acquired through the ordinary trading line.
In the three months ended March 31, 2015, under the announced share buyback program, the Company purchased 17.4 million shares for cancellation and 4.1 million shares to support its employee share programs. These transactions resulted in an increase in “Treasury stock” of $452 million.
As of March 31, 2015, under this program, the Company has purchased a total of approximately 43 million shares for cancellation and approximately 11 million shares to support its employee share programs.
Basic earnings per share is calculated by dividing income by the weighted-average number of shares outstanding during the period. Diluted earnings per share is calculated by dividing income by the weighted-average number of shares out-standing during the period, assuming that all potentially dilutive securities were exercised, if dilutive. Potentially dilutive securities comprise outstanding written call options and outstanding options and shares granted subject to certain con-ditions under the Company’s share-based payment arrangements.
Basic earnings per share
Three months ended March 31,
($ in millions, except per share data in $) 2015 2014
Amounts attributable to ABB shareholders:
Income from continuing operations, net of tax 560 545
Income (loss) from discontinued operations, net of tax 4 (1)
Net income 564 544
Weighted-average number of shares outstanding (in millions) 2,251 2,301
Basic earnings per share attributable to ABB shareholders:
Income from continuing operations, net of tax 0.25 0.24
Income (loss) from discontinued operations, net of tax – –
Net income 0.25 0.24
Diluted earnings per share
Three months ended March 31,
($ in millions, except per share data in $) 2015 2014
Amounts attributable to ABB shareholders:
Income from continuing operations, net of tax 560 545
Income (loss) from discontinued operations, net of tax 4 (1)
Net income 564 544
Weighted-average number of shares outstanding (in millions) 2,251 2,301
Effect of dilutive securities:
Call options and shares 5 10
Adjusted weighted-average number of shares outstanding (in millions) 2,256 2,311
Diluted earnings per share attributable to ABB shareholders:
Income from continuing operations, net of tax 0.25 0.24
Income (loss) from discontinued operations, net of tax – –
Net income 0.25 0.24
Note 8 Stockholders’ equity
Note 9 Earnings per share

25 Q1 2015 | Financial Information
The following table shows changes in “Accumulated other comprehensive loss” (OCI) attributable to ABB, by component, net of tax:
($ in millions)
Foreign currency
translation
adjustments
Unrealized
gains (losses)
on available-
for-sale
securities
Pension
and other post-
retirement plan
adjustments
Unrealized
gains (losses)
of cash flow
hedge
derivatives Total OCI
Balance at January 1, 2014 (431) 7 (1,610) 22 (2,012)
Other comprehensive (loss) income
before reclassifications (76) 3 (10) (11) (94)
Amounts reclassified from OCI – (1) 23 (1) 21
Total other comprehensive (loss) income (76) 2 13 (12) (73)
Less:
Amounts attributable to noncontrolling interests (3) – – – (3)
Balance at March 31, 2014 (504) 9 (1,597) 10 (2,082)
($ in millions)
Foreign currency
translation
adjustments
Unrealized
gains (losses)
on available-
for-sale
securities
Pension
and other post-
retirement plan
adjustments
Unrealized
gains (losses)
of cash flow
hedge
derivatives Total OCI
Balance at January 1, 2015 (2,102) 13 (2,131) (21) (4,241)
Other comprehensive (loss) income
before reclassifications (831) 3 147 (22) (703)
Amounts reclassified from OCI – – 27 11 38
Total other comprehensive (loss) income (831) 3 174 (11) (665)
Less:
Amounts attributable to noncontrolling interests – – – – –
Balance at March 31, 2015 (2,933) 16 (1,957) (32) (4,906)
The following table reflects amounts reclassified out of OCI in respect of pension and other postretirement plan adjustments:
($ in millions) Three months ended March 31,
Details about OCI components Location of (gains) losses reclassified from OCI 2015 2014
Pension and other postretirement plan adjustments:
Amortization of prior service cost Net periodic benefit cost(1) 7 5
Amortization of net actuarial loss Net periodic benefit cost(1) 28 26
Total before tax 35 31
Tax Provision for taxes (8) (8)
Amounts reclassified from OCI 27 23
These components are included in the computation of net periodic benefit cost (see Note 7).
The amounts in respect of unrealized gains (losses) on available-for-sale securities and unrealized gains (losses) of cash flow hedge derivatives were not significant for the three months ended March 31, 2015 and 2014.
(1)
Note 10 Reclassifications out of accumulated other comprehensive loss

26 Q1 2015 | Financial Information
The Chief Operating Decision Maker (CODM) is the Company’s Executive Committee. The CODM allocates resources to and assesses the performance of each operating segment using the information outlined below. The Company’s operat-ing segments consist of Discrete Automation and Motion, Low Voltage Products, Process Automation, Power Products and Power Systems. The remaining operations of the Company are included in Corporate and Other.
A description of the types of products and services provided by each reportable segment is as follows:
– Discrete Automation and Motion: manufactures and sells motors, generators, variable speed drives, programmable logic controllers, robots and robotics, solar inverters, wind converters, rectifiers, excitation systems, power quality and protection solutions, electric vehicle fast charging infrastructure, components and subsystems for railways, and related services for a wide range of applications in discrete automation, process industries, transportation and utili-ties.
– Low Voltage Products: manufactures and sells products and systems that provide protection, control and measure-ment for electrical installations, as well as enclosures, switchboards, electronics and electromechanical devices for industrial machines, plants and related service. In addition, the segment manufactures products for wiring and cable management, cable protection systems, power connection and safety. The segment also makes intelligent building control systems for home and building automation.
– Process Automation: develops and sells control and plant optimization systems, automation products and solutions, including instrumentation, as well as industry-specific application knowledge and services for the oil, gas and petro-chemicals, metals and minerals, marine and turbocharging, pulp and paper, chemical and pharmaceuticals, and power industries.
– Power Products: manufactures and sells a wide range of products across voltage levels, including circuit breakers, switchgears, capacitors, instrument transformers, power, distribution and traction transformers for electrical and other infrastructure utilities, as well as industrial and commercial customers.
– Power Systems: designs, installs and upgrades high-efficiency transmission and distribution systems and power plant automation and electrification solutions, including monitoring and control products, software and services and incor-porating components manufactured by both the Company and by third parties, for power generation, transmission and distribution utilities, other infrastructure utilities, as well as other industrial and commercial enterprises.
– Corporate and Other: includes headquarters, central research and development, the Company’s real estate activities, Group Treasury Operations and other minor business activities.
Effective January 1, 2015, the Company changed its primary measure of segment performance from Operational EBITDA to Operational EBITA, which represents income from operations excluding amortization expense on intangibles arising upon acquisitions (acquisition-related amortization), restructuring and restructuring-related expenses, gains and losses from sale of businesses, acquisition-related expenses and certain non-operational items, as well as foreign exchange/commodity timing differences in income from operations consisting of: (i) unrealized gains and losses on derivatives (foreign exchange, commodities, embedded derivatives), (ii) realized gains and losses on derivatives where the underlying hedged transaction has not yet been realized, and (iii) unrealized foreign exchange movements on receiv-ables/payables (and related assets/liabilities).
The segment performance for the three months ended March 31, 2014, has been restated to reflect this change.
The CODM primarily reviews the results of each segment on a basis that is before the elimination of profits made on inventory sales between segments. Segment results below are presented before these eliminations, with a total deduc-tion for intersegment profits to arrive at the Company’s consolidated Operational EBITA. Intersegment sales and trans-fers are accounted for as if the sales and transfers were to third parties, at current market prices.
The following tables present segment revenues, Operational EBITA, and the reconciliations of consolidated Operational EBITA to income from continuing operations before taxes for the three months ended March 31, 2015 and 2014, as well as total assets at March 31, 2015, and December 31, 2014.
Note 11 Operating segment data

27 Q1 2015 | Financial Information
Three months ended March 31, 2015
($ in millions) Third-party revenues Intersegment revenues Total revenues
Discrete Automation and Motion 2,146 125 2,271
Low Voltage Products 1,476 79 1,555
Process Automation 1,543 36 1,579
Power Products 1,961 314 2,275
Power Systems 1,418 54 1,472
Corporate and Other 11 346 357
Intersegment elimination – (954) (954)
Consolidated 8,555 – 8,555
Three months ended March 31, 2014
($ in millions) Third-party revenues Intersegment revenues Total revenues
Discrete Automation and Motion 2,194 187 2,381
Low Voltage Products 1,784 98 1,882
Process Automation 1,891 52 1,943
Power Products 1,996 395 2,391
Power Systems 1,532 76 1,608
Corporate and Other 74 411 485
Intersegment elimination – (1,219) (1,219)
Consolidated 9,471 – 9,471
Three months ended March 31,
($ in millions) 2015 2014
Operational EBITA:
Discrete Automation and Motion 318 352
Low Voltage Products 243 299
Process Automation 192 245
Power Products 253 304
Power Systems 33 (54)
Corporate and Other and Intersegment elimination (90) (107)
Consolidated Operational EBITA 949 1,039
Acquisition-related amortization (83) (101)
Restructuring and restructuring-related expenses (26) (47)
Gains and losses from sale of businesses, acquisition-related expenses and certain non-operational items (11) (11)
Foreign exchange/commodity timing differences in income from operations:
Unrealized gains and losses on derivatives (foreign exchange, commodities, embedded derivatives) (16) (55)
Realized gains and losses on derivatives where the underlying hedged transaction has not yet been realized (8) 17
Unrealized foreign exchange movements on receivables/payables (and related assets/liabilities) 54 13
Income from operations 859 855
Interest and dividend income 19 17
Interest and other finance expense (71) (84)
Income from continuing operations before taxes 807 788
Total assets (1)
($ in millions) March 31, 2015 December 31, 2014
Discrete Automation and Motion 9,846 10,123
Low Voltage Products 7,682 7,978
Process Automation 4,049 4,268
Power Products 7,105 7,396
Power Systems 6,558 6,855
Corporate and Other 7,895 8,258
Consolidated 43,135 44,878
Total assets are after intersegment eliminations and therefore reflect third-party assets only.(1)
Note 11 Operating segment data, continued

28 Q1 2015 | Financial Information

29 Q1 2015 | Financial Information
The following reconciliations and definitions include measures which ABB uses to supplement its Interim Consolidated Financial Information (unaudited) which is prepared in accordance with United States generally accepted accounting principles (U.S. GAAP). Certain of these financial measures are, or may be, considered non-GAAP financial measures as defined in the rules of the U.S. Securities and Exchange Commission (SEC).
While ABB’s management believes that the non-GAAP financial measures herein are useful in evaluating ABB’s operat-ing results, this information should be considered as supplemental in nature and not as a substitute for the related finan-cial information prepared in accordance with U.S. GAAP. Therefore these measures should not be viewed in isolation but considered together with the Interim Consolidated Financial Information (unaudited) prepared in accordance with U.S. GAAP as of and for the three months ended March 31, 2015.
Growth rates for certain key figures may be presented and discussed on a “like-for-like” basis. The like-for-like growth rate measures growth on a constant currency basis. Since we are a global company, the comparability of our operating results reported in U.S. dollars is affected by foreign currency exchange rate fluctuations. We calculate the impacts from foreign currency fluctuations by translating the current-year periods reported key figures into U.S. dollar amounts using the exchange rates in effect for the comparable periods in the previous year.
Like-for-like growth rates also adjust for changes in our business portfolio. The adjustment for portfolio changes is cal-culated as follows: where the results of any business acquired or divested have not been consolidated and reported for the entire duration of both the current and comparable periods, the reported key figures of such business are adjusted to exclude the relevant key figures of any corresponding quarters which are not comparable when computing the like-for-like growth rate. In addition, certain other adjustments, which affect the business portfolio but do not qualify as a divestment, are treated in a similar manner to a divestment. We do not adjust for portfolio changes where the business acquired or divested has annual revenues of less than $50 million.
The following tables provide reconciliations of reported growth of certain key figures to their respective like-for-like growth rate.
Divisional like-for-like growth rate reconciliation
Q1 2015 compared to Q1 2014
Order growth rate Revenue growth rate
Division
US$
(as
reported)
Foreign
exchange
impact
Acquisitions
and
divestments Like-for-like
US$
(as
reported)
Foreign
exchange
impact
Acquisitions
and
divestments Like-for-like
Discrete Automation and Motion -9% 8% 0% -1% -5% 9% 0% 4%
Low Voltage Products -14% 10% 6% 2% -17% 9% 7% -1%
Process Automation -4% 14% 6% 16% -19% 11% 4% -4%
Power Products -3% 10% 0% 7% -5% 9% 0% 4%
Power Systems 61% 29% 0% 90% -8% 12% 0% 4%
ABB Group 0% 13% 2% 15% -10% 10% 3% 3%
Regional like-for-like growth rate reconciliation
Q1 2015 compared to Q1 2014
Order growth rate Revenue growth rate
Region
US$
(as
reported)
Foreign
exchange
impact
Acquisitions
and
divestments Like-for-like
US$
(as
reported)
Foreign
exchange
impact
Acquisitions
and
divestments Like-for-like
Europe 2% 23% 2% 27% -17% 17% 2% 2%
The Americas -1% 5% 5% 9% -3% 5% 6% 8%
Asia, Middle East and Africa 0% 7% 1% 8% -8% 6% 2% 0%
ABB Group 0% 13% 2% 15% -10% 10% 3% 3%
Like-for-like growth rates
Supplemental Reconciliations and Definitions

30 Q1 2015 | Financial Information
Order backlog growth rate reconciliation
March 31, 2015 compared to March 31, 2014
US$
(as reported)
Foreign
exchange impact
Acquisitions and
divestments Like-for-like
Discrete Automation and Motion -5% 11% 0% 6%
Low Voltage Products -14% 11% 9% 6%
Process Automation -3% 20% 2% 19%
Power Products -5% 12% 0% 7%
Power Systems -6% 17% 0% 11%
ABB Group -5% 14% 1% 10%
Operational EBITA growth rate reconciliation
Q1 2015 compared to Q1 2014
US$
(as reported)
Foreign
exchange impact
Acquisitions and
divestments Like-for-like
Discrete Automation and Motion -10% 10% 0% 0%
Low Voltage Products -19% 11% 9% 1%
Process Automation -22% 9% 2% -11%
Power Products -17% 10% 0% -7%
Power Systems n.a. n.a. n.a. n.a.
ABB Group -9% 10% 4% 5%
Other growth rate reconciliations
Q1 2015 compared to Q1 2014
US$
(as reported)
Foreign
exchange impact
Acquisitions and
divestments Like-for-like
Large orders 91% 38% 0% 129%
Base orders -12% 9% 3% 0%
Service orders -13% 10% 4% 1%
Service revenues -7% 9% 4% 6%
In line with the updated financial targets of ABB’s Next Level strategy, effective from January 1, 2015, ABB changed its measure of segment profit from Operational EBITDA to Operational EBITA.
Definition Operational EBITA marginOperational EBITA margin is Operational EBITA as a percentage of Operational revenues.
Operational EBITA Operational earnings before interest, taxes and acquisition-related amortization (Operational EBITA) represents Income from operations excluding acquisition-related amortization (as defined below), restructuring and restructuring-related expenses, gains and losses from sale of businesses, acquisition-related expenses and certain non-operational items, as well as foreign exchange/commodity timing differences in income from operations consisting of: (i) unrealized gains and losses on derivatives (foreign exchange, commodities, embedded derivatives), (ii) realized gains and losses on deriva-tives where the underlying hedged transaction has not yet been realized, and (iii) unrealized foreign exchange move-ments on receivables/payables (and related assets/liabilities).
Acquisition-related amortization Amortization expense on intangibles arising upon acquisitions.
Operational revenues Operational revenues are total revenues adjusted for foreign exchange/commodity timing differences in total revenues of: (i) unrealized gains and losses on derivatives, (ii) realized gains and losses on derivatives where the underlying hedged transaction has not yet been realized, and (iii) unrealized foreign exchange movements on receivables (and related assets).
Operational EBITA margin

31 Q1 2015 | Financial Information
Three months ended March 31, 2015
($ in millions, unless otherwise indicated)
Discrete
Automation
and Motion
Low
Voltage
Products
Process
Automation
Power
Products
Power
Systems
Corporate and
Other and
Intersegment
elimination Consolidated
Total revenues 2,271 1,555 1,579 2,275 1,472 (597) 8,555
Foreign exchange/commodity
timing differences in total revenues:
Unrealized gains and losses
on derivatives (13) 7 (12) (17) 16 1 (18)
Realized gains and losses on derivatives
where the underlying hedged
transaction has not yet been realized (29) – 17 11 16 – 15
Unrealized foreign exchange movements
on receivables (and related assets) 8 (3) (12) (11) (16) – (34)
Operational revenues 2,237 1,559 1,572 2,258 1,488 (596) 8,518
Income (loss) from operations 300 217 186 240 4 (88) 859
Acquisition-related amortization 32 25 3 3 14 6 83
Restructuring and
restructuring-related expenses 3 6 1 11 4 1 26
Gains and losses from sale of businesses,
acquisition-related expenses and certain
non-operational items – 1 (1) 1 – 10 11
Foreign exchange/commodity timing
differences in income from operations:
Unrealized gains and losses on
derivatives (foreign exchange,
commodities, embedded derivatives) 7 8 2 3 15 (19) 16
Realized gains and losses on derivatives
where the underlying hedged
transaction has not yet been realized (29) – 12 14 11 – 8
Unrealized foreign exchange movements
on receivables/payables
(and related assets/liabilities) 5 (14) (11) (19) (15) – (54)
Operational EBITA 318 243 192 253 33 (90) 949
Operational EBITA margin (%) 14.2% 15.6% 12.2% 11.2% 2.2% n.a. 11.1%

32 Q1 2015 | Financial Information
Three months ended March 31, 2014
($ in millions, unless otherwise indicated)
Discrete
Automation
and Motion
Low
Voltage
Products
Process
Automation
Power
Products
Power
Systems
Corporate and
Other and
Intersegment
elimination Consolidated
Total revenues 2,381 1,882 1,943 2,391 1,608 (734) 9,471
Foreign exchange/commodity
timing differences in total revenues:
Unrealized gains and losses
on derivatives (1) 1 (7) (7) 35 (1) 20
Realized gains and losses on derivatives
where the underlying hedged
transaction has not yet been realized – – – (1) (10) – (11)
Unrealized foreign exchange movements
on receivables (and related assets) (5) – 3 4 (6) – (4)
Operational revenues 2,375 1,883 1,939 2,387 1,627 (735) 9,476
Income (loss) from operations 326 256 219 272 (102) (116) 855
Acquisition-related amortization 34 30 4 5 22 6 101
Restructuring and
restructuring-related expenses 1 8 20 8 8 2 47
Gains and losses from sale of businesses,
acquisition-related expenses and certain
non-operational items (3) 4 1 5 1 3 11
Foreign exchange/commodity timing
differences in income from operations:
Unrealized gains and losses on
derivatives (foreign exchange,
commodities, embedded derivatives) 1 1 1 16 38 (2) 55
Realized gains and losses on derivatives
where the underlying hedged
transaction has not yet been realized (1) – – (2) (14) – (17)
Unrealized foreign exchange
movements on receivables/payables
(and related assets/liabilities) (6) – – – (7) – (13)
Operational EBITA 352 299 245 304 (54) (107) 1,039
Operational EBITA margin (%) 14.8% 15.9% 12.6% 12.7% -3.3% n.a. 11.0%

33 Q1 2015 | Financial Information
DefinitionOperational EPSOperational EPS is calculated as Operational net income divided by the weighted-average number of shares used in determining basic earnings per share.
Operational net income Operational net income is calculated as Net income attributable to ABB adjusted for the net-of-tax impact of: (i) restructuring and restructuring-related expenses, (ii) gains and losses from sale of businesses, acquisition-related expenses and certain non-operational items, (iii) foreign exchange/commodity timing differences in income from operations consisting of: (a) unrealized gains and
losses on derivatives (foreign exchange, commodities, embedded derivatives), (b) realized gains and losses on deriva-tives where the underlying hedged transaction has not yet been realized, and (c) unrealized foreign exchange move-ments on receivables/payables (and related assets/liabilities), and
(iv) acquisition-related amortization.
Acquisition-related amortizationAmortization expense on intangibles arising upon acquisitions.
Adjusted Group effective tax rateThe Adjusted Group effective tax rate is computed by dividing the provision for income taxes by income from continuing operations before taxes. The calculation excludes the amount of gains and losses from sale of businesses and the related provision for income taxes.
Constant currency Operational EPS adjustmentIn connection with ABB’s 2015-2020 targets, Operational EPS growth is measured assuming 2014 as the base year and uses constant exchange rates. We compute the constant currency operational net income for all periods using the rel-evant monthly exchange rates which were in effect during 2014 and any income difference is divided by the relevant weighted-average number of shares outstanding to identify the constant currency Operational EPS adjustment.
Reconciliation
Three months ended March 31,
($ in millions, except per share data in $) 2015 2014
EPS(1) EPS(1)
Net income (attributable to ABB) 564 0.25 544 0.24
Restructuring and restructuring-related expenses(2) 19 0.01 34 0.01
Gains and losses from sale of businesses,
acquisition-related expenses and certain non-operational items(3) 8 0.00 8 0.00
FX/commodity timing differences in income from operations(2) (21) (0.01) 18 0.01
Acquisition-related amortization(2) 59 0.03 72 0.03
Operational net income 629 0.28 676 0.29
Constant currency Operational EPS adjustment 0.03 –
Operational EPS (constant currency basis) 0.31 0.29
EPS amounts are computed individually, therefore the sum of the per share amounts shown may not equal to the total.Net of tax at the Adjusted Group effective tax rate.Net of tax at the Adjusted Group effective tax rate, except for gains and losses from sale of businesses which are net of the actual related provision for taxes.
DefinitionNet debt / (Net cash)Net debt / (Net cash) is defined as Total debt less Cash and marketable securities.
Total debtTotal debt is the sum of Short-term debt and current maturities of long-term debt, and Long-term debt.
Cash and marketable securitiesCash and marketable securities is the sum of Cash and equivalents, and Marketable securities and short-term invest-ments.
Reconciliation
($ in millions) March 31, 2015 December 31, 2014
Short-term debt and current maturities of long-term debt 506 353
Long-term debt 7,203 7,338
Total debt 7,709 7,691
Cash and equivalents 4,471 5,443
Marketable securities and short-term investments 1,684 1,325
Cash and marketable securities 6,155 6,768
Net debt / (Net cash) 1,554 923
Operational EPS
(1)
(2)
(3)
Net debt / (Net cash)

34 Q1 2015 | Financial Information
DefinitionNet working capital as a percentage of revenues Net working capital as a percentage of revenues is calculated as Net working capital divided by Adjusted revenues for the trailing twelve months.
Net working capitalNet working capital is the sum of (i) receivables, net, (ii) inventories, net, and (iii) prepaid expenses; less (iv) accounts payable, trade, (v) billings in excess of sales, (vi) advances from customers, and (vii) other current liabilities (excluding primarily: (a) income taxes payable, (b) current derivative liabilities, (c) pension and other employee benefits, and (d) pay-ables under the share buyback program); and including the amounts related to these accounts which have been pre-sented as either assets or liabilities held for sale.
Adjusted revenues for the trailing twelve monthsAdjusted revenues for the trailing twelve months includes total revenues recorded by ABB in the twelve months preced-ing the relevant balance sheet date adjusted to eliminate revenues of divested businesses and the estimated impact of annualizing revenues of certain acquisitions which were completed in the same trailing twelve-month period.
Reconciliation
($ in millions, unless otherwise indicated) March 31, 2015 March 31, 2014
Net working capital:
Receivables, net 10,599 12,215
Inventories, net 5,346 6,201
Prepaid expenses 289 305
Accounts payable, trade (4,473) (4,872)
Billings in excess of sales (1,396) (1,539)
Advances from customers (1,503) (1,780)
Other current liabilities(1) (2,900) (3,307)
Net working capital 5,962 7,223
Total revenues for the three months ended:
March 31, 2015 / 2014 8,555 9,471
December 31, 2014 / 2013 10,346 11,373
September 30, 2014 / 2013 9,823 10,535
June 30, 2014 / 2013 10,190 10,225
Adjustment to annualize/eliminate revenues of certain acquisitions/divestments (372) 204
Adjusted revenues for the trailing twelve months 38,542 41,808
Net working capital as a percentage of revenues (%) 15% 17%
Amounts exclude $1,017 million and $710 million at March 31, 2015 and 2014, respectively, related primarily to (a) income taxes payable, (b) current derivative liabilities, (c) pension and other employee benefits, and (d) payables under the share buyback program.
DefinitionFinance net is calculated as Interest and dividend income less Interest and other finance expense.
Reconciliation
Three months ended March 31,
($ in millions) 2015 2014
Interest and dividend income 19 17
Interest and other finance expense (71) (84)
Finance net (52) (67)
Definition Book-to-bill ratio is calculated as Orders received divided by Total revenues.
Reconciliation
Three months ended March 31,
($ in millions, unless otherwise indicated) 2015 2014
Orders received 10,404 10,358
Total revenues 8,555 9,471
Book-to-bill ratio 1.22 1.09
Net working capital as a percentage of revenues
(1)
Finance net
Book-to-bill ratio

ABB Ltd
Corporate CommunicationsP.O. Box 8131 8050 ZurichSwitzerland Tel: +41 (0)43 317 71 11 Fax: +41 (0)43 317 79 58
www.abb.com