Embed Size (px)
Citation preview
Airport Master Plan
Financial Feasibility Report
Prepared for:Prepared by:AECOM
May 20, 2013
South Suburban Airport Master Plan – Draft Financial Feasibility Report May 20, 2013
Table of Contents Page i
Table of Contents Topic Page Number Cover Sheet.................................................................................................................................................. Cover Sheet Table of Contents ........................................................................................................................................................... i List of Tables .................................................................................................................................................................. ii List of Exhibits ................................................................................................................................................................ ii List of Appendices .......................................................................................................................................................... ii Section 1 – Introduction ............................................................................................................................................... 1 Section 2 – Sources of Airport Funding ........................................................................................................................ 2 2.1 – Federal Airport Funding Sources ......................................................................................................... 2 2.2 – Federal Airport Project Eligibility Requirements................................................................................. 3 2.3 – FAA-Facilities and Equipment Program............................................................................................... 4 2.4 – Department of Homeland Security, Transportation Security Administration – Airport Security
System Grants ..................................................................................................................................... 4 2.5 – Passenger Facility Charges .................................................................................................................. 5 2.6 – Federal Highway Administration Grants ............................................................................................. 5 2.7 – Federal Transit Administration Grants ................................................................................................ 5 2.8 – Illinois Department of Transportation Grants ..................................................................................... 6 2.9 – Local Funding ...................................................................................................................................... 7 2.10 – Customer Facility Charge .................................................................................................................. 7 2.11 – Private Funds .................................................................................................................................... 7 2.12 – Innovative Funding Techniques ........................................................................................................ 8 2.12.1 – Design Build .......................................................................................................................... 8 2.12.2 – Public-Private Partnerships ................................................................................................... 8 2.12.3 – Credit Assistance Programs................................................................................................... 9 2.12.4 – Other Local Programs ........................................................................................................... 9 Section 3 – Projected Airport Revenues ..................................................................................................................... 10 3.1 – Approach and Assumptions .............................................................................................................. 10 3.2 – Projected Airport Operating Revenue Assumptions ......................................................................... 12 3.3 – Projected Passenger Aeronautical Revenue ..................................................................................... 13 3.4 – Projected Non-Passenger Aeronautical Revenue ............................................................................. 13 3.5 – Projected Non-Aeronautical Revenue .............................................................................................. 15 Section 4 – Projected Airport Expenses ..................................................................................................................... 17 4.1 – Inaugural Airport Staffing ................................................................................................................. 17 4.2 – Federal Staffing ................................................................................................................................. 18 4.3 – Staffing Summary .............................................................................................................................. 19 4.4 – Operations and Maintenance Expenses ........................................................................................... 20 Section 5 – Conceptual Development Plan ................................................................................................................ 22 5.1 – Inaugural Airport Capital Improvement Program Review ................................................................ 22 5.2 – Capital Revenue Projections ............................................................................................................. 22 5.2.1 – FAA-AIP Funding LOI Discretionary plus Entitlements .......................................................... 22 5.2.2 – FAA-Facilities and Equipment Program................................................................................. 23 5.2.3 – TSA Funds .............................................................................................................................. 23 5.2.4 – FHWA Grants ......................................................................................................................... 24 5.2.5 – FTA Grants ............................................................................................................................. 24 5.2.6 – Passenger Facility Charges .................................................................................................... 24 5.2.7 – State of Illinois General Obligation Bonds ............................................................................ 24 5.2.8 – Private Funds ........................................................................................................................ 24 5.3 – Conceptual Development Funding Projections through DBO+5 ....................................................... 24 Section 6 –Cash Flow and Financial Feasibility Analysis ............................................................................................ 26 Section 7 – Capital Improvement Plan Schedule and Debt Service ........................................................................... 27
South Suburban Airport Master Plan – Draft Financial Feasibility Report May 20, 2013
Table of Contents Page ii
7.1 – Capital Improvement Plan Costs by Federal Fiscal Years .................................................................. 27 7.2 – Debt Service ...................................................................................................................................... 29 Section 8 – Financial Conclusions ............................................................................................................................... 31 8.1 – IDOT’s Ability to Fund the CIP ........................................................................................................... 31 8.2 – Reasonable Rates and Charges ......................................................................................................... 31 8.3 – Financial Management of the Airport ............................................................................................... 31 List of Tables Table 3-1: Averaged Metrics for Benchmark Airports ................................................................................................ 11 Table 3-2: Airport Revenue Estimates for Commercial Airline Revenue .................................................................... 14 Table 3-3: Estimated Fuel Usage by Plane Type at DBO+1 ......................................................................................... 14 Table 3-4: Projected Landing Fees, FBO Revenues, Hangar Rentals and Fuel Revenues ........................................... 15 Table 3-5: Projected Non-Aeronautical Revenue ....................................................................................................... 16 Table 3-6: Total Projected Airport Revenue ............................................................................................................... 16 Table 4-1: Estimated Airport Full Time Equivalent Positions ...................................................................................... 19 Table 4-2: Salary and Benefit Cost Drivers for SSA ..................................................................................................... 20 Table 4-3: Estimated Operating Expenses Expressed as a Percentage of Labor Costs ............................................... 20 Table 4-4: Projected Operating Expenses for SSA ...................................................................................................... 21 Table 5-1: Airport Improvement Plan Entitlement Projections .................................................................................. 23 Table 5-2: Passenger Facility Charges Projections ...................................................................................................... 24 Table 5-3: Conceptual Development Funding Projections through DBO+5 ............................................................... 25 Table 6-1: Summary of Estimated Cash Flow ............................................................................................................. 26 Table 6-2: Financial Summary for DBO+1 to DBO+5 ................................................................................................... 26 Table 7-1: Capital Cost by Federal Fiscal Years – Post EIS ROD .................................................................................. 27 Table 7-2: Federal Eligible/Federal Non-Eligible Capital Costs-Post EIS ROD ............................................................. 28 Table 7-3: Debt Service by Federal Fiscal Year (2015-2024) ....................................................................................... 30 List of Exhibits Exhibit 4-1 – Sample Organizational Chart .................................................................................................................. 35 Exhibit 5-1 – Entitlement Eligibility Timeline ............................................................................................................... 36 List of Appendices Appendix A-Acronyms ................................................................................................................................................. 32 Appendix B-Exhibits ..................................................................................................................................................... 34
South Suburban Airport Master Plan – Draft Financial Feasibility Report May 20, 2013
Section 1 - Introduction Page 1
Section 1 – Introduction This Financial Feasibility Report is a chapter of the South Suburban Airport (SSA) Master Plan that provides information on how to fund the development and operation of the airfield. Using the Capital Improvement Plan (CIP) costs contained in the SSA Implementation Report, this study identifies potential sources to fund construction of the airfield. The Financial Feasibility Report is the last chapter of the SSA Master Plan and is an extension of all previous reports. This report discusses the following topics: Sources of Airport Funding, Projected Airport Revenues, Projected Airport Expenses, Conceptual Development Plan, Cash Flow and Financial Feasibility Analysis, Debt Service and Financial Conclusions. An airport sponsor’s eligibility and ability to fund recommended projects is a major consideration in preparing the CIP and a Facilities Implementation Plan. The financial feasibility analysis should take place concurrently with the development of the CIP and the Facilities Implementation Plan.
1 This financial feasibility review is consistent with
industry practices for the fiduciary analysis of a major public works development. As noted in the companion SSA Facilities Implementation Report, uncertainty is inherent when forecasting costs and revenue streams. It must be understood that some assumptions regarding future events may not occur as projected. Construction of SSA is dependent upon the occurrence and potential variability of future events. Illinois Department of Transportation (IDOT) will continually assess economic conditions and the progress of the project on an ongoing basis and make adjustments to the program, as warranted. For the purposes of this report, several time periods are referenced. Date of Beneficial Occupancy (DBO) is the date the airport opens for operation. Date of Beneficial Occupancy-Fifth Year After Opening Day (DBO+5) is considered the fifth year of airport operation. The term fiscal year is a reference used to define an entity’s budgetary yearly cycle. Specifically, for the purpose of this report, fiscal year refers to the Federal Fiscal Year (FY) that extends from October 1
st to September 30
th.
1 http://www.faa.gov/regulations_policies/advisory_circulars/index.cfm/go/document.information/documentID/22329
South Suburban Airport Master Plan – Draft Financial Feasibility Report May 20, 2013
Section 2 – Sources of Airport Funding Page 2
Section 2 – Sources of Airport Funding Airport development may be financed utilizing a number of sources including Federal Airport Funding Sources, Passenger Facility Charges (PFC), state funding, Customer Facility Charges (CFC) and private funds. Innovative financing techniques include design build and public-private partnership options. SSA will require funding for preconstruction and construction as defined in the Facilities Implementation Report. 2.1 Federal Airport Funding Sources To promote the development of a system of airports to meet the nation's needs, the Federal Government embarked on a grants-in-aid program to units of state and local governments shortly after the end of World War II. The early program, the Federal-Aid Airport Program was authorized by the Federal Airport Act of 1946 and received its funding from the general fund of the U.S. Treasury. In 1970, a more comprehensive program was established with the passage of the Airport and Airway Development Act of 1970. This Act provided grants for airport planning under the Planning Grant Program and for airport development under the Airport Development Aid Program. These programs were funded from a newly established Airport and Airway Trust Fund, into which were deposited revenues from several aviation-user taxes on such items as airline fares, air freight and aviation fuel. The authority to issue grants under these two programs expired on September 30, 1981. During this 11-year period, 8,809 grants totaling $4.5 billion were approved. The current program, known as the Airport Improvement Program (AIP),
2 was established by the Airport and
Airway Improvement Act of 1982 (Public Law 97-248). Since then, the AIP has been amended several times, most recently with the passage of the Federal Aviation Administration (FAA) Modernization and Reform Act of 2012.
3
Funds obligated for the AIP are drawn from the Airport and Airway Trust fund, which is supported by user fees, fuel taxes and other similar revenue sources. AIP provides grants to public agencies for planning and development of airports in the National Plan of Integrated Airport Systems (NPIAS).
4 SSA has received Federal funds for the
preparation of this Airport Master Plan and the associated Environmental Impact Statement (EIS) and is listed in the NPIAS. Policies, procedures and guidance for the administration of AIP are defined in FAA Order 5100.38C, Airport Improvement Program Handbook, June 28, 2005
5 and Program Guidance Letter regarding the Letter of Intent (LOI)
Program. The law defines airports by categories of airport activities, including commercial service, primary, cargo service, reliever and General Aviation (GA) airports. Commercial Service Airports are publicly owned airports that have at least 2,500 passenger boardings each calendar year and receive scheduled passenger service. Passenger boardings refer to revenue passenger boardings on an aircraft in service in air commerce whether or not in scheduled service. The definition also includes passengers who continue on an aircraft in international flight that stops at an airport in any of the 50 states for a non-traffic purpose, such as refueling or aircraft maintenance rather than passenger activity. Passenger boardings at airports that receive scheduled passenger service are also referred to as enplanements. Non-primary Commercial Service Airports are those facilities that have at least 2,500 but no more than 10,000 passenger boardings each year. Primary Airports are Commercial Service Airports that have more than 10,000 passenger boardings each year. Hub categories for Primary Airports are defined as a percentage of total passenger boardings within the United States (U.S.) in the most current calendar year ending before the start of the current fiscal year. Hub airports are classified as large, medium, small and non-hub. Examples include: Chicago O’Hare International Airport (ORD) is a large hub; Indianapolis International Airport is a medium hub; Quad City International Airport is a small hub; and Chicago Rockford International Airport is a non-hub airport.
2 http://www.faa.gov/airports/aip/ 3 http://www.gpo.gov/fdsys/pkg/CRPT-112hrpt381/pdf/CRPT-112hrpt381.pdf 4 http://www.faa.gov/airports/aip/overview/ 5 http://www.faa.gov/airports/resources/publications/orders/media/aip_5100_38c.pdf

South Suburban Airport Master Plan – Draft Financial Feasibility Report May 20, 2013
Section 2 – Sources of Airport Funding Page 3
Cargo Service Airports are airports that, in addition to any other air transportation services that may be available, are served by aircraft providing air transportation of only cargo with a total annual landed weight of more than 100 million pounds. “Landed weight” means the weight of aircraft transporting only cargo in intrastate, interstate and foreign air transportation. An airport may be both a Commercial Service and a Cargo Service Airport. GA airport’s non-primary entitlement funds are a $150,000 per year stipend. Because the demand for AIP funds exceeds the availability, FAA distributes limited AIP funds on current national priorities and objectives. Projects that rate a high priority will receive higher consideration for funding over those projects with lower priority ratings. Each fiscal year, the FAA apportions AIP funds into major entitlement categories such as enplanements, non-primary and state apportionment funds. The FAA distributes the remaining funds to a discretionary fund. Set-aside projects (airport noise and the Military Airport Program) receive first attention from this distribution. The funds that remain after the set-asides are true discretionary funds that the FAA distributes based on a national prioritization system.
6
FAA is authorized to issue an LOI for certain airport development projects when current obligating authority is not timely or adequate to meet a sponsor’s desired timing for a project. Under this provision, a sponsor may notify the FAA of an intention to implement a project without Federal funds and request that the FAA issue an LOI. The FAA evaluates the proposal and, if approved, issues a letter stating that reimbursement will be made according to a given schedule, as funds become available. A sponsor who has received an LOI may proceed with a project without waiting for an AIP grant. The sponsor is assured that all allowable costs related to the approved project remain eligible for reimbursement.
7
IDOT is the airport owner and Sponsor of SSA and is eligible under the AIP program to receive Federal funding for plan, design and construction of SSA.
8
2.2 Federal Airport Project Eligibility Requirements Certain types of projects are eligible for FAA funding. Projects eligible for AIP funding include improvements related to airport safety, security, capacity and environmental compliance. These projects may include: land acquisition; planning studies; environmental studies; Airport Layout Plans (ALP); runway construction and rehabilitation; taxiway construction and rehabilitation; aircraft apron construction and rehabilitation; airfield lighting and signage; airfield storm water management and drainage; navigational aids- weather observation stations; access roads located on airport property; removing, lowering, moving, marking and lighting hazards; and glycol recovery trucks/glycol vacuum trucks. Projects that are normally not eligible for AIP funding include: maintenance equipment and vehicles; office and office equipment; landscaping; artworks; industrial park development; marketing; training; improvements for commercial enterprises; and maintenance or repair of buildings. Fuel farms may be eligible at non-primary airports using entitlements. IDOT intends to own and operate the fueling facilities, directly provide fuel services, use the revenues to offset operating expenses and use residual revenue to cover capital costs. These would be new facilities that could provide an important source of additional operating revenue. The Federal share of the allowable costs of eligible CIP projects is determined by the requirements of 49 USC 47109 and is defined in the AIP Handbook, Section 2, paragraph 26, pages 12–14. The Federal share for large and medium hub airports is 75 percent. The Federal share for small, non-hub airports and GA facilities is 90 percent. It is anticipated that through the first year of operation (DBO to DBO+1), SSA will be classified as a GA reliever airport. SSA is forecasted to exceed the number of enplanements needed to be a primary airport in DBO and be designated by FAA as a primary non-hub facility by the end of Date of Beneficial Occupancy-First Year After
6 http://www.faa.gov/airports/central/aip/sponsor_guide/media/0100.pdf 7 http://www.faa.gov/airports/resources/publications/orders/media/aip_5100_38c.pdf 8 FAA Order 5100.3(a)(c) Airport Improvement Program Handbook, Chapter 2, Sponsor Eligibility, June 28, 2005.
South Suburban Airport Master Plan – Draft Financial Feasibility Report May 20, 2013
Section 2 – Sources of Airport Funding Page 4
Opening Day (DBO+1).9 It is expected that SSA will grow to be a small hub primary airport by DBO+5. It is
anticipated that the Federal share of eligible development costs of SSA would be 90 percent. 2.3 FAA-Facilities and Equipment Program FAA is responsible for the development and operation of the national air navigation and traffic control system for civil and military aviation. In support of this responsibility, annual appropriations of funds are made by the Federal government to the Airport and Airways Trust Fund, Facilities and Equipment budget. These appropriations are for the procurement, installation and operation of facilities and equipment needed to support the national air navigation and traffic control system. Funding is available through the FAA-Facilities and Equipment Program for the procurement and installation of airport Navigational and Visual Aids (NAVAIDS). These include ground-based and satellite-based Instrument Landing Systems (ILS), runway approach lighting systems and automated weather monitoring systems. Eligibility for NAVAIDS funding is contained in FAA Order 2500.8B - Funding Criteria for Operations, Facilities and Equipment (F&E), and Research, Engineering and Development (R, E&D) Accounts
.10
It is anticipated that visual and instrument operations will be supported by airfield infrastructure such as an Airport Traffic Control Tower (ATCT), airport surveillance radar, runway approach lights, visual and instrument navigational aids, automated weather observing system, low level wind shear alert system and a computer based control system and fiber optic network. 2.4 Department of Homeland Security, Transportation Security Administration – Airport Security System Grants The Transportation Security Administration (TSA) was created by the Aviation and Transportation Security Act, November 19, 2001. The TSA was originally within the Department of Transportation. The Department of Homeland Security (DHS) was created by the Homeland Security Act on November 25, 2002. Subsequently, the TSA was transferred to the DHS in March 2003. The TSA has responsibility for civil aviation security functions. Civil aviation security requires screening passengers and their carry-on and checked baggage for prohibited items including weapons, explosives and other prohibited items. It also includes airport perimeter security. To offset the cost of providing aviation security, the Aviation and Transportation Security Act gave TSA the authority to impose two security related fees including a passenger security fee (Aviation Passenger Security Fee) and an air carrier security fee (Aviation Security Infrastructure Fee). The Aviation Passenger Security Fee is a uniform fee on passengers of U.S and foreign air carriers originating at airports in the U.S.
11 TSA also has the authority to levy an
Aviation Security Infrastructure Fee on airlines equal to their costs of passenger and baggage screening in 2000, to the extent that the September 11 Security Fee was insufficient to cover the agency's costs for aviation security. Airlines pay one-twelfth per month of their 2000 screening costs to TSA.
12
Title 49 U.S.C. Section 44923 – Airport Security Improvement Projects gives the DHS Under Secretary for Border and Transportation Security the authority to make grants to airport sponsors for the procurement and installation of airport security systems. In accordance with Title 49 Transportation Part 1542 – Airport Security, airport sponsors must appoint an airport security coordinator and prepare an airport security program for approval by TSA. The airport sponsor may submit grant applications for the funding of security systems to the DHS TSA. The Under Secretary for Border and Transportation Security may issue a LOI to a sponsor to provide funding for airport security projects. The Federal Government’s share for medium and large airports is 90 percent and for other airports is 95 percent. The Airport Improvement Program, Section 5, paragraph. 542, Security Projects, also includes provisions for the funding of airport security projects. The approval for AIP funding of security projects is also under the authority of the TSA. It is anticipated that SSA security systems could be funded with a mix of TSA and AIP resources.
9 http://www.southsuburbanairport.com/MasterPlan/reports/2009_Forecast_Update_Approved.pdf 10 http://www.faa.gov/documentLibrary/media/directives/nd/ND2500-8B.pdf 11 http://www.tsa.gov/stakeholders/september-11-security-fee-passenger-fee 12 http://www.tsa.gov/stakeholders/aviation-security-infrastructure-fee-air-carrier-fee
South Suburban Airport Master Plan – Draft Financial Feasibility Report May 20, 2013
Section 2 – Sources of Airport Funding Page 5
2.5 Passenger Facility Charges The Aviation Safety and Capacity Expansion Act of 1990 authorized the Secretary of Transportation to grant public agencies the authority to impose a PFC to fund eligible airport projects. PFC revenue may be used on a “pay-as-you-go” basis or leveraged to pay debt service on bonds or other debt used to pay for PFC-eligible projects. Although the FAA is required to approve the collection and use of PFCs, the program permits local collection of PFC revenue through the airlines operating at an airport and provides more flexibility to airport sponsors than AIP funds. To be eligible for PFC revenues, a project must preserve or enhance the safety, security or capacity of the national air transportation system, reduce or mitigate airport related noise, or enhance competition among air carriers. Some eligible projects include: airport planning and development projects eligible under 49 U.S.C. Chapter 471, Subchapter I; terminal development paid for with apportionment funds as described in 49 U.S.C. 47110(d); airport noise compatibility planning as described in 49 U.S.C. 47505; noise compatibility planning eligible for Federal assistance under 49 U.S.C. 47504; construction of gates and related areas at which passengers are enplaned or deplaned and other areas directly related to the movement of passengers and baggage; air traffic modification projects approved under 49 U.S.C. 44517; and converting to or acquiring low emission vehicles in air quality non-attainment or maintenance areas. The PFC Program allows the collection of PFC fees up to $4.50 for every boarded passenger at commercial airports controlled by public agencies. Airports use these fees to fund FAA-approved projects that enhance safety, security, or capacity; reduce noise; or increase air carrier competition.
13 PFCs are authorized under 49 U.S.C. Section 40117
– Passenger Facility Fees14
and the legislation is implemented by 14 CFR Part 158, Passenger Facility Charge.15
FAA Order 5500.1 – Passenger Facility Charge provides guidance and procedures for the administration of the PFC Program.
16 Based on this legislation and guidance, the FAA Administrator may grant authority to a public agency
that controls an airport to impose a PFC on enplaned passengers. A PFC may be in the amount of $1, $2, $3, $4 or $4.50 per enplanement. PFC revenue may only be used to finance the allowable costs of approved projects and may be used to finance all or part of the costs. PFC revenue may be used to pay debt service on a bond issued to finance approved projects. 2.6 Federal Highway Administration Grants The Federal Highway Administration (FHWA) is responsible for the Highway Trust Fund (HTF) is administered by and was established by the Federal-Aid Highway Act and the Highway Revenue Act of 1956.
17 The HTF has been
continued through subsequent legislation, most recently, by SAFETEA-LU,18
which authorized expenditures through September 30, 2009. A number of temporary extensions have been subsequently passed. The most recent temporary extension is Public Law 112-102, March 30, 2012 which extended HTF funding until June 30, 2012. Current legislation is in negotiation in the U.S. Congress. The principal revenue is motor vehicle fuel and road use taxes. It is anticipated that construction of the I-57/SSA Airport Access Road Interchange could be funded by monies from HTF. The Federal share is normally 90 percent and the non-Federal share is normally 10 percent. 2.7 Federal Transit Administration Grants The Federal Transit Administration (FTA) may provide funds to establish an initial airport express bus shuttle service from the University Park Metra Station to SSA. The FTA funding could help fund planning, design and construction of station improvements at SSA and University Park Metra Station and route development costs.
13 http://www.faa.gov/airports/pfc/ 14 http://www.faa.gov/airports/resources/publications/regulations/media/49usc40117.pdf 15 http://www.faa.gov/airports/resources/publications/regulations/media/pfc_14cfr158_062207.pdf 16 http://www.faa.gov/documentLibrary/media/Order/PFC_55001.pdf 17 http://www.fhwa.dot.gov/publications/publicroads/96summer/p96su10.cfm 18 Public Act 109-59, August 10, 2002 originally signed August 10, 2005. SAFETEA-LU - Safe, Accountable, Flexible, Efficient Transportation Equity Act: A Legacy for Users.
South Suburban Airport Master Plan – Draft Financial Feasibility Report May 20, 2013
Section 2 – Sources of Airport Funding Page 6
The Moving Ahead for Progress in the 21st Century Act (MAP-21) (Public Law 112-141)19
was signed on July 6, 2012, effective October 1, 2012. MAP-21 provides FTA authorization level of $10.6 billion in FY 2013 and $10.7 billion in FY 2014. MAP-21 consolidates certain transit programs, provides significant funding for state of good repair programs, grants FTA the authority to improve safety of transit systems, streamlines the New Start process to expedite project delivery and provides for core capacity project eligibility. The Bus and Bus Facility program has been changed from a discretionary program to a formula based program to provide a steady and more predictable source of funding for transit investments. It is suggested that the planning, design and construction of the SSA express shuttle bus system could be funded through the FTA New Starts, Small Starts and Very Small Starts program. The shuttle bus system will employ high occupancy, highly energy efficient, low or no emission vehicles and bus rapid transit technology. The SSA express shuttle bus will facilitate multimodal and intermodal connectivity and accessibility at SSA, which is a specific objective of the MAP-21 transit development programs. The FTA New Starts share is anticipated to be 90 percent and non-Federal share is 10 percent. 2.8 Illinois Department of Transportation Grants A programming process known as the Transportation Improvement Program, (TIP) has been used by IDOT for determining state transportation procurements. IDOT, under statutory authority, is legally responsible for “channeling” Federal and state funds to maintain, enhance and expand Illinois’ publicly owned, open to the public airports through its TIP. Every October, airport sponsors across Illinois attend individual programming meetings with IDOT to review potential projects for the upcoming Federal and state fiscal years. At these meetings airports prepare financial assistance requests (TIP sheets) for development projects. Even though the focus of these TIP meetings is the upcoming Federal and state fiscal years, airport sponsors do provide through their TIP sheets projects that could be expected for the next three fiscal years following the initial year’s request. IDOT evaluates all statewide TIP requests based on need. Due to eligibility, justification, project readiness and funding limitations, not all projects requested in the TIP process are included in the Federal and state programs. SSA was included in the IDOT 2012-2014 AIP.
20 SSA was contained in the Program Summary indicating that it will
be a new supplemental air carrier airport in Will County. For programming purposes, SSA will submit TIP sheets for development and construction of the airfield. These TIP sheets will identify projects and potential Federal and state funding, through a prescribed development schedule. SSA will be subject to the same eligibility, justification, project readiness and funding limitations as other airfields in the state. IDOT provides funding for the non-federal share of FAA funded projects. IDOT has also recently reinitiated a State-Local Program for funding projects whose priority are not normally high enough to receive or ineligible to receive Federal monies. Periodically the State of Illinois issues bonds of various kinds for investments in major transportation initiatives. The main types of bonds issued by the state include General Obligation Bonds, Special Obligation Bonds and Revenue Bonds. General Obligation Bonds are backed by the full faith and credit of the state and are considered direct debt of the state. Special Obligation Bonds are considered direct debt of the state but are not backed by the full faith and credit of the state. Special Obligation Bonds are supported by a dedicated state revenue source, such as sales tax. Revenue Bonds are not backed by the full faith and credit of the state but are backed by a specific revenue stream. The state is currently using General Obligation Series–B bond funds for the land acquisition for SSA. It is anticipated that the state could utilize General Obligation Series-B bonds to provide the Sponsor’s share of SSA funding. This would provide a stable source of funding during the preconstruction and construction phases of the project. When SSA is operational and AIP entitlement and PFC revenues are available, these sources of funding may be utilized for capital costs going forward. As an alternative to the use of General Obligation Series-B bond
19 http://www.fmcsa.dot.gov/about/what-we-do/MAP-21/Map21.aspx 20 http://www.dot.il.gov/aero/2012program/2012program.pdf
South Suburban Airport Master Plan – Draft Financial Feasibility Report May 20, 2013
Section 2 – Sources of Airport Funding Page 7
funds for the Sponsor’s share of capital costs, IDOT could request FAA’s consideration for the use of land that has already been acquired to cover the Sponsor’s share of capital costs. It is anticipated that an operating reserve fund will be established. The fund could be used to provide the financial share of eligible project costs; fund total costs for non-eligible Federal projects; or to fund unexpected operating expenses. The Sponsor intends to provide fueling services for commercial and GA/corporate users. Also, SSA has leasable agricultural lands that will generate revenue. These sources of revenue could provide an operating reserve fund. 2.9 Local Funding IDOT is the airport owner and Sponsor of SSA, and it is anticipated that no local funds are contemplated to be used at this time. 2.10 Customer Facility Charge A CFC is a fee paid by airport customers for the use of some non-aeronautical service at the airport. These charges are commonly collected from on-airport rental car agencies. The funds are collected by the rental car agency from their customers and then paid to the airport for use in paying the debt service on, for example, a consolidated rental car facility. The airport may construct the facilities (i.e., consolidated rental car facility) on behalf of the agency, allowing them to finance major projects, but keeping the debt off their balance sheets. 2.11 Private Funds Private funds are regularly used on public airports. Airport tenants have numerous lease agreements with airports across the U.S. It is anticipated that private funds could be used for several airfield development items including: Fixed Base Operator (FBO) facilities, private aircraft storage hangars, and retail concessions. It should be noted that concession areas of the terminal building are not eligible for Federal funding. At this time, no tenants have been identified. Core and shell space will initially be provided as a part of the base building. The cost will be recovered through facility leases. Final build out of concession space will be funded by the tenant. Free-Trade Zone/Foreign-Trade Zone
21 - A free-trade zone is defined in the Revised Kyoto Convention of the World
Customs Organization as a public or private duty-free area where goods may be landed, warehoused, processed, sold, serviced, distributed, showcased, packaged, labeled, sorted, assembled and/or manufactured as finished goods prior to re-exporting without the normal customs procedures and incurring the payment of customs duties. In the U.S. “free-trade zones” are referred to as “foreign-trade zones”. In the U.S., authority for establishing a foreign-trade zone is granted by the Foreign-Trade Zones Board under the Foreign-Trade Zones Act of 1934,
22 as
amended by 19 U.S.C. 81a-81u and the Board’s regulations 15 C.F.R. Part 400. Foreign-Trade zones are also regulated by the U.S. Customs and Border Control, Title 19, Part 146 (19 CFR Part 146). The Board is part of the Import Administration within the International Trade Administration of the U.S. Department of Commerce.
23
Foreign-trade zones offer more advantageous business conditions with regard to capital investment, international trade and customs, taxation, and the regulatory environment. Foreign-trade zones are meant to attract international capital investment, stimulate economic activity and create employment opportunities. A foreign-trade zone may be an effective means to encourage the investment of private corporate funds at the airport. There are numerous foreign-trade zones in the U.S. that have been developed in relationship to the airport. For
21 U.S. Foreign-Trade Zones, Tax-Free Trade Zones of the World, and Their Impact on the U.S. Economy, Selected Works of Susan W. Tiefenbrun, August 2012. http://works.bepress.com/susan_tiefenbrun/3 22 Foreign-Trade Zones Act as amended 19 U.S.C. 81a-81, January 1, 1984. http://ia.ita.doc.gov/ftzpage/19uscftz/ch1a.html#81u 23 73rd Annual Report of the Foreign-Trade Zones Board to the Congress of the United States, Foreign Trade Zones Board, International Trade Administration, United States Department of Commerce. http://ia.ita.doc.gov/ftzpage/annualreport/ar-2011.pdf
South Suburban Airport Master Plan – Draft Financial Feasibility Report May 20, 2013
Section 2 – Sources of Airport Funding Page 8
example, at John F. Kennedy International Airport in New York City, the entire cargo area is designated as a foreign-trade zone. Another example is the Miami Free Zone, which is a privately developed and managed foreign-trade zone located in close proximity to the Miami International Airport. IDOT will explore the possibility of using a foreign-trade zone to attract and facilitate the investment of private funds in the development of the airport. 2.12 Innovative Funding Techniques It is prudent to note there are alternative revenue streams that may lessen the amount of public funding required. None of the traditional funding sources and levels identified in this document should preclude the potential for consideration of Innovative Funding Techniques (IFTs) should the opportunity present itself. IFTs are alternatives to traditional, grant-based funding. Innovative finance includes such measures as new or non-traditional sources of revenue, financing mechanisms designed to leverage resources, funds management techniques, and institutional arrangements. While a number of IFTs have been developed nationwide, their use in any individual state depends on a host of factors, including that state's enabling statutes. To use innovative transportation finance programs, proper enabling legislation to implement the programs is normally required. Some of the IFTs that may be incorporated into the SSA implementation program include: Design-Build, Public-Private Partnerships, Credit Assistance Programs and other programs.
2.12.1 Design-Build This financial feasibility analysis was conducted through utilization of a standard Design-Bid-Build system, in which the design contracts and documents are created separately and independently of their respective construction projects. With a Design-Build arrangement, a single point of responsibility is contracted to coordinate concurrent design and construction processes. The multi-faceted oversight provided by an administrative entity can serve to lessen the contractual risk to IDOT, since a single point is responsible for the entirety of a contract’s success and can be held accountable, regardless of the origins of any complications that may arise. A Design-Build arrangement can also consolidate some of the duplicative contractual and administrative functions present in any project through use of a single source, thus potentially translating into significant cost and time savings for IDOT.
2.12.2 Public-Private Partnerships A Public-Private Partnership (P3) is a joint venture between a government sponsor and one or more private entities. Typically, a Special Purpose Vehicle is formed between the parties to clearly identify the contract period, responsibilities and risk allocation throughout the various phases of asset management. P3 relationships can apply to the transfer of responsibilities on existing assets or to the development of completely new facilities. There are nearly limitless permutations of the P3 concept that may include various combinations of design, construction, maintenance and/or operation of all or a portion of the facility. The P3 concept also allows for financial flexibility depending on the specifics of a particular project. There is no one-size-fits-all P3 model. P3 relationships may be extremely complex and involve literally every facet of a particular endeavor, or they may be simple and commonplace as tenant front-end financial participation in a development that offsets future occupancy lease costs. P3 arrangements can be an attractive option for major public infrastructure projects because they allow the timely leveraging of private capital with relatively low public-sector financial risk. They may also provide for revenue sharing opportunities to recoup public investment and provide long-term positive

South Suburban Airport Master Plan – Draft Financial Feasibility Report May 20, 2013
Section 2 – Sources of Airport Funding Page 9
revenue. The private investors in turn may benefit from management/concessionaire earnings, facility usage and tenant fees, revenue guarantees, tax incentives, etc.
2.12.3 Credit Assistance Programs There are certain Federal and/or other loan programs that could allow some of the costs to shift to a long-term loan instead or reliance on public grants. One example of such a program is the Federal Highway Administration (FHWA) Transportation Infrastructure Finance and Innovation Act (TIFIA) program available for surface transportation projects. The TIFIA program allows a project sponsor or a private entity in coordination with the sponsor, to secure a low interest rate loan to finance a large-scale project. This program is currently available for surface transportation projects and offers a host of finance options, including secured loans, loan guarantees and standby lines of credit. Rates are typically lower than can be secured through other credit options and funding can be divided into branches to match a project’s specific needs and schedule. The repayment plan of a TIFIA loan can also be tailored to minimize financial exposure to the public entities involved. 2.12.4 Other Local Programs A multi-faceted coordinated approach to managed development on and around the airport may also provide additional revenues unaccounted for in the financial feasibility analysis. For any of these potential development options, however, care should be taken to ensure compatibility with both existing and future airport development plans. Also, it is important to conduct an appropriate level of outreach to ensure any development proposals integrate with existing and future community planning and development priorities. For example, airport property not required for airfield development may be utilized, in accordance with appropriate FAA land use compatibility guidelines, for aeronautical and non-aeronautical revenue generating sources. Examples may include restaurants, hotels, shopping centers, business or industrial parks, etc. Another option is the creation of a development district that extends beyond airport property and is governed by a recognized regional authority, dedicated development group or other similar agency with an appropriate level of authority. This development district would have proper oversight and enforcement. Coordination and concurrence among surrounding communities are essential to the successful creation and implementation of any regional development district.
Other more localized programs, including Tax Increment Financing Districts, financial incentive programs or other economic opportunity options may help attract private development on and around SSA. If financial recapturing terms are crafted properly, the revenues from these improvements can provide long-term economic benefit.
South Suburban Airport Master Plan – Draft Financial Feasibility Report May 20, 2013
Section 3 – Projected Airport Revenues Page 10
Section 3 – Projected Airport Revenues The financial feasibility analysis considers an array of revenues and expenses that could support operating and capital costs for SSA. The financial approach is built around the approved forecasts for SSA covering passenger enplanements and operations associated with commercial, cargo activity and GA/corporate. The analysis also relies on facility planning decisions for the terminal size, location/size of cargo aprons and other support facilities that could influence revenue potentials and operating expense factors. 3.1 Approach and Assumptions Each year, U.S. commercial airports must file the following financial reports with FAA:
The Financial Government Payment Report, FAA Form 5100-126. This form is used for reporting the airport payments to governmental entities, the services the airport performs for governmental entities and the land and facilities the airport provides to such entities.
The Operating and Financial Summary, FAA Form 5100-127. This form is used for reporting airport revenues, expenses and other financial information.
Airports can file or amend these reports through the FAA’s Airport Financial Reporting Program Website.
24
Consolidated versions of financial reports from about 550 commercial airports that have filed with FAA since 1996 are available online. The available reports, however, might not represent all commercial service airports required to file forms with FAA. The online database includes only those reports received and processed by the FAA Office of Airport Compliance and Management Analysis, Airport Compliance Division, Washington, DC, from the date of last revision. The SSA financial analysis relies on an extensive review of reported financial information for other U.S. airports, to help frame expectations for SSA’s financial performance as it follows an expected transition from GA to scheduled commercial air service. SSA is anticipated to be an additional new airport in an existing region that already supports two mature commercial air carrier airports. Reflective of this distinct situation, our analysis goals include:
1. Examine airport operational employment levels (Full Time Equivalent (FTE) basis), salaries, facility impacts and passenger levels, as reported in FAA Form 127.
2. Identify and evaluate the financial performance of specific benchmark airports, grouping them into one of
four “groups” based on operational and financial data. The intent is to use the airports in each “group” to frame the financial and operational implications associated with SSA’s currently approved passenger forecasts. The analysis will frame SSA as it is projected to transition over 20 years from a facility that will be reliant on corporate and GA/corporate, to one that can grow into a diversified mix of cargo, GA/corporate and scheduled commercial air service. It is important to note that the selected airports in each group are not perfect matches; each reflects a distinct reaction to regional and national market forces. But, taken together, these benchmark airports touch on all the aspects of SSA.
The guiding principles behind each generalized airport grouping are as follows:
Group 1: The FAA approved forecasts for SSA between DBO+1 and DBO+5 presume that SSA is initially focused on corporate and GA, representing a majority of projected operations (41,600 in Date of Beneficial Occupancy-Second Year After Opening Day (DBO+2). The following airports were included in this group: FNL – Fort Collins/Loveland Municipal, CO; MOD – Modesto City-County, CA; YNG – Youngstown Warren Regional, OH; and SGU – St. George, UT. A number of other airports with similar levels of operations were considered for this group, but excluded in part because smaller airports have a
24 http://www.faa.gov/airports/airport_compliance/airport_financial_reporting_program/
South Suburban Airport Master Plan – Draft Financial Feasibility Report May 20, 2013
Section 3 – Projected Airport Revenues Page 11
lower threshold for reporting financial data to the FAA using Form 127 as required under FAA 5100-127 (April 2010)
25. A number of potential benchmark airports were excluded for this reason.
Group 2: The approved forecasts between DBO+5 and Date of Beneficial Occupancy-Tenth Year After Opening Day (DBO+10) presume that SSA remains largely focused on GA/corporate (80 percent of 54,100 operations in DBO+5), but with a growing scheduled commercial service component. The following airports were included in this group: ECP – Northwest FL; PHF – Newport News, VA; AVL – Ashville Regional, NC; DAB – Daytona Beach International, FL; IWA – Phoenix Mesa, AZ; and FNT – Flint, MI.
Group 3: The approved forecasts for SSA from DBO+10 to Date of Beneficial Occupancy-15
th Year After
Opening Day (DBO+15) presume that SSA will continue to add scheduled commercial service, with about 1.2 million enplaned passengers, representing almost 40 percent of 72,000 forecast operations. The following airports were included in this group: SAV – Savannah Intl, GA; CAK – Akron Canton, OH; MSN – Dane County WI; SRQ – Sarasota, FL; SFB – Orlando Sanford, FL; and XNA – NW Arkansas, AR.
Group 4: This group reflects the Date of Beneficial Opening-20
th Year After Opening Day (DBO+20) for
SSA, (i.e., an airport with 2.2 million enplaned passengers) and scheduled air service representing about 50 percent of a forecasted total of 96,900 operations. The following airports were included in this group: PVD – Theodore F. Green International, RI; BUF – Greater Buffalo International, NY; TUS – Tucson International, AZ; ORF – Norfolk International, VA; and GRR – Gerald Ford International, MI.
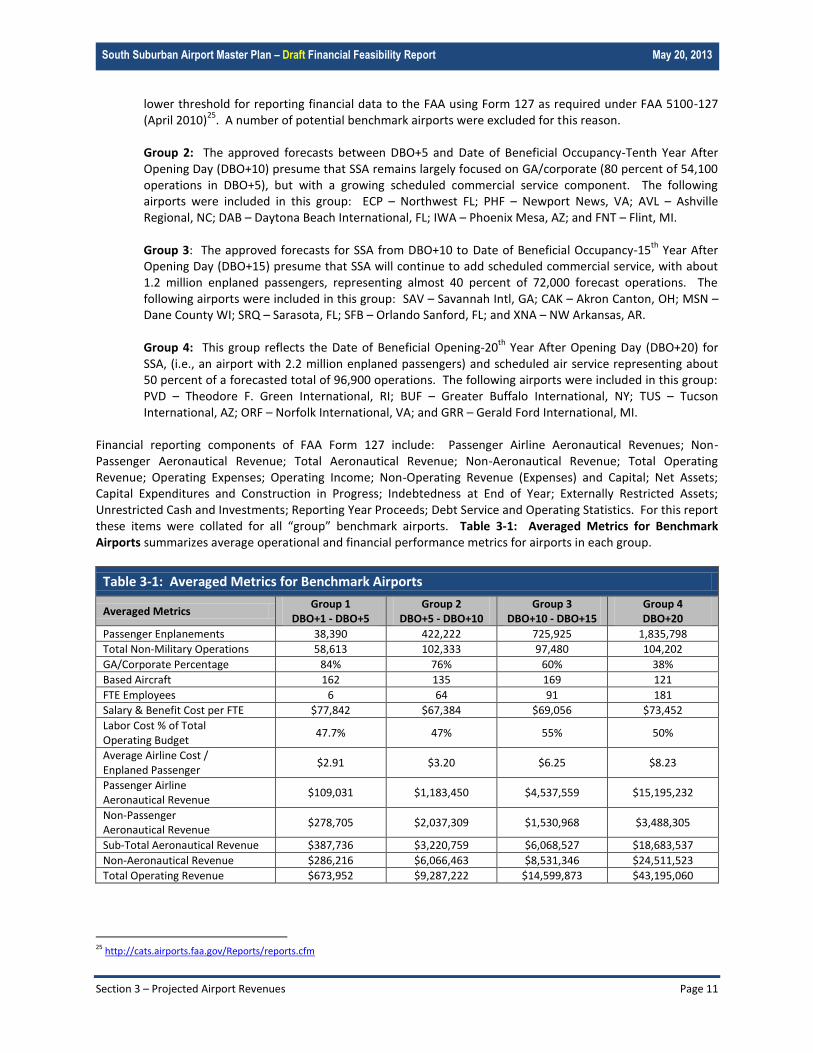
Financial reporting components of FAA Form 127 include: Passenger Airline Aeronautical Revenues; Non-Passenger Aeronautical Revenue; Total Aeronautical Revenue; Non-Aeronautical Revenue; Total Operating Revenue; Operating Expenses; Operating Income; Non-Operating Revenue (Expenses) and Capital; Net Assets; Capital Expenditures and Construction in Progress; Indebtedness at End of Year; Externally Restricted Assets; Unrestricted Cash and Investments; Reporting Year Proceeds; Debt Service and Operating Statistics. For this report these items were collated for all “group” benchmark airports. Table 3-1: Averaged Metrics for Benchmark Airports summarizes average operational and financial performance metrics for airports in each group.
Table 3-1: Averaged Metrics for Benchmark Airports
Averaged Metrics Group 1
DBO+1 - DBO+5 Group 2
DBO+5 - DBO+10 Group 3
DBO+10 - DBO+15 Group 4 DBO+20
Passenger Enplanements 38,390 422,222 725,925 1,835,798
Total Non-Military Operations 58,613 102,333 97,480 104,202
GA/Corporate Percentage 84% 76% 60% 38%
Based Aircraft 162 135 169 121
FTE Employees 6 64 91 181
Salary & Benefit Cost per FTE $77,842 $67,384 $69,056 $73,452
Labor Cost % of Total Operating Budget
47.7% 47% 55% 50%
Average Airline Cost / Enplaned Passenger
$2.91 $3.20 $6.25 $8.23
Passenger Airline Aeronautical Revenue
$109,031 $1,183,450 $4,537,559 $15,195,232
Non-Passenger Aeronautical Revenue
$278,705 $2,037,309 $1,530,968 $3,488,305
Sub-Total Aeronautical Revenue $387,736 $3,220,759 $6,068,527 $18,683,537
Non-Aeronautical Revenue $286,216 $6,066,463 $8,531,346 $24,511,523
Total Operating Revenue $673,952 $9,287,222 $14,599,873 $43,195,060
25 http://cats.airports.faa.gov/Reports/reports.cfm
South Suburban Airport Master Plan – Draft Financial Feasibility Report May 20, 2013
Section 3 – Projected Airport Revenues Page 12
Table 3-1: Averaged Metrics for Benchmark Airports
Averaged Metrics Group 1
DBO+1 - DBO+5 Group 2
DBO+5 - DBO+10 Group 3
DBO+10 - DBO+15 Group 4 DBO+20
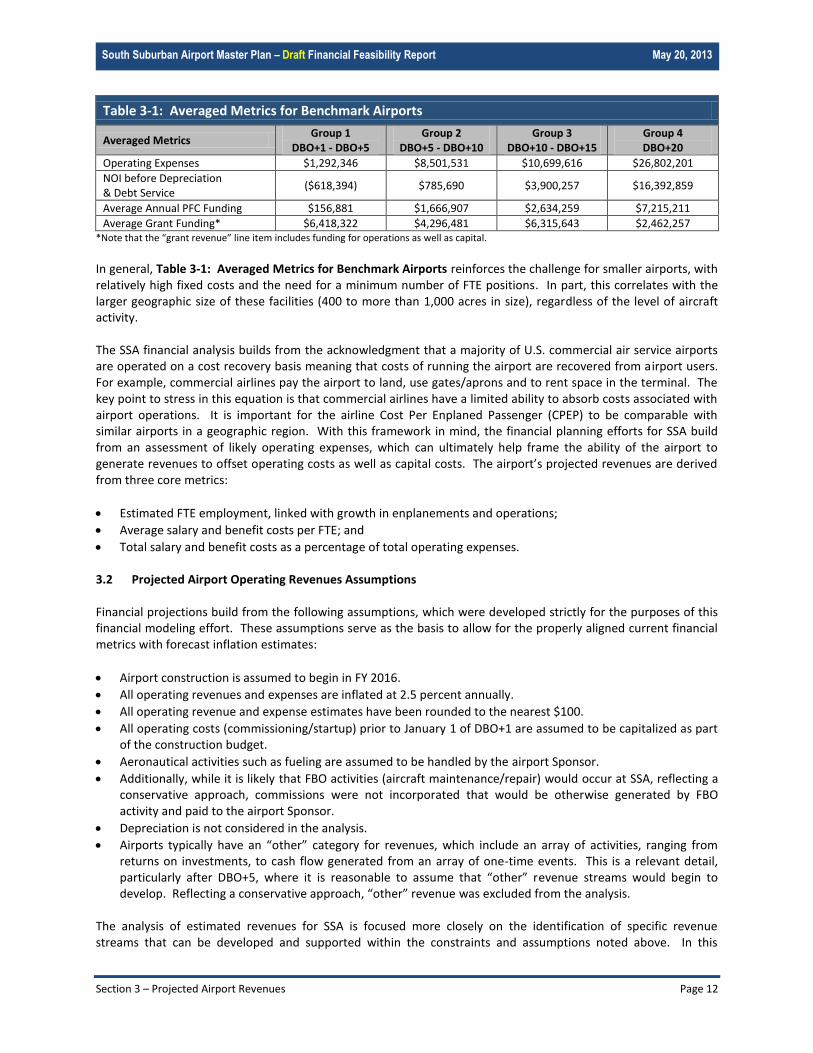
Operating Expenses $1,292,346 $8,501,531 $10,699,616 $26,802,201
NOI before Depreciation & Debt Service
($618,394) $785,690 $3,900,257 $16,392,859
Average Annual PFC Funding $156,881 $1,666,907 $2,634,259 $7,215,211
Average Grant Funding* $6,418,322 $4,296,481 $6,315,643 $2,462,257 *Note that the “grant revenue” line item includes funding for operations as well as capital.
In general, Table 3-1: Averaged Metrics for Benchmark Airports reinforces the challenge for smaller airports, with relatively high fixed costs and the need for a minimum number of FTE positions. In part, this correlates with the larger geographic size of these facilities (400 to more than 1,000 acres in size), regardless of the level of aircraft activity. The SSA financial analysis builds from the acknowledgment that a majority of U.S. commercial air service airports are operated on a cost recovery basis meaning that costs of running the airport are recovered from airport users. For example, commercial airlines pay the airport to land, use gates/aprons and to rent space in the terminal. The key point to stress in this equation is that commercial airlines have a limited ability to absorb costs associated with airport operations. It is important for the airline Cost Per Enplaned Passenger (CPEP) to be comparable with similar airports in a geographic region. With this framework in mind, the financial planning efforts for SSA build from an assessment of likely operating expenses, which can ultimately help frame the ability of the airport to generate revenues to offset operating costs as well as capital costs. The airport’s projected revenues are derived from three core metrics:
Estimated FTE employment, linked with growth in enplanements and operations;
Average salary and benefit costs per FTE; and
Total salary and benefit costs as a percentage of total operating expenses. 3.2 Projected Airport Operating Revenues Assumptions Financial projections build from the following assumptions, which were developed strictly for the purposes of this financial modeling effort. These assumptions serve as the basis to allow for the properly aligned current financial metrics with forecast inflation estimates:
Airport construction is assumed to begin in FY 2016.
All operating revenues and expenses are inflated at 2.5 percent annually.
All operating revenue and expense estimates have been rounded to the nearest $100.
All operating costs (commissioning/startup) prior to January 1 of DBO+1 are assumed to be capitalized as part of the construction budget.
Aeronautical activities such as fueling are assumed to be handled by the airport Sponsor.
Additionally, while it is likely that FBO activities (aircraft maintenance/repair) would occur at SSA, reflecting a conservative approach, commissions were not incorporated that would be otherwise generated by FBO activity and paid to the airport Sponsor.
Depreciation is not considered in the analysis.
Airports typically have an “other” category for revenues, which include an array of activities, ranging from returns on investments, to cash flow generated from an array of one-time events. This is a relevant detail, particularly after DBO+5, where it is reasonable to assume that “other” revenue streams would begin to develop. Reflecting a conservative approach, “other” revenue was excluded from the analysis.
The analysis of estimated revenues for SSA is focused more closely on the identification of specific revenue streams that can be developed and supported within the constraints and assumptions noted above. In this
South Suburban Airport Master Plan – Draft Financial Feasibility Report May 20, 2013
Section 3 – Projected Airport Revenues Page 13
context, there are several revenue streams that are identified including: commercial airline and air cargo landing fees; terminal rents; fuel sales/flowage commissions; agricultural and other non-terminal land leases; terminal food and beverage/retail leases; parking and rental cars. 3.3 Projected Passenger Aeronautical Revenue As noted previously, commercial air passenger revenues are associated with fees paid by commercial airlines to use the airport. These typically include fees to land aircraft and rents paid to lease various spaces within the terminal. Landing fee assumptions are as follows:
Commercial takeoffs (50 percent of operations), as defined in the approved FAA’s approved SSA Forecast 2009: Verification of 2004 Forecasts, March 23, 2011 (Forecast).
26 A DBO+1 landing fee of $1.00 per 1,000 pounds of Maximum Certified Takeoff Weight (MCTOW), inflated at
2.5 percent annually over the forecast period, beginning in DBO+5. The approach assumes that the landing fee remains constant over the first five years of operation. Judgment regarding the selected rate was based on reported landing fees at Group 1 and Group 2 airports, where the current average landing fees was about $0.89(cents) per 1,000 pounds.
An average aircraft MCTOW in DBO+1 of 82,000 pounds and a DBO+20 of 125,000 pounds. Average aircraft weight is assumed to grow incrementally over the forecast period as larger planes are anticipated to use the airport. Average commercial aircraft weight is projected to increase at an annualized rate of 2.2 percent per year.
Terminal rent assumptions are as follows:
Average terminal rent to airlines of $50 per square foot per year in DBO+1, held constant through DBO+5, after which the annual lease rate inflates at 2.5 percent annually. The base rent has been adjusted through DBO+20 with an occupancy factor, linked with percentage growth in enplanements through DBO+5 and DBO+20 forecast levels. Using this approach, only about four percent of terminal space would be occupied at DBO+1. Judgment regarding the base year terminal rent was based on reviews of a sample of airport financial records.
Total terminal size in DBO+1 of 103,740 square feet, with airline leasable space of 36,470 square feet. The total terminal area increases in line with master plan findings, growing from 103,740 square feet through DBO+5 to 299,000 square feet by DBO+10, and 485,000 square feet by DBO+20. The aforementioned occupancy adjustments were applied to these area measures.
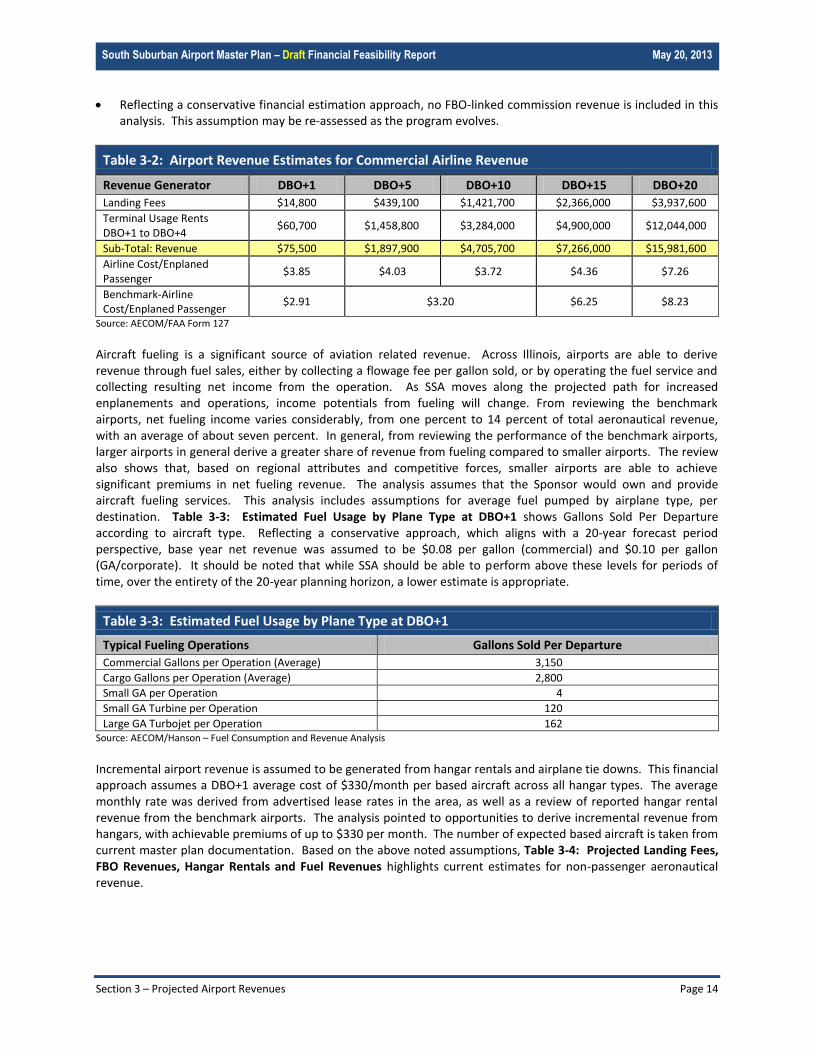
Table 3-2: Airport Revenue Estimates for Commercial Airline Revenue highlights estimated revenues paid by commercial airlines to use SSA. DBO+1 should not be considered as reflective of “stabilized” year operations. Cost factors for DBO+20 are influenced by the overall inflation assumption used throughout the analysis (i.e., 2.5 percent per year, extended over 20 years). In terms of the resulting airline CPEP, for DBO+5 through DBO+10, the projected revenues would appear to be slightly higher than, but still comparable to, the benchmark airports. 3.4 Projected Non-Passenger Aeronautical Revenue Non-passenger revenue streams include landing fees from cargo and larger GA/corporate aircraft with turbofan engines, hangar rentals and fuel flowage fees. Key assumptions are as follows:
For cargo, the landing fee between DBO+1 and DBO+5 is $1.00 per 1,000 pounds of MCTOW; average plane weight is assumed to be 102,000 pounds. Landing fee grows with inflation after DBO+5.
For GA/corporate, the DBO+1 landing fee is assumed at $30 per landing for itinerant turbofan GA/corporate aircraft and inflates annually at 2.5 percent per year.
26 http://www.southsuburbanairport.com/MasterPlan/reports/2009_Forecast_Update_Approved.pdf
South Suburban Airport Master Plan – Draft Financial Feasibility Report May 20, 2013
Section 3 – Projected Airport Revenues Page 14
Reflecting a conservative financial estimation approach, no FBO-linked commission revenue is included in this analysis. This assumption may be re-assessed as the program evolves.
Table 3-2: Airport Revenue Estimates for Commercial Airline Revenue
Revenue Generator DBO+1 DBO+5 DBO+10 DBO+15 DBO+20
Landing Fees $14,800 $439,100 $1,421,700 $2,366,000 $3,937,600
Terminal Usage Rents DBO+1 to DBO+4
$60,700 $1,458,800 $3,284,000 $4,900,000 $12,044,000
Sub-Total: Revenue $75,500 $1,897,900 $4,705,700 $7,266,000 $15,981,600
Airline Cost/Enplaned Passenger
$3.85 $4.03 $3.72 $4.36 $7.26
Benchmark-Airline Cost/Enplaned Passenger
$2.91 $3.20 $6.25 $8.23
Source: AECOM/FAA Form 127
Aircraft fueling is a significant source of aviation related revenue. Across Illinois, airports are able to derive revenue through fuel sales, either by collecting a flowage fee per gallon sold, or by operating the fuel service and collecting resulting net income from the operation. As SSA moves along the projected path for increased enplanements and operations, income potentials from fueling will change. From reviewing the benchmark airports, net fueling income varies considerably, from one percent to 14 percent of total aeronautical revenue, with an average of about seven percent. In general, from reviewing the performance of the benchmark airports, larger airports in general derive a greater share of revenue from fueling compared to smaller airports. The review also shows that, based on regional attributes and competitive forces, smaller airports are able to achieve significant premiums in net fueling revenue. The analysis assumes that the Sponsor would own and provide aircraft fueling services. This analysis includes assumptions for average fuel pumped by airplane type, per destination. Table 3-3: Estimated Fuel Usage by Plane Type at DBO+1 shows Gallons Sold Per Departure according to aircraft type. Reflecting a conservative approach, which aligns with a 20-year forecast period perspective, base year net revenue was assumed to be $0.08 per gallon (commercial) and $0.10 per gallon (GA/corporate). It should be noted that while SSA should be able to perform above these levels for periods of time, over the entirety of the 20-year planning horizon, a lower estimate is appropriate.
Table 3-3: Estimated Fuel Usage by Plane Type at DBO+1
Typical Fueling Operations Gallons Sold Per Departure
Commercial Gallons per Operation (Average) 3,150
Cargo Gallons per Operation (Average) 2,800
Small GA per Operation 4
Small GA Turbine per Operation 120
Large GA Turbojet per Operation 162 Source: AECOM/Hanson – Fuel Consumption and Revenue Analysis
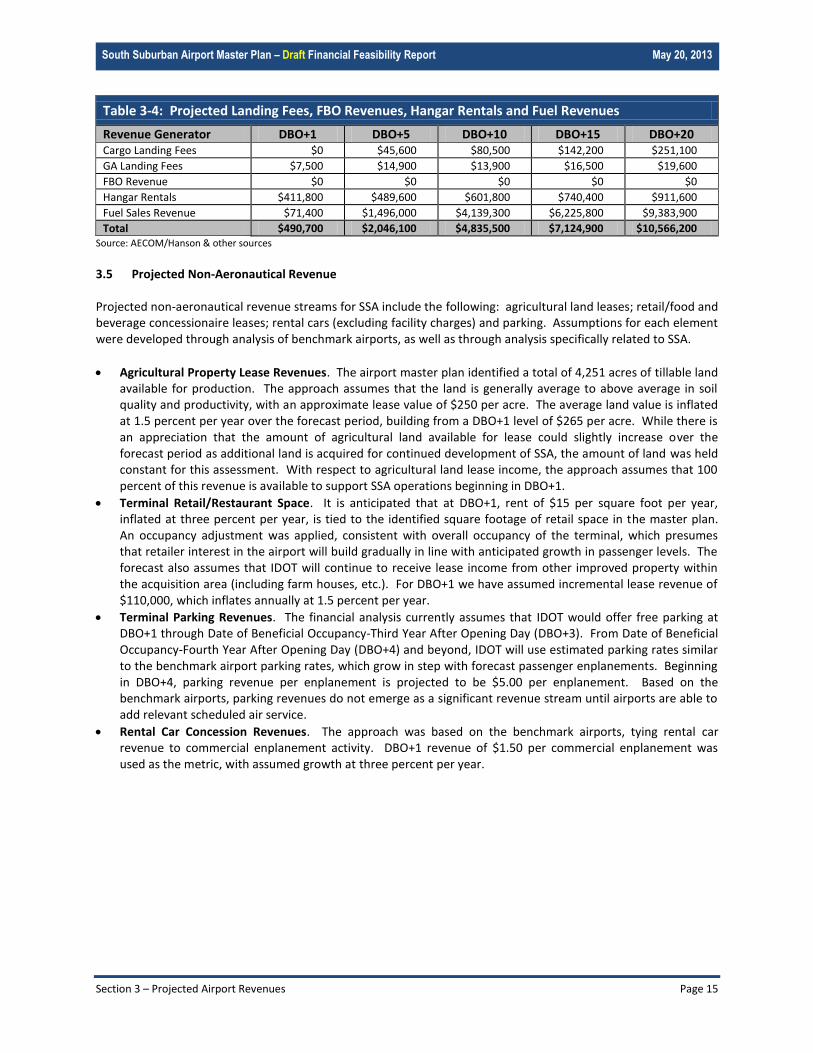
Incremental airport revenue is assumed to be generated from hangar rentals and airplane tie downs. This financial approach assumes a DBO+1 average cost of $330/month per based aircraft across all hangar types. The average monthly rate was derived from advertised lease rates in the area, as well as a review of reported hangar rental revenue from the benchmark airports. The analysis pointed to opportunities to derive incremental revenue from hangars, with achievable premiums of up to $330 per month. The number of expected based aircraft is taken from current master plan documentation. Based on the above noted assumptions, Table 3-4: Projected Landing Fees, FBO Revenues, Hangar Rentals and Fuel Revenues highlights current estimates for non-passenger aeronautical revenue.
South Suburban Airport Master Plan – Draft Financial Feasibility Report May 20, 2013
Section 3 – Projected Airport Revenues Page 15
Table 3-4: Projected Landing Fees, FBO Revenues, Hangar Rentals and Fuel Revenues
Revenue Generator DBO+1 DBO+5 DBO+10 DBO+15 DBO+20 Cargo Landing Fees $0 $45,600 $80,500 $142,200 $251,100
GA Landing Fees $7,500 $14,900 $13,900 $16,500 $19,600
FBO Revenue $0 $0 $0 $0 $0
Hangar Rentals $411,800 $489,600 $601,800 $740,400 $911,600
Fuel Sales Revenue $71,400 $1,496,000 $4,139,300 $6,225,800 $9,383,900
Total $490,700 $2,046,100 $4,835,500 $7,124,900 $10,566,200 Source: AECOM/Hanson & other sources
3.5 Projected Non-Aeronautical Revenue Projected non-aeronautical revenue streams for SSA include the following: agricultural land leases; retail/food and beverage concessionaire leases; rental cars (excluding facility charges) and parking. Assumptions for each element were developed through analysis of benchmark airports, as well as through analysis specifically related to SSA.
Agricultural Property Lease Revenues. The airport master plan identified a total of 4,251 acres of tillable land available for production. The approach assumes that the land is generally average to above average in soil quality and productivity, with an approximate lease value of $250 per acre. The average land value is inflated at 1.5 percent per year over the forecast period, building from a DBO+1 level of $265 per acre. While there is an appreciation that the amount of agricultural land available for lease could slightly increase over the forecast period as additional land is acquired for continued development of SSA, the amount of land was held constant for this assessment. With respect to agricultural land lease income, the approach assumes that 100 percent of this revenue is available to support SSA operations beginning in DBO+1.
Terminal Retail/Restaurant Space. It is anticipated that at DBO+1, rent of $15 per square foot per year, inflated at three percent per year, is tied to the identified square footage of retail space in the master plan. An occupancy adjustment was applied, consistent with overall occupancy of the terminal, which presumes that retailer interest in the airport will build gradually in line with anticipated growth in passenger levels. The forecast also assumes that IDOT will continue to receive lease income from other improved property within the acquisition area (including farm houses, etc.). For DBO+1 we have assumed incremental lease revenue of $110,000, which inflates annually at 1.5 percent per year.
Terminal Parking Revenues. The financial analysis currently assumes that IDOT would offer free parking at DBO+1 through Date of Beneficial Occupancy-Third Year After Opening Day (DBO+3). From Date of Beneficial Occupancy-Fourth Year After Opening Day (DBO+4) and beyond, IDOT will use estimated parking rates similar to the benchmark airport parking rates, which grow in step with forecast passenger enplanements. Beginning in DBO+4, parking revenue per enplanement is projected to be $5.00 per enplanement. Based on the benchmark airports, parking revenues do not emerge as a significant revenue stream until airports are able to add relevant scheduled air service.
Rental Car Concession Revenues. The approach was based on the benchmark airports, tying rental car revenue to commercial enplanement activity. DBO+1 revenue of $1.50 per commercial enplanement was used as the metric, with assumed growth at three percent per year.
South Suburban Airport Master Plan – Draft Financial Feasibility Report May 20, 2013
Section 3 – Projected Airport Revenues Page 16
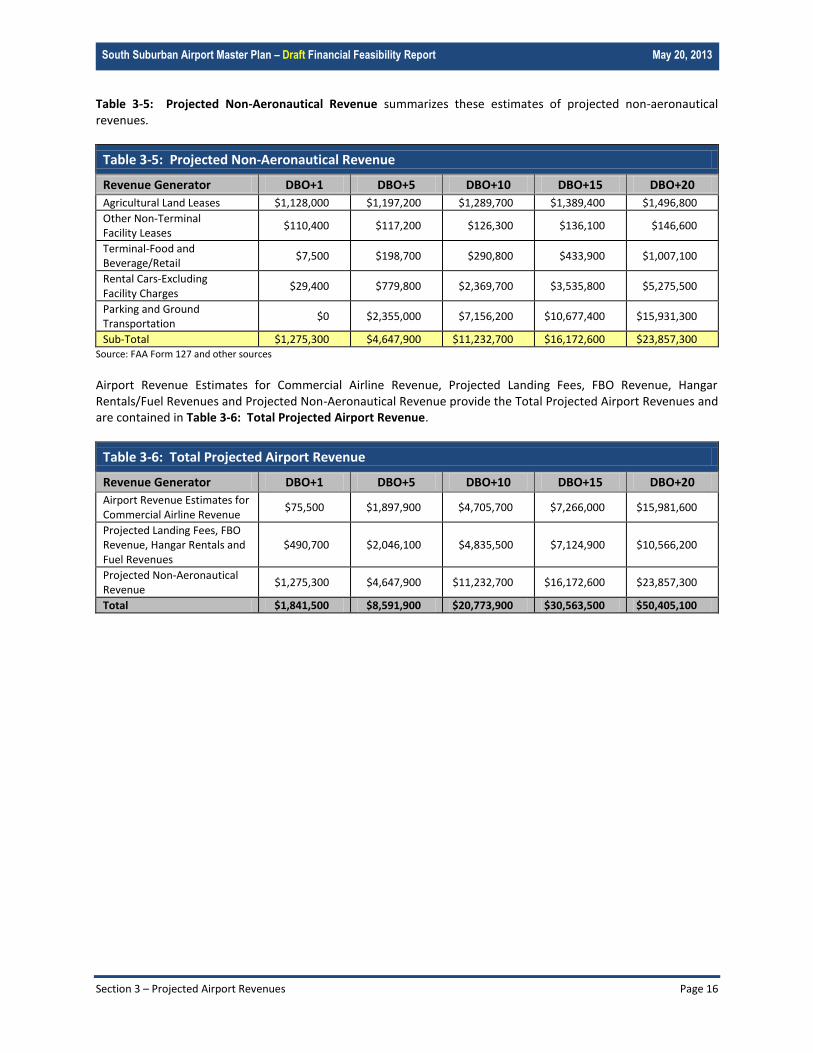
Table 3-5: Projected Non-Aeronautical Revenue summarizes these estimates of projected non-aeronautical revenues.
Table 3-5: Projected Non-Aeronautical Revenue
Revenue Generator DBO+1 DBO+5 DBO+10 DBO+15 DBO+20
Agricultural Land Leases $1,128,000 $1,197,200 $1,289,700 $1,389,400 $1,496,800
Other Non-Terminal Facility Leases
$110,400 $117,200 $126,300 $136,100 $146,600
Terminal-Food and Beverage/Retail
$7,500 $198,700 $290,800 $433,900 $1,007,100
Rental Cars-Excluding Facility Charges
$29,400 $779,800 $2,369,700 $3,535,800 $5,275,500
Parking and Ground Transportation
$0 $2,355,000 $7,156,200 $10,677,400 $15,931,300
Sub-Total $1,275,300 $4,647,900 $11,232,700 $16,172,600 $23,857,300 Source: FAA Form 127 and other sources
Airport Revenue Estimates for Commercial Airline Revenue, Projected Landing Fees, FBO Revenue, Hangar Rentals/Fuel Revenues and Projected Non-Aeronautical Revenue provide the Total Projected Airport Revenues and are contained in Table 3-6: Total Projected Airport Revenue.
Table 3-6: Total Projected Airport Revenue
Revenue Generator DBO+1 DBO+5 DBO+10 DBO+15 DBO+20
Airport Revenue Estimates for Commercial Airline Revenue
$75,500 $1,897,900 $4,705,700 $7,266,000 $15,981,600
Projected Landing Fees, FBO Revenue, Hangar Rentals and Fuel Revenues
$490,700 $2,046,100 $4,835,500 $7,124,900 $10,566,200
Projected Non-Aeronautical Revenue
$1,275,300 $4,647,900 $11,232,700 $16,172,600 $23,857,300
Total $1,841,500 $8,591,900 $20,773,900 $30,563,500 $50,405,100
South Suburban Airport Master Plan – Draft Financial Feasibility Report May 20, 2013
Section 4 – Projected Airport Expenses Page 17
Section 4 – Projected Airport Expenses
4.1 Inaugural Airport Staffing Operation of SSA would create the need to provide appropriate airport management oversight and staffing. This section discusses potential staffing scenarios for the Inaugural Airport Program (IAP). These scenarios are based on aeronautical demand levels contained in the Forecast. SSA will operate as a certificated commercial service airport under FAA Regulations 14 CFR Part 139, commonly referred to as FAR Part 139.
27 The airport will operate
24 hours a day and seven days a week. The facility will be staffed by a combination of full-time/part-time airport employees, contractors/consultants and federal employees. Airlines, concessionaires and other airport tenants would provide their own staff to handle their daily actions. Airport Administration Staffing. Airport administration would be responsible for implementing policies, budgets, procurements, contracts, scheduling oversight and operation of SSA. These responsibilities can be managed by a professional airport staff led by an airport director. It is expected that the airport staff would be periodically augmented with contractors who provide legal, fiduciary, engineering and marketing services. The airport administration would also interface with all appropriate Federal, state and local authorities on behalf of the airport. Airport Maintenance Staffing. Airport maintenance staff would be responsible for the daily activities necessary to keep the airport facilities open and operating safely. These activities would be divided between airside and landside maintenance actions. Airside actions include general maintenance of pavements, vegetation control (grassing cutting and obstruction removal), snow removal and hazardous wildlife attractant management. Landside actions include terminal building janitorial activities, snow removal and maintenance of the airport access road and passenger terminal parking lot, snow removal and maintenance in the GA, air cargo, ATCT, Snow Removal Equipment Complex and maintenance building areas. Airport Public Safety Staffing. Airport public safety staffing would be responsible for daily police and fire protection of the airfield building and grounds. Handling commercial passenger operations at SSA will require the possession of a FAA operational certificate. Requirements for public safety staffing are discussed below. FAR Part 139 – Airport Certificate Staffing Requirements. For an airport to provide commercial passenger service, a FAR Part 139 Certificate must be issued by the FAA. 14 CFR Part 139 requires FAA to issue airport operating certificates to airports that:
serve scheduled and unscheduled air carrier aircraft with more than 30 seats;
serve scheduled air carrier operations in aircraft with more than nine seats but less than 31 seats; and
the FAA Administrator requires an airport to have a certificate. Based on the Forecast and the requirements listed above, SSA must have an issued FAR Part 139 Certificate prior to accepting commercial passenger operations. Airport Operating Certificates serve to ensure safety in air transportation. To obtain a certificate, an airport must agree to certain operational and safety standards and provide for such items as firefighting and rescue equipment. These requirements vary depending on the size of the airport and the type of flights available. To ensure that airports with Airport Operating Certificates are meeting the requirements of Part 139, FAA Airport Certification Safety Inspectors conduct certification inspections. These inspections typically occur yearly, but FAA can also make unannounced inspections. Certification inspections include the following steps:
27 http://www.faa.gov/airports/airport_safety/part139_cert/?p1=what
South Suburban Airport Master Plan – Draft Financial Feasibility Report May 20, 2013
Section 4 – Projected Airport Expenses Page 18
Pre-inspection review of office airport files and airport certification manual.
In-briefing with airport management. Organize inspection time schedule, meet with different airport personnel.
Administrative inspection of airport files, paperwork, etc. Also includes updating the Airport Master Record (FAA Form 5010) and review of the Airport Certification Manual/Specifications (ACM/ACS), Notices to Airmen (NOTAM), airfield self-inspection forms, etc.
Movement area inspection. Check the approach slopes of each runway end; inspect movement areas to monitor the condition of pavement, markings, lighting, signs, abutting shoulders and safety areas; watch ground vehicle operations; ensure the public is protected against inadvertent entry and jet or propeller blast; check for the presence of any wildlife; check the traffic and wind direction indicators.
Aircraft rescue and firefighting inspection. Conduct a timed-response drill; review aircraft rescue and firefighting personnel training records, including annual live-fire drill and documentation of basic emergency medical care training; check equipment and protective clothing for operation, condition and availability.
Fueling facilities inspection. Inspection of fuel farm and mobile fuelers; check airport files for documentation of their quarterly inspections of the fueling facility; review certification from each tenant fueling agent about completion of fire safety training.
Night inspection. Evaluate runway/taxiway and apron lighting and signage, pavement marking, airport beacon, wind cone, lighting and obstruction lighting for compliance with Part 139 and the ACM/ACS. A night inspection is conducted if air carrier operations are conducted or expected to be conducted at an airport at night or the airport has an instrument approach.
Post inspection briefing with airport management. Discuss findings; issue Letter of Correction noting violations and/or discrepancies if any are found; agree on a reasonable date for correcting any violation, and give safety recommendations.
SSA will need to provide staffing to maintain safety of the facility as prescribed by FAR Part 139. One of the more intensive cost centers of a FAR Part 139 Certificate is the requirement for Aircraft Rescue and Fire Fighting
28 (ARFF)
personnel to be available during air carrier operations. The first step in determining daily ARFF needs is to complete an Index Rating Determination. The Index is determined by a combination of air carrier aircraft length and the average daily departures of air carrier aircraft. Except as provided in FAR Part 139.319(c), if there are five or more average daily departures of air carrier aircraft in a single Index group serving that airport, the longest aircraft with an average of five or more daily departures determines the Index required for the airport. When there are fewer than five average daily departures of the longest air carrier aircraft serving the airport, the Index required for the airport will be the next lower Index group than the Index group prescribed for the longest aircraft. Through DBO+5, the longest aircraft identified in the SSA forecast report is the Boeing 737-800 model. This aircraft is 129 ft 6 inches and is in Index C. However, in DBO+1, the operational levels for this aircraft are beneath the five average daily departures listed and thereby place SSA initially in the Index B category.
29 It is anticipated that by DBO+5, SSA will be in the Index C category.
The SSA administration office, in concert with airport police and firefighters, will be required to prepare and keep the FAR Part 139 Certification Manual and Emergency Plan current. All personnel that help support the FAR Part 139 Certification activities will be employees (airport employees or contract) of the Sponsor. The cost of their employment will be the responsibility of the airport. 4.2 Federal Staffing Transportation Safety Administration Staffing.
30 Following September 11, 2001, the TSA was created to secure the
nation’s transportation systems and ensure the freedom of movement for people and commerce. Today, TSA oversees the security of nation’s airports and screens all commercial airline passengers and baggage. TSA uses a
28 http://www.faa.gov/airports/airport_safety/aircraft_rescue_fire_fighting/ 29139.315 Aircraft Rescue and Firefighting: Index determination 30 http://www.tsa.gov/
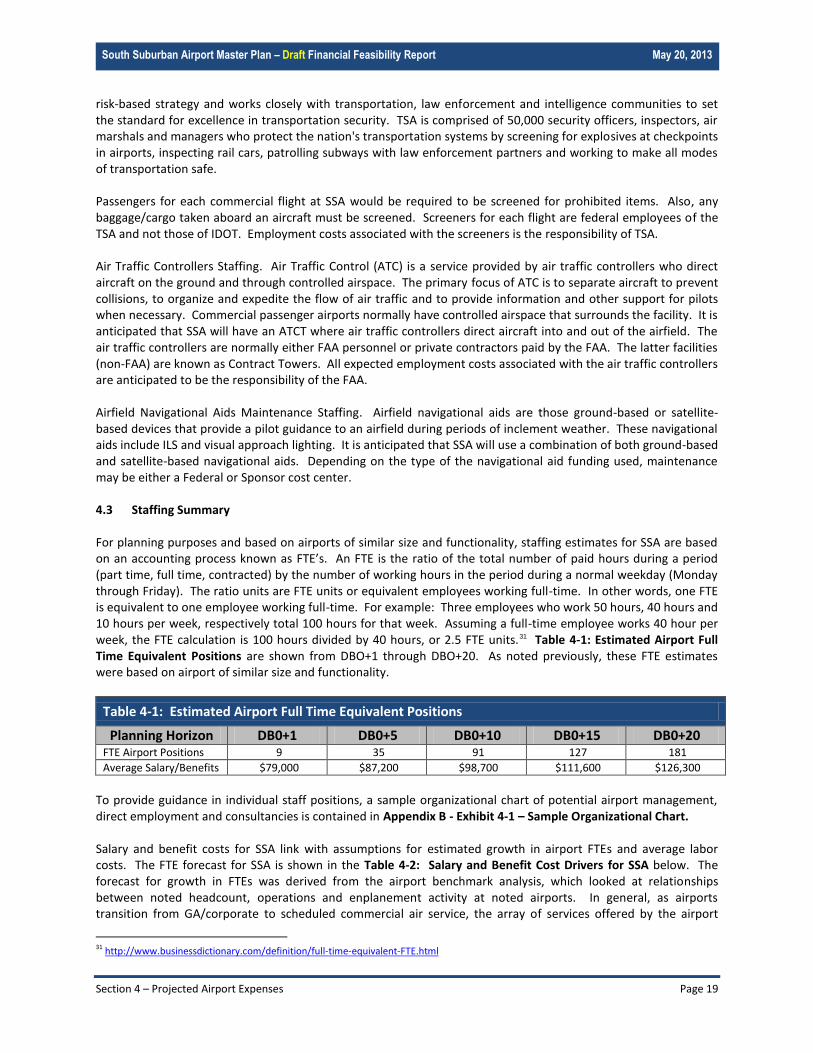
South Suburban Airport Master Plan – Draft Financial Feasibility Report May 20, 2013
Section 4 – Projected Airport Expenses Page 19
risk-based strategy and works closely with transportation, law enforcement and intelligence communities to set the standard for excellence in transportation security. TSA is comprised of 50,000 security officers, inspectors, air marshals and managers who protect the nation's transportation systems by screening for explosives at checkpoints in airports, inspecting rail cars, patrolling subways with law enforcement partners and working to make all modes of transportation safe. Passengers for each commercial flight at SSA would be required to be screened for prohibited items. Also, any baggage/cargo taken aboard an aircraft must be screened. Screeners for each flight are federal employees of the TSA and not those of IDOT. Employment costs associated with the screeners is the responsibility of TSA. Air Traffic Controllers Staffing. Air Traffic Control (ATC) is a service provided by air traffic controllers who direct aircraft on the ground and through controlled airspace. The primary focus of ATC is to separate aircraft to prevent collisions, to organize and expedite the flow of air traffic and to provide information and other support for pilots when necessary. Commercial passenger airports normally have controlled airspace that surrounds the facility. It is anticipated that SSA will have an ATCT where air traffic controllers direct aircraft into and out of the airfield. The air traffic controllers are normally either FAA personnel or private contractors paid by the FAA. The latter facilities (non-FAA) are known as Contract Towers. All expected employment costs associated with the air traffic controllers are anticipated to be the responsibility of the FAA. Airfield Navigational Aids Maintenance Staffing. Airfield navigational aids are those ground-based or satellite-based devices that provide a pilot guidance to an airfield during periods of inclement weather. These navigational aids include ILS and visual approach lighting. It is anticipated that SSA will use a combination of both ground-based and satellite-based navigational aids. Depending on the type of the navigational aid funding used, maintenance may be either a Federal or Sponsor cost center. 4.3 Staffing Summary For planning purposes and based on airports of similar size and functionality, staffing estimates for SSA are based on an accounting process known as FTE’s. An FTE is the ratio of the total number of paid hours during a period (part time, full time, contracted) by the number of working hours in the period during a normal weekday (Monday through Friday). The ratio units are FTE units or equivalent employees working full-time. In other words, one FTE is equivalent to one employee working full-time. For example: Three employees who work 50 hours, 40 hours and 10 hours per week, respectively total 100 hours for that week. Assuming a full-time employee works 40 hour per week, the FTE calculation is 100 hours divided by 40 hours, or 2.5 FTE units.31 Table 4-1: Estimated Airport Full Time Equivalent Positions are shown from DBO+1 through DBO+20. As noted previously, these FTE estimates were based on airport of similar size and functionality.
Table 4-1: Estimated Airport Full Time Equivalent Positions
Planning Horizon DB0+1 DB0+5 DB0+10 DB0+15 DB0+20 FTE Airport Positions 9 35 91 127 181
Average Salary/Benefits $79,000 $87,200 $98,700 $111,600 $126,300
To provide guidance in individual staff positions, a sample organizational chart of potential airport management, direct employment and consultancies is contained in Appendix B - Exhibit 4-1 – Sample Organizational Chart. Salary and benefit costs for SSA link with assumptions for estimated growth in airport FTEs and average labor costs. The FTE forecast for SSA is shown in the Table 4-2: Salary and Benefit Cost Drivers for SSA below. The forecast for growth in FTEs was derived from the airport benchmark analysis, which looked at relationships between noted headcount, operations and enplanement activity at noted airports. In general, as airports transition from GA/corporate to scheduled commercial air service, the array of services offered by the airport
31 http://www.businessdictionary.com/definition/full-time-equivalent-FTE.html
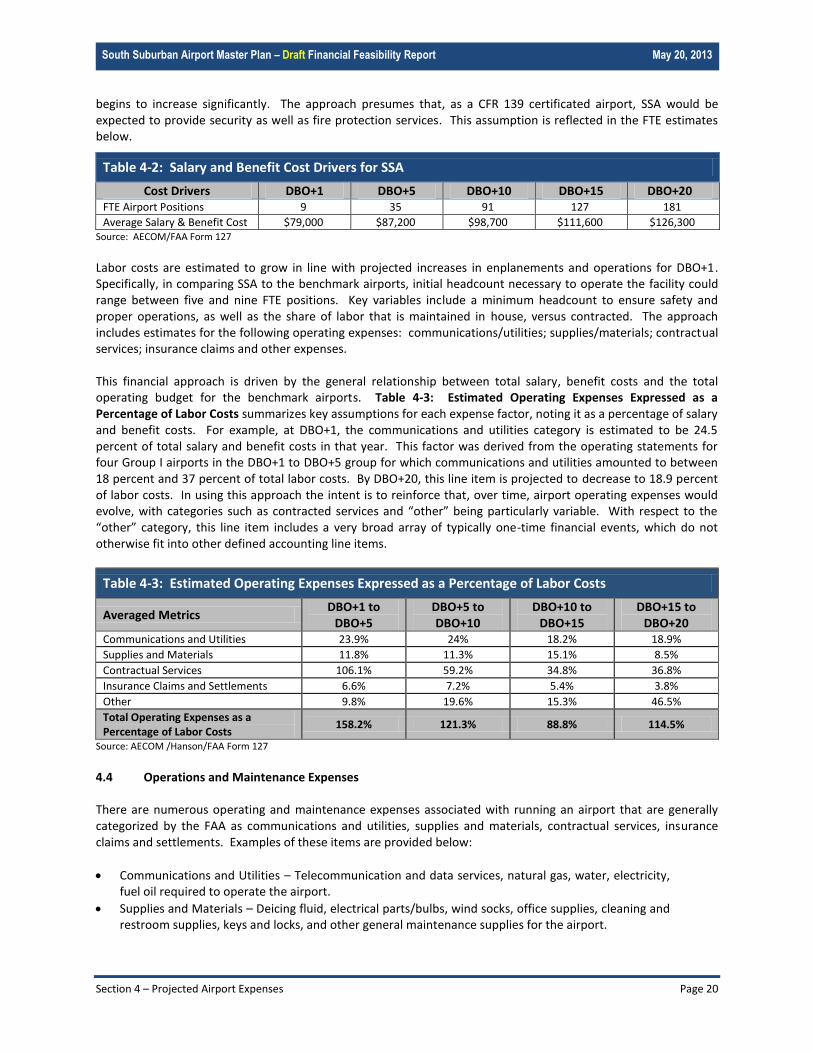
South Suburban Airport Master Plan – Draft Financial Feasibility Report May 20, 2013
Section 4 – Projected Airport Expenses Page 20
begins to increase significantly. The approach presumes that, as a CFR 139 certificated airport, SSA would be expected to provide security as well as fire protection services. This assumption is reflected in the FTE estimates below.
Source: AECOM/FAA Form 127
Labor costs are estimated to grow in line with projected increases in enplanements and operations for DBO+1. Specifically, in comparing SSA to the benchmark airports, initial headcount necessary to operate the facility could range between five and nine FTE positions. Key variables include a minimum headcount to ensure safety and proper operations, as well as the share of labor that is maintained in house, versus contracted. The approach includes estimates for the following operating expenses: communications/utilities; supplies/materials; contractual services; insurance claims and other expenses. This financial approach is driven by the general relationship between total salary, benefit costs and the total operating budget for the benchmark airports. Table 4-3: Estimated Operating Expenses Expressed as a Percentage of Labor Costs summarizes key assumptions for each expense factor, noting it as a percentage of salary and benefit costs. For example, at DBO+1, the communications and utilities category is estimated to be 24.5 percent of total salary and benefit costs in that year. This factor was derived from the operating statements for four Group I airports in the DBO+1 to DBO+5 group for which communications and utilities amounted to between 18 percent and 37 percent of total labor costs. By DBO+20, this line item is projected to decrease to 18.9 percent of labor costs. In using this approach the intent is to reinforce that, over time, airport operating expenses would evolve, with categories such as contracted services and “other” being particularly variable. With respect to the “other” category, this line item includes a very broad array of typically one-time financial events, which do not otherwise fit into other defined accounting line items.
Table 4-3: Estimated Operating Expenses Expressed as a Percentage of Labor Costs
Averaged Metrics DBO+1 to
DBO+5 DBO+5 to DBO+10
DBO+10 to DBO+15
DBO+15 to DBO+20
Communications and Utilities 23.9% 24% 18.2% 18.9%
Supplies and Materials 11.8% 11.3% 15.1% 8.5%
Contractual Services 106.1% 59.2% 34.8% 36.8%
Insurance Claims and Settlements 6.6% 7.2% 5.4% 3.8%
Other 9.8% 19.6% 15.3% 46.5%
Total Operating Expenses as a Percentage of Labor Costs
158.2% 121.3% 88.8% 114.5%
Source: AECOM /Hanson/FAA Form 127
4.4 Operations and Maintenance Expenses There are numerous operating and maintenance expenses associated with running an airport that are generally categorized by the FAA as communications and utilities, supplies and materials, contractual services, insurance claims and settlements. Examples of these items are provided below:
Communications and Utilities – Telecommunication and data services, natural gas, water, electricity, fuel oil required to operate the airport.
Supplies and Materials – Deicing fluid, electrical parts/bulbs, wind socks, office supplies, cleaning and restroom supplies, keys and locks, and other general maintenance supplies for the airport.
Table 4-2: Salary and Benefit Cost Drivers for SSA
Cost Drivers DBO+1 DBO+5 DBO+10 DBO+15 DBO+20 FTE Airport Positions 9 35 91 127 181
Average Salary & Benefit Cost $79,000 $87,200 $98,700 $111,600 $126,300

South Suburban Airport Master Plan – Draft Financial Feasibility Report May 20, 2013
Section 4 – Projected Airport Expenses Page 21
Contractual Services – Costs for outside contractors that provide ramp repair, taxiway painting, outside janitorial for terminals, heating and air conditioning, trash removal, escalator/elevator maintenance, and other general repairs. Professional services could include engineering, legal, accounting and other services.
Other Operating Expenses – Training, equipment rental; machinery, vehicles, and equipment; and miscellaneous administrative expenses.
Table 4-4: Projected Operating Expenses for SSA summarizes estimated operating expenses for SSA over the forecast period. Reflective of the Forecast and based on benchmark airport performance, the total operating budget is estimated to grow over time, increasing from about $1.7 million in DBO+1 to more than $57 million by DBO+20. The projections presume growth in enplanements from the DBO+1 level of 19,600 to 2.2 million by DBO+20.
Table 4-4: Projected Operating Expenses for SSA
Operating Expenses DBO+1 DBO+5 DBO+10 DBO+15 DBO+20
Salaries and Benefits $395,000 $3,053,200 $8,938,000 $14,169,200 $22,911,800
Communications & Utilities $94,500 $646,900 $1,628,100 $2,630,000 $4,333,600
Supplies and Materials $46,600 $402,500 $1,353,800 $1,607,100 $1,945,900
Contractual Services $419,000 $1,972,300 $3,106,000 $5,065,800 $8,427,600
Insurance Claims $26,100 $184,100 $479,300 $642,400 $878,400
Other $38,700 $364,400 $1,367,200 $3,780,100 $10,660,400
Total $1,019,900 $6,623,400 $16,872,400 $27,894,600 $49,157,700 Source: AECOM/Hanson/FAA Form 127
South Suburban Airport Master Plan – Draft Financial Feasibility Report May 20, 2013
Section 5 – Conceptual Development Plan Page 22
Section 5 – Conceptual Development Plan Section 2 – Sources of Airport Funding outlines several areas that funds may be available to construct and operate SSA. Using the CIP contained in the SSA Implementation Report, this section will prepare a conceptual development funding plan to bring the airport into fruition. Funding for the SSA CIP may be available through various Federal agencies including the FAA, TSA, FHWA and the FTA. It is anticipated that SSA may be eligible for funding through various programs administered by these agencies. 5.1 Inaugural Airport Capital Improvement Program Review Section 5 – Inaugural Airport Capital Improvement Program in the SSA Facilities Implementation Plan report details the tasks and capital costs expected to construct the airfield. Specifically, Table 5-2: Inaugural Capital Improvement Program-Construction of the Facilities Implementation Plan report focuses on the construction costs. The CIP serves as a preliminary notice of an airport sponsor’s interest and intent without actually obligating the Sponsor to perform any work or expend any funds. Acceptance of the CIP by the FAA does not imply that the proposed project will be programmed under the AIP. When a project need is identified subsequent to the annual ACIP process, the Sponsor may submit an updated CIP. 5.2 Capital Revenue Projections Capital revenue projections are a compilation of Federal and state funds that could be used in the construction of SSA. Sources under consideration include: FAA-AIP Funding LOI Discretionary plus Entitlements, facilities and equipment funds, TSA Grants, FHWA Grants, FTA Grants, PFCs, State of Illinois General Obligation Bonds and Private Funds.
5.2.1 FAA-AIP Funding LOI Discretionary plus Entitlements AIP funds are apportioned annually by a formula, contained in FAA Order 5100.38C, Airport Improvement Program Handbook, June 28, 2005 to specific airports or types of airports. Primary airports are apportioned AIP funding based on passenger boardings or enplanements. These funds are calculated based on the following:
$7.80 for each of the first 50,000 (0-50,000) passenger boardings at the airport during the prior calendar year;
$5.20 for each of the next 50,000 (50,001-100,000) passenger boardings at the airport during the prior calendar year;
$2.60 for each of the next 400,000 (100,001-500,000) passenger boardings at the airport during the prior calendar year;
$0.65 for each of the next 500,000 (500,001-1,000,000) passenger boardings at the airport during the prior calendar year; and
$0.50 for each passenger boarding in excess of 1,000,000 at the airport during the prior calendar year.
The minimum and maximum apportionments will not be less than $650,000 or more than $22 million. When the total amount available for airport development is greater than $3.2 billion, the apportionments shall be doubled and the minimum apportionment shall not be less than $1,000,000 or greater than $26 million. Table 5-1: Airport Improvement Plan Entitlement Projections depicts the eligible entitlement funding resulting from passenger enplanement levels during each year of the IAP. These entitlement funds are anticipated to be received during the following Federal FY as described in Section 6 – Cash Flow and Financial Feasibility Analysis. It is anticipated that the existing GA/corporate airfield would be incorporated into the IAP. Non-primary entitlements may begin during the fiscal year following the ROD (FY2016). These funds could be available in the fourth year prior to DBO. See Exhibit 5-1 - Project Financial Timeline.
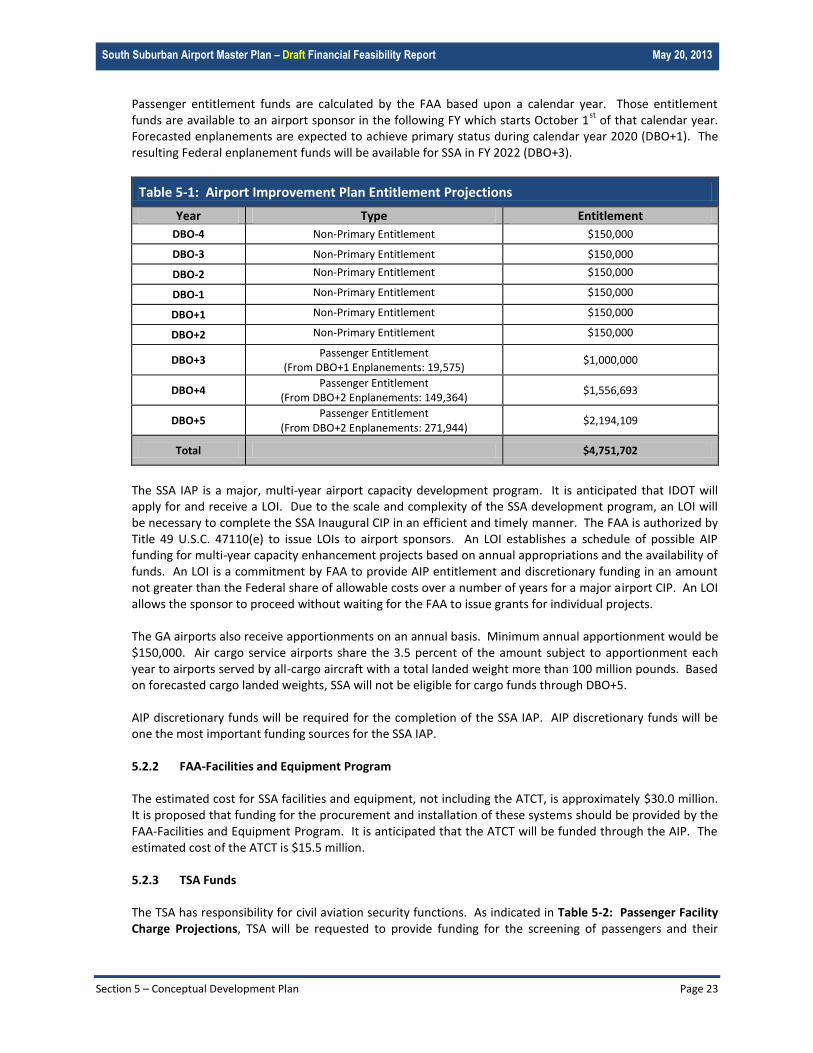
South Suburban Airport Master Plan – Draft Financial Feasibility Report May 20, 2013
Section 5 – Conceptual Development Plan Page 23
Passenger entitlement funds are calculated by the FAA based upon a calendar year. Those entitlement funds are available to an airport sponsor in the following FY which starts October 1
st of that calendar year.
Forecasted enplanements are expected to achieve primary status during calendar year 2020 (DBO+1). The resulting Federal enplanement funds will be available for SSA in FY 2022 (DBO+3).
Table 5-1: Airport Improvement Plan Entitlement Projections
Year Type Entitlement
DBO-4 Non-Primary Entitlement $150,000
DBO-3 Non-Primary Entitlement $150,000
DBO-2 Non-Primary Entitlement $150,000
DBO-1 Non-Primary Entitlement $150,000
DBO+1 Non-Primary Entitlement $150,000
DBO+2 Non-Primary Entitlement $150,000
DBO+3 Passenger Entitlement
(From DBO+1 Enplanements: 19,575) $1,000,000
DBO+4 Passenger Entitlement
(From DBO+2 Enplanements: 149,364) $1,556,693
DBO+5 Passenger Entitlement
(From DBO+2 Enplanements: 271,944) $2,194,109
Total $4,751,702
The SSA IAP is a major, multi-year airport capacity development program. It is anticipated that IDOT will apply for and receive a LOI. Due to the scale and complexity of the SSA development program, an LOI will be necessary to complete the SSA Inaugural CIP in an efficient and timely manner. The FAA is authorized by Title 49 U.S.C. 47110(e) to issue LOIs to airport sponsors. An LOI establishes a schedule of possible AIP funding for multi-year capacity enhancement projects based on annual appropriations and the availability of funds. An LOI is a commitment by FAA to provide AIP entitlement and discretionary funding in an amount not greater than the Federal share of allowable costs over a number of years for a major airport CIP. An LOI allows the sponsor to proceed without waiting for the FAA to issue grants for individual projects. The GA airports also receive apportionments on an annual basis. Minimum annual apportionment would be $150,000. Air cargo service airports share the 3.5 percent of the amount subject to apportionment each year to airports served by all-cargo aircraft with a total landed weight more than 100 million pounds. Based on forecasted cargo landed weights, SSA will not be eligible for cargo funds through DBO+5. AIP discretionary funds will be required for the completion of the SSA IAP. AIP discretionary funds will be one the most important funding sources for the SSA IAP.
5.2.2 FAA-Facilities and Equipment Program The estimated cost for SSA facilities and equipment, not including the ATCT, is approximately $30.0 million. It is proposed that funding for the procurement and installation of these systems should be provided by the FAA-Facilities and Equipment Program. It is anticipated that the ATCT will be funded through the AIP. The estimated cost of the ATCT is $15.5 million. 5.2.3 TSA Funds The TSA has responsibility for civil aviation security functions. As indicated in Table 5-2: Passenger Facility Charge Projections, TSA will be requested to provide funding for the screening of passengers and their

South Suburban Airport Master Plan – Draft Financial Feasibility Report May 20, 2013
Section 5 – Conceptual Development Plan Page 24
baggage. TSA will also be requested to provide funds for airport perimeter security. A detailed explanation of the TSA Funds is discussed in Section 2 – Sources of Airport Funding. 5.2.4 FHWA Grants FHWA Funds will be requested for the construction of a new Interstate 57 interchange and airport access road to provide access to the SSA terminal area. FHWA funds will also be used for the reconstruction and renovation of local access roads. FHWA Funds are discussed in Section 2 – Sources of Airport Funding. 5.2.5 FTA Grants Development of a bus shuttle service from University Park Metra Station to SSA is planned. Funding will be requested from FTA for the construction of the necessary facilities and the acquisition of vehicles. These FTA Funds would be used for pick-up and drop-off areas at the University Park Station and the SSA passenger terminal complex. A more detailed explanation of FTA Funds is set forth in Section 2 – Sources of Airport Funding. 5.2.6 Passenger Facility Charges It is anticipated that the Sponsor would request authorization to collect a PFC of $4.50 per enplaned passenger when airport operations are initiated at DBO. The PFC revenues will be used to pay for eligible projects, such as terminal and air cargo facility development. Table 5-2: Passenger Facility Charges Projections includes an estimate of PFC revenues during the timeframe of DBO through DBO+5. Table 5-2: Passenger Facility Charges Projections indicates that there is a potential eligibility for $5,733,702 in PFCs.
Table 5-2: Passenger Facility Charges Projections
DBO+1 DBO+2 DBO+3 DBO+4 DBO+5 Total
Passenger Enplanements 19,575 149,364 271,944 362,273 471,000 1,274,156
PFC Revenue Potential $88,088 $672,138 $1,223,748 $1,630,229 $2,119,500 $5,733,702
5.2.7 State of Illinois General Obligation Bonds
The State of Illinois General Obligation Bonds are anticipated to be one funding source for the Sponsor’s share of capital costs. See Section 2 – Sources of Airport Funding.
5.2.8 Private Funds
A discussion of the potential use of private funds for airport development is included in Section 2 – Sources of Airport Funding. It is anticipated that $19,373,693 of private funds would be used to develop auto rental facilities and long term air cargo facilities.
5.3 Conceptual Development Funding Projections through DBO+5 Airport development may be financed utilizing a number of sources including Federal and state grants-in-aid, PFCs, CFCs, various types of bonds, airport revenues, Sponsor funds and private financing. SSA is a new airport and would require funding for preconstruction and construction. Many of funding sources have been identified for SSA. One of the main funding sources for the airport development is the FAA’s AIP. These items contained within the AIP include: GA Entitlement Funds (six years at $150,000=$900,000); Passenger Entitlement Funds ($5,650,802); and Discretionary Funding ($430,572,254) as shown in Table 5-3: Conceptual Development Funding Projections through DBO+5.

South Suburban Airport Master Plan – Draft Financial Feasibility Report May 20, 2013
Section 5 – Conceptual Development Plan Page 25
Table 5-3: Conceptual Development Funding Projections through DBO+5
Funding Source Airport Projections Non-Airport Projections
FAA–AIP Funding LOI Discretionary plus Entitlements $436,223,056 Not Applicable
FAA-Facilities and Equipment Program $39,636,680 Not Applicable
TSA Grants Not Applicable $29,191,630
FHWA Grants Not Applicable $72,397,809
FTA Grants Not Applicable $4,216,161
Passenger Facility Charges $2,987,043 Not Applicable
State of Illinois General Obligation Bonds $98,465,893 Not Applicable
Private Funds $19,373,693 Not Applicable
Total Projected Funding* $702,491,000
*The Total Projected Funding is rounded to the nearest thousand.
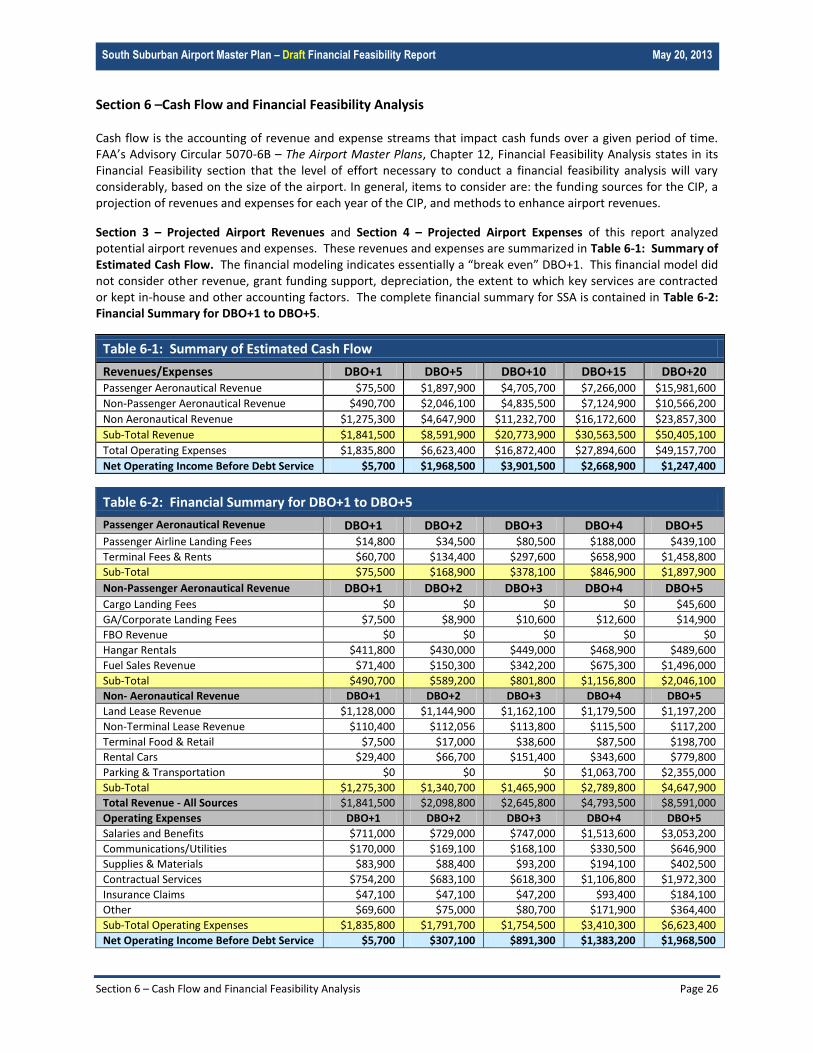
South Suburban Airport Master Plan – Draft Financial Feasibility Report May 20, 2013
Section 6 – Cash Flow and Financial Feasibility Analysis Page 26
Section 6 –Cash Flow and Financial Feasibility Analysis
Cash flow is the accounting of revenue and expense streams that impact cash funds over a given period of time. FAA’s Advisory Circular 5070-6B – The Airport Master Plans, Chapter 12, Financial Feasibility Analysis states in its Financial Feasibility section that the level of effort necessary to conduct a financial feasibility analysis will vary considerably, based on the size of the airport. In general, items to consider are: the funding sources for the CIP, a projection of revenues and expenses for each year of the CIP, and methods to enhance airport revenues.
Section 3 – Projected Airport Revenues and Section 4 – Projected Airport Expenses of this report analyzed potential airport revenues and expenses. These revenues and expenses are summarized in Table 6-1: Summary of Estimated Cash Flow. The financial modeling indicates essentially a “break even” DBO+1. This financial model did not consider other revenue, grant funding support, depreciation, the extent to which key services are contracted or kept in-house and other accounting factors. The complete financial summary for SSA is contained in Table 6-2: Financial Summary for DBO+1 to DBO+5.
Table 6-1: Summary of Estimated Cash Flow
Revenues/Expenses DBO+1 DBO+5 DBO+10 DBO+15 DBO+20 Passenger Aeronautical Revenue $75,500 $1,897,900 $4,705,700 $7,266,000 $15,981,600
Non-Passenger Aeronautical Revenue $490,700 $2,046,100 $4,835,500 $7,124,900 $10,566,200
Non Aeronautical Revenue $1,275,300 $4,647,900 $11,232,700 $16,172,600 $23,857,300
Sub-Total Revenue $1,841,500 $8,591,900 $20,773,900 $30,563,500 $50,405,100
Total Operating Expenses $1,835,800 $6,623,400 $16,872,400 $27,894,600 $49,157,700
Net Operating Income Before Debt Service $5,700 $1,968,500 $3,901,500 $2,668,900 $1,247,400
Table 6-2: Financial Summary for DBO+1 to DBO+5
Passenger Aeronautical Revenue DBO+1 DBO+2 DBO+3 DBO+4 DBO+5 Passenger Airline Landing Fees $14,800 $34,500 $80,500 $188,000 $439,100
Terminal Fees & Rents $60,700 $134,400 $297,600 $658,900 $1,458,800
Sub-Total $75,500 $168,900 $378,100 $846,900 $1,897,900
Non-Passenger Aeronautical Revenue DBO+1 DBO+2 DBO+3 DBO+4 DBO+5 Cargo Landing Fees $0 $0 $0 $0 $45,600
GA/Corporate Landing Fees $7,500 $8,900 $10,600 $12,600 $14,900
FBO Revenue $0 $0 $0 $0 $0
Hangar Rentals $411,800 $430,000 $449,000 $468,900 $489,600
Fuel Sales Revenue $71,400 $150,300 $342,200 $675,300 $1,496,000
Sub-Total $490,700 $589,200 $801,800 $1,156,800 $2,046,100
Non- Aeronautical Revenue DBO+1 DBO+2 DBO+3 DBO+4 DBO+5
Land Lease Revenue $1,128,000 $1,144,900 $1,162,100 $1,179,500 $1,197,200
Non-Terminal Lease Revenue $110,400 $112,056 $113,800 $115,500 $117,200
Terminal Food & Retail $7,500 $17,000 $38,600 $87,500 $198,700
Rental Cars $29,400 $66,700 $151,400 $343,600 $779,800
Parking & Transportation $0 $0 $0 $1,063,700 $2,355,000
Sub-Total $1,275,300 $1,340,700 $1,465,900 $2,789,800 $4,647,900
Total Revenue - All Sources $1,841,500 $2,098,800 $2,645,800 $4,793,500 $8,591,000
Operating Expenses DBO+1 DBO+2 DBO+3 DBO+4 DBO+5
Salaries and Benefits $711,000 $729,000 $747,000 $1,513,600 $3,053,200
Communications/Utilities $170,000 $169,100 $168,100 $330,500 $646,900
Supplies & Materials $83,900 $88,400 $93,200 $194,100 $402,500
Contractual Services $754,200 $683,100 $618,300 $1,106,800 $1,972,300
Insurance Claims $47,100 $47,100 $47,200 $93,400 $184,100
Other $69,600 $75,000 $80,700 $171,900 $364,400
Sub-Total Operating Expenses $1,835,800 $1,791,700 $1,754,500 $3,410,300 $6,623,400
Net Operating Income Before Debt Service $5,700 $307,100 $891,300 $1,383,200 $1,968,500
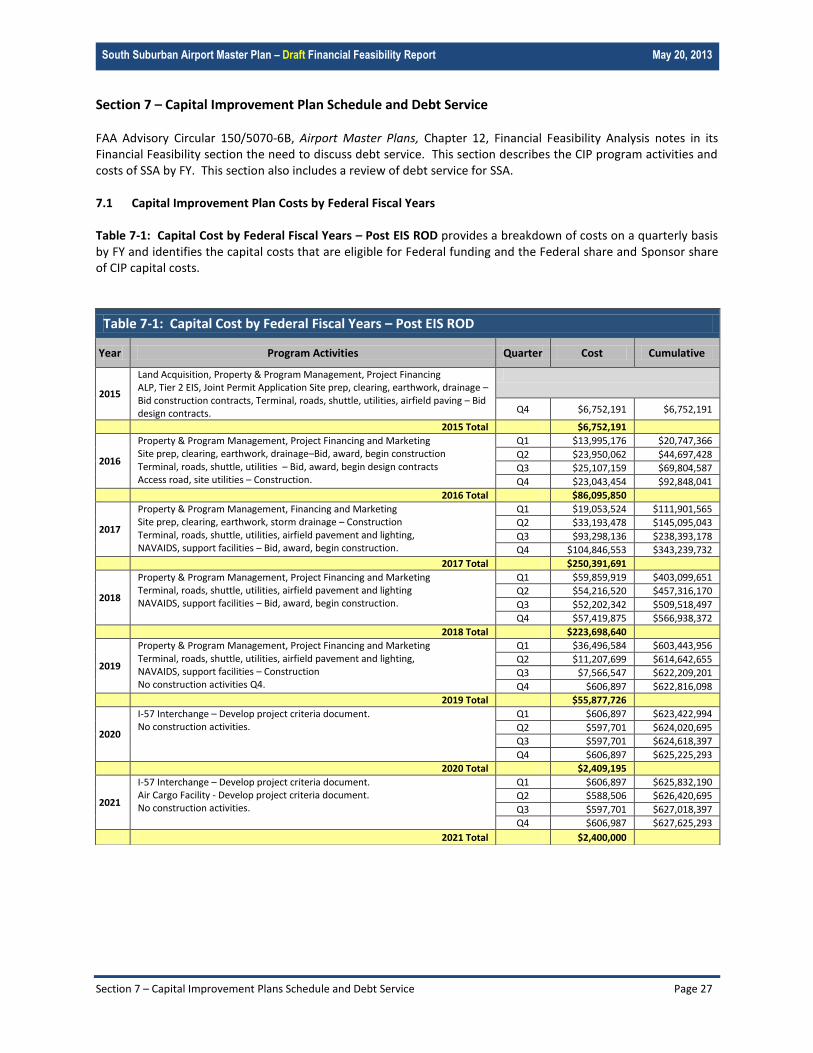
South Suburban Airport Master Plan – Draft Financial Feasibility Report May 20, 2013
Section 7 – Capital Improvement Plans Schedule and Debt Service Page 27
Section 7 – Capital Improvement Plan Schedule and Debt Service FAA Advisory Circular 150/5070-6B, Airport Master Plans, Chapter 12, Financial Feasibility Analysis notes in its Financial Feasibility section the need to discuss debt service. This section describes the CIP program activities and costs of SSA by FY. This section also includes a review of debt service for SSA. 7.1 Capital Improvement Plan Costs by Federal Fiscal Years Table 7-1: Capital Cost by Federal Fiscal Years – Post EIS ROD provides a breakdown of costs on a quarterly basis by FY and identifies the capital costs that are eligible for Federal funding and the Federal share and Sponsor share of CIP capital costs.
Table 7-1: Capital Cost by Federal Fiscal Years – Post EIS ROD
Year Program Activities Quarter Cost Cumulative
2015
Land Acquisition, Property & Program Management, Project Financing ALP, Tier 2 EIS, Joint Permit Application Site prep, clearing, earthwork, drainage – Bid construction contracts, Terminal, roads, shuttle, utilities, airfield paving – Bid design contracts.
Q4 $6,752,191 $6,752,191
2015 Total $6,752,191
2016
Property & Program Management, Project Financing and Marketing Site prep, clearing, earthwork, drainage–Bid, award, begin construction Terminal, roads, shuttle, utilities – Bid, award, begin design contracts Access road, site utilities – Construction.
Q1 $13,995,176 $20,747,366
Q2 $23,950,062 $44,697,428
Q3 $25,107,159 $69,804,587
Q4 $23,043,454 $92,848,041
2016 Total $86,095,850
2017
Property & Program Management, Financing and Marketing Site prep, clearing, earthwork, storm drainage – Construction Terminal, roads, shuttle, utilities, airfield pavement and lighting, NAVAIDS, support facilities – Bid, award, begin construction.
Q1 $19,053,524 $111,901,565
Q2 $33,193,478 $145,095,043
Q3 $93,298,136 $238,393,178
Q4 $104,846,553 $343,239,732
2017 Total $250,391,691
2018
Property & Program Management, Project Financing and Marketing Terminal, roads, shuttle, utilities, airfield pavement and lighting NAVAIDS, support facilities – Bid, award, begin construction.
Q1 $59,859,919 $403,099,651
Q2 $54,216,520 $457,316,170
Q3 $52,202,342 $509,518,497
Q4 $57,419,875 $566,938,372
2018 Total $223,698,640
2019
Property & Program Management, Project Financing and Marketing Terminal, roads, shuttle, utilities, airfield pavement and lighting, NAVAIDS, support facilities – Construction No construction activities Q4.
Q1 $36,496,584 $603,443,956
Q2 $11,207,699 $614,642,655
Q3 $7,566,547 $622,209,201
Q4 $606,897 $622,816,098
2019 Total $55,877,726
2020
I-57 Interchange – Develop project criteria document. No construction activities.
Q1 $606,897 $623,422,994
Q2 $597,701 $624,020,695
Q3 $597,701 $624,618,397
Q4 $606,897 $625,225,293
2020 Total $2,409,195
2021
I-57 Interchange – Develop project criteria document. Air Cargo Facility - Develop project criteria document. No construction activities.
Q1 $606,897 $625,832,190
Q2 $588,506 $626,420,695
Q3 $597,701 $627,018,397
Q4 $606,987 $627,625,293
2021 Total $2,400,000
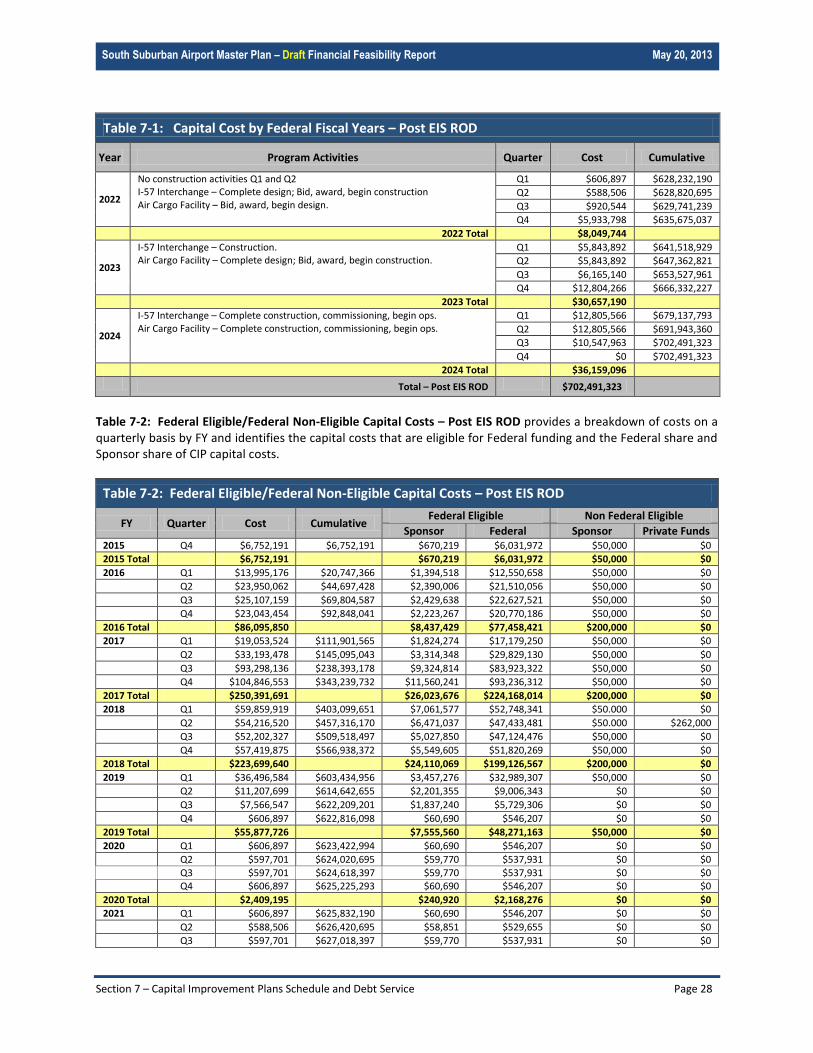
South Suburban Airport Master Plan – Draft Financial Feasibility Report May 20, 2013
Section 7 – Capital Improvement Plans Schedule and Debt Service Page 28
Table 7-2: Federal Eligible/Federal Non-Eligible Capital Costs – Post EIS ROD provides a breakdown of costs on a quarterly basis by FY and identifies the capital costs that are eligible for Federal funding and the Federal share and Sponsor share of CIP capital costs.
Table 7-2: Federal Eligible/Federal Non-Eligible Capital Costs – Post EIS ROD
FY Quarter Cost Cumulative Federal Eligible Non Federal Eligible
Sponsor Federal Sponsor Private Funds 2015 Q4 $6,752,191 $6,752,191 $670,219 $6,031,972 $50,000 $0
2015 Total $6,752,191 $670,219 $6,031,972 $50,000 $0
2016 Q1 $13,995,176 $20,747,366 $1,394,518 $12,550,658 $50,000 $0
Q2 $23,950,062 $44,697,428 $2,390,006 $21,510,056 $50,000 $0
Q3 $25,107,159 $69,804,587 $2,429,638 $22,627,521 $50,000 $0
Q4 $23,043,454 $92,848,041 $2,223,267 $20,770,186 $50,000 $0
2016 Total $86,095,850 $8,437,429 $77,458,421 $200,000 $0
2017 Q1 $19,053,524 $111,901,565 $1,824,274 $17,179,250 $50,000 $0
Q2 $33,193,478 $145,095,043 $3,314,348 $29,829,130 $50,000 $0
Q3 $93,298,136 $238,393,178 $9,324,814 $83,923,322 $50,000 $0
Q4 $104,846,553 $343,239,732 $11,560,241 $93,236,312 $50,000 $0
2017 Total $250,391,691 $26,023,676 $224,168,014 $200,000 $0
2018 Q1 $59,859,919 $403,099,651 $7,061,577 $52,748,341 $50.000 $0
Q2 $54,216,520 $457,316,170 $6,471,037 $47,433,481 $50.000 $262,000
Q3 $52,202,327 $509,518,497 $5,027,850 $47,124,476 $50,000 $0
Q4 $57,419,875 $566,938,372 $5,549,605 $51,820,269 $50,000 $0
2018 Total $223,699,640 $24,110,069 $199,126,567 $200,000 $0
2019 Q1 $36,496,584 $603,434,956 $3,457,276 $32,989,307 $50,000 $0
Q2 $11,207,699 $614,642,655 $2,201,355 $9,006,343 $0 $0
Q3 $7,566,547 $622,209,201 $1,837,240 $5,729,306 $0 $0
Q4 $606,897 $622,816,098 $60,690 $546,207 $0 $0
2019 Total $55,877,726 $7,555,560 $48,271,163 $50,000 $0
2020 Q1 $606,897 $623,422,994 $60,690 $546,207 $0 $0
Q2 $597,701 $624,020,695 $59,770 $537,931 $0 $0
Q3 $597,701 $624,618,397 $59,770 $537,931 $0 $0 Q4 $606,897 $625,225,293 $60,690 $546,207 $0 $0
2020 Total $2,409,195 $240,920 $2,168,276 $0 $0
2021 Q1 $606,897 $625,832,190 $60,690 $546,207 $0 $0
Q2 $588,506 $626,420,695 $58,851 $529,655 $0 $0
Q3 $597,701 $627,018,397 $59,770 $537,931 $0 $0
Table 7-1: Capital Cost by Federal Fiscal Years – Post EIS ROD
Year Program Activities Quarter Cost Cumulative
2022
No construction activities Q1 and Q2 I-57 Interchange – Complete design; Bid, award, begin construction Air Cargo Facility – Bid, award, begin design.
Q1 $606,897 $628,232,190
Q2 $588,506 $628,820,695
Q3 $920,544 $629,741,239
Q4 $5,933,798 $635,675,037
2022 Total $8,049,744
2023
I-57 Interchange – Construction. Air Cargo Facility – Complete design; Bid, award, begin construction.
Q1 $5,843,892 $641,518,929
Q2 $5,843,892 $647,362,821
Q3 $6,165,140 $653,527,961
Q4 $12,804,266 $666,332,227
2023 Total $30,657,190
2024
I-57 Interchange – Complete construction, commissioning, begin ops. Air Cargo Facility – Complete construction, commissioning, begin ops.
Q1 $12,805,566 $679,137,793
Q2 $12,805,566 $691,943,360
Q3 $10,547,963 $702,491,323
Q4 $0 $702,491,323
2024 Total $36,159,096
Total – Post EIS ROD $702,491,323
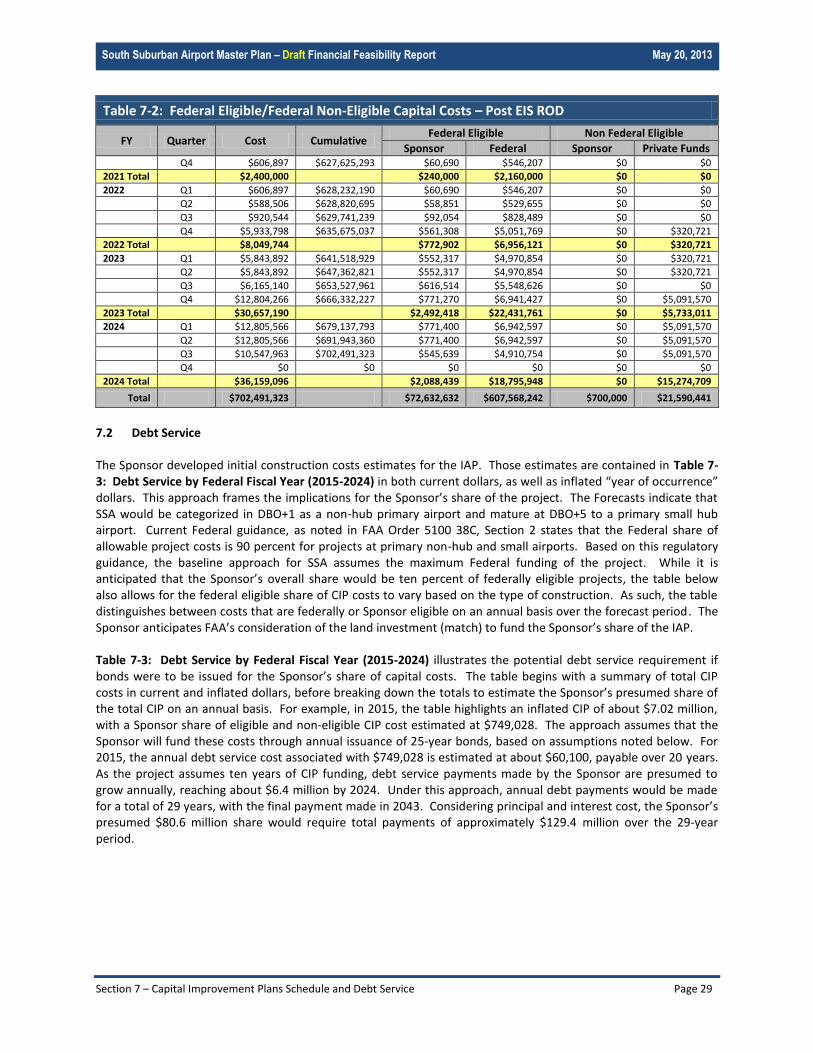
South Suburban Airport Master Plan – Draft Financial Feasibility Report May 20, 2013
Section 7 – Capital Improvement Plans Schedule and Debt Service Page 29
Table 7-2: Federal Eligible/Federal Non-Eligible Capital Costs – Post EIS ROD
FY Quarter Cost Cumulative Federal Eligible Non Federal Eligible
Sponsor Federal Sponsor Private Funds Q4 $606,897 $627,625,293 $60,690 $546,207 $0 $0
2021 Total $2,400,000 $240,000 $2,160,000 $0 $0
2022 Q1 $606,897 $628,232,190 $60,690 $546,207 $0 $0
Q2 $588,506 $628,820,695 $58,851 $529,655 $0 $0
Q3 $920,544 $629,741,239 $92,054 $828,489 $0 $0
Q4 $5,933,798 $635,675,037 $561,308 $5,051,769 $0 $320,721
2022 Total $8,049,744 $772,902 $6,956,121 $0 $320,721
2023 Q1 $5,843,892 $641,518,929 $552,317 $4,970,854 $0 $320,721
Q2 $5,843,892 $647,362,821 $552,317 $4,970,854 $0 $320,721
Q3 $6,165,140 $653,527,961 $616,514 $5,548,626 $0 $0
Q4 $12,804,266 $666,332,227 $771,270 $6,941,427 $0 $5,091,570
2023 Total $30,657,190 $2,492,418 $22,431,761 $0 $5,733,011
2024 Q1 $12,805,566 $679,137,793 $771,400 $6,942,597 $0 $5,091,570
Q2 $12,805,566 $691,943,360 $771,400 $6,942,597 $0 $5,091,570
Q3 $10,547,963 $702,491,323 $545,639 $4,910,754 $0 $5,091,570
Q4 $0 $0 $0 $0 $0 $0
2024 Total $36,159,096 $2,088,439 $18,795,948 $0 $15,274,709
Total $702,491,323 $72,632,632 $607,568,242 $700,000 $21,590,441
7.2 Debt Service The Sponsor developed initial construction costs estimates for the IAP. Those estimates are contained in Table 7-3: Debt Service by Federal Fiscal Year (2015-2024) in both current dollars, as well as inflated “year of occurrence” dollars. This approach frames the implications for the Sponsor’s share of the project. The Forecasts indicate that SSA would be categorized in DBO+1 as a non-hub primary airport and mature at DBO+5 to a primary small hub airport. Current Federal guidance, as noted in FAA Order 5100 38C, Section 2 states that the Federal share of allowable project costs is 90 percent for projects at primary non-hub and small airports. Based on this regulatory guidance, the baseline approach for SSA assumes the maximum Federal funding of the project. While it is anticipated that the Sponsor’s overall share would be ten percent of federally eligible projects, the table below also allows for the federal eligible share of CIP costs to vary based on the type of construction. As such, the table distinguishes between costs that are federally or Sponsor eligible on an annual basis over the forecast period. The Sponsor anticipates FAA’s consideration of the land investment (match) to fund the Sponsor’s share of the IAP. Table 7-3: Debt Service by Federal Fiscal Year (2015-2024) illustrates the potential debt service requirement if bonds were to be issued for the Sponsor’s share of capital costs. The table begins with a summary of total CIP costs in current and inflated dollars, before breaking down the totals to estimate the Sponsor’s presumed share of the total CIP on an annual basis. For example, in 2015, the table highlights an inflated CIP of about $7.02 million, with a Sponsor share of eligible and non-eligible CIP cost estimated at $749,028. The approach assumes that the Sponsor will fund these costs through annual issuance of 25-year bonds, based on assumptions noted below. For 2015, the annual debt service cost associated with $749,028 is estimated at about $60,100, payable over 20 years. As the project assumes ten years of CIP funding, debt service payments made by the Sponsor are presumed to grow annually, reaching about $6.4 million by 2024. Under this approach, annual debt payments would be made for a total of 29 years, with the final payment made in 2043. Considering principal and interest cost, the Sponsor’s presumed $80.6 million share would require total payments of approximately $129.4 million over the 29-year period.
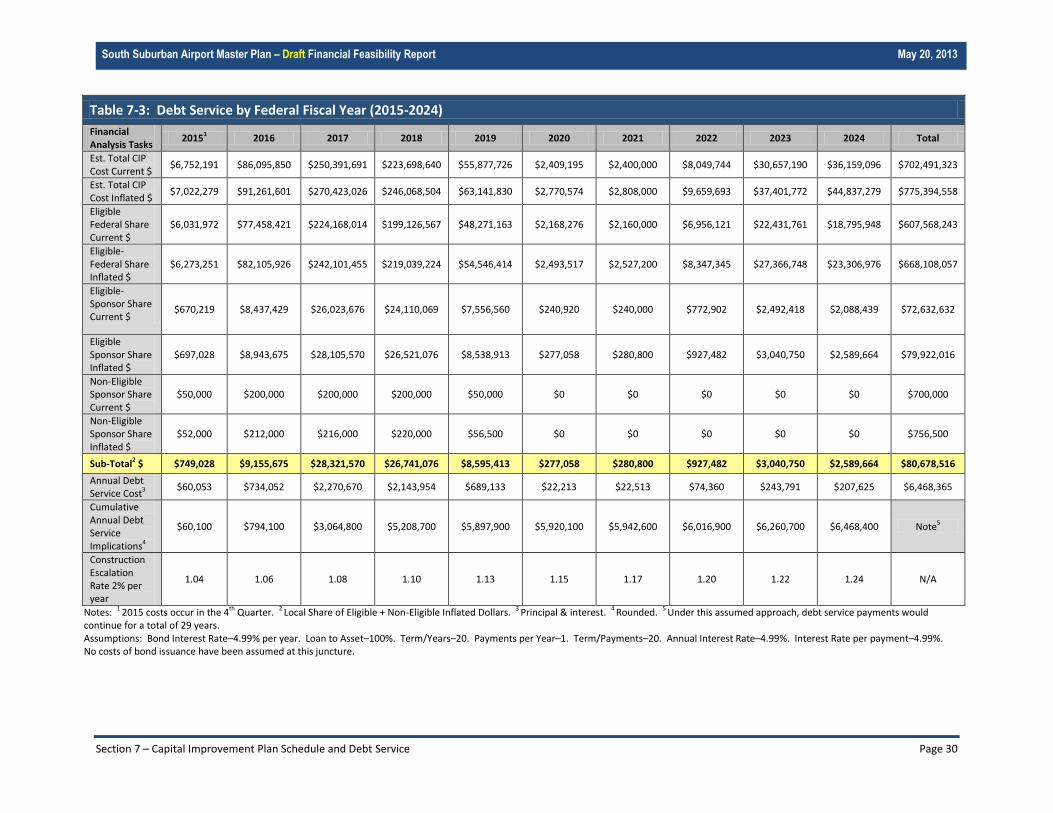
South Suburban Airport Master Plan – Draft Financial Feasibility Report May 20, 2013
Section 7 – Capital Improvement Plan Schedule and Debt Service Page 30
Table 7-3: Debt Service by Federal Fiscal Year (2015-2024)
Financial Analysis Tasks
20151 2016 2017 2018 2019 2020 2021 2022 2023 2024 Total
Est. Total CIP Cost Current $
$6,752,191 $86,095,850 $250,391,691 $223,698,640 $55,877,726 $2,409,195 $2,400,000 $8,049,744 $30,657,190 $36,159,096 $702,491,323
Est. Total CIP Cost Inflated $
$7,022,279 $91,261,601 $270,423,026 $246,068,504 $63,141,830 $2,770,574 $2,808,000 $9,659,693 $37,401,772 $44,837,279 $775,394,558
Eligible Federal Share Current $
$6,031,972 $77,458,421 $224,168,014 $199,126,567 $48,271,163 $2,168,276 $2,160,000 $6,956,121 $22,431,761 $18,795,948 $607,568,243
Eligible-Federal Share Inflated $
$6,273,251 $82,105,926 $242,101,455 $219,039,224 $54,546,414 $2,493,517 $2,527,200 $8,347,345 $27,366,748 $23,306,976 $668,108,057
Eligible-Sponsor Share Current $
$670,219 $8,437,429 $26,023,676 $24,110,069 $7,556,560 $240,920 $240,000 $772,902 $2,492,418 $2,088,439 $72,632,632
Eligible Sponsor Share Inflated $
$697,028 $8,943,675 $28,105,570 $26,521,076 $8,538,913 $277,058 $280,800 $927,482 $3,040,750 $2,589,664 $79,922,016
Non-Eligible Sponsor Share Current $
$50,000 $200,000 $200,000 $200,000 $50,000 $0 $0 $0 $0 $0 $700,000
Non-Eligible Sponsor Share Inflated $
$52,000 $212,000 $216,000 $220,000 $56,500 $0 $0 $0 $0 $0 $756,500
Sub-Total2 $ $749,028 $9,155,675 $28,321,570 $26,741,076 $8,595,413 $277,058 $280,800 $927,482 $3,040,750 $2,589,664 $80,678,516
Annual Debt Service Cost3
$60,053 $734,052 $2,270,670 $2,143,954 $689,133 $22,213 $22,513 $74,360 $243,791 $207,625 $6,468,365
Cumulative Annual Debt Service Implications4
$60,100 $794,100 $3,064,800 $5,208,700 $5,897,900 $5,920,100 $5,942,600 $6,016,900 $6,260,700 $6,468,400 Note5
Construction Escalation Rate 2% per year
1.04 1.06 1.08 1.10 1.13 1.15 1.17 1.20 1.22 1.24 N/A
Notes: 1 2015 costs occur in the 4th Quarter. 2 Local Share of Eligible + Non-Eligible Inflated Dollars. 3 Principal & interest. 4 Rounded. 5 Under this assumed approach, debt service payments would continue for a total of 29 years. Assumptions: Bond Interest Rate–4.99% per year. Loan to Asset–100%. Term/Years–20. Payments per Year–1. Term/Payments–20. Annual Interest Rate–4.99%. Interest Rate per payment–4.99%. No costs of bond issuance have been assumed at this juncture.
South Suburban Airport Master Plan – Draft Financial Feasibility Report May 20, 2013
Section 8 – Financial Conclusions Page 31
Section 8 - Financial Conclusions As demonstrated in this report the financial feasibility of SSA is based on a number of key factors. These factors include anticipated project funding and airport revenues and expenses. The Sponsor has demonstrated financial support for SSA by committing $200 million to site selection, master planning, environmental analysis and land acquisition. These efforts have resulted in FAA actions through the Tier 1 EIS/ROD (site approval and protection) and subsequent approval and/or acceptance of numerous airport master plan and environmental reports. In accordance with FAA AC 150-5070-6B Airport Master Plans, Chapter 12, Financial Feasibility Analysis, this report:
demonstrates the ability of IDOT to fund the proposed CIP for the SSA; and
indicates that the airport rates and charges would be comparable with other airports in the region as reflected in the airline costs per enplaned passenger.
8.1 IDOT’s Ability to Fund the CIP
IDOT is an eligible airport Sponsor based on the Illinois state statutes. Specifically contained in the following:
(620 ILCS 5/25.01) (from Ch. 15 1/2, par. 22.25a) Sec. 25.01. This state or any political subdivision of this state is authorized to acquire, establish, construct, own, control, lease, equip, improve, maintain and operate airports, or restricted landing areas, or other air navigation facilities in an adjoining state whose laws permit, subject to the laws of such state, but subject to the laws of this state in all matters relating to financing such projects. (Source: Laws 1963, p. 1812.)
In accordance with the FAA AIP Handbook and referenced enabling statutory authority, the Sponsor is eligible to receive AIP funding. Furthermore, SSA is a facility listed in the NPIAS under Temporary ID 2043 and thereby eligible to receive Federal funding through the AIP. A conceptual funding plan is included in Section 5 – Conceptual Development Plan of this report. This table demonstrates the ability of the Sponsor, with eligible Federal support, to fund the proposed Inaugural CIP for SSA. Proposed sources of funding may include Federal Airport Funding Sources, PFC, state funding, Customer Facility Charges (CFC) and private funds. Examples of private funds include commercial auto rentals, parking and retail/concession development and management companies. The analysis indicates that the potential available funding is sufficient to cover the anticipated costs of the SSA CIP. 8.2 Reasonable Rates and Charges A database of financial information for comparable airports has been compiled. This data was used to help estimate the projected revenues, expenses, and comparable rates and charges for SSA. The SSA airline CPEP has been calculated and is presented in Table 3-2: Airport Revenue Estimates for Commercial Airline Revenue. Table 3-6: Total Projected Airport Revenue contains anticipated SSA revenues and Table 4-4: Projected Operating Expenses for SSA contains anticipated SSA expenses. SSA compares favorably to the benchmark airports. Therefore, the financial analysis indicates that the SSA rates and charges are reasonable and are similar to comparable airports in other multiple airport systems. 8.3 Financial Management of the Airport The financial analysis presents the projected airport revenues and expenses for the first five years of operation of SSA. Revenues and expenses are also presented for DBO+10, DBO+15 and DBO+20. The projected revenues are based on the level of operations and enplanements included in the Forecast and analysis of the financial data and performance of comparable benchmark airports. The financial analysis indicates that the projected budgets would be balanced on a FY basis, that the airport operations would generate positive cash flow and that the airport would have a positive net operating income. Therefore, this financial analysis has indicated that SSA would be operated in a self-sufficient, financially fit and sustainable manner.
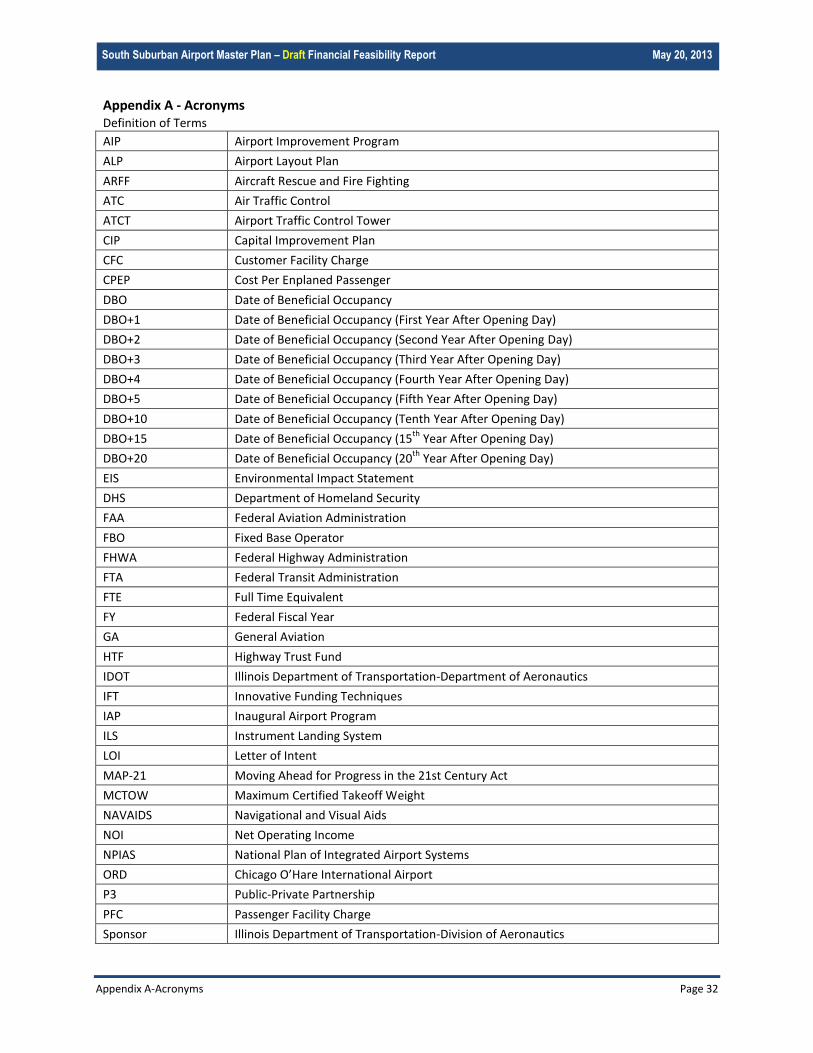
South Suburban Airport Master Plan – Draft Financial Feasibility Report May 20, 2013
Appendix A-Acronyms Page 32
Appendix A - Acronyms
Definition of Terms
AIP Airport Improvement Program
ALP Airport Layout Plan
ARFF Aircraft Rescue and Fire Fighting
ATC Air Traffic Control
ATCT Airport Traffic Control Tower
CIP Capital Improvement Plan
CFC Customer Facility Charge
CPEP Cost Per Enplaned Passenger
DBO Date of Beneficial Occupancy
DBO+1 Date of Beneficial Occupancy (First Year After Opening Day)
DBO+2 Date of Beneficial Occupancy (Second Year After Opening Day)
DBO+3 Date of Beneficial Occupancy (Third Year After Opening Day)
DBO+4 Date of Beneficial Occupancy (Fourth Year After Opening Day)
DBO+5 Date of Beneficial Occupancy (Fifth Year After Opening Day)
DBO+10 Date of Beneficial Occupancy (Tenth Year After Opening Day)
DBO+15 Date of Beneficial Occupancy (15th
Year After Opening Day)
DBO+20 Date of Beneficial Occupancy (20th
Year After Opening Day)
EIS Environmental Impact Statement
DHS Department of Homeland Security
FAA Federal Aviation Administration
FBO Fixed Base Operator
FHWA Federal Highway Administration
FTA Federal Transit Administration
FTE Full Time Equivalent
FY Federal Fiscal Year
GA General Aviation
HTF Highway Trust Fund
IDOT Illinois Department of Transportation-Department of Aeronautics
IFT Innovative Funding Techniques
IAP Inaugural Airport Program
ILS Instrument Landing System
LOI Letter of Intent
MAP-21 Moving Ahead for Progress in the 21st Century Act
MCTOW Maximum Certified Takeoff Weight
NAVAIDS Navigational and Visual Aids
NOI Net Operating Income
NPIAS National Plan of Integrated Airport Systems
ORD Chicago O’Hare International Airport
P3 Public-Private Partnership
PFC Passenger Facility Charge
Sponsor Illinois Department of Transportation-Division of Aeronautics
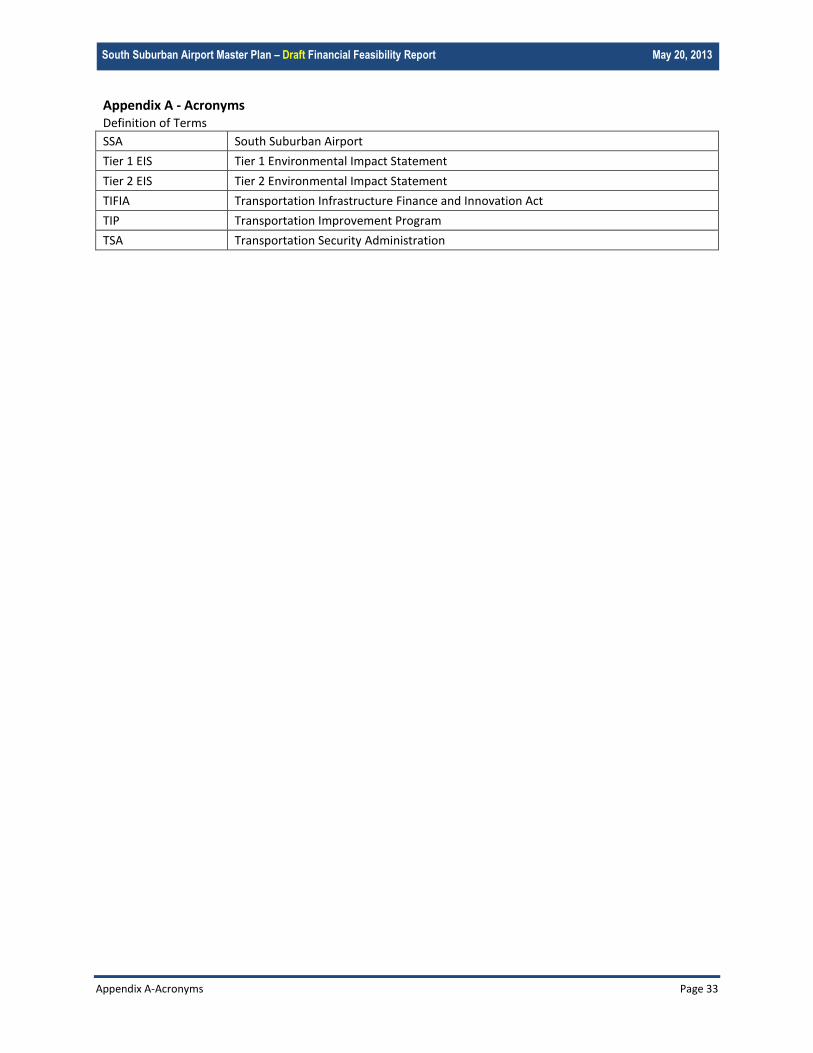
South Suburban Airport Master Plan – Draft Financial Feasibility Report May 20, 2013
Appendix A-Acronyms Page 33
Appendix A - Acronyms
Definition of Terms
SSA South Suburban Airport
Tier 1 EIS Tier 1 Environmental Impact Statement
Tier 2 EIS Tier 2 Environmental Impact Statement
TIFIA Transportation Infrastructure Finance and Innovation Act
TIP Transportation Improvement Program
TSA Transportation Security Administration

South Suburban Airport Master Plan – Draft Financial Feasibility Report May 20, 2013
Appendix B-Exhibits Page 34
Appendix B – Exhibits Exhibit 4-1 – Sample Organizational Chart Exhibit 5-1 – Entitlement Eligibility Timeline
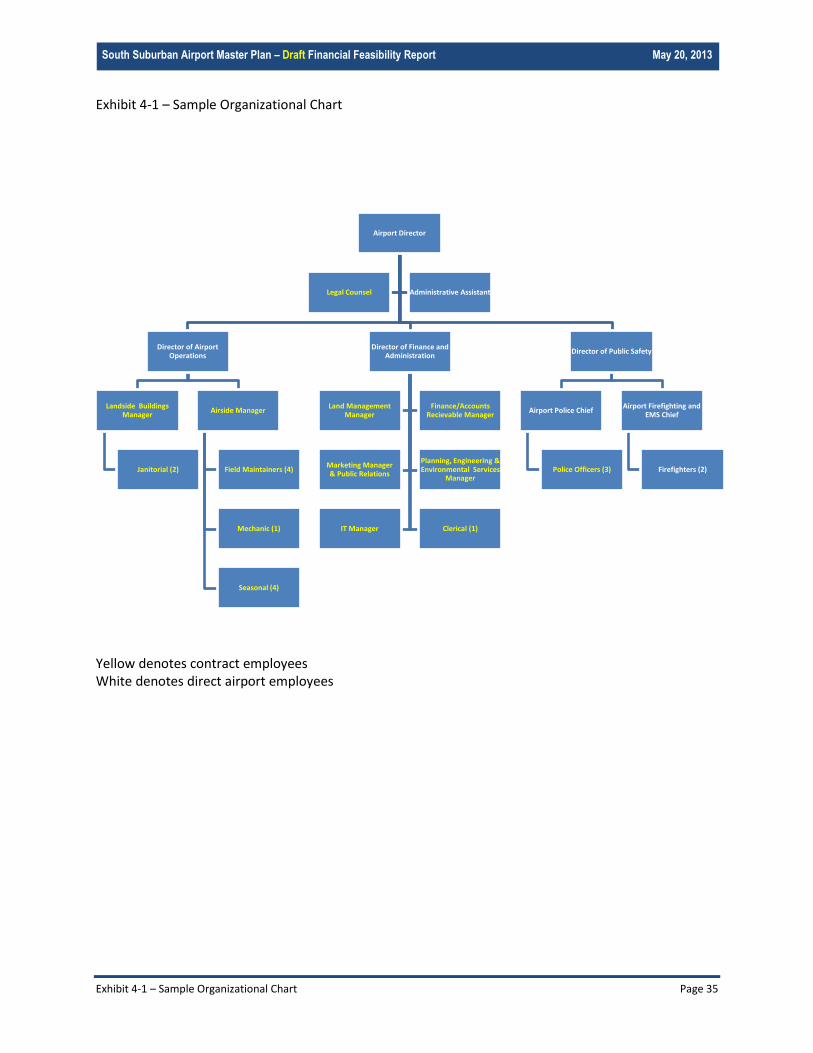
South Suburban Airport Master Plan – Draft Financial Feasibility Report May 20, 2013
Exhibit 4-1 – Sample Organizational Chart Page 35
Exhibit 4-1 – Sample Organizational Chart
Yellow denotes contract employees White denotes direct airport employees
Airport Director
Director of Airport Operations
Landside Buildings Manager
Janitorial (2)
Airside Manager
Field Maintainers (4)
Mechanic (1)
Seasonal (4)
Director of Finance and Administration
Land Management Manager
Finance/Accounts Recievable Manager
Marketing Manager & Public Relations
Planning, Engineering & Environmental Services
Manager
IT Manager Clerical (1)
Director of Public Safety
Airport Police Chief
Police Officers (3)
Airport Firefighting and EMS Chief
Firefighters (2)
Legal Counsel Administrative Assistant
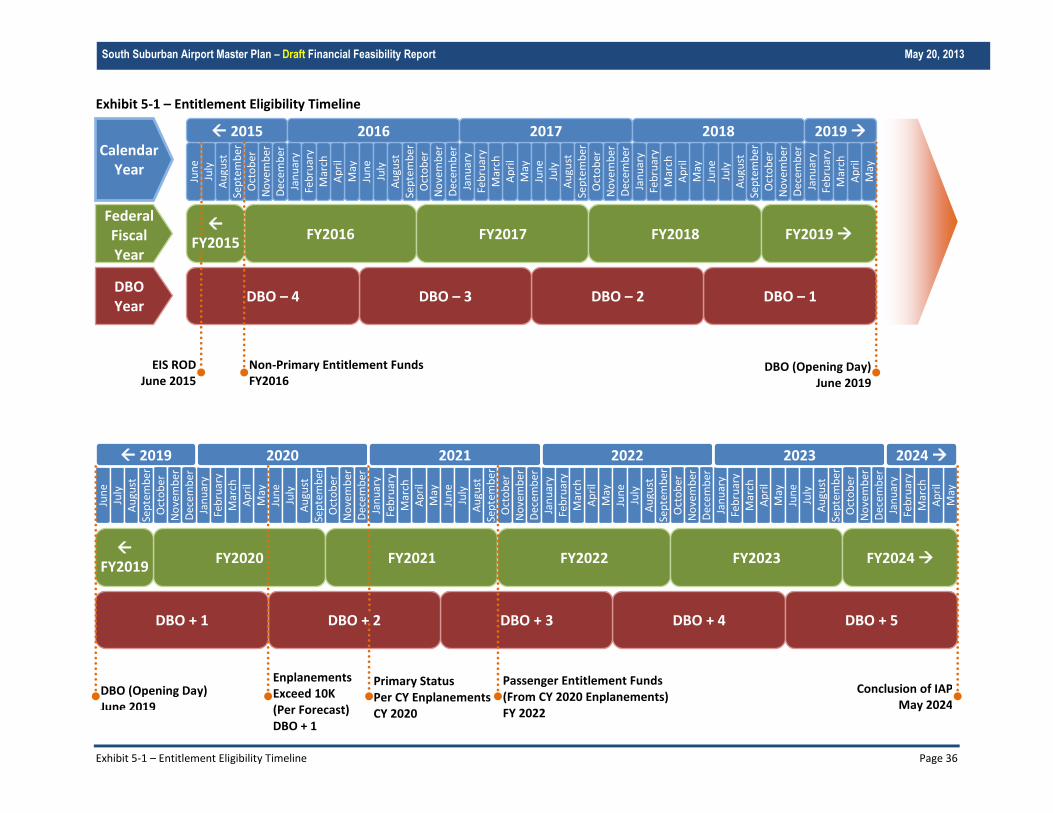
South Suburban Airport Master Plan – Draft Financial Feasibility Report May 20, 2013
Exhibit 5-1 – Entitlement Eligibility Timeline Page 36
Exhibit 5-1 – Entitlement Eligibility Timeline
EIS ROD
June 2015 Non-Primary Entitlement Funds FY2016
DBO (Opening Day) June 2019
Calendar Year
Federal Fiscal Year
FY2016
DBO Year
DBO – 1
FY2017
FY2015 FY2018 FY2019
DBO – 2 DBO – 3 DBO – 4
Jun
e
July
A
ugu
st
Sep
tem
ber
2015
Oct
ob
er
No
vem
ber
D
ecem
ber
Ja
nu
ary
Feb
ruar
y
May
Ju
ne
Ju
ly
Au
gust
Se
pte
mb
er
Ap
ril
Mar
ch
2016
Oct
ob
er
No
vem
ber
D
ecem
ber
Ja
nu
ary
Feb
ruar
y
May
Ju
ne
Ju
ly
Au
gust
Se
pte
mb
er
Ap
ril
Mar
ch
2017
Oct
ob
er
No
vem
ber
D
ecem
ber
Ja
nu
ary
Feb
ruar
y
May
Ju
ne
Ju
ly
Au
gust
Se
pte
mb
er
Ap
ril
Mar
ch
2018
Oct
ob
er
No
vem
ber
D
ecem
ber
Ja
nu
ary
Feb
ruar
y
May
A
pri
l M
arch
2019
DBO (Opening Day) June 2019
Primary Status Per CY Enplanements CY 2020
Passenger Entitlement Funds (From CY 2020 Enplanements) FY 2022
Conclusion of IAP May 2024
Enplanements Exceed 10K (Per Forecast) DBO + 1
FY2020
DBO + 4
FY2021 FY2022
Jan
uar
y Fe
bru
ary
May
Ju
ne
Ju
ly
Au
gust
Se
pte
mb
er
Ap
ril
Mar
ch
2020
Oct
ob
er
No
vem
ber
D
ecem
ber
Ja
nu
ary
Feb
ruar
y
May
Ju
ne
Ju
ly
Au
gust
Se
pte
mb
er
Ap
ril
Mar
ch
2021
Oct
ob
er
No
vem
ber
D
ecem
ber
Ja
nu
ary
Feb
ruar
y
May
Ju
ne
Ju
ly
Au
gust
Se
pte
mb
er
Ap
ril
Mar
ch
2022
Oct
ob
er
No
vem
ber
D
ecem
ber
DBO + 3 DBO + 2
Jun
e
July
A
ugu
st
Sep
tem
ber
2019
Oct
ob
er
No
vem
ber
D
ecem
ber
FY2019
DBO + 1 DBO + 5
FY2023
Jan
uar
y Fe
bru
ary
May
Ju
ne
Ju
ly
Au
gust
Se
pte
mb
er
Ap
ril
Mar
ch
2023
Oct
ob
er
No
vem
ber
D
ecem
ber
Ja
nu
ary
Feb
ruar
y
May
A
pri
l M
arch
2024
FY2024