Embed Size (px)
Citation preview
University of Southern Maine University of Southern Maine
USM Digital Commons USM Digital Commons
Disability & Aging Cutler Institute for Health & Social Policy
12-2017
Financial Exploitation of Maine's Older Adults: An Analysis of Financial Exploitation of Maine's Older Adults: An Analysis of
Maine Adult Protective Services and Legal Services for the Elderly Maine Adult Protective Services and Legal Services for the Elderly
Case Records, State Fiscal Years 2010-2016 Case Records, State Fiscal Years 2010-2016
Eileen Griffin JD University of Southern Maine, Muskie School of Public Service
Catherine McGuire BS University of Southern Maine, Muskie School of Public Service
Kimberly I. Snow MHSA, BA University of Southern Maine, Muskie School of Public Service
Follow this and additional works at: https://digitalcommons.usm.maine.edu/aging
Part of the Health Policy Commons, Public Policy Commons, and the Social Policy Commons
Recommended Citation Recommended Citation Griffin, E., McGuire, C., Snow, K.I. Financial Exploitation of Maine's Older Adults: An Analysis of Maine Adult Protective Services and Legal Services for the Elderly Case Records, State Fiscal Years 2010-2016. Portland, ME: University of Southern Maine, Muskie School of Public Service, Cutler Institute of Health and Social Policy; December, 2017.
This Report is brought to you for free and open access by the Cutler Institute for Health & Social Policy at USM Digital Commons. It has been accepted for inclusion in Disability & Aging by an authorized administrator of USM Digital Commons. For more information, please contact [email protected].

Prepared by:
Eileen Griffin
Catherine McGuire
Kimberly Snow
Muskie School of Public Service
Prepared for:
Legal Services for the Elderly
Office of Aging and Disability Services
Department of Health and Human Services

Executive Summary ........................................................................................................................................... 1
Financial Exploitation in Maine ....................................................................................................................... 3
Methods ............................................................................................................................................................... 6
Data Sources ................................................................................................................................................... 6
Data Sets ......................................................................................................................................................... 8
Case Examples ............................................................................................................................................... 9
The Victims of Financial Exploitation.......................................................................................................... 10
The Cost of Financial Exploitation ............................................................................................................... 17
APS ................................................................................................................................................................ 19
LSE ................................................................................................................................................................ 25
Statewide Estimate of Financial Exploitation .............................................................................................. 31
References ......................................................................................................................................................... 34
This report was produced with support from the U.S. Department of Health and Human Services, Administration for
Community Living, under its Model Approaches to Statewide Legal Assistance grant program.
Executive Summary
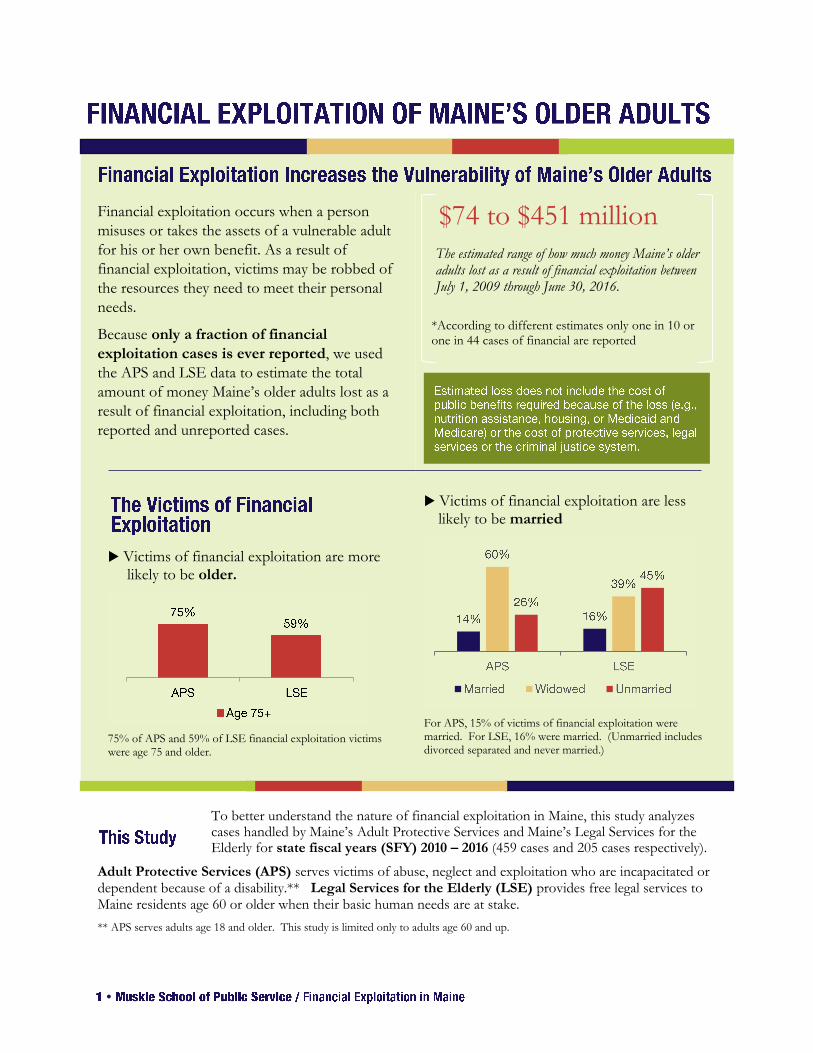
Financial exploitation occurs when a person
misuses or takes the assets of a vulnerable adult
for his or her own benefit. As a result of
financial exploitation, victims may be robbed of
the resources they need to meet their personal
needs.
Because only a fraction of financial
exploitation cases is ever reported, we used
the APS and LSE data to estimate the total
amount of money Maine’s older adults lost as a
result of financial exploitation, including both
reported and unreported cases.
To better understand the nature of financial exploitation in Maine, this study analyzes cases handled by Maine’s Adult Protective Services and Maine’s Legal Services for the Elderly for state fiscal years (SFY) 2010 – 2016 (459 cases and 205 cases respectively).
Adult Protective Services (APS) serves victims of abuse, neglect and exploitation who are incapacitated or dependent because of a disability.** Legal Services for the Elderly (LSE) provides free legal services to Maine residents age 60 or older when their basic human needs are at stake.
** APS serves adults age 18 and older. This study is limited only to adults age 60 and up.
The estimated range of how much money Maine’s older adults lost as a result of financial exploitation between July 1, 2009 through June 30, 2016.
$74 to $451 million
*According to different estimates only one in 10 or one in 44 cases of financial are reported
Victims of financial exploitation are more likely to be older.
75% of APS and 59% of LSE financial exploitation victims were age 75 and older.
Victims of financial exploitation are less likely to be married
For APS, 15% of victims of financial exploitation were married. For LSE, 16% were married. (Unmarried includes divorced separated and never married.)
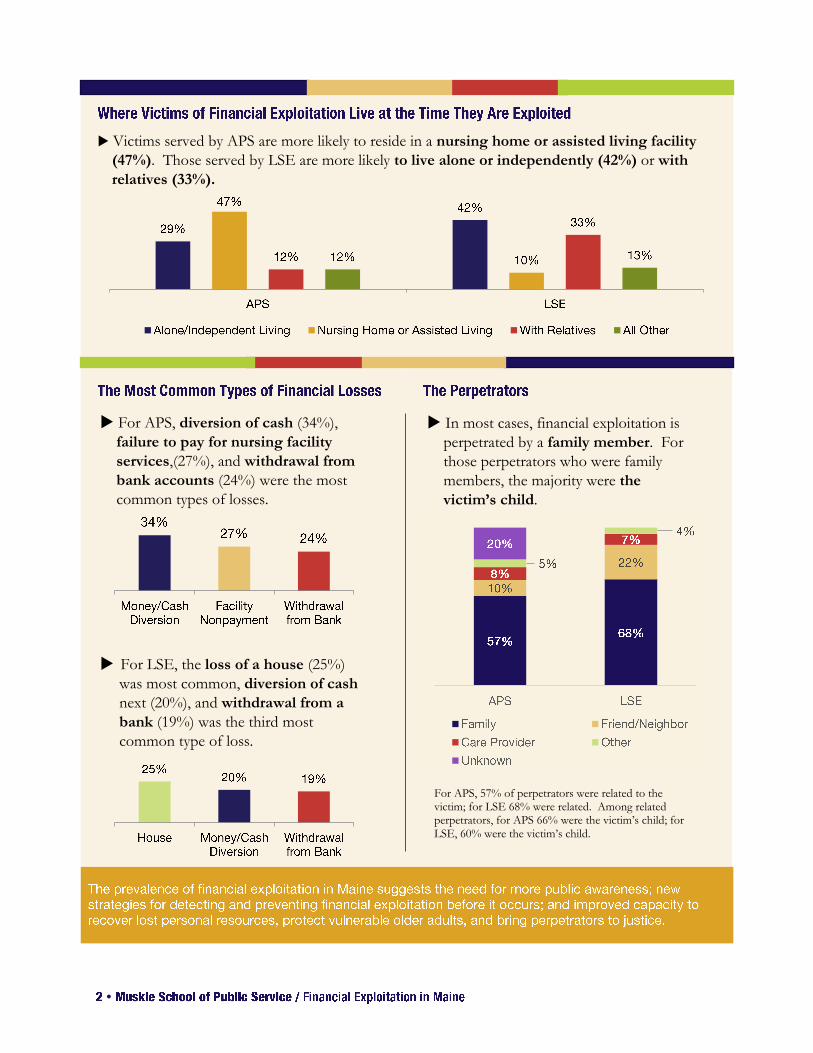
Victims served by APS are more likely to reside in a nursing home or assisted living facility
(47%). Those served by LSE are more likely to live alone or independently (42%) or with
relatives (33%).
For APS, diversion of cash (34%),
failure to pay for nursing facility
services,(27%), and withdrawal from
bank accounts (24%) were the most
common types of losses.
For LSE, the loss of a house (25%)
was most common, diversion of cash
next (20%), and withdrawal from a
bank (19%) was the third most
common type of loss.
In most cases, financial exploitation is
perpetrated by a family member. For
those perpetrators who were family
members, the majority were the
victim’s child.
For APS, 57% of perpetrators were related to the victim; for LSE 68% were related. Among related perpetrators, for APS 66% were the victim’s child; for LSE, 60% were the victim’s child.
Financial exploitation takes many forms. It might be the result of a scam perpetrated by a stranger
or an exploitive deal perpetrated by an attorney, a financial advisor or another type of professional.
More typically, financial exploitation is the taking or diversion of money or property by a family
member or friend.
The costs associated with financial exploitation of older adults in Maine are not well understood.
Data is not systematically collected on reported cases and it is estimated that the reported cases
account for only a small portion of all cases of financial exploitation.
To address this gap, Legal Services for the Elderly (LSE), in collaboration with Department of
Health and Human Services (DHHS), contracted with the Muskie School to analyze data collected
by Maine’s Adult Protective Services (APS) program and LSE. The data analyzed in this report
cover the time period of 2010 through 2016 and includes a total of 459 victims of financial
exploitation served by APS and a total of 205 victims of financial exploitation served by LSE.
The goal of this study was to capture information about the amount of money Maine’s older adults
have lost to financial exploitation, along with information about those exploited, the perpetrators of
financial exploitation, the type of loss, and amount of money lost. This report summarizes key
findings emerging from this analysis. In particular, we found that, when compared to Maine’s
general population of adults age 60 and older, the victims of financial exploitation served by APS
and LSE are more likely to be:
Age 80 and older;
Female; and
Widowed, single, or divorced compared to the general population of Maine’s older adults.
Consistent with the different populations served by APS and LSE, we also found that the victims of
financial exploitation served by APS are more likely than those served by LSE to reside in a nursing
facility.
The victims of financial exploitation served by APS and LSE experienced significant financial losses.
For the time period of 2010 through 2016, the total loss for those served by APS was $19 million;
for LSE the total loss was $9.0 million. The median loss for LSE clients was higher than that
experienced by APS clients: the median loss for LSE clients was $27,000 while the median loss for
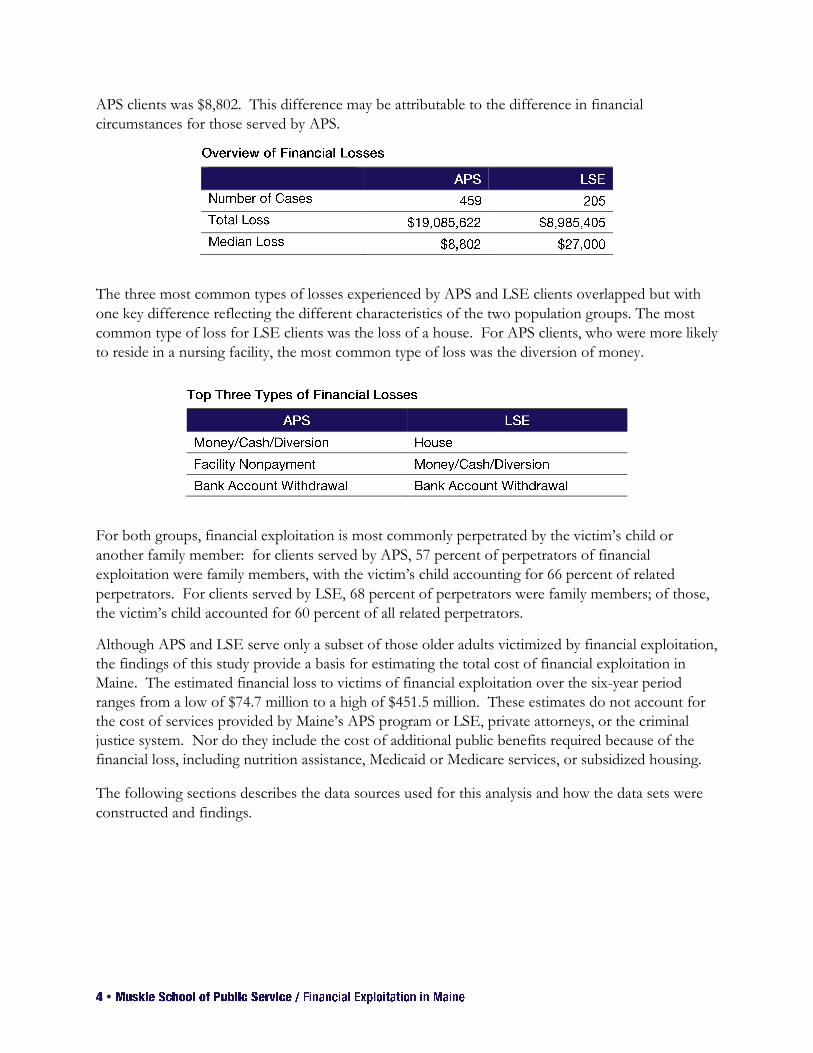
APS clients was $8,802. This difference may be attributable to the difference in financial
circumstances for those served by APS.
The three most common types of losses experienced by APS and LSE clients overlapped but with
one key difference reflecting the different characteristics of the two population groups. The most
common type of loss for LSE clients was the loss of a house. For APS clients, who were more likely
to reside in a nursing facility, the most common type of loss was the diversion of money.
For both groups, financial exploitation is most commonly perpetrated by the victim’s child or
another family member: for clients served by APS, 57 percent of perpetrators of financial
exploitation were family members, with the victim’s child accounting for 66 percent of related
perpetrators. For clients served by LSE, 68 percent of perpetrators were family members; of those,
the victim’s child accounted for 60 percent of all related perpetrators.
Although APS and LSE serve only a subset of those older adults victimized by financial exploitation,
the findings of this study provide a basis for estimating the total cost of financial exploitation in
Maine. The estimated financial loss to victims of financial exploitation over the six-year period
ranges from a low of $74.7 million to a high of $451.5 million. These estimates do not account for
the cost of services provided by Maine’s APS program or LSE, private attorneys, or the criminal
justice system. Nor do they include the cost of additional public benefits required because of the
financial loss, including nutrition assistance, Medicaid or Medicare services, or subsidized housing.
The following sections describes the data sources used for this analysis and how the data sets were
constructed and findings.
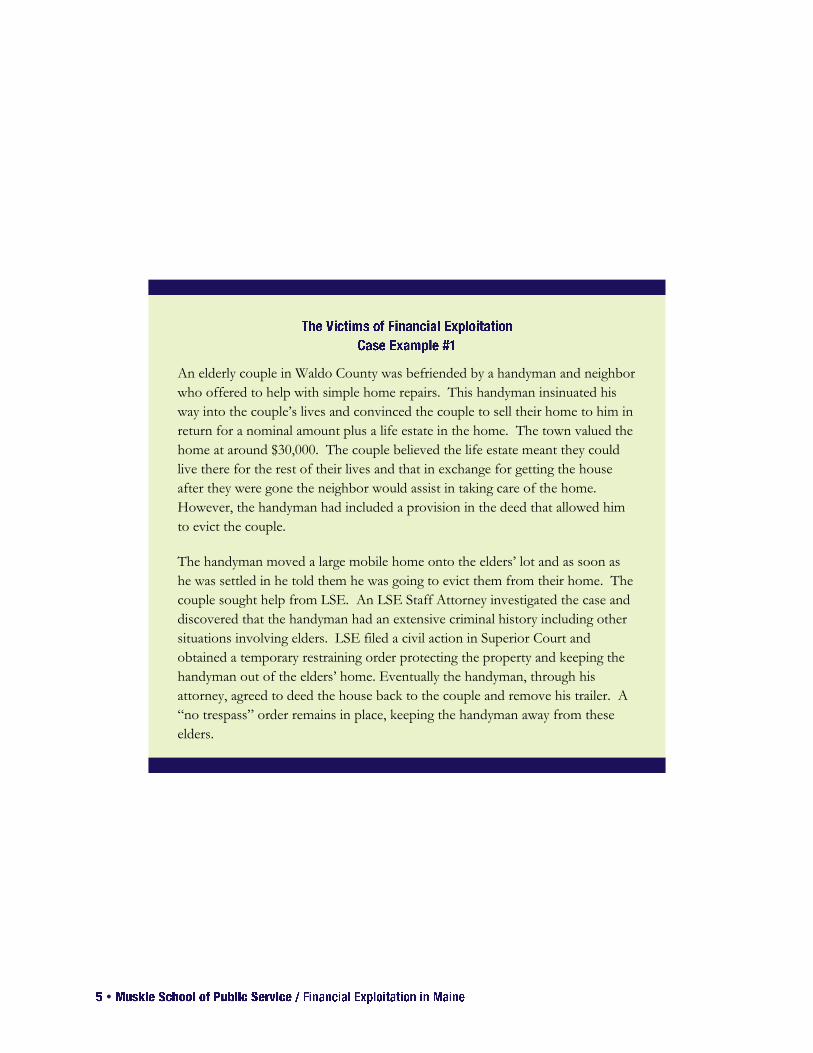
An elderly couple in Waldo County was befriended by a handyman and neighbor
who offered to help with simple home repairs. This handyman insinuated his
way into the couple’s lives and convinced the couple to sell their home to him in
return for a nominal amount plus a life estate in the home. The town valued the
home at around $30,000. The couple believed the life estate meant they could
live there for the rest of their lives and that in exchange for getting the house
after they were gone the neighbor would assist in taking care of the home.
However, the handyman had included a provision in the deed that allowed him
to evict the couple.
The handyman moved a large mobile home onto the elders’ lot and as soon as
he was settled in he told them he was going to evict them from their home. The
couple sought help from LSE. An LSE Staff Attorney investigated the case and
discovered that the handyman had an extensive criminal history including other
situations involving elders. LSE filed a civil action in Superior Court and
obtained a temporary restraining order protecting the property and keeping the
handyman out of the elders’ home. Eventually the handyman, through his
attorney, agreed to deed the house back to the couple and remove his trailer. A
“no trespass” order remains in place, keeping the handyman away from these
elders.
This report includes data from two different data sources:
Data collected by the Maine Department of Health and Human Services (DHHS) Adult
Protective Services (APS) program.
Data collected by Legal Services for the Elderly.
These programs serve two different population groups, although each program’s service population
may include individuals who are victims of financial exploitation.
The APS program operates within the statutory authority defined for it under the Adult Protective
Services Act1 and may serve only those adults who are determined to be “incapacitated” or
“dependent.” These terms are defined by statute:
A dependent adult is an adult who has a physical or mental condition that substantially impairs the
adult's ability to adequately provide for his or her daily needs. A person is considered a
dependent adult if he or she is wholly or partially dependent upon one or more other people for
care or support because the person suffers from a significant limitation in mobility, vision,
hearing or mental functioning or is unable to perform self-care because of advanced age or
physical or mental disease, disorder or defect. A dependent adult includes an adult residing in
any setting including a nursing facility, assisted living, or a residential care facility.2
An incapacitated adult is any adult who is impaired by reason of mental illness, mental deficiency,
physical illness or disability to the extent that the individual lacks sufficient understanding or
capacity to make or communicate responsible decisions concerning his or her person or
effectively manage his or her estate.3
APS’ statutory authority is also limited to those cases where danger or significant risk of danger
exists. If APS does not find allegations of abuse, neglect or exploitation or circumstances that
present a substantial risk of abuse, neglect or exploitation, it may not intercede. These terms are
defined as follows:
1 22 M.R.S.A. Chapter 958-A.
2 22 M.R.S.A. §3472(6).
3 22 M.R.S.A. §3472(10).
Abuse is the infliction of injury, unreasonable confinement, intimidation or cruel punishment that
causes or is likely to cause physical harm or pain or mental anguish; sexual abuse or exploitation;
or the intentional, knowing or reckless deprivation of essential needs. Abuse includes acts and
omissions.
Neglect is a threat to an adult’s health or welfare by physical or mental injury or impairment,
deprivation of essential needs or lack of protection from these.
Exploitation is the illegal or improper use of an incapacitated or dependent adult or that adult’s
resources for another’s profit or advantage.
Danger is defined as a situation or condition of abuse, neglect or exploitation, or the inability to give
informed consent when there is no responsible substitute decision-maker. The risk of danger is
substantial when it is more likely than not that abuse, neglect or exploitation will occur.
Over a six-year period (State Fiscal Years 2010 through 2016), 14 percent of APS cases with at least
one substantiated allegation and involving adults age 60 and older involved a substantiated allegation
of financial exploitation.4
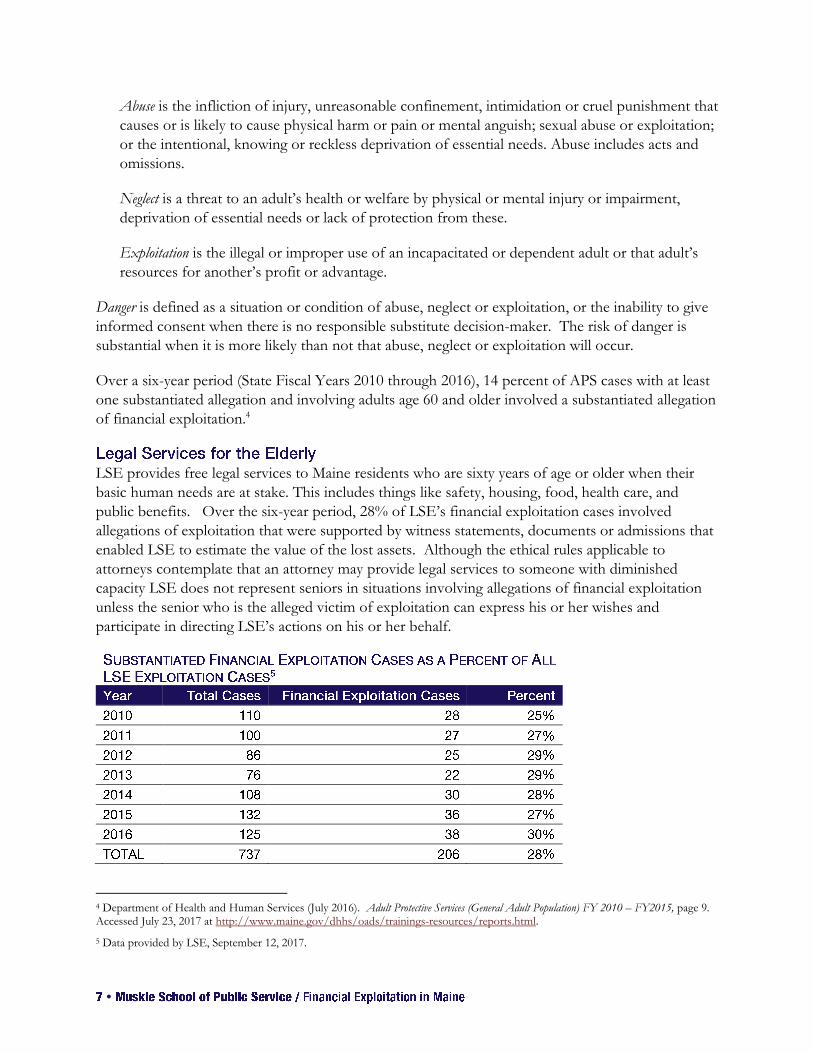
LSE provides free legal services to Maine residents who are sixty years of age or older when their
basic human needs are at stake. This includes things like safety, housing, food, health care, and
public benefits. Over the six-year period, 28% of LSE’s financial exploitation cases involved
allegations of exploitation that were supported by witness statements, documents or admissions that
enabled LSE to estimate the value of the lost assets. Although the ethical rules applicable to
attorneys contemplate that an attorney may provide legal services to someone with diminished
capacity LSE does not represent seniors in situations involving allegations of financial exploitation
unless the senior who is the alleged victim of exploitation can express his or her wishes and
participate in directing LSE’s actions on his or her behalf.
4 Department of Health and Human Services (July 2016). Adult Protective Services (General Adult Population) FY 2010 – FY2015, page 9. Accessed July 23, 2017 at http://www.maine.gov/dhhs/oads/trainings-resources/reports.html.
5 Data provided by LSE, September 12, 2017.
Data sets were constructed based on the data collected through the APS program and by LSE.
The APS data set was extracted from the data collected in the Maine Adult Protective Services
Information System (MAPSIS), the information system used by APS caseworkers to collect
information about each APS client, all allegations of abuse, neglect and exploitation, the outcome of
any investigation, and the disposition of the case. Using data for fiscal years 2010 through 2016, 682
cases with substantiated allegations of financial exploitation were identified. Key data elements
about the APS client were also extracted from the data set.
MAPSIS does not have a data field to record the amount of client losses or the type of client losses.
A search of the case notes attached to the 682 cases was conducted to identify case notes where the
dollar amount associated with financial exploitation might have been recorded. A search of the
12,280 case notes corresponding to the 682 financial exploitation cases was conducted using “$,”
“dollar,” “thousand,” “hundred,” or “.00” as search terms.
This search resulted in 2,133 rows of case notes which were reviewed manually to identify the dollar
amounts associated with a client loss. Not all dollar amounts referenced in the 2,133 rows of case
notes were related to a client’s financial loss. Some may only say how much money is left in the
client’s bank account, how much they receive each month from Social Security or some other dollar
amount unrelated to their financial loss. There also may be additional case notes rows that do not
match any of the search terms used, but still record the dollar amount of a financial loss. For
example, if a note says, “Client’s granddaughter cashed a check for 2,150,” it would not have been
picked up by the search terms we've used.
In the end, we were able to identify 460 cases with usable dollar amounts, a total of 72% of the APS
cases with substantiated allegations of financial exploitation. One outlier case of $1,200,000 was
removed from the analysis for a final sample of 459 cases (67%).
The LSE data set was extracted from the data collected in an electronic case management system
called Legal Files. Using data for state fiscal years 2010 through 2016, 737 cases involving
allegations of financial exploitation were identified. Of those, 2066 involved allegations LSE
determined had merit for further investigation and as a result included valuations of the stolen
property and assets.
6 While 206 cases were identified with merit, one case was deemed a financial outlier and removed from this analysis. The analysis was completed with the remaining 205 cases.
The data sources used in this report do not capture the universe of financial exploitation cases in
Maine nor the total financial loss associated with the financial exploitation.
1. APS Data. As discussed above, some detail related to financial exploitation is not collected
systematically in MAPSIS. In addition, it is possible that the methods used to extract detail
on financial exploitation from the case notes did not capture all the data that was recorded in
the case notes, meaning that the findings in this report are likely to underestimate the
number, type and dollar amount associated with different types of financial exploitation.
Finally, the cases in this study are limited to those for which the allegations were
substantiated. It does not include allegations which APS did not find to be untrue but for
which there was insufficient evidence to substantiate.
2. LSE Data. LSE Data. As with the APS data, the cases in this study are limited to those
where the allegations were determined to have merit. Some of the excluded cases were
simply too old to investigate or involved seniors who were unable to participate in directing
the action she or he wanted taken on her behalf. In addition, under the Older Americans
Act, LSE must restrict its services to situations where a senior would not otherwise have
access to an attorney. This means the data involving elderly victims helped by LSE excludes
situations where a private attorney was willing to get involved with the case. These cases
may involve much larger sums of money and more valuable assets. This means the LSE data
predominately reflects the types and magnitude of losses experienced by lower income
seniors.
3. Cases Handled by Others or Otherwise Unreported. This study does not include any data on
financial exploitation cases, whether because they were handled through a private attorney or
the criminal justice system and APS or LSE involvement was not necessary, or because the
cases were unreported. Estimates vary on how many cases of financial exploitation are
unreported. One study found that one in 10 cases of financial exploitation are reported,
while another found that ratio to be much higher, with only one in 44 cases were reported
(National Center on Elder Abuse, 1998; Lifespan of Greater Rochester, Inc. et al., 2011).
Following the methodology used in other states, this report applies these studies to estimate the
total financial loss Maine’s older adults experience when victims of financial exploitation.
In addition, this report only calculates the financial loss experienced by the victim of exploitation
and does not include the cost of any public benefits accessed when a victim’s own resources are
depleted because of the exploitation. For example, when resources to pay for nursing facility care
are diverted and cannot be recovered, a victim of financial exploitation may need to rely on
Medicaid in order to pay for those services.
LSE also provided four case examples to illustrate some of the ways that financial exploitation
occurs, often perpetrated by people known to the victim. These case examples appear on pages 3, 8,
12 and 28. DHHS also provided a case example which appears on page 18.
The next pages present data on the characteristics of the older adults who have experienced financial
exploitation, including their age, gender, marital status, and living arrangement. Because APS and
LSE serve two distinct groups of older adults with relatively rare overlap, the characteristics of each
group are presented separately, to provide insight into how these two populations differ and how
those differences may relate to any differences in the nature and type of financial exploitation across
the two groups, as discussed in subsequent sections. Demographic information for all older adults
in Maine is presented as a point of comparison.
In comparison to the general population of Maine’s older adults (age 60 and up), the victims of
financial exploitation served by each of these organizations are older, more likely to be female, and
more likely to be widowed, single, or divorced.
Between APS and LSE, the APS clients in this analysis were older and more likely to be widowed.
APS clients were more likely to live in a nursing home compared to LSE clients, while LSE clients
were more likely to live alone or with relatives compared with the APS group.
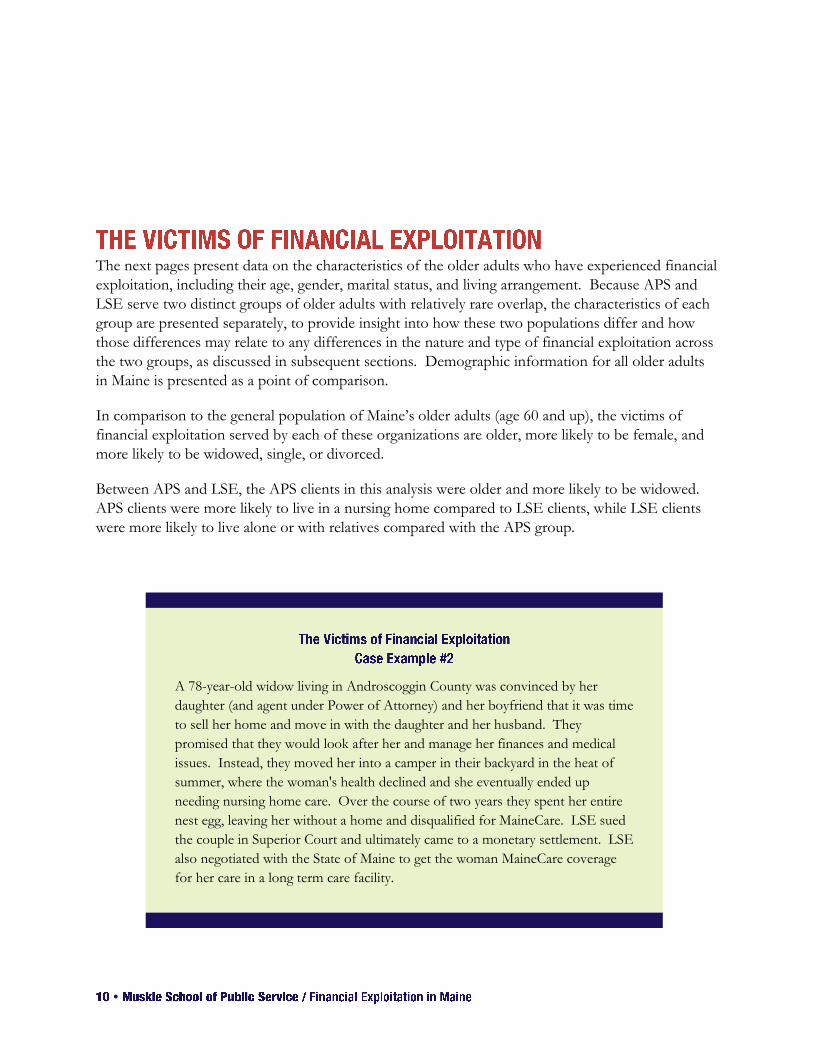
A 78-year-old widow living in Androscoggin County was convinced by her
daughter (and agent under Power of Attorney) and her boyfriend that it was time
to sell her home and move in with the daughter and her husband. They
promised that they would look after her and manage her finances and medical
issues. Instead, they moved her into a camper in their backyard in the heat of
summer, where the woman's health declined and she eventually ended up
needing nursing home care. Over the course of two years they spent her entire
nest egg, leaving her without a home and disqualified for MaineCare. LSE sued
the couple in Superior Court and ultimately came to a monetary settlement. LSE
also negotiated with the State of Maine to get the woman MaineCare coverage
for her care in a long term care facility.
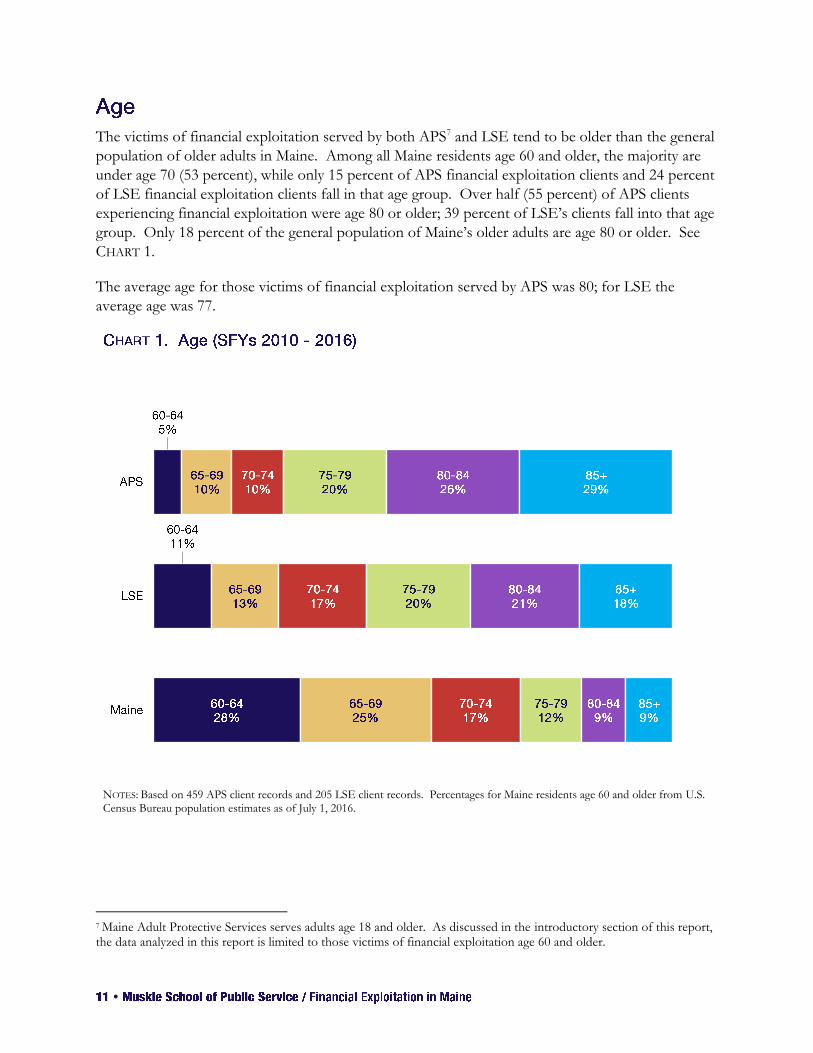
The victims of financial exploitation served by both APS7 and LSE tend to be older than the general
population of older adults in Maine. Among all Maine residents age 60 and older, the majority are
under age 70 (53 percent), while only 15 percent of APS financial exploitation clients and 24 percent
of LSE financial exploitation clients fall in that age group. Over half (55 percent) of APS clients
experiencing financial exploitation were age 80 or older; 39 percent of LSE’s clients fall into that age
group. Only 18 percent of the general population of Maine’s older adults are age 80 or older. See
CHART 1.
The average age for those victims of financial exploitation served by APS was 80; for LSE the
average age was 77.
NOTES: Based on 459 APS client records and 205 LSE client records. Percentages for Maine residents age 60 and older from U.S. Census Bureau population estimates as of July 1, 2016.
7 Maine Adult Protective Services serves adults age 18 and older. As discussed in the introductory section of this report, the data analyzed in this report is limited to those victims of financial exploitation age 60 and older.
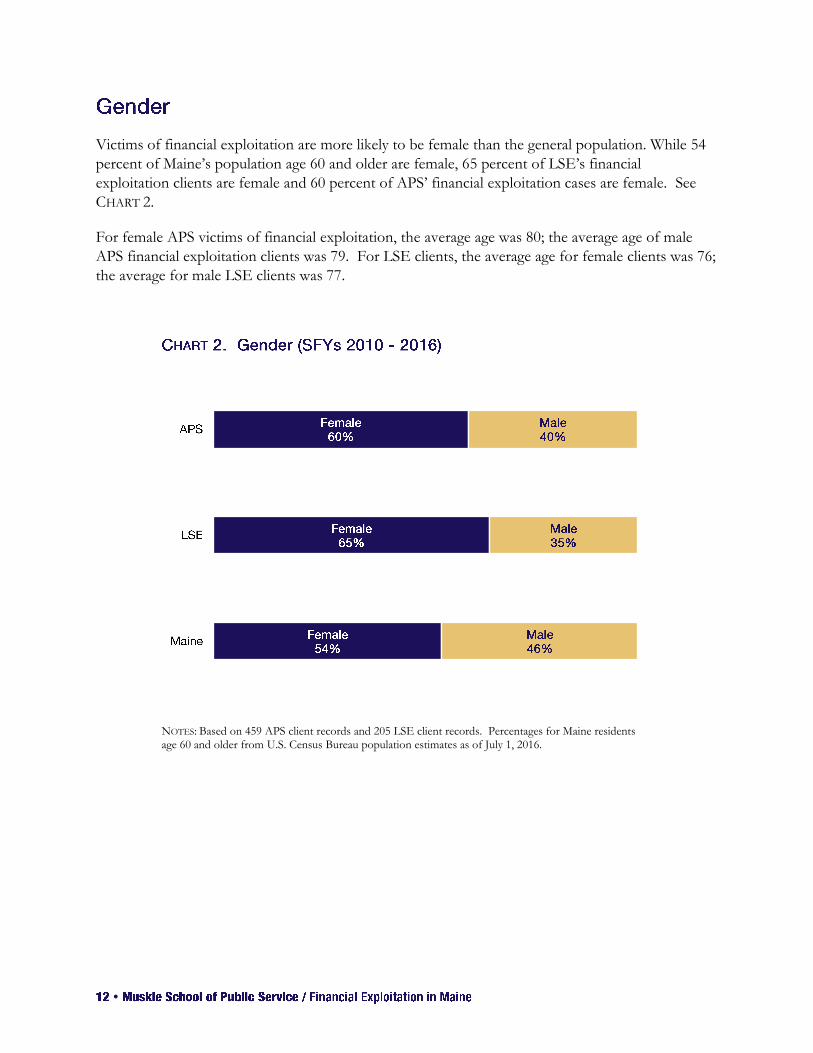
Victims of financial exploitation are more likely to be female than the general population. While 54
percent of Maine’s population age 60 and older are female, 65 percent of LSE’s financial
exploitation clients are female and 60 percent of APS’ financial exploitation cases are female. See
CHART 2.
For female APS victims of financial exploitation, the average age was 80; the average age of male
APS financial exploitation clients was 79. For LSE clients, the average age for female clients was 76;
the average for male LSE clients was 77.
NOTES: Based on 459 APS client records and 205 LSE client records. Percentages for Maine residents age 60 and older from U.S. Census Bureau population estimates as of July 1, 2016.
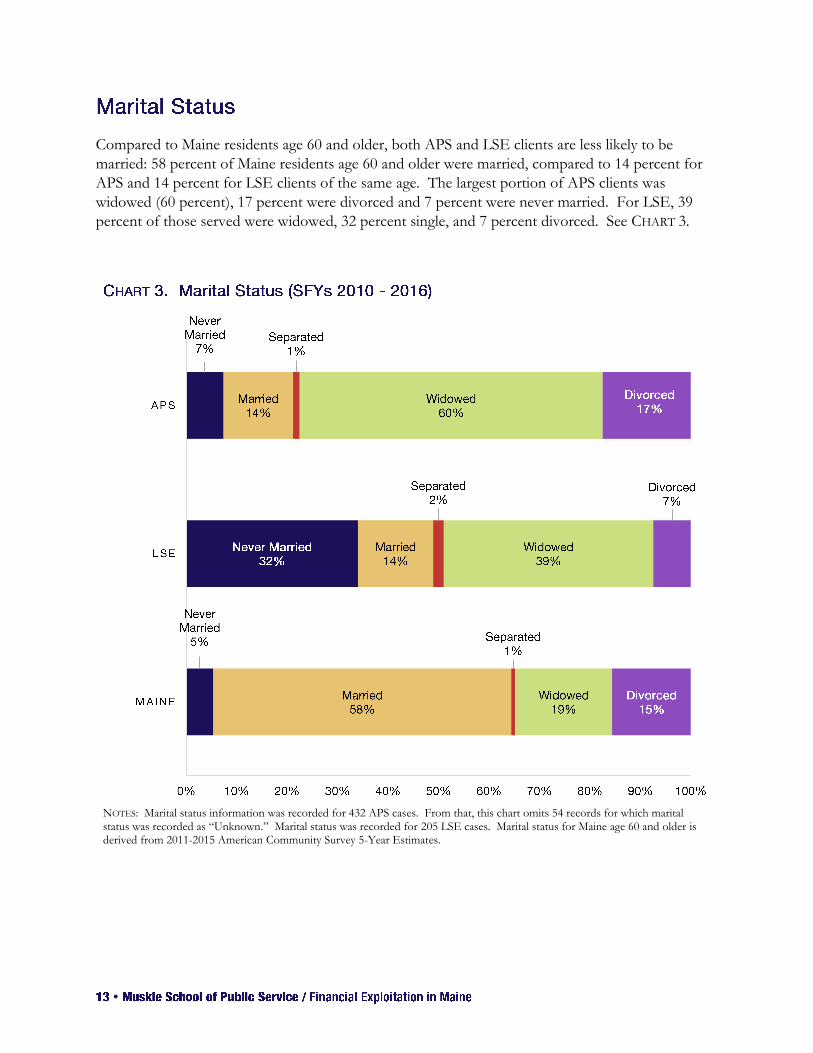
Compared to Maine residents age 60 and older, both APS and LSE clients are less likely to be
married: 58 percent of Maine residents age 60 and older were married, compared to 14 percent for
APS and 14 percent for LSE clients of the same age. The largest portion of APS clients was
widowed (60 percent), 17 percent were divorced and 7 percent were never married. For LSE, 39
percent of those served were widowed, 32 percent single, and 7 percent divorced. See CHART 3.
NOTES: Marital status information was recorded for 432 APS cases. From that, this chart omits 54 records for which marital status was recorded as “Unknown.” Marital status was recorded for 205 LSE cases. Marital status for Maine age 60 and older is derived from 2011-2015 American Community Survey 5-Year Estimates.
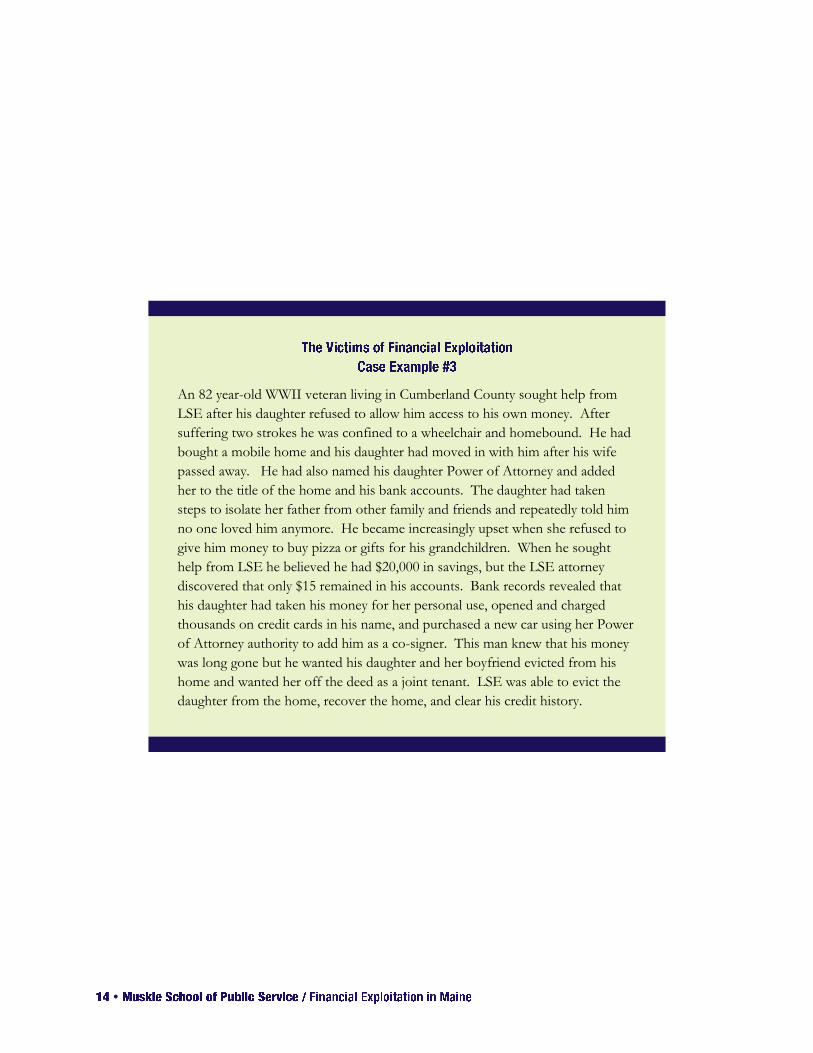
An 82 year-old WWII veteran living in Cumberland County sought help from
LSE after his daughter refused to allow him access to his own money. After
suffering two strokes he was confined to a wheelchair and homebound. He had
bought a mobile home and his daughter had moved in with him after his wife
passed away. He had also named his daughter Power of Attorney and added
her to the title of the home and his bank accounts. The daughter had taken
steps to isolate her father from other family and friends and repeatedly told him
no one loved him anymore. He became increasingly upset when she refused to
give him money to buy pizza or gifts for his grandchildren. When he sought
help from LSE he believed he had $20,000 in savings, but the LSE attorney
discovered that only $15 remained in his accounts. Bank records revealed that
his daughter had taken his money for her personal use, opened and charged
thousands on credit cards in his name, and purchased a new car using her Power
of Attorney authority to add him as a co-signer. This man knew that his money
was long gone but he wanted his daughter and her boyfriend evicted from his
home and wanted her off the deed as a joint tenant. LSE was able to evict the
daughter from the home, recover the home, and clear his credit history.
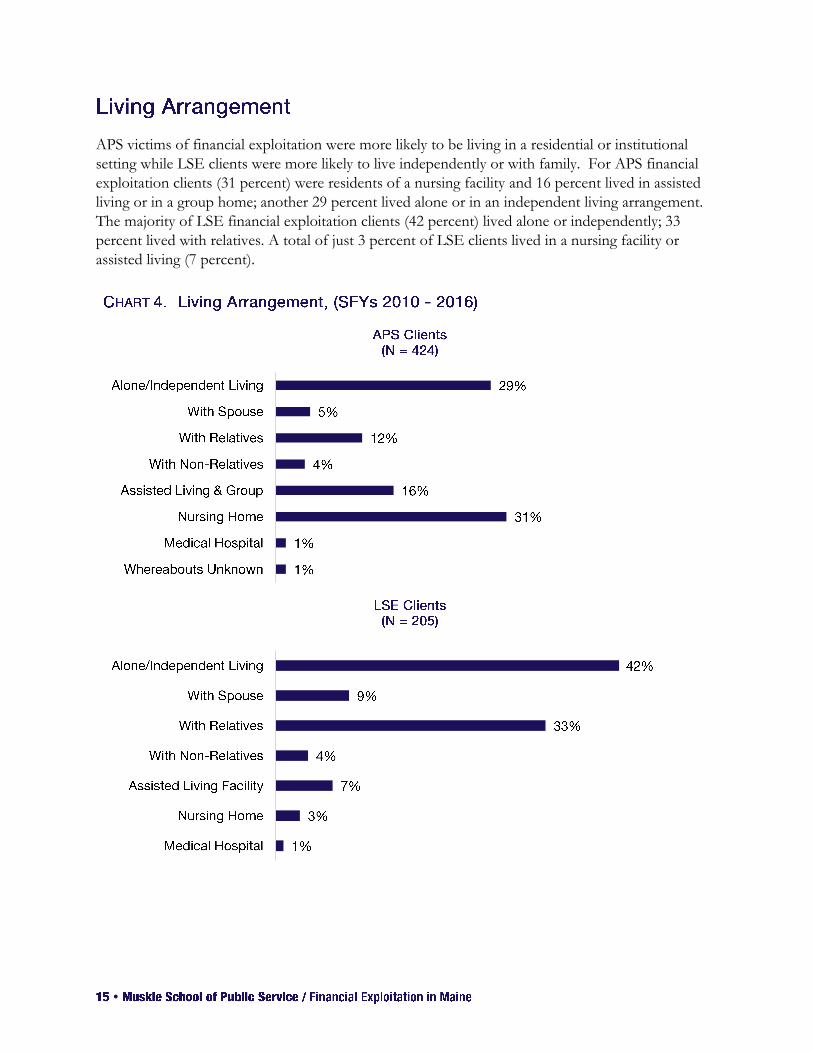
APS victims of financial exploitation were more likely to be living in a residential or institutional
setting while LSE clients were more likely to live independently or with family. For APS financial
exploitation clients (31 percent) were residents of a nursing facility and 16 percent lived in assisted
living or in a group home; another 29 percent lived alone or in an independent living arrangement.
The majority of LSE financial exploitation clients (42 percent) lived alone or independently; 33
percent lived with relatives. A total of just 3 percent of LSE clients lived in a nursing facility or
assisted living (7 percent).
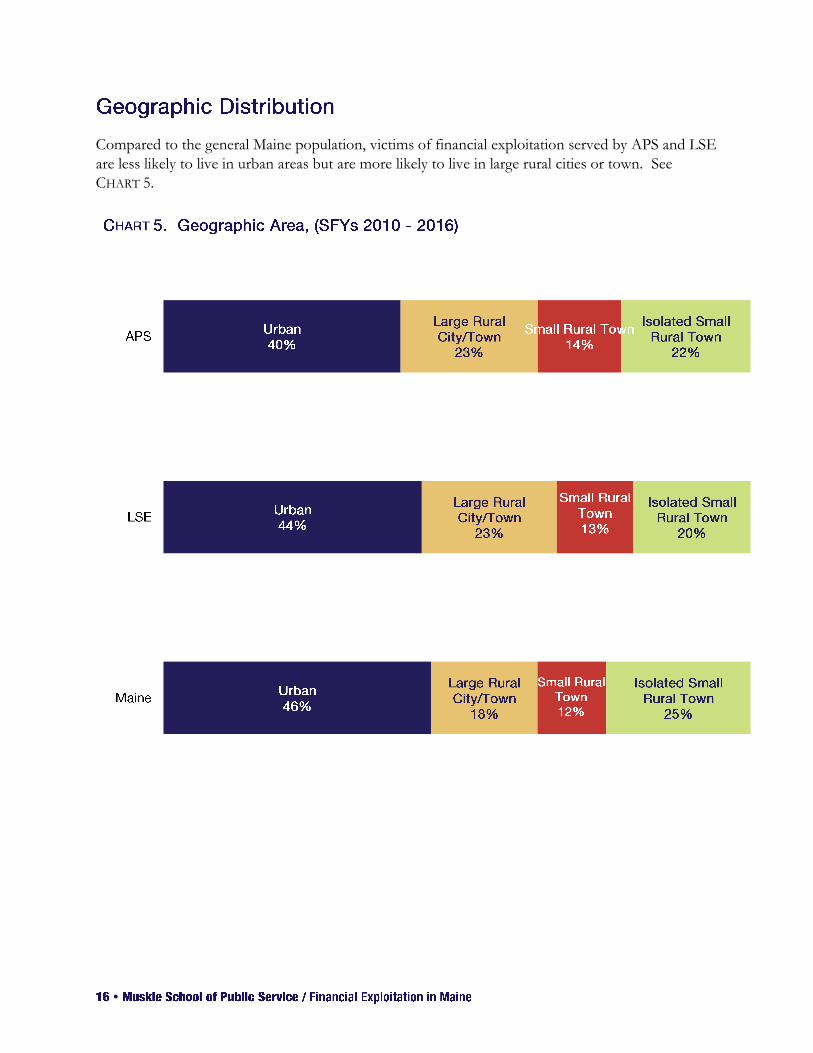
Compared to the general Maine population, victims of financial exploitation served by APS and LSE
are less likely to live in urban areas but are more likely to live in large rural cities or town. See
CHART 5.
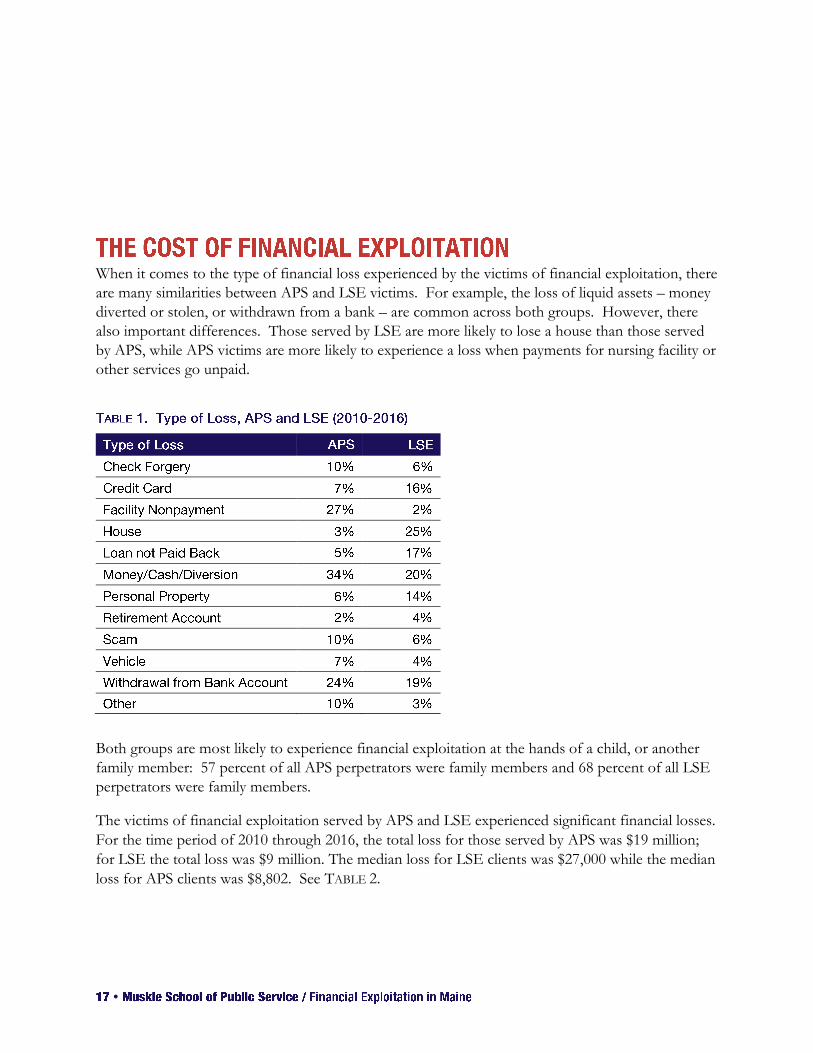
When it comes to the type of financial loss experienced by the victims of financial exploitation, there
are many similarities between APS and LSE victims. For example, the loss of liquid assets – money
diverted or stolen, or withdrawn from a bank – are common across both groups. However, there
also important differences. Those served by LSE are more likely to lose a house than those served
by APS, while APS victims are more likely to experience a loss when payments for nursing facility or
other services go unpaid.
Both groups are most likely to experience financial exploitation at the hands of a child, or another
family member: 57 percent of all APS perpetrators were family members and 68 percent of all LSE
perpetrators were family members.
The victims of financial exploitation served by APS and LSE experienced significant financial losses.
For the time period of 2010 through 2016, the total loss for those served by APS was $19 million;
for LSE the total loss was $9 million. The median loss for LSE clients was $27,000 while the median
loss for APS clients was $8,802. See TABLE 2.
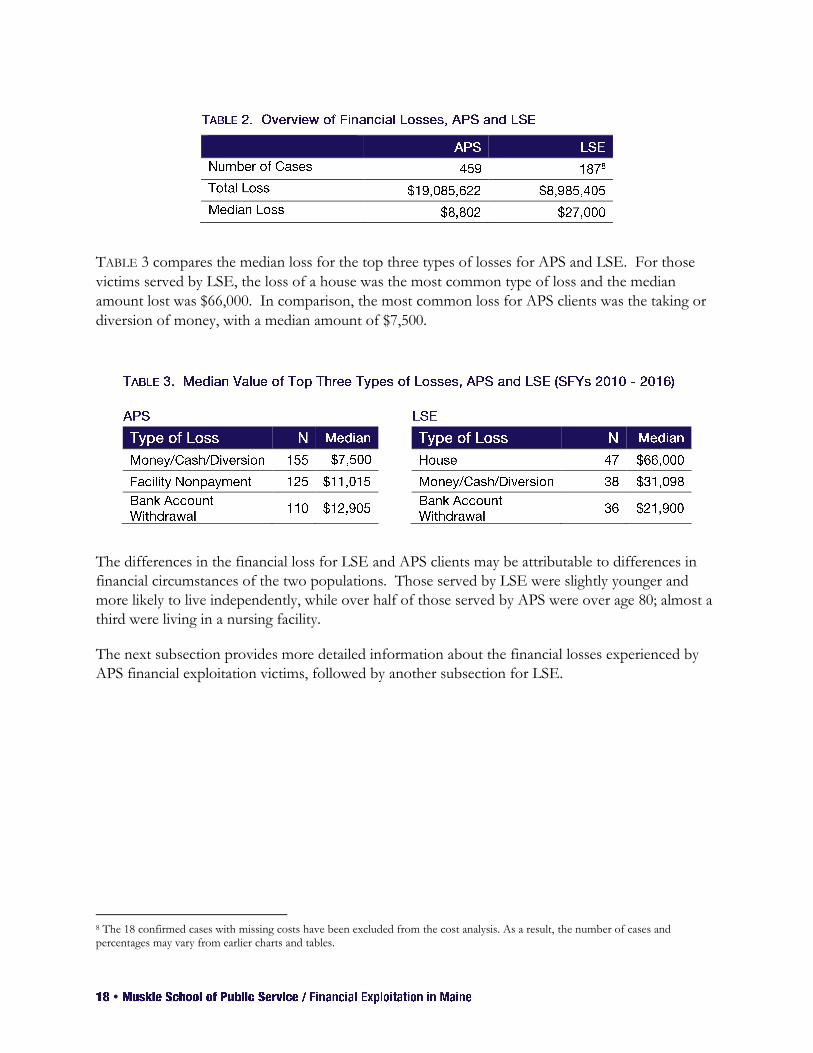
TABLE 3 compares the median loss for the top three types of losses for APS and LSE. For those
victims served by LSE, the loss of a house was the most common type of loss and the median
amount lost was $66,000. In comparison, the most common loss for APS clients was the taking or
diversion of money, with a median amount of $7,500.
The differences in the financial loss for LSE and APS clients may be attributable to differences in
financial circumstances of the two populations. Those served by LSE were slightly younger and
more likely to live independently, while over half of those served by APS were over age 80; almost a
third were living in a nursing facility.
The next subsection provides more detailed information about the financial losses experienced by
APS financial exploitation victims, followed by another subsection for LSE.
8 The 18 confirmed cases with missing costs have been excluded from the cost analysis. As a result, the number of cases and percentages may vary from earlier charts and tables.
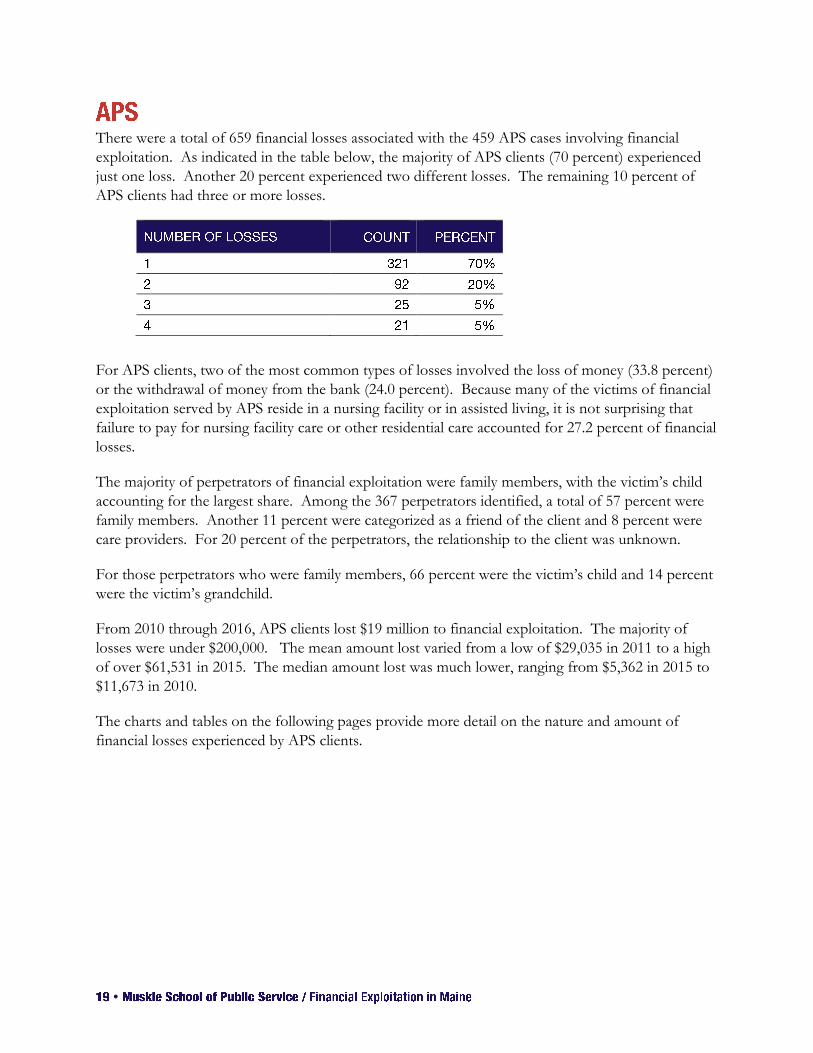
There were a total of 659 financial losses associated with the 459 APS cases involving financial
exploitation. As indicated in the table below, the majority of APS clients (70 percent) experienced
just one loss. Another 20 percent experienced two different losses. The remaining 10 percent of
APS clients had three or more losses.
For APS clients, two of the most common types of losses involved the loss of money (33.8 percent)
or the withdrawal of money from the bank (24.0 percent). Because many of the victims of financial
exploitation served by APS reside in a nursing facility or in assisted living, it is not surprising that
failure to pay for nursing facility care or other residential care accounted for 27.2 percent of financial
losses.
The majority of perpetrators of financial exploitation were family members, with the victim’s child
accounting for the largest share. Among the 367 perpetrators identified, a total of 57 percent were
family members. Another 11 percent were categorized as a friend of the client and 8 percent were
care providers. For 20 percent of the perpetrators, the relationship to the client was unknown.
For those perpetrators who were family members, 66 percent were the victim’s child and 14 percent
were the victim’s grandchild.
From 2010 through 2016, APS clients lost $19 million to financial exploitation. The majority of
losses were under $200,000. The mean amount lost varied from a low of $29,035 in 2011 to a high
of over $61,531 in 2015. The median amount lost was much lower, ranging from $5,362 in 2015 to
$11,673 in 2010.
The charts and tables on the following pages provide more detail on the nature and amount of
financial losses experienced by APS clients.
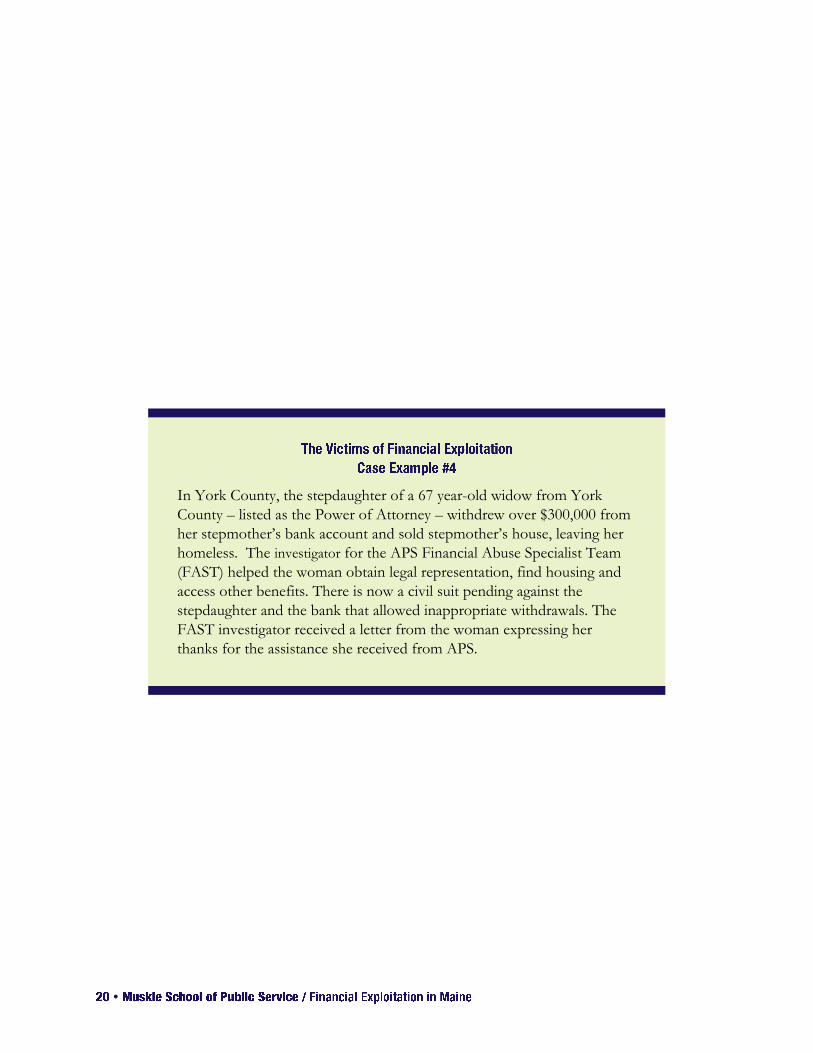
In York County, the stepdaughter of a 67 year-old widow from York
County – listed as the Power of Attorney – withdrew over $300,000 from
her stepmother’s bank account and sold stepmother’s house, leaving her
homeless. The investigator for the APS Financial Abuse Specialist Team
(FAST) helped the woman obtain legal representation, find housing and
access other benefits. There is now a civil suit pending against the
stepdaughter and the bank that allowed inappropriate withdrawals. The
FAST investigator received a letter from the woman expressing her
thanks for the assistance she received from APS.
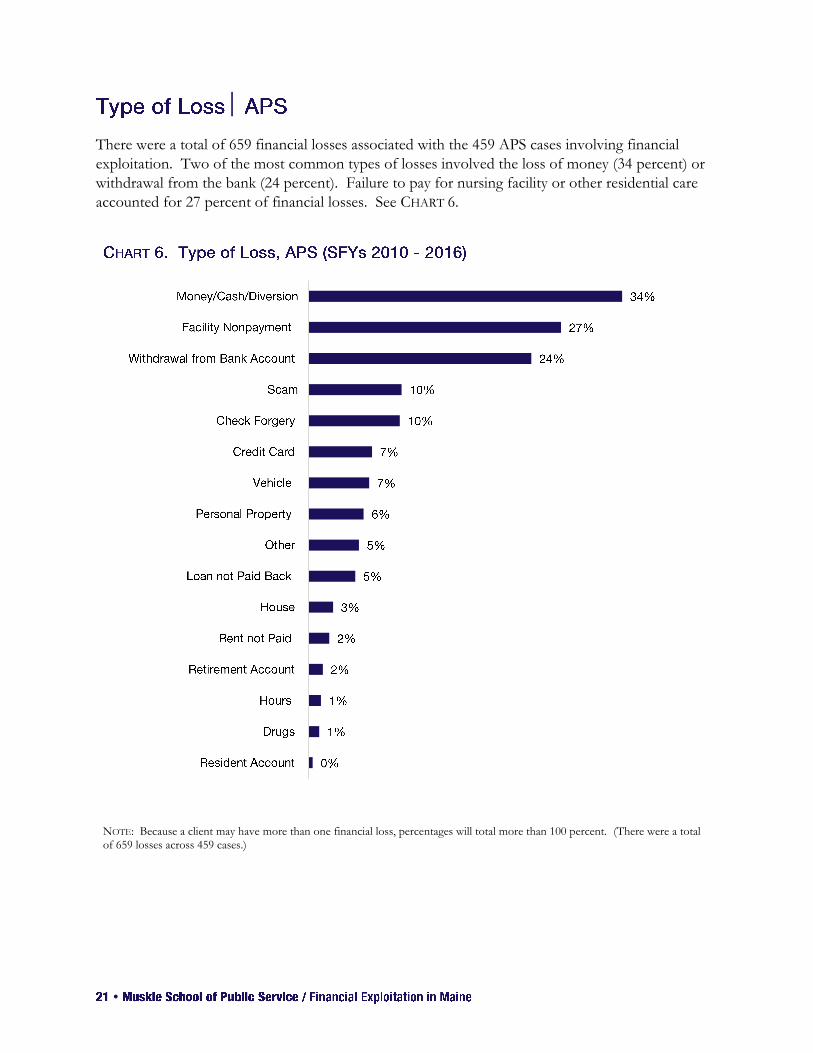
There were a total of 659 financial losses associated with the 459 APS cases involving financial
exploitation. Two of the most common types of losses involved the loss of money (34 percent) or
withdrawal from the bank (24 percent). Failure to pay for nursing facility or other residential care
accounted for 27 percent of financial losses. See CHART 6.
NOTE: Because a client may have more than one financial loss, percentages will total more than 100 percent. (There were a total of 659 losses across 459 cases.)
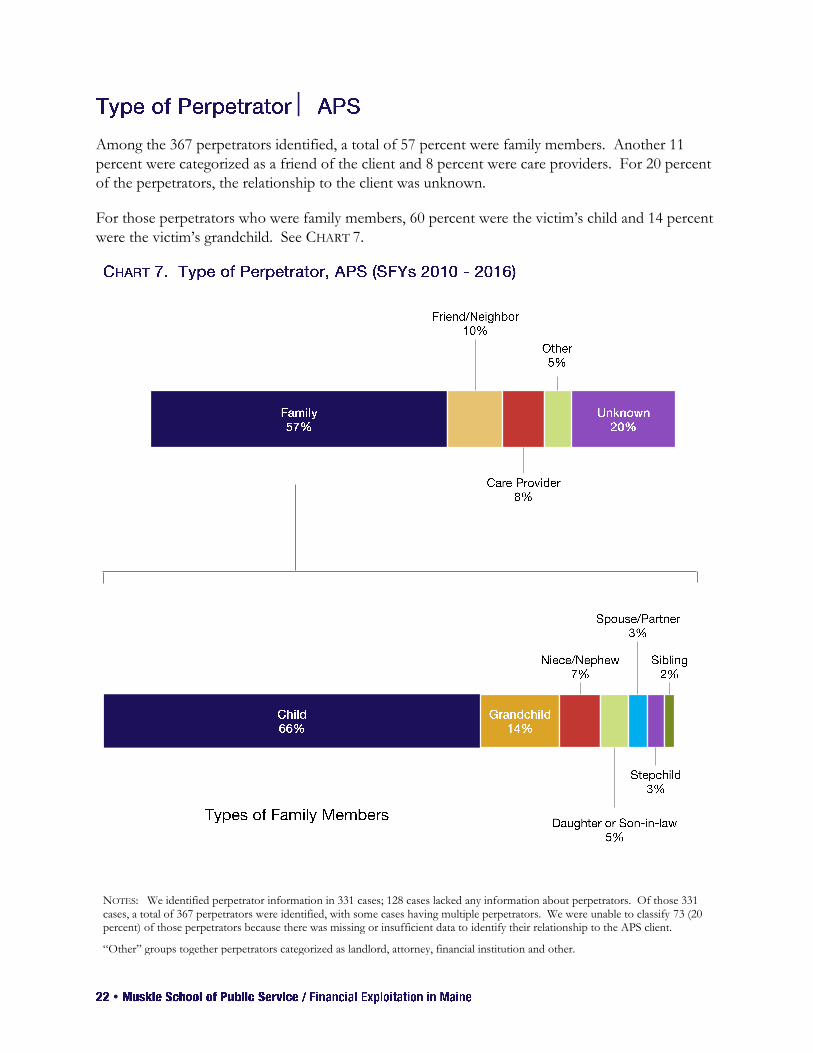
Among the 367 perpetrators identified, a total of 57 percent were family members. Another 11
percent were categorized as a friend of the client and 8 percent were care providers. For 20 percent
of the perpetrators, the relationship to the client was unknown.
For those perpetrators who were family members, 60 percent were the victim’s child and 14 percent
were the victim’s grandchild. See CHART 7.
NOTES: We identified perpetrator information in 331 cases; 128 cases lacked any information about perpetrators. Of those 331 cases, a total of 367 perpetrators were identified, with some cases having multiple perpetrators. We were unable to classify 73 (20 percent) of those perpetrators because there was missing or insufficient data to identify their relationship to the APS client.
“Other” groups together perpetrators categorized as landlord, attorney, financial institution and other.
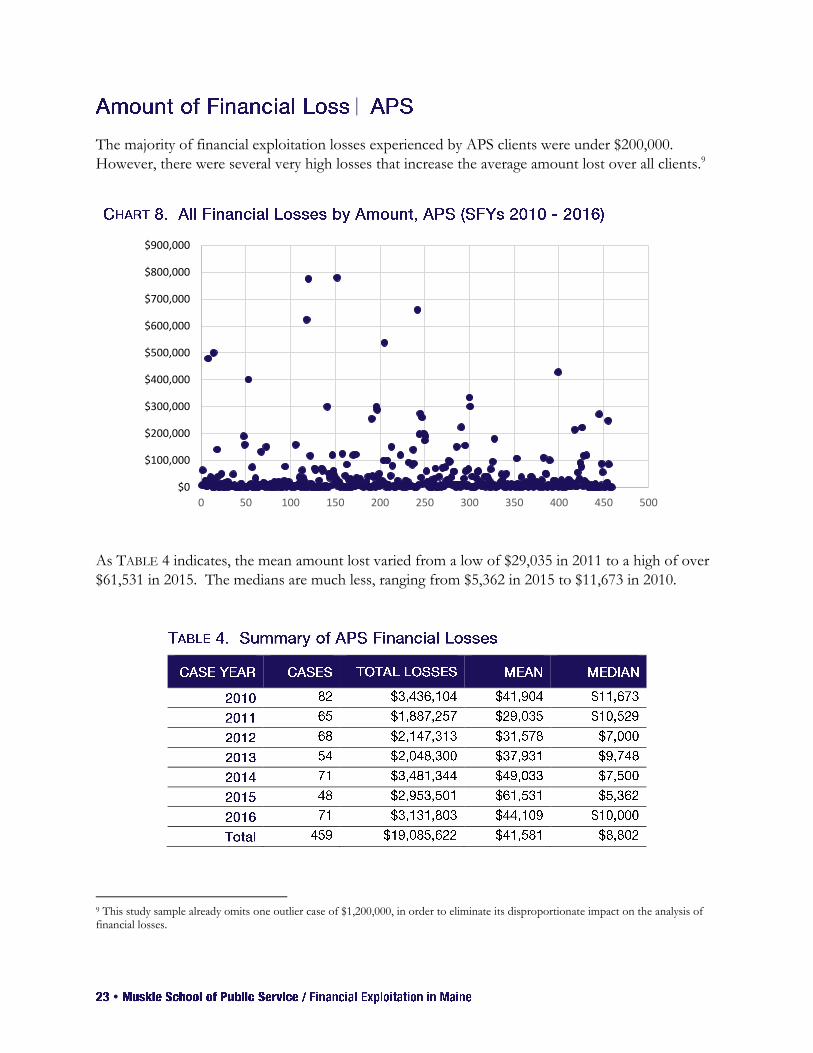
The majority of financial exploitation losses experienced by APS clients were under $200,000.
However, there were several very high losses that increase the average amount lost over all clients.9
As TABLE 4 indicates, the mean amount lost varied from a low of $29,035 in 2011 to a high of over
$61,531 in 2015. The medians are much less, ranging from $5,362 in 2015 to $11,673 in 2010.
9 This study sample already omits one outlier case of $1,200,000, in order to eliminate its disproportionate impact on the analysis of financial losses.
$0
$100,000
$200,000
$300,000
$400,000
$500,000
$600,000
$700,000
$800,000
$900,000
0 50 100 150 200 250 300 350 400 450 500
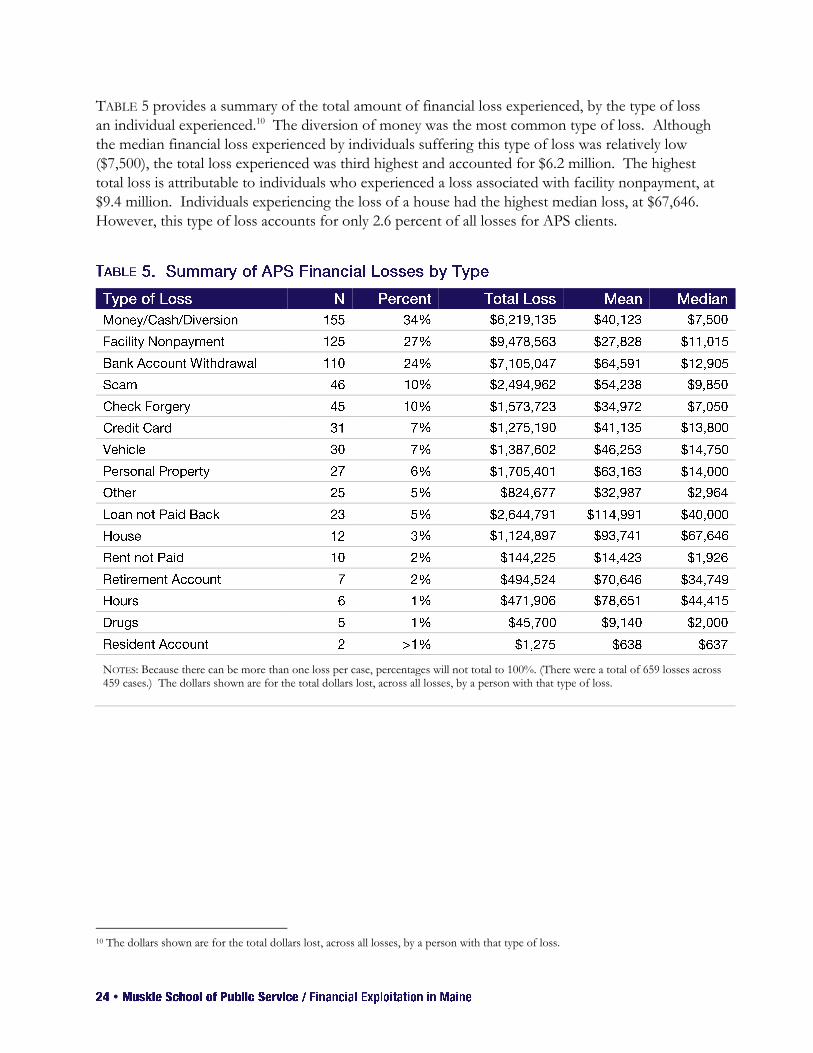
TABLE 5 provides a summary of the total amount of financial loss experienced, by the type of loss
an individual experienced.10 The diversion of money was the most common type of loss. Although
the median financial loss experienced by individuals suffering this type of loss was relatively low
($7,500), the total loss experienced was third highest and accounted for $6.2 million. The highest
total loss is attributable to individuals who experienced a loss associated with facility nonpayment, at
$9.4 million. Individuals experiencing the loss of a house had the highest median loss, at $67,646.
However, this type of loss accounts for only 2.6 percent of all losses for APS clients.
NOTES: Because there can be more than one loss per case, percentages will not total to 100%. (There were a total of 659 losses across 459 cases.) The dollars shown are for the total dollars lost, across all losses, by a person with that type of loss.
10 The dollars shown are for the total dollars lost, across all losses, by a person with that type of loss.
There were a total of 278 financial losses associated with the 205 LSE cases involving financial
exploitation. The majority of LSE clients (76 percent) experienced one financial loss; 15 percent
experienced two. The remaining 9 percent experienced three or more financial losses.
For LSE clients, the most common type of loss was the loss of a house, accounting for 25.3 percent
of all clients. The taking or diversion of liquid assets account for the next four most common types
of loss (loss of money or cash, withdrawals from the client’s bank account, a loan not paid back, and
misuse of a credit card), together accounting for 69.3 percent of all types of losses experienced by
LSE’s financial exploitation clients.
The majority of perpetrators (68 percent) were family members. Another 22 percent were
categorized as a friend of the client and 7 percent were care providers. For those perpetrators who
were family members, 60 percent were the victim’s child and 13 percent were the victim’s
grandchild.
From 2010 through 2016, LSE clients lost $9 million to financial exploitation, with a mean loss of
$48,050 and a median loss was $27,000. The mean varied from $36,904 in 2011 to $66,852 in 2013.
The median range was lower, ranging from $13,900 in 2010 to $40,308 in 2013.
The charts and tables on the following pages provide more detail on the nature and amount of
financial losses experienced by LSE clients.

LSE’s 205 financial exploitation clients experienced a total of 278 losses. Of these, the most
common type of loss was the loss of a house, accounting for 25 percent of all losses. The next four
most common types of loss relate to the loss of money or cash (20 percent), withdrawals from the
client’s bank account (19 percent), a loan not paid back (16 percent) and misuse of a credit card (15
percent). Together, these methods of financial exploitation account for more than half (70 percent)
of all types of losses experienced by LSE’s financial exploitation clients. See CHART 9.
NOTE: Because a client may have more than one financial loss, percentages will total more than 100 percent. (There were a total of 278 losses across 205 cases.)
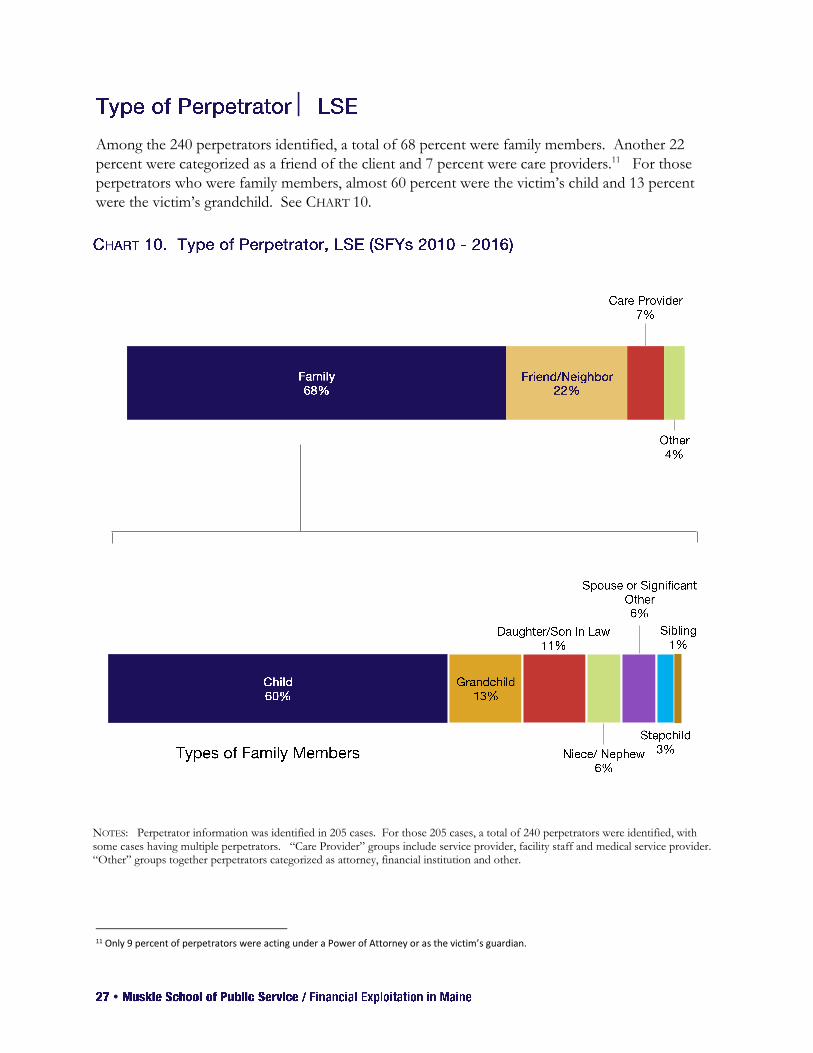
Among the 240 perpetrators identified, a total of 68 percent were family members. Another 22
percent were categorized as a friend of the client and 7 percent were care providers.11 For those
perpetrators who were family members, almost 60 percent were the victim’s child and 13 percent
were the victim’s grandchild. See CHART 10.
NOTES: Perpetrator information was identified in 205 cases. For those 205 cases, a total of 240 perpetrators were identified, with some cases having multiple perpetrators. “Care Provider” groups include service provider, facility staff and medical service provider. “Other” groups together perpetrators categorized as attorney, financial institution and other.
11 Only 9 percent of perpetrators were acting under a Power of Attorney or as the victim’s guardian.
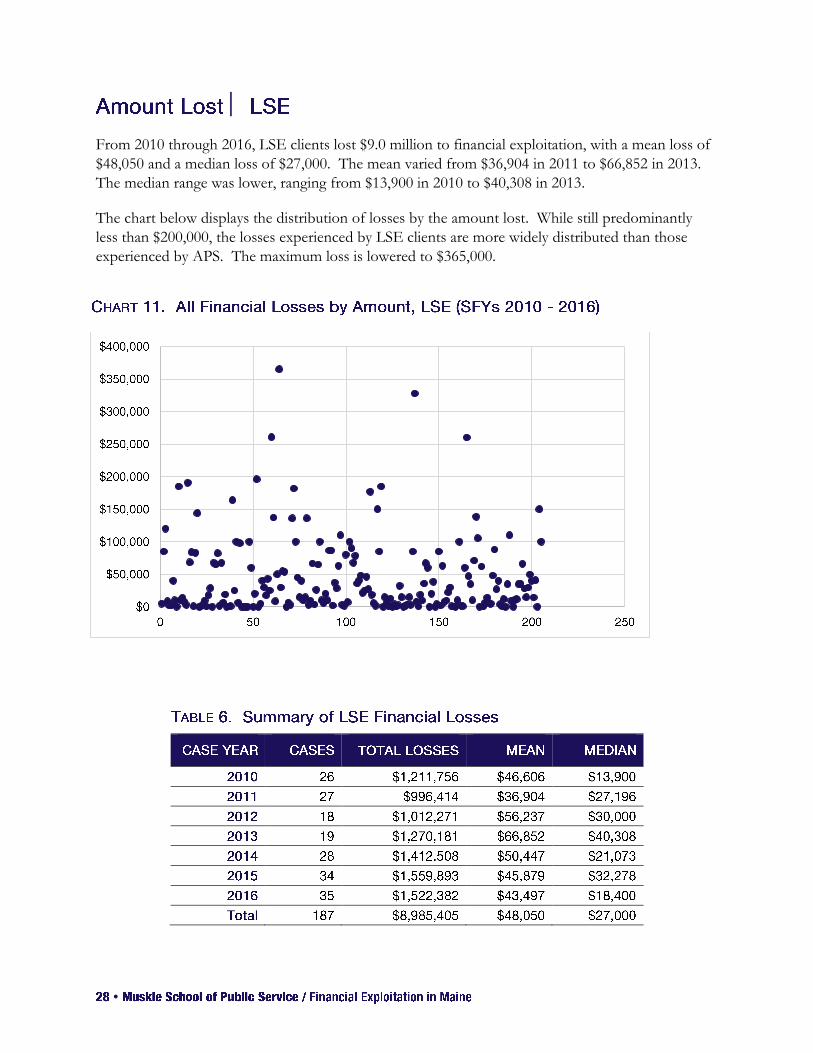
From 2010 through 2016, LSE clients lost $9.0 million to financial exploitation, with a mean loss of
$48,050 and a median loss of $27,000. The mean varied from $36,904 in 2011 to $66,852 in 2013.
The median range was lower, ranging from $13,900 in 2010 to $40,308 in 2013.
The chart below displays the distribution of losses by the amount lost. While still predominantly
less than $200,000, the losses experienced by LSE clients are more widely distributed than those
experienced by APS. The maximum loss is lowered to $365,000.
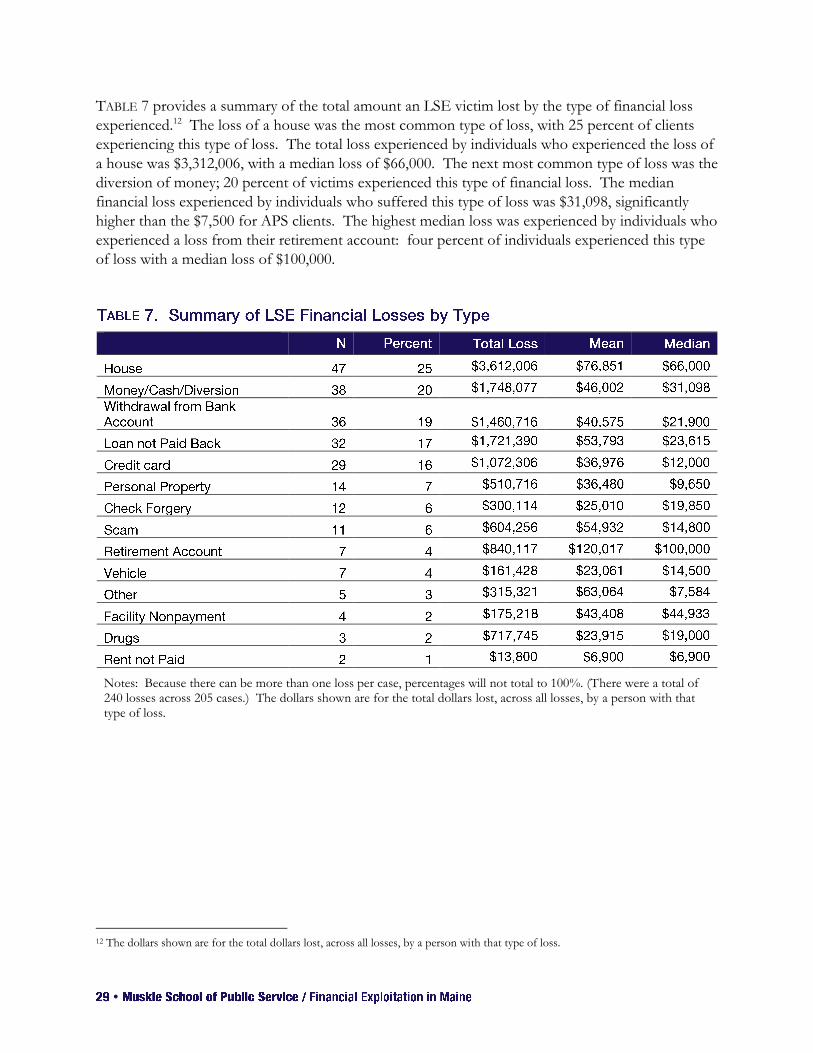
TABLE 7 provides a summary of the total amount an LSE victim lost by the type of financial loss
experienced.12 The loss of a house was the most common type of loss, with 25 percent of clients
experiencing this type of loss. The total loss experienced by individuals who experienced the loss of
a house was $3,312,006, with a median loss of $66,000. The next most common type of loss was the
diversion of money; 20 percent of victims experienced this type of financial loss. The median
financial loss experienced by individuals who suffered this type of loss was $31,098, significantly
higher than the $7,500 for APS clients. The highest median loss was experienced by individuals who
experienced a loss from their retirement account: four percent of individuals experienced this type
of loss with a median loss of $100,000.
Notes: Because there can be more than one loss per case, percentages will not total to 100%. (There were a total of 240 losses across 205 cases.) The dollars shown are for the total dollars lost, across all losses, by a person with that type of loss.
12 The dollars shown are for the total dollars lost, across all losses, by a person with that type of loss.
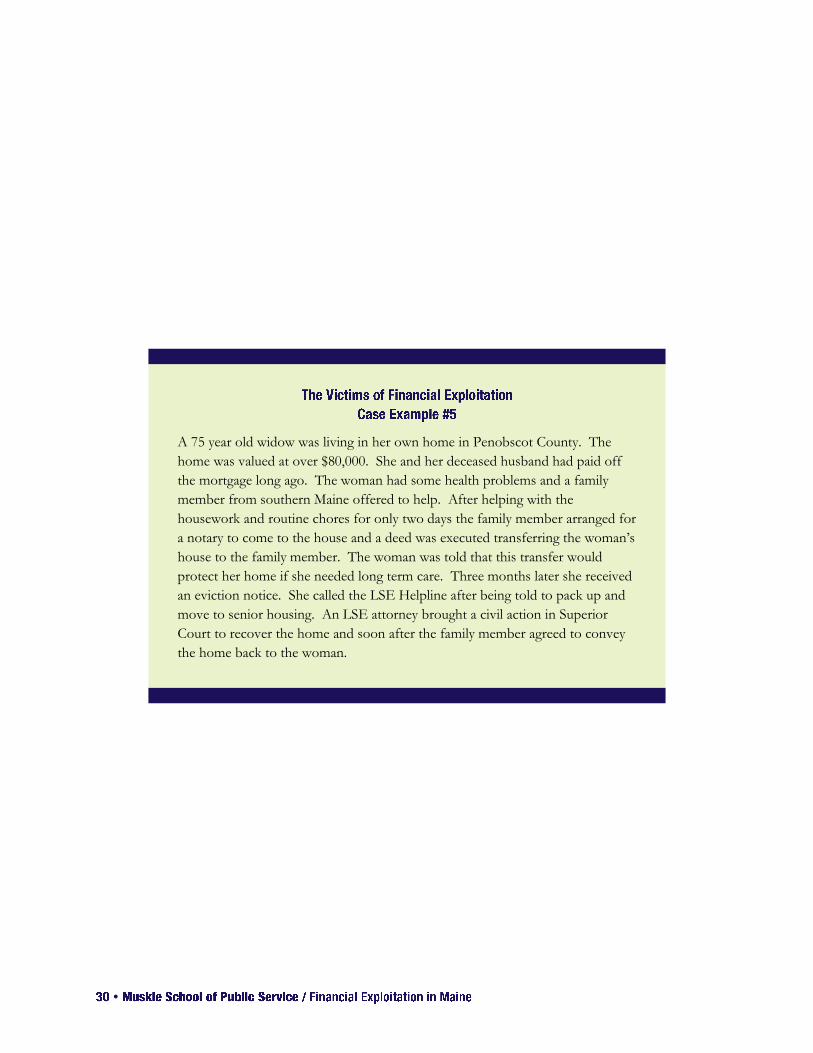
A 75 year old widow was living in her own home in Penobscot County. The
home was valued at over $80,000. She and her deceased husband had paid off
the mortgage long ago. The woman had some health problems and a family
member from southern Maine offered to help. After helping with the
housework and routine chores for only two days the family member arranged for
a notary to come to the house and a deed was executed transferring the woman’s
house to the family member. The woman was told that this transfer would
protect her home if she needed long term care. Three months later she received
an eviction notice. She called the LSE Helpline after being told to pack up and
move to senior housing. An LSE attorney brought a civil action in Superior
Court to recover the home and soon after the family member agreed to convey
the home back to the woman.
Financial exploitation often goes unreported, sometimes because the victim is embarrassed, or afraid
of reprisal, or does not understand or have confidence in the legal process or their rights (Rabiner et
al., 2004). Estimates of the number of cases of financial exploitation that go unreported varies
widely. To estimate the total financial loss if all cases of financial exploitation were reported, this
analysis adopts the methodology used by other states (Utah Division of Aging and Adult Services,
n.d.; New York State Office of Children and Family Services, 2016). In particular, the total number
of reported and unreported cases of financial abuse was calculated using both a low and high
estimate of unreported cases and multiplying that by the median loss for documented for reported
cases. The low estimate is based on an estimate from the National Center on Elder Abuse, which
estimated that one out of 10 cases of financial exploitation is reported (National Center on Elder
Abuse, 1998). The high estimate is based on another study which estimates that only one in 44
cases is reported (New York City Department of Aging, 2011).
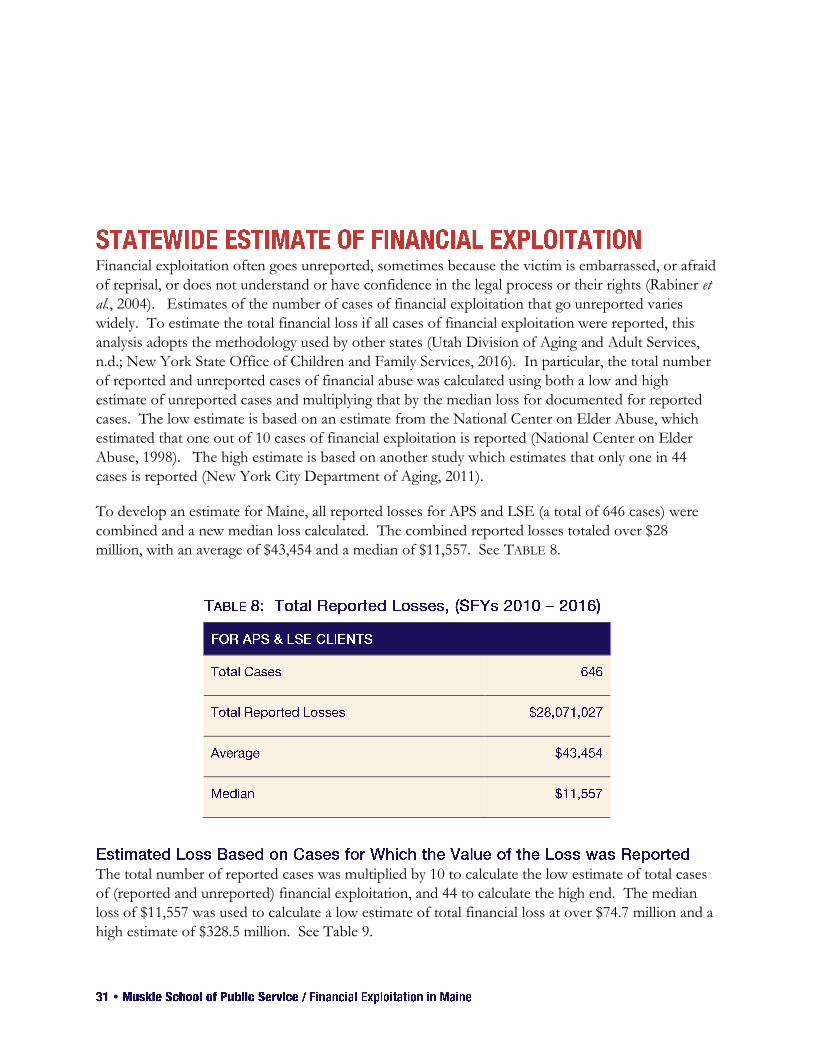
To develop an estimate for Maine, all reported losses for APS and LSE (a total of 646 cases) were
combined and a new median loss calculated. The combined reported losses totaled over $28
million, with an average of $43,454 and a median of $11,557. See TABLE 8.
The total number of reported cases was multiplied by 10 to calculate the low estimate of total cases
of (reported and unreported) financial exploitation, and 44 to calculate the high end. The median
loss of $11,557 was used to calculate a low estimate of total financial loss at over $74.7 million and a
high estimate of $328.5 million. See Table 9.
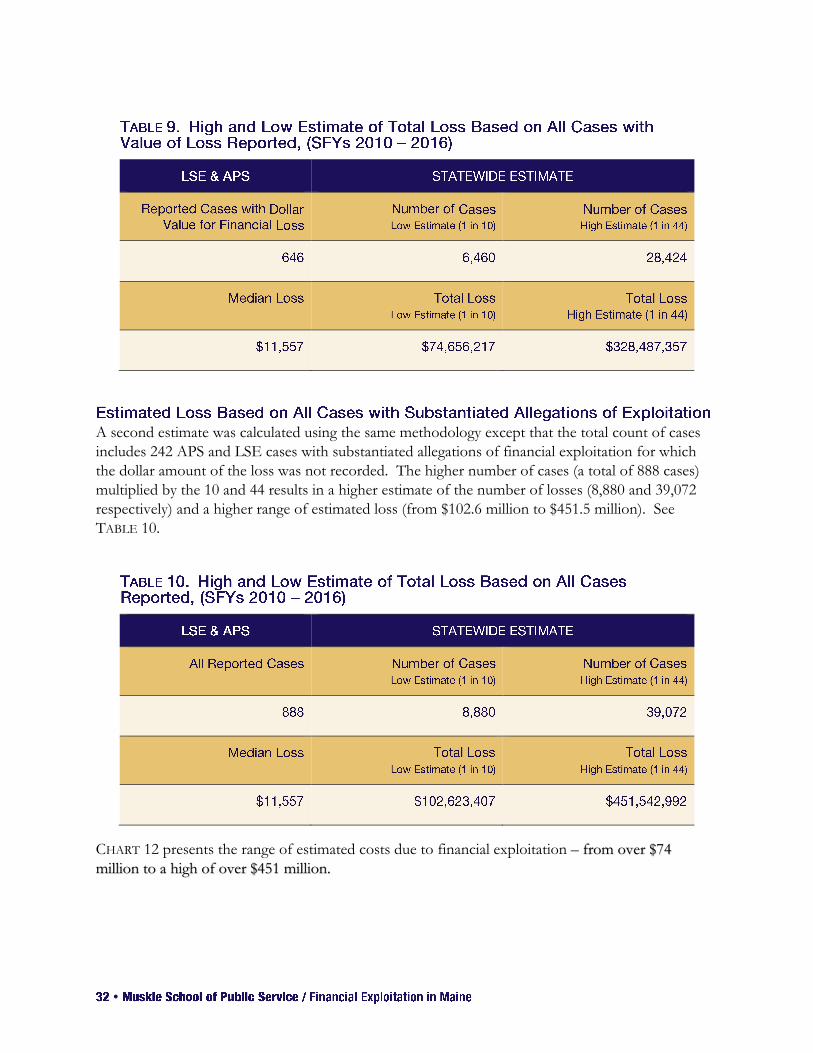
A second estimate was calculated using the same methodology except that the total count of cases
includes 242 APS and LSE cases with substantiated allegations of financial exploitation for which
the dollar amount of the loss was not recorded. The higher number of cases (a total of 888 cases)
multiplied by the 10 and 44 results in a higher estimate of the number of losses (8,880 and 39,072
respectively) and a higher range of estimated loss (from $102.6 million to $451.5 million). See
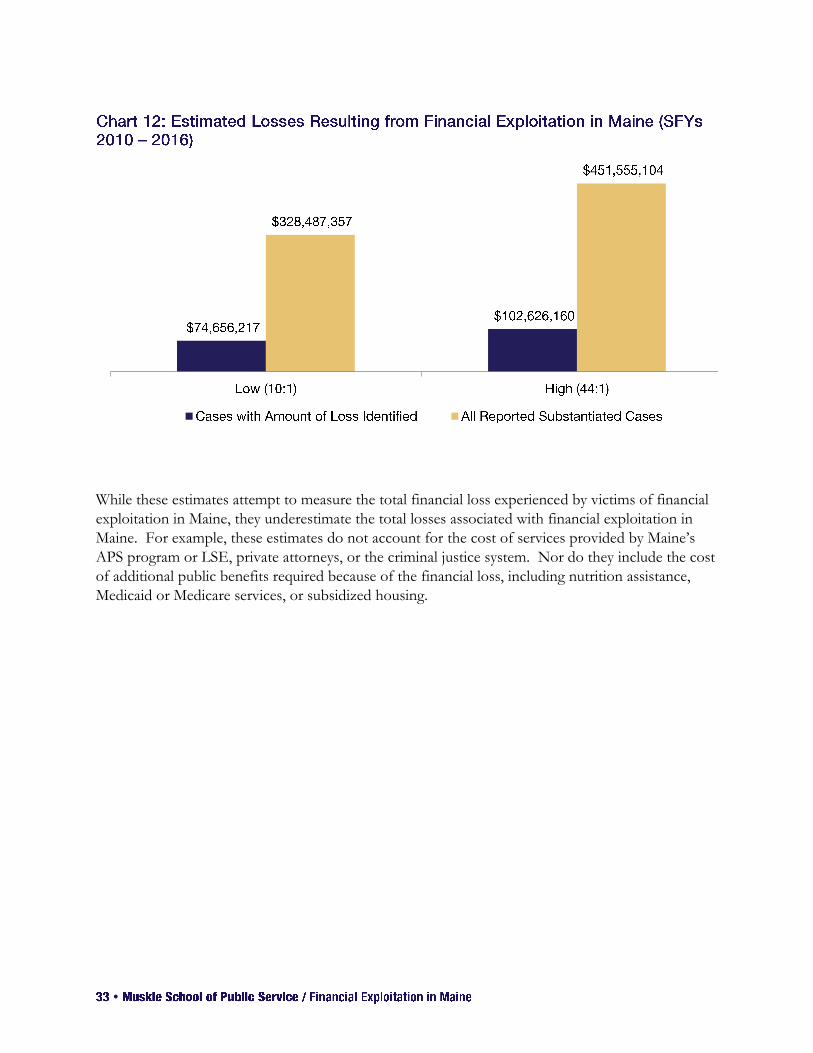
TABLE 10.
CHART 12 presents the range of estimated costs due to financial exploitation – from over $74
million to a high of over $451 million.
While these estimates attempt to measure the total financial loss experienced by victims of financial
exploitation in Maine, they underestimate the total losses associated with financial exploitation in
Maine. For example, these estimates do not account for the cost of services provided by Maine’s
APS program or LSE, private attorneys, or the criminal justice system. Nor do they include the cost
of additional public benefits required because of the financial loss, including nutrition assistance,
Medicaid or Medicare services, or subsidized housing.
Gunther, J. (n.d.). The 2010 Utah Cost of Financial Exploitation. Salt Lake City, UT: Utah Division of
Aging and Adult Services. Retrieved from:
http://digitallibrary.utah.gov/awweb/awarchive?type=download&item=55391
Lifespan of Greater Rochester, Inc., Weill Cornell Medical Center of Cornell University, and New York
City Department of Aging. (2011). Under the Radar: New York State Elder Abuse Prevalence Study.
Retrieved from
http://ocfs.ny.gov/main/reports/Under%20the%20Radar%2005%2012%2011%20final%20report.pdf
National Center on Elder Abuse (1996). The National Elder Abuse Incidence Study: Final Report.
Washington, D.C.: National Center on Elder Abuse.
New York State Office of Children and Family Services. (June 15, 2016). The New York State Cost of
Financial Exploitation Study. Retrieved from:
http://ocfs.ny.gov/main/reports/Cost%20of%20Financial%20Exploitation%20Study%20FINAL
%20May%202016.pdf.
Rabiner, D., Brown, D. & O’Keefe, J. (2005). Financial Exploitation of Older Persons: Policy
Issues and Recommendations for Addressing Them. Journal of Elder Abuse & Neglect, 16(1), 65-84.
DOI: 10.1300/J084v16n01_04.