Embed Size (px)
Citation preview

1
Financial Expertise of the Board, Risk Taking, and Performance:
Evidence from Bank Holding Companies*
Bernadette A. Minton
The Ohio State University
Jérôme P. Taillard Boston College
and
Rohan Williamson
Georgetown University
July 2012
Abstract
Financial expertise among independent directors of U.S. banks is positively associated with balance-sheet and market-based measures of risk in the run-up to the 2007-2008 financial crisis. While financial expertise is weakly associated with better performance before the crisis, it is strongly related to lower performance during the crisis. Overall, the results are consistent with independent directors with financial expertise supporting increased risk-taking prior to the crisis. Despite being consistent with shareholder value maximization ex ante, these actions became detrimental during the crisis. These results are not driven by powerful CEOs who select independent experts to rubber stamp strategies that satisfy their risk appetite.
Key Words: Governance, Risk Taking, Board Composition, Financial Expertise, Risk Management Committee JEL Classification: G20, G21, G24, G32
*Earlier versions of this paper were titled, “Do Independence and Financial Expertise of Board Matter for Risk Taking and Performance.” We thank an anonymous referee, Viral Acharya, Laura Fields, Laurent Frésard, Kai Li, Brian Peters, Jeff Pontiff, Jun Quian, Philip Strahan, David Scharfstein, René Stulz, and seminar participants at the NBER Fall 2010 Corporate Finance conference, the Annual Corporate Governance Conference at the Weinberg Center for Corporate Governance, the 8th International Paris EUROFIDAI-AFFI Finance Meeting, the Conference on Governance and Risk Management in the Financial Services Industry at the FRBNY, the Western Economic Association Meetings, Boston College, Georgetown University and Ohio State University for helpful comments and suggestions. We also thank Kelvin Moses, José Pérez, Robert Prilmeier, Felipe Restrepo, and Mai Zhang for excellent research assistance. Minton acknowledges financial support from the Dice Center for Research in Financial Economics. Williamson acknowledges financial support from the Stallkamp Faculty Research Fellowship and the Center for Financial Markets and Policy at Georgetown University. Authors’ email addresses: [email protected], [email protected], [email protected]

2
Introduction
The failure of various internal governance mechanisms has often been cited among the
key contributing factors to the 2007-2008 financial crisis (see for example Bebchuk and
Spamann (2010), Guerrera and Thal-Larsen (2008), Hashagen et al. (2009), and Strebel (2009)).
In particular, calls for reform of the financial sector argue that the lack of financial expertise of
board members played a major role in the crisis (e.g. Kirkpatrick (2009) and Walker (2009)).
Financial expertise among independent directors is low among U.S. financial institutions. A
quarter of all publicly-traded U.S. commercial bank holding companies with over one billion
dollars in assets do not have a single financial expert among their independent directors.1 As
such, it is commonly believed that the presence of more independent financial experts on the
board would have limited the excessive risks taken by banks’ management and mitigated their
fall during the financial crisis. The goal of this paper is to test this assertion by analyzing how
the banks’ measures of risk and performance relate to the presence of independent financial
experts on their board.
Financial experts among a board’s independent directors arguably have lower costs in
acquiring information about the complexity and associated risks of certain financial transactions
and hence are better able to efficiently monitor senior management (Harris and Raviv (2008)).
As such, a more financially knowledgeable board can recognize risks that will not pay off or
which are unsound for the financial stability of the bank and advise senior managers to avoid
such risks. Alternatively, these financial experts can identify risks that are more beneficial to
shareholders in normal times and encourage management to take on those risks. Additionally,
recognizing the explicit and implicit government guarantees given to banks, financial experts
1 For example, at year-end 2006, JP Morgan Chase had 12 independent directors of which only two had financial expertise. See Appendix A for details on JP Morgan Chase.

3
among the independent directors might encourage senior management to pursue risk taking
activities to increase the residual claims of the bank’s shareholders (Merton (1977), Marcus
(1984), Keeley (1990), Acharya et al. (2010)). Thus, it is an empirical question as to whether the
presence of financial experts on the board is associated with more or less risk taking and whether
the risks taken create value for shareholders. In this paper, we examine these questions by
analyzing a large sample of U.S. commercial bank holding companies both prior to and during
the 2007-2008 financial crisis.
After controlling for various bank, board, and risk management characteristics, we find
that the fraction of independent financial experts is positively related to several measures of risk
in the period leading to the 2007-2008 financial crisis. Our results are stronger for the subset of
large banks, defined as having total assets greater than those of the median bank.2 Specifically,
an increase in the percent of financial experts among independent directors is positively related
to the total risk of the bank’s equity and its real estate loan exposure and negatively related to its
Tier-1 and total risk-weighted capital ratios. For example, a one-standard deviation increase in
the our financial expertise measure is associated with a 34-basis point decline in a bank’s Tier-1
risk-weighted capital ratio; an economically significant drop compared to the average Tier-1
risk-weighted capital ratio of 10.4% among large banks. Moreover, we observe that prior to the
crisis, between 2003 and 2006, banks with more financial expertise slightly outperformed banks
with less expertise. These results are largely consistent with the view that financial expertise is
associated with more risk taking that benefits shareholders in normal times.
Yet, when we analyze how financial expertise relates to banks’ performance during the
2007-2008 crisis, we document a strong negative relation that holds especially for large banks.
2 Our sample consists of bank holding companies with total assets greater or equal to $1Bn. For the period between 2003 and 2008, the median value for total assets stands above $3Bn dollars.

4
A one standard deviation increase in financial expertise levels is associated with a five percent
drop in stock value during the crisis; an economically meaningful impact when compared to a
median stock performance of about minus 40% between January 2007 and December 2008. For
the subset of large banks, the negative relation remains statistically and economically significant
even after augmenting the set of controls to include exposure to real estate loans, deposit
financing, and mortgage-backed securities.
Taken together, these findings indicate that financial expertise is associated with more
risk taking that potentially benefits investors before the financial crisis but turn out to be
detrimental during the crisis. These results are consistent with Beltratti and Stulz (2010) who
study an international panel of large banks and find that pro-shareholder boards are associated
with higher (lower) performance prior to (during) the crisis, potentially reflecting decisions that
were thought to maximize shareholder value but did not perform as expected when the crisis hit.
Endogeneity concerns always exist in studies relating corporate governance aspects to
firm performance (e.g. Hermalin and Weisbach (1998), Adams, Hermalin and Weisbach (2010)).
In our setting, directors with financial expertise are not randomly allocated across banks.
Empirically, we specify lagged independent variables similar to the main specifications of Coles,
Daniel and Naveen (2008) and Linck, Netter and Yang (2008) and separately use propensity
score matching techniques, as in Drucker and Puri (2005). The results of our propensity score
matching analyses corroborate our regression-based results.
We also test a potential reverse causality interpretation of our results by examining
whether the presence of independent financial experts on boards is positively related to the
presence of a powerful CEO. The rationale behind the focus on powerful CEOs is that if boards
are ineffective, it is because the top management, and in particular the CEO, have control of the

5
firm (Hermalin and Weisbach (1998)). In our setting, it might be that powerful CEOs select
independent financial experts to rubber stamp strategies that satisfy their risk appetite. For this
test, we use four proxies of CEO power and interact these proxies with the financial expertise
variable to test whether the negative relation found between performance during the crisis and
levels of financial expertise is driven by banks with powerful CEOs in place. The interaction
terms are not significant in any of the specifications, thus providing evidence that rubber
stamping by independent financial experts is not driving our main results.
Furthermore, we verify whether the Troubled Asset Relief Program (TARP) in which the
government created a fund that protected against systemic risk had an impact on our results.
Though the likelihood of receiving TARP is associated with certain bank characteristics and
board independence, it is not associated with financial expertise of independent directors.
The results are robust to many alternative specifications. First, our definition of financial
expertise follows Güner, Malmendier and Tate (2008) but we also run our main tests using
alternate definitions of financial expertise and the results hold. Second, we show that all of the
main results hold when independence is defined more restrictively, by taking into account other
potential social and business ties between a director and the CEO of the bank (see Fracassi and
Tate (2010)). Third, the results hold when we exclude the five largest commercial banks, and
hence are not driven by unique features of the mega-banks in our sample. Lastly, the results hold
when the sample includes Savings & Loans associations (S&Ls) and investment banks.
Our research extends the literature examining the role of internal governance mechanisms
going into the financial crisis3 by looking at a specific aspect of board governance — financial
3 Several recent papers examine the role of internal governance mechanisms going into the financial crisis (e.g. Adams (2009), Erkens, Hung, and Matos (2009), and Ferreira, Kirchmaier, and Metzger (2010)). For instance, a fair amount of attention has been given to the incentives of bank management in the run-up to the crisis and during the

6
expertise of independent directors — that is relevant to the current debate on how to “fix”
financial firms and regulate the industry going forward.4 In stable times, the presence of
financial experts among the independent directors is associated with higher risk taking and
slightly above-average performance. Since financial expertise on the board is related to more
risk taking, it is not surprising that banks with more independent financial experts underperform
when the crisis hits. These results are still consistent with the board acting to maximize
shareholder value ex ante. However, our results do challenge the popular view that more
financial expertise on the boards of banks would unambiguously lower their risk profile since
this lower risk level may not have been in the best interest of shareholders prior to the crisis.
The remainder of the paper proceeds as follows. Section I describes the sample and
board characteristics. Section II discusses results related to risk taking and board composition in
the run-up to the 2007-2008 crisis. Performance prior to and during the crisis and how it relates
to board composition are examined in Section III. Section IV discusses several robustness tests.
Section V concludes.
I. Sample description and board characteristics
I.A Sample
crisis (see Fahlenbrach and Stulz (2011), Bebchuk, Cohen, and Spamann (2010), and Cornett, McNutt and Tehranian (2010)). 4 In a recent study, Fernandes and Fich (2009) examine how financial expertise relates to bank performance during the crisis. Their definition of expertise is quite different from ours as they define financial expertise of the board as the average number of years of banking experience among board directors. Overall, their results are different from ours. We conjecture that this is due to several factors including the different set of banks and controls they use, the different definition of financial expertise and their different empirical strategy; in particular, they focus on an event study around Lehman’s bankruptcy.

7
The original sample of financial institutions includes all U.S. banks along with specialty
and other finance firms on the BoardEx database, a business intelligence database that includes
profiles of over 350,000 business leaders across 19 countries, during the 2000 to 2008 period.
Given the smaller and potentially biased coverage prior to 2003, we focus only on the 2003 to
2008 period. We eliminate small local institutions by focusing only on those with more than one
billion dollars in assets. All insurance companies, REITs and investment companies are also
eliminated by keeping only those firms in the Standard Industrial Classification codes of 602,
603, 6211 and 6282. The remaining sample includes commercial bank holding companies,
S&Ls and investment banks. Commercial bank holding companies comprise 75% of the sample,
S&Ls about 23% and investment banks 2%.
One concern related to the empirical analysis is the potential heterogeneity among
different types of financial institutions. The impact of the financial crisis arguably might differ
across commercial banks, S&Ls, and investment banks. To make sure that there is consistency
across the sample, we focus our main analysis on the subset of commercial bank holding
companies (hereafter referred to as banks). We discuss the impact on investment banks and
S&Ls relative to banks in the robustness section. The sample of banks varies from 182 banks in
2003 to 119 in 2008, with a maximum of 206 banks in 2005. We also require that banks have
data on Compustat and CRSP.5
Lastly, much of the discussion surrounding the crisis and how the government would
respond to each distressed financial institution has revolved around the idea that large institutions
are different from small institutions. In particular, if implicit government backing is stronger for
large banks, it might affect ex ante how board members view the optimal risk taking level.
5 Depending on the specifications of our tests, the sample size is sometimes reduced further due to data availability issues on some balance sheet items, stock market data or call report data.
8
Furthermore, a bank’s size can affect its risk profile in various ways. Larger banks tend to be
better diversified and hence less vulnerable to shocks than smaller banks. Conversely, larger
banks might also engage in more risky activities than do smaller banks, such as more off-balance
sheet operations. Thus, in the empirical analyses we run each set of tests on both the full sample
of banks and the subsample of large banks, defined annually as banks with total assets exceeding
those of the median bank.
I.B Financial expertise
Information on the financial expertise of independent directors is collected from annual
bank proxy statements and BoardEx. Similar to Güner, Malmendier and Tate (2008), we classify
an independent director as a financial expert if he or she (i) has worked within a banking
institution, (ii) currently works at a non-bank financial institution, (iii) has a finance-related role
within a non-financial firm (e.g. CFO, accountant, treasurer, or VP finance) or (iv) academic
institution (e.g. professor in finance, accounting, economics or business), (v) is a professional
investor (e.g. hedge fund, private equity).
It is common for a director to sit on the board of both the parent bank holding company
and one of its subsidiaries.6 However, bank regulations do not allow a management official of
one depositary institution to sit on another bank’s board at the same time if they are not
affiliated. Accordingly, we do not classify a current executive working at a subsidiary of the
bank to be an independent financial expert at the bank holding company level.7 Our financial
6 In a majority of cases, it is related to acquisitions where an executive of the acquired banks steps down and joins the board of the merged entity (see Adams and Mehran (2003, 2008, and 2012). 7 We thank the referee for making this point and helping us clarify our previous definition of financial expertise. Although exemptions can be made, Federal Reserve regulation L forbids interlocks of management officials for depositary institutions and their holding companies.

9
expertise variable is measured as the fraction of reported independent directors that are classified
as financial experts.8
Figure 1 summarizes the average composition of financial expertise over the sample
period. As Figure 1 shows, more than 30% of independent directors with finance expertise hold
finance related positions at non-financial firms and more than half of the financial experts are
current or former executives at financial firms, with 43% holding positions at non-bank financial
institutions. While regulations do not allow bankers to work and be a board member in two
different banks at the same time, several banks place former bankers on their board. In all, more
than 10% of independent financial experts have past executive experience in banking.
[Insert Figure 1 here]
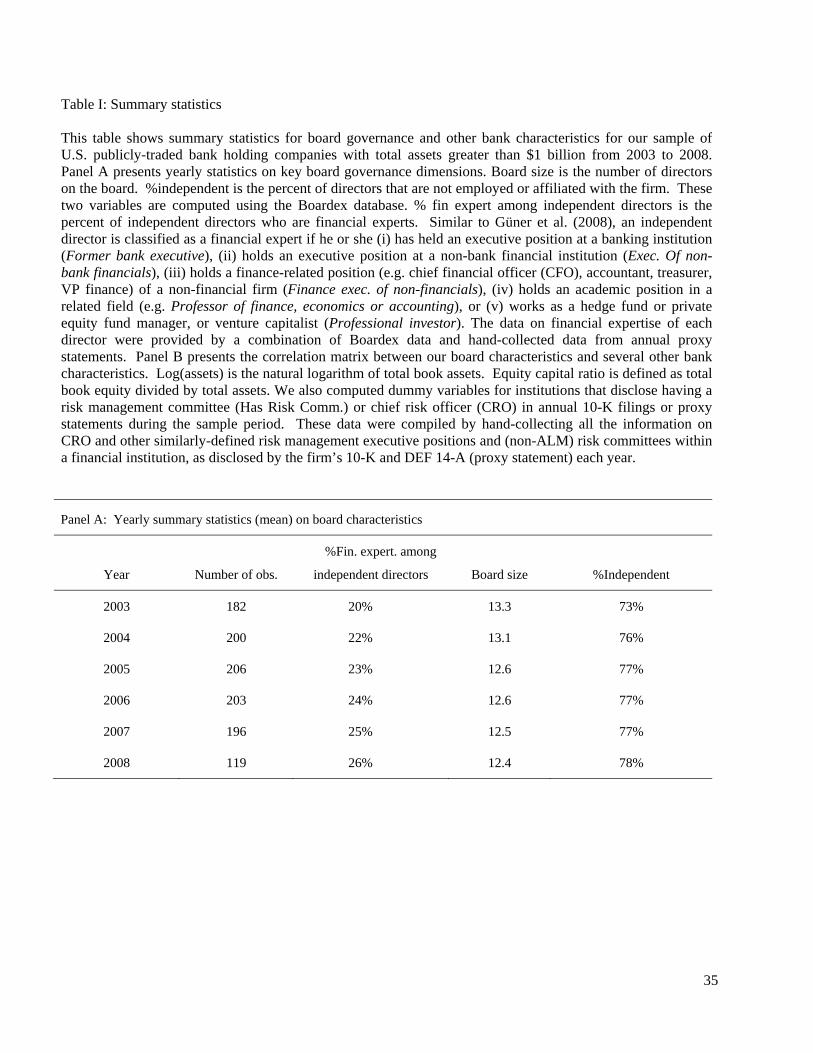
Table I reports data on financial expertise and other board characteristics. Column one in
Panel A of Table I summarizes the average level of financial expertise across the sample. The
fraction of financial experts among independent directors increases from 20% in 2003 to 26% in
2008.
[Insert Table I here]
Figure 2 shows the distribution of independent financial experts among banks at year-end
2006. It is interesting to note that the distribution is relatively spread out. Furthermore, the
figure shows that almost 25% of banks have no financial experts among their independent
directors. Given this high proportion of zero financial expertise among independent directors,
8 See section V for results with alternate definitions of financial expertise.

10
we also run all of our tests defining financial expertise as an indicator variable that takes value
one if at least one independent director has financial expertise and zero otherwise. All the results
using this variable are qualitatively similar to those reported and are therefore not shown. The
propensity score analyses also use this definition to categorize banks in the treatment versus the
control group.
[Insert Figure 2 here]
I.C Other board characteristics
We control for three other characteristics of banks’ boards: board size, board
independence, and the presence of a risk management function.9 Data on board size and board
independence are taken from BoardEx which reports the disclosure made by firms along those
dimensions. Board size is defined as the number of directors on the board. Decision making
costs are often assumed to be lower in smaller boards than in larger boards. As such, smaller
boards might be more effective monitors. Board independence is the ratio of the number of
directors reported as independent in a bank’s proxy statement relative to board size.
Independence is based on the definition set by the NYSE and NASDAQ guidelines.
As shown in Table I, the average board size decreased slightly from about 13.3 board
members in 2003 to about 12.4 members in 2008. Levels of board independence are high among
our sample of banks. In 2003, 73% of the board is independent. By 2008, independent directors
make up over 78% of the board.
Ellul and Yerramilli (2010) and Aebi, Sabato, and Schmid (2011) show that risk
management governance can matter for risk taking. For almost all commercial banks, the risk
9 Busy boards are related to poor corporate governance among non-financial firms (Fich and Shivdasani (2006)). We do not control for this characteristic as it is a rare feature among our sample of commercial banks.

11
management function is performed either by the Audit Committee or the Asset and Liability
Management Committee of the board of directors. Thus, there would be no variation in indicator
variables denoting these committees across banks. However, some banks disclose the presence
of a Chief Risk Officer (CRO) or Risk Management Committee that oversees risk monitoring
and reports to the Board of Directors and separate from the Audit or Asset and Liability
Management Committees. To detect the presence of these two risk monitoring functions, we
perform multiple key word searches of all 10-Ks and DEF 14-A (proxy) statements during the
sample period. We then verify manually each flagged financial statement and hand-collect all
the disclosed information regarding both the executive positions and committees related to risk
management. By relying on voluntarily disclosed information by firms, we are probably
underestimating the true number of firms having these risk functions in place. The risk
management structures (CRO, and risk committee, discussed below) are also positively related to
bank size (untabulated). This fact is not surprising given the increased complexity of operations
at larger banks.
Panel B of Table I presents a correlation matrix for the variables measuring board size,
board independence, finance expertise, and selected bank characteristics. There are several
features of the data worth highlighting. First, there is a positive correlation between board size
and bank size, which is consistent with the results presented in Adams and Mehran (2003, 2008).
Second, there is no correlation between our measure of finance expertise of the board and other
board characteristics. Hence financial expertise among independent directors reflects a
dimension of the board that is not captured by other board variables. Lastly, there is a slight
negative correlation between bank size and the fraction of financial experts among independent
directors.

12
II. Board composition and firm risk
In this section, we examine the associations between board characteristics and two groups
of risk measures in the run-up to the 2007-2008 financial crisis: a market-based measure of risk
(section II.A) and two balance sheet-based measures of risk (section II.B). To examine whether
large banks behave differently from small banks, we run each test on the subset of large banks
separately. We also investigate the impact of sample biases by using a propensity score
matching technique to address possible endogeneity concerns (section II.C).
II.A Board composition and market-based risk
Table II presents the OLS regression coefficient estimates for regressions examining the
relation between total risk and bank and board characteristics. Total risk is our market-based
measure of risk and is computed annually as the standard deviation of daily stock returns over
the calendar year. The dependent variable in the OLS regressions is the average total risk over
the 2004 to 2006 period. All explanatory variables measuring bank and board characteristics
including the risk monitoring function, board size, board independence, and financial expertise
are measured at year-end 2003.
[Insert Table II here]
Results for all banks are reported in the first two columns and for the subset of large
banks in the last two columns.10 For each sample, we estimate two regressions: one excluding
10 To be consistent throughout the study, the above-median cutoff for large banks is the same as in the other tables. However, there is a larger fraction of the smaller banks that do not have all the data for this specification; this explains the low sample size reported in the first two columns of the table.

13
the fraction of financial experts among independent directors (Regression (1)) and one which
includes this financial expertise variable (Regression (2)). As the table reports, larger banks and
larger boards are associated with lower levels of total risk. For example, for the full sample of
banks, a one member increase in board size is associated with a decrease in total risk of 15 basis
points. This decrease has to be compared to the average daily total risk for the sample of firms is
equal to 1.25%. The negative relation between risk and board size is similar to the results in
Pathan (2009) for financial firms and Cheng (2008) for non-financial firms. Cheng (2008)
argues that because of the compromises needed to reach decisions in larger boards, stock returns
should be less variable for firms with larger boards.
Table II shows that, after controlling for bank and other board characteristics, financial
expertise among independent directors is positive and statistically significantly related to total
risk (Regressions (2)). The coefficient estimates, however, are larger and more statistically
significant for the subset of large banks than they are for the full sample of banks. For the subset
of large banks, a one-standard deviation increase in the fraction of financial experts among a
board’s independent directors is associated with a seven-basis point increase in average daily
volatility, corresponding to slightly more than a 5% increase in total risk relative to the sample
mean. For the full sample of banks, a one-standard deviation increase in the fraction of financial
experts among a board’s independent directors is associated with less than a four-basis point
increase in average daily volatility, corresponding to a 2.5% increase in total risk relative to the
sample mean.
The positive associations are consistent with financial experts acting in the interest of
shareholders as shareholders benefit from more risk-taking given that their cost of capital does
not reflect the riskiness of their assets (Merton (1977)). The positive associations are also

14
consistent with a more financially knowledgeable board having a better understanding of
complex investments and potentially encouraging bank management to increase their risk taking.
II.B Board composition and balance sheet-based measures of risk
We analyze two balance sheet choices in this section: real estate related activity and bank
leverage.11 Data on the bank balance sheets are from FR Y-9C filings and are available from the
Federal Reserve Commercial Bank Holding Company Database. We examine real estate activity
because of its prominent role in the financial crisis. Bank leverage is examined through the lens
of capital ratios. Given that equity capital serves as a buffer to weather financial crises, capital
ratios are direct measures of the willingness of the bank to take on a riskier profile. Commercial
banks have discretion in choosing levels of equity capital, as long as it is above the minimum
regulatory levels.12 The higher the capital cushion, the safer is the bank. However, from a
shareholders’ perspective, the higher levels of capital dampen the potential returns on equity.
The cross-sectional regression results for capital ratios and real estate exposure at the onset of the
crisis are shown in Table III. As in Table II, we estimate the OLS regressions for the full sample
of banks and the subset of large banks.
[Insert Table III here]
11 See the robustness section for the discussion of results along other dimensions of risk taking. 12 The distribution of Tier-1 capital ratios is bell-shaped and does not exhibit any lower bound spike.

15
Panel A of Table III provides the OLS regression results for Tier-1 capital to the risk-
adjusted assets ratio.13 Similar to the regression in Table II, we estimate two sets of regressions:
one without the percentage of financial experts among independent directors (Regression (1))
and one with this variable (Regression (2)). Consistent with extant research, lagged net interest
margin is negatively associated with equity capital across all regression specifications. Higher
levels of profitability are associated with lower capital buffers.
After controlling for bank and other board characteristics, financial expertise is
negatively related to Tier-1 risk-weighted capital ratios in the subset of large banks. A one-
standard deviation increase in the percent of financial experts among independent directors is
associated with a 34-basis point decline in a bank’s Tier-1 risk-weighted capital ratio; an
economically significant drop compared to the average Tier-1 risk-weighted capital ratio of
10.4% among large banks. This negative association is consistent with the idea that banks with
more financial experts had more leverage and hence were more exposed at the onset of the
financial crisis. Lastly, as Panel A reports, the other board variables are unrelated to the banks’
capital ratios.
Panel B of Table III provides the regression results for exposure to real estate, defined as
the proportion of loans secured by real estate on the balance sheet. Surprisingly, financial
expertise, as well as the other board characteristics, is not related to real estate exposures of
banks across most regression specifications.
II.C. Association between financial expertise and risk taking
13 Results explaining Tier-1 capital to total assets and total capital to risk-adjusted assets yield quantitatively similar results and are hence not shown.

16
As reported in Table I, about 25% of a board’s independent directors are financial
experts. The results in Table II and Table III show that, after controlling for bank and board
characteristics, including the risk management function, these experts, on average, are associated
with higher market- and balance-based measures of risk, especially for large banks.
In this section, we address the interpretation of these results and in the following section
we examine the performance consequences of these associations. One interpretation of our
results is that independent financial experts, representing on average a quarter of the independent
directors on the board, influence and/or sanction the decision making of senior bank executives
such that the banks’ measures of risk are higher. Another interpretation, more skeptical and
which recognizes regulators’ monitoring of banks’ activities and capital positions, is that
independent directors with financial expertise are not randomly allocated across banks and many
of the variables that are correlated with the appointment of these directors are also correlated
with the banks’ risk profile. In the absence of a natural experiment or an econometrically valid
instrument, we follow Drucker and Puri (2005), Aggarwal, Erel, Stulz, and Williamson (2009),
and Fahlenbrach, Minton, and Pan (2011) and use propensity score matching techniques to
address the potential endogeneity concerns.
[Insert Table IV here]
Panel A of Table IV presents the results of propensity score analysis for total risk. Panel
B and Panel C present the results of the propensity score analysis for balance sheet risk
measures. In the first stage, we calculate each observation’s propensity score. The propensity
score is equal to the probability that a firm with given characteristics has a financial expert
17
among its independent directors. To be consistent with our regression results in Tables II and III,
the set of controls in the first stage are the same bank and board characteristics used as controls
in the regression framework. In the second stage, each firm with a financial director among its
independent directors (treatment group) is matched with a set of firms that do not have a
financial director among its independent directors (control group) that have the closest
propensity score to the treated firm.14
The results in Panel A of Table IV show that the average total risk during the period
2004-2006 is greater for banks with at least one independent financial expert on their boards.
The difference between the two groups is statistically significant for the full sample of all banks
but not for the subset of large banks. Generally, the results indicate that banks with more
independent financial experts had higher total risk prior to the crisis.
Panel B of Table IV reports the results of our propensity score analysis of Tier-1 risk-
weighted capital ratios. Large banks with financial experts among their independent directors
have lower Tier-1 risk-weighted capital ratios. In contrast, there is no difference between Tier-1
risk-weighted capital ratios between the treatment and control group of banks for the full sample.
These results are consistent with those shown in Table III using a regression approach.
The propensity score analysis in Panel C shows that large banks with financial experts
among their independent directors have higher real estate exposure than those with no financial
expertise among their independent directors. As the propensity matching approach allows for a
better match among treated and control banks based on observable differences such as bank size,
we can conclude that there is a significant link between the presence of independent financial
14 Results are shown for the radius methodology. Similar results are obtained when using the kernel, caliper or nearest neighbor match (5) approach.

18
experts on the board and higher risk-taking profile as captured by higher leverage and higher
exposure to real estate among the subset of large banks.
In this sub-section we have focused on potential endogeneity concerns of our results.
Overall, we show that banks with more financial expertise were engaged in more risk-taking in
the period leading up to the financial crisis which is consistent with results shown in the previous
sub-sections. The risk level was higher for the total risk as well as for risk capital and real estate
which is believed to be one of the main drivers in the financial crisis.
III. Board characteristics and performance
In the previous section, we show that banks with more financial expertise took on more
risks in the period leading up to the financial crisis. In this section, we examine the
consequences of these decisions by examining the associations between financial expertise of the
board and performance during the 2007-2008 crisis period, as well as during normal times prior
to the crisis.15
III.A Performance during the 2007-2008 crisis period
Table V presents the regression coefficients of stock performance during the crisis period
on bank and board characteristics. Stock performance is measured as the nominal cumulative
stock return from January 2007 to December 2008.16 The set of firm and board characteristics
used as controls in the regressions are measured at fiscal year-end 2006, except for banks’ past
15 We do not use accounting-based measures of performance such as write-downs on toxic assets as these numbers can be booked at different times for different banks, sometimes reversed and are generally subject to changes in accounting rules and government intervention. 16 We require at least six months of valid monthly stock return data in order to compute the cumulative returns. Therefore, the sample includes banks that delist between June 2007 and December 2008, as long as they were trading since January 2007. Results using abnormal returns without beta as a control yield quantitatively similar results.

19
cumulative stock returns measured during the calendar year of 2006 and beta, which is computed
using a market model with daily returns over 2006.
[Insert Table V here]
Panel A of Table V gives the results for the full sample of banks. The first two columns
contain a base set of regressors and the second two columns contain an augmented set of
controls. The set of “augmented” controls includes the same variables as those used in the first
two columns and adds several extra dimensions of risk exposures from Call Report (FR Y-9C)
data: The proportion of total loans to total assets, the proportion of deposits to total assets, a
measure of real estate exposure with real estate loans to total assets, the amount of non-deposit
short-term financing, the level of off-balance sheet securitized assets (home equity, car loans,
credit cards, etc.) and a measure of exposure to mortgage-backed securities with the total amount
of mortgage-backed securities held on the balance sheet (including those held by the firm,
available for sale and in the trading account) relative to total assets. These data are all
winsorized at the 1% and 99% levels.
As Panel A reports, few firm and board characteristics are significantly related to
performance. Beta is positively and significantly related to stock performance over the crisis
period in all specifications. The presence of a Chief Risk Officer (CRO) has a positive
relationship with firm stock performance and is significant for three of the four specifications,
while the percent of independent directors is significantly and negatively associated with stock
performance during the crisis. These results are confirmed in Aebi, Sabato and Schmid (2011)
who examine the impact of board level risk management on bank performance during the 2007-
2008 crisis.

20
Holding firm and board characteristics constant, the percentage of independent financial
experts and board size are not significantly related to stock performance during the crisis when
using the base set of controls in the first two columns. We perform several robustness checks
including different control variables such as the credit rating of financial institutions. For
instance, if beta is taken out, then other firm characteristics, such as equity capital, become
significant in explaining stock returns during the crisis. However, our results for financial
expertise hold across all specifications.
In columns three and four of Table V Panel A, we include the set of variables that reflect
financing and other operating and financing choices made by the bank. The results show that
independence is still negatively associated with performance, while financial expertise is not
related to worse performance during the crisis. Not surprisingly, exposure to real estate is
strongly and negatively related to performance during the crisis.
The results for large banks are shown in Panel B of Table V. For the large bank sub-
sample, beta is statistically significant for only two of the four specifications and all other base
controls are not significant. The only firm characteristic that is significant throughout is the
exposure to real estate as measured by real estate loans to total assets. The negative association
between real estate loans and performance is not surprising given the central role of the real
estate bubble in the financial crisis.
In terms of board characteristics, similar to the results in Panel A, board independence is
negative and significant for all specifications though less so for the base specification. In
contrast to the full sample of banks, in all specifications in Panel B, financial expertise among
independent board members among large banks is negatively related to stock performance during
the crisis. Moreover, the associations are economically and statistically significant. A one

21
standard deviation increase in financial expertise levels at the onset of the crisis is associated
with a five percent drop in the stock market performance during the crisis, relative to a mean
(and median) stock performance of about -40% between January 2007 and December 2008. The
negative association remains when we use the augmented set of controls in the regressions.17
III.B Performance during the 2003-2006 pre-crisis period
Table VI reports the analyses that relate bank and board characteristics to bank
performance over the 2003 to 2006 pre-crisis period. The dependent variable is the cumulative
stock return during the pre-crisis period. All independent variables are taken as of fiscal year-
end 2003.
[Insert Table VI here]
Table VI, panel A shows the results for the full sample of banks. As in Table V, the first
two columns contain a base set of regressors and the second two columns contain an augmented
set of controls. In contrast to the crisis-period regressions in Table V, the coefficient estimates
on the financial expertise variable are positive and statistically significant. A one-standard
deviation increase in the percent of financial experts among the independent directors is
associated with a 13% increase in stock returns, compared to a median stock appreciation of 70%
over the pre-crisis period.
Panel B reports the OLS regression results for subset of large banks. Similar to the
results for the full sample of banks, the coefficient estimates on the financial expertise variable
17 To further confirm these results, we also run the same set of tests explaining changes in firm value as measured by percentage changes in Tobin’s Q (Market to book value of assets) during the crisis period, from fiscal year-end 2006 to fiscal year-end 2008. This specification requires banks to be in the sample at fiscal year-end 2008, which reduces the dataset. The results are very similar to those from the stock performance regressions and hence not shown.

22
are positive. However, they are not statistically significant. Overall the pre-crisis results are
consistent with banks with more financial expertise on the board being associated with better
stock performance leading up to the financial crisis.
III.C Risk taking, expertise and CEO power
Given the cross-sectional nature of our tests, one possible competing explanation for our
findings is that strong CEOs who were more prone to risk taking hired independent financial
experts to rubber stamp their intentions. If that were true, the CEO’s desire to take on more risks
is driving both an increase in risk taking (and a consequent poor performance during the crisis)
and higher levels of financial expertise among independent directors. This rubber stamping from
independent directors could give the illusion of independent expert verification, while in reality
the powerful CEO would control the board’s decisions. We test this alternative explanation for
our results in this section.
To run these tests, we define four proxies to capture CEO power relative to their
boards. The first measure (Table VII, Column 1) is an indicator variable that takes the value
of one whenever the CEO has a dual role of CEO and Chairman of the board and zero
otherwise. The dual role of a CEO has long been recognized as giving the CEO significant
power over the board (e.g. Dahya et al. (2002)). The second measure is taken from Landier et
al. (2007). They define a director to be “independent of the CEO” if his appointment to the
board occurs prior to the appointment of the current CEO. A measure of board strength can be
derived from the percentage of board members whose tenure on the board exceeds that of the
current CEO. We rank all banks according to this measure and define a CEO strength
indicator variable that takes the value of one if the bank falls below the median in terms of this

23
measure of board power (Table VII, Column 2). The other two measures are closely related to
the one just described. Instead of computing the percentage of all directors with tenure greater
than the current CEO, we compute the percentage of independent directors with greater tenure
and again define firms with powerful CEOs with an indicator variable that takes the value of
one for all banks below the median of the commercial bank sample (Table VII, Column 3).
Lastly, we compute the percentage of independent financial experts whose tenure exceed that
of the CEO and also define a CEO strength variable to take the value of one for all banks that
fall below the median value according to that dimension (Table VII, Column 4).
The correlation among these different measures of CEO strength is positive. Among
the three measures based on relative seniority of board members to the CEO, correlations
range between 0.80 and 0.44 and between these seniority-based measures and the dual role
indicator variable, correlations vary between 0.23 and 0.16.
[Insert Table VII here]
The results in Table VII are qualitatively similar across the various measures of CEO
power. The firm characteristic variables are not significant except for size squared for the first
three measures of CEO power. As with the prior results, we see that large bank performance is
significantly negatively related to real estate loan exposure.
Holding bank characteristics constant, independence and independent financial expertise
is negatively related to performance. None of the CEO power variables are related to firm
performance. To directly test whether the powerful CEOs are driving the negative relationship
between financial expertise among independent directors and performance during the crisis, we
24
interact the proxies of CEO power with the variable measuring financial expertise of the board.
If this interaction term is negative and statistically significant, it would lead us to conclude in
favor of the rubber stamping hypothesis. However, the interaction term is not significant in all
four specifications of CEO power. The interpretation of these finding is that powerful CEOs are
not simply getting independent financial experts on the board to rubber stamp high risk taking
objectives
III.D TARP
One potential confounding event that occurred during our sample period is the
establishment of the Troubled Asset Relief Program (TARP). Thus, we investigate the effects
TARP might have had on the banks in our sample. During the financial crisis, the federal
government provided funds to financial institutions and other firms in order to alleviate the risk
of systemic failure within the financial system. Though these firms were not in default, these
funds were made available by the government to those that needed them. Many banks received
TARP money.18 Although the great majority of the TARP funds were disbursed after the end of
our sample period, the exercise is still relevant given the potential anticipation of TARP at the
tail end of our sample.
We examine the marginal probabilities from logistic regressions estimating the
probability of receiving TARP funds. The dependent variable equals one if the bank receives
TARP money and zero otherwise. The independent variables include many firm and board
characteristics measured at year-end 2006. Not surprisingly, the results (not shown) imply that
18 We obtain data on TARP recipients from http://bailout.propublica.org/main/list/index. This website reports the list of TARP recipients, the amount of TARP money committed, disbursed and returned. Using this website, we identify 160 of the sample firms which received TARP funds.

25
banks with lower equity capital ratios going into the crisis are more likely to receive TARP
funding. Additionally, larger boards and more independent boards are associated with increases
in the likelihood of receiving TARP funds. Financial expertise is never significant in explaining
the probability of receiving TARP funds. These results suggest that TARP-related effects are not
driving our main results.
IV. Robustness
In this section, we provide a series of robustness tests for our main findings. Our
robustness results are shown in Table VIII and Table IX. In these tables, we only present the
variables associated with independence and financial expertise for brevity since the control
variables used are the same as those presented throughout the paper.
IV.A All financial institutions
Our discussion has focused so far on commercial banks. In this section, we expand our
results on independence and financial expertise to the full sample of financial institutions that
includes all publicly-traded commercial banks, savings and loan associations (S&Ls) and
investment banks. The latter group has been at the center of the crisis and has potentially
received the most attention from regulators, the media and researchers. In this extended sample,
commercial banks still comprise 75% of all banks with S&Ls make up 23% and investment
banks 2%.
[Insert Table VIII here]

26
Selected regression results for the sample of all financial institutions are shown in Panel
A and B of Table VIII. The results show that financial expertise among independent directors is
associated with worse performance during the crisis across all financial institutions (Panel A),
which is consistent with our earlier results on commercial banks. As in the main section of our
study, the results are stronger for the subset of large financial institutions. For the risk
regressions (Panel B), the results show that the pre-crisis market-based measure of risk taking
were not significantly higher for large financial institutions that had more financial expertise
among their independent directors. Overall, we can conclude that our main performance results
extend to the broader sample of financial institutions that include commercial banks, S&Ls and
investment banks.
IV.B Excluding the five largest U.S. banks
Our main sample is comprised of all commercial banks with at least one billion dollars in
total assets. As previously noted, there is still considerable heterogeneity in bank size among
this sample. We have dealt with this heterogeneity parametrically by including linear and non-
linear size controls in our regressions and non-parametrically using the propensity score
matching approach. These approaches may still not capture unobserved differences between
smaller commercial banks and the likes of Citigroup, Bank of America or JP Morgan Chase.
The largest commercial banks differ in terms of risk taking behavior, market exposure and
systemic risk. It is thus important to test the robustness of our results to the exclusion of this set
of banks. Specifically, we exclude Citigroup, Bank of America, JP Morgan Chase, Wachovia,
and Wells Fargo.
27
We rerun our main tests on banks excluding the largest by total assets at year end 2006
with the results shown in Panel C and D of Table VIII. Results in Panel C show that financial
expertise among independent directors is associated with worse performance during the crisis,
and the association is stronger for the subset of the large banks. In this case, the set of large
banks is comprised of banks above the median total assets at fiscal year-end 2006, excluding the
five largest banks. For the risk regressions (Panel D), the results show that the pre-crisis market-
based measure of risk taking was significantly higher for large banks that had more financial
expertise among their independent directors, consistent again with our sample of all commercial
banks. Overall, we can conclude that our main results extend to the sample of commercial banks
that excludes the largest publicly-traded banks.
IV.C Other measures of financial expertise and independence
In this section, we investigate the impact of using other definitions of independence and
financial expertise. Thus far, the definitions of independence are taken from those issued by the
exchanges which are in accordance with federal mandates issued through Sarbanes-Oxley. We
also follow the definition of financial expertise used in the existing literature.
Table IX gives the results for the main set of regressions when examining alternate
definitions of both independence and financial expertise. Our alternate measure of board
independence in Panel A, called %Truly Indep, takes into consideration outside relationships
between the current CEO and independent directors. Using the BoardEx database, we identify
independent directors who have a prior or existing relationship with the CEO beyond that of
being on the same board. These external ties might include social (e.g. charities), educational or
other business relationship. An independent director is considered “truly independent” if he/she
28
has no relationship with the President/CEO other than being currently on the same bank board
(see Fracassi and Tate (2010) for a similar construct). As a consequence, our financial expertise
measure is also modified and becomes the percentage of “truly independent financial experts”
computed from the pool of truly independent directors. In terms of financial expertise, we re-
compute all of our main specifications using a stricter definition by considering independent
directors to be experts only if they have held or currently hold executive positions within
financial institutions (SIC codes 6000-6999). Results are shown in Panel B of Table IX.
[Insert Table IX here]
Since all of our main results are driven by the large banks, we concentrate on this subset
in this section. In Panel A, the “truly independent” measure of independence yields qualitatively
similar results to our base measure of independence. Large banks with more independent boards
did not perform any worse than other banks while those with more financial expertise among
independent directors performed worse during the crisis. Banks with more “truly independent”
boards took on less risk leading up to the crisis while banks with more financial expertise among
truly independent directors took on more risk using the alternative measure.
Finally, in Panel B of Table IX we use the more restrictive definition of financial
expertise where we define an independent director as a financial expert only if they held or is
currently holding an executive position within a financial institution (SIC code 6000-6999).
With this definition, we see that the crisis results hold, in particular with the augmented set of
controls. Furthermore, the total risk results are more significant when financial expertise is
defined in this manner. The Tier-1 capital ratios results are, however, no longer statistically

29
significant. Overall, the main results of the effect of independence and financial expertise among
independent directors is robust across several alternative definitions of these variables.
IV.D Other measures of risk
There are many activities that a bank can undertake to increase its risk profile in the run-
up to the crisis. We have shown that higher levels of financial expertise among independent
directors were associated with lower Tier-1 capital and with higher levels of real estate exposure.
We examine several other measures of bank activities, such as the amount of non-deposit short-
term financing, and the exposure to on- and off-balance sheet asset backed securities related
activities. In these regressions (not shown for brevity), the levels of independence and financial
expertise are not significantly associated with these variables.
V. Conclusion
In the aftermath of the 2007-2008 financial crisis, banks and other financial institutions
were accused of engaging in excessive risk taking. The composition of the board of directors
should be a reliable proxy of how well the board can process information provided by insiders
and advise as well as monitor the bank’s risk taking practices in the best interests of its
shareholders. This paper examines how the presence of financial experts among independent
directors relates to risk taking and performance of commercial bank holding companies during
the period from 2003 to 2008, which includes the 2007-2008 financial crisis.
We document that the level of financial expertise among independent directors is
positively related to risk taking at the onset of the financial crisis using both market-based and

30
balance sheet-based risk measures. These results are primarily driven by large banks in our
sample.
We show that, as a consequence of the heightened risk profile, stock performance was
worse during the crisis for large banks with more independent financial expertise. Additionally,
there is weak evidence that the higher risk taking of banks with more independent financial
expertise is related to better stock performance in the period leading up to the crisis. Our results
are robust to alternative measures of independence and financial expertise as well as including
S&Ls and investment banks in the sample and excluding the largest U.S. banks from our sample.
The Bank of International Settlements (BIS), in their 2006 report “Enhancing Corporate
Governance for Banking Organisations,” stressed that banks should have independent directors
and that these directors should have sufficient knowledge of the main financial activities of the
bank to “enable effective governance and oversight.” Overall, our results challenge the
regulators’ view that more financial expertise on the boards of banks would unambiguously
lower their risk profile. In particular, the presence of financial experts among independent
directors is related to more risk taking in the run-up to the crisis. This positive association with
risk-taking was not penalized by the markets prior to the crisis but was penalized by the market
when the crisis hit. For the large banks, more financial experts among independent directors led
to significant underperformance. We do not find evidence for a reverse causality channel
explanation of our results, whereby a powerful CEO would choose a higher risk profile and
select independent financial experts to rubber stamp his/her strategy.
Our results could be explained by the fact that independent financial experts, with a
fiduciary duty to shareholders, understand the residual nature of the equity claims and will
generally favor more risk taking. Another plausible explanation could be that external financial

31
experts are more willing to let their bank participate in more risk-taking activities due to their
familiarity and understanding of complex financial instruments. Both explanations are important
considerations for policy makers as they examine governance reforms of the financial sector.
32
References
Acharya, V., T. Cooley, M. Richardson, and I. Walter, 2010, Regulating Wall Street: The Dodd-Frank Act and the New Architecture of Global Finance, New York University Stern School of Business, John Wiley and Sons.
Adams, R., 2009, Governance and the financial crisis, unpublished working paper, University of
Queensland, Brisbane, Australia. Adams, R., B. Hermalin, and M. Weisbach, 2010, The Role of Boards of Directors in Corporate
Governance: A Conceptual Framework & Survey, Journal of Economic Literature 48, 58-107.
Adams, R. and H. Mehran, 2003, Is corporate governance different for bank holding companies?,
Economic Policy Review 9, 123-142. Adams, R. and H. Mehran, 2008, Corporate Performance, Board Structure, and Their
Determinants in the Banking Industry, Federal Reserve Bank of New York Staff Reports, no. 330.
Adams, R. and H. Mehran, 2012, Bank board structure and performance: Evidence for large
bank holding companies, Journal of Financial Intermediation 21, 243-267. Aebi, V., G. Sabato, M. Schmid, 2011, Risk Management, Corporate Governance, and Bank
Performance in the Financial Crisis, Journal of Banking and Finance, forthcoming. Aggarwal, R., I. Erel, R. Stulz, and R. Williamson, 2009, Differences in Governance Practices
between U.S. and Foreign Firms: Measurement, Causes, and Consequences, Review of Financial Studies 22, 3171-3209.
Bebchuk, L., A. Cohen, and H. Spamann, 2010, The Wages of Failure: Executive Compensation
at Bear Stearns and Lehman 2000-2008, Yale Journal on Regulation 27, 257-282. Bebchuk, L. A. and H. Spamann, 2010, Regulating Bankers' Pay, Georgetown Law Journal 98,
247-287. Beltratti, A. and R. M. Stulz, 2010, The credit crisis around the globe: Why did some banks
perform better?, unpublished working Paper, Dice Center WP 2010-05, The Ohio State University.
Cheng, S., 2008, Board size and the variability of corporate performance, Journal of Financial
Economics 87, 157-176. Coles, J., N. Daniel, and L. Naveen, 2008, Boards: Does One Size Fit All?, Journal of Financial
Economics 87, 329–356.

33
Cornett, M.M., J.J. McNutt, and H. Tehranian, 2010, The financial crisis, internal corporate governance, and the performance of publicly-traded U.S. bank holding companies, unpublished working paper, Boston College.
Dahya, J., McConnell, J., and N. Travlos, 2002, The Cadbury Committee, corporate performance
and top management turnover, Journal of Finance 57, 461-483. Drucker, S. and M. Puri, 2005, On the Benefits of Concurrent Lending and Underwriting,
Journal of Finance 60, 2763-2799. Erkens, D., M. Hung, and P. Matos, 2009, Corporate Governance in the Recent Financial Crisis:
Evidence from Financial Institutions Worldwide, unpublished working paper, Marshall School of Business, USC.
Ellul, A. and V. Yerramilli, 2010, Stronger Risk Controls, Lower Risk: Evidence from U.S. Bank
Holding Companies, unpublished working paper, Kelley School of Business, Indiana University.
Fahlenbrach, R., B. Minton, and C. Pan, 2011, Former CEO Directors: Lingering CEOs or Valuable Resources?, Review of Financial Studies 24, 3486-3518. Fahlenbrach, R. and R. M. Stulz, 2011, Bank CEO Incentives and the credit crisis, Journal of
Financial Economics 99, 11-26. Ferreira, D., T. Kirchmaier, and D. Metzger, 2010, Boards of Banks, Finance Working Paper N°.
289/2010, ECGI. Fernandes, N. and E. Fich, 2009, Does Financial Experience Help Banks during Credit Crises?,
unpublished working paper, IMD-Lausanne, Switzerland. Fich, E. and A. Shivdasani, 2006, Are Busy Boards Effective Monitors?, Journal of Finance 61, 689-724. Fracassi, C. and G. Tate, 2010, External Networking and Internal Firm Governance, unpublished
working paper, UCLA. Guerrera, F. and P. Thal-Larsen, 2008, Gone by the Board: Why the directors of big banks failed
to spot credit risks, Financial Times, June 26th. Güner, A.B., Malmendier. U., and G. Tate, 2008, Financial expertise of directors, Journal of
Financial Economics 88, 323-354. Harris, M. and A. Raviv, 2008, A Theory of Board Control and Size. Review of Financial Studies
21, 1797-832.
34
Hashagen, J., N. Harman, and M. Conover, 2009, Never again? Risk management in banking beyond the credit crisis. KPMG International.
Hermalin, B., and M. Weisbach, 1998, Endogenously chosen boards of directors and their
monitoring of the CEO, American Economic Review 88, 96-118. Keeley, M., 1990, Deposit Insurance, Risk, and Market Power in Banking, American Economic
Review 80, 1183-200. Kirkpatrick, G., 2009, The corporate governance lessons from the financial crisis, report, OECD,
Paris, France.
Landier, Augustin, David Sraer, and David Thesmar, 2007, Bottom-Up Corporate Governance, unpublished working paper, HEC Paris.
Linck, J., J. Netter, and T. Yang, 2008, The Determinants of Board Structure, Journal of
Financial Economics 87, 308-328. Marcus, A. 1984, Deregulation and Bank Financial Policy, Journal of Banking and Finance 8,
557-565. Merton, R. C., 1977, An Analytic Derivation of the Cost of Deposit Insurance and Loan
Guarantees, Journal of Banking and Finance 1, 3-11. Pathan, S., 2009, Strong boards, CEO power and bank risk-taking, Journal of Banking and
Finance 33, 1340-1350. Strebel, R., 2009, Time to bring real shareholders back on board, Financial Times, February 12th. Walker, D., 2009, A Review of Corporate Governance in UK banks and other Financial Industry
Entities: Final Recommendations. http://www.hmtreasury.gov.uk/walker_review_information.htm.
35
Table I: Summary statistics
This table shows summary statistics for board governance and other bank characteristics for our sample ofU.S. publicly-traded bank holding companies with total assets greater than $1 billion from 2003 to 2008. Panel A presents yearly statistics on key board governance dimensions. Board size is the number of directorson the board. %independent is the percent of directors that are not employed or affiliated with the firm. These two variables are computed using the Boardex database. % fin expert among independent directors is the percent of independent directors who are financial experts. Similar to Güner et al. (2008), an independent director is classified as a financial expert if he or she (i) has held an executive position at a banking institution (Former bank executive), (ii) holds an executive position at a non-bank financial institution (Exec. Of non-bank financials), (iii) holds a finance-related position (e.g. chief financial officer (CFO), accountant, treasurer,VP finance) of a non-financial firm (Finance exec. of non-financials), (iv) holds an academic position in a related field (e.g. Professor of finance, economics or accounting), or (v) works as a hedge fund or private equity fund manager, or venture capitalist (Professional investor). The data on financial expertise of each director were provided by a combination of Boardex data and hand-collected data from annual proxy statements. Panel B presents the correlation matrix between our board characteristics and several other bankcharacteristics. Log(assets) is the natural logarithm of total book assets. Equity capital ratio is defined as totalbook equity divided by total assets. We also computed dummy variables for institutions that disclose having arisk management committee (Has Risk Comm.) or chief risk officer (CRO) in annual 10-K filings or proxy statements during the sample period. These data were compiled by hand-collecting all the information on CRO and other similarly-defined risk management executive positions and (non-ALM) risk committees within a financial institution, as disclosed by the firm’s 10-K and DEF 14-A (proxy statement) each year.
Panel A: Yearly summary statistics (mean) on board characteristics
Year Number of obs.
%Fin. expert. among
independent directors Board size %Independent
2003 182 20% 13.3 73%
2004 200 22% 13.1 76%
2005 206 23% 12.6 77%
2006 203 24% 12.6 77%
2007 196 25% 12.5 77%
2008 119 26% 12.4 78%

36
Panel B: Correlation matrix among board and risk governance and bank characteristics
Log(Asset)
Equity capital ratio
CRO
Risk committee
Board size
%Independent directors
Log(Asset) 1.00
Equity capital ratio 0.11 1.00
CRO 0.36 0.05 1.00
Risk committee 0.42 0.01 0.35 1.00
Board size 0.35 0.21 0.06 0.09 1.00
%Independent directors 0.14 -0.04 0.16 0.16 -0.04 1.00
%Fin expert among indep. directors -0.13 -0.07 0.05 0.02 -0.13 0.01

37
Table II: Total risk and financial expertise This table presents results for OLS panel regressions of market-based measures of risk-taking activities on firm and board characteristics. Total risk is the average annual standard deviation of daily stock returns over the 2004-2006 period. All independent variables are defined in Table I and are measured at year-end 2003. A bank is defined as large for a given year if the book value of its total assets is greater than the median total asset number for the sample of commercial bank during that year. The standard deviation of the error term is estimated using clustering at the firm level. Standard errors are given in brackets. ***, ** and * denote respectively significance at the 1%, 5% and 10% levels.
All banks Large Banks
(1) (2) (1) (2)
Log(assets) -0.713*** -0.685*** -0.843*** -0.853***
[0.183] [0.179] [0.288] [0.279]
Log(assets)2 0.028*** 0.027*** 0.034** 0.036***
[0.009] [0.009] [0.014] [0.013]
Equity capital ratio 0.017 0.521 0.384 1.109
[1.642] [1.679] [1.814] [1.802]
Board Size -0.016*** -0.014*** -0.014** -0.013**
[0.005] [0.005] [0.005] [0.005]
Has CRO 0.084 0.074 0.087 0.065
[0.067] [0.064] [0.079] [0.074]
Has Risk Comm. 0.002 -0.014 0.008 -0.010
[0.045] [0.047] [0.054] [0.055]
%Independent -0.001 -0.034 -0.201 -0.295
[0.222] [0.226] [0.227] [0.228] %Fin expert among independent directors
0.237* 0.378**
[0.136] [0.148]
Observations 96 96 76 76
Adjusted R-squared 0.541 0.550 0.462 0.494

38
Table III: Balance sheet risk and financial expertise in 2006 This table presents results for cross-sectional OLS regressions in 2006 for Tier 1 capital ratios (Panel A) and real estate exposure (Panel B) on firm and board characteristics. Real estate loans are computed as all loans secured by real estate relative to total assets. Data on real estate loans and Tier-1 capital ratios are from the FED FRY-9C Call Report forms filed by Bank Holding Companies (BHCs). Net interest margin is a measure of bank profitability used as a control for the Tier 1 capital ratio regressions. All other board and risk monitoring variables are defined in Table I. All independent variables are measured at year-end 2005. A bank is defined as large if the book value of total assets is greater than the median total asset number for the sample of commercial banks at year-end 2005. Robust standard errors corrected for heteroskedasticity are reported in brackets. ***, ** and * denote respectively significance at the 1%, 5% and 10% levels.
Panel A: Tier-1 risk-weighted capital ratio All banks Large banks
(1) (2) (1) (2)
Log(assets) 0.009 0.009 -0.010 -0.012
[0.009] [0.010] [0.014] [0.014]
Log(assets)2 -0.001 -0.001 0.000 0.000
[0.000] [0.000] [0.001] [0.001]
Net interest margin -0.005* -0.005* -0.006* -0.007*
[0.003] [0.003] [0.003] [0.003]
Board Size 0.000 0.000 -0.000 -0.000
[0.000] [0.000] [0.001] [0.001]
Has CRO 0.002 0.003 0.004 0.005
[0.004] [0.004] [0.004] [0.005]
Has Risk Comm. -0.006 -0.005 -0.007 -0.007
[0.004] [0.004] [0.005] [0.005]
%Independent -0.022 -0.023 -0.001 0.000
[0.018] [0.018] [0.017] [0.016]
%Fin expert among independent
-0.013 -0.019**
[0.009] [0.008]
Observations 193 193 106 106
Adjusted R-squared 0.133 0.141 0.190 0.227

39
Panel B: Real estate loans All banks Large banks
(1) (2) (1) (2)
Log(assets) -0.083 -0.084 -0.191 -0.198 [0.074] [0.075] [0.178] [0.181]
Log(assets)2 0.002 0.002 0.007 0.008 [0.004] [0.004] [0.008] [0.008]
Has a long-term credit rating
-0.035 -0.033
-0.008 -0.001
[0.043] [0.043] [0.054] [0.055] Board Size 0.002 0.002 0.003 0.003
[0.003] [0.003] [0.004] [0.004] Has CRO 0.013 0.011 0.003 -0.002
[0.029] [0.029] [0.038] [0.039] Has Risk Comm. 0.022 0.021 0.033 0.033
[0.030] [0.031] [0.037] [0.037] %Independent -0.111 -0.109 -0.235 -0.245
[0.099] [0.099] [0.152] [0.150] %Fin expert among independent
0.039
0.079
[0.062] [0.089]
Observations 193 193 106 106
Adjusted R-squared 0.166 0.163 0.140 0.140

40
Table IV. Propensity Score Matching Analyses This table presents results for propensity-score matching analyses for total risk (Panel A), Tier 1 risk-weighted capital ratios (Panel B), and real estate loans (Panel C). A bank is considered part of the treatment group if it has at least one independent financial expert on its board. Total risk is the average annual standard deviation of daily stock returns over the 2004-2006 period. Real estate loans are computed as all loans secured by real estate relative to total assets. Data on real estate loans and Tier-1 capital ratios are from the FED FRY-9C Call Report forms filed by Bank Holding Companies (BHCs). A bank is defined as large if the book value of total assets is greater than the median total asset number for the sample of commercial banks at year-end 2005. ***, ** and * denote respectively significance at the 1%, 5% and 10% levels. Panel A: Total Risk
All banks Large banks
Bank with at least one independent financial expert
1.365 1.302
Control group 1.217 1.203
Difference 0.147** 0.099
T-stat 2.312 1.502 Panel B: Tier 1 risk-weighted capital ratio
All banks Large banks
Bank with at least one independent financial expert
0.109 0.107
Control group 0.114 0.115
Difference -0.005 -0.008*
T-stat -1.167 -1.647 Panel C: Real estate loans
All banks Large banks
Bank with at least one independent financial expert
0.503 0.459
Control group 0.447 0.400
Difference 0.055*** 0.059*
T-stat 2.106 1.78

41
Table V: Stock performance during the crisis This table presents results for OLS regressions of firm stock performance on firm and board characteristics and risk monitoring functions. Panel A reports the results for all banks. Panel B reports the results for large banks. A bank is defined as large if its book value of total assets is greater than that of the median firm in the sample for 2006. Stock performance is measured as the nominal cumulative stock return from January 2007 to December 2008. Log(assets) is the natural logarithm of total book assets. Equity capital ratio is defined as total book equity divided by total assets. Beta is computed as the market beta estimated from a market model in which the daily stock returns are explained by the value-weighted market return and the return on the three-month Treasury bill. Stock ret 2006 is the nominal cumulative stock return over 2006. All board and risk monitoring variables are defined in Table I. Data on loans, deposits, real estate loans, and mortgage-backed securities are from the FED FRY-9C Call Report forms filed by Bank Holding Companies (BHCs). Real estate loans are computed as all loans secured by real estate relative to total assets. MBS are mortgage-backed securities held-to-maturity, available-for-sale and held for trading relative to total assets. Short-term financing is non-deposit short-term financing to total asset. Off-Balance sheet activities is the off balance sheet securitized assets (home equity, credit card, auto loans, etc.) to total assets. All variables are taken as of the fiscal year end 2006. Robust standard errors corrected for heteroskedasticity are reported in brackets. ***, ** and * denote respectively significance at the 1%, 5% and 10% levels.

42
Panel A: All banks
(1) (2) (3) (4)
Log(assets) 0.256 0.271 0.169 0.191
[0.181] [0.182] [0.182] [0.187]
Log(assets)2 -0.014 -0.015 -0.012 -0.013
[0.009] [0.009] [0.010] [0.010]
Equity capital ratio -1.433 -1.574 -0.052 -0.213
[1.092] [1.078] [1.044] [1.056]
Beta 0.153*** 0.153*** 0.142*** 0.142***
[0.040] [0.039] [0.035] [0.035]
Stock ret 2006 -0.074 -0.031 -0.033 -0.006
[0.172] [0.170] [0.143] [0.142]
Board Size 0.011 0.010 0.007 0.007
[0.008] [0.008] [0.007] [0.007]
Has CRO 0.089 0.100* 0.106* 0.112**
[0.058] [0.058] [0.055] [0.056]
Has Risk Comm. -0.059 -0.055 -0.042 -0.041
[0.083] [0.081] [0.078] [0.077]
Total loans -0.088 -0.027
[0.415] [0.422]
Deposits 0.436 0.369
[0.537] [0.537]
Real estate loans -0.849*** -0.885***
[0.256] [0.263]
MBS 0.479 0.431
[0.403] [0.408]
Short-term financing 0.800 0.784
[0.840] [0.847]
Off-balance sheet 0.480 0.509
[0.493] [0.487]
% Independent directors -0.487** -0.496** -0.510** -0.527**
[0.237] [0.234] [0.228] [0.226]
%Fin expert among -0.228* -0.155
independent directors [0.134] [0.132]
Observations 198 198 198 198
Adjusted R-squared 0.066 0.076 0.229 0.232

43
Panel B: Large banks
(1) (2) (3) (4)
Log(assets) 0.592 0.629 0.400 0.506
[0.413] [0.424] [0.372] [0.381]
Log(assets)2 -0.029 -0.031 -0.023 -0.029
[0.019] [0.020] [0.018] [0.018]
Equity capital ratio -0.871 -1.521 0.739 0.019
[1.514] [1.516] [1.510] [1.475]
Beta 0.235* 0.227* 0.181 0.182
[0.131] [0.135] [0.112] [0.113]
Stock ret 2006 0.033 0.086 0.106 0.132
[0.311] [0.317] [0.290] [0.286]
Board Size 0.006 0.009 0.005 0.007
[0.013] [0.013] [0.012] [0.011]
Has CRO 0.090 0.120* 0.071 0.092
[0.075] [0.071] [0.072] [0.068]
Has Risk Comm. -0.122 -0.131 -0.078 -0.094
[0.084] [0.080] [0.076] [0.074]
Total loans 0.054 0.173
[0.625] [0.621]
Deposits -0.129 -0.280
[0.724] [0.658]
Real estate loans -1.244** -1.294***
[0.498] [0.469]
MBS 0.443 0.329
[0.528] [0.571]
Short-term financing -0.559 -0.784
[1.049] [1.023]
Off-balance sheet 0.423 0.565
[0.518] [0.504]
% Independent directors -0.625* -0.521 -0.753** -0.731**
[0.331] [0.321] [0.326] [0.316]
%Fin expert among -0.593*** -0.503***
independent directors [0.186] [0.175]
Observations 101 101 101 101
Adjusted R-squared 0.033 0.116 0.217 0.274

44
Table VI: Stock performance over the pre-crisis period This table presents results for OLS regressions of firm stock performance over the pre-crisis period on firm and board characteristics and corresponding propensity-score matching analysis. Panel A and B report the results for all banks. Panel C and D report the results for large banks. A bank is defined as large if its book value of total assets is greater than the median total asset number for the sample of commercial banks for 2003. Stock performance is measured as the nominal cumulative stock return from January 2003 to December 2006. Log(assets) is the natural logarithm of total book assets. Equity capital ratio is defined as total book equity divided by total assets. Beta is computed as the market beta estimated from a market model in which the daily stock returns are explained by the value-weighted market return and the return on the three-month Treasury bill. All board and risk monitoring variables are defined in Table I. All variables are taken as of the fiscal year-end 2003. Robust standard errors corrected for heteroskedasticity are reported in brackets. ***, ** and * denote respectively significance at the 1%, 5% and 10% levels.

45
Panel A: All banks
(1) (2) (3) (4)
Log(Assets) -1.073* -0.973* -0.775 -0.666
[0.553] [0.548] [0.518] [0.515]
Log(Assets) squared 0.052* 0.049* 0.039 0.035
[0.026] [0.026] [0.025] [0.025]
Book equity 0.315 1.504 -2.242 -0.965
[2.038] [2.041] [2.984] [2.919]
Beta 0.066 -0.054 0.028 -0.106
[0.221] [0.222] [0.269] [0.265]
Board Size -0.008 -0.006 -0.004 -0.002
[0.012] [0.012] [0.012] [0.012]
Has CRO -0.092 -0.105 -0.050 -0.056
[0.098] [0.097] [0.120] [0.112]
Has Risk Comm. -0.111 -0.157* -0.170 -0.215*
[0.081] [0.093] [0.105] [0.117]
Total loans -0.452 -0.494
[0.624] [0.646]
Total deposits 0.198 0.383
[0.894] [0.758]
Real estate loans 0.135 0.061
[0.551] [0.559]
Mortgage-backed securities -0.965* -1.071*
[0.558] [0.557]
Short-term financing -1.982 -1.860*
[1.236] [1.091]
Off-balance sheet commitments -0.442 -0.535
[0.444] [0.466]
%independent directors 0.058 -0.050 0.142 0.003
[0.272] [0.282] [0.292] [0.313]
%Fin expert among 0.644** 0.714**
independent directors [0.280] [0.307]
Observations 100 100 100 100
Adjusted R-squared 0.034 0.066 0.042 0.085

46
Panel B: Large banks
(1) (2) (3) (4)
Log(Assets) -0.727* -0.730* -0.486 -0.483
[0.404] [0.415] [0.405] [0.410]
Log(Assets) squared 0.036* 0.037* 0.026 0.026
[0.019] [0.020] [0.019] [0.019]
Book equity 1.789 2.210 1.425 1.879
[2.327] [2.383] [2.195] [2.313]
Beta 0.185 0.142 0.218 0.146
[0.184] [0.191] [0.185] [0.192]
Board Size -0.004 -0.004 -0.003 -0.003
[0.009] [0.009] [0.009] [0.009]
Has CRO -0.063 -0.072 -0.017 -0.032
[0.095] [0.096] [0.106] [0.106]
Has Risk Comm. -0.063 -0.077 -0.063 -0.083
[0.079] [0.082] [0.093] [0.098]
Total loans -0.866* -0.896*
[0.474] [0.476]
Total deposits 0.853 0.796
[0.573] [0.551]
Real estate loans 0.418 0.368
[0.458] [0.459]
Mortgage-backed securities -0.666 -0.691*
[0.412] [0.413]
Short-term financing -0.091 -0.225
[0.896] [0.913]
Off-balance sheet commitments -0.395 -0.429
[0.425] [0.424]
%independent directors -0.158 -0.221 -0.143 -0.216
[0.179] [0.183] [0.192] [0.196]
%Fin expert among 0.256 0.317
independent directors [0.220] [0.245]
Observations 80 80 80 80
Adjusted R-squared -0.008 -0.008 0.013 0.02
Table VII: Stock performance during the crisis and CEO power This table presents OLS regression coefficients of firm stock performance during the crisis on firm and board characteristics for a sample of large banks. A bank is defined as large if its book value of total assets is greater than the median total asset number for the sample of banks in 2006. Stock performance is measured as the nominal cumulative stock return from January 2007 to December 2008. Log(assets) is the natural logarithm of total book assets. Equity capital ratio is defined as total book equity divided by total assets. Beta is computed as the market beta estimated from a market model in which the stock returns are explained by the value-weighted market return and the return on the three-month Treasury bill. Stock ret 2006 is the nominal cumulative stock return over 2006. All board and risk monitoring variables are defined in Table I. Data on loans, deposits, real estate loans, and mortgage backed securities are from the FED FRY-9C Call Report forms filed by Bank Holding Companies (BHCs). Real estate loans are computed as all loans secured by real estate relative to total assets. MBS are mortgage-backed securities held-to-maturity, available-for-sale, and held for trading relative to total assets Short-term financing is non-deposit short-term financing to total asset. Off-Balance sheet activities is the off balance sheet securitized assets (home equity, credit card, auto loans, etc.) to total assets. In regression (1) the proxy for CEO power is an indicator variable equal to one if the CEO is also the Chairman of the Board and zero otherwise. In regression (2) the proxy for CEO power is the percentage of board members whose tenure on the board exceeds that of the current CEO so the indicator variable is equal to one if the bank falls below the median on this measure of relative CEO tenure. In regression (3) the proxy for CEO power is the percentage of independent directors with greater tenure and the indicator variable we derive from this measure takes the value of one for all firms below the median of the commercial bank sample. In regression (4) the proxy for CEO power is the percentage of independent financial experts whose tenure exceeds that of the CEO and we also derive a CEO strength variable from it that takes the value of one for all banks that fall below the median value on that dimension. All variables are taken as of the fiscal year end 2006. Robust standard errors corrected for heteroskedasticity are reported in brackets. ***, ** and * denote respectively significance at the 1%, 5% and 10% levels.

48
(1) (2) (3) (4)
Log(assets) 0.541 0.563 0.611 0.530
[0.390] [0.382] [0.382] [0.386]
Log(assets)2 -0.032* -0.032* -0.034* -0.031*
[0.019] [0.018] [0.018] [0.018]
Equity capital ratio -0.114 0.006 -0.031 -0.046
[1.491] [1.441] [1.430] [1.445]
Beta 0.159 0.177 0.178 0.162
[0.120] [0.117] [0.118] [0.124]
Stock ret 2006 0.148 0.191 0.199 0.212
[0.273] [0.293] [0.291] [0.303]
Board Size 0.006 0.007 0.006 0.006
[0.011] [0.011] [0.011] [0.011]
Has CRO 0.084 0.100 0.093 0.106
[0.073] [0.069] [0.070] [0.072]
Has Risk Comm. -0.095 -0.128 -0.134* -0.116
[0.077] [0.080] [0.078] [0.076]
Total loans 0.042 0.061 0.053 0.029
[0.592] [0.620] [0.615] [0.656]
Deposits -0.596 -0.450 -0.483 -0.418
[0.693] [0.679] [0.676] [0.685]
Real estate loans -1.333*** -1.233** -1.215** -1.242**
[0.481] [0.476] [0.477] [0.473]
MBS 0.399 0.516 0.516 0.480
[0.541] [0.612] [0.592] [0.612]
Short-term financing -1.603 -1.268 -1.356 -1.269
[1.038] [1.072] [1.072] [1.164]
Off-balance sheet 0.648 0.604 0.602 0.627
[0.510] [0.489] [0.476] [0.521]
% Independent directors -0.799** -0.798** -0.751** -0.809**
[0.319] [0.337] [0.344] [0.330]
%Fin expert among -0.202 -0.672** -0.790** -0.574*
independent directors [0.336] [0.309] [0.327] [0.335]
CEO power proxy 0.190 -0.051 -0.089 -0.017
[0.123] [0.111] [0.105] [0.129]
CEO power proxy * %Fin exp -0.480 0.254 0.423 0.106
[0.389] [0.362] [0.363] [0.446]
Observations 98 98 98 98
Adjusted R-squared 0.286 0.267 0.274 0.263

Table VIII: Sample-related robustness tests Each panel of this table replicates the performance in crisis regressions (Table IV) and the market-based measures of risk taking in the run-up to the crisis (Table II) on the extended sample of all publicly-traded commercial banks, savings and loan associations (S&Ls) and investment banks in Panel A and B and the sample of publicly-traded commercial banks, excluding the five largest commercial banks (Citigroup, Bank of America, JP Morgan Chase, Wachovia, and Wells Fargo) in Panel C and D. A bank-type indicator variable is added to each specification of Panel A and B. Robust standard errors corrected for heteroskedasticity are reported in brackets. ***, ** and * denote respectively significance at the 1%, 5% and 10% levels.
Panel A: Crisis results on broader set of financial institutions – Performance
All Financial Institutions Large Financial Institutions
Controls Yes Yes % fin experts among independent directors
-0.227* -0.443***
[0.119] [0.165]
Observations 272 137
Adjusted R-squared 0.071 0.117 Panel B: Pre-crisis results on broader set of financial institutions - Total risk
All financial Institutions Large Financial Institutions
Controls Yes Yes % fin experts among independent directors
0.198 0.260
[0.138] [0.160]
Observations 131 105
Adjusted R-squared 0.507 0.433 Panel C: Crisis results on commercial banks excluding largest banks – Performance
All Banks Large Banks
Controls Yes Yes % fin experts among independent directors
-0.242* -0.610 ***
[0.135] [0.187]
Observations 194 99
Adjusted R-squared 0.083 0.141 Panel D: Pre-crisis results on commercial banks excluding largest banks - Total risk
All Banks Large Banks
Controls Yes Yes % fin experts among independent directors
0.202 0.327**
[0.143] [0.147]
Observations 92 74
Adjusted R-squared 0.520 0.510

50
Table IX: Robustness of board characteristics definitions Each panel of this table replicates the performance in crisis regressions (Table IV) and the market-based and balance sheet-based measures of risk taking in the run-up to the crisis (Table II and III) for the sample of large banks using alternate definitions for board independence and financial expertise. In Panel A, we use a more restrictive definition of independence. Among the declared independent board members, we compute the percentage of independent directors on the board who do not have any present or past social or economic ties with the current CEOs beyond being on the same bank board. This variable is computed using Boardex database and matching up a given director with the current CEO against all education-related, charity-related and business-related institutions. In Panel B, we use a more restrictive definition of financial expertise relative to Güner et al. (2008). Specifically, an independent director is defined as a financial expert only if he has been or currently is an executive within the financial industry (SIC code between 6000 and 6999). Robust standard errors corrected for heteroskedasticity are reported in brackets. ***, ** and * denote respectively significance at the 1%, 5% and 10% levels.
Panel A: More restrictive definition of independence
Crisis regressions: Large banks
Base controls Augmented set of controls
(1) (2) (1) (2)
%truly independent directors -0.081 -0.030 -0.068 -0.032
[0.139] [0.135] [0.132] [0.132] % fin experts among truly independent directors
-0.412***
-0.352**
[0.147] [0.141]
Observations 101 101 101 101
Adjusted R-squared 0.004 0.067 0.175 0.220
Total risk in pre-crisis: Large banks
(1) (2)
Controls Yes Yes
% truly independent directors -0.171 -0.241**
[0.106] [0.108] % fin experts among truly independent directors
0.268**
[0.112]
Observations 76 76
Adjusted R-squared 0.475 0.493 Balance sheet Tier 1 risk-weighted capital ratio: Large banks
(1) (2)
Controls Yes Yes
%truly independent directors -0.014** -0.013*
[0.007] [0.007] % fin experts among truly independent directors -0.007
[0.007]
Observations 106 106
Adjusted R-squared 0.227 0.225

51
Panel B: More restrictive definition of financial expertise
Crisis regressions: Large banks
Base controls Augmented set of controls
(1) (2) (1) (2)
%independent directors -0.625* -0.551 -0.753** -0.739**
[0.331] [0.342] [0.326] [0.331] %fin experts among independent directors -0.459** -0.417**
[0.233] [0.185]
Observations 101 101 101 101
Adjusted R-squared 0.033 0.061 0.217 0.239
Total risk in pre-crisis: Large banks
(1) (2)
Controls Yes Yes
%independent directors -0.201 -0.318
[0.227] [0.227] %fin experts among independent directors 0.575**
[0.221]
Observations 76 76
Adjusted R-squared 0.462 0.510
Balance sheet Tier 1 risk-weighted capital ratio: Large banks
(1) (2)
Controls Yes Yes
% independent directors -0.001 -0.000
[0.017] [0.017] %fin experts among independent directors -0.014
[0.010]
Observations 106 106
Adjusted R-squared 0.190 0.195

52
Figure 1: Composition of financial expertise This figure provides the average composition of financial expertise among independent directors of the board for publicly traded bank holding companies with total assets greater than $1Bn over the period 2003-2008. Similar to Güner et al. (2008), an independent director is classified as a financial expert if he or she (i) has held an executive position at a banking institution (Former bank executive), (ii) holds an executive position at a non-bank financial institution (Exec. Of non-bank financials), (iii) holds a finance-related position (e.g. chief financial officer (CFO), accountant, treasurer, VP finance) of a non-financial firm (Finance exec. of non-financials), (iv) holds an academic position in a related field (e.g. Professor of finance, economics or accounting), or (v) works as a hedge fund or private equity fund manager, or venture capitalist (Professional investor).

53
Figure 2: Distribution of financial expertise among commercial banks This figure provides the distribution of independent directors with financial expertise across all bank holding companies with total assets greater than $1Bn in 2006. Similar to Güner et al. (2008), an independent director is classified as a financial expert if he or she (i) has held an executive position at a banking institution (Former bank executive), (ii) holds an executive position at a non-bank financial institution (Exec. Of non-bank financials), (iii) holds a finance-related position (e.g. chief financial officer (CFO), accountant, treasurer, VP finance) of a non-financial firm (Finance exec. of non-financials), (iv) holds an academic position in a related field (e.g. Professor of finance, economics or accounting), or (v) works as a hedge fund or private equity fund manager, or venture capitalist (Professional investor).
05
1015
2025
Per
cent
0 .2 .4 .6 .8 1Proportion of financial experts among independent directors
Distribution of financial expertise

54
Appendix Appendix A: Board of JP Morgan Chase at the onset of the financial crisis (year-end 2006) Insiders:
1. James Dimon, President and CEO of JP Morgan Chase 2. William Harrison, Chairman and past CEO of JP Morgan Chase 3. Robert Lipp, Senior Advisor to JP Morgan Chase
Outsiders (independent directors):
1. John Biggs, Former Chairman and CEO of TIAA-CREF, retirement funds (financial expert*)
2. Crandall Bowles, Chairman and CEO of Springs Industries, window manufacturer 3. Stephen Burke, President of Comcast Cable Communications Inc., cable television 4. James Crown, President of H. Crown and Company, diversified investments (financial
expert*) 5. Ellen Futter, President and Trustee of the American Museum of Natural History 6. William Gray III, Chairman of the Amani Group, consulting and advisory 7. Laban Jackson, Chairman and CEO of Clear Creek Properties Inc., real estate
development 8. John Kessler, owner of John W. Kessler Company, real estate development 9. Richard Manoogian, Chairman and CEO of Masco Corporation, diversified manufacturer 10. David Novak, Chairman and CEO of Yum! Brands, Inc, franchised restaurants 11. Lee Raymond, Retired Chairman and CEO of Exxon Mobil Corp, oil and gas 12. William Weldon, Chairman and CEO of Johnson & Johnson, healthcare products
*: Both directors are considered financial experts according to our definition as they are executives of non-bank financial institutions.

55
Appendix B: Bank Characteristics This table provides the firm characteristics for our sample of U.S. financial institutions at the end of 2006. Panel A provides summary statistics for the sample combining commercial banks, investment banks and savings and loan associations (S&L). Panels B, C and D provides summary statistics for each bank type separately. Total assets is given as of fiscal year-end 2006. ROA is the return on assets and ROE the return on equity for the corresponding fiscal year. M/B is the ratio of the market value of assets divided by the book value of assets at fiscal year-end 2006, where the market value of assets is computed as the sum of book value of asset and market value of equity, minus the book value of equity. Equity capital ratio is book equity to total assets at fiscal year-end 2006. The variables are computed using Compustat source. The sample of commercial banks used for most tests in the study is reduced by about 10% once data availability from call reports is imposed.
Panel A: Full sample Variables N median mean stdev Total assets 292 2,911 44,230 194,899 ROA 284 0.01 0.012 0.009 ROE 284 0.059 0.059 0.022 M/B 284 1.084 1.091 0.059 Equity capital ratio 284 0.091 0.096 0.041
Panel B: Bank holding companies Variables N median mean stdev Total assets 225 2,850 37,736 190,506 ROA 219 0.011 0.011 0.004 ROE 219 0.059 0.059 0.016 M/B 219 1.093 1.098 0.051 Equity capital ratio 219 0.091 0.092 0.023
Panel C: Savings & Loans Variables N median mean stdev Total assets 60 2,839 12,509 45,623 ROA 58 0.007 0.009 0.013 ROE 58 0.054 0.053 0.035 M/B 58 1.047 1.068 0.079 Equity capital ratio 58 0.096 0.11 0.054
Panel D: Investment banks Variables N median mean stdev Total assets 7 503,545 524,839 431,026 ROA 7 0.049 0.047 0.012 ROE 7 0.094 0.091 0.023 M/B 7 1.053 1.057 0.029 Equity capital ratio 7 0.039 0.11 0.173