Embed Size (px)
Citation preview
TheFinancialEdge™
Visual Chart Organizer Guide
090811
©2011 Blackbaud, Inc. This publication, or any part thereof, may not be reproduced or transmitted in any form or by any means, electronic, or mechanical, including photocopying, recording, storage in an information retrieval system, or otherwise, without the prior written permission of Blackbaud, Inc.
The information in this manual has been carefully checked and is believed to be accurate. Blackbaud, Inc., assumes no responsibility for any inaccuracies, errors, or omissions in this manual. In no event will Blackbaud, Inc., be liable for direct, indirect, special, incidental, or consequential damages resulting from any defect or omission in this manual, even if advised of the possibility of damages.
In the interest of continuing product development, Blackbaud, Inc., reserves the right to make improvements in this manual and the products it describes at any time, without notice or obligation.
All Blackbaud product names appearing herein are trademarks or registered trademarks of Blackbaud, Inc.
All other products and company names mentioned herein are trademarks of their respective holder.
FE‐VisualChartOrganizerGuide‐090811
Contents
VISUAL CHART ORGANIZER . . . . . . . . . . . . . . . . . . . . . . . . . . . . . . . . . . . . . . . . . . . . . 1
Basics of Visual Chart Organizer . . . . . . . . . . . . . . . . . . . . . . . . . . . . . . . . . . . . . . . . . . . . . . . . . . . . . . . . . 2Working with Chart Templates . . . . . . . . . . . . . . . . . . . . . . . . . . . . . . . . . . . . . . . . . . . . . . . . . . . . . . . . 12
INDEX . . . . . . . . . . . . . . . . . . . . . . . . . . . . . . . . . . . . . . . . . . . . . . . . . . . . . . . . . . . 23

1chapter
Visual Chart Organizer
Basics of Visual Chart Organizer . . . . . . . . . . . . . . . . . . . . . . . . . . . . . . . . . . . . . . . . . . . . . . . . . . . . . . . . . . . . . . . . . 2Accessing Visual Chart Organizer . . . . . . . . . . . . . . . . . . . . . . . . . . . . . . . . . . . . . . . . . . . . . . . . . . . . . . . . . . . . . . . . . . 2Elements of Visual Chart Organizer . . . . . . . . . . . . . . . . . . . . . . . . . . . . . . . . . . . . . . . . . . . . . . . . . . . . . . . . . . . . . . . . 3
Menu Bar . . . . . . . . . . . . . . . . . . . . . . . . . . . . . . . . . . . . . . . . . . . . . . . . . . . . . . . . . . . . . . . . . . . . . . . . . . . . . . . . . . . 3Toolbar . . . . . . . . . . . . . . . . . . . . . . . . . . . . . . . . . . . . . . . . . . . . . . . . . . . . . . . . . . . . . . . . . . . . . . . . . . . . . . . . . . . . 4Buttons . . . . . . . . . . . . . . . . . . . . . . . . . . . . . . . . . . . . . . . . . . . . . . . . . . . . . . . . . . . . . . . . . . . . . . . . . . . . . . . . . . . . 4Tabs . . . . . . . . . . . . . . . . . . . . . . . . . . . . . . . . . . . . . . . . . . . . . . . . . . . . . . . . . . . . . . . . . . . . . . . . . . . . . . . . . . . . . . . 5
Understanding the Design View . . . . . . . . . . . . . . . . . . . . . . . . . . . . . . . . . . . . . . . . . . . . . . . . . . . . . . . . . . . . . . . . . . . 9Understanding the Account View . . . . . . . . . . . . . . . . . . . . . . . . . . . . . . . . . . . . . . . . . . . . . . . . . . . . . . . . . . . . . . . . . 11Working with Chart Templates . . . . . . . . . . . . . . . . . . . . . . . . . . . . . . . . . . . . . . . . . . . . . . . . . . . . . . . . . . . . . . . . 12
2 CHAPTER
The chart of accounts is a fundamental part of your accounting system, providing stability, organization, and functionality. In Visual Chart Organizer, you create chart templates that determine the accounts to include in your financial statements and how the financial statements look. You can define an infinite number of templates in Visual Chart Organizer.
Visual Chart Organizer has two viewing modes: Design View and Account View. In Design View you can build your template, and in Account View you can see what your report will look like using that template.
In Design View, header/total and detail lines define a chart of accounts. You determine the text, font format, and alignment for each header/total line. Use detail lines to include accounts under the header/total lines. If you have the optional module Projects and Grants, you can also use advanced filters in Design View to include specific projects, project attributes, and transaction codes in your chart templates.
In Account View, you can see the chart of accounts in the various templates you designed. In Reports, the program uses this chart of accounts to construct financial statements. You can access account records from the Account View without closing the chart.
With the default chart templates in Visual Chart Organizer, you can begin producing reports and financial statements without having to create a template. The Default template contains very little detail. Major category headers and totals sum all accounts within each category. You can use the default chart template as a basis to build your own chart of accounts. Just remember to save the new template and keep the default template intact.
Basics of Visual Chart OrganizerThis section provides you with a basic understanding of how to access and use Visual Chart Organizer. It contains information describing elements of the visual chart organizer, including menus, the toolbar, buttons, and tabs.
Accessing Visual Chart Organizer
Note: Our documentation shows you how to select, locate, and use the right resources for a particular task. We encourage you to try the procedures in this chapter with the sample database before recording transactions using your data. Visit our Web site at www.blackbaud.com for the latest documentation and information.
Warning: We highly recommend you do not modify the default chart template. Leaving the default template as it is gives you an accurate balance sheet or income statement each time you use it.
Glossary: A chart of accounts is a systematic numeric listing of all accounts that exist in an organization’s general ledger.
VISUAL CHART ORGANIZER 3
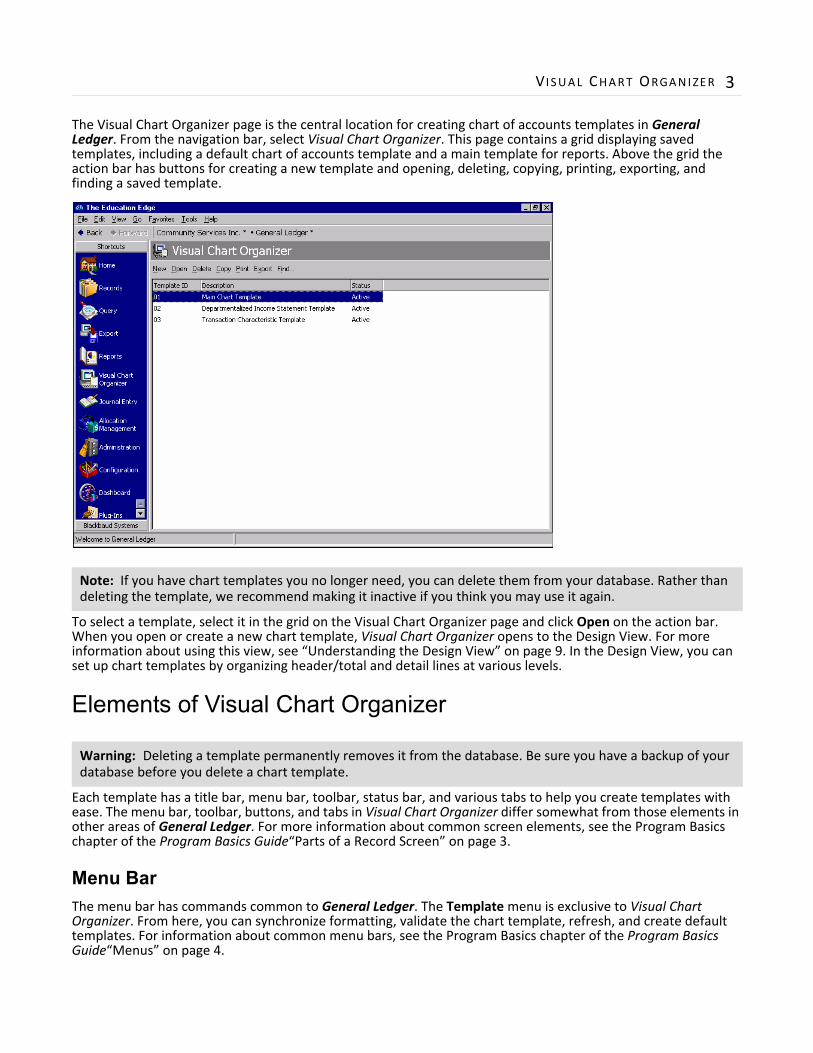
The Visual Chart Organizer page is the central location for creating chart of accounts templates in General Ledger. From the navigation bar, select Visual Chart Organizer. This page contains a grid displaying saved templates, including a default chart of accounts template and a main template for reports. Above the grid the action bar has buttons for creating a new template and opening, deleting, copying, printing, exporting, and finding a saved template.
To select a template, select it in the grid on the Visual Chart Organizer page and click Open on the action bar. When you open or create a new chart template, Visual Chart Organizer opens to the Design View. For more information about using this view, see “Understanding the Design View” on page 9. In the Design View, you can set up chart templates by organizing header/total and detail lines at various levels.
Elements of Visual Chart Organizer
Each template has a title bar, menu bar, toolbar, status bar, and various tabs to help you create templates with ease. The menu bar, toolbar, buttons, and tabs in Visual Chart Organizer differ somewhat from those elements in other areas of General Ledger. For more information about common screen elements, see the Program Basics chapter of the Program Basics Guide“Parts of a Record Screen” on page 3.
Menu BarThe menu bar has commands common to General Ledger. The Template menu is exclusive to Visual Chart Organizer. From here, you can synchronize formatting, validate the chart template, refresh, and create default templates. For information about common menu bars, see the Program Basics chapter of the Program Basics Guide“Menus” on page 4.
Note: If you have chart templates you no longer need, you can delete them from your database. Rather than deleting the template, we recommend making it inactive if you think you may use it again.
Warning: Deleting a template permanently removes it from the database. Be sure you have a backup of your database before you delete a chart template.
4 CHAPTER
Synchronize formatting by level. When you select Synchronize formatting by level, the program makes sure that formatting selections, such as the font, are the same for each line in a level. Formatting comes from the first line of each type and level in the header.
Validate chart template. When you select Validate chart template, the program makes sure no accounts are duplicated in the template. If there are duplicates, they appear in a validation report. The program ensures no accounts are missing from the template.
Refresh. If you make changes to the template, you can select Refresh from the Template menu, and the program updates the template to reflect your changes. Refresh is available only in Account View.
Create default template. When you select Create default template the program creates broad category sections in the chart for you. These sections include major headings, such as Assets and Liabilities, and their detail sections. Create default template can speed up your chart design processing.
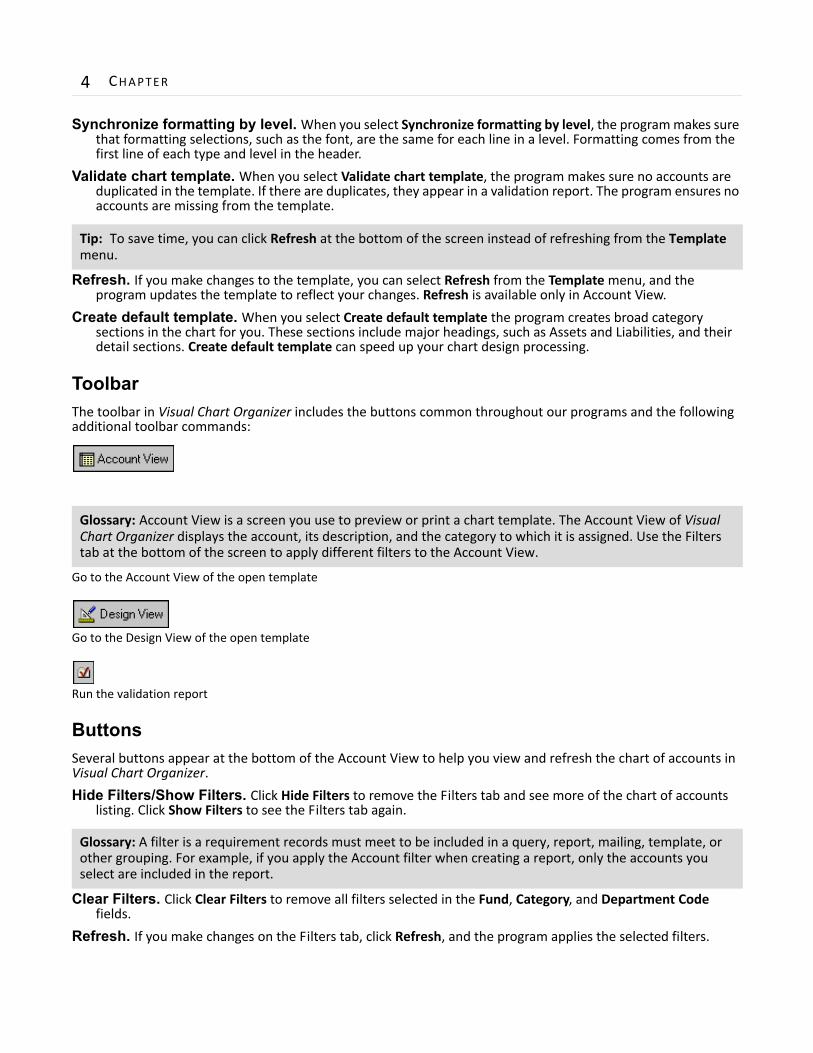
ToolbarThe toolbar in Visual Chart Organizer includes the buttons common throughout our programs and the following additional toolbar commands:
Go to the Account View of the open template
Go to the Design View of the open template
Run the validation report
ButtonsSeveral buttons appear at the bottom of the Account View to help you view and refresh the chart of accounts in Visual Chart Organizer.
Hide Filters/Show Filters. Click Hide Filters to remove the Filters tab and see more of the chart of accounts listing. Click Show Filters to see the Filters tab again.
Clear Filters. Click Clear Filters to remove all filters selected in the Fund, Category, and Department Code fields.
Refresh. If you make changes on the Filters tab, click Refresh, and the program applies the selected filters.
Tip: To save time, you can click Refresh at the bottom of the screen instead of refreshing from the Template menu.
Glossary: Account View is a screen you use to preview or print a chart template. The Account View of Visual Chart Organizer displays the account, its description, and the category to which it is assigned. Use the Filters tab at the bottom of the screen to apply different filters to the Account View.
Glossary: A filter is a requirement records must meet to be included in a query, report, mailing, template, or other grouping. For example, if you apply the Account filter when creating a report, only the accounts you select are included in the report.
VISUAL CHART ORGANIZER 5
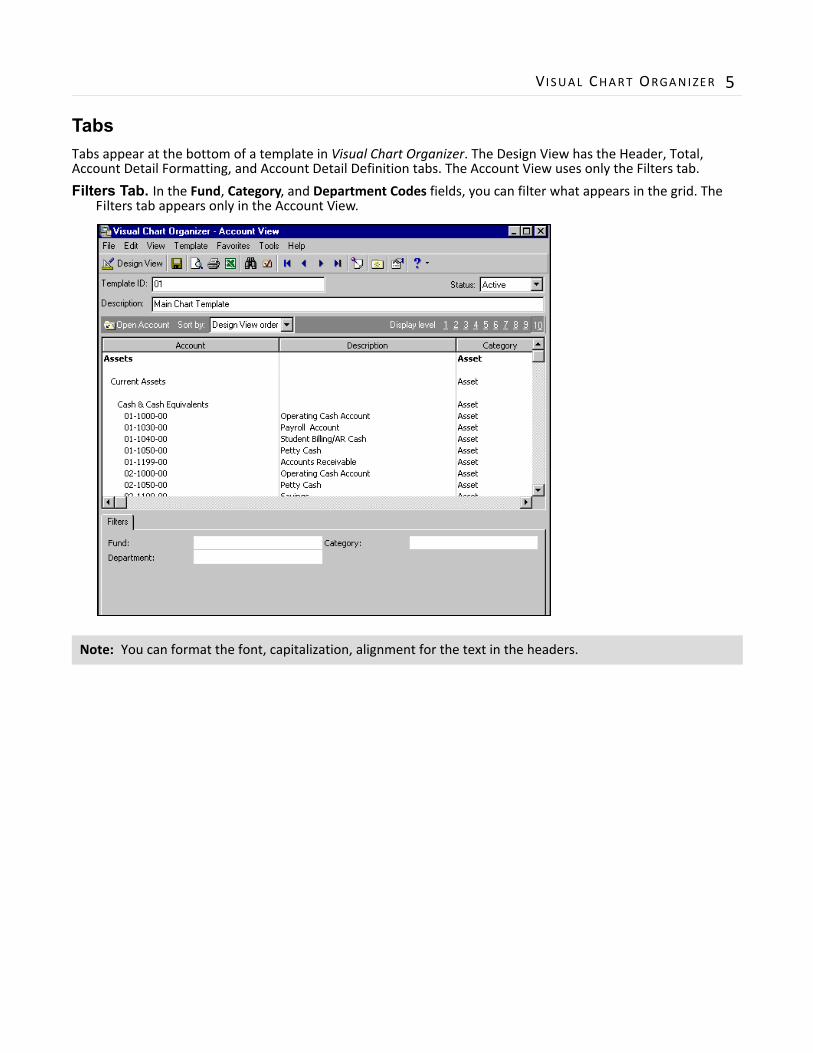
TabsTabs appear at the bottom of a template in Visual Chart Organizer. The Design View has the Header, Total, Account Detail Formatting, and Account Detail Definition tabs. The Account View uses only the Filters tab.
Filters Tab. In the Fund, Category, and Department Codes fields, you can filter what appears in the grid. The Filters tab appears only in the Account View.
Note: You can format the font, capitalization, alignment for the text in the headers.
6 CHAPTER
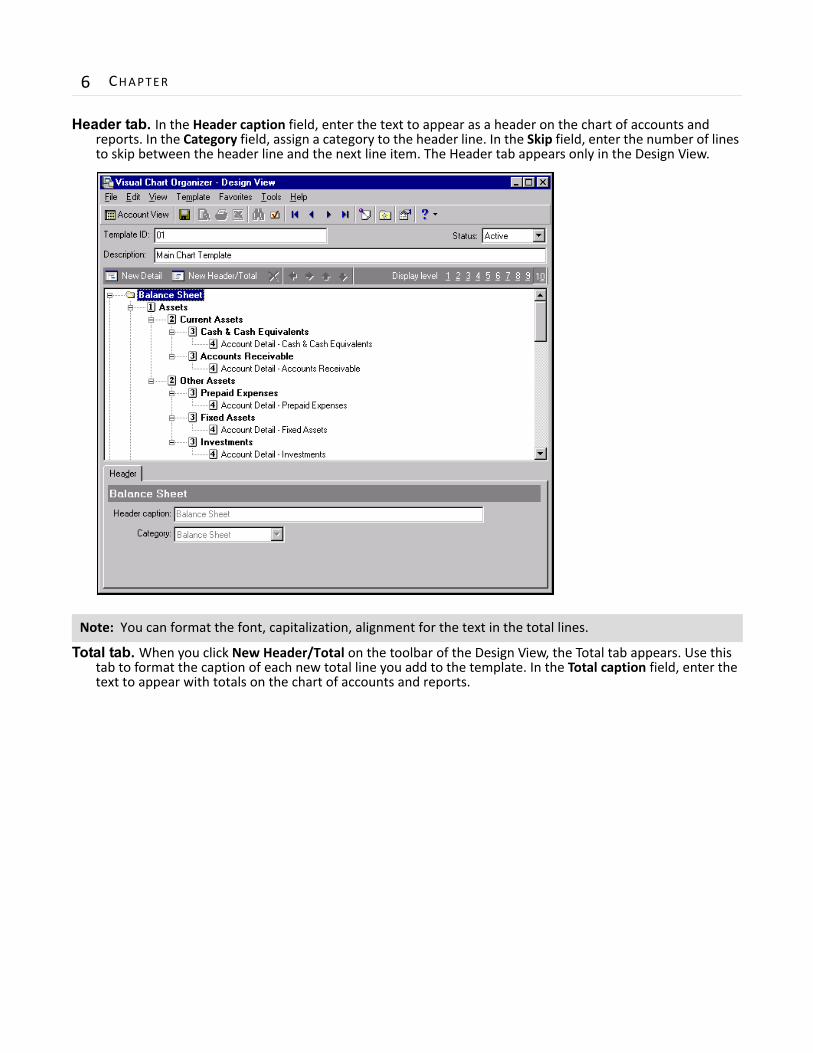
Header tab. In the Header caption field, enter the text to appear as a header on the chart of accounts and reports. In the Category field, assign a category to the header line. In the Skip field, enter the number of lines to skip between the header line and the next line item. The Header tab appears only in the Design View.
Total tab. When you click New Header/Total on the toolbar of the Design View, the Total tab appears. Use this tab to format the caption of each new total line you add to the template. In the Total caption field, enter the text to appear with totals on the chart of accounts and reports.
Note: You can format the font, capitalization, alignment for the text in the total lines.
VISUAL CHART ORGANIZER 7
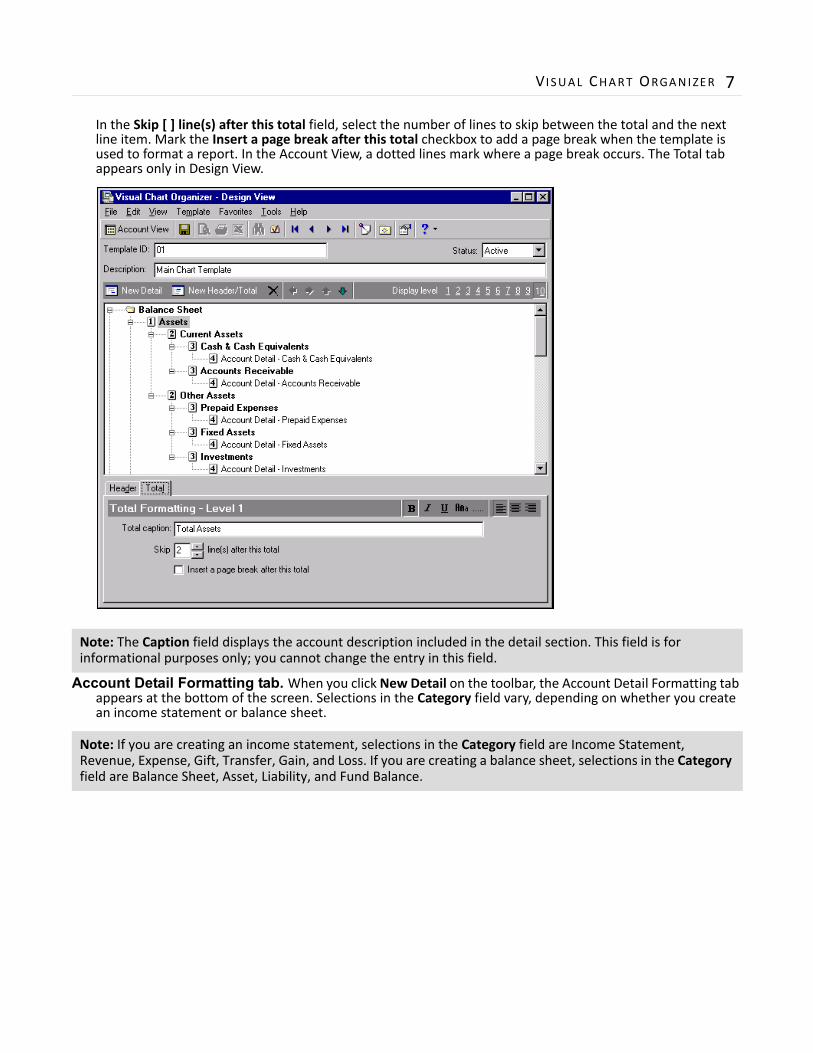
In the Skip [ ] line(s) after this total field, select the number of lines to skip between the total and the next line item. Mark the Insert a page break after this total checkbox to add a page break when the template is used to format a report. In the Account View, a dotted lines mark where a page break occurs. The Total tab appears only in Design View.
Account Detail Formatting tab. When you click New Detail on the toolbar, the Account Detail Formatting tab appears at the bottom of the screen. Selections in the Category field vary, depending on whether you create an income statement or balance sheet.
Note: The Caption field displays the account description included in the detail section. This field is for informational purposes only; you cannot change the entry in this field.
Note: If you are creating an income statement, selections in the Category field are Income Statement, Revenue, Expense, Gift, Transfer, Gain, and Loss. If you are creating a balance sheet, selections in the Category field are Balance Sheet, Asset, Liability, and Fund Balance.
8 CHAPTER
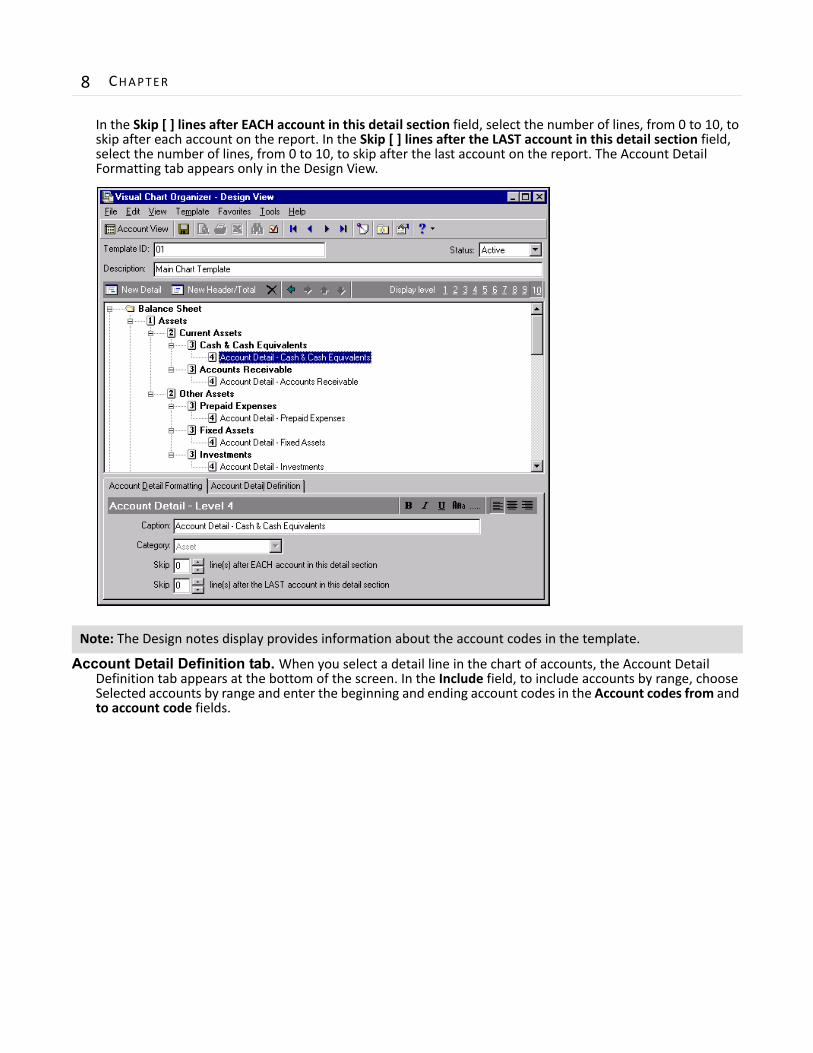
In the Skip [ ] lines after EACH account in this detail section field, select the number of lines, from 0 to 10, to skip after each account on the report. In the Skip [ ] lines after the LAST account in this detail section field, select the number of lines, from 0 to 10, to skip after the last account on the report. The Account Detail Formatting tab appears only in the Design View.
Account Detail Definition tab. When you select a detail line in the chart of accounts, the Account Detail Definition tab appears at the bottom of the screen. In the Include field, to include accounts by range, choose Selected accounts by range and enter the beginning and ending account codes in the Account codes from and to account code fields.
Note: The Design notes display provides information about the account codes in the template.
VISUAL CHART ORGANIZER 9
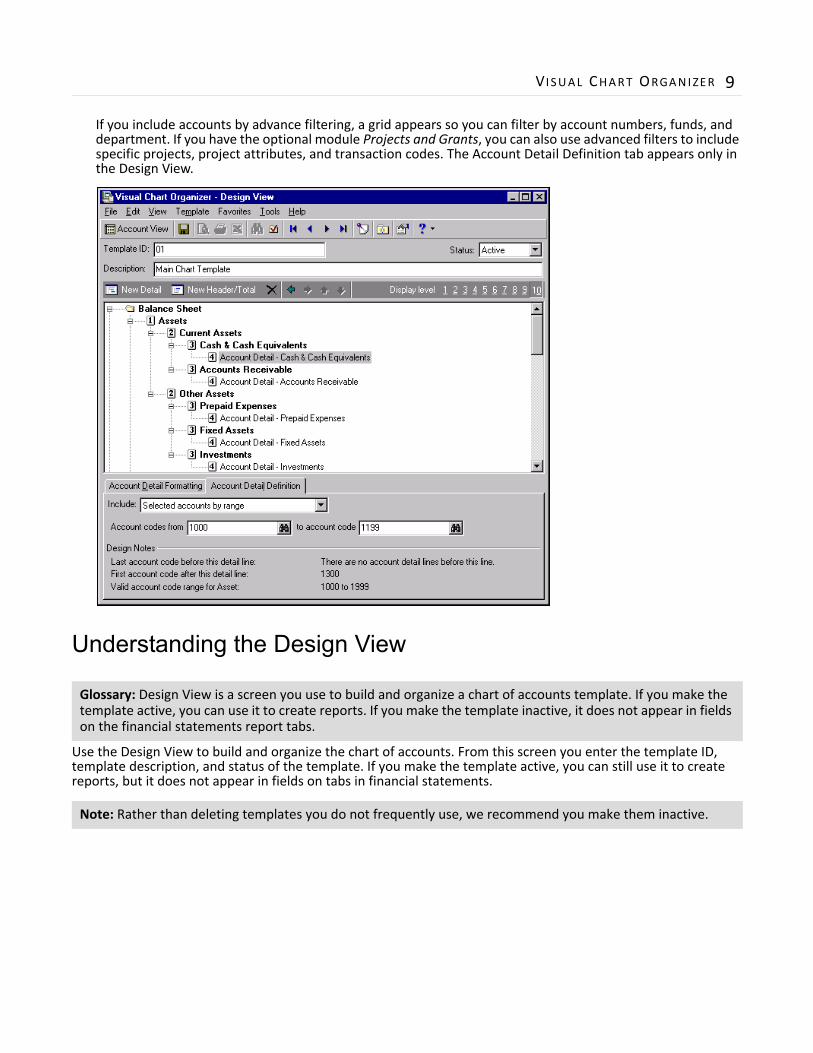
If you include accounts by advance filtering, a grid appears so you can filter by account numbers, funds, and department. If you have the optional module Projects and Grants, you can also use advanced filters to include specific projects, project attributes, and transaction codes. The Account Detail Definition tab appears only in the Design View.
Understanding the Design View
Use the Design View to build and organize the chart of accounts. From this screen you enter the template ID, template description, and status of the template. If you make the template active, you can still use it to create reports, but it does not appear in fields on tabs in financial statements.
Glossary: Design View is a screen you use to build and organize a chart of accounts template. If you make the template active, you can use it to create reports. If you make the template inactive, it does not appear in fields on the financial statements report tabs.
Note: Rather than deleting templates you do not frequently use, we recommend you make them inactive.
10 CHAPTER
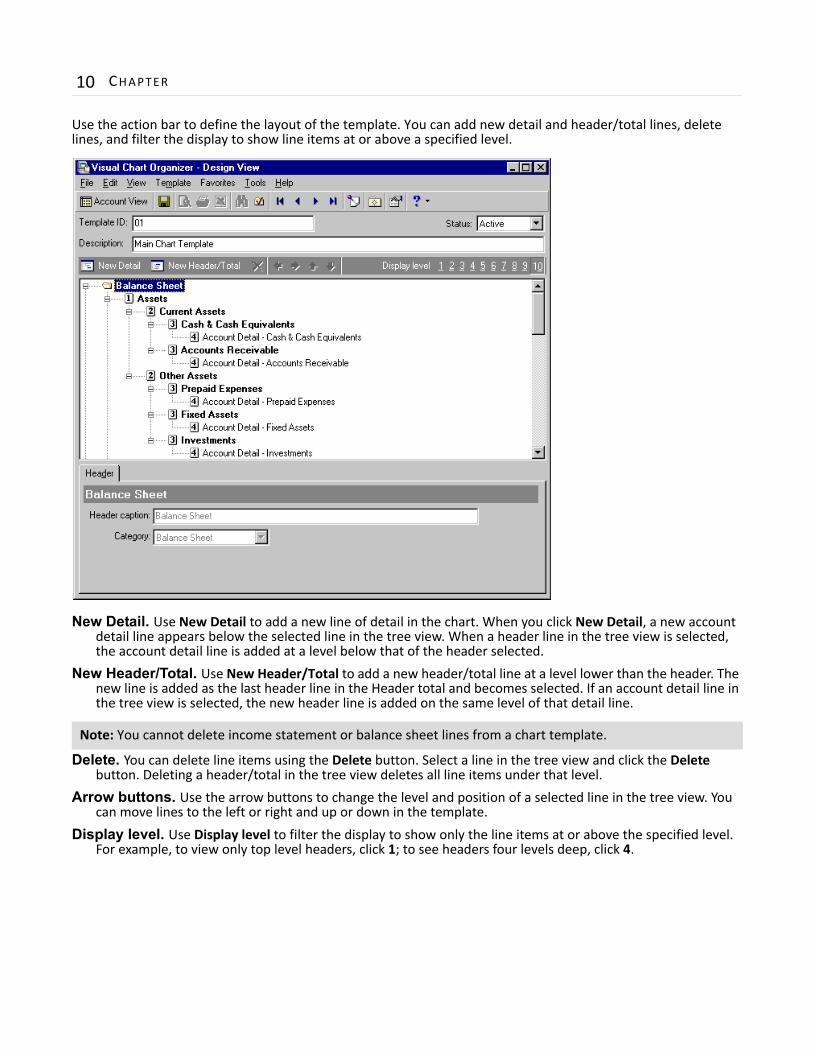
Use the action bar to define the layout of the template. You can add new detail and header/total lines, delete lines, and filter the display to show line items at or above a specified level.
New Detail. Use New Detail to add a new line of detail in the chart. When you click New Detail, a new account detail line appears below the selected line in the tree view. When a header line in the tree view is selected, the account detail line is added at a level below that of the header selected.
New Header/Total. Use New Header/Total to add a new header/total line at a level lower than the header. The new line is added as the last header line in the Header total and becomes selected. If an account detail line in the tree view is selected, the new header line is added on the same level of that detail line.
Delete. You can delete line items using the Delete button. Select a line in the tree view and click the Delete button. Deleting a header/total in the tree view deletes all line items under that level.
Arrow buttons. Use the arrow buttons to change the level and position of a selected line in the tree view. You can move lines to the left or right and up or down in the template.
Display level. Use Display level to filter the display to show only the line items at or above the specified level. For example, to view only top level headers, click 1; to see headers four levels deep, click 4.
Note: You cannot delete income statement or balance sheet lines from a chart template.
VISUAL CHART ORGANIZER 11
Understanding the Account View
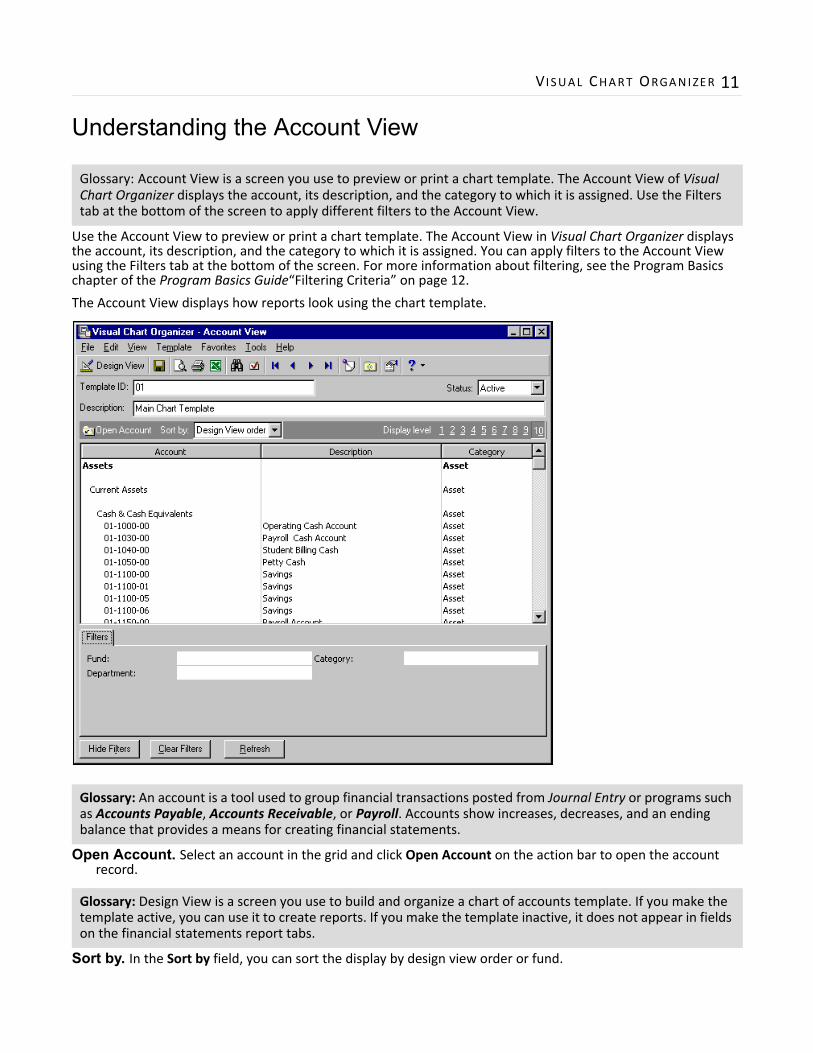
Use the Account View to preview or print a chart template. The Account View in Visual Chart Organizer displays the account, its description, and the category to which it is assigned. You can apply filters to the Account View using the Filters tab at the bottom of the screen. For more information about filtering, see the Program Basics chapter of the Program Basics Guide“Filtering Criteria” on page 12.
The Account View displays how reports look using the chart template.
Open Account. Select an account in the grid and click Open Account on the action bar to open the account record.
Sort by. In the Sort by field, you can sort the display by design view order or fund.
Glossary: Account View is a screen you use to preview or print a chart template. The Account View of Visual Chart Organizer displays the account, its description, and the category to which it is assigned. Use the Filters tab at the bottom of the screen to apply different filters to the Account View.
Glossary: An account is a tool used to group financial transactions posted from Journal Entry or programs such as Accounts Payable, Accounts Receivable, or Payroll. Accounts show increases, decreases, and an ending balance that provides a means for creating financial statements.
Glossary: Design View is a screen you use to build and organize a chart of accounts template. If you make the template active, you can use it to create reports. If you make the template inactive, it does not appear in fields on the financial statements report tabs.
12 CHAPTER
Display level. Use Display level to filter the display to show header/totals or detail lines at or above the specified level. For example, to view only top level line items, click 1; to see line items four levels deep, click 4.
Filters. Use the Filters tab to filter by fund, department codes, or category. For more information about filtering, see the Program Basics chapter of the Program Basics Guide“Filtering Criteria” on page 12.
Working with Chart TemplatesVisual Chart Organizer is the central location for creating templates for your chart of accounts in General Ledger. A chart template is a visual representation in General Ledger of all or selected accounts from the general ledger. Chart templates drive the presentation of accounts on financial statements.
From the Visual Chart Organizer page, you can create a new template or open a saved template, delete, copy, print, export, and find a saved template. We encourage you to try these procedures with the sample database before you create your own to use with your data.
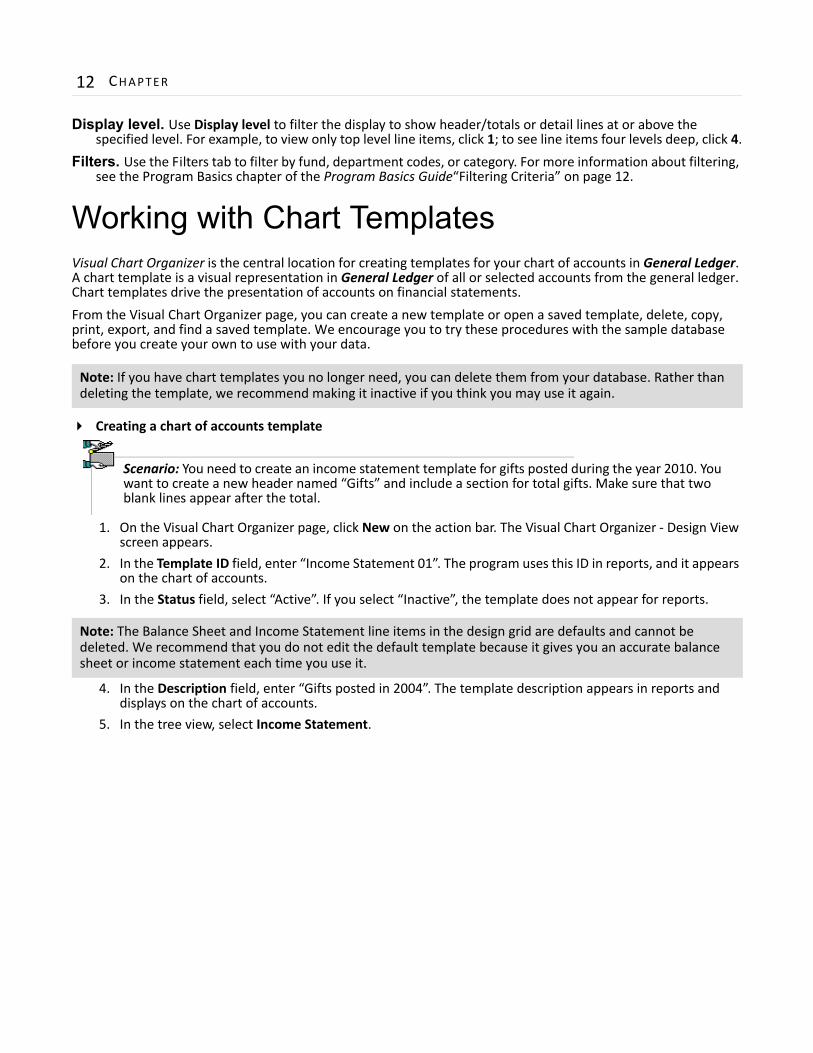
Creating a chart of accounts template
1. On the Visual Chart Organizer page, click New on the action bar. The Visual Chart Organizer ‐ Design View screen appears.
2. In the Template ID field, enter “Income Statement 01”. The program uses this ID in reports, and it appears on the chart of accounts.
3. In the Status field, select “Active”. If you select “Inactive”, the template does not appear for reports.
4. In the Description field, enter “Gifts posted in 2004”. The template description appears in reports and displays on the chart of accounts.
5. In the tree view, select Income Statement.
Note: If you have chart templates you no longer need, you can delete them from your database. Rather than deleting the template, we recommend making it inactive if you think you may use it again.
Note: The Balance Sheet and Income Statement line items in the design grid are defaults and cannot be deleted. We recommend that you do not edit the default template because it gives you an accurate balance sheet or income statement each time you use it.
Scenario: You need to create an income statement template for gifts posted during the year 2010. You want to create a new header named “Gifts” and include a section for total gifts. Make sure that two blank lines appear after the total.
VISUAL CHART ORGANIZER 13
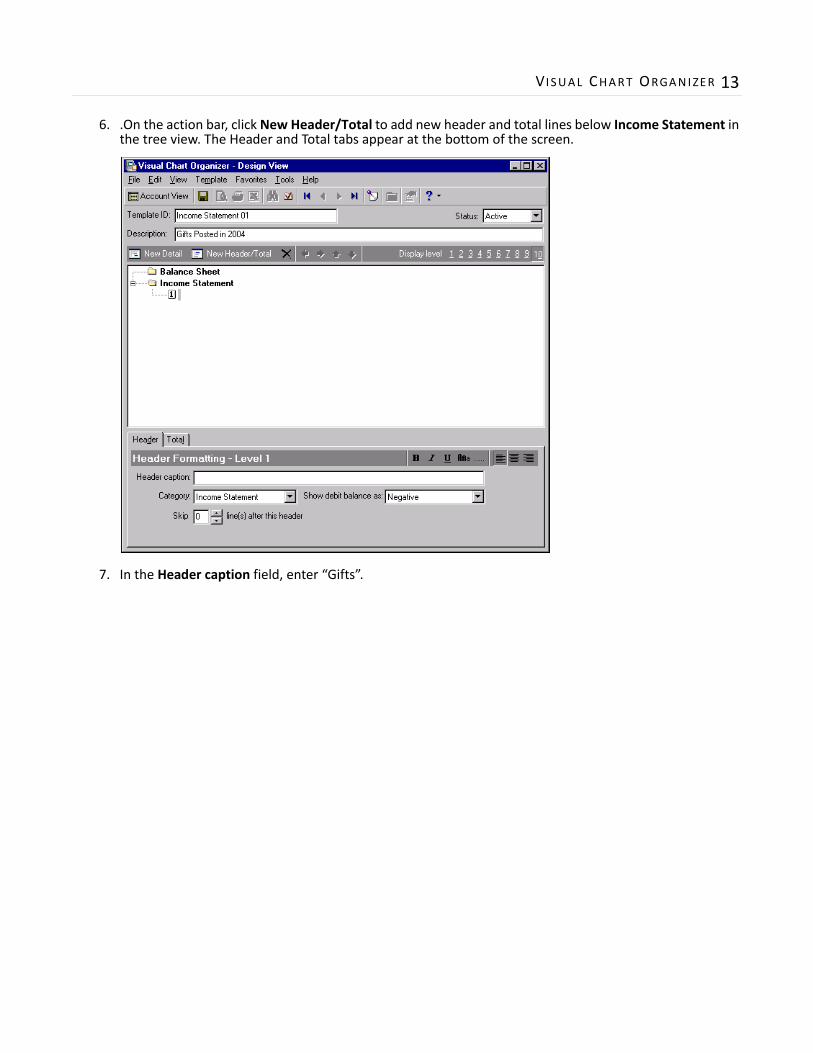
6. .On the action bar, click New Header/Total to add new header and total lines below Income Statement in the tree view. The Header and Total tabs appear at the bottom of the screen.
7. In the Header caption field, enter “Gifts”.
14 CHAPTER
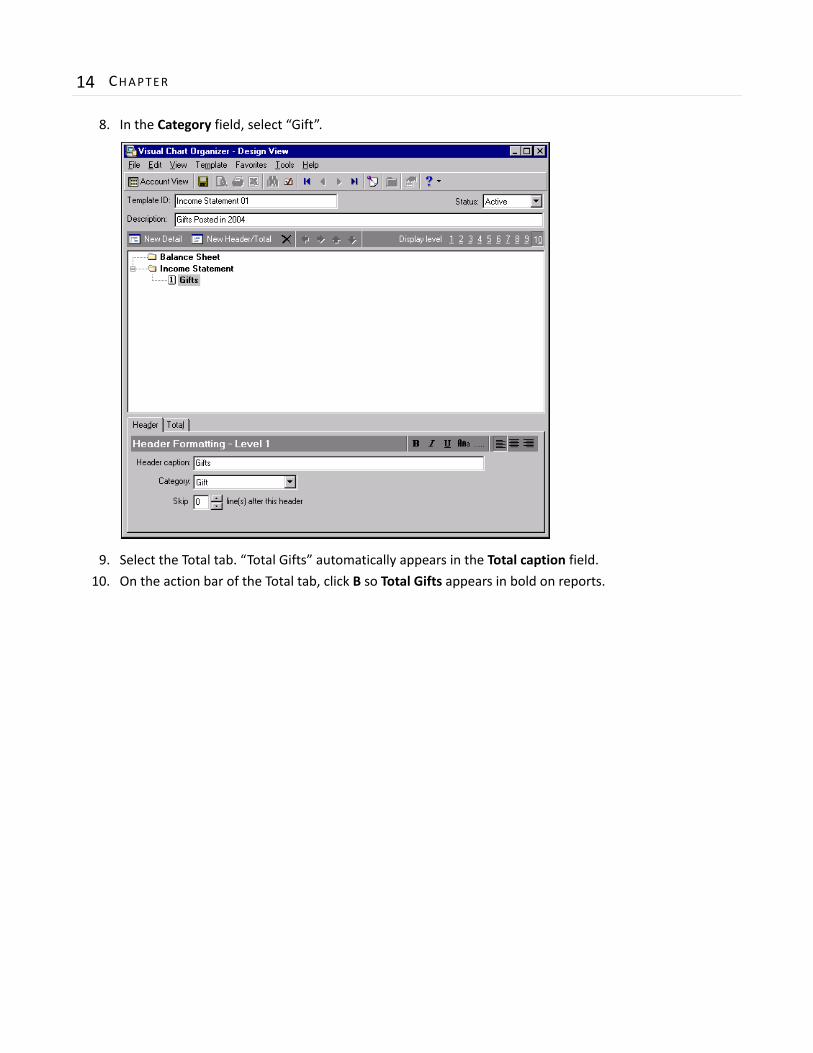
8. In the Category field, select “Gift”.
9. Select the Total tab. “Total Gifts” automatically appears in the Total caption field.
10. On the action bar of the Total tab, click B so Total Gifts appears in bold on reports.
VISUAL CHART ORGANIZER 15
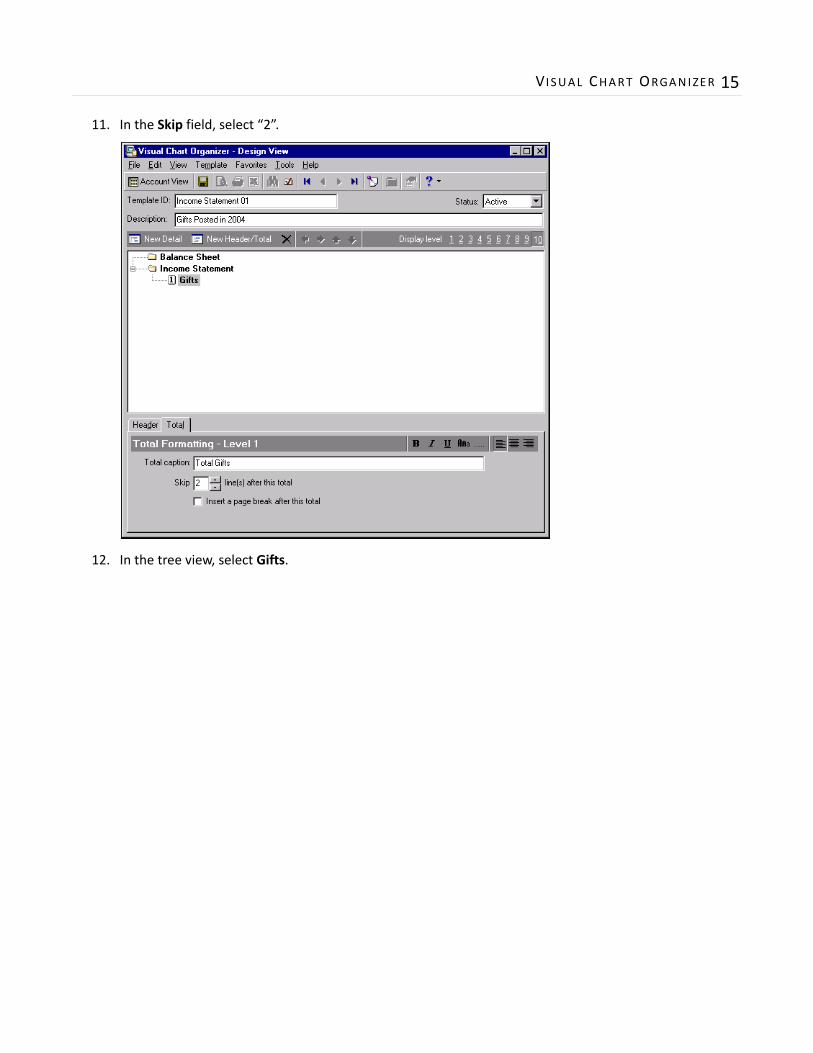
11. In the Skip field, select “2”.
12. In the tree view, select Gifts.
16 CHAPTER
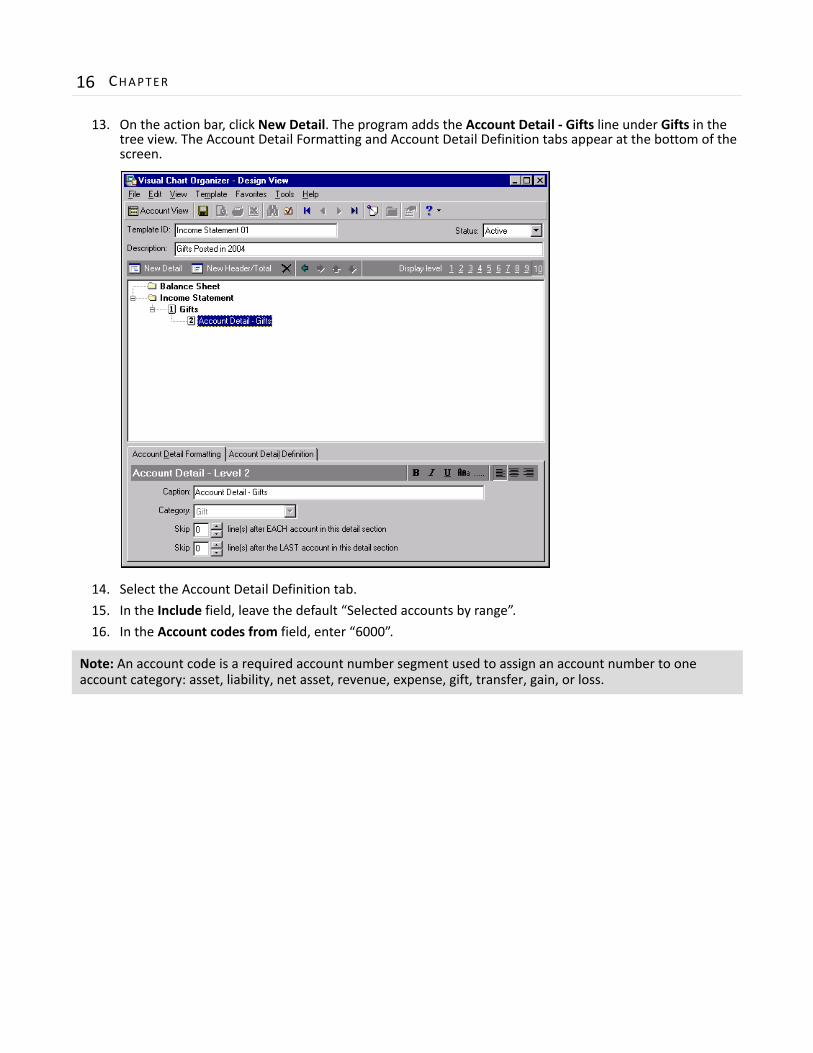
13. On the action bar, click New Detail. The program adds the Account Detail ‐ Gifts line under Gifts in the tree view. The Account Detail Formatting and Account Detail Definition tabs appear at the bottom of the screen.
14. Select the Account Detail Definition tab.
15. In the Include field, leave the default “Selected accounts by range”.
16. In the Account codes from field, enter “6000”.
Note: An account code is a required account number segment used to assign an account number to one account category: asset, liability, net asset, revenue, expense, gift, transfer, gain, or loss.
VISUAL CHART ORGANIZER 17
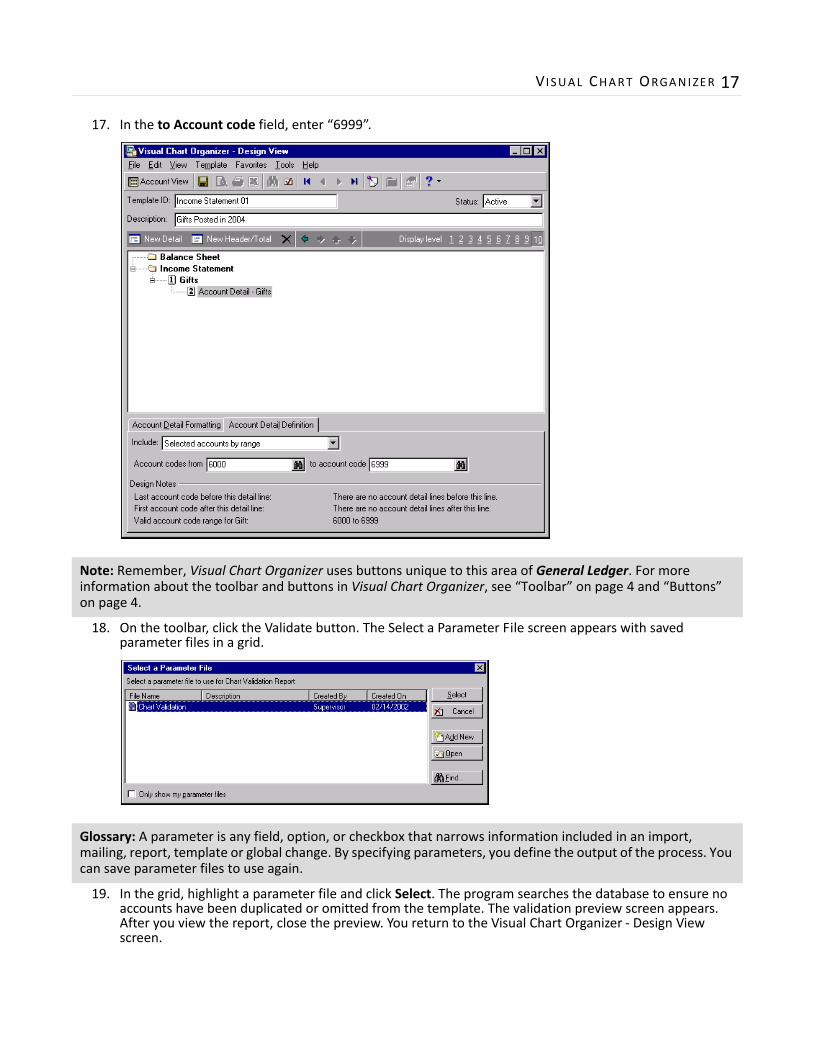
17. In the to Account code field, enter “6999”.
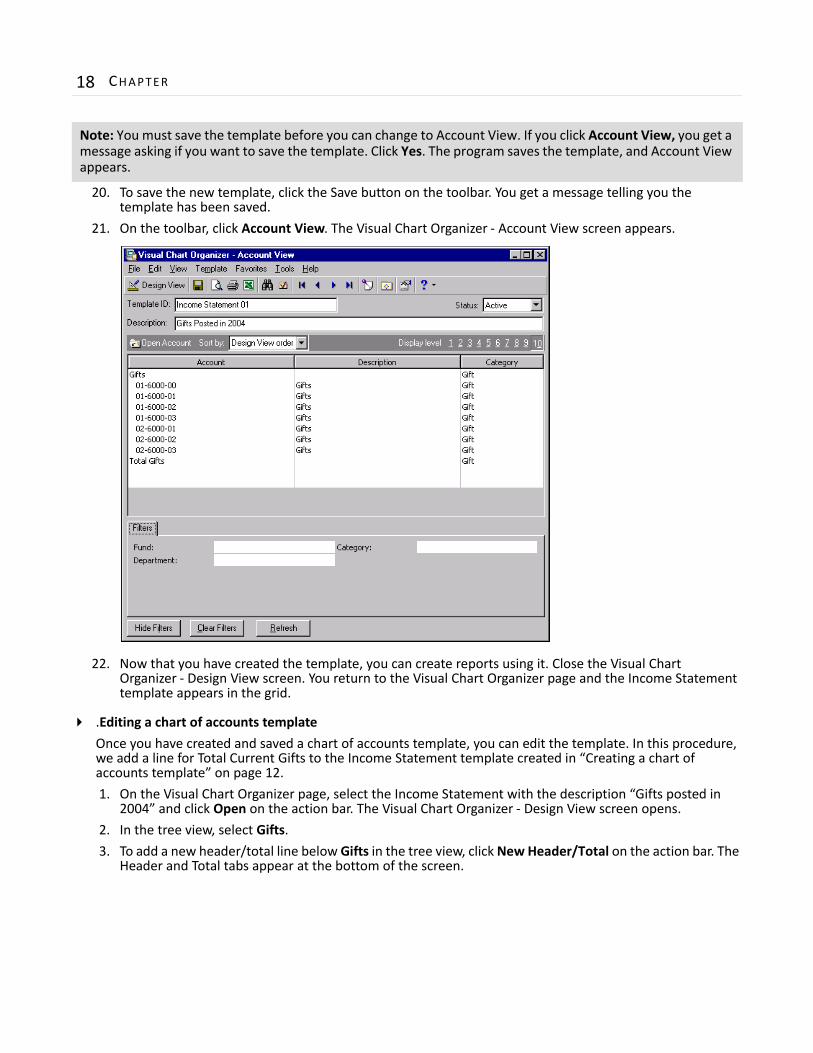
18. On the toolbar, click the Validate button. The Select a Parameter File screen appears with saved parameter files in a grid.
19. In the grid, highlight a parameter file and click Select. The program searches the database to ensure no accounts have been duplicated or omitted from the template. The validation preview screen appears. After you view the report, close the preview. You return to the Visual Chart Organizer ‐ Design View screen.
Note: Remember, Visual Chart Organizer uses buttons unique to this area of General Ledger. For more information about the toolbar and buttons in Visual Chart Organizer, see “Toolbar” on page 4 and “Buttons” on page 4.
Glossary: A parameter is any field, option, or checkbox that narrows information included in an import, mailing, report, template or global change. By specifying parameters, you define the output of the process. You can save parameter files to use again.
18 CHAPTER
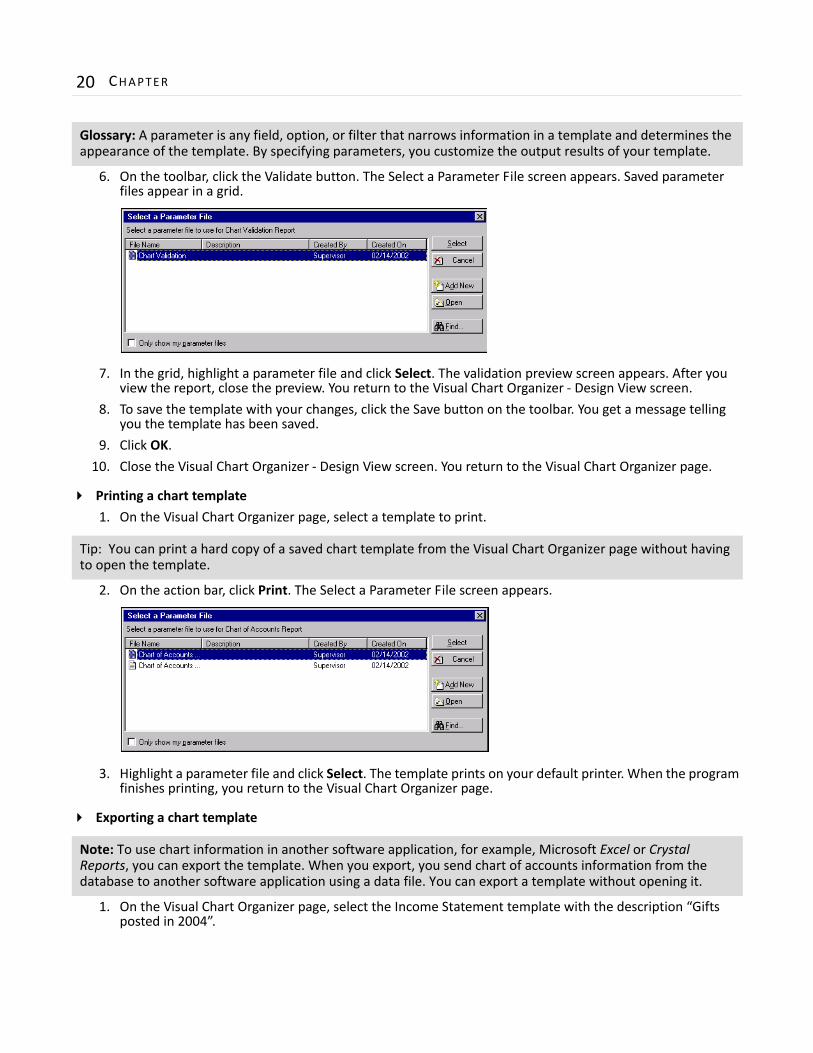
20. To save the new template, click the Save button on the toolbar. You get a message telling you the template has been saved.
21. On the toolbar, click Account View. The Visual Chart Organizer ‐ Account View screen appears.
22. Now that you have created the template, you can create reports using it. Close the Visual Chart Organizer ‐ Design View screen. You return to the Visual Chart Organizer page and the Income Statement template appears in the grid.
.Editing a chart of accounts template
Once you have created and saved a chart of accounts template, you can edit the template. In this procedure, we add a line for Total Current Gifts to the Income Statement template created in “Creating a chart of accounts template” on page 12.
1. On the Visual Chart Organizer page, select the Income Statement with the description “Gifts posted in 2004” and click Open on the action bar. The Visual Chart Organizer ‐ Design View screen opens.
2. In the tree view, select Gifts.
3. To add a new header/total line below Gifts in the tree view, click New Header/Total on the action bar. The Header and Total tabs appear at the bottom of the screen.
Note: You must save the template before you can change to Account View. If you click Account View, you get a message asking if you want to save the template. Click Yes. The program saves the template, and Account View appears.
VISUAL CHART ORGANIZER 19
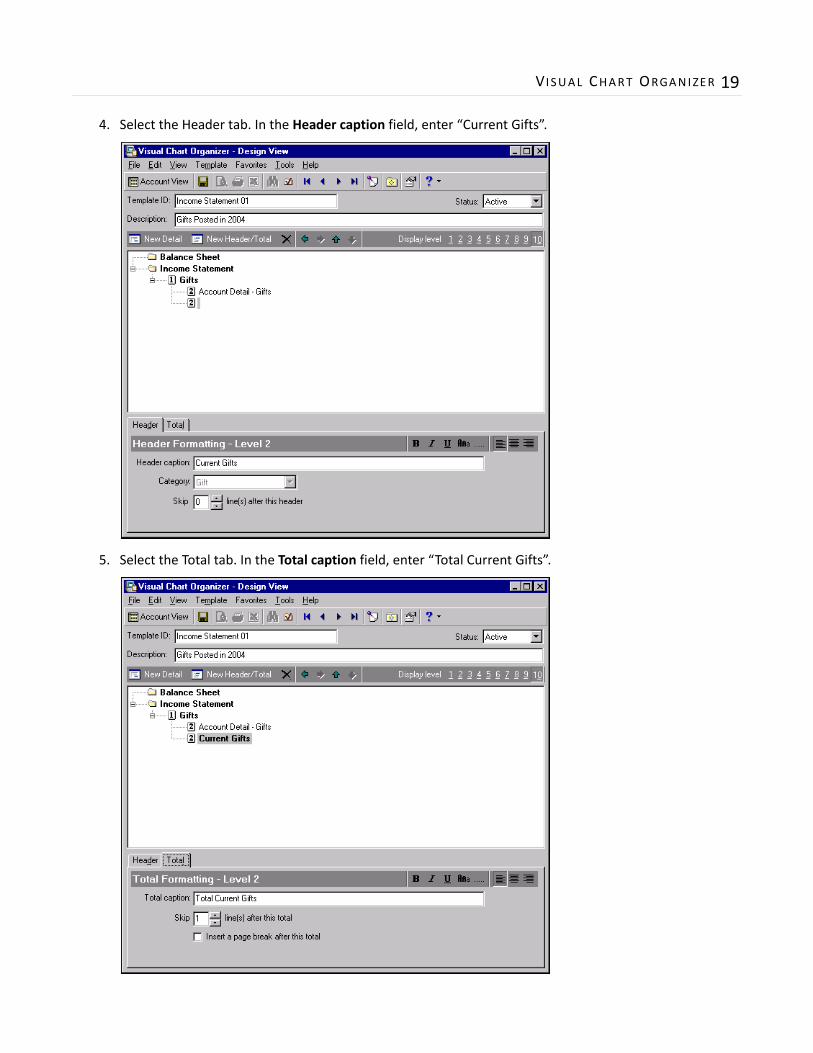
4. Select the Header tab. In the Header caption field, enter “Current Gifts”.
5. Select the Total tab. In the Total caption field, enter “Total Current Gifts”.
20 CHAPTER
6. On the toolbar, click the Validate button. The Select a Parameter File screen appears. Saved parameter files appear in a grid.
7. In the grid, highlight a parameter file and click Select. The validation preview screen appears. After you view the report, close the preview. You return to the Visual Chart Organizer ‐ Design View screen.
8. To save the template with your changes, click the Save button on the toolbar. You get a message telling you the template has been saved.
9. Click OK.
10. Close the Visual Chart Organizer ‐ Design View screen. You return to the Visual Chart Organizer page.
Printing a chart template
1. On the Visual Chart Organizer page, select a template to print.
2. On the action bar, click Print. The Select a Parameter File screen appears.
3. Highlight a parameter file and click Select. The template prints on your default printer. When the program finishes printing, you return to the Visual Chart Organizer page.
Exporting a chart template
1. On the Visual Chart Organizer page, select the Income Statement template with the description “Gifts posted in 2004”.
Glossary: A parameter is any field, option, or filter that narrows information in a template and determines the appearance of the template. By specifying parameters, you customize the output results of your template.
Tip: You can print a hard copy of a saved chart template from the Visual Chart Organizer page without having to open the template.
Note: To use chart information in another software application, for example, Microsoft Excel or Crystal Reports, you can export the template. When you export, you send chart of accounts information from the database to another software application using a data file. You can export a template without opening it.
VISUAL CHART ORGANIZER 21
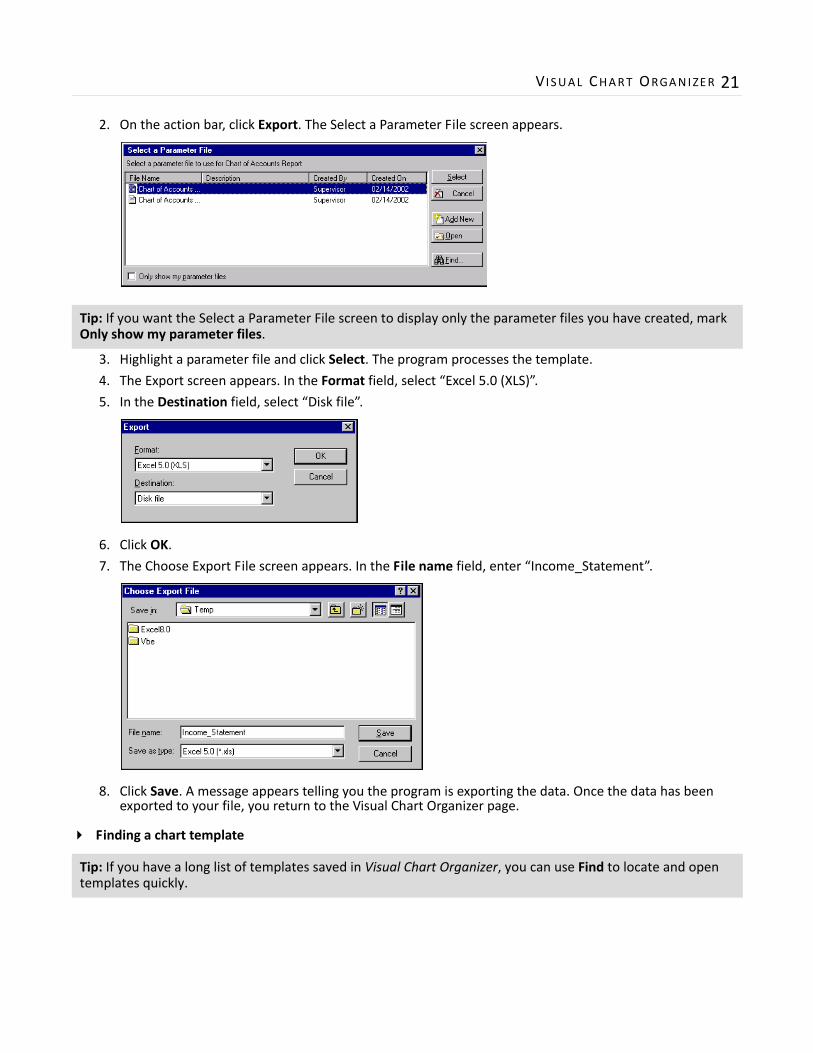
2. On the action bar, click Export. The Select a Parameter File screen appears.
3. Highlight a parameter file and click Select. The program processes the template.
4. The Export screen appears. In the Format field, select “Excel 5.0 (XLS)”.
5. In the Destination field, select “Disk file”.
6. Click OK.
7. The Choose Export File screen appears. In the File name field, enter “Income_Statement”.
8. Click Save. A message appears telling you the program is exporting the data. Once the data has been exported to your file, you return to the Visual Chart Organizer page.
Finding a chart template
Tip: If you want the Select a Parameter File screen to display only the parameter files you have created, mark Only show my parameter files.
Tip: If you have a long list of templates saved in Visual Chart Organizer, you can use Find to locate and open templates quickly.
22 CHAPTER
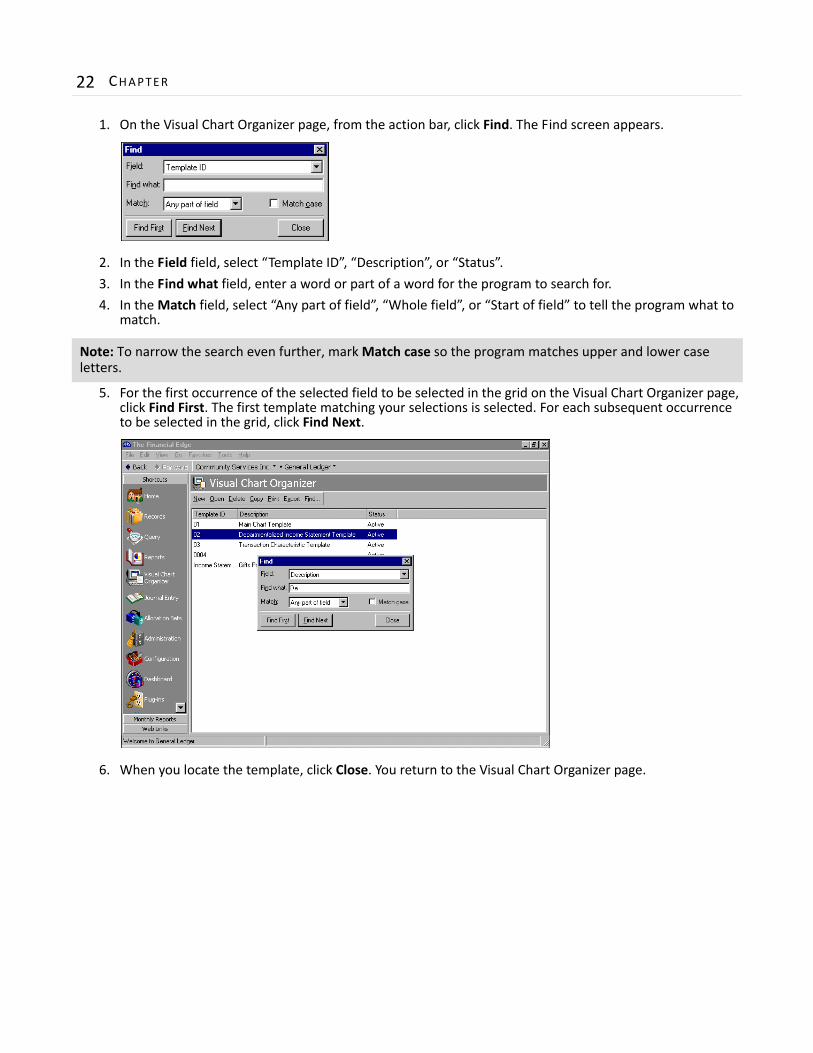
1. On the Visual Chart Organizer page, from the action bar, click Find. The Find screen appears.
2. In the Field field, select “Template ID”, “Description”, or “Status”.
3. In the Find what field, enter a word or part of a word for the program to search for.
4. In the Match field, select “Any part of field”, “Whole field”, or “Start of field” to tell the program what to match.
5. For the first occurrence of the selected field to be selected in the grid on the Visual Chart Organizer page, click Find First. The first template matching your selections is selected. For each subsequent occurrence to be selected in the grid, click Find Next.
6. When you locate the template, click Close. You return to the Visual Chart Organizer page.
Note: To narrow the search even further, mark Match case so the program matches upper and lower case letters.
Aaccessing Visual Chart Organizer 2account detail definition tab 8account detail formatting tab 7account view 11adding a chart template 12
Bbutton 4
Cchanging, see editingchart of accounts, overview 2chart template
adding 12defined 12editing 18exporting 20finding 21overview 12printing 20
creating, see adding
Ddesign view 9
Eediting a chart template 18elements of Visual Chart Organizer 3exporting a chart template 20
Ffilters tab 5finding a chart template 21
Hheader tab 6
Mmenu bar
create default template 4overview 3refresh 4synchronize formatting by level 4validate chart template 4
Pprinting a chart template 20
Ttab
account detail definition 8account detail formatting 7filters 5header 6total 6
toolbar 4total tab 6
Index
24