Embed Size (px)
Citation preview
1
Financial Distress Risk, Executive Compensation,
and Institutional Investors1
Jie Chen
University of Bristol
Paula Hill University of Bristol
Neslihan Ozkan University of Bristol
January 13th, 2014
Abstract: This paper examines how financial distress risk could influence the level and structure of executive compensation in UK firms. We investigate whether institutional shareholders as major shareholders play a role in determining compensation packages of executives who are newly hired from either outside or inside the firm with financial distress risk. Our sample consists of 3,697 newly appointed executives from 1,141 UK listed non-financial firms over the period 1998 to 2009. We find that financial distress risk has a negative impact on the level of total compensation and the fraction of equity-based compensation, which suggests the presence of strong creditors in the debt-friendly UK bankruptcy system. Institutional ownership concentration seems to increase the level of total compensation and fraction of equity-based compensation in firms with high financial distress risk, but its overall impact is negative and significant. Our results do not provide any evidence of statistically significant difference between compensation packages of executives who are internally promoted and those who are externally hired by firms with high financial distress risk.
1 We would like to thank Marcin Kacperczyk and Eliezer Fich for valuable feedback.
2
1. Introduction
Executive pay deals, in particular, those at financially distressed firms attract considerable
public attention2. Recently, an influential institutional investor group announced that
executive pay policy at Punch Tavern, a debt-laden struggling UK company, was
unacceptable. The fact that Giles Thorley, the CEO of Punch Tavern, has been one of
Britain’s best paid chief executives has caused a discontent among institutional shareholders.
They described executive compensation packages as ‘potentially excessive’ and performance
milestones set for executives were regarded to be ‘not challenging’. Mike Tye, a newly
appointed director at Punch Tavern, has had a long-term bonus deal that could pay him nine
times his base salary. Punch Tavern insisted that it set up a dedicated payout scheme for
Mr. Tye which was vital to recruiting him to the company that was struggling with its high
level of debt. Recently, UK High Pay Commission Report recommended that full disclosure
of all voting decisions on executive remuneration should be made by institutional investors
and fund managers. Thus, institutional investors are expected to have further incentive to take
an active monitoring role in firms at which they have an ownership.
The question about how to attract executives to firms which are struggling with high level
of financial distress risk and how to compensate them could be of utmost importance in terms
of determining the likelihood of firm’s survival. This paper aims to investigate how financial
distress risk could influence the level and structure of executive compensation in UK firms.
Specifically, we focus on executives who are newly recruited to those firms either from
outside or inside the firm. Different from US firms, UK firms operate in a corporate
environment where creditors have relatively stronger legal protection which could potentially
influence the incentives of creditors to take an active monitoring role in firms with financial
2 See, for instance, ‘Watchdog savages pub landlord Punch’s boardroom payout’, Guardian, January 6th, 2009.
3
distress risk (Franks, Nyborg, and Torous, 1996; Davydenko and Franks, 2008; Acharya,
Sundaram, John, 2011).
Extant literature suggests that states of financial distress and bankruptcy present a major
stage in the life cycle of firms that leads to substantial changes in the contracting features of
managerial compensation3. Executives take on human capital risk when they accept offers
from firms with high financial distress risk (Berk, Stanton and Zechner, 2010; Chemmanur,
Cheng and Zhang, 2012). Eckbo, Thorburn and Wang (2012) present estimates of CEO
human capital losses from corporate bankruptcy accounting for CEO post-bankruptcy
employment in US firms. Their findings show that overall the estimates imply an ex ante
expected median personal bankruptcy cost of $2.7 million, or three times the typical annual
CEO compensation.
Given that financial distress can cause considerable personal loss for executives, firms
with financial distress risk might have to offer relatively high level of compensation to attract
executives to their firms. Thus, we would expect a positive association between level of
executive compensation and financial distress risk. However, as financial distress risk
increases, creditors, shareholders and other stakeholders can increase their monitoring and put
pressure on firms to reduce the levels of executive compensation (Gilson, 1990).
Furthermore, firms with high financial distress risk might be too cash constrained to offer
high levels of executive compensation (Henderson, 2006). Thus, we could observe either a
positive or a negative relation between the level of executive compensation and financial
distress risk depending on which effect is dominating.
Financial distress risk can also influence executive compensation structure leading to an
increase or decrease in the fraction of equity-based compensation. The risk of bankruptcy and
3 See, for instance, Senbet and Wang (2010).
4
potential job loss are considered to provide strong managerial incentives for effort, since a
bankruptcy can lead to major personal losses, including the loss of private benefits,
reputation, and specialized human capital (Grossman and Hart 1982; Gilson 1989). As
financial distress risk increases, agency costs that explain potential rent-seeking on the part of
executives are reduced (Henderson, 2006). Thus, managers in firms with high financial
distress risk would need less equity-based compensation to align their interests with the
interests of shareholders. Furthermore, in a firm with high financial distress risk, equity-
based compensation can influence managers’ incentives to choose investment strategies that
might increase shareholders’ wealth at the expense of debt holders’ value. Rational debt
holders would consider executive compensation structure as influencing executives’
incentives when they price debt issues. Thus, we would expect that firms offer their
executives lower fraction of equity-based compensation as firms’ financial distress risk
increases.
Alternatively, executives’ concerns about their potential loss of human capital might cause
them to take a more risk-averse approach in their selection of investment projects than
shareholders would otherwise prefer. For instance, executives might avoid investment in
risky projects (e.g., R&D projects, new product development) even when those projects might
maximize shareholder wealth. Thus, firms with financial distress risk can provide additional
risk-taking incentives by increasing fraction of equity-based compensation. Consequently,
this would lead to a positive relation between financial distress risk and the fraction of equity-
based compensation.
To sum up, it is unclear, ex ante, whether financial distress risk could have a positive or
negative impact on the level of total compensation and the fraction of equity-based
compensation. Thus, whether firms with high financial distress risk offer higher or lower level
of executive compensation and the fraction of equity-based compensation is ultimately an
5
empirical question. This study seeks to provide evidence on how financial distress risk
influences executive compensation contracts by focusing on the following questions: Do
firms with high financial distress risk offer relatively low level of compensation to their newly
hired executives since creditors’ and shareholders’ activism would put a downward pressure
on compensation? Do firms offer a lower fraction of equity-based compensation if they have
high financial distress risk? Do institutional investors take a more active monitoring role for
determining the level and structure of executive compensation in firms with high financial
distress risk? Our study provides new insights by investigating the relationship between
financial distress risk and executive compensation in a set up that considerably differs from
the US in terms of degree of protection offered to creditors4.
We examine the cash and equity-based compensation of 3,697 newly appointed
executives from 1,141 UK-listed non-financial firms over the period 1998 to 2009. For our
empirical analysis, we employ three alternative measures of financial distress risk, which are
based on the Merton (1974) structural model of default, the accounting based z-score model
of Altman (1968), and the hazard type default prediction model of Chava and Jarrow (2004),
which incorporates both market and accounting based variables.
Our results show that financial distress risk has a negative and significant impact on
the level of executive compensation. This finding is consistent with creditors and other
stakeholders increasing their monitoring and putting a check on the level of total
compensation. Creditors can have more incentives to provide monitoring for firms with high
financial distress risk. In particular, in an environment where there is a relatively strong
protection of creditors, they can bargain over executive compensation since executive
incentives may play an important role in capturing and expanding the firm’s going concern
4 See Franks, Nyborg, and Torous (1996), Kaiser (1996), Franks and Sussman (2005) for differences between
UK and US insolvency codes.
6
value. Our findings also indicate that financial distress risk has a negative impact on the
fraction of equity-based compensation. This finding is consistent with the argument that
creditors could press for a change in the compensation structure reducing the fraction of
equity-based compensation which aligns interests of executives with those of shareholders
(John and John, 2003). Our results also support the hypothesis that risk-averse executives at
firms with high financial distress risk might be reluctant to take on high fraction of equity-
based compensation, and thereby increase the risk of their compensation.
We find that higher level of institutional ownership is associated with a higher fraction
of equity-based compensation and higher level of total compensation. Our findings are
consistent with the results from previous studies suggesting that executives would require
higher level of compensation for being under pressure to perform and work harder in firms
with higher institutional ownership. Further, institutional blockholders seem to increase the
level of total compensation and fraction of equity-based compensation in firms with high
financial distress risk, but the overall impact of institutional blockholder concentration is
negative and significant suggesting that consistent with the anecdotal evidence that
institutional blockholders provide monitoring for executive compensation. When we classify
institutional blockholder concentration into foreign and domestic institutional blockholder
concentration, we observe that both groups of blockholders have negative impact on
executive compensation, but the magnitude of coefficient estimate is bigger for foreign
institutional blockholder concentration. Regardless of presence of financial distress risk level,
foreign institutional blockholders have a negative impact on the level of total compensation
and the fraction of equity-based compensation.
This study makes several contributions to the literature. First, it extends the literature
on executive compensation by focusing on how financial distress risk influences the level and
structure of executive compensation in a set up with strong creditors’ rights. Secondly, we

7
contribute to the literature on institutional investor activism by considering institutional
investors’ monitoring role in firms with financial distress risk. Our findings show that
institutional block holders attempt to increase the level of executive compensation in firms
with high financial distress risk, but overall their impact is negative and statistically
significant. Finally, this study extends the literature on the differences between external and
internal executives. Different from previous studies we investigate whether there is a
difference in the way internally recruited and externally recruited executives are compensated
in firms with high financial distress risk (e.g., Brockman, Lee, and Salas, 2012). Our findings
show that there is no statistically significant difference between the compensations of
externally hired executives and internally promoted executives.
The remainder of this paper is organized as follows. Section 2 presents the related
literature review. Section 3 presents model specification and Section 4 reports sample
statistics. Section 5 presents the results of empirical analysis. Section 6 concludes. The
appendix contains the additional empirical tests.
2. Literature review
2.1. Financial distress risk and executive compensation
Extant literature on the relationship between financial distress risk and executive
compensation has been limited and mainly based on evidence from US, where creditors have
relatively lower legal protection. Gilson and Vetsuypens (1992) provide evidence that firms
systematically restructure their management compensation contracts when they experience
severe financial difficulty. Their sample consists of 77 US firms that either filed for Chapter
11 under the U.S. Bankruptcy Code (29 firms) or privately restructured their debt out of court
(48 firms) over the period 1981-1987. They report that members of the incumbent senior
8
management team incur significant personal losses when their firms are financially distressed.
Their results show that almost one-third of the CEOs in their sample are replaced in a given
year around default, and also those who remain often take substantial cuts in their salary and
bonus. Furthermore, they observe that CEO pay also typically falls when the outgoing CEO is
replaced by another incumbent manager, while outside replacement CEOs typically receive
large grants of stock options as part of their compensation.
Different from Gilson and Vetsuypens (1992), Chang, Hayes and Hillegeist (2009)
focus on the initial level of CEO compensation and stock-based incentives offered to new
CEOs in firms with financial distress risk for a sample of 2,347 new CEOs in ExecuComp
between 1992 and 2007. In their empirical analysis, they use the firm’s ex ante risk of
financial distress as a proxy for CEO’s human capital risk hypothesizing new CEOs in firms
with relatively high financial distress risk demand higher level of compensation as a premium
for bearing higher human capital risk. They find that firms provide new CEOs with fewer
equity-based incentives when financial distress risk is higher. This finding is contrary to the
results from Gilson and Vetsuypens (1992) suggesting that firms with financial distress risk
offer their outside replacement CEOs typically large grants of stock options as part of their
compensation. Thus, limited evidence on how financial distress risk could influence
contracting terms of new CEO compensation is mixed given those contrary findings from
Gilson and Vetsuypens (1992) and Chang, Hayes and Hillegeist (2009). In this paper we aim
to provide further evidence on the impact of financial distress risk on new CEO compensation
for a sample of 1,141UK firms and 3,697 new executives over the period 1998-2009.
Different from previous studies we investigate the relation between financial distress risk,
institutional investors and executive compensation in a country with a debt-friendly
bankruptcy code.
9
2.2. Financial distress risk and compensation structure
Financial distress risk can affect the fraction of equity-based compensation, or simply
compensation structure in several ways. A firm with financial distress risk can have liquidity
concerns, and thereby prefer equity-based compensation since it is cashless and doesn’t add
burden to the already-tight working capital constraints (Henderson, 2007). However, a risk-
averse executive who bears high human capital risk in a firm with high financial distress risk
may be reluctant to take on high fraction of equity-based compensation, and thereby increase
the risk of his current compensation. In addition, the risk of bankruptcy and potential job loss
can provide strong managerial incentives for effort (Grossman and Hart 1982; Gilson 1989)
mitigating the potential agency problems between managers and shareholders. Consequently,
there will be less need for equity-based compensation in those firms with high financial
distress risk.
Limited empirical evidence on how financial distress risk influences the compensation
structure of executives is also mixed. Chang et al. (2009) find that firms with higher default
risk provide new CEOs with less equity-based incentive. This result is consistent with the
view that firms might not use equity-based compensation when they face financial distress
risk which could reduce the agency conflicts between managers and shareholders. Contrary
to Chang et al., Gilson and Vetsuypens (1993) find that high-risk firms tend to offer their
outside replacement CEOs large grants of stock options as part of their compensation. In
particular, outside replacement CEOs with presumed expertise in turnarounds receive more
stock options than either insiders or other outsiders.
As financial distress risk increases, agency problems that arise from potential conflicts
of interests between shareholders and creditors can increase, while those between
shareholders and managers can decrease. The tradeoff between the two agency costs in turn
10
exerts a significant impact on optimal compensation structure (John and John, 1993). The
agency problems facing a firm with high financial distress risk are likely to be very different
from a firm with a substantial, but still relatively small, financial distress risk. Douglas (2006)
shows theoretically that shareholder-bondholder conflict is the main concern when the firm
experiences poor performance implying presence of potential financial distress risk, and the
shareholder-executive conflict is the main concern when the firm is doing well implying a
relatively low financial distress risk. Thus, we would expect that executives in firms with high
financial distress risk receive a lower fraction of equity-based compensation, if manager-
shareholder conflicts are relatively less important.
2.3. Executive compensation, financial distress risk and institutional Investors
Institutional investors have considerably increased their share ownership in the UK equity
market for the last couple of decades. According to the Office for National Statistics (ONS)
(2012), at the end of 2008 institutional ownership accounts for 74.2% of UK equity held by
domestic investors, as compared to 32.6% in 1936. In our sample, the fraction of institutional
ownership in the total UK corporate equity has increased from 40.9% in 1998 to 46.4% in
2009. UK institutional investors are becoming more active in overseeing corporate
governance issues. Given typically large amount of investment at stake, institutional investors
tend to have more incentives to monitor the firms of interest. The benefits they receive from
monitoring are more likely to exceed the costs (Shleifer and Vishny, 1986).
Aggarwal et al. (2010) find that firms with higher institutional ownership are more
likely to terminate poorly performing Chief Executive Officers (CEOs) using a sample of
firms from 23 countries during the period from 2003-2008. Thus, executives could demand
higher risk premium, i.e. higher compensation, at firms with high institutional ownership
(Croci et al. (2012), Fernandes et al. (2012)). Gillan and Starks (2003) emphasize the

11
important role that institutional investors, in particular foreign institutional investors, play in
improving corporate governance across countries. Foreign institutions are often viewed as
being more capable of taking an active stance without having any loyal attachment to
management, while domestic institutional investors with potential business ties to
management can be less active in initiating good governance practices. Ferreira and Matos
(2008) report that foreign institutional ownership is positively related to firm value and
performance for a sample of firms from ...countries, suggesting that foreign institutional
investors can play an active monitoring role contributing to higher firm value. We aim to
extend the extant literature on institutional investors by examining their monitoring role in
firms with financial distress risk. As a proxy for measuring the impact of institutional
investors, we use total institutional ownership and institutional blockholder concentration.
3. Data
Our sample consists of 3, 697 new-executive observations including both new CEOs
and new executive directors from 1,141 UK-listed non-financial firms over the period 1998 to
2009. Our sample of 1,141 firms is an unbalanced panel in that firms join only when they hire
new executives in a certain year during the sample period. Executive compensation data
including salaries, bonuses, long term incentive plans (LTIPs) and option grants are obtained
from BoardEx5. Cash compensation is the sum of salary and cash bonuses, while equity-
based compensation is the sum of value of shares and options granted during a year. The
value of stock options is calculated using the Black-Sholes model during the vesting period
and therefore it is the estimated value of options awarded instead of their intrinsic value.
5BoardEx is a leading database for academic research concerning corporate governance and boardroom processes in UK. It consolidates in-depth profiles of over 400,000 publicly quoted and large private companies and detailed remuneration and biographic information on top executives and other board members in over 50 countries.
12
Institutional ownership data are obtained from Thomson One Banker and firm -specific
financial and accounting variables are obtained from Datastream.
We restrict our sample to newly appointed executives as a means of eliminating the
confounding effects of prior performance on executive’s current compensation. We employ
cash compensation data for an executive’s first full year in position. As a robustness check we
also employ the grossed up compensation from the first part year in position. Our results are
not materially different. The value of shares and options is taken at the end of the first part
year in employment.
As mentioned previously, we employ three alternative measures of default risk, in this
paper. Our first model is based on the theories of Black and Scholes (1973) and Merton
(1974) (BSM) in which the probability that a firm enters bankruptcy is the probability that the
(book) value of its liabilities exceeds the (market) value of its assets at a point in time. We
employ the method set out in the paper of Hillegeist et al. (2004) to calculate default risk
using this model.
Our second measure of financial distress risk is a discrete time hazard model taken
from Chava and Jarrow (2004), who emphasize importance of industry effects on bankruptcy
prediction.6 We employ their “public firm model with industry effects” (Table 3, page 556).
This model incorporates both market and accounting based variables. Our third measure
employs is the z-score model of Altman (1968) in which the bankruptcy or failure risk of a
firm is based on a linear combination of accounting ratios. The selected ratios reflect a firm’s
working capital position, profitability, gearing and efficiency (with which assets are used to
generate sales). We employ the version of the model reported in Hillegeist et al. (2004) and
6 Different industries face different levels of competition and different industries may have different accounting conventions. Thus the probability of bankruptcy may differ for firms in different industries with otherwise identical balance sheets. (Chava and Jarrow (2004)).
13
Shumway (2001) in which all the coefficients other than Sales/Total Assets are multiplied by
100.
4. Empirical methodology
To examine the relationship between financial distress risk, institutional investors and
executive compensation, we use the following two empirical models:
LnCompensation it = α +β1 Financial distress risk dummyit +β2 Ins Ownit + Control
Variablesit + εit (1)
Ratio of equity-based compensationit = γ + δ1Financial distress risk dummyit +δ2 Ins Ownit +
Control Variablesit + εit (2)
where LnCompensation is the log of total executive compensation, or log of bonuses, or log of
cash compensation, and Ratio of Equity-based compensation is the ratio of equity-based
compensation to total compensation. Our explanatory variables include financial distress risk
dummies, i.e. high financial distress risk dummy and medium financial distress risk dummy,
institutional ownership variables, firm characteristics including log of sales, leverage,
ROA(return on assets), Tobin’s Q, cash holdings/total assets, corporate governance
characteristics including proportion of independent non-executive directors, dummy for CEO,
executive age, executive’s time in role and dummy for externally hired executives. To account
for both year and industry specific shocks, we include both year and industry dummies.
Similar to Hartzell and Starks (2003), we use level and concentration of institutional
ownership to measure for the effect of institutional shareholders on compensation of newly
hired executive in firms with financial distress risk. Institutional investors would have more
incentive to provide intense monitoring as their ownership concentration increases (e.g.,
14
Hartzell and Starks, 2003, and Ozkan, 2010). Thus, we measure the impact of institutional
investors using both total institutional ownership and institutional ownership concentration.
Total Institutional Ownership is the fraction of equity owned by all institutional investors and
Institutional Concentration is the holdings of financial institutions who own 3% or more of
firm’s equity as a percentage of total institutional holdings.
We employ three alternative measures of financial distress risk as previously outlined,
being a model based on the theories of Black and Scholes (1973) and Merton (1974) (BSM), a
discrete time hazard model of Chava and Jarrow (2004) and a z-score model of Altman
(1968). We are particularly interested in the subset of firms with a significant level of financial
distress risk and thus we create two dummy variables RIMed and RIHigh which are equal to
one for the medium and high financial distress risk firms, respectively.
Previous studies report that firm size accounts for the greatest portion of the variation in
executive compensation and it is a key control variable when examining the impact of
financial distress risk on executive compensation. Managing large firms requires more effort
and managerial expertise due to the increased complexity of the investment and operating
decisions. Thus, large firms offer higher level of compensation to attract more talented
executives. We use log of sales as our measure of firm size.
Consistent with agency theory, firm performance is viewed as another key determinant of
executive compensation (e.g., Holmstrom, I979; Tirole, 1988; Jensen and Murphy, 1990).
We use both accounting based and market-based measure of performance, the return on assets
in the year prior to the appointment of the executive (ROAt-1. We use the lagged return on
assets, ROAt-1, to reduce the potential endogeneity between executive compensation and firm
performance (Gregg, Machin and Szymanski, 1993; Palia, 2001). To reduce the agency costs
associated with high leverage (e.g. asset substitution) firms with high leverage may find it
15
optimal to reduce the alignment of executives’ interests with shareholders interests and thus
high leverage would negatively impact the fraction of equity compensation (John and John
(1993)). However, Yermack (1995) reports no significant relation between stock option
grants and leverage.
Cash holdings might reflect the ability of the firm to pay cash compensation while also
contributing to the conflict of interest between executives and shareholders and hence is
crucial in determining the optimal managerial incentives (Jensen, 1986). Following Kaplan
and Zingales (1997) we define cash holdings as cash and short-term investments divided by
the book value of total assets for the financial year prior to the executive’s appointment
(CashHoldingt/TAt-1). Our final firm characteristic is growth opportunities. Smith and Watts
(1992) find that firms’ growth opportunities influence managerial compensation. Firms with
more growth opportunities are likely to use incentive-based compensation since it is more
difficult to observe actions of managers in those firms. Tobin’s Q is used as a proxy for
growth opportunities.
Weisbach (1988) finds that CEOs are more likely to be removed after poor
performance in firms with more independent directors suggesting that independent directors
play an active monitoring role7. To compensate for the utility loss that can be caused by an
intense monitoring, CEOs at firms with more independent boards require higher
compensation (Fernandes et al. (2013), Ozkan (2007)). Hermalin (2005) argues that rising
managerial compensation is a result of intense monitoring of managers by boards and large
shareholders including institutional investors. Conversely, boards might have an incentive to
signal their independence by lowering the level of CEO compensation (Singh, 2006). We use
the ratio of the number of independent non-executive directors to the total number of directors
7 Board independence is proxied by the fraction of independent directors on board. However, the true level of independence is fundamentally unobservable (Hermalin and Weisbach, 2003).
16
as a proxy for board independence. Laux (2008) predicts a positive relationship between
board independence and the fraction of equity compensation. He argues that the stronger the
monitoring by an independent board, the less willing the CEO is to share critical information
that may lead to his own dismissal. This gives the firm an incentive to increase the level of
severance pay to induce truthful communication and higher equity based compensation is
employed to mitigate the reduced effort that higher severance pay would induce. In sum, the
prediction on the relation between board independence and compensation level is mixed while
previous literature suggest a positive relation between board independence and the fraction of
equity compensation.
Murphy (1985) stresses the importance of controlling for executive-specific variables
when studying executive compensation. We employ four executive characteristics variables.
Age is the age of the executive in years which might impact human capital risk given this, in
turn, is a function of compensation. Time in role is the executive’s time in position in years.
The relation between Time in role and executive compensation is expected to be ambiguous
(Ryan and Wiggins, 2001; Ozkan, 2011b) On the one hand, executives with longer tenures are
more likely to be entrenched and have more managerial power which allows them to take an
opportunistic approach and compensate themselves excessively. On the other hand, they
might also have larger share ownership from previous equity grants owing to their longer
tenure aligning their interests with those of shareholders. External is a dummy variable which
equals one if the new executive is hired from outside the company and zero otherwise; while
new internal executives have a larger amount of firm-specific managerial capital at stake, new
external executives are hired solely for their (transferable) managerial ability.8 Gilson and
8 Murphy and Zabojnik (2006) define general managerial ability as managerial skills valuable to all companies, such as financial and accounting expertise as well as management skills. Firm-specific managerial capital in contrast refers to those skills, experience and knowledge valuable only to the specific organization, such as connection with colleagues and clients and familarity with the culture and regulations of a specific company.
17
Vetsuypens (1993), Murphy (2002) and Murphy and Zabojnik (2006) all show that executives
hired from the outside earn significantly more than those promoted internally. Murphy and
Zabojnik (2006) interpret this result by arguing that the relative importance of general over
firm-specific managerial ability leads to higher compensation for external hires than internal
hires. Finally, CEO is a dummy variable which equals one for new CEOs and zero for other
new executive directors.
4. Sample statistics and empirical results
4.1. Sample Statistics
We divide our firms into deciles according to each measure of default risk (BSM,
Chava and Jarrow, Altman) and in Table 1 we present the values of compensation by decile.
From Table 1 it is evident that total compensation, cash compensation and equity
compensation decrease as financial distress risk increases. The ratio of equity based
compensation to total compensation follows a similar pattern. Under the BSM default risk
model the mean (median) values of default risk for the 9th decile are 0.99% (0.85%) vs. 0.09%
(0.06%) for the 8th decile i.e. default risk is negligible up to some point in the 8th decile under
the BSM model. Under the Chava and Jarrow model the mean (median) values of default risk
for the 9th decile are 0.53% (0.51%) and 0.35% (0.35%) for the 8th decile.
The Altman model provies a significantly higher measure of default risk however this
is not without precedent. Hillegeist et al. (2004) report that the actual average bankruptcy rate
for solvent firm years is 0.87% vs. an average estimate 13.46% based on the z-score model of
Altman (1968).9 Given our sample is made up for UK listed firms the estimates of default risk
9 The means for the smaller number of bankrupt observations are considerably higher. See Table3, page 16, Hillegiest et al. (2004).

18
under the Altman model are evidently exaggerated, however this does not preclude the model
from being a useful measure of relative bankruptcy risk.
[Insert Table 1 here]
Given the evidence in Table 1 we create subsets of firms in which financial distress
risk is significant. We use a 0.25% probability of default/bankruptcy to separate low-risk
firms from medium risk firms and a 2.5% probability of default/bankruptcy to separate
medium and high risk firms.10 Between 1981 and 2010, the average annual one-year default
rates for European firms with an investment grade S&P rating of BBB (BBB-) are 0.09%
(0.32%), while the average rates for the sub-investment grade B+ (B) rated firms are 1.77%
(4.78%). Our cut-off values fall between each of these average one-year default rates. This
gives us 384 high risk observations and 354 medium risk observations. We similarly allocate
384 (354) firms to the high (medium) risk categories based on the Chava and Jarrow and
Altman models. As a robustness check, we adopt alternative cutoffs based on natural break-
points in our sample distributions under the Chava and Jarrow and Altman measures and find
the results are qualitatively similar.11
Table 2 reports summary statistics for our measures of financial distress risk,
executive compensation and other variables. We observe that the Altman model provides a
significantly higher measure of default risk however this is not without precedent. Hillegeist
et al. (2004) report that the actual average bankruptcy rate for solvent firm years is 0.87% vs.
an average estimate 13.46% based on the z-score model of Altman (1968).12 Given our
10 These cut-off are also employed by Chang et al. (2009). As a robustness check, we adopt alternative cut offs based on our sample distributions via the Chava and Jarrow and Altman measure and find the results are qualitatively similar.
12 The means for the smaller number of bankrupt observations are considerably higher. See Table3, page 16, Hillegiest et al. (2004).
19
sample is made up for UK listed firms the estimates of default risk under the Altman model
are evidently exaggerated, however this does not preclude the model from being a useful
measure of relative bankruptcy risk. We present summary statistics of executive
compensation and explanatory variables in Table 2.
[insert Table 2 here]
Table 2 also shows that on average newly hired executives are 47.7 years old with 1.5
years in role. The average years in role of more than 1 year reflects the fact that we collect
compensation data for the first full fiscal year of each new executive. We observe that 46.2%
of the new executives in our sample are hired from outside the companies.
Average total compensation for our sample of 3,697 newly hired executives is
£564,468 while the median total compensation is £257,145. The considerable difference
between the mean and median for total compensation suggests that our compensation data are
skewed to the right. As a robustness check we adopt two approaches to ensure that our results
are not driven by outliers. First, we re-estimate regressions using median regression which is
widely used in the literature to deal with outliers in compensation levels (Aggarwal and
Samwick, 1999; Conyon and Murphy, 2000). Second, we re-estimate our models using firm
average observations following Core et al. (1999). That is, we average all the observations of
a given firm and run regressions using the averages of observations. These procedures allow
us to mitigate measurement error and the impact of outliers. In both cases, we find results are
consistent suggesting that extreme values do not drive our results.
The average equity-based compensation is £265,096 while the median equity based
compensation is £30,528. The large gap between the mean and median equity compensation
results from the fact that not all firms in our sample pay their executives with equity-based
compensation. Even firms that use equity-based compensation do not necessarily grant equity
based compensation every year. 1,489 new executives in our sample do not receive any equity
20
based pay, which accounts for more than 40% of the total sample. We employ a Tobit
regression with censoring at zero to estimate compensation structure (equity to total
compensation) following previous literature (Yermack, 1995; Fernandes et al., 2013).
Empirical Results In Table 3, Panel A reports the estimation results for log of bonuses and log of cash
compensation for our sample of 1,141 firms and 3.697 new executives during the period
1998-2009. Our main variables of interest are high and medium financial distress risk
dummies. We observe that new executives at firms with medium and high financial distress
risk receive relatively lower bonuses and cash compensation than those executives at firms
with low financial distress risk controlling for firm-specific and executive-specific variables.
These results contrast with the hypothesis that executives at firms with high financial distress
risk would have higher level of compensation since they take a human capital risk when they
agree to take an executive role at those firms. For our three different measures of financial
distress risk, the coefficient estimates for high and medium financial distress risk dummies in
column (1) to column (3) are negative and statistically significant. Similarly, we find that the
coefficient estimates for high and medium financial distress risk dummies for cash
compensation regressions in column (4) to column (6) are negative and statistically significant
for BSM and C&J measures of risk, but they are not statistically significant for the Altman
measure of financial distress risk. We can interpret this finding as creditors’ taking active role
to put a downward check on the level of total compensation.
Table 3, Panel B, column (1) to column (3) reports estimation results for log of total
compensation. Similar to our results from bonus and cash compensation in Panel A, we
observe a negative relationship between total compensation and financial distress risk. In UK

21
where creditors’ protection is stronger than in US, presence of financial distress risk leads to
lower level of bonus, cash and total compensation.
We do not observe any significant relation between executive age and level of total
compensation. Older executives receive lower fraction of equity-based compensation. Time
in role (tenure) does not seem to have a significant impact on the level or fraction of equity-
based compensation. Our findings do not suggest that externally hired executives receive
higher level of compensation than internally hired executives. Our results indicate that
higher proportion of independent directors lead to higher level of compensation and also
higher fraction of compensation.
[insert Table 3 here]
In columns (3) to (6), we test the impact of financial distress risk on the structure of
executive compensation. For both BSM and C&J measures of financial distress risk, we
observe a negative and significant and significant relation between the fraction of equity-
based compensation and the presence of high financial distress risk, while we do not observe
any significant impact of the dummy for high financial distress risk for Altman’s measure.
Our finding of negative coefficient estimate for RI high dummy is consistent with the
hypothesis that firms with high financial distress risk would offer lower equity-based
compensation in their attempt to avoid asset substitution problem. Higher fraction of equity-
based compensation can lead to higher risk taking which could serve the interests of
shareholders at the expense of debt holders’ wealth13.
[insert Table 4 here]
In Table 4, Panel (A), column (1) and (2), we test whether the presence of high and
medium level of financial distress risk can influence level of compensation in a different way
13
We also use fixed effects regressions to control for unobservable firm-specific fixed effects, but our results remain similar.
22
for CEOs and other directors14. Our findings show that firms with high financial distress risk
offer both their CEOs and other executive directors relatively lower level of total
compensation. For firms with medium financial distress risk, executive directors seem to
experience a decline in their compensation while the impact on CEO’s compensation is not
statistically significant for the BSM measure of financial distress risk. Further, we observe
that the coefficient estimate for high financial distress risk dummy is negative and significant
using BSM and C&J measures for both internally and externally hired executives. For
Altman’s measure, it is negative, but not significant. In column (5) and (6), we test whether
the impact of financial distress risk on total compensation vary with executive age. We
classify our sample of newly hired executives into two classes; executives with age above the
median (‘old’ executives) and those with age below the median (‘young’ executives). Our
results show that both ‘old’ and ‘young’ executives receive lower level of compensation in
firms with high financial distress risk firms. However, the magnitude of coefficient estimate
for financial distress risk dummies is relatively lower for ‘young’ executives.
In Panel B, column (1) and (2), we report estimation results for the fraction of equity-
based compensation. For both CEOs and other executive directors, we observe that presence
of high financial distress risk has a negative impact on the fraction of equity-based
compensation. For medium financial distress risk firms, the coefficient estimate is still
negative but statistically significant, in general.
In Table 5, we test whether institutional monitoring can play a significant role in
determining the level and structure of executive compensation in firms with high financial
distress risk. Controlling for total institutional level, we observe that institutional ownership
concentration has a negative and significant impact on the level and structure of executive
14
For brevity, we only report coefficient of estimates for medium and high financial distress risk dummies.
23
compensation. However, when we consider the impact of institutional ownership
concentration on executive compensation with high financial distress risk, we observe that the
sum of the coefficient estimates for interaction term of RI high and institutional ownership
concentration is positive. Thus, institutional blockholders seem to raise the level and fraction
of equity-based compensation in firms with high financial distress risk.
[Insert Table 5 here]
In Table 6, we investigate whether the impact of foreign and domestic institutional
investors on total compensation and fraction of equity-based compensation varies depending
on financial distress risk. We find that both domestic and foreign institutional ownership
concentration have a negative and significant impact on the level of total compensation and
fraction of equity-based compensation. The impact of foreign institutional ownership
concentration on the level of total compensation does not vary depending on whether we
consider medium financial distress risk firms or high financial distress risk firms. Overall, the
impact of foreign and institutional ownership concentration on the level of total compensation
in medium and high financial distress risk firms is negative and significant. In Table 6,
column (4) to (6), we observe that concentration of foreign and domestic institutional
ownership and fraction of equity-based compensation are negatively related.
[Table 6]
Conclusion
This paper investigates the relationship between financial distress risk, executive
compensation and institutional investors in UK firms. One distinctive characteristics of the
UK is that it has a debt-friendly bankruptcy code, which could have implications for the
nature of monitoring creditors can provide for firms with financial distress risk. On the one
hand, strong creditor presence in firms with high financial distress risk can put a downward
pressure on the level of executive compensation, and we could observe a negative relation

24
between executive compensation and financial distress risk. Further, institutional investors as
major shareholders in UK firms can also put a check on executive compensation packages in
firms with high financial distress risk. On the other hand, newly hired executives at a firm
with high financial distress risk can demand premium for their career risk (or human capital
risk) since they might face a higher level of career risk when they take up an executive role at
a firm with high financial distress risk. If financial distress risk can turn into a bankruptcy,
executives will suffer from loss of reputation and wealth. In a country with debt-friendly
bankruptcy code, the likelihood of bankruptcy could be relatively higher for a firm with high
financial distress risk (Claessens and Klapper, 2005).
Using a sample of 1,141 UK listed non-financial firms and 3,697 newly hired
executive, we find that executives receive relatively lower total compensation and lower
fraction of equity-based compensation in firms with high financial distress risk. Our results
show that institutional ownership concentration has a positive and significant impact on the
level of total compensation and fraction of equity-based compensation, but their overall
impact is negative and significant.
25
Reference:
Acharya, V.V., Sundaram, R.K., John, K., 2011. Cross-country variations in capital structures: The role of bankruptcy codes. Journal of Financial Intermediation 20, 25–54.
Aggarwal, R., Samwick, A., 1999. The other side of the trade-off: The impact of risk on executive compensation. Journal of Political Economy 107, 65-104. Altman, E.I., 1968. Financial ratios, discriminant analysis and the prediction of corporate bankruptcy. Journal of Finance 23, 589–609.
Berk, J.B., Stanton, R., Zechner, J., 2010. Human capital, bankruptcy, and capital structure. Journal of Finance 65, 891–926.
Black, F., Scholes, M., 1973. The pricing of options and corporate liabilities. Journal of Political Economy 81, 637–654.
Brockman, P., Lee, H.S., Salas, J.M., 2012. CEO compensation and the role of in-house experience. Working paper.
Chang, W.J., Hayes, R.M., Hillegeist, S.A., 2009. Human capital risk and initial CEO compensation contracts. Working paper. Chava, S., Jarrow, R.A., 2004. Bankruptcy prediction with industry effects. Review of Finance 8, 537–569.
Chemmanur, T.J., Cheng, Y.M., Zhang, T.M., 2013. Human capital, capital structure, and employee pay: An empirical analysis. Journal of Financial Economics 110, 478–502.
Claessens, S., Klapper, L.F., 2005. Bankruptcy around the world: Explanations of its relative use. American Law and Economics Review 7, 253-283.
Conyon M.J., Murphy, K.J., 2000. The prince and the pauper? CEO pay in the United States and the United Kingdom. The Economic Journal 110, 640-671.
Core, J.E., Holthausen, R.W., Larcher, D.F., 1999. Corporate governance, chief executive officer compensation, and firm performance. Journal of Financial Economics 51, 371-406.
Croci, E., Gonenc, H., Ozkan, N., 2012. CEO compensation, family control, and institutional investors in continental Europe, Journal of Banking and Finance 36, 3318-3335. Davydenko, S.A., Franks, J.R., 2008. Do bankruptcy codes matter? A study of defaults in France, Germany, and the U.K. Journal of Finance 63, 565–608.
Douglas, A.V., 2006. Capital structure, compensation and incentives. The Review of Financial Studies 19, 605-632. Eckbo, B.E., Thorburn, K.S., Wang, W., 2012. How costly is corporate bankruptcy for top executives? Tuck School of Business Working Paper No. 2012-109.
Fernandes, N., Ferreira, M.A., Matos, P., Murphy, K.J., 2013. Are US CEOs paid more? New international evidence. Forthcoming in the Review of Financial Studies.
26
Ferreira, M., Matos, P., 2008. The colours of investors’ money: The role of institutional investors around the world. Journal of Financial Economics 88, 499–533.
Franks, J.R., Nyborg, K.G., Torous, W.N., 1996. A comparison of US, UK, and German insolvency codes. Financial Management 25, 86-101.
Franks, J.R., Sussman, O., 2005. Financial innovations and corporate bankruptcy. Journal of Financial Intermediation 14, 283–317.
Gillan, S.L., Starks, L.T., 2003. Corporate governance, corporate ownership, and the role of institutional investors: A global perspective. Journal of Applied Finance 1, 4 – 22.
Gilson, S.C., 1989. Management turnover and financial distress. Journal of Financial Economics 25, 241-262. Gilson, S.C., 1990. Bankruptcy, boards, banks, and blockholders: Evidence on changes in corporate ownership and control when firms default. Journal of Financial Economics 27, 255-287.
Gilson, S.C., Vetsuypens, M.R., 1993. CEO compensation in financially distressed firms: An empirical analysis, The Journal of Finance, 48 (2), 425-458.
Gregg, P., Machin, S., Szymanski, S., 1993. The disappearing relationship between directors' pay and corporate performance. British Journal of Industrial Relations, 31, 1-10. Grossman, S.J., Hart, O., 1982. Corporate financial structure and managerial incentive, in J. McCall, ed.: The Economics of Information and Uncertainty, University of Chicago Press, Chicago.
Hartzell, J.C., Starks, L.T., 2003. Institutional investors and executive compensation. Journal of Finance 58, 2351-2374. Henderson, M.T., 2007. Paying CEOs in bankruptcy: Executive compensation when agency costs are low. Northwestern University Law Review 101, 1543-1618.
Hermalin, B.E., 2005. Trends in corporate governance. The Journal of finance 60, 2351-2384.
Hermalin, B.E., Weisbach, M.S., 2003. Boards of directors as an endogenously determined institution: A survey of the economic literature. Economic Policy Review 9, 7-26.
Hillegeist, S.A., Keating, E., Cram, D.P., Lunstedt, K.G., 2004. Assessing the probability of bankruptcy, Review of Accounting Studies 9, 5-34. Holmstrom, B., 1979. Moral hazard and observability. The Bell Journal of Economics 10, 74-91.
Jensen, M.C., Murphy K.J., 1990. Performance pay and top-management incentives. Journal of Political Economy, 98, 225-264. Jensen, M.C., 1986. Agency costs of free cash flow, corporate finance, and takeovers. American Economic Review 76, 323-329.
27
John, T.A., John, K., 1993. Top-management compensation and capital structure, The Journal of Finance 48, 949-974.
Kaiser, K. 1996. European bankruptcy laws: Implications for corporations facing financial distress. Financial Management 25, 67-85. Kaplan, S.N., Zingales, L., 1997. Do investment-cash flow sensitivities provide useful measures of financial constraints? The Quarterly Journal of Economics, 169-215. Laux, V., 2008. Board independence and CEO turnover. Journal of Accounting Research 46, 137-171. Merton, R.C., 1974. On the pricing of corporate debt: The risk structure of interest rates. Journal of Finance 29, 449-470. Murphy, K.J., Zabojnik, J., 2006. Managerial capital and the market for CEOs. Working Papers 1110, Queen's University, Department of Economics.
Murphy K.J., 1985. Corporate performance and managerial remuneration: An empirical analysis. Journal of Accounting and Economics 7, 11-42. Murphy K.J., 2002. Explaining executive compensation: Managerial power versus the perceived cost of stock options. The University of Chicago Law Review 69, 847-869.
ONS, 2012. A report on ownership of shares as at 31st December 2010. HMSO, London.
Ozkan, N., 2007. Do corporate governance mechanisms influence CEO compensation? An empirical investigation of UK companies. Journal of Multinational Financial Management 17, 349-364.
Ozkan, N., 2011. CEO compensation and firm performance: An empirical investigation of UK panel data. European Financial Management, 349-364. Palia, D., 2001. The endogeneity of managerial compensation in firm valuation: A solution. The Review of Financial Studies 14, 735-764. Ryan, H.E., Wiggins, R.A., 2001. The influence of firm and manager-specific characteristics on the structure of executive compensation. Journal of Corporate Finance 7, 101-123.
Ryan, H.E., Wiggins, R.A., 2004. Who is in whose pocket? Director compensation, board independence, and barriers to effective monitoring. Journal of Financial Economics 73, 497-524.
Senbet, L.W., Wang, T.Y., 2010. Corporate financial distress and bankruptcy: A survey. Foundations and Trends in Finance 5, 243-335.
Shleifer, A., Vishny, R., 1997. A survey of corporate governance. Journal of Finance 52, 737-783. Shumway, T., 2001. Forecasting bankruptcy more accurately: A simple hazard model. Journal of Business 74, 101-124.

28
Singh, R., 2006. Board independence and the design of executive. Harvard NOM Working Paper No. 673741.
Smith, C.W., Watts, L.R., 1992. The investment opportunity set and corporate financing, dividend, and compensation policies. Journal of Financial Economics 32, 263–292.
Tirole, J., 1988. The theory of industrial organization. MIT Press.
Weisbach, M.S., 1988. Outside directors and CEO turnover. Journal of Financial Economics 20, 431-460. Yermack, D., 1995, Do corporations award stock options effectively? Journal of Financial Economics 39, 237-269.

29
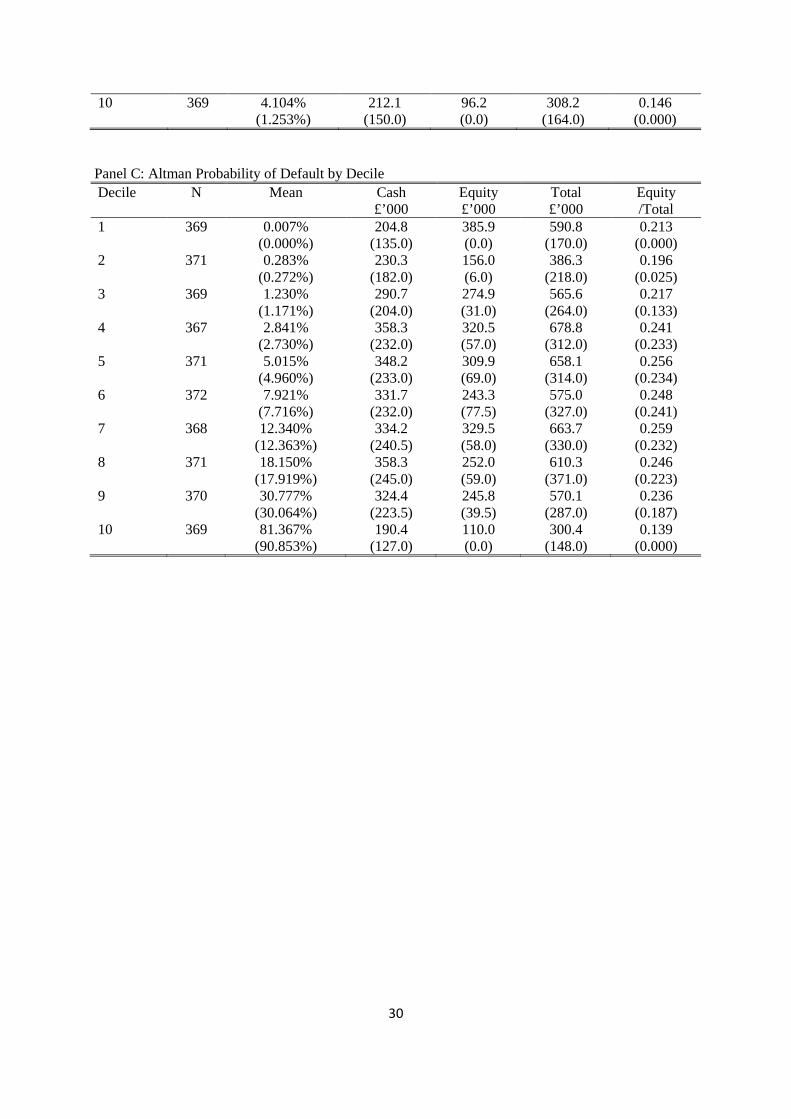
Table1. Descriptive statistics for deciles of compensation and financial distress risk
This table presents the summary statistics of our default risk measures and the mean (median) of executive compensation variables by decile. Compensation data are reported in thousand pounds after adjustment for inflation with the base year of 2005. Results shown in panel A is based on Altman (1968) probability of bankruptcy, penal B on Hillegeist et al. (2004) BSM probability of bankruptcy and panel C on Chava and Jarrow (2004) hazard model. Panael A: BSM Probability of Default by Decile Decile N Mean Cash-based
compensation £’000
Equity-based compensation
£’000
Total compensation
£’000
Equity /Total
1 370 0.000% (0.000%)
247.4 (178.0)
198.0 (8.0)
445.4 (224.5)
0.218 (0.072)
2 367 0.000% (0.000%)
309.1 (220.0)
438.7 (85.0)
747.9 (338.0)
0.291 (0.268)
3 373 0.000% (0.000%)
340.3 (240.0)
408.9 (77.0)
749.2 (333.0)
0.264 (0.271)
4 370 0.000% (0.000%)
332.2 (221.5)
270.2 (49.0)
602.5 (290.5)
0.244 (0.206)
5 370 0.000% (0.000%)
304.1 (210.0)
264.3 (39.5)
568.4 (257.0)
0.238 (0.180)
6 367 0.000% (0.000%)
347.2 (241.0)
322.4 (74.0)
669.6 (333.0)
0.255 (0.229)
7 372 0.007% (0.005%)
297.3 (197.0)
188.8 (21.0)
486.1 (247.0)
0.205 (0.100)
8 367 0.090% (0.062%)
318.9 (193.0)
297.4 (31.0)
616.2 (254.0)
0.216 (0.144)
9 371 0.993% (0.848%)
250.9 (173.0)
148.4 (5.0)
399.4 (208.0)
0.176 (0.023)
10 370 12.792% (7.822%)
224.4 (152.5)
91.3 (0.0)
315.6 (170.0)
0.144 (0.000)
Panel B: C&J Probability of Default by Decile Decile N Mean Cash
£’000 Equity £’000
Total £’000
Equity /Total
1 368 0.060% (0.062%)
322.1 (195.0)
637.1 (47.5)
959.2 (290.0)
0.284 (0.244)
2 372 0.096% (0.096%)
292.3 (191.5)
264.8 (44.0)
557.2 (265.5)
0.240 (0.212)
3 369 0.125% (0.126%)
318.7 (203.0)
230.0 (38.0)
548.7 (266.0)
0.235 (0.168)
4 370 0.152% (0.151%)
325.1 (238.0)
243.6 (74.5)
568.7 (323.0)
0.255 (0.250)
5 368 0.185% (0.185%)
325.2 (221.0)
390.1 (59.0)
715.3 (321.0)
0.266 (0.229)
6 370 0.227% (0.226%)
313.0 (213.5)
220.8 (40.0)
533.8 (271.5)
0.226 (0.207)
7 370 0.277% (0.277%)
293.8 (206.5)
193.7 (37.0)
487.5 (251.0)
0.209 (0.137)
8 371 0.354% (0.351%)
308.9 (202.0)
178.2 (31.0)
487.1 (263.0)
0.203 (0.164)
9 370 0.525% (0.508%)
260.3 (188.0)
174.6 (8.0)
434.9 (227.5)
0.188 (0.068)
30
10 369 4.104% (1.253%)
212.1 (150.0)
96.2 (0.0)
308.2 (164.0)
0.146 (0.000)
Panel C: Altman Probability of Default by Decile Decile N Mean Cash
£’000 Equity £’000
Total £’000
Equity /Total
1 369 0.007% (0.000%)
204.8 (135.0)
385.9 (0.0)
590.8 (170.0)
0.213 (0.000)
2 371 0.283% (0.272%)
230.3 (182.0)
156.0 (6.0)
386.3 (218.0)
0.196 (0.025)
3 369 1.230% (1.171%)
290.7 (204.0)
274.9 (31.0)
565.6 (264.0)
0.217 (0.133)
4 367 2.841% (2.730%)
358.3 (232.0)
320.5 (57.0)
678.8 (312.0)
0.241 (0.233)
5 371 5.015% (4.960%)
348.2 (233.0)
309.9 (69.0)
658.1 (314.0)
0.256 (0.234)
6 372 7.921% (7.716%)
331.7 (232.0)
243.3 (77.5)
575.0 (327.0)
0.248 (0.241)
7 368 12.340% (12.363%)
334.2 (240.5)
329.5 (58.0)
663.7 (330.0)
0.259 (0.232)
8 371 18.150% (17.919%)
358.3 (245.0)
252.0 (59.0)
610.3 (371.0)
0.246 (0.223)
9 370 30.777% (30.064%)
324.4 (223.5)
245.8 (39.5)
570.1 (287.0)
0.236 (0.187)
10 369 81.367% (90.853%)
190.4 (127.0)
110.0 (0.0)
300.4 (148.0)
0.139 (0.000)
31
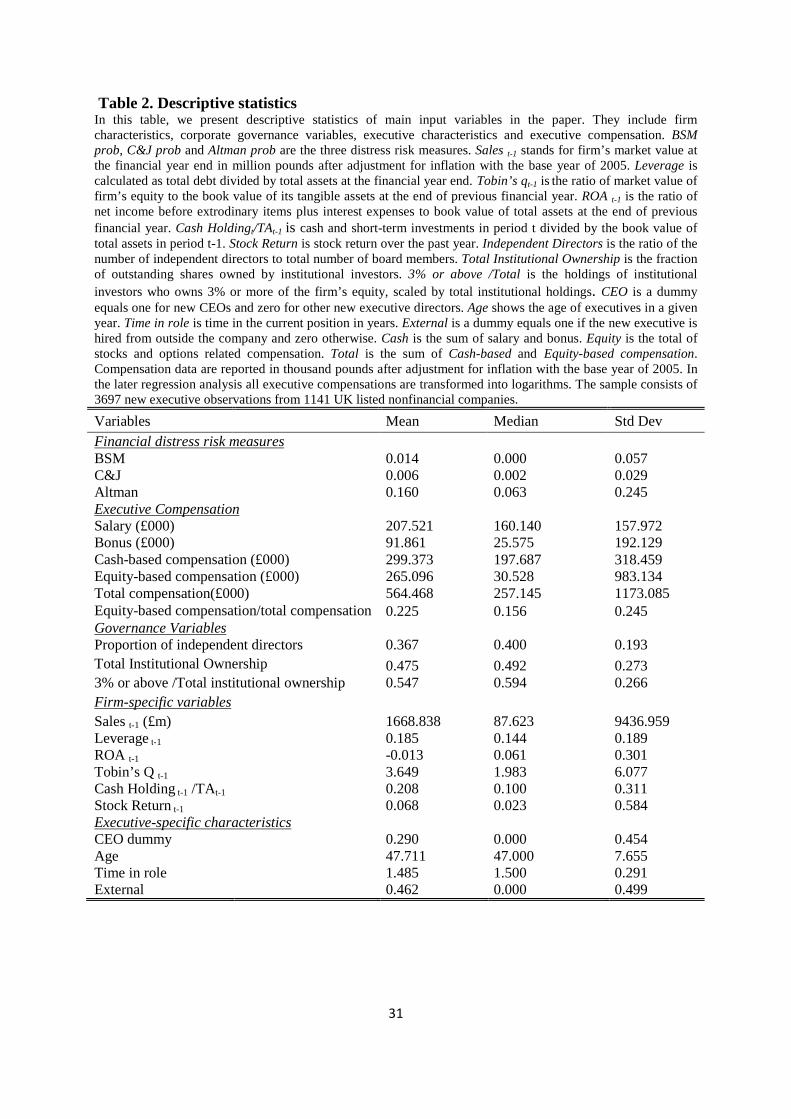
Table 2. Descriptive statistics In this table, we present descriptive statistics of main input variables in the paper. They include firm characteristics, corporate governance variables, executive characteristics and executive compensation. BSM prob, C&J prob and Altman prob are the three distress risk measures. Sales t-1 stands for firm’s market value at the financial year end in million pounds after adjustment for inflation with the base year of 2005. Leverage is calculated as total debt divided by total assets at the financial year end. Tobin’s qt-1 is the ratio of market value of firm’s equity to the book value of its tangible assets at the end of previous financial year. ROA t-1 is the ratio of net income before extrodinary items plus interest expenses to book value of total assets at the end of previous financial year. Cash Holdingt/TAt-1 is cash and short-term investments in period t divided by the book value of total assets in period t-1. Stock Return is stock return over the past year. Independent Directors is the ratio of the number of independent directors to total number of board members. Total Institutional Ownership is the fraction of outstanding shares owned by institutional investors. 3% or above /Total is the holdings of institutional investors who owns 3% or more of the firm’s equity, scaled by total institutional holdings. CEO is a dummy equals one for new CEOs and zero for other new executive directors. Age shows the age of executives in a given year. Time in role is time in the current position in years. External is a dummy equals one if the new executive is hired from outside the company and zero otherwise. Cash is the sum of salary and bonus. Equity is the total of stocks and options related compensation. Total is the sum of Cash-based and Equity-based compensation. Compensation data are reported in thousand pounds after adjustment for inflation with the base year of 2005. In the later regression analysis all executive compensations are transformed into logarithms. The sample consists of 3697 new executive observations from 1141 UK listed nonfinancial companies.
Variables Mean Median Std Dev Financial distress risk measures BSM
0.014 0.000 0.057
C&J
0.006 0.002 0.029 Altman
0.160 0.063 0.245
Executive Compensation Salary (£000) 207.521 160.140 157.972 Bonus (£000) 91.861 25.575 192.129 Cash-based compensation (£000) 299.373 197.687 318.459 Equity-based compensation (£000) 265.096 30.528 983.134 Total compensation(£000) 564.468 257.145 1173.085 Equity-based compensation/total compensation 0.225 0.156 0.245 Governance Variables Proportion of independent directors 0.367 0.400 0.193 Total Institutional Ownership 0.475 0.492 0.273 3% or above /Total institutional ownership 0.547 0.594 0.266 Firm-specific variables Sales t-1 (£m) 1668.838 87.623 9436.959 Leverage t-1 0.185 0.144 0.189 ROA t-1 -0.013 0.061 0.301 Tobin’s Q t-1 3.649 1.983 6.077 Cash Holding t-1 /TAt-1 0.208 0.100 0.311 Stock Return t-1 0.068 0.023 0.584 Executive-specific characteristics CEO dummy
0.290 0.000 0.454
Age
47.711 47.000 7.655 Time in role 1.485 1.500 0.291 External
0.462 0.000 0.499
32
Table 3. Executive compensation and financial distress risk In this table, we examine the relationship between financial distress risk and executive compensation. The dependent variables are the logarithm of bonus and cash compensation for Panel A and total compensation and the fraction of equity compensation for Panel B. We use pooled cross sectional (OLS) regressions to estimate compensation levels and Tobit regressions to estimate compensation structure (i.e., the fraction of equity compensation in total compensation). RIMed and RIHigh are the two dummies for medium and high levels of risky firms respectively. The three risk indicators include Hillegeist et al (2004) BSM model, Chava and Jarrow (2004) hazard model and Altman (1968) Z-score model. Ln(Sales) t-1 is the log of sales adjusted for inflation. Leverage is calculated as total debt divided by total assets at the financial year end. Tobin’s qt-1 is the ratio of market value of firm’s equity to the book value of its tangible assets at the end of previous financial year. ROA t-1 is the ratio of net income before extrodinary items plus interest expenses to book value of total assets at the end of previous financial year. Cash Holdingt/TAt-1 is cash and short-term investments in period t divided by the book value of total assets in period t-1. Stock Return is stock return over the past year. Independent Directors is the ratio of the number of independent directors to total number of board members. Total Institutional Ownership is the fraction of outstanding shares owned by institutional investors. 3% or above /Total is the holdings of institutional investors who owns 3% or more of the firm’s equity, scaled by total institutional holdings. CEO is a dummy for new CEOs. Age shows the age of executives in a given year. Time in role is time in the current position in years. External is a dummy equals one if the new executive is hired from outside the company and zero otherwise. All regressions include industry and year dummies. The sample consists of 3697 new executive observations from 1141 UK listed nonfinancial companies. t-statistics are based on robust standard errors clustered at the firm level. ‘*’, ‘**’ and ‘***’ denote significance at 10%, 5% and 1% level respectively. Year and industry-level dummies results are suppressed. Industry dummy variables are based on 12 Fama-French industries. Panel A. Cash compensation and financial distress risk Variables Ln (Bonuses) Ln (Cash Compensation) BSM C&J Altman BSM C&J Altman
(1) (2) (3) (4) (5) (6) Intercept 1.575 1.597 1.615 10.568*** 10.585*** 10.566***
(1.17) (1.19) (1.19) (58.07) (58.50) (57.73) RIMed -1.436*** -1.031*** -1.509*** -0.099** -0.093** -0.039
(-4.06) (-2.63) (-3.62) (-2.46) (-2.49) (-0.87) RIHigh -2.636*** -2.411*** -1.347*** -0.176*** -0.246*** -0.084
(-7.05) (-5.89) (-3.57) (-4.12) (-5.03) (-1.57) Ln(Sales) t-1 0.258*** 0.253*** 0.246*** 0.054*** 0.053*** 0.053***
(6.60) (6.43) (6.17) (7.61) (7.57) (7.50) Leverage 0.356 0.830 0.669 0.181** 0.249*** 0.173**
(0.53) (1.18) (0.94) (2.11) (2.85) (1.98) ROAt-1 0.910** 0.992*** 0.769** 0.025 0.023 0.019
(2.47) (2.73) (2.03) (0.52) (0.46) (0.36) Tobin’s Qt-1 0.038** 0.069*** 0.036* 0.004 0.007** 0.004
(2.05) (3.43) (1.96) (1.40) (2.52) (1.47) CashHoldingt/TAt-1 1.030** 1.094** 1.164** 0.016 0.013 0.025
(2.31) (2.44) (2.53) (0.19) (0.16) (0.30) Stock Return t-1 0.978*** 1.023*** 1.203*** 0.060*** 0.053** 0.076***
(4.26) (4.35) (5.01) (2.62) (2.32) (3.33) Independent directors t-1 2.385*** 2.283*** 2.451*** 0.726*** 0.712*** 0.730***
(3.55) (3.33) (3.58) (8.06) (7.87) (8.06) Total Institutional Ownership t-1 5.299*** 5.292*** 5.420*** 1.144*** 1.133*** 1.156***
(9.38) (9.35) (9.53) (15.31) (15.15) (15.41) 3% or above t-1 /Total t-1 -3.712*** -3.707*** -3.766*** -0.930*** -0.924*** - 0.936***
(-7.45) (-7.45) (-7.48) (-12.02) (-12.00) (-12.02) CEO 0.487*** 0.517*** 0.486*** 0.425*** 0.429*** 0.424***
(3.21) (3.40) (3.20) (22.66) (22.69) (22.50) Age -0.034*** -0.035*** -0.033*** 0.004** 0.004** 0.004**
(-3.04) (-3.08) (-2.88) (2.40) (2.31) (2.47) Time in role -0.055 -0.028 -0.034 0.007 0.006 0.010
(-0.18) (-0.09) (-0.11) (0.18) (0.16) (0.29) External 0.223 0.238 0.174 0.024 0.026 0.021 (1.21) (1.28) (0.93) (1.11) (1.19) (0.96) Industry Dummies + + + + + + Year Dummies + + + + + + N 3697 3697 3697 3697 3697 3697 Adjusted R2/ Pseudo R2 0.281 0.275 0.269 0.557 0.559 0.554

33
Panel B. Compensation level and structure and financial distress risk
Variables Ln (Total compensation)
Fraction of equity-based compensation
BSM C&J Altman BSM C&J Altman (1) (2) (3) (4) (5) (6)
Intercept 10.837*** 10.857*** 10.834*** 0.091 0.099 0.089 (42.22) (42.29) (41.91) (0.78) (0.85) (0.76)
RIMed -0.130** -0.124** -0.035 -0.027 -0.043* 0.003 (-2.51) (-2.45) (-0.60) (-1.13) (-1.65) (0.10)
RIHigh -0.241*** -0.323*** -0.121* -0.075*** -0.105*** -0.041 (-4.40) (-4.75) (-1.83) (-2.75) (-2.99) (-1.28)
Ln(Sales) t-1 0.057*** 0.056*** 0.056*** 0.005 0.005 0.004 (5.87) (5.84) (5.77) (1.38) (1.35) (1.29)
Leverage 0.257** 0.345*** 0.241** 0.081* 0.109** 0.072 (2.34) (3.07) (2.16) (1.65) (2.15) (1.41)
ROAt-1 -0.032 -0.034 -0.043 -0.057* -0.060* -0.062* (-0.44) (-0.50) (-0.59) (-1.76) (-1.87) (-1.84)
Tobin’s Qt-1 0.005 0.010*** 0.006* 0.002 0.003** 0.002 (1.64) (2.75) (1.78) (1.22) (2.10) (1.40)
CashHoldingt/TAt-1 0.143* 0.140* 0.154* 0.065* 0.062 0.067* (1.77) (1.75) (1.92) (1.71) (1.64) (1.77)
Stock Return 0.140*** 0.132*** 0.162*** 0.056*** 0.052*** 0.062*** (3.36) (3.15) (4.06) (3.28) (3.10) (3.75)
Independent directors 0.981*** 0.963*** 0.987*** 0.281*** 0.274*** 0.282*** (8.40) (8.20) (8.41) (5.71) (5.53) (5.74)
Total Institutional Ownership 1.629*** 1.615*** 1.646*** 0.520*** 0.514*** 0.524*** (16.33) (16.16) (16.39) (13.61) (13.45) (13.75)
3% or above /Total -1.262*** -1.255*** -1.271*** -0.317*** -0.313*** -0.321*** (-12.65) (-12.61) (-12.61) (-8.50) (-8.36) (-8.59)
CEO 0.425*** 0.430*** 0.423*** -0.014 -0.013 -0.015 (17.35) (17.41) (17.18) (-1.21) (-1.08) (-1.29)
Age 0.001 0.000 0.001 -0.004*** -0.004*** -0.004*** (0.37) (0.27) (0.44) (-5.11) (-5.20) (-5.02)
Time in role -0.033 -0.034 -0.027 -0.022 -0.022 -0.019 (-0.71) (-0.72) (-0.57) (-0.98) (-1.00) (-0.85)
External 0.041 0.043 0.036 0.018 0.019 0.017 (1.45) (1.53) (1.28) (1.44) (1.47) (1.31) Industry Dummies + + + + + + Year Dummies + + + + + + N 3697 3697 3697 3697 3697 3697 Adjusted R2/ Pseudo R2 0.529 0.531 0.525 0.234 0.236 0.232
34
Table 4. Executive Director Characteristics, Financial Distress Risk and Compensation Table 4 presents the results from estimating the same models in Table III Panel B using different subsamples. Only the coefficients and t-statistics associated with the medium/high risk dummies are presented for simplicity. BSMMed, BSMhigh, CJMed, CJHigh, AltmanMed, Altmanhigh are the medium and high risk dummies based on Hillegeist et al. (2004) BSM model, Chava and Jarrow (2004) hazard model and Altman (1968) Z-score model respectively. Panel A presents the results from pooled cross sectional (OLS) regressions on total compensation and panel B presents the results from Tobit regressions on compensation structure (equity/total compensation). Adjusted R2 (for OLS regression) and pseudo R2 (for Tobit regression) is presented. Coefficients are presented with t-statistics below in parentheses. t-statistics are based on robust standard errors clustered at the firm level. ‘*’, ‘**’ and ‘***’ denote significance at 10%, 5% and 1% level respectively. Year and industry-level dummies results are suppressed. Industry dummy variables are based on 12 Fama-French industries. Panel A. Dependent Variable: Ln (Total compensation)
CEO and other directors Internal and external hires Executive age
CEO Only
(N=1073)
Directors Only
(N=2624)
Internal Promotions (N=1990)
External Hires
(N=1707)
Age above Median
(N=1804)
Age not above
Median (N=1893)
(1) (2) (3) (4) (5) (6) BSMMed -0.146 -0.118** -0.191*** -0.061 -0.174** -0.094*
(-1.48) (-2.23) (-2.64) (-0.92) (-2.30) (-1.66) BSMhigh -0.259*** -0.228*** -0.213*** -0.248*** -0.327*** -0.162***
(-3.17) (-3.78) (-3.19) (-3.43) (-3.84) (-2.80) Adjusted R2 0.505 0.523 0.555 0.511 0.534 0.530 CJMed -0.121* -0.115** -0.199*** -0.024 -0.105 -0.172***
(-1.67) (-1.99) (-2.87) (-0.38) (-1.42) (-3.06) CJHigh -0.314*** -0.315*** -0.345*** -0.263*** -0.416*** -0.258***
(-3.46) (-4.25) (-3.83) (-3.11) (-4.39) (-3.45) Adjusted R2 0.506 0.525 0.558 0.511 0.535 0.534 AltmanMed -0.146* 0.017 -0.036 -0.010 -0.022 -0.049
(-1.87) (0.27) (-0.53) (-0.13) (-0.30) (-0.72) Altmanhigh -0.167 -0.091 -0.108 -0.092 -0.164 -0.063
(-1.49) (-1.37) (-1.20) (-1.16) (-1.54) (-1.01) Adjusted R2 0.503 0.520 0.552 0.507 0.529 0.528 Panel B. Dependent Variable: Fraction of equity-based compensation BSMMed 0.016 -0.039 -0.034 -0.021 -0.050 -0.006
(0.39) (-1.56) (-1.23) (-0.57) (-1.45) (-0.20) BSMhigh -0.079* -0.069** -0.087*** -0.058 -0.125*** -0.035
(-1.91) (-2.25) (-2.65) (-1.54) (-3.45) (-1.05) Pseudo R2 0.209 0.253 0.293 0.207 0.251 0.238 CJMed -0.033 -0.047 -0.053* -0.019 -0.083** -0.012
(-0.79) (-1.60) (-1.66) (-0.50) (-2.09) (-0.40) CJHigh -0.105** -0.102*** -0.115** -0.085 -0.208*** -0.032
(-2.06) (-2.70) (-2.58) (-1.59) (-4.55) (-0.78) Pseudo R2 0.210 0.255 0.296 0.208 0.260 0.238 AltmanMed -0.035 0.016 0.036 -0.023 0.017 -0.002
(-0.84) (0.56) (1.13) (-0.59) (0.54) (-0.06) Altmanhigh -0.095* -0.014 -0.035 -0.024 -0.027 -0.034
(-1.85) (-0.42) (-0.89) (-0.53) (-0.58) (-0.92) Pseudo R2 0.209 0.250 0.291 0.205 0.246 0.238
35
Table 5. Executive compensation, financial distress risk, institutional investors Table 5 examines the extent to which distress risk affect institution’s impact on executive compensation. We use pooled cross sectional regressions (OLS) to investigate institution’s impact on compensation level and use Tobit regressions for compensation structure. The dependent variables are the logarithm of total executive compensation adjusted for inflation with the base year of 2005 and the fraction of equity compensation in total compensation respectively. The three risk indicators include BSM which is attained from Hillegeist et al (2004) BSM model, C&J from Chava and Jarrow (2004) hazard model and Altman from Altman (1968) Z-score model. RIMed and RIHigh are the two dummies for median and high levels of risky firms respectively. Total Institutional Ownership is the fraction of outstanding shares owned by institutional investors. 3% or above /Total is the fraction of equity owned by institutional investors who owns 3% or more of the firm’s equity as a percentage of total institutional ownership. For brevity we only report the results on the variables of interest. Other control variables include Ln(Sales) t-1, Leverage, ROAt-1, Tobin’s Qt-1, CashHoldingt/TAt-1, Stock Return, Independent directors, CEO, Age, Time in role and External. t-statistics are based on robust standard errors clustered at the firm level. Adjusted R2 is reported for pooled cross sectional regressions and pseudo R2 for tobit regressions. ‘*’, ‘**’ and ‘***’ denote significance at 10%, 5% and 1% level respectively. Year and industry-level dummies results are suppressed. Industry dummy variables are based on 12 Fama-French industries. Variables Pooled Cross Sectional Regressions Tobit Regressions
Ln (Total compensation) Equity/Total BSM C&J Altman BSM C&J Altman (1) (2) (3) (4) (5) (6)
Intercept 10.891*** 10.936*** 10.880*** 0.102 0.121 0.101 (42.68) (42.78) (42.23) (0.88) (1.04) (0.85)
RIMed -0.275* -0.258 -0.072 -0.024 -0.085 -0.060 (-1.88) (-1.54) (-0.48) (-0.43) (-1.13) (-1.10) RIHigh -0.684*** -0.678*** -0.443*** -0.209*** -0.213*** -0.087 (-5.58) (-5.41) (-2.89) (-3.54) (-3.37) (-1.47) Total Institutional Ownership 1.638*** 1.622*** 1.651*** 0.521*** 0.516*** 0.524***
(16.59) (16.38) (16.48) (13.78) (13.64) (13.75) 3% or above /Total -1.412*** -1.394*** -1.365*** -0.347*** -0.351*** -0.343***
(-12.26) (-11.94) (-11.83) (-8.34) (-8.38) (-8.15) 3% or above /Total 0.258 0.237 0.066 -0.008 0.075 0.116 *RIMed (1.17) (0.99) (0.30) (-0.09) (0.68) (1.22) *RIHigh 0.767*** 0.643*** 0.527*** 0.229*** 0.194** 0.076 (4.39) (3.63) (2.61) (2.60) (2.09) (0.91) Other Control Variables + + + + + + Industry Dummies + + + + + + Year Dummies + + + + + + N 3697 3697 3697 3697 3697 3697 Adjusted R2/Pseudo R2 0.533 0.534 0.527 0.236 0.238 0.232
36
Table 6. Executive compensation, financial distress risk, and foreign vs domestic Institutional Investors Variables Pooled Cross Sectional Regressions Tobit Regressions
Ln (Total compensation) Equity/Total BSM C&J Altman BSM C&J Altman (1) (2) (3) (4) (5) (6)
Intercept 11.030*** 11.070*** 11.022*** 0.125 0.145 0.125 (43.28) (43.51) (42.85) (1.07) (1.24) (1.06)
RIMed -0.236* -0.210 -0.067 -0.018 -0.078 -0.059 (-1.68) (-1.34) (-0.47) (-0.34) (-1.08) (-1.09) RIHigh -0.607*** -0.614*** -0.377** -0.185*** -0.196*** -0.071 (-4.79) (-4.95) (-2.47) (-3.19) (-3.14) (-1.21) Foreign Total Institutional Ownership 4.188*** 4.112*** 4.095*** 0.935*** 0.899*** 0.903***
(11.70) (11.44) (11.20) (6.92) (6.80) (6.66) Domestic Total Institutional Ownership 0.929*** 0.935*** 0.969*** 0.393*** 0.396*** 0.404*** (9.40) (9.43) (9.81) (8.52) (8.59) (8.69) Foreign 3% or above /Total -2.300*** -2.206*** -2.081*** -0.586*** -0.522*** -0.516*** (-8.89) (-8.52) (-7.92) (-4.87) (-4.59) (-4.26) Domestic 3% or above /Total -0.991*** -1.001*** -0.986*** -0.262*** -0.279*** -0.272***
(-8.93) (-9.00) (-8.86) (-5.65) (-6.04) (-5.80) Foreign 3% or above /Total 0.438 0.015 -0.026 0.284* 0.071 0.098 *RIMed (1.09) (0.03) (-0.05) (1.66) (0.32) (0.46) *RIHigh -0.016 -0.075 -0.442 0.066 0.001 -0.046 (-0.04) (-0.19) (-1.22) (0.32) (0.00) (-0.27) Domestic 3% or above /Total 0.103 0.178 0.019 -0.070 0.062 0.111 *RIMed (0.48) (0.79) (0.09) (-0.81) (0.57) (1.15) *RIHigh 0.621*** 0.558*** 0.502** 0.189** 0.180* 0.058 (3.42) (3.11) (2.42) (2.15) (1.95) (0.66) Other Control Variables + + + + + + Industry Dummies + + + + + + Year Dummies + + + + + + N 3697 3697 3697 3697 3697 3697 Adjusted R2/Pseudo R2 0.557 0.557 0.552 0.242 0.242 0.236
37
In this table, we distinguish between foreign and domestic institutional investors. The dependent variables are the logarithm of total executive compensation (inflation adjusted) for pooled cross sectional (OLS) regressions and the fraction of equity compensation in total compensation for Tobit regressions. The three risk indicators include BSM which is attained from Hillegeist et al (2004) BSM model, C&J from Chava and Jarrow (2004) hazard model and Altman from Altman (1968) Z-score model. RIMed and RIHigh are the two dummies for median and high levels of risky firms respectively. Foreign (domestic) Total Institutional Ownership is the fraction of outstanding shares owned by non-UK (UK) institutional investors. Foreign (domestic) 3% or above /Total is the fraction of equity owned by non-UK (UK) institutional investors who owns 3% or more of the firm’s equity as a percentage of total institutional ownership. For brevity we only report the results on the variables of interest. Other control variables include Ln(Sales) t-1, Leverage, ROAt-1, Tobin’s Qt-1, CashHoldingt/TAt-1, Stock Return, Independent directors, CEO, Age, Time in role and External. t-statistics are based on robust standard errors clustered at the firm level. Adjusted R2 is reported for pooled cross sectional regressions and pseudo R2 for Tobit regressions. ‘*’, ‘**’ and ‘***’ denote significance at 10%, 5% and 1% level respectively. Year and industry-level dummies results are suppressed. Industry dummy variables are based on 12 Fama-French industries.
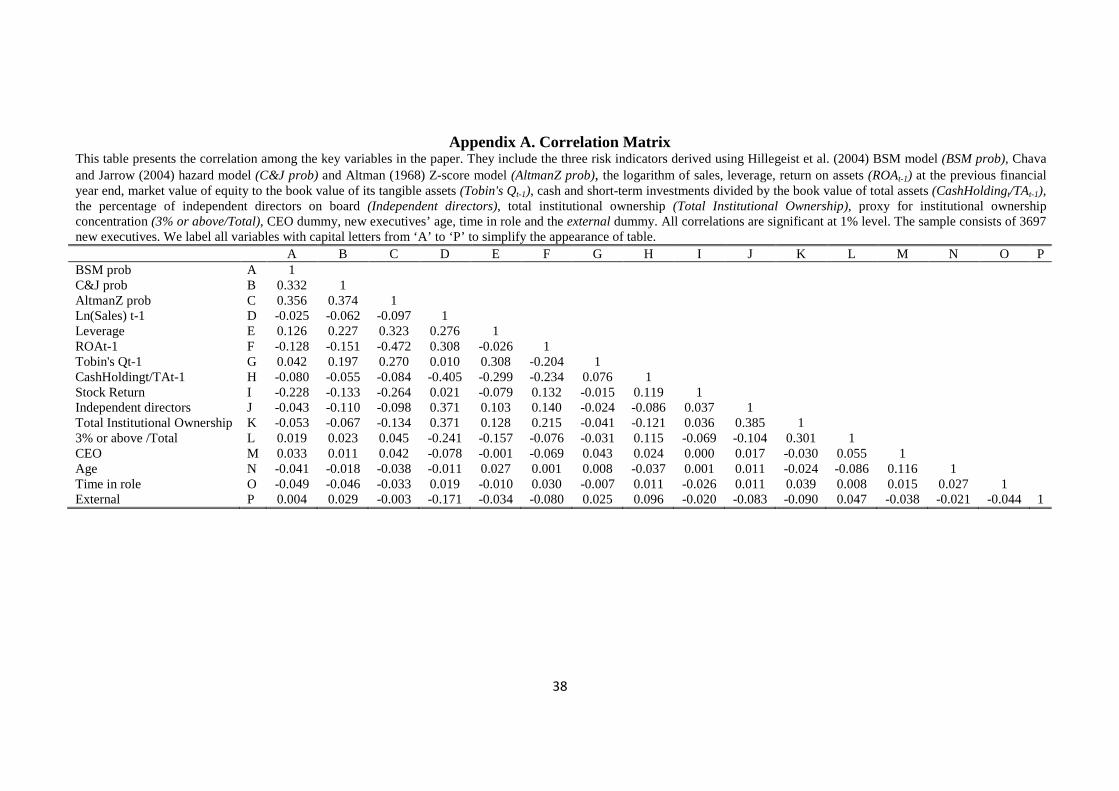
38
Appendix A. Correlation Matrix This table presents the correlation among the key variables in the paper. They include the three risk indicators derived using Hillegeist et al. (2004) BSM model (BSM prob), Chava and Jarrow (2004) hazard model (C&J prob) and Altman (1968) Z-score model (AltmanZ prob), the logarithm of sales, leverage, return on assets (ROAt-1) at the previous financial year end, market value of equity to the book value of its tangible assets (Tobin's Qt-1), cash and short-term investments divided by the book value of total assets (CashHoldingt/TAt-1), the percentage of independent directors on board (Independent directors), total institutional ownership (Total Institutional Ownership), proxy for institutional ownership concentration (3% or above/Total), CEO dummy, new executives’ age, time in role and the external dummy. All correlations are significant at 1% level. The sample consists of 3697 new executives. We label all variables with capital letters from ‘A’ to ‘P’ to simplify the appearance of table. A B C D E F G H I J K L M N O P BSM prob A 1 C&J prob B 0.332 1 AltmanZ prob C 0.356 0.374 1 Ln(Sales) t-1 D -0.025 -0.062 -0.097 1 Leverage E 0.126 0.227 0.323 0.276 1 ROAt-1 F -0.128 -0.151 -0.472 0.308 -0.026 1 Tobin's Qt-1 G 0.042 0.197 0.270 0.010 0.308 -0.204 1 CashHoldingt/TAt-1 H -0.080 -0.055 -0.084 -0.405 -0.299 -0.234 0.076 1 Stock Return I -0.228 -0.133 -0.264 0.021 -0.079 0.132 -0.015 0.119 1 Independent directors J -0.043 -0.110 -0.098 0.371 0.103 0.140 -0.024 -0.086 0.037 1 Total Institutional Ownership K -0.053 -0.067 -0.134 0.371 0.128 0.215 -0.041 -0.121 0.036 0.385 1 3% or above /Total L 0.019 0.023 0.045 -0.241 -0.157 -0.076 -0.031 0.115 -0.069 -0.104 0.301 1 CEO M 0.033 0.011 0.042 -0.078 -0.001 -0.069 0.043 0.024 0.000 0.017 -0.030 0.055 1 Age N -0.041 -0.018 -0.038 -0.011 0.027 0.001 0.008 -0.037 0.001 0.011 -0.024 -0.086 0.116 1 Time in role O -0.049 -0.046 -0.033 0.019 -0.010 0.030 -0.007 0.011 -0.026 0.011 0.039 0.008 0.015 0.027 1 External P 0.004 0.029 -0.003 -0.171 -0.034 -0.080 0.025 0.096 -0.020 -0.083 -0.090 0.047 -0.038 -0.021 -0.044 1
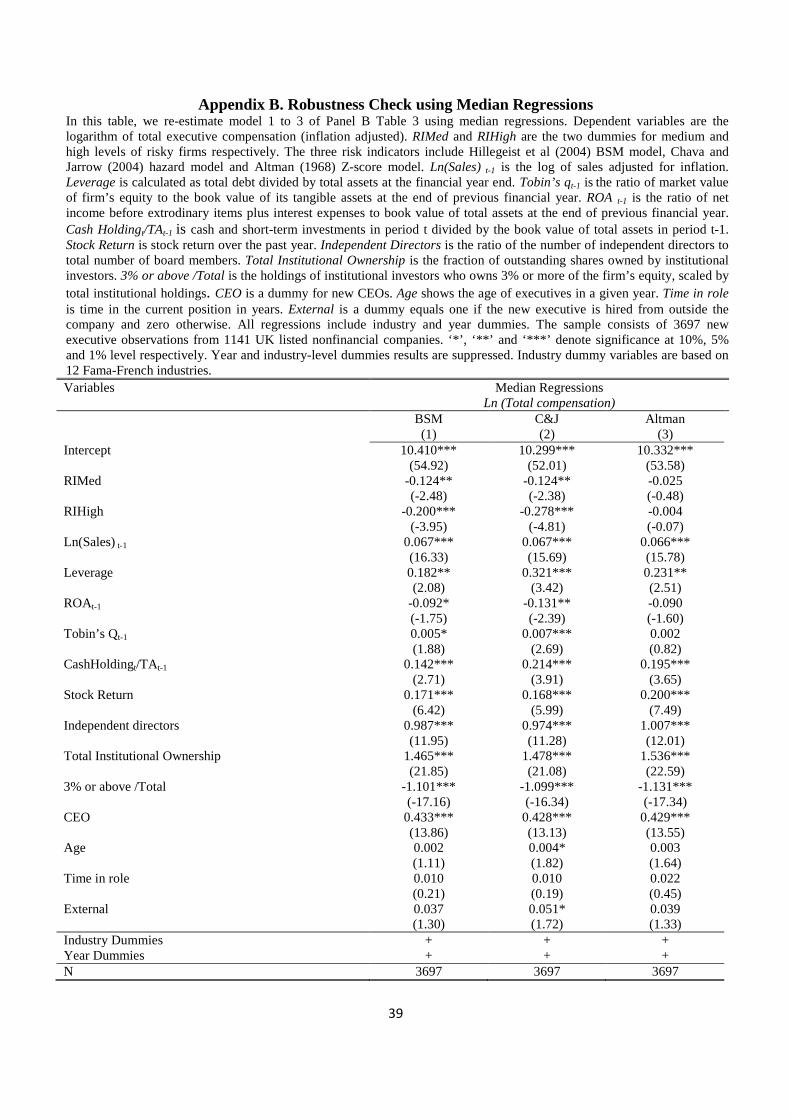
39
Appendix B. Robustness Check using Median Regressions In this table, we re-estimate model 1 to 3 of Panel B Table 3 using median regressions. Dependent variables are the logarithm of total executive compensation (inflation adjusted). RIMed and RIHigh are the two dummies for medium and high levels of risky firms respectively. The three risk indicators include Hillegeist et al (2004) BSM model, Chava and Jarrow (2004) hazard model and Altman (1968) Z-score model. Ln(Sales) t-1 is the log of sales adjusted for inflation. Leverage is calculated as total debt divided by total assets at the financial year end. Tobin’s qt-1 is the ratio of market value of firm’s equity to the book value of its tangible assets at the end of previous financial year. ROA t-1 is the ratio of net income before extrodinary items plus interest expenses to book value of total assets at the end of previous financial year. Cash Holdingt/TAt-1 is cash and short-term investments in period t divided by the book value of total assets in period t-1. Stock Return is stock return over the past year. Independent Directors is the ratio of the number of independent directors to total number of board members. Total Institutional Ownership is the fraction of outstanding shares owned by institutional investors. 3% or above /Total is the holdings of institutional investors who owns 3% or more of the firm’s equity, scaled by total institutional holdings. CEO is a dummy for new CEOs. Age shows the age of executives in a given year. Time in role is time in the current position in years. External is a dummy equals one if the new executive is hired from outside the company and zero otherwise. All regressions include industry and year dummies. The sample consists of 3697 new executive observations from 1141 UK listed nonfinancial companies. ‘*’, ‘**’ and ‘***’ denote significance at 10%, 5% and 1% level respectively. Year and industry-level dummies results are suppressed. Industry dummy variables are based on 12 Fama-French industries. Variables Median Regressions
Ln (Total compensation) BSM C&J Altman
(1) (2) (3) Intercept 10.410*** 10.299*** 10.332***
(54.92) (52.01) (53.58) RIMed -0.124** -0.124** -0.025
(-2.48) (-2.38) (-0.48) RIHigh -0.200*** -0.278*** -0.004
(-3.95) (-4.81) (-0.07) Ln(Sales) t-1 0.067*** 0.067*** 0.066***
(16.33) (15.69) (15.78) Leverage 0.182** 0.321*** 0.231**
(2.08) (3.42) (2.51) ROAt-1 -0.092* -0.131** -0.090
(-1.75) (-2.39) (-1.60) Tobin’s Qt-1 0.005* 0.007*** 0.002
(1.88) (2.69) (0.82) CashHoldingt/TAt-1 0.142*** 0.214*** 0.195***
(2.71) (3.91) (3.65) Stock Return 0.171*** 0.168*** 0.200***
(6.42) (5.99) (7.49) Independent directors 0.987*** 0.974*** 1.007***
(11.95) (11.28) (12.01) Total Institutional Ownership 1.465*** 1.478*** 1.536***
(21.85) (21.08) (22.59) 3% or above /Total -1.101*** -1.099*** -1.131***
(-17.16) (-16.34) (-17.34) CEO 0.433*** 0.428*** 0.429***
(13.86) (13.13) (13.55) Age 0.002 0.004* 0.003
(1.11) (1.82) (1.64) Time in role 0.010 0.010 0.022
(0.21) (0.19) (0.45) External 0.037 0.051* 0.039 (1.30) (1.72) (1.33) Industry Dummies + + + Year Dummies + + + N 3697 3697 3697

40
Appendix C. Robustness Check using Fixed Effects Regressions In this table, we re-estimate model 1 to 3 of Panel B Table 3 using fixed effects regressions. Dependent variables are the logarithm of total executive compensation (inflation adjusted). RIMed and RIHigh are the two dummies for medium and high levels of risky firms respectively. The three risk indicators include Hillegeist et al (2004) BSM model, Chava and Jarrow (2004) hazard model and Altman (1968) Z-score model. Ln(Sales) t-1 is the log of sales adjusted for inflation. Leverage is calculated as total debt divided by total assets at the financial year end. Tobin’s qt-
1 is the ratio of market value of firm’s equity to the book value of its tangible assets at the end of previous financial year. ROA t-1 is the ratio of net income before extrodinary items plus interest expenses to book value of total assets at the end of previous financial year. Cash Holdingt/TAt-1 is cash and short-term investments in period t divided by the book value of total assets in period t-1. Stock Return is stock return over the past year. Independent Directors is the ratio of the number of independent directors to total number of board members. Total Institutional Ownership is the fraction of outstanding shares owned by institutional investors. 3% or above /Total is the holdings of institutional investors who owns 3% or more of the firm’s equity, scaled by total institutional holdings. CEO is a dummy for new CEOs. Age shows the age of executives in a given year. Time in role is time in the current position in years. External is a dummy equals one if the new executive is hired from outside the company and zero otherwise. All regressions include industry and year dummies. The sample consists of 3697 new executive observations from 1141 UK listed nonfinancial companies. ‘*’, ‘**’ and ‘***’ denote significance at 10%, 5% and 1% level respectively. Year and industry-level dummies results are suppressed. Industry dummy variables are based on 12 Fama-French industries. Variables Fixed Effects Regressions
Ln (Total compensation) BSM C&J Altman
(1) (2) (3) Intercept 11.327*** 11.338*** 11.351***
(35.07) (34.34) (34.93) RIMed -0.106* -0.032 -0.064
(-1.95) (-0.65) (-0.91) RIHigh -0.237*** -0.258*** -0.135*
(-3.95) (-3.44) (-1.88) Ln(Sales) t-1 0.014 0.012 0.012
(0.91) (0.75) (0.78) Leverage -0.346** -0.235 -0.363**
(-2.06) (-1.30) (-2.07) ROAt-1 -0.069 -0.055 -0.070
(-0.90) (-0.69) (-0.90) Tobin’s Qt-1 -0.003 -0.001 -0.003
(-0.75) (-0.25) (-0.71) CashHoldingt/TAt-1 0.096 0.100 0.101
(1.03) (1.08) (1.04) Stock Return 0.088** 0.090** 0.107***
(2.42) (2.51) (3.07) Independent directors 0.835*** 0.851*** 0.834***
(4.38) (4.38) (4.35) Total Institutional Ownership 0.494*** 0.520*** 0.486***
(3.82) (4.06) (3.63) 3% or above /Total -0.233* -0.246** -0.227*
(-1.92) (-2.02) (-1.83) CEO 0.451*** 0.453*** 0.453***
(22.06) (22.29) (22.17) Age -0.004** -0.003** -0.003**
(-2.21) (-2.10) (-2.15) Time in role -0.052 -0.052 -0.053
(-1.40) (-1.39) (-1.42) External 0.051** 0.048** 0.046* (2.13) (1.97) (1.88) Industry Dummies + + + Year Dummies + + + N 3697 3697 3697 Adjusted R2 0.373 0.372 0.368

41