Embed Size (px)
Citation preview

1
Financial Distress: Lifecycle and Corporate Restructuring
SzeKee Koh, Lele Dai and Millicent Chang
The University of Western Australia
Abstract
Lifecycle theory suggests the unique firm lifecycle characteristics of birth, growth, maturity,
and decline and how these characteristics affect the decisions a firm makes, especially in
situations such as financial distress and the threat of bankruptcy. However because of these
lifecycle characteristics, when firms are faced with distress, managers may have limited
restructuring options. We examine how lifecycle characteristics affect the restructuring
strategies used by firms in financial distress such as: managerial, operational, asset and
financial strategies. We find evidence that distress firms’ access to different types of
restructuring strategies is limited by the lifecycle stage they are in. For example, mature firms
replace top level management while growth, mature and decline firms reduce dividend
payments and raise funds from external sources. Birth firms on the other hand are least able
to adopt restructuring strategies when in distress.
JEL classification: G33, G34
Keywords: Lifecycle Theory, Financial Distress, Restructuring
_______________________
The authors are from the University of Western Australia Business School (M250 (Accounting and Finance, 35
Stirling Highway, Crawley, Western Australia 6009). The authors also gratefully acknowledge the financial
support provided by the UWA Business School Research Development Grant.

2
1.0 Introduction
It has become commonly accepted in the managerial literature that as a firm grows and
matures, it moves through different stages of the corporate lifecycle (Miller & Friesen, 1984).
These stages differ in terms of firm characteristics and structure. The exact classification of
lifecycle stages varies, but common stages include; birth, growth, maturity, and decline
(Adizes, 2004). Firms in the birth phase are in the initial stage of starting up business
operations. These firms are action oriented and focused on expansion. During the growth
stage, firms have enjoyed some success and are experiencing strong business growth and cash
flows. Those that reach maturity are cash rich, financially oriented, with a focus on low risk
endeavours. Finally, firms in decline have limited investment opportunities and are largely
incapable of generating sufficient resources. As each lifecycle stage faces different
challenges, management decisions must be adjusted to take into account these differences.
Corporate finance theory, on the other hand, argues that states of financial distress, default
and bankruptcy present a fundamental stage in the lifecycle of firms (Wruck, 1990). The
survival of a firm is therefore not only dependent on its ability to remain profitable, to
maximise shareholder wealth and to avoid financial distress but also on its ability to make
decisions which take into consideration its stage in the lifecycle. As financial distress is a pre-
curser to bankruptcy, it needs to be addressed immediately and effectively. A firm’s ability to
take responsive action when it is in financial distress is a crucial factor in its recovery.
In this paper, the following question is addressed: How do firms in different lifecycle stages
approach corporate restructuring when faced with financial distress? It is expected that firms
experience financial distress before bankruptcy is filed. With the extreme nature and high
costs of bankruptcy, the implementation of correct restructuring strategies is an important
consideration for the firm and its shareholders. Since bankruptcy as a strategy is found to be
limited in its likelihood of success, it is imperative that preventative measures are taken when
managers recognise that the firm is in distress before the need to resort to bankruptcy.
Furthermore, bankruptcy is found to be costly both directly and indirectly and should be
avoided whenever possible (Moulton & Thomas 1993). Therefore, the importance of
restructuring strategies in a firm’s recovery from distress forms the motivation for this paper.

3
While it is clear that firms in each lifecycle stage exhibit different characteristics, there is
limited evidence on how these differences affect the choice of restructuring strategies. We
expect that these distinct lifecycle characteristics will influence management decisions when
firms recognise financial distress. These differences impact management decisions when
faced with distress as well as limit the restructuring options available. In particular, an
examination into how the lifecycle characteristics of birth, growth, maturity, and decline
stages affect managerial, operational and asset, and financial restructurings will be conducted.
Due to the lifecycle stage of a firm, certain restructuring strategies may not be available or
appropriate.
Using a sample of US firms, we find evidence to support lifecycle theory. When in distress, a
firm’s access to various types of restructuring strategies is limited by the lifecycle stage it is
in. Compared to birth firms, mature firms in distress are more likely to replace their
incompetent managers. Distress firms further on in the lifecycle hierarchy are also found to
be more likely to engage in operational and asset restructuring strategies relative to birth
firms. Growth, mature and decline firms are more likely to reduce dividend payments to
preserve investments and resources due to increased creditor pressure. Consistent with the
pecking order hypothesis, distress firms will raise external funding through the issuance of
common shares. We also found that none of the restructuring strategies we examined help the
firms to turn around within two years after distress. Therefore, even for those who have
access to the chosen restructuring strategy, there is no guarantee of recovery from distress.
The remainder of this paper is organised as follows. In Section 2 discusses past studies on the
lifecycle theory, financial distress and corporate turnaround strategies. In Section 3, we
present our hypotheses. In Section 4, we describe our data and sample selections. We present
our findings in Section 5 and our conclusions are presented in the final section.

4
2.0 Literature Review
2.1 Life Cycle Theory
Life cycle theory suggests that appropriate growth and capital capacity strategies depend on
the firm’s life cycle stage (Anthony and Ramesh, 1992). This life cycle stage may be viewed
as consisting essentially four main stages namely: (1) birth, (2) growth, (3) maturity, and (4)
decline; and each stage exhibits significant differences in terms of situation, organizational
strategy, structure, and decision making style (Miller & Friesen, 1984; Pashley and
Philippatos, 1990; Adizes, 2004). As a firm matures, its characteristics, business goals,
strengths and limitations will change reflecting the progression through the phases of
lifecycle theory. Firms tend to become bigger and more complex in organisational structure,
concentration of ownership becomes more dispersed and integration generally increases.
Strategic decision-making and their effectiveness will also differ depending on the lifecycle
of the firm. Mature and declining firms are less likely to take on innovative, risk-taking
strategies in comparison to firms in birth and growth. Theitart & Vivas (1984) suggest that
key factors affecting performance1 of each lifecycle stage differs. Marketing and product
differentiation are vital for the growth stage while mature firms depend on low cost
production and process efficiency. During decline, firms focus on controlling costs,
simplifying the production line, raising price, and cutting R&D expenses.
Birth
According to Miller & Friesen (1984), firms in the birth stage are small, dominated by their
owners (entrepreneurs), simple, informal in structure, undifferentiated, with highly
centralized power systems and considerable focus on innovation. Young firms face greater
uncertainty over future growth which results in higher book-to-market ratios and greater firm
specific risk (Pastor & Veronesi, 2003; Lubos & Peitro, 2003). These firms are in the initial
stages of operations and are struggling to remain viable amongst competition with older more
established firms. An entrepreneurial focus with a risk taking strategic approach usually
characterises the birth stage. The market therefore considers them riskier enterprises with
uncertain future cash flows and values them accordingly. For this reason, Quinn and
Cameron (1983) who categorize the four groups by their core strategy or decision making
style, label their birth stage as the “Creativity & Entrepreneurship” phase.
1 Performance as measured by % change in market share and cash-flow/revenue
5
Growth
Growth stage firms are medium sized organisations achieving rapid growth and multiple
shareholders. They are larger than birth firms and will begin to acquire subsidiaries in similar
industries. This is due to the fact that these firms would have experienced some initial success
and will be attempting to establish itself in the market by broadening the product market
scope into closely related areas. Mueller (1972) suggests that the typical growing corporation
will continue to decentralise its decision making structure with a downward shifting of
authority. As a result, managers will be delegated more decision making responsibility and
the separation of ownership and control will begin to emerge (Miller & Friesen 1984).
However, although a more team based management approach is taken, power remains quite
centralized at the upper levels of the organisation. Growth firms are also becoming more
formalised in structure and procedure with moderate levels of differentiation. Thietart &
Vivas (1984) argue that the ‘leadership’ strategy is adopted at the growth phase. An emphasis
will be placed on achieving rapid sales growth, amassing resources for economies of scale,
and broadening of operations to promote further growth. Quinn & Cameron (1983) name this
stage “Collectivity” for the emerging sense of a collective mission.
Maturity
Mature firms will have an even more dispersed ownership structure, be less innovative, have
formal bureaucratic systems, and slower or zero growth as sales become stabilised. Mueller
(1972) argues that internal fund flows will eventually outpace investment opportunities and
cost of capital will decrease as uncertainty is reduced. Markets will consider these firms to be
less risky as cash flows are stable and market position is established. Any investment
endeavours will be supported by existing operations. Firms in this stage will be very large in
size, have divisional organisational structure with high differentiation and sophisticated
systems. These formal structures are necessary to cope with the diverse needs of complex
business operations as well as heterogeneous markets. Mature firms face a competitive
environment and are usually conservative in their strategies. These firms will be enjoying a
size advantage over competitors and will be focused on efficiency rather than on innovation.
The main aim of firms in this stage is the smooth functioning of the business in a well-
defined market (Miller & Friesen 1984). For this reason, Thietart & Vivas (1984) argue that
mature firms pursue a ‘niche’ strategy. The increase in structure and emphasis on
formalisation lead Quinn & Cameron (1983) to name this stage “formalization and control”

6
where procedures and policies are institutionalized, goals are formalized, and flexibility is
reduced.
Decline
Finally as the name suggests, firms in decline are encroaching stagnation and suffer from low
profitability (Miller & Friesen 1984). Markets shrink, demand drops, and lack of innovation
lead to ever declining sales. Firms in this stage often resort to price cutting measures, the
consolidation of product lines, or the liquidation of subsidiaries to remain afloat. These firms
are forced to be risk averse in their strategies as they cannot sustain potential losses. The
dominant approach pursued by declining firms is a ‘harvest’ strategy where the main aim is
the collection of as much funds from existing operations as possible (Thietart & Vivas, 1984).
2.2 Financial Distress and Corporate Turnaround Strategies
Financial distress refers to a condition whereby a business or company cannot pay the owed
amounts on the due date. Chen, Weston, & Altman’s (1995) definition of distress is if a
firm’s liquidation of total assets is less than the total value of creditor claims. If prolonged,
this situation can lead to forced liquidation or bankruptcy. For this reason financial distress is
often referred to as the likelihood of bankruptcy which is found to be dependent on the
availability of liquidity and credit (Hendel, 1996).
Whitaker (1999) categorizes financial distress into categories. Distress due to poor
management (firm specific distress) and distress as a result of economic decline (common
factors). The argument is that if distress is the result of poor management, then the actions of
management in restructuring will be a more significant determinant of successful recovery.
Jensen (1989) argues that financial distress will trigger corrective action from management
which improves firm performance. Whitaker (1999) finds support for Jensen’s hypothesis and
argues that early financial distress will motivate managers to increase efficiency. Therefore
distress is actually beneficial to overall firm performance as it stimulates poorly managed
firms to improve. Based on Jenson and Whitaker, firms engaging in distress motivated
restructuring should show signs of performance improvement.
When a firm recognises that it is in danger of financial distress, it is vital that it responds
immediately by taking corrective measures to enhance efficiency and control costs. Lohrke,
Beheian, & Palmer (2004) for example, emphasise the importance of top management teams

7
during restructuring. They argue that a major determinant of successful turnaround is the
ability of management to select the appropriate strategy for recovery. However, restructuring
decisions are influenced not only by management teams and shareholders but also by
creditors who are found to exert significant power over financially distressed firms (Brown,
James & Mooradian, 1992 & 1994). When a firm is in distress, restructurings are usually met
with positive stock reactions2 which is a sign that they are considered to be necessary for the
firm to remain viable (Denis & Kruse, 2000).
When in financial distress, the affected firm usually faces a shortage of cash flows. In order
to generate liquid funds and decrease outflows, such firm can resort to cash reserves, reduce
inventory levels, extend trade credits, draw upon bank lines of credit, restructure debt
payments, raise equity, and sell assets (Whitaker, 1999).
Gibbs (1993) looks at the determinants of corporate restructuring and categorizes his findings
into two broad categories of theory; free cash flow and corporate governance. The free cash
flow hypothesis developed by Jensen (1986) proposes that management in firms with free
cash flow will be more likely to over-invest and over-diversify. These agency costs will
increase the likelihood of takeover treats which will lead to forced restructuring. Free cash
flow variables reflect the choice between retained and distributed earnings, investment
opportunities, operating cash flow, financial leverage, and diversification.
Corporate governance looks at the board of directors, management compensation,
concentration of equity ownership, and the managerial labour market. The argument is that
these factors will affect restructuring3 through their relevance to the level of monitoring and
limits to the discretionary power of managers. The argument is that the greater the proportion
of outside directors, the more effective the board will be in monitoring the actions of
managers and limiting agency costs (Gibbs, 1993). To summarise his results, Gibbs finds that
investment opportunity is negatively related to restructuring whilst financial leverage has a
positive relationship to restructuring. The positive relationship between investment
opportunity and restructuring is consistent with the free cash flow hypothesis. The
explanation provided is that decreasing investment potential leads to a higher risk of takeover
2 Average abnormal return of 0.59% over the two-day announcement period significant at the 10% level
3 Gibbs (1993) examines financial and portfolio restructuring. Financial restructuring refers to debt
recapitalization and portfolio restructuring refers to refocusing on the core business of the firm through
divestment and horizontal integration.

8
threats which results in a greater likelihood of takeover based restructuring. However, Gibbs
also finds that leverage has a positive relationship to restructuring which is inconsistent with
the free cash flow theory. According to the theory, firms with high levels of leverage limit the
ability of managers to over-invest and engage in self-serving behaviour. These firms are
restricted by their debt repayments as these obligations have to be met regularly. Thus, they
are prevented from engaging in overinvestment as free cash is low (Jensen, 1986). Broadly,
the determinants examined by Gibbs (1993) reflect the level of agency costs or the manager-
stockholder conflict, the investment opportunities available, and the level of leverage within
the firm. Lifecycle stages are expected to differ in both cash flow and corporate governance
which according to the findings of Gibbs should in turn affect restructuring.
Barket & Duhaime (1997) classify restructuring strategies into those that are strategic and
those that are operational. Operational restructuring refers to increasing efficiency and
productivity through cost cutting measures. Strategic restructuring is necessary when the
firm’s position relative to competitors is weak. In these cases, the managers need to focus on
changing the strategy, structure, and ideology to better adapt to a changing environment.
John, Lang, & Netter (1992) review annual reports and analyst reports and classify responses
to negative earnings into five groups: (1) Contraction policies, (2) Expansion policies, (3)
Change in market or pricing, (4) Change in production methods or management structure,
and (5) Other responses.4 They find that contraction policies such as sales, divestitures,
spinoffs, debt reductions, and plant shut downs are the most dominant form of restructuring.
Similarly, Chan, Weston & Altman (1995) find that the majority of restructuring takes on the
form of divestitures rather than investment. However, looking in the long run, there is some
weak evidence that sales and assets increased from restructuring decisions. Bowman & Singh
(1993) review the literature on corporate restructuring and develop a classification of
restructuring into three main groups. These are; portfolio restructuring, organisational
restructuring, and financial restructuring. Sudarsanam & Lai (2001) expand on this
classification to encompass: managerial, operational, asset, and financial restructuring.
4 The two main categories of interest for this paper are contraction and expansion policies. Contraction policies
refer to strategies which cut down the size of the firm through divestitures and the control of expenditure. In
times of financial distress it is often not viable for a firm to continue investing funds into all lines of business.
These unprofitable or costly branches of operations can be sold off to generate much needed funds which then
can be used to repay debt. Expansion policies increase the size of the firm by increasing investments, assets,
operations, or resources. These strategies look to pull themselves out of financial distress through synergistic
cost benefits and economies of scale.

9
Managerial Restructuring
Changes in top management are argued to be one of the main conditions for successful
turnarounds as they are a tangible signal to creditors that action is being taken by the
distressed firm (Hofer 1980). Incompetent managers may have been the cause of financial
distress through poor planning or inefficient decision making. Whitaker (1999) refers this as
firm-specific distress. These managers need to be replaced with management teams who can
accurately assess the source of distress and implement strategies necessary for successful
turnaround (Lohrke, Beheian, & Palmer 2004). Pearce & Robbins (1993) also stress the
importance of management in turning distressed firms around. They argue that a management
team lacking in the skills needed to respond efficiently and in a timely manner will result in
continued decline and the eventual failure of the company. Sudarsanam and Lai (2001)
suggest that creditors will only provide continued financial support if they are reassured that
management will be able to cope with distress. Denis & Kruse (2000) find that 36% of the
sample firms they study experience managerial turnover in top executives following
performance declines. Managerial restructuring includes replacement of senior management
and/or the Chief Executive Officer. Overall, managerial restructuring may be a crucial factor
in the turnaround process of a distressed firm.
Operational Restructuring
Operational restructuring refers to the efficiency/operating turnaround stage. This stage aims
to restore profitability by controlling costs and reducing overheads through the sale of surplus
fixed resources such as land, equipment, and offices. By decreasing input and maximising
output firms can generate cash flow (at least in the short term) and enhance efficiency. When
firms recognise distress, operational restructuring is usually the first strategy implemented.
However, although necessary, operational restructuring is primarily a short term fix used to
generate cash flow quickly. Sudarsanam & Lai (2001) argue that if used as a stand-alone
strategy, it may not be enough for recovery from distress. Past literature suggests that
operational restructuring in the form of purchases are less likely than sales. Nevertheless, if
productivity can be significantly improved, distressed firms may build new plants or invest in
more advanced technology and equipment.
Asset Restructuring
When a distressed firm sells off lines of businesses which are unprofitable or not at the core
operations of the company, it is considered to be engaging in asset restructuring. The aim of

10
this form of restructuring is to realign the focus of the firm by reducing unrelated
diversification and refocusing the business portfolio around core competencies (Shleifer &
Vishnny, 1992). Chang (1996) finds that poorly performing firms will be motivated to divest
lines of business which do not generate competitive advantages. Asset restructuring allows
the firm to re-evaluate its operations and reorganise business units into more efficient groups.
This form of restructuring is especially necessary if agency costs have resulted in over-
diversification by management. By selling underperforming businesses, resources can be
redeployed towards better uses so that asset restructuring is generally considered to be value
adding (Atanassov & Kim, 2009). Asset sales are limited by industry wide factors as highly
leveraged industries are less prone to sell assets. However, this form of restructuring is found
to play an important role for distressed firms as it both provides a source of funds and acts as
a mechanism for creditors to obtain control over assets (Brown, James & Mooradian, 1994).
Divestment of subsidiaries and divisions is argued to be the most common turnaround
strategy used by all but the smallest of firms as these firms are less likely to have subsidiaries
and non-essential business operations which they can afford to sell off (Sudarsanam & Lai,
2001).
Although contraction policies have been found to be the dominant form of restructuring
(John, Lang, & Netter 1992), asset restructuring could also refer to actions which increase the
size of the firm such as investments, strategic alliances, joint ventures, and licensing
agreements (Sudarsanam & Lai 2001). For example, acquisition of related businesses that fit
core competencies could help to increase the competitive advantage of distressed firms
through economies of scale. These restructuring strategies are risky however as they require
capital expenditure from firms already experiencing low cash flows. Since smaller firms will
generally have lower cash reserves, this form of restructuring may not be appropriate or
possible.
Financial Restructuring
Financial restructuring generally refers to changes in the firm’s capital structure in terms of
leverage. This seeks to reduce payment pressures through equity-based and debt-based
strategies. Where equity-based strategies may involve dividend cuts or issuance of shares as a
means to retain or generate funds, debt-based strategies involve the adjustment of interest,
maturity, or debt/equity ratio. DeAngelo & DeAngelo (1990) find that large firms are likely
to respond to distress with rapid and aggressive dividend reductions. Funds retained are then

11
able to be used to pay debt obligations. Share issues are another way in which distressed
firms can generate funds to support continued operations.
2.3 Restructuring Effectiveness
Past research have also examined factors which affect the success of completing certain
restructuring strategies. Moulton & Thomas (1993) find that firm size dominates all other
variables in predicting successful completion of the reorganization process. Large firms with
varied assets are more likely to successfully restructure as they are better able to survive
substantial losses, have more businesses to serve as the core, and have sufficient assets which
can be sold to provide cash for continued operations. Rate of decline or severity of financial
distress as measured by the number of years in which the firm had negative net income
during the six years prior to bankruptcy is also found to be a significant determinant of
restructuring success (Whitaker, 1999). Sudarsanam & Lai (2001) study a sample of
potentially bankrupt UK firms and find that recovery firms have more focus on growth and
external market strategies whereas non-recovery firms engage in fire-fighting actions. Using
logit and linear regressions, they find that recovered firms are more likely to engage in
investments and acquisitions in their restructuring decisions. This suggests that firms that
recover from distress are more expansionary, forward looking, and have an external market
focus. Non-recovered firms are found to be more internally focused and engage in short term
fire-fighting techniques of operational and financial restructuring. Barker and Duhaime
(1997) also argue that successful turnaround depends on the firm’s ability to change its
strategy, structure, and ideology rather than restructuring based on short term efficiency or
cost cutting tactics. They find that effective restructuring results from shifting the strategic
change to better suit the needs of the market and the competitive environment in which a firm
operates. Cost-cutting and layoffs are also found to be ineffectual strategies by Denis &
Kruse (2000) who find that improvements in operating performance are mostly attributable to
asset restructuring.
3.0 Hypotheses Development
As firms in the birth stage have highly centralised power structures (Miller & Friesen 1984),
it is more likely that the managers are also the owners. This suggests that there will be less
external pressure for a change in management when the firms are in distress and therefore
firms in the birth stage are less likely to engage in managerial restructuring. We would also

12
expect that birth and growth firms are less likely to have outside blockholders or to be
influenced by external shareholder pressures since there is a close manager-owner
connection. Kang & Shivdasani (1997) find that there exists a positive relationship between
outside blockholders and the probability of top management turnover in Japanese firms.
Bethel & Liebeskind (1993) also find that the prominence of managerial restructuring found
in the U.S. in the late 80’s was due outside pressure by blockholders. Based on these
arguments, the hypothesis is stated as:
H1: Firms in the birth stage are less likely to use managerial restructuring compared to firms
in growth, maturity, and decline stages.
Similarly, younger firms also engage in low levels of operational or asset restructuring due to
the limited range of product lines available to them. It has been argued that the greater the
diversification and the larger the size of a firm, the greater the capacity for change during the
turnaround process (Barker & Duhaime 1997). Furthermore, Brown, James, & Mooradian
(1994) argue that shareholders of distressed firms have little incentive to sell assets. It is up to
creditors to apply pressure on management to sell assets and generate funds so that debt
repayments can be made. Kang & Shivdasani (1997) examined Japanese firms and find
similar results where the probability of asset contractions increases with equity ownership by
a firm’s main bank. As was previously argued, younger firms have higher costs of debt
financing and would therefore be less likely to be subject to strong creditor pressure to sell
off investments.
Bowman & Singh (1993) argue that an increased equity stake of managers and board
members are negatively associated with portfolio restructuring. Their definition of portfolio
restructuring corresponds to asset restructuring in that it refers to significant changes in the
line of business through acquisition and divestiture. This suggests that younger firms with
more centralized ownership structures would engage in less portfolio/asset restructuring
given that the equity stake of managers is closely linked to that of owners. Birth and growth
firms are also more focused on business expansion. It is therefore likely that they would
attempt to seek other restructuring options during distress in order to maintain future growth
potential in the form of investments.

13
Since mature firms are more likely to have higher debt capacities and therefore more
creditors, asset restructuring should increase as a firm matures. This is confirmed by papers
which find that firms with greater amounts of debt are more likely to sell assets to repay debt
(Brown, James & Mooradian 1992), and those with close ties to outside banks and larger
blockholders engage in more asset sales (Kang & Shivdasani 1997).
Corresponding to the above arguments, Sudarsanam & Lai (2001) find that acquisition and
divestment (asset restructuring) is perhaps the most common turnaround strategy employed
by all but the smallest of firms. They argue that asset restructuring is especially important in
turnaround for firms in mature or declining product/markets. As we generally expect firm
size to increase with age, the hypothesis is stated as follows:
H2: Firms in the birth stage are less likely to use asset restructuring compared to firms in
growth, maturity, and decline stages.
During distress, firms in the birth stage will have less capacity for managerial, asset and
financial restructuring relative to firms in growth, maturity, and decline. This is due to the
highly centralized power structure, limited availability of non-core investments, and a high
cost of capital. These factors will force young firms to engage in high levels of operational
restructuring such as the sale of property, plant, and equipment to pull themselves out of
distress.
H3: Firms in the birth stage are more likely to use operational restructuring strategies
compared to firms in the growth, mature and decline stages.
In terms of financial restructuring, older and more established firms may be able to negotiate
debt restructuring more effectively than younger firms (Sudarsanam & Lai 2001). Younger
firms face greater uncertainties surrounding new ideas and products (Mueller 1972) which
results in greater difficulties in raising outside funds. This leads to young firms being subject
to higher costs of capital. Banks are also more likely to loosen financial constraints when
borrowing firms have collateral (Asquith, Gertner & Scharfstein 1994) which would be more
likely for mature firms who have good credit histories and a greater availability of capital.
Young firms are also less liquid and have smaller debt capacities relative to more mature

14
firms. This is confirmed by Bulan & Yan (2009) who find that on average, firms in the mature
stage of the lifecycle are older, larger, more profitable, and have higher leverage.
H4: Firms in the birth stage are less likely to use debt based financial restructuring
strategies compared to firms in the growth, maturity, and decline stages
With equity, dividend payout ratios are also dependent on a firm’s lifecycle stage. Mueller
(1972) argues that during the early stage of rapid growth, stockholders will want all of the
capital consumption allowances reinvested. This suggests that young firms will be paying
fewer dividends as funds will be allocated towards generating further expansion. When
growth potential declines, an ever increasing share of profits will go towards dividends.
DeAngelo & DeAngelo (1990) find that large firms respond to financial distress with rapid
and aggressive dividend reductions due to liquidity constraints.
H5: Firms in the birth stage are less likely to use equity based financial restructuring
strategies compared to firms in the growth, maturity, and decline stages.
4.0 Data
We investigate the implications of lifecycle theory of the firm on its choice of restructuring
strategies when faced with distress. In particular, our sample firms are constructed from U.S.
firm data available on CRSP and COMPUSTAT between 1995 and 2006. Our sample does
not include firms from the utilities and financials industries since these industries operate in a
more controlled environment and are distinct to firms in other industries. First, we classify
our firms into their lifecycle stages. Next, we identify firms that are financially distressed and
those that are not. Finally, we use a series of proxies to determine which restructuring
strategies are used by our sample firms.
Identification of lifecycle
First, we adopt Anthony and Ramesh’s (1992) method of classifying firms into the four
lifecycle classifications: birth, growth, maturity and decline. As a firm matures, growth will
slow down as sales stabilize and market saturation occurs. It makes sense that a firm will
maximise growth early in its lifecycle in order to create competitive advantages, acquire
market share, and build capacity (Anthony & Ramesh, 1992). Porter (1980) states that mature
firms will find investments less rewarding (relative to younger firms) which leads to

15
declining market growth. If investment opportunities decrease, capital expenditure will also
fall. More established firms will invest less into business operations and consequently more
will be paid out to shareholders as dividends. Dividend payouts will therefore increase as
firms grow older. Therefore, using univariate and multivariate ranking procedures, Anthony
and Ramesh classify firms into the four lifecycle categories based on the following four
lifecycle descriptors: annual dividends, scaled by income; percentage of sales growth; capital
expenditure as a proportion of firm value and age of firm.
1. Annual dividend as a percentage of income (DP)
��� � � �������� �100
2. Percent sales growth (SG)
��� � � �������� �100
3. Capital expenditure as a percentage of total value of the firm (CEV)
��� � � ������� �100
4. Age of the firm (AGE)
Where:
DIV t = common dividends in year t
IBED t = income before extraordinary items and discontinued operations in year t
SALES t = net sales in year t
CE t = capital expenditure in year t
VALUE t = market value of equity plus book value debt at year t
AGE t = number of years information is available for the firm on CRSP/Compustat
Industries differ in their dividend payment, sales growth, capital expenditure and age. We
control for the industry effect when grouping our firms into the four lifecycle categories. We
first calculate the four lifecycle descriptors for each year for each sample firm. Then for each
firm-year, median values of the descriptors (denoted MDP, MSG, MCEV, MAGE) are

16
computed using five years’ data (i.e., current year and prior four years). Next, using the
Fama-French 49 industry grouping, we split the median values of the descriptors (for each of
the industry) into quartiles and group the firms into the four lifecycle categories. Once a firm
year is assigned to a category, it is given a score (median values less than Q1 =1, median
values between Q1 and less than Q2 =2, median values between Q2 and less than Q3 =3 and
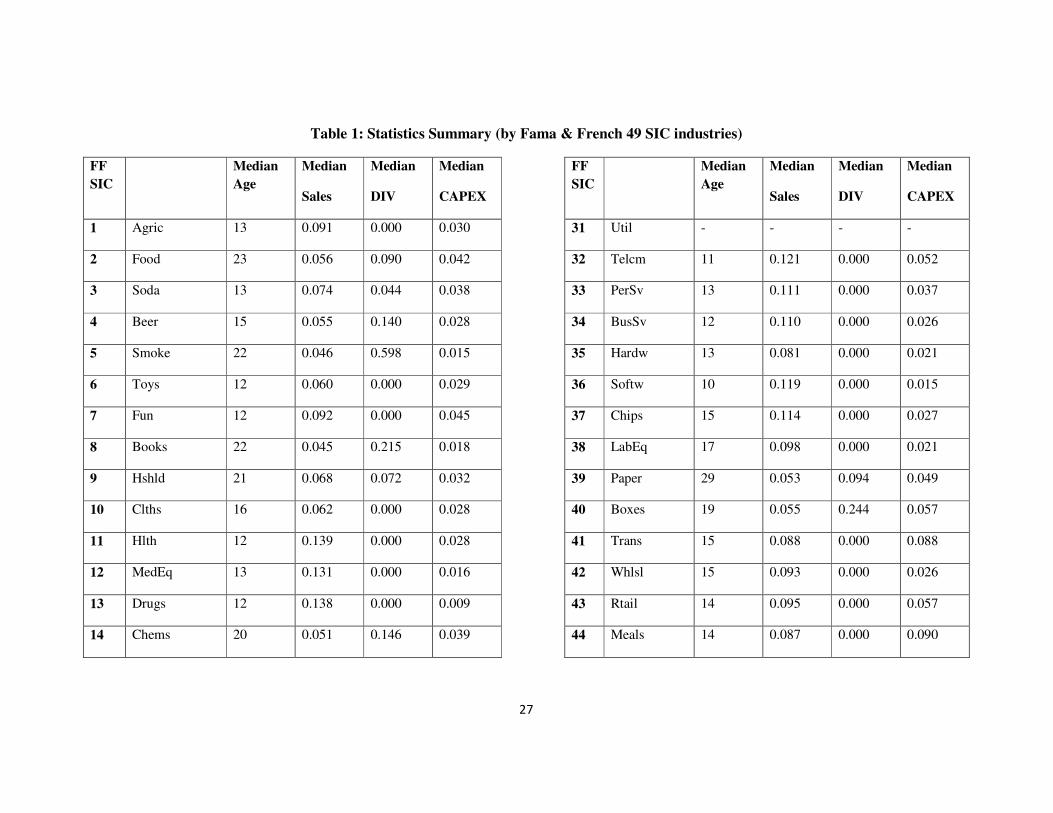
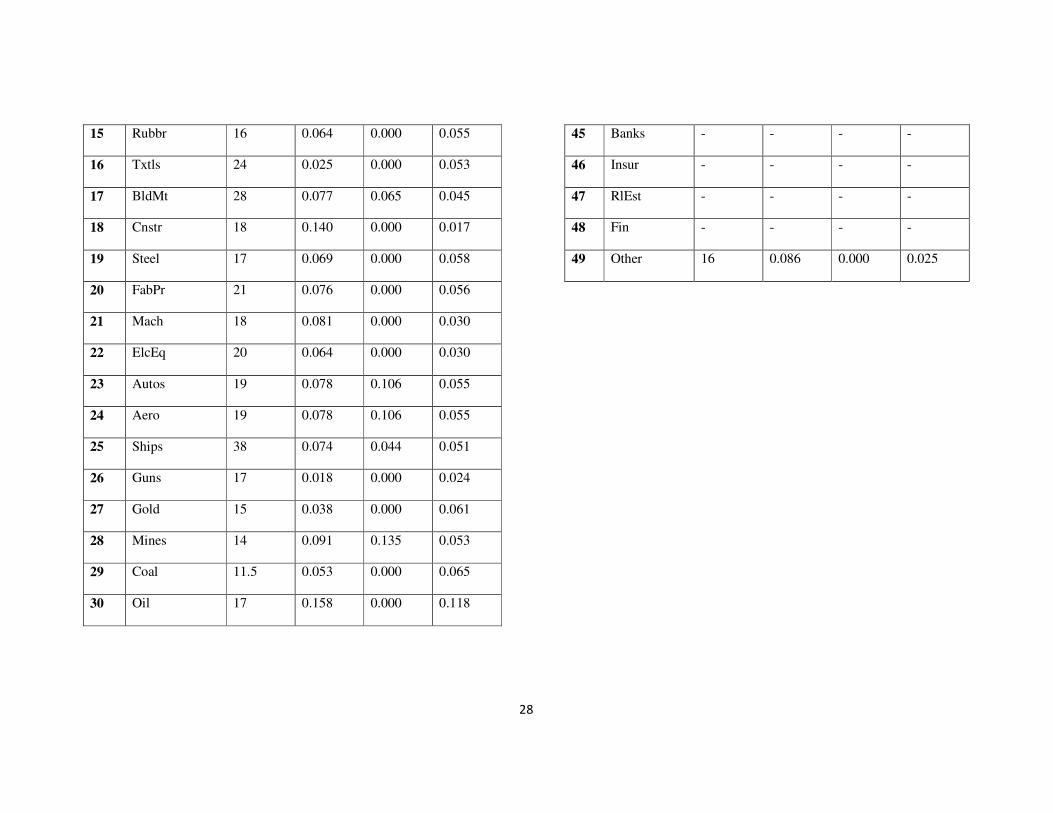
median values equal to Q3 and above =4). Table 1 presents the statistics summary for the
median values by Fama & French 49 SIC industries grouping.
[TABLE 1 ABOUT HERE]
We then sum up the scores for each firm year and further split all observations into quartiles
again. Firms are then finally categorised into the four lifecycle classifications: birth, growth,
maturity and decline, based on the cut-off values of the quartiles.
Identification of distress
Asquith, Gertner and Scharfstein (1994) argue that a firm is classified as being in distress if
in any two consecutive years, the firm’s earnings before interest, taxes, depreciation and
amortization (EBITDA) is less than its reported expense. Sudarsanam and Lai (2001) use
Taffler’s Z-score and adopt a positive, positive, negative approach to classify a firm being in
distress. They define a financially distress firm as one which has positive Z-scores in the two
previous years and a negative Z-score in the current year. Combining the two approaches, we
classify a firm to be financially distressed when it has two consecutive years of negative
EBITDA after a year of positive EBITDA. For example, firms classified as in distress in
1995 (the commencement of our sample period) have a positive EBITDA in 1993 and
negative EBITDAs in 1994 and 1995. Those firms that have positive EBITDA for all three
years (i.e., 1993 to 1995) are labelled as non-distress firms in 1995. Table 2 presents the
breakdown of the number of distress firms and non-distress firms by the four lifecycle
categories.
[TABLE 2 ABOUT HERE]

17
Figure 1 also shows the dispersion of distress firms across the sample period. An inspection
of Figure 1 shows that there was a sharp increase in distress firms over three general cycles:
the 1997/1998 Asian finacial crisis, the 2001/2002 tech-stock crash and the pre-2007/2008
Global Financial Crisis.
[FIGURE 1 ABOUT HERE]
Managerial Restructuring
We define a firm as engaging in managerial restructuring if it has replaced one of its top tier
management, being the Chief Executive Officer (CEO) or Managing Director (MD). We
obtained information on CEO or MD replacement from the S&P Executive Compensation
database. Similar to Atanassov and Kim (2009), managerial restructuring is taken to have
occurred if a CEO or MD changes during the distress period (i.e., year t). The reason for
leaving and age of the management is also examined to ensure that none of the replacements
are due to death, illness, or retirement.
Restructuring strategies: Operational /Asset
Operational and asset restructuring is generally the first broad strategy undertaken by firms.
We look at a number of operational and asset restructuring strategies including reducing
investments, reducing cost of goods sold, laying off employees and selling off assets.
Similar to Kang and Shivdasani (1997), a strategy to reduce investments (sell off assets) is
deemed to be taken by a firm if its investing activities - proxied by COMPUSTAT item
IVNCF (total (net) property, plant and equipment) falls more than 15% between year t-1 and
year t or year t+1, where t is the observed firm year; for distress firms, year t is also their year
of distress. For the strategy of reducing cost of goods sold, we follow Atanassov and Kim
(2009) where this strategy is implemented if its Cost of Goods Sold (scaled by Sales) is
initially above the industry median in year t-1 and falls to the bottom quartile of its industry’s
median in year t or year t+1. A firm is deemed to have undertaken the strategy of laying off
its employees if it has a more than 20% drop in the number of employees between year t-1
and year t or t+1 (Denis & Kruse, 2000).

18
Restructuring strategies: Financial
Financial restructuring typically includes cutting or omitting dividends, issuing new security
and exchanging debt for equity. Following Chen and Zhang (1998), a firm is deemed to have
undertaken the strategy to cut or omit dividends if it experiences more than a 25% drop in its
total dividends paid between year t-1 and year t or t+1. We define a firm to have issued
equity (debt) when the firm’s net equity (net debt) exceeds 5% of the book value of its total
asset at year t (Hovakimian, Hovakimian and Tehranian, 2004)
Table 3 describes the definition of the variables discussed above.
[TABLE 3 ABOUT HERE]
5.0 Analyses and Findings
Lifecycle theory, distress firms and restructuring strategies
We first examine if firms in the birth stage are less likely to use managerial restructuring
compared to firms in growth, maturity, and decline stages by running a logistic regression
where the dependent variable takes on the value of one if the CEO/MD has left the company
and zero otherwise.
iit
itititit
ititititit
nalInstitutio
etsLnTotalAssTobinsQFDDECLINEFDMATURE
FDGROWTHDECLINEMATUREGROWTHCEO
εα
αααα
ααααα
++
++++
++++=
10
9876
54321
**
*
Eqn (1)
GROWTH, MATURE and DECLINE are the lifecycle dummies that take the value 1 for the
respective lifecycle stages and zero otherwise. FD is the dummy for distress firm and takes
the value of 1 if a firm is distress and zero otherwise. We have also added three control
variables namely: TobinsQ (to control for the growth opportunities), LnTotalAssets (to
control for the firm size) and Institutional (to control for the institutional ownership in the
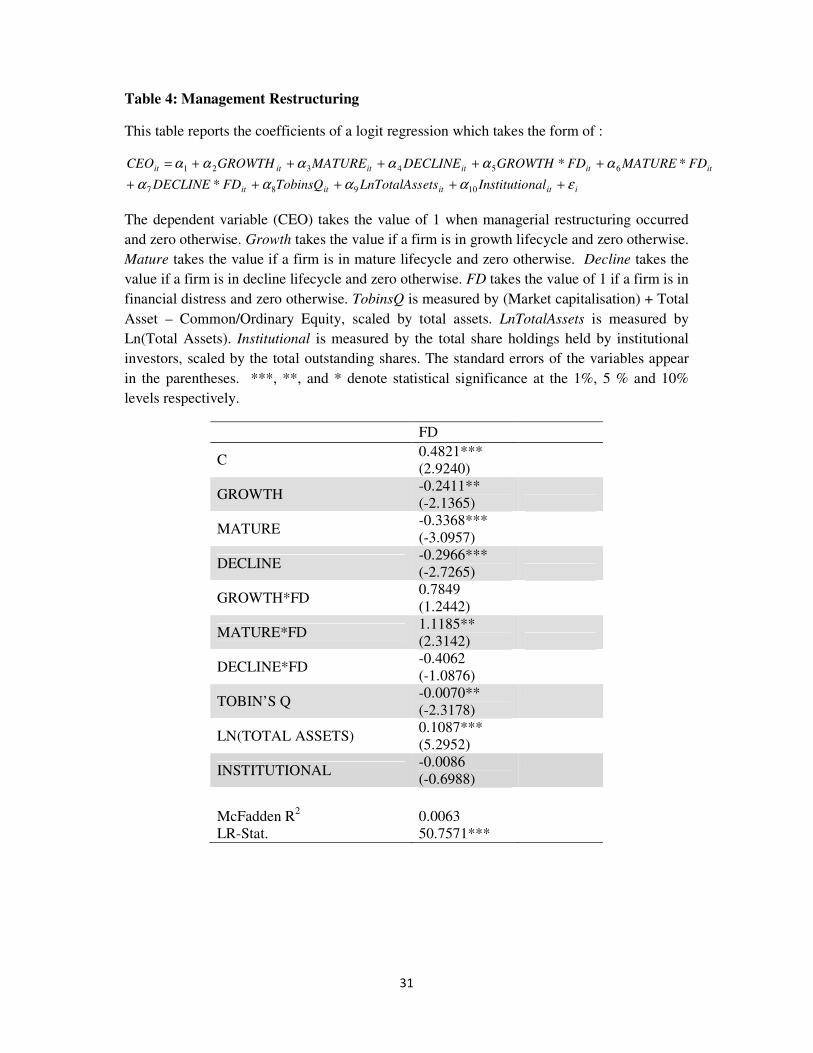
firm). Table 4 presents the results.
[TABLE 4 ABOUT HERE]

19
Since our research question seeks to answer if there is a systematic difference in the choice of
restructuring strategies undertaken by distress firms when they are in different lifecycle
stages, we focus our discussion on the interaction between lifecycle stage and distress. These
dummies allow us to separate the restructuring which occurs due to financial distress from the
normal strategies. In Table 4, we find that the FDMATURE* coefficient is 1.1185
(statistically significant at the 5% level). This is consistent with lifecycle theory. When
compared to firms in the birth stage, mature firms have more complex business operations.
Incompetent managers need to be replaced with others who can accurately assess the source
of distress and implement strategies necessary for a successful turnaround. The coefficients
of 0.7849 and -0.4062 for the growth and decline firms respectively are not statistically
significant. This suggests that there is no difference in the use of managerial restructuring
strategies between these two groups and the birth firms. Growth firms are likely to be still
dominated by the same top management/CEO since the birth stage, whereas it may be too late
to use such restructuring strategy for decline firms as it may be very difficult to employ new
management/CEO since the firms are close to filing bankruptcy.
We next examine if firms in the birth stage are less likely to use operational/asset
restructuring strategies compared to firms in growth, maturity, and decline stages by running
the following logistic regression:
iitit
itititit
itititit
nalInstitutioetsLnTotalAss
TobinsQFDDECLINEFDMATUREFDGROWTH
DECLINEMATUREGROWTHgstructurin
εαα
αααα
αααα
+++
++++
+++=
109
8765
4321
***
Re
Eqn (2)
We run the regression in Equation 2 four separate times, each time replacing the dependent
variable for the various operational/asset restructuring strategies: (1) reducing in investing
activities (INV), (2) reducing cost of goods sold (COGS), (3) laying off employees (EMP) and
(4) asset sales (ASSETS). Table 5 reports the findings.
[TABLE 5 ABOUT HERE]
Birth firms and growth firms are expected to have accumulated less resources than mature
and decline firms in the course of business. This is because these firms (birth and growth)
will be still pursuing a growth based strategy focused on expansion. It is therefore likely that

20
they will attempt to use other restructuring options during distress in order to maintain future
growth potential in the form of investments than engaging in operational or asset
restructuring. Furthermore, since birth and growth firms are more focused on business
expansion, they will have the least amount of non-essential property, plant, and equipment
with which they can sell or the less number of employees to lay off, even if they are in
distress. When we examine the regression result for firms to engage in operational/asset
restructuring strategies, all (except one) columns of Table 5 show that distress firms higher in
the lifecycle hierarchy are more likely to engage in operational/asset restructuring strategies
relative to birth firms; the coefficients ranging between 0.7361 and 1.5673 are all statistically
significant at the 1% level.
Financial restructuring typically includes issuing new securities, cutting/omitting dividends
and exchanging debt for equity. We examine if firms in the birth stage are less likely to use
financial restructuring strategies compared to firms in growth, maturity, and decline stages by
running the following logistic regression:
iitit
itititit
itititit
nalInstitutioetsLnTotalAss
TobinsQFDDECLINEFDMATUREFDGROWTH
DECLINEMATUREGROWTHgstructurin
εαα
αααα
αααα
+++
++++
+++=
109
8765
4321
***
Re
Eqn (3)
We run the regression in Equation 3 for three separate dependent variables: reduction of
dividend (DIV), issuing of debt (NetDebt) and issuing of equity (NetEquity). Table 6 presents
the results for the financial restructuring.
[TABLE 6 ABOUT HERE]
When examining Column 1 in Table 6, we find that compared to the distress birth firms, the
rest of the firms are more likely to engage in a reduction in dividends; the coefficients of
1.2456, 1.7517 and 1.4345 are all statistically significant at 1% level for the distress growth,
mature and decline firms. Distress growth and mature firms are more likely to reduce
dividend payments in order to preserve investments and resources so that future expansion is
not stymied. Decline firms in distress may be forced to decrease dividends due to increasing

21
creditor pressure. Comparing the above findings to the individual lifecycle dummies, in the
normal course of business, firms of all lifecycles are unlikely to engage in dividend cuts;
coefficients of -0.2512, -0.6244 and -0.7627 for growth, mature and decline respectively are
all statistically significant at 1% level. Dividend policies are often sticky. Firms will avoid
cutting or omitting dividends as this could give a wrong signal to the market that the firms are
performing poorly. However, when distress sets in, these firms will be forced to cut
dividends.
When firms are in distress, capital can be raised through the issuance of common shares. In
the Column 3 of Table 6, we find that all growth, mature and decline firms are more likely to
raise equity when in distress. In contrast, we find that they are less likely to raise external
funding using debt when in distress. The coefficients are between -0.5006 and 2.0717 and are
all statistically significant at 1% and 5% levels. This is consistent with the pecking order
hypothesis where firms will resort to raising external funds through issuance of equity when
in distress. A possible explanation for distress birth firms not raising new equity (relative to
the other firms) is that they have limited capacity; birth firms are not as well established as
the other firms and investors prefer firms with more established track records. As debt
financing is less transparent compared to equity, it is easier for distress birth firms to engage
in debt financing.
Restructuring Effectiveness
In the preceding section, we report evidence consistent with the lifecycle theory and that
firms are only likely to engage in certain restructuring strategies (depending on which stage
of the lifecycle they are in) when in distress. However, the ability to engage in a strategy does
not necessary mean that the distress firm will be able to turnaround its poor performance.
They may still continue to falter and may eventually find themselves filing for bankruptcy.
For the sample of distress firms only, we examine the success of the restructuring strategies
used. We define a “recovered” firm as one that has at least two consecutive years of positive
EBITDA after being previously classified as in distress. For example, a distress firm in 1995

22
is deemed to have turned around if its EBITDA is positive in 1996 and 1997. We run the
following logistic regression to examine the success of restructuring strategies for distress
firms:
iit
ititit
ititit
nalInstitutio
etsLnTotalAssTobinsQgsstructurinDECLINE
gsstructurinMATUREgsstructurinGROWTHery
εα
ααα
ααα
++
+++
++=
7
654
321
Re*
Re*Re*covRe
Eqn (4)
The dependent variable, Recovery, takes the value 1 if a distress firm recovers from distress
and zero otherwise. The interacted variables, Restructuring, represent the managerial,
operational/asset and financial restructuring strategies, examined in the previous section.
Table 7 presents the effectiveness of the restructuring strategies.
[TABLE 7 ABOUT HERE]
When examining the results in Table 7, we find that none of the restructuring strategies
appear to have any impact. However, we find that distress growth and mature firms that
raised external funds by issuing equities are less likely to recover from distress, relative to the
distress birth firms who used the same strategy; the coefficients for the growth and mature
firms are -1.1145and -1.2313, statistically significant at 5% and 1% respectively. Compared
to the distress growth and mature firms, it is likely birth firms are not as distressed. After all,
birth firms are in their infancy and in the commencement of their business operations. Since
birth firms are more likely to be dominated and managed by their owners, these managers-
owners certainly have more incentives to make sure the firms turn round as they are more
likely to have personal funds in the firms. Finally, we also find a weak evidence to suggest
that mature firms that replaced their incompetent managers are less likely to have a successful
turnaround from their financial distress. Given the complexity of their business operations, it
is unlikely for the new manager to turn the firms around within the short time-span of 2 years.
6.0 Conclusions
When firms suffer from poor operating performance, shareholders may pressure management
to undertake restructuring actions to improve firm performance. Creditors also may demand

23
corrective measures, especially when debt covenants are violated. While the decision on
which corrective measures to be used is decided by the management, management may be
limited in their measures, depending on which lifecycle stage the firm is in.
We examine the implications of the lifecycle theory on how a distress firm chooses its
restructuring strategies. We find evidence that distress firms’ access to different types of
restructuring strategies is limited by the lifecycle stages they are in: there are systematic
differences between firms in different lifecycles when choosing a restructuring strategy.
However, even for those able to implement restructuring strategies, there is no guarantee that
the strategies are successful.

24
References
Adizes, I 2004, Managing Corporate Lifecycles, 2nd edn, Adizes Institute.
Anthony, J & Ramesh, K 1992, 'Association Between Accounting Performance Measures and
Stock Prices: A Test of the Lifecycle Hypothesis', Journal of Accounting and Economics,
15(2-3), 203-227.
Asquith, P, Gertner, R & Scharfstein, D 1994, 'Anatomy of Financial Distress: An
Examination of Junk-Bond Issuers', The Quarterly Journal of Economics, 109 (3), 625-
658.
Atanassov, J & Kim, H 2009, 'Labor and Corporate Governance: International Evidence from
Restructuring Decisions', The Journal of Finance, 64(1), 341-373.
Barker, V & Duhaime, I 1997, 'Strategic Change in the Turnaround Process: Theory and
Empirical Evidence', Strategic Management Journal, 18(1), 13-38.
Bethel, J. E.& Liebeskind, J., The Effects of Ownership Structure on Corporate
Restructuring, Strategic Management Journal, 14, Summer 1993, 15-31.
Bowman, E & Singh, H 1993, 'Corporate Restructuring: Reconfiguring the Firm', Strategic
Management Journal, 14, 5-14.
Brown, D, James, C & Mooradian, R 1992, 'The Information Content of Distressed
Restructurings Involving Public and Private Debt Claims', Journal of Financial
Economics, 33, 93-118.
Brown, D, James, C & Mooradian, R 1994, 'Asset Sales by Financially Distressed Firms',
Journal of Corporate Finance, 1(2), 233-257.
Bulan, L. & Yan, Z., 2009, ‘The pecking order of Financing in the Firm’s Life Cycle’,
Banking and Finance Letters, 1 (3), 129-40.
Chang, SJ 1996, 'Evolutionary Perspective on Diversification and Corporate Restructuring:
Entry, Exit, and Economic Performance During 1981-1989', Strategic Management
Journal, 17 (8), 587-611.
Chen, N. & Zhang, F., 1998, ‘Risk and Return of Value Stocks’, Journal of Business, 71 (4),
501-35
Chen, Y, Weston, F & Altman, E 1995, 'Financial Distress and Restructuring Models',
Financial Management, 24(2), 57-75.
DeAngelo, H & DeAngelo, L 1990, 'Dividend Policy and Financial Distress: An Empirical
Investigation of Troubled NYSE Firms', The Journal of Finance, 45(5), 1415-1431.

25
Denis, D & Kruse, T 2000, 'Managerial Discipline and Corporate Restructuring Following
Performance Declines', Journal of Financial Economics, 55, 391-424.
Gibbs, P 1993, 'Determinants of Corporate Restructuring: The Relative Importance of
Corporate Governance, Takeover Threat, and Free Cash Flow', Strategic Management
Journal, 14(1), 51-68.
Hendel, I 1996, 'Competition Under Financial Distress', The Journal of Industrial Economics,
44(3), 309-324.
Hofer, C 1980, 'Turnaround Strategies', Journal of Business Strategy, 1(1), 19-31.
Hovakimian, A., Hovakimian, G., Tehranian, H., 2004. Determinants Of Target Capital
Structure: The Case Of Dual, Debt And Equity Issues, Journal of Financial Economics, 71
(3), 517-540.
Jensen, M 1986, 'Agency Costs of Free Cash Flow, Corporate Finance, and Takeovers',
American Economic Review, 76, 323-329.
Jensen, M 1989, 'The Eclipse of the Public Corporation', Harvard Business Review, 5, 61-74.
John, K, Lang, L & Netter, J 1992, 'The Voluntary Restructuring of Large firms in Response
to Performance Decline', The Journal of Finance, 47(3), 891-917.
Kang, J-K & Shivdasani, A 1997, 'Corporate Restructuring during Performance Declines in
Japan', Journal of Financial Economics, 102, 510-546.
Lohrke, F, Bedeian, A & Palmer, T 2004, 'The Role of Top Management Teams in
Formulating and Implementing Turnaround Strategies: A Review and Research Agenda',
International Journal of Management Reviews, 5-6 (2), 63-90.
Lubos, P & Peitro, V 2003, 'Stock Valuation and Learning About Profitability', Journal of
Finance, 58, 1749-1989.
Miller, D & Friesen, PH 1984, 'A Longitudinal Study of the Corporate Life Cycle',
Management Science, 30 (10), 1161-1183.
Moulton, W & Thomas, H 1993, 'Bankruptcy as a Deliberate Strategy: Theoretical
Considerations and Empirical Evidence', Strategic Management Journal, 14(2), 125-135.
Mueller, D 1972, 'A Life Cycle Theory of the Firm', The Journal of Industrial Economics,
20(3), 199-219.
Pashley, M & Philippatos, G 1990, 'Voluntary Divestitures and Croporate Life-cycle: Some
Empirical Evidence', Applied Econmics, 22, 1181-1196.
Pastor, L. & P. Veronesi 2003, ‘Stock Valuation and learning about profitability” Journal of
Finance, 58, 1749-89

26
Pearce, J. A. II, & Robbins, D. K. (1993). Toward improved theory and research on business
turnaround. Journal of Management, 19(3), 613–637.
Porter, ME 1980, Competitive Strategy: Techniques for Analysing Industries and
Competitors, Free Press, New York.
Quinn, R & Cameron, K 1983, 'Organizational Lifecycles and Shifting Criteria of
Effectiveness: Some Preliminary Evidence', Management Science, 29 (1), 33-51.
Shleifer, A & Vishny, R 1992, 'Liquidation Values and Debt Capacity: A Market Equilibrium
Approach', Journal of Finance, 47(4), 1343-1366.
Sudarsanam, S & Lai, J 2001, 'Corporate Financial Distress and Turnaround Strategies: An
Empirical Analysis', British Journal of Management, 12, 183-199.
Thietart, R & Vivas, R 1984, 'An Empirical Investigation of Success Strategies for
Businesses Along the Product Life Cycle', Management Science, 30(12), 1405-1423.
Whitaker, R 1999, 'The Early Stages of Financial Distress', Journal of Economics and
Finance, 23(2), 123-133.
Wruck, K 1990, ‘Financial distress, reorganization, and organizational Efficiency’, Journal of
Financial Economics, 27, 419-444.
27
Table 1: Statistics Summary (by Fama & French 49 SIC industries)
FF
SIC
Median
Age
Median
Sales
Median
DIV
Median
CAPEX
FF
SIC
Median
Age
Median
Sales
Median
DIV
Median
CAPEX
1 Agric 13 0.091 0.000 0.030 31 Util - - - -
2 Food 23 0.056 0.090 0.042 32 Telcm 11 0.121 0.000 0.052
3 Soda 13 0.074 0.044 0.038 33 PerSv 13 0.111 0.000 0.037
4 Beer 15 0.055 0.140 0.028 34 BusSv 12 0.110 0.000 0.026
5 Smoke 22 0.046 0.598 0.015 35 Hardw 13 0.081 0.000 0.021
6 Toys 12 0.060 0.000 0.029 36 Softw 10 0.119 0.000 0.015
7 Fun 12 0.092 0.000 0.045 37 Chips 15 0.114 0.000 0.027
8 Books 22 0.045 0.215 0.018 38 LabEq 17 0.098 0.000 0.021
9 Hshld 21 0.068 0.072 0.032 39 Paper 29 0.053 0.094 0.049
10 Clths 16 0.062 0.000 0.028 40 Boxes 19 0.055 0.244 0.057
11 Hlth 12 0.139 0.000 0.028 41 Trans 15 0.088 0.000 0.088
12 MedEq 13 0.131 0.000 0.016 42 Whlsl 15 0.093 0.000 0.026
13 Drugs 12 0.138 0.000 0.009 43 Rtail 14 0.095 0.000 0.057
14 Chems 20 0.051 0.146 0.039 44 Meals 14 0.087 0.000 0.090
28
15 Rubbr 16 0.064 0.000 0.055 45 Banks - - - -
16 Txtls 24 0.025 0.000 0.053 46 Insur - - - -
17 BldMt 28 0.077 0.065 0.045 47 RlEst - - - -
18 Cnstr 18 0.140 0.000 0.017 48 Fin - - - -
19 Steel 17 0.069 0.000 0.058 49 Other 16 0.086 0.000 0.025
20 FabPr 21 0.076 0.000 0.056
21 Mach 18 0.081 0.000 0.030
22 ElcEq 20 0.064 0.000 0.030
23 Autos 19 0.078 0.106 0.055
24 Aero 19 0.078 0.106 0.055
25 Ships 38 0.074 0.044 0.051
26 Guns 17 0.018 0.000 0.024
27 Gold 15 0.038 0.000 0.061
28 Mines 14 0.091 0.135 0.053
29 Coal 11.5 0.053 0.000 0.065
30 Oil 17 0.158 0.000 0.118

29
Table 2: Breakdown of the number of distress firm years and non-distress firms years
by the four lifecycle categories
Distress Firms Non-Distress Firms Total
Birth 157 4190 4347
Growth 328 7660 7988
Mature 387 8559 8946
Decline 263 8770 9032
Total 1134 29179 30313

30
Table 3: Definition of Variables
This table presents the definition of the variables employed in this paper.
Dependent Variables
CEOit = Dummy variable where it is equal to one if the CEO of the firm is replaced
and zero otherwise.
INVit = Dummy variable where it is equal to one if the firm experiences more than
15% decrease in investment activities from year t-1 to year t or t+1 and zero
otherwise.
COGSit = Dummy variable where it is equal to one if the firm’s [Cost of good
sold/Sales] is initially above the industry median at year t-1 and falls to the
bottom quartile of its industry in year t or year t+1 and zero otherwise.
EMPit = Dummy variable where it is equal to one if the firm experiences more than
20% drop in the number of employees from year t-1 to year t or t+1 and
zero otherwise.
ASSETSit = Dummy variable where it is equal to one if the firm experiences more than
15% drop in its total property, plant and equipment (net) from year t-1 to
year t or t+1 and zero otherwise.
DIVit = Dummy variable where it is equal to one if the firm experiences more than
25% drop in its total dividends from year t-1 to year t or t+1 and zero
otherwise.
NetDebtit = Dummy variable where it is equal to one if Net Debt exceeds 5% of the
book value of total asset at year t or t+1 and zero otherwise. Net Debt is
measured by Compustat item: DLTIS (Data 111) less DLTR (Data 114).
Net Equityit = Dummy variable where it is equal to one if Net Equity exceeds 5% of the
book value of total asset at year t or t+1 and zero otherwise. Net Debt is
measured by Compustat item: SSTK (Data 108) less PRSTKC (Data 115).
Independent Variables
Toibn’s Qit
= Market capitalisation) + Total Asset – Common/Ordinary Equity, scaled by
total assets at year t.
LnTotal Assetsit
= Natural logarithm of company i's total asset at year t.
Institutionalit = The proportion of shares held by institutional investors reported in file s13
at year t.
31
Table 4: Management Restructuring
This table reports the coefficients of a logit regression which takes the form of :
iitititit
itititititit
nalInstitutioetsLnTotalAssTobinsQFDDECLINE
FDMATUREFDGROWTHDECLINEMATUREGROWTHCEO
εαααα
αααααα
+++++
+++++=
10987
654321
*
**
The dependent variable (CEO) takes the value of 1 when managerial restructuring occurred
and zero otherwise. Growth takes the value if a firm is in growth lifecycle and zero otherwise.
Mature takes the value if a firm is in mature lifecycle and zero otherwise. Decline takes the
value if a firm is in decline lifecycle and zero otherwise. FD takes the value of 1 if a firm is in
financial distress and zero otherwise. TobinsQ is measured by (Market capitalisation) + Total
Asset – Common/Ordinary Equity, scaled by total assets. LnTotalAssets is measured by
Ln(Total Assets). Institutional is measured by the total share holdings held by institutional
investors, scaled by the total outstanding shares. The standard errors of the variables appear
in the parentheses. ***, **, and * denote statistical significance at the 1%, 5 % and 10%
levels respectively.
FD
C 0.4821***
(2.9240)
GROWTH -0.2411**
(-2.1365)
MATURE -0.3368***
(-3.0957)
DECLINE -0.2966***
(-2.7265)
GROWTH*FD 0.7849
(1.2442)
MATURE*FD 1.1185**
(2.3142)
DECLINE*FD -0.4062
(-1.0876)
TOBIN’S Q -0.0070**
(-2.3178)
LN(TOTAL ASSETS) 0.1087***
(5.2952)
INSTITUTIONAL -0.0086
(-0.6988)
McFadden R2 0.0063
LR-Stat. 50.7571***

32
Table 5: Operational Restructuring / Asset Restructuring This table reports the coefficients of a logit regression which takes the form of :
iititititit
ititititit
nalInstitutioetsLnTotalAssTobinsQFDDECLINEFDMATURE
FDGROWTHDECLINEMATUREGROWTHgstructurin
εααααα
ααααα
++++++
++++=
109876
54321
**
*Re
The dependent variable (Restructuring) takes the value of 1 when operational (asset)
restructurings occurred and zero otherwise. The restructurings include reducing in investing
activities (INV), reducing cost of goods sold (COGS), laying off employees (EMP) and asset
sales (ASSETS). Definitions of the restructurings are in Table 2. Growth takes the value if a
firm is in growth lifecycle and zero otherwise. Mature takes the value if a firm is in mature
lifecycle and zero otherwise. Decline takes the value if a firm is in decline lifecycle and zero
otherwise. FD takes the value of 1 if a firm is in financial distress and zero otherwise.
TobinsQ is measured by (Market capitalisation) + Total Asset – Common/Ordinary Equity,
scaled by total assets. LnTotalAssets is measured by Ln(Total Assets). Institutional is
measured by the total share holdings held by institutional investors, scaled by the total
outstanding shares. The standard errors of the variables appear in the parentheses. ***, **,
and * denote statistical significance at the 1%, 5 % and 10% levels respectively.
INV COGS EMP ASSETS
C 1.1489***
(22.2152)
-1.8518***
(17.8514)
-0.0387
(-0.5817)
0.25488**
(4.4088)
GROWTH 0.0198
(0.4658)
-0.0215
(-0.2516)
-0.1861***
(-3.5982)
-0.0448
(-0.9433)
MATURE 0.1869**
(4.3985)
0.0037
(0.0439)
-0.2574***
(-4.9541)
0.0799*
(1.7026)
DECLINE 0.2479***
(5.7451)
-0.0190
(-0.2160)
-0.2617***
(-4.8824)
0.2366***
(4.9588)
GROWTH*FD 1.4396***
(7.0413)
0.7193***
(4.0950)
1.3461***
(10.2747)
1.5673***
(11.3586)
MATURE*FD 1.1751***
(6.4825)
0.2714
(1.4120)
1.4749***
(11.8700)
1.3254***
(10.5539)
DECLINE*FD 1.1072***
(4.7295)
0.7361***
(3.7037)
1.3289***
(8.7588)
1.0781***
(6.9902)
TOBIN’S Q -0.0003
(-1.5053)
0.0000
(0.1251)
-0.0001
(-1.0731)
-0.0002**
(-2.0628)
LN(TOTAL ASSETS) -0.0933***
(-13.3508)
-0.1765***
(11.7543)
-0.2288***
(-22.9595)
-0.2439***
(-29.1921)
INSTITUTIONAL 0.0001**
(2.2010)
0.0002***
(3.3362)
-0.0064*
(-1.8956)
0.0007
(1.0037)
McFadden R2 0.0138 0.0209 0.0573 0.0568
LR-Stat. 452.1484*** 241.0682*** 1343.2100*** 1645.6120***

33
Table 6: Financial Restructuring
This table reports the coefficients of a logit regression which takes the form of :
iititititit
ititititit
nalInstitutioetsLnTotalAssTobinsQFDDECLINEFDMATURE
FDGROWTHDECLINEMATUREGROWTHgstructurin
εααααα
ααααα
++++++
++++=
109876
54321
**
*Re
The dependent variable (Restructuring) takes the value of 1 when financial restructurings
occurred and zero otherwise. The restructurings include dividend cuts (DIV), issue of debt
(NetDebt) and issue of equity (NetEquity). Definitions of the restructurings are in Table 2.
Growth takes the value if a firm is in growth lifecycle and zero otherwise. Mature takes the
value if a firm is in mature lifecycle and zero otherwise. Decline takes the value if a firm is
in decline lifecycle and zero otherwise. FD takes the value of 1 if a firm is in financial
distress and zero otherwise. TobinsQ is measured by (Market capitalisation) + Total Asset –
Common/Ordinary Equity, scaled by total assets. LnTotalAssets is measured by Ln(Total
Assets). Institutional is measured by the total share holdings held by institutional investors,
scaled by the total outstanding shares. The standard errors of the variables appear in the
parentheses. ***, **, and * denote statistical significance at the 1%, 5 % and 10% levels
respectively.
DIV NetDebt NetEquity
C 0.6879***
(6.8299)
-0.5011***
(-9.5213)
-1.7984***
(-21.4868)
GROWTH -0.2512***
(-2.8805)
-0.3044***
(-7.0061)
-0.4659***
(-6.9203)
MATURE -0.6244***
(-7.5450)
-0.4741***
(-10.8175)
-0.8813***
(-12.0733)
DECLINE -0.7627***
(-9.5786)
-0.4155***
(-9.3513)
-1.4572***
(-16.7136)
GROWTH*FD 1.2456***
(3.0042)
-0.3013**
(-2.1116)
1.2707***
(8.7514)
MATURE*FD 1.7517***
(5.6077)
-0.4839***
(-3.2606)
1.4694***
(9.9279)
DECLINE*FD 1.4345***
(4.8616)
-0.5006***
(-2.8514)
2.0717***
(11.5711)
TOBIN’S Q 0.0002
(1.1338)
0.0000
(0.4627)
0.0010**
(2.3130)
LN(TOTAL ASSETS) -0.1937***
(-16.4640)
-0.0433***
(-5.8534)
-0.0433***
(-3.4434)
INSTITUTIONAL 0.0027
(0.9661)
0.0000
(-1.3190)
0.0002***
(7.1979)
McFadden R2 0.0479 0.0071 0.0475
LR-Stat. 652.8526*** 213.7014*** 617.3404***

34
Table 7: Effectiveness of the Restructuring Strategies
This table reports the coefficients of a logit regression which takes the form of :
iititit
itititit
nalInstitutioetsLnTotalAssTobinsQ
gsstructurinDECLINEgsstructurinMATUREgsstructurinGROWTHery
εααα
αααα
++++
+++=
765
4321 Re*Re*Re*covRe
The dependent variable (Recovery) takes the value of 1 when a financial distress firm return to profit (measured by Earnings before Interest, Tax, depreciation
and amortisation) within 2 years followed the distress year; and zero otherwise. Growth takes the value if a firm is in growth lifecycle and zero otherwise.
Mature takes the value if a firm is in mature lifecycle and zero otherwise. Decline takes the value if a firm is in decline lifecycle and zero otherwise. The
restructurings include managerial, operational/assets and financial restructurings. Definitions of the restructurings are in Table 2. TobinsQ is measured by
(Market capitalisation) + Total Asset – Common/Ordinary Equity, scaled by total assets. LnTotalAssets is measured by Ln(Total Assets). Institutional is
measured by the total share holdings held by institutional investors, scaled by the total outstanding shares. The standard errors of the variables appear in the
parentheses. ***, **, and * denote statistical significance at the 1%, 5% and 10% levels respectively.
CEO INV COGS EMP ASSETS DIV NetDebt NetEquity
C -1.7642
(-1.5200)
-1.8066***
(-6.1193)
-1.8722***
(-7.5213)
-1.7756***
(-6.6102)
-1.8937***
(-6.9198)
-1.7877***
(-2.7097)
-1.9046***
(-7.7345)
-1.7135***
(-6.6556)
GROWTH*RESTRUCTURING -1.0473
(-1.5582)
-0.1389
(-0.5652)
0.5782
(0.7842)
-0.1562
(-0.5809)
-0.1442
(-0.5861)
0.6315
(1.0369)
0.2161
(0.5878)
-1.1145**
(-2.0423)
MATURE*RESTRUCTURING -1.0368*
(-1.6958)
0.0608
(0.2611)
-0.2964
(-0.2265)
0.1385
(0.5924)
0.1944
(0.8641)
0.5404
(1.0620)
0.5739
(1.5683)
-1.2313***
(-2.6202)
DECLINE*RESTRUCTURING -0.1044
(-0.1428)
-0.0315
(-0.1188)
-0.8360
(-0.7593)
-0.2075
(-0.6782)
0.1088
(0.3959)
0.0144
(0.0229)
0.2119
(0.4614)
0.0289
(0.0647)
TOBIN’S Q 0.0090
(1.0011)
0.0001
(0.8353)
0.0000
(0.5765)
0.0001
(0.7071)
0.0001
(0.8508)
0.0124**
(1.9656)
0.0000
(0.8085)
0.0001
(0.8945)
LN(TOTAL ASSETS) 0.3218*
(1.7233)
0.1889***
(3.3819)
0.1981***
(3.5417)
0.1820***
(3.1852)
0.1973***
(3.4969)
0.2032*
(1.7155)
0.1927***
(3.4914)
0.1854***
(3.2350)
INSTITUTIONAL 0.5208
(0.7022)
0.0012
(0.5177)
0.0012
(0.5361)
0.0014
(0.5854)
0.0012
(0.5382)
0.0809
(1.5583)
0.0013
(0.5607)
0.0012
(0.5025)
McFadden R2 0.0881 0.0184 0.0196 0.0183 0.0202 0.0989 0.0213 0.0346
LR-Stat. 10.2591 14.8193** 15.8277** 14.3043** 16.3203** 15.2450** 17.2008*** 27.9626***

35
Figure 1: Distress Firms (by lifecycle) from 1995 to 20006
0
10
20
30
40
50
60
1995 1996 1997 1998 1999 2000 2001 2002 2003 2004 2005 2006
Nu
mb
er o
f F
irm
s
birth
growth
mature
decline