Embed Size (px)
Citation preview

Financial Development and Economic Growth:Evidence from South Africa: 1970-1999
Jones Gondo1
April, 2009
ABSTRACT
We examine the impact �nancial development has on economic performance ofthe South African economy from 1970 to 1999. The evidence is based on atime series empirical growth model, using instrumental variables with robuststandard errors. The paper introduces an index of political and economicpolarisation as well as the in�ation tax ,as the identifying instruments, to
compensate for simulteneity bias in the �nancial development regressors. Theresults show that credit extension to the private sector and stock marketliquidity have a complementary and statistically progressive impact on
economic performance over the period, whilst, in the short-run at least, liquidliabilities exerts a negative imapct on economic growth. We also �nd that
intstitutions and the regulatory environment matter for both economic growthand �nancial development. Increasing access to credit and indexed securities,is a bene�cial policy proposition to reduce inequality and protect the earningsof the poor ,in particular, whilst increasing productivity. Therefore a more
active stock market and banking sector drives economic growth in South Africa
1Supervised by: Dr. Manoel Bittencourt
1

1 Introduction
1.1 Motivation
A well functioning �nancial system mobilizes savings from depositors and thenselects investment opportunities through credit lines to entrepreneurs. In de-veloped countries, a well functioning system has been shown to be growth pro-moting as it spurs on entrepreneurial innovation, technological progress andrapidly increases human and physical capital accumulation. Financial inter-mediaries function in order to reduce information, monitoring and transactioncosts. With less information asymmetry, banks and stock markets can bettermonitor managers, reduce risk through portfolio diversi�cation and hedging op-portunities, increase liquidity in productive assets, and facilitate the tradingand exchange of real goods and services.
South Africa developed a sophisticated �nancial system, borne out of themining boom of the late 1800s. As such, one would expect to �nd South Africato exhibit robust economic growth, not unlike other middle income nations thathave similar �nancial systems and economic histories. South Africa�s economicperformance is crucial for the development of the Sub-Saharan African regionas it is by far the largest economy on the continent with a the second oldeststock exchange on the continent behind Egypt. (Fourie et al., 1992)
This paper sets out to examine the �nance-growth link and hypothesisesthat �nancial development has a positive impact on economic performance inSouth Africa. The paper particularly investigates the period 1970 to 2000, aperiod of dynamic change in the economic and political environment of thecountry. The country experienced political change to democracy; the �nancialsector underwent liberalisation to adopt free-market principles and the economywas under recessionary pressure with increasing in�ation, unemployment anddisinvestment in the economy by foreign investors.
This paper contributes to the empirical growth literature, �rstly, by exam-ining the �nance-growth nexus for the country-speci�c case of South Africa andsecondly, employing an instrumental variable approach to compensate for simul-taneity bias in the �nancial development measures. The study also allows forthe opportunity to investigate the importance of policy and institutional factorson the �nancial system and economic growth.
2

1.2 Literature Overview
The works of Schumpeter (1912), Goldsmith (1969), McKinnon (1973) and Shaw(1973) were pioneering contributions in the debate surrounding the relationshipbetween �nancial development and economic growth. This debate has since,continued to be a critical part of the discourse on economic development andespecially so for developing nations because there�s an impetus for more countryspeci�c analysis. The cross-country evidence is not su¢ cient to account forthe permutations from theoretical predictions, especially when one considersthe impact of institutional, policy and regulatory changes at a disaggregated,country-speci�c level (Levine, 2004).
Since these seminal works, the theoretical disagreement centred on the role ofthe �nancial system in economic growth, whereby prominent economists suchas Robert Lucas (1988) downplayed the relevance of the �nance-growth rela-tionship in growth theory; whilst Merton Miller (1998) held the view that itwas too obvious and not worth serious discussion that �nancial markets do con-tribute to growth, (Levine, 2004). For example, to crystallize the essence ofthe disagreement, Goldsmith (1969) sought to detail the evolution of �nancialstructures as economies grow and develop and also to establish the impact �nan-cial development has on growth. Although Goldsmith managed to establish apositive correlation between �nance and growth, he could not establish a causalrelationship. In contrast to this, Robinson (1952) argued that, �by and large,it seems to be the case that where enterprise leads �nance follows.� inferringthat the �nancial system does not cause growth, but merely responds to eventsstemming from the real sector.
More recently, a critical mass of literature has emerged with eminent con-tributions by economists such as Levine, King, Demirgüç-Kunt, Beck, Loayzaamongst others. They have all made great strides in advancing the applicationof endogenous growth theory, with the view that �nancial systems a¤ect long-run economic growth. On that basis therefore, the debate continues to focuson, but not limited to, the determinants of �nancial development, models of�nancial systems and other interesting new theoretical models that link �nanceto aggregate growth, income distribution and poverty alleviation (Levine, 2004).
Country-speci�c studies are also receiving greater amounts of attention be-cause researchers can model speci�c structural changes that occur in an economyand assess the individual causes of growth and level of �nancial development inthat economy. This has important implications on policy and regulatory strate-gies employed by countries and economic/geographical regions on issues such asbusiness development, industry competition and regulation and �nancial mar-ket liberalization. For example, Acemoglu et al. (2004) promotes the economicinstitutions hypothesis.
Political institutions play an important role in income distribution, social
3
con�ict, corruption and political stability as they respond to special electoralinterests. Thus, the institutional quality of a country has an important impactas a determinant of �nancial development on long-run economic growth. Forexample, Levine (2004) cites Haber�s (1991,1997) example of Brazil�s revolu-tion from monarchy in the late 1800�s to a republic that was characterized bysubsequent liberalization policies in �nancial markets that increased industrialproduction and opened the �nancial system to external sources of �nance forbusinesses. The Mexican experience of liberalization was slower during theirDiaz dictatorship which �. . . relied on the �nancial and political support of asmall in-group of powerful �nancial capitalists.�
Demirgüç-Kunt and Levine (1999) found that countries with higher incomesper capita tend to exhibit large, active and e¢ cient �nancial systems and thatin developing economies, development of their �nancial structure can be deter-mined by the legal, regulatory, tax and macroeconomic environment. The studyby La Porta et al. (1998) and corroborated by Beck, Levine, Loayza (2000) con-tend that the origins of the legal system in a country is an important indicatorin determining the �nancial structure to be bank or market based. For exam-ple, under-developed �nancial systems were likely to have French Civil law legalsystems that do not focus on minority shareholder rights. They have relativelyine¢ cient contract enforcement and tend to have higher levels of corruptionand could thus have adverse e¤ects on the market-based system performance.On the other hand, countries with Common Law legal systems were likely tohave relatively stronger market-based �nancial systems. Although, there existsa sharp debate between market-based versus bank-based �nancial systems beingbetter for economic development, microeconomic literature points towards thecomplementarities of the two systems whereby stock-market development tendsto increase the use of bank intermediaries in developing countries (Demirgüç-Kunt and Maksimovic, 1996)
1.3 Financial Structure and Intermediaries
A well functioning �nancial system is one that exhibits allocative e¢ ciency ofthe system by mobilizing savings from depositors and selecting investment op-portunities through credit lines to entrepreneurs. The Schumpeterian view ofa �nancial system is one that in�uences and can in fact; accelerate economicgrowth through the savings-investment channel by in�uencing savings rates,investment decisions and technological innovations. De Gregorio (1996) arguesthat the volume of savings however, may not be as important to growth so muchas the impact that borrowing constraints have on the marginal productivity ofcapital. Countries that relax borrowing constraints can induce higher humancapital accumulation rates, technological progress and higher output growth,despite reduced savings rates. Hence, the focus should remain on the role of
4
�nancial intermediaries have in productivity growth as opposed to merely im-proving aggregate savings as the �rst-generation growth theory would suggest.
Financial intermediaries therefore function in order to reduce information,monitoring and transaction costs. With less information asymmetry, banks andstock markets can better monitor managers, reduce risk through portfolio diver-si�cation and hedging opportunities, increase liquidity in productive assets, andfacilitate the trading and exchange of real goods and services. Such a systemcan then spur on productivity growth by facilitating entrepreneurial innova-tion, technological progress and rapidly increase human and physical capitalaccumulation.
The richness in this debate, evidently, is in the di¤erent econometric tech-niques proposed in order to promote and express a speci�c argument wherethe �nancial development is concerned, for example, country speci�c studiesuse time-series data and it is with these dynamic datasets that causality inthe relationship between �nancial development and growth can be establishedusing econometric techniques such as Granger-type causality tests and vectorautoregressive procedures. (Levine, 2004)
Evidence from cross-sectional studies propose a positive statistical relation-ship between �nancial development and output growth and that �nance leadsgrowth, but the robustness of these studies are compromised by issues of simul-taneity bias or reverse causality e¤ects. So, in the Demetriades and Hussein(1996 cited in Khan et al. 2005), there�s evidence of bi-directional causalitybetween �nancial development and output growth for a majority of countries intheir sample.
That said, we alternatively consider the dynamic panel analysis by Rioja andValev (2004a, 2004b) which produces interesting results, in that, their evidenceshows that in rich economies, �nance increases the rate of productivity growthand accelerates economic growth in relatively poorer economies by increasingcapital accumulation. These relationships are non-linear because marginal in-creases in �nancial development have greater impacts on growth acceleration forrich and middle-income countries, whilst it is very low for poor countries withlow levels of �nancial development. Again, the causality of the non-linearitywas not established.
Levine (1993b, 1997, 2004) in his many examinations on the topic, �ndscompelling statistical evidence that �nancial development, is positively relatedwith the rate of physical capital accumulation and measures of e¢ ciency of re-source allocation or economic performance. The �ndings infer that �nance doesindeed lead growth, a view that sharply contrasts that of Robinson (1952). It isimportant, however, to be mindful that accounting for growth through capitalaccumulation does not necessarily translate into long-run economic growth.
King and Levine (1993a) conducted a cross-country panel study that ana-
5

lyzed whether the level of �nancial development in a country predicts long-runeconomic growth, capital accumulation and productivity growth. Apart from �-nancial development proxies, other control variables related to economic growthand that can improve the robustness of the economic model include, for ex-ample: income per capita, education, political stability, indicators of exchangerate, trade, �scal, and monetary policy, inequality and in�ation. The evidencefrom this study noted a positive relationship between real interest rates, realincome and �nancial depth. It is important to note that this model does not es-tablish causality and inherits the ambiguities found in Goldsmith (1969). Otherresearch has developed from this basis to include the stock market ratios to im-prove upon the de�nition of �nancial development. The results also signi�cantlypromote the �nance-growth relationship (Levine and Zervos 1998a).
The spectrum of international evidence is indeed wide, and draws upon manyimportant economic and political factors that a¤ect the case of South Africa, asa middle-income economy, such as income inequality, political stability and theinstitutions and regulatory environment that govern �nancial services.
The rest of the paper proceeds with a description of the dataset used. Wealso analyse the initial statistics and comment on the behaviour of the key re-lationships using a correlation matrix and univariate regressions of �nancial de-velopment on per capita GDP growth. Section 3 explains the empirical strategyemployed to make statistical inferences and reports the ordinary least squaresand instrumental variable regression results. Section 4 concludes with a sum-mary of the salient �ndings and asserts some policy remarks.
2 The Data
The dataset comprises annual time-series data spanning the period 1970 to 1999.The �nancial development indicators were sourced from the South African Re-serve Bank (SARB) Quarterly Bulletin and also from two World Bank data-bases: The Financial Structure Database compiled by Beck et al. (2000) andthe World Development Indicators (WDI) database.
Drawing from the spectrum of empirical literature that model the �nancedevelopment and output growth relationship, we begin by using �nancial depthas a proxy for �nancial development. Financial development refers to the ag-gregate supply of �nancial assets by bank and non-bank intermediaries in the�nancial system. Theoretically, �nancial depth is necessarily de�ned by the sizeof �nancial intermediaries. Size is captured as the ratio of liquid liabilities tonominal gross domestic product (LLY ). Liquid liabilities consist of currencyplus demand and interest-bearing liabilities of banks and other �nancial inter-mediaries and it is the broadest measure of �nancial deepening (Beck et al.,2000).
6

Additionally, the ratio of credit extended to private enterprises divided bynominal gross domestic product (CREDIT ) su¢ ciently proxies �nancial depth(Beck et al., 2000). These claims on the private sector indicate the level ofactivity in the savings-investment channel performed by the banking-sector andother �nancial intermediaries. This infers that �nancial development increasesaccess to credit by the private sector rather than to government; which, attimes, focuses on investing non-pro�t seeking activities. Access to credit, inturn, stimulates private investment and increases the levels and growth rates ineconomic development (King and Levine 1993c; Shaw, 1973).
The last proxy (SML) is the ratio of stock market total value traded to GDPand measures the liquidity of the stock market or the ability for �rms to issueequity (Demitriades et al., 2007). The securities market also has the ability tomobilise the savings of short-term investors, who prefer to keep their savings ina more liquid form, and channel these funds to �nance longer-term investmentsin capital goods (Fourie et al., 1992).
From these three �nancial development indicators we create an aggregatemeasure (FD) which is derived from the princpal components analysis (PCA).PCA is a method of data reduction that takes orthogonal linear combinationsof the original �nancial development measures that contain most of the variance(Jackson, 2004).
The real GDP growth (GRGDP ) data and the set of macroeconomic controlvariables for growth were sourced from the Penn World Table (PWT ) Version6.2, compiled by the Centre for International Comparisons of Production, In-come and Prices at the University of Pennsylvania.
The three principle control variables used are those commonly used in en-dogenous growth literature and in cross-country empirical analysis as determi-nants of economic growth2 . In this study, we include trade openness (OPEN),which is measured as total trade over real GDP; investment share of real GDP(INV Y ) and government share of real GDP (GOV Y ).
GOV Y , in Mariotti (2001), is introduced as a proxy for �scal policy. The�scal policy paradigm in post-apartheid South Africa is strongly in�uenced bythe labour unions which emphasise the need for the state to play a greater rolein reducing inequality in South Africa through �scal policy, whilst funding it byincreasing taxation on the rich (Nattrass, 1996).
In addition to the principle macroeconomic controls mentioned above, weinclude the in�ation rate and an index of political and economic polarisationwhich are assumed to be exogenous and have been shown to have an impact onper capita GDP growth in South Africa (Mariotti, 2001; Fedderke, 1999).
2See Barro (1991 and 1997) and Levine and Renelt (1991) for theoretical analysis anda review of empirical growth literature and international evidence. See Mariotti (2001) forSouth African evidence.
7

Firstly, we consider in�ation. Mariotti (2001) also introduces the in�ationrate to proxy monetary policy as the South African Reserve Bank is mandatedprimarily to �ght in�ation and maintain price stability, with a view to achievea stable macroeconomic environment 3 . We obtain data on in�ation from theInternational Monetary Fund�s International Financial Statistics (IFS) Year-book. Following Erosa and Ventura (2002), we then transform the in�ation rateto re�ect the in�ation tax (INFLTAX), as in�ation operates as a regressiveconsumption tax.
INFLTAXt =�t
1 + �t(1)
De Gregorio (1993) examines the impact in�ation has on investment andeconomic growth. The paper reports evidence from Latin America, citing thatreal money balances of �rms begin to decline as a result of high rates of in�a-tion. Furthermore, the value of existing capital increases, along with the costof holding cash to purchase new capital goods. Therefore, private investmentby �rms is depressed as resources tend to be diverted away from productiveprocesses and channelled into working capital, and ultimately, lower rates ofinvestment and economic growth are the outcomes. In�ation, therefore, is atax on �rms�money balances and erodes the contribution investment has toadditional capacity and to �rm pro�ts (Mariotti, 2001).
Acemoglu et al. (2003) and La Porta et al (1998) �nd that better institutionsand increased political and civil rights, that derive from the onset of democrati-sation, also matter for economic development. Therefore, to proxy for politicalstability, we construct an index of polarisation (POLAR) which is comprised ofinteracted data series from the Centre for Systemic Peace�s Polity IV Project�sPolity index4 and The University of Texas Inequality Project�s (UTIP ) annualHousehold Income Inequality index5 .
POLARt = 1��(Polityt � Inqualityt)
10
�(2)
The POLAR index attempts to capture South Africa�s historical politicaland economic polarisation from an oppressive apartheid regime, characterizedby low levels of democracy and high income inequality. These conditions were
3See www.reservebank.co.za4According to the Polity IV Dataset, the POLITYt score/index computed by subtracting
the institutionalised autocracy score (AUTOCt) from the institutionalised democracy score(DEMOCt) and the resulting uni�ed polity scale ranges from +10 (strongly democratic) to-10 (strongly autocratic).
5UTIP uses the Theil t� statistic as the measure of inequality
8

a source of great civil unrest and uncertainty which was shown in Fedderke(1999; 2000) to adversely a¤ect the investment rate and in so doing, adverselya¤ecting GDP growth. Investment is one of the most robust determinants ofgrowth. (Levine and Renelt, 1992)
Lastly, we include an indicator variable to control for periods of direct inter-vention and regulation in the banking sector and securities market by monetaryauthorities.
The indicator variable, DUMV , takes a value of one in the years 1970-1972and 1976-1980 and zero otherwise. During these years, monetary authoritiesmade use of credit ceilings and high liquid asset requirements in the bankingsector to try and curtail overspending and to dampen the increasingly high levelsof in�ation. Meanwhile, the Exchange Control Regulations Act imposed capitalrestrictions, exchange controls, direct investment controls and o¤-shore borrow-ing and lending restrictions on the capital markets to prevent deterioration ofthe capital account. These policies a¤ected banks�intermediation activities somuch so, that banking sector disintermediation began to occur. This was char-acterised by the development of �grey markets�, whereby �rms began to bypassthe banking system in favour of �rm-to-�rm lending (Fourie et al., 1992).
2.1 Behaviour of the Data
According to the descriptive statistics inTable1, South Africa�s growth has beenpoor over the period of study, ranging from -3.8% to 4.5%, which suggests theeconomy su¤ered recessionary pressure borne out of a combination of factors,principally, poor macroeconomic stability and high levels of political instabilityover the period of study.
The measure of �nancial deepening (LLY ) shows a mean ratio of 50%ranging from a minimum of 38% to a maximum of 60% of GDP; which showsthe relative size of the �nancial sector in South Africa to be large as cross-country evidence shows other middle income nations� ratios ranging between30% to 40% (Beck et al., 2000).
The mean ratio for CREDIT is 74% and this ratio of banking sector activityshows large variability of up to 21 standard deviations over time. CREDITreaches a maximum ratio of 121% of GDP, which re�ects South Africa�s level ofprivate sector indebtedness and is also indicative of a consumer-driven economy.
The ratio of stock market total value traded to GDP (SML) has a lowerthan expected mean value of 10%, considering the bourse is well established;over 100 years old. It is, by far, the largest stock market on the African continentand ranks among the top 20 exchanges globally. The proxy also exhibits widevariation ranging from a low of 2% of GDP to a high of 56% of GDP, suggesting
9

that the securities market was under a period of considerable repression, butshowed signi�cant recovery.
Table 1. Summary Statistics and Correlation Matrix, South Africa 19701999.
Correlations GRGDP LLY CREDIT SML FD INFLTAX POLAR OPEN INVY GOVY
GRGDP 1
LLY 0.272 1
CREDIT 0.078 0.642*** 1
SML 0.161 0.375*** 0.795*** 1
FD 0.001 0.763*** 0.955*** 0.854*** 1
INFLTAX 0.417** 0.163 0.525*** 0.470*** 0.350* 1
POLAR 0.039 0.672*** 0.967*** 0.751*** 0.935*** 0.483*** 1
OPEN 0.337* 0.521*** 0.150 0.196 0.039 0.754*** 0.129 1
INVY 0.354* 0.771*** 0.505*** 0.333* 0.609*** 0.198 0.488*** 0.639*** 1
GOVY 0.422** 0.822*** 0.256 0.017 0.385** 0.536*** 0.312* 0.744*** 0.741*** 1Source: PWT Version 6.2, World Bank Financial Structure Database, WDI, SARB Quarterly Bulletin, IFS, UTIP and author’s owncalculations. *** p<0.01, ** p<0.05, * p<0.1
Variable Obs Mean Std. Dev. Min MaxGRGDP 30 0.008 0.020 0.038 0.045LLY 30 0.495 0.069 0.384 0.600CREDIT 30 0.737 0.215 0.488 1.211SML 30 0.101 0.122 0.022 0.559
Consider the correlation matrix in the second panel of Table1. The matrixreports, as we expect, that all the measures of �nancial development exhibita positive correlation with per capita GDP growth. SML and CREDIT arepositively correlated, however, LLY is negatively correlated with the other two�nancial depth measures, which suggests the possibility of substitution e¤ectsaway from savings and deposit accounts towards credit channels and equitymarkets. The correlations between each �nancial development measure withthe composite measure of �nancial development, FD; shows that CREDITexplains the greatest portion of the FD measure; closely followed by the SMLvariable and LLY explains the least.
The control variables OPEN and INV Y are positively and signi�cantlycorrelated with per capita GDP growth at the 10% level. The policy variablesINFLTAX and GOV Y are both signi�cant at the 5% level and are negativelycorrelated with growth. The correlation signs of these policy control variablesare consistent with the South African evidence found by Mariotti (2001), whichsuggests that GOV Y and INFLTAX exert a negative impact on economicgrowth at higher levels of in�ation and government consumption6 .
The polarisation index is negatively correlated with GDP growth, CREDIT ,SML and FD, but positively correlated with LLY . This is suggestive of the
6Marrioti (2001) also found the presence of non-linearity in the impact of governmentconsumption of growth in South Africa
10

impact political instability had on the �nancial system, particularly throughcapital �ight and disinvestment, and also, that inequality in South Africa maypreclude certain sectors of society, particularly the poor, from access to creditand other �nancial securities (Fourie et al., 1992). These observations merelyre�ect statistical associations which may not be empirically conclusive.
To further our insight into the behaviour of the data, we consider the follow-ing diagrams. Figure1 exhibits real per capita GDP in South Africa which hasbeen poor and erratic over time. Even the gold boom of the early 1980s couldnot break the cycle of low growth and sustain higher levels of growth. SouthAfrica experienced its longest recessionary period in its history between 1988and 1993, due to low investment and high political instability or uncertainty(Fedderke, 2005; 2001a).
Figure 1. Real per Capita GDP growth (GRGDP), South Africa 19701999.
Source: PWT Version 6.2
1970 1975 1980 1985 1990 1995 2000
0.03
0.02
0.01
0.00
0.01
0.02
0.03
0.04GRGDP
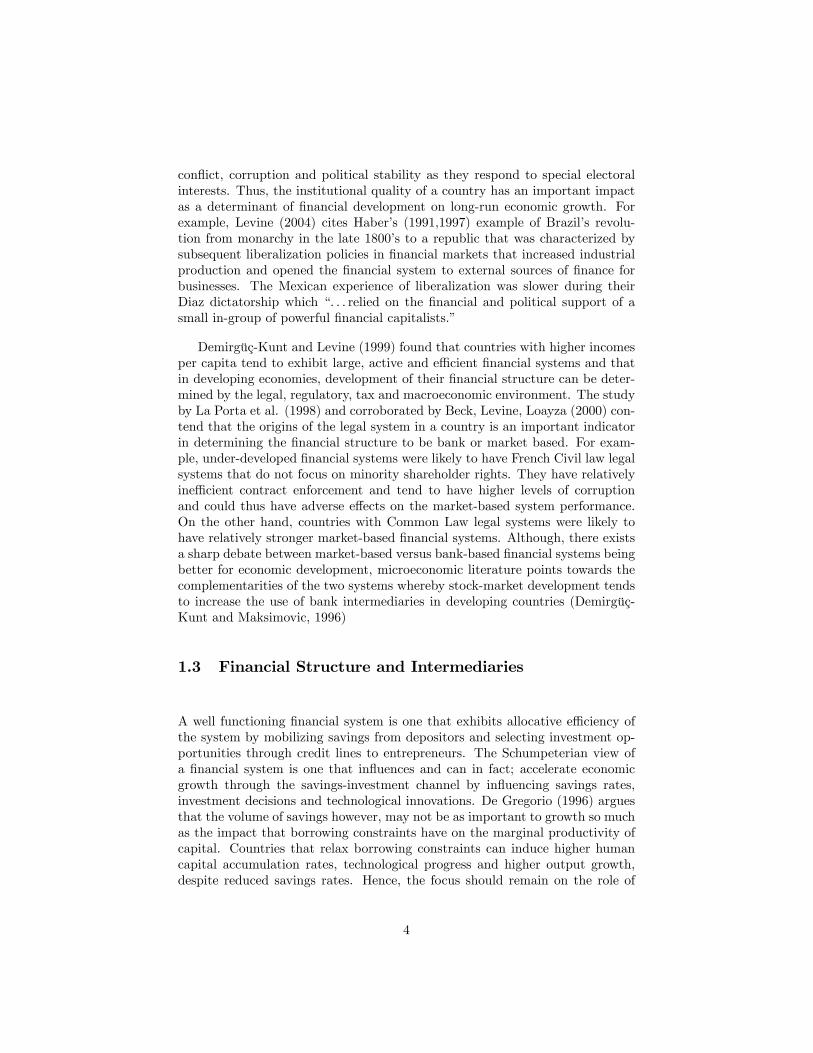
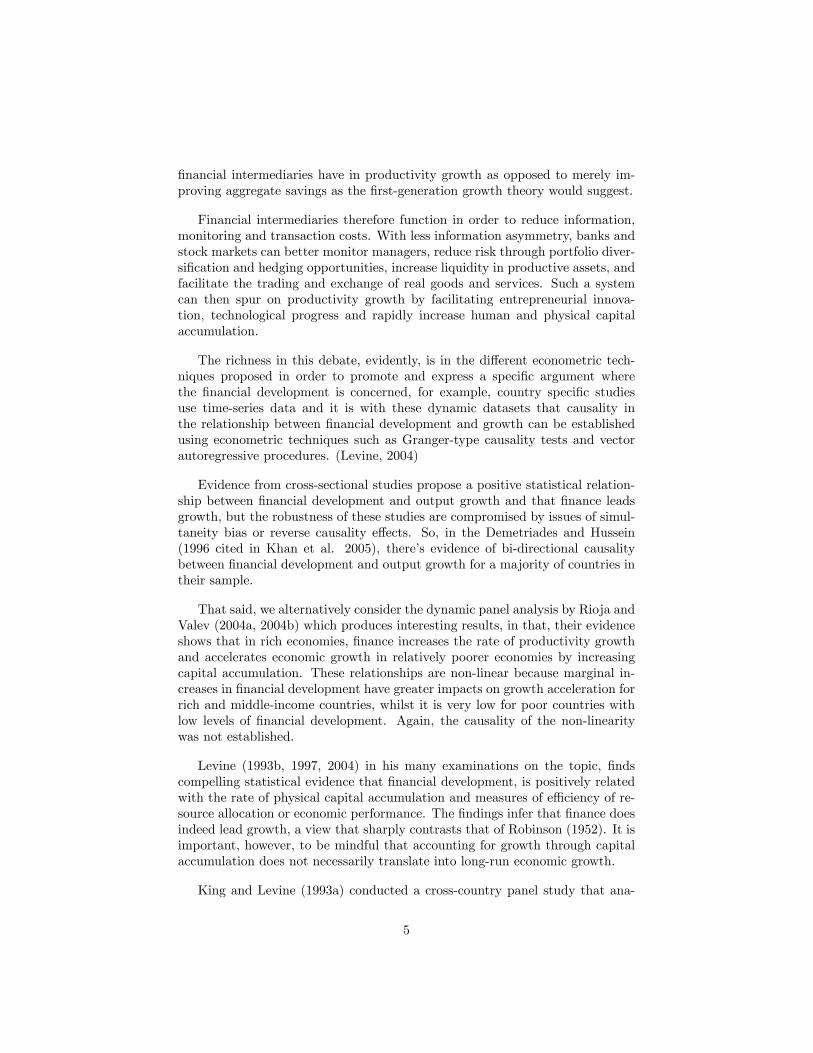
The top two panels of Figure2 below provide a graphical interpretation ofthe �nancial development series. From the 1970�s to the early 1990�s SouthAfrica experienced high rates of in�ation. Monetary authorities then employedinterventionist policies in the banking sector, which were characterised by highcash reserves, high liquid asset requirements and credit ceilings aimed at moder-ating the increasingly high levels of in�ation. As a result, we observe that overthe same period, liquid liabilities as a proportion of GDP declined as saversbegan to shift their deposits from banking and contractual savings institutionsinto other, often less-liquid, savings instruments that they considered to be morein�ation-proof and often had attractive �tax-breaks�attached to them (Fourieet al., 1992). Banking sector de-regulation consolidation began in the early1980�s and the process of disintermediation in the credit sector began to be re-versed as credit extension to the private sector began to improve. LLY began
11

to improve in the early 1990s and CREDIT signi�cantly accelerated as sanc-tions were lifted and political instability gave way to democratic institutions,in�ation began to decline and free market policies were pursued by monetaryauthorities.
The stock market liquidity ratio remained low primarily due to the exchangecontrols. Furthermore the exchange experienced capital �ight and disinvestmentdue to the sanctions imposed on the country (Fourie et al., 1992). However, thedual e¤ect of the advent of democracy and the liberalisation of the exchange con-trols in 1995 saw SML accelerate. The FD measure shows a trend that closelycharacterises that of the CREDIT variable, inferring that credit extension is alead indicator for �nancial development in South Africa.
When we consider index of polarisation in Figure2, we observe that SouthAfrica is a polarised society that experienced high levels of political oppressionand then transitioned to high levels of democracy in a relatively short period be-tween 1989 and 1994. According to the inequality data, over the sample period,inequality in South Africa remained relatively high and marginally increased;therefore the variation in the index is primarily due to the advent of democ-racy in South Africa. Having a high in�ation environment and high levels ofeconomic inequality has implications on the poor as they have limited accessto indexed �nancial products. Bittencourt (2007) mentions that in developedcountries, in�ation is progressive through the debtor and creditor channel andthat the rich have access to credit and sophisticated indexed assets, whilst thepoor, who mainly fund their consumption of goods using cash, as opposed tocredit, are impacted disproportionately by the in�ation tax.
12
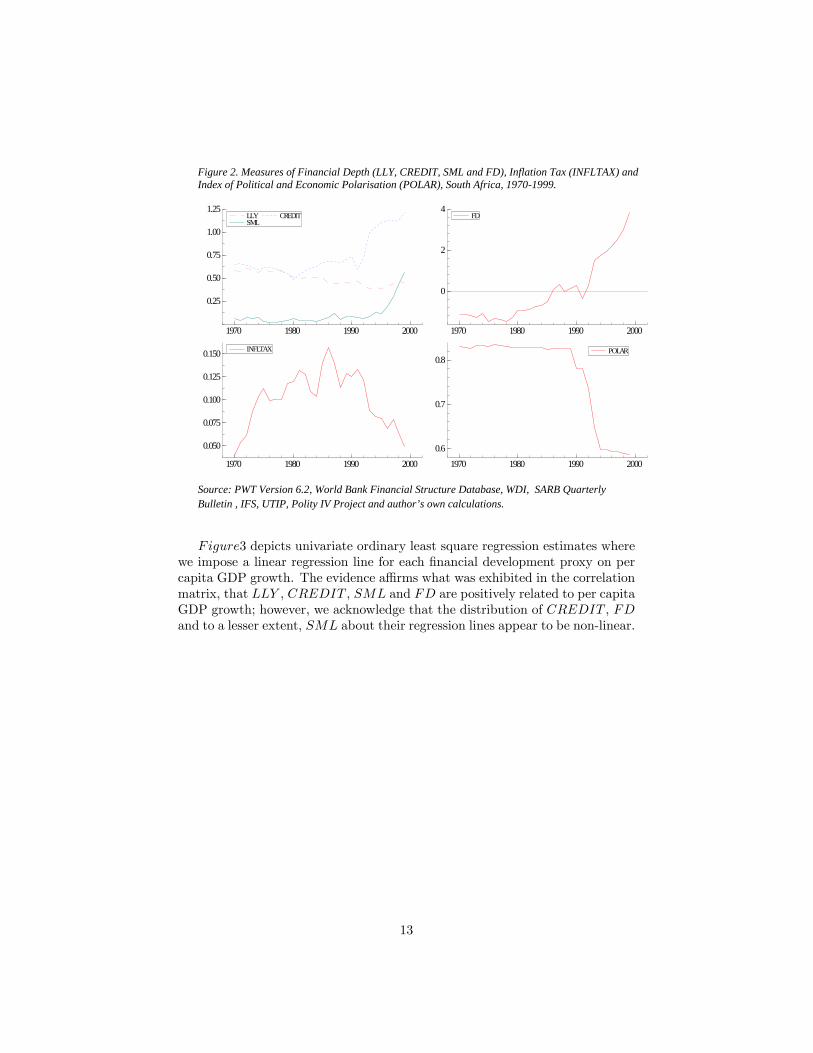
Figure 2. Measures of Financial Depth (LLY, CREDIT, SML and FD), Inflation Tax (INFLTAX) andIndex of Political and Economic Polarisation (POLAR), South Africa, 19701999.
Source: PWT Version 6.2, World Bank Financial Structure Database, WDI, SARB QuarterlyBulletin , IFS, UTIP, Polity IV Project and author’s own calculations.
1970 1980 1990 2000
0.25
0.50
0.75
1.00
1.25LLYSML
CREDIT
1970 1980 1990 2000
0
2
4FD
1970 1980 1990 2000
0.050
0.075
0.100
0.125
0.150 INFLTAX
1970 1980 1990 2000
0.6
0.7
0.8POLAR
Figure3 depicts univariate ordinary least square regression estimates wherewe impose a linear regression line for each �nancial development proxy on percapita GDP growth. The evidence a¢ rms what was exhibited in the correlationmatrix, that LLY , CREDIT , SML and FD are positively related to per capitaGDP growth; however, we acknowledge that the distribution of CREDIT , FDand to a lesser extent, SML about their regression lines appear to be non-linear.
13

Figure 3. Univariate OLS Regressions Lines: Financial Development on per capita GDP growth(GRGDP). LLY is Liquid Liabilities over GDP; CREDIT is private credit by Deposit Banks andother Financial Institutions over GDP; SML is Stock Market total value traded over GDP and FD isthe Principal Components Score.
Source: PWT Version 6.2, The World Bank’s Financial Structure Database, WDI, the SARBQuarterly Bulletin and author’s own calculations.
0.40 0.45 0.50 0.55 0.60
0.025
0.000
0.025
0.050 GRGDP× LLY
0.5 0.6 0.7 0.8 0.9 1.0 1.1 1.2
0.025
0.000
0.025
0.050 GRGDP× CREDIT
0.1 0.2 0.3 0.4 0.5
0.025
0.000
0.025
0.050 GRGDP× SML
1 0 1 2 3 4
0.025
0.000
0.025
0.050GRGDP× FD
All in all, the initial statistics show that there is a positive association be-tween �nancial development and per capita GDP growth, without consideringthe possible feedback e¤ects from per capita GDP growth back to �nancial de-velopment. We also observe that although per capita GDP growth has beenpoor and low over the sample period, we need to control for the impact certainpolicies have had on growth and the �nancial sector. This suggests that �nan-cial development may not be exogenous and in section 3, we attempt to isolateand then explain the role �nancial development has had in promoting economicgrowth.
3 Empirical Strategy and Results Strategy
Demetriades and Hussein (1996) suggest that simultaneity bias in the �nance-growth relationship may be a problem, particularly in developing countries. Toexplore this possibility in this dataset, we follow instrumental variable evidenceby Levine, Loayza and Beck (2000) and Bittencourt (2008) to assess the strengthof the linkage between �nancial development and economic performance in SouthAfrica.
Instrumental variable (IV) methods are used to obtain consistent parameterestimates in regressions where endogeneity of regressors is suspected or whereE[ujx] 6= 0. Statistical endogeneity is therefore a problem caused by measure-ment error and possible reverse causality, which renders all speci�ed ordinary
14

least squares (OLS) parameter estimators to be biased and inconsistent (Baum,2007).
Firstly, we estimate two benchmark regressions. The �rst is a simple Ordi-nary Least Squares (OLS) regression and the second, an instrumental variable(IV) regression with robust standard errors. Equation3 below illustrates base-line model estimated by the OLS and IV estimators7 ; where Yt is real percapita GDP growth, �tis the constant term, FIN_DEVt is the �nancial devel-opment estimator, CONTROLSt is the set of macroeconomic control variables,DUMVt represents the time indicator variable that captures the presence of�nancial repression policies and �t is the error term.
Yt = �t + �FIN_DEVt + CONTROLSt + �DUMVt + �t (3)
Secondly, we abstract from the benchmark IV regression and introduce theindex of political and economic polarisation (POLAR) and the in�ation tax(INFLTAX) as possible identifying instruments. The rational is based on theevidence above which suggests that �nancial development may be endogenouslydetermined by the high in�ation and political instability apparent over the pe-riod of study. The Hausman test is used to test for endogeneity in all theinstrumental variable speci�cations.
3.1 Results
Table2 reports the main �ndings from the benchmark OLS estimates in the�rst panel, followed by the baseline instrumental variable case in the secondpanel. Initially, the sequence of benchmark OLS regressions report statisticallysigni�cant estimates for CREDIT , SML and FD, which carry positive signs.This indicates that �nancial development, in general, has a progressive impacton per capita GDP growth and more speci�cally; credit extension and stockmarket liquidity also have a positive impact on growth. On the other hand,LLY is not reported as having a statistically signi�cant impact on per capitaGDP growth; however, its negative sign suggests that growth in money supply,as a proportion of GDP, has had a diminishing impact on economic growth.We suspected that endogeneity in the �nancial deepening variable may be aproblem, and this OLS result is suggestive of this.
Assessing the control variables, across all speci�cations, GOV Y is not statis-tically signi�cant. The negative sign for GOV Y is consistent with the Mariotti(2001) �ndings that high levels of government expenditure and in�ation aredeleterious to GDP growth, whilst at lower levels; the variables would exhibit
7The data is assumed a priori to be stationary and results are available upon request.
15

a positive sign. Trade openness is also negative in all speci�cations and is sta-tistically signi�cant in the second model. The investment share of real GDP(INV Y ) is positive in all speci�cations and reported as signi�cant in the sec-ond model and interestingly; the dummy variable is reported with a positivesign in all the models and has a statistically signi�cant impact on growth whereCREDIT , SML and FD are speci�ed as the �nancial depth measures. Thisindicates that the regulations imposed by monetary authorities to protect theeconomy from external shocks and capital �ight had a growth promoting e¤ectin the short-run. The F test for overall signi�cance of regressors rejects the nullthat all the regressors are jointly equal to zero and the R2 values are sound.
When we examine the baseline IV regression evidence, all the �nancial de-velopment estimates are statistically signi�cant and the signs of the coe¢ cientsremain the same as they were in the OLS models. The Hausman regression testrejects the null of no endogeneity when liquid liabilities is speci�ed as a regressorand as expected- the second lag of LLY is reported as a valid instrument in the�rst-stage regression. What this infers is that the measurement error problemmay be caused by feedback e¤ects from output growth to �nancial deepening.Therefore the IV regression approach is justi�ed in this speci�cation. WhenCREDIT , SML and FD are speci�ed, the Hausman test reports that we canalso reject the null of no endogeneity.
Before we interpret the changes in the control variables, it is important tonote the Levine and Renelt (1992) suggestion that the macroeconomic variablesare sensitive to small changes in the other control variables in the conditioningset. As a result of this, it is possible that changes in signs and levels of signif-icance are due to this fragility; hence, these results must be interpreted withcare.
GOV Y is statistically signi�cant and has a negative sign in the �rst twomodels. The fact that GOV Y is positive in the third model is probably dueto the sensitivity of the conditioning set mentioned above. OPEN and INV Yreport a similar result to the OLS speci�cations and the dummy variable isstatistically signi�cant in all the models. The instrumental variable methodreports robust standard errors, hence we consider the Wald Chi-squared test foroverall signi�cance of the models, which reports that all model speci�cationsare valid and the R2 statistics are reasonable.
16

Table 2: Baseline Ordinary Least Squares and Instrumental Variable Regressions of Financial Development onEconomic Growth. South Africa 197099
OLS (GRGDP) IV(1) (GRGDP)
Baseline Ordinary Least Squares Regressions2nd Lag of each financial development measure serves as an
identifying instrument(1) (2) (3) (4) (1) (2) (3) (4)
LLY 0.194 LLY 0.409**(0.114) (0.208)
CREDIT 0.086*** CREDIT 0.089***(0.027) (0.029)
SML 0.078* SML 0.093***(0.039) (0.027)
FD 0.010*** FD 0.012***(0.004) (0.04)
OPEN 0.033 0.183** 0.052 0.119 OPEN 0.054 0.179** 0.055 0.128(0.061) (0.078) (0.063) (0.069) (0.083) (0.087) (0.063) (0.087)
GOVY 0.688 0.387 0.030 0.338 GOVY 1.152* 0.372* 0.0356 0.332(0.424) (0.302) (0.348) (0.311) (0.686) (0.220) (291) (0.295)
INVY 0.264 0.696** 0.378 0.588** INVY 0.501* 0.722** 0.450* 0.680**(0.242) (0.272) (0.260) (0.269) (0.275) (0.298) (0.257) (0.302)
DUMV 0.017 0.023** 0.0173* 0.023** DUMV 0.029** 0.024*** 0.020*** 0.026***(0.010) (0.009) (0.010) (0.009) (0.013) (0.009) (0.007) (0.009)
CONSTANT 0.266 0.057 0.008 0.088 CONSTANT 0.477 0.047 0.033 0.082
(0.164) (0.099) (0.115) (0.103) (0.304) (0.083) (0.106) (0.112)
Obs. 30 30 30 30 Obs. 28 28 28 28R2 0.299 0.451 0.327 0.410 R2 0.231 0.449 0.320 0.405F 2.051 3.935 2.330 3.330 Wald Chi2 4.31 4.89 4.56 5.43
Hausman test 0.752*** 0.986*** 0.960*** 0.939***
(0.157) (0.112) (0.075) (0.119)***p<0.01,**p<0.05,*p<0.1 For IV Regression Robust standard errors in parenthesesSource: author’s own calculations ***p<0.01,**p<0.05,*p<0.1
Table3 presents the alternative instrumental variable cases with robust stan-dard errors. All the models in both instrumental variable cases report statisti-cally signi�cant Wald Chi-squared test values, meaning we can reject the nullthat regressors are all jointly equal to zero and infer that the overall model spec-i�cations are valid. The Hausman test results presented in both panels indicatethat endogeneity is a problem. The change in the endogeneity of the stock mar-ket liquidity measure when we use the INFLTAX as an instrument suggeststhe possibility that it may be a weak instrument. The macroeconomic controlvariable reports generally similar results to those presented in the baseline IVregression in Table2.
The �nancial development measures keep the same signs in all the speci-�cations as we observed in the baseline IV regression above; with CREDIT ,SML and FD exhibiting positive signs and the LLY ratio remaining nega-tive. The stock market liquidity proxy is not statistically signi�cant when the
17

in�ation tax is introduced as an identifying instrument. The �rst-stage leastsquares regression reports that INFLTAX is not an e¢ cient instrument forSML, presumably because investors were still able to be compensated for highlevels of in�ation through stock market returns, hence the in�ation tax wouldnot explain the variation in the stock market liquidity ratio. Bruno and East-erly (1998) cite that at in�ation rates exceeding 40%, one would then witnesssigni�cantly lower levels of investment and real activity. Cross-country evidenceby Khan and Senhadji (2000) o¤ers no conclusive evidence of threshold e¤ectsfor South Africa and therefore, in�ation in South Africa, albeit high, has notbeen high enough to have a signi�cant impact on this particular aspect of the�nancial system and depress real returns to negative values, as it did in Brazilin the late 1980�s (Bittencourt, 2008).
On the other hand, the index of polarisation would be an important in-strument to explain poor macroeconomic performance because the political in-stability and increasing inequality, emphasised by declining real incomes andincreasing unemployment, characterised the recessionary economic environmentof the time and where the stock market witnessed capital �ight and disinvest-ment by foreign banks.
That said, CREDIT robustly promotes per capita GDP growth, despite the�nancial repression policies that resulted in disintermediation. Fedderke (2005)�nds that deepening credit extension and improving stock-market liquidity hasa complementary and progressive impact on economic growth in South Africa.
The persistence of the negative signs for the liquid liabilities ratio may havea number of explanations. Firstly, Beck et al. (2000) remark that a positivelong-run relationship may co-exist with a generally negative short-run link8 .Secondly, Benhabib and Spiegel (2000) make an important qualifying statementas to why permutations from theoretical evidence exist, mentioning that mea-sures of �nancial development are linked to di¤erent components of economicgrowth such human capital, physical capital accumulations and total factor pro-ductivity, which is suggestive of the �ndings by Kularatne (2002) and Fedderke(2005), that �nancial deepening has indirect e¤ects on growth through the in-vestment channel. Thirdly, it is also a possibility that in the short-run, liquidliabilities (consisting mainly of short-term deposits) may not be utilised in longergestation-period and productivity enhancing investment projects.
We have evidence to suggest that the FD measure captures the importantcomponents of �nancial development for South Africa. We can therefore, gen-eralise our �ndings to infer that when we consider �nancial development, par-ticularly instrumented by the polarisation index, one may remark that SouthAfrica�s �nancial structure over the period of study re�ects one that is biasedto cater to an elite, and thus, deepening �nancial development by increasing
8Results for dynamic equations using instrumental variables showed LLY change sign topositive, but the result was not statistically signi�cant. Available upon request.
18

access to credit and indexed securities would disproportionately bene�t the richcompared to the poor (Beck et al., 2004b).
Table 3: Instrumental Variable Regressions of Financial Development on Economic Growth, with robuststandard errors. South Africa 197099
IV(2) (GRGDP) IV(3) (GRGDP)The Polarisation index (POLAR) serves as the identifying
instrumentThe inflation tax (INFLTAX) serves as the identifying
instrument(1) (2) (3) (4) (1) (2) (3) (4)
LLY 0.397** LLY 0.510**(0.165) (0.224)
CREDIT 0.077*** CREDIT 0.103***(0.027) (0.038)
SML 0.143** SML 0.329(0.061) (0.212)
FD 0.011*** FD 0.017**(0.004) (0.008)
OPEN 0.076 0.161** 0.104 0.123 OPEN 0.100 0.219** 0.248 0.196*(0.069) (0.077) (0.073) (0.079) (0.079) (0.096) (0.173) (0.108)
GOVY 1.146** 0.372 0.155 0.341 GOVY 1.402* 0.414* 0.680 0.392(0.583) (0.228) (0.290) (0.287) (0.727) (0.234) (0.690) (0.344)
INVY 0.485* 0.623** 0.654** 0.606** INVY 0.609* 0.820** 1.435* 0.919**(0.293) (0.278) (0.299) (0.303) (0.311) (0.326) (0.786) (0.403)
DUMV 0.025** 0.021** 0.024** 0.023** DUMV 0.030* 0.025*** 0.044* 0.031**(0.012) (0.009) (0.009) (0.010) (0.016) (0.010) (0.023) (0.014)
CONSTANT 0.481* 0.058 0.066 0.089 CONSTANT 0.601* 0.057 0.231 0.106(0.251) (0.081) (0.101) (0.105) (0.318) (0.080) (0.215) (0.122)
Obs. 30 30 30 30 Obs. 30 30 30 30R2 0.206 0.447 0.246 0.409 R2 0.073 0.442 . 0.336Wald Chi2 3.35 3.30 3.22 3.41 Wald Chi2 2.85 3.84 2.07 3.97Hausman test 0.770*** 1.043*** 0.767** 0.989*** Hausman test 0.606*** 0.903*** 0.166 0.708***
(0.158) (0.101) (0.146) (0.109) (0.140) (0.112) (0.165) (0.153)***p<0.01,**p<0.05,*p<0.1, Robust standard errors in parentheses :Source: author’s own calculations
4 Concluding Remarks
The objective of this paper was to examine the �nance-growth link for SouthAfrica from 1970 �1999; sourcing data from a number of international databasesto build an endogenous growth model that would isolate the impact �nancialdevelopment has on economic performance, in the presence of macroeconomiccontrols for economic growth.
Initial statistical evidence showed that per capita GDP growth in SouthAfrica has been poor and that �nancial development is expected to be pro-gressive for economic growth. The evidence also suggests that the economic
19

environment in South Africa was unstable, characterised by increasing rates ofin�ation and inequality, international sanctions and civil unrest. These condi-tions gave way to a new democratic system from 1994. The �nancial systemalso underwent signi�cant reform from �nancial repression and market protec-tion policies towards adopting free-market principles. In light of these, isolatingthe impact �nancial development had on economic growth would not be sim-ple because one would expect to �nd evidence of bi-directional causality in the�nance-growth relationship.
Therefore, learning from international evidence, we applied the instrumentvariable with robust standard errors to compensate for the possibility of simul-taneity bias in the measures of �nancial development.
The regression results report that deepening credit extension and improvingstock-market liquidity has a complementary and progressive impact on economicgrowth in South Africa. In the short-run, the evidenced showed that bankingsector deepening was regressive to economic growth. The reason is not entirelyclear, but intuitively, one would conclude that liquid liabilities, in the short-run,would not be invested by holders of deposits in long-term growth enhancingcapital projects and that increasing liquidity would be in�ationary and hencegrowth retarding over time.
By using the in�ation tax and index of polarisation as instruments; theresults emphasise the �ndings by Choi, Smith et al. (1996) and Acemoglu,Johnson et al. (2003) that in�ation levels and the institutional framework mat-ter for growth and �nancial development, particularly by enhancing the e¢ cientallocation of resources through the investment channel.
These �ndings therefore have important policy implications for the SouthAfrican economy. The result is that the investment climate has not always beenconducive to broad-based �nancial development and economic growth evidencedby the levels of instability and resultant capital �ight from the stock market.Furthermore, the onset of �nancial liberalisation in the 1980�s led to bankingsector consolidation as the economic environment led to decreased levels of prof-itability, and thus, the competitive structure of commercial banks became moreoligopolistic. This allowed the �nancial sector to develop in a direction thatsupported and bene�ted the rich and the poor disproportionately. Less com-petition would dampen the incentives for the banks to access the lower endof the market. Although the �scal policy position was motivated by the needto reduce inequality, expansive �scal policy was shown to be growth retardingand would crowd-out private investment. Therefore, if pro-poor growth is theobjective, then the �nancial sector has an important and dual role to play topromote growth and reduce inequality. This is achieved by expanding access tocredit and access to indexed securities, particularly for the poor. In so doing,this would increase the size and e¢ ciency of private sector productivity in thelong-run.
20
Therefore, the policy imperative remains to continue to strengthen institu-tions to ensure that insiders (the rich) do not bene�t from a more active �nancialsector at the expense of outsiders (the poor). The evidence presented impliesthat �nancial deepening is growth promoting if policy and regulation allow foreasing of credit constraints and access to indexed securities, conditioned uponmacroeconomic and political stability for the case of South Africa.
21

5 References
1. International Financial Statistics Yearbook. Cape Town, InternationalMonetary Fund. 2008.
2. Acemoglu, D., S. Johnson, et al. (2004). Institutions as the Fndamen-tal Cause of Long-Run Growth. National Bureau of Economic ResearchWorking Paper.
3. Acemoglu, D., S. Johnson, et al. (2003). "Institutional Causes, Macro-economic Symptoms: Volatility, Crises and Growth." Journal of MonetaryEconomics(50): 49-123.
4. Barro, R. (1997). Determinants of economic growth: a cross-country em-pirical study. Cambridge Massachusettes, The MIT Press.
5. Baum, K. (2007). Instrumental Variables: Overview and Advances. UnitedKingdom Stata Users�Group Meetings.
6. Beck, T., A. Demirgüç-Kunt, et al. (2000). "A New Database on FinancialDevelopment and Structure." World Bank Economic Review(14): 597-605.
7. Beck, T., A. Demirgüç-Kunt, et al. (2004b). Finance, Inequality andPoverty: Cross-Country Evidence", University of Minnesota (Carlson Schoolof Management): mimeo.
8. Beck, T., A. Demirgüç-Kunt, et al. (2001). Financial Structure and Eco-nomic Development: Firm, Industry, and Country Evidence. FinancialStructure and Economic Growth: A Cross-Country Comparison of Banks,Markets, and Development. A. a. R. L. Demirguc-Kunt. Cambridge, MA,MIT Press: 189-242.
9. Beck, T., N. Loayza, et al. (2000). "Finance and the Sources of Growth."Journal of Financial Economics 58: 261-300.
10. Beck, T., N. Loayza, et al. (2000). "Financial Intermediation and Growth:Causality and Causes." Journal of Monetary Economics 46: 31-77.
11. Benhabib, J. and M. Spiegel (2000). "the role of Financial Developmentin Growth and Investment." Journal of Economic Growth 5(341-60).
22

12. Bittencourt, M. (2006). Financial Development and Inequality: Brazil1985-99. Society for the Study of Economic Inequality Working PaperSeries.
13. Bittencourt, M. (2007). Macroeconomic Performance and Inequality:Brazil1983-1994. Ibero-America Institute f or Economic Research DiscussionPapers.
14. Bittencourt, M. (2008). In�ation and Financial Development: Evidencefrom Brazil. Economic Research Southern Africa Working Paper.
15. Boyd, J., R. Levine, et al. (2001). "The Impact of In�ation on FinancialSector Performance." Journal of Monetary Economics 47: 221-248.
16. Choi, S., G. Smith, et al. (1996). "In�ation, Financial Markets and Cap-ital Formation." Proceedings, Federal Reserve Bank of St. Louis(May):9-35.
17. De_Gregorio, J. (1996). "Borrowing Constraints, Human Capital Accu-mulation and Growth." Journal of Monetary Economics 37(1): 49-71.
18.
19. De_Gregorio, J. (1998). Financial Integration, Financial Developmentand Economic Growth. Centre for Applied Economics, Department ofIndustrial Engineering, Universidad de Chile.
20. De_Gregorio, J. and P. Guidotti (1995). "Financial Development andEconomic Growth." World Development Review 23(3): 433-48.
21. Demetriades, P. and K. Luintel (1996). "Financial development, economicgrowth and banking sector controls: Evidence from India." EconomicJournal 106, No. 435(March): 359-374.
22. Demitriades, P., B. Batalgi, et al. (2007). "Financial Development, Open-ness and Institutions: Evidence from panel data." Journal of EconomicLiterature(F19 and G29).
23. Erosa, A. and G. Ventura (2002). "On In�ation as a Regressive Consump-tion Tax." Journal of Monetary Economics(49): 761-95.
23

24. Fedderke, J. (1999). "A Case of Polarisation Paralysis: the debate sur-rounding growth strategy for South Africa." ERSA Policy Paper No.1(Univeristyof Witwatersrand).
25. Fedderke, J. (2000). "Investment on Fixed Capital Stock: the SouthAfrican Manufacturing Industry 1970-1997." ERSAWorking Paper No.16.
26. Fedderke, J. (2005). South Africa: Sources and Constraints of Long-TermGrowth. World Bank Informal Discussion Paper Series on South Africa.
27. Fedderke, J., R. De_Kadt, et al. (2001a). "Indicators of Political Liberty,Property Rights and Political Instability in South Africa." InternationalReview of Law and Economics 21(1): 103-34.
28. Fourie, L., H. Falkena, et al. (1992). Fundamentals of the South AfricanFinancial System, Halfway House: Southern Book Publishers.
29. Galbraith, J. and H. Kum (2004). The University of Texas InequalityProject. 2008.
30. Goldsmith, R. (1969). Financial Structure and Development, New Haven:National Bureau of Economic Research.
31. Heston, A., R. Summers, et al. (2006). Penn World Table Version 6.2,Center for International Comparisons of Production, Income and Pricesat the University of Pennsylvania. 2008.
32. Jackson, E. (2004). A User�s Guide to Principal Components, John Wiley& Sons, Inc.
33. Khan, M. and S. Senhadji (2000). "Threshold e¤ects in the relationshipbetween in�ation and growth." IMF Working Paper(110): 1 - 31.
34. King, R. and R. Levine (1993a). "Finance and Growth: Schumpeter MightBe Right." Quarterly Journal of Economics(108): 717-38.
35. King, R. and R. Levine (1993c). "Finance, entrepreneurship, and growth:theory and evidence." Journal of Monetary Economics 32(December): 513-542.
24

36. Kularatne, C. (2002). "An examination of the impact of Financial Deep-ening on long-run economic growth: An application of a VECM Structureto a middle-income country context." South African Journal of Economics70(4): 647-87.
37. La_Porta, R., F. Lopez-de-Silanes, et al. (1998). "Law and Finance."Journal of Political Economy(106): 1113-1155.
38. Levine, R. (1997). "Financial Development and Economic Growth: Viewsand Agenda." Journal of Economic Literature(35): 688-726.
39. Levine, R. (2004). Theory and Evidence. National Bureau of EconomicResearch Working Paper.
40. Levine, R. and D. Renelt (1992). "A sensistivity Analysis of Cross-Country Regressions." The American Economic Review 82: 942-963.
41. Levine, R. and S. Zervos (1998a). "Stock Markets, Banks and EconomicGrowth." American Economic Review(88): 537-58.
42. Mariotti, M. (2001). "An examination of the impact of economic policyon long-run economic growth: An application of a VECM structure to amiddle-income context." ERSA Working Paper Series 25.
43. Marshall, M. and K. Jaggers (2007). Polity IV Project, The Centre forSystemic Peace. 2008.
44. McKinnon, R. (1973). Money and Capital in Economic Development.Washington DC, Brookings Institution.
45. Schumpeter, J., Ed. (1912). Theorie der Wirtschaftlichen Entwicklung.Leipzig: Dunker & Humblot, [The Theory of Economic Development,1912], Cambridge, MA: HArvard University Press, 1934.
46. Shaw, E. (1973). Financial deepening in economic development. NewYork: Oxford University Press.
25
47. Stals, C. (1997). South African Financial Sector Reform Process. Fi-nancial Secotr Reforms in Africa: Realities, Problems and Lessons fromCountryExperiences, Addis Ababa, Ethiopia, United Nations EconomicCommission for Africa.
48. Udo_Ndebbio, J. (2004). "Financial Deepening, Economic Growth andDevelopment: Evidence from Selected Sub-Saharan African Countries."African Economic Research Consortium 142.
26