Embed Size (px)
Citation preview

1
Financial Derivatives usage by UK & Italian SMEs.
Empirical evidence from UK & Italian non-financial firms.
Doctor of Philosophy
Università degli Studi di Ferrara
Giulia Fantini*
Abstract
A number of studies have examined the risk management practices within non-financial companies. This research is a comparative study of derivative usage among UK and Italian non-financial listed SMEs over the time period 2005-2012. The aspects it refers concern the management of financial risks which to date (in Italy) has been little studied from the point of view of literature because of the paucity of data. The aim of this research is to provide evidence for UK and Italian non-financial listed SMEs on the determinants of hedging and on the types of financial derivatives used as hedging instruments.
--- Numerosi studi hanno esaminato le pratiche di risk management da parte delle imprese non
finanziarie. Questa ricerca confronta l’utilizzo dei derivati da parte delle Piccole e Medie Imprese non finanziarie quotate del Regno Unito ed Italiane nell’arco temporale 2005-2012. Gli aspetti che vengono analizzati riguardano la gestione dei rischi finanziari che, a causa della scarsità dei dati, ad oggi in Italia sono stati poco approfonditi. Il presente lavoro intende dimostrare empiricamente quali sono i fattori che influiscono sulle scelte delle PMI Inglesi ed Italiane ad adottare gli strumenti derivati ai fini di copertura per proteggersi contro i rischi finanziari.
Keywords: Derivative, Interest Rate, Forward, Risk Management, SME.
JEL Codes: G30, G32.
* I would like to thank my Italian supervisor Jacopo Mattei – University of Ferrara, and my UK supervisor Ian Marsh – Cass
Business School for their continual support and advice throught this work; I also thank Judge Amrit – Middlesex University, and Kevin James – London School of Economics for useful discussion and suggestions. All errors are my own.

2

3
Index
Introduction p.05
Chapter 1: Literature Review p.07
1.1Introduction p.07
1.2 Risks faced by firms p.07
1.3 Shareholders Maximizing Theory p.08
1.4 Underinvestment problems p.12
1.5 Positive role of hedging p.13
1.6 Managerial Theory of Risk Management p.13
1.7 Empirical Evidence p.15
Chapter 2: Risk p.23
2.1 Risk evolution p.23
2.2 Risk Classification p.25
2.2.1 Financial Risk p.27
2.2.1.1 Exchange Rate Risk p.27
2.2.1.2 Interest Rate Risk p.29
2.2.1.3 Commodity Risk p.29
2.2.1.4 Credit Risk p.30
2.3 Risk Classification, Basel I, Basel II, Basel III p.30
Chapter 3: Methodology p.35
3.1 Data Collection p.35
3.2 Methodology p.39
Chapter 4: Hypotheses p.42
4.1 Introduction p.42
4.1.1 H1 – Financial Distress p.42
4.1.2 H2 – Underinvestment Costs p.44
4.1.3 H3 – Financial Price Risk as Interest Rate Risk p.45
4.1.4 H4 – Firm Growth p.45
4.1.5 H5 – Overseas Operations and Foreign Exchange Risk p.46
4.1.6 H6 – Hedging Substitutes p.47

4
4.2 Summary of Measures and Predictions p.47
4.3 Dependent Variables p.49
4.4 Independent Variables p.49
Chapter 5: Empirical Analyses p.51
5.1 Methodology p.51
5.1.1 Outliers p.51
5.1.2 Multicollinearity p.51
5.2 Descriptive statistics UK non-financial listed SMEs p.52
5.2.1 Univariate Logit Regression - UK non-financial listed SMEs p.63
5.2.2 Multivariate Logit Regression - UK non-financial listed SMEs p.69
5.3 Descriptive statistics Italian non-financial listed SMEs p.84
5.3.1 Univariate Logit Regression - Italian non-financial listed SMEs p.95
5.3.2 Multivariate Logit Regression - Italian non-financial listed SMEs p.101
5.4 United Kingdom vs Italian non-financial listed SMEs 114
Conclusion p.117
References p.120
Annexes p.125

5
INTRODUCTION
The last decades, compared to the previous decades, have been
characterized by a greater volatility in interest rates, foreign exchange rates,
commodity prices and securities’ markets prices. To reduce the significant
negative effects that can be produced by those fluctuations on the firms’ wealth,
were made available to companies a numbers of risk management instruments
such as financial derivatives that allowed them to transfer financial price risks to
other parties.
The aim of this research is to provide evidence for United Kingdom and Italian
non-financial listed Small and Medium Enterprises (SMEs) on the determinant of
hedging and on the types of financial derivatives used as hedging instruments. It is
a comparative study between United Kingdom and Italian SMEs that intends to
evaluate whether differences exist between these two countries.
The limited research on the use of derivatives by non-financial SMEs in the
United Kingdom and in Italy provides the motivation for this study.
The majority of these studies investigated about the use of derivative by U.S.
non-financial companies such as Nance et al. (1993), Dodle (1993), Bodnar et al.
(1995), Mian (1996), Geczy et al. (1997), Gay and Nam (1998), Allayannis and
Ofek (2001), Graham and Rodgers (2002), Guay and Kothary (2003) and Kedia
and Mozumdar (2003).
Also, there have been some studies on the use of financial derivatives by
European companies such as Berkman and Bradbury (1996) about New Zeland
non-financial firms, Hakkarainen et al. (1997) and Keloharju and Niskanen (2001)
related to Finland firms, Bodnar and Gebhardt (1999) about Germany firms,
Alkeback and Hagelin (1999) about Swedish companies, Loderer and Pichler
(2000) about Switzerland companies, De Ceuster et al. (2000) about Belgium
firms.
Meanwhile there is little literature about the use of financial derivatives in the
United Kingdom and fewer in Italy. Grant and Marshall (1997), Mallin et al. (2001),
El-Masry (2006) and Judge (2006) have conducted surveys to investigate the use
of derivatives by UK non-financial firms. Fewer studies have been done to
investigate this subject in Italy, Bison, Pelizzon and Sartore (2002) and Bodnar et
al. (2013). Both of these UK and Italian empirical studies focus on large firms.

6
Therefore this research based on previous literature, proposed a series of
hypotheses that have been tested with econometric techniques to check whether
these hypotheses drawn from financial theories are met in UK and Italian non-
financial listed companies or not. The econometric methods used have been
univariate and multivariate logit tests. They have been used to analyse the data of
a sample of 166 UK non-financial listed SMEs and a sample of and of 66 Italian
non-financial listed SMEs, which have been handily collected.
The reminder of the thesis is organized as follows. The next section discusses
the existing literature on the use of derivatives. Chapter two discuss the financial
risks. Chapter three describes the data used and how the data for United Kingdom
and Italian non-financial listed SMEs have been collected, further describes the
methods implemented for testing the hypotheses. Chapter four further extend the
theoretical aspects of the determinants of hedging into hypotheses, describes the
effects in different variables used to measure the effects of hedging, and it
explains the dependent and independent variables. Chapter five contains the
descriptive analyses with an overview of the hedging data, quotes from annual
reports, univariate and multivariate regression. The last section includes
conclusions.

7
CHAPTER 1: LITERATURE
1.1: Introduction.
In the real world the financial market is imperfect and hedging can directly
affect the firms’ cash flow.
Risk management can be understood taking into account that the modern
financial theory is based on three major paradigms the rational wealth
maximization, the risk/return tradeoff and the no-arbitrage principle. At the same
time each of these paradigms can be extended to three major areas of finance the
corporate finance, the financial intermediation and the investments.
To understand why risk should be managed have been developed two
different hypotheses. The first is the Value Maximizing Theory of Risk
Management that is based on the fact that a company will engage in risk
management policies if they enhance the firm’s value and its shareholders’ value.
This value can arise from the minimization of costs of financial distress, from the
minimization of the taxes and from the minimization of the possibility that the firm
may be forced to forego positive net present value projects because it lacks the
internally generated funds to do so. The second hypothesis is the Managerial
Theory of Risk Management that is based on an agency argument. It considers
the risk aversion of managers associated with their own forms of remuneration, the
problems of information asymmetry and agency costs.
1.2: Risks faced by firms.
Generally firms face mainly three types of risks, business risk, strategic risk
and financial risk.
Business risk is related to the firm’s operation; in fact it can be identified as
operating risk, technological risk, informational risk or distributional risk. These
types of risk are assumed by a firm when it wants to profit by a competitive
situation in the aforementioned fields. This kind of risk can be managed by
management’s internal operating decisions. Fatemi and Luft (2002) state that if
firms are unable to mitigate their operating risk on advantageous terms may
ultimately fail, and Montgomery Ward1 is an excellent example of this type of
failure. Business risk is influenced by numerous factors such as sales volume, per-
1 It was an American retail giant enterprise. For more details see: "Montgomery Ward Goes Under": National Post Dec.29,
2000, "Montgomery Ward Closes Its Doors," Leslie Kaufman with Claudia H. Deutsch, The New York Times, Dec.29, 2000.

8
unit price, input costs, competition, overall economic climate and government
regulations. A firm that has a higher business risk should choose a capital
structure that has a lower debt ratio to ensure that it can meet its financial
obligations at all times.
Strategic risk is those factors that can affect the firm and the value of its
shareholders. It can be generated by economic, political, domestic or international
factors. This type of risk has the characteristic to have a long duration and so can
produce negative effect on the firm’s value for long period of time. It can arise from
making poor business decisions, from the substandard execution of decisions,
from inadequate resource allocation and from failure to respond well to changes in
the business environment.
Financial risk can be seen as an umbrella term that includes different types of
risk that are associated with financing, including a financial transaction that
includes the risk of default of a company. This type of risk is going to be discussed
in deep in the next chapter.
1.3: Shareholders Maximizing Theory.
The first invocation to risk management occurs with Markowitz (1952) who
introduced a crucial element: the risk. He considered the risk not as a general idea
or as an emotion but as a number. With his model risk-return postulates the
investors risk aversion and identifies the variables involved in investments
decisions that are expected return and equity standard deviation. This model does
not provide any information concerning the relationship between the performance
and the risk of an equity/security. In fact, it explains the performance and the risk
as input data.
The Capital Asset Pricing Model (CAPM) is the most well-known equilibrium
model in the financial market. It was proposed by Sharpe (1964) and adjusted by
Lintner (1965) and by Mossin (1966). It assumes the concept of informational
efficiency, the absence of transaction costs, the homogeneity of expectations, and
the presence of risk free rate and suggests the trade-off between risk and
performance. It has three main variables: the risk free rate, the coefficient of
systematic risk (beta) and the risk premium. The CAPM identifies a linear
relationship between the yield of a security and its degree of risk, the latter is
measured by a factor (beta), and this factor is proportional to the covariance
between the bond yield and the market yield. Therefore, the CAPM identifies those

9
factors that affect the financial assets’ profitability and identifies the investor’
required return for each level of risk.
Each model point out that, the performance depends only on the contribution
that the individual investor has on the market or on the systematic risk of the
portfolio. Therefore the shareholders will not be willing to remunerate risk
management interventions designed to cover specific risks that, for definition, can
be diversified within their own investment portfolio.
Another important front of financial theory relevant to the study of the
investment choices of the industrial and financial companies has further developed
the debate on companies risk management. On one side the Modigliani and Miller
(1958) theory shows that changes in the firm’s financial policy do not affect its
value if shareholders can replicate or reverse these decisions at zero costs. Since
hedging policies are equivalent to general changes in the firm’s financial structure,
they also fail to enhance firm value as long as basic assumptions of Modigliani and
Miller are met. In presence of market imperfections, reducing the firm’s
performance volatility can increase the net cash flows accruing to shareholders
either directly and indirectly. Directly, by generating tax or transaction cost
savings, or in the other hand by improving the contractual relations with company
stakeholders. Corporate hedging can also help to reduce the firm’s cost of capital
which raises the present value of future net cash flow streams for corporate
hedging; to make sense, it must however further hold that it is the least costly way
of obtaining these value increases. Modigliani and Miller (M&M) as a theory has
formalized the contribution of risk management in conditions of perfect markets.
Later models recognized market imperfections, releasing the restrictive
assumptions and ascribing to risk management a key role in the creation of value.
Since the mid-80s emerged a new vision of funding policies that gives the risk
management a different role. The key concept of M&M, that the value is created
through good investments, is not rejected but the financial risk management is
considered a key element to enable companies to make good investments. It is
evident how the M&M assumptions are, and therefore the perfect world considered
by them does not exist. In a real context characterized by market imperfections,
companies are exposed to economic and financial risks that if do not be hedged
could generate costs for the companies.
The first front of research studies how risk management allows to reduce the
destruction of value generated by the taxation asymmetry.

10
The tax-asymmetry topic has to be analysed with reference to two different
situations: the progressive evolution of taxation and the different tax treatment of
the two financing sources (risk capital and debt capital).
About the first point, the progressive evolution of taxation, it means that a company
is required to pay a tax that increases with the value of the company before tax
(pre-tax value). In a scenario like this, the best solution for a company is to present
profits in the lowest tax rates in different accounting periods, rather than having
negative profits for a year and profits, in the following years, that are positioned in
the highest area. Therefore, through the risk manager you can achieve a reduction
in the overall tax burden due to the leveling of the economic results obtained in the
various exercises.
In the mid-80s appeared the first models that made a valuable quantitative
support for the analysis of hedging on firm value. Clifford, Smith and Stulz (1985)
in their research they develop a positive theory of hedging by value-maximizing
corporations in which hedging is part of overall financing policy. They demonstrate
how hedging, in special circumstances, can increase firm value. The researchers
study how the M&M hypothesis can be related with hedging policies. For the first
time they show that, if the firm’s fiscal rates are a convex function, hedging can
reduce taxes. Furthermore, more convex is the fiscal rate function higher the tax
benefits can be. Thus, can be stated that the progressivity of taxation is the key
element that makes the function that describes the rate convex. Other factors can
contribute to generate a convex tax rate, as: operating losses fiscally deductible,
fiscal credits investment and foreign fiscal credits. Much higher are these preferred
items, the greater the tax benefits for a company that hedges.
With regard to the issue of tax asymmetries, a firm, thanks to increased
exploitation of the tax shield, which increases its optimal leverage level could
increase its "after-tax expected cash flow”. Risk management increases the
possibility to attract more debt capital because it reduces the gains volatility and
therefore reduce the overall company risk, without reducing the net present value
of the investments. With a lower level of risk a company can sustain a higher
debt/equity ratio which means the ability to make greater use of the tax shelter.
Leland (1998) in his article demonstrates that through hedging policies firms
could achieve a higher debt capacity. The primary benefit of financing with debt
capital resides in the deductibility of interest. The study shows that hedging allows
firms to increase their debt capacity and thus the firm value.

11
Graham, Clifford and Smith (1999) in their analysis, use a simulation method
to test more than 80,000 Comupustat firm-year observations and find that
approximately 50 percent of corporations face convex tax functions. Among these
50 percent, roughly one-quarter of these firms have potential tax savings from
hedging that appear material, in extreme cases firms can save expected tax
liability exceed 40 percent. While 25 percent have concave tax functions. Can be
stated that firms facing convexity tax-function, hedging lowers expected tax
liabilities, thereby providing an incentive to hedge. This paper reports the same
results of Smith and Stutz (1985). The study of Graham and Rogers (2002) starts
from these two assumptions: that hedging can increase the debt capacity and
increase the tax deduction, and hedging can reduce expected tax liability when tax
function is convex. They find that tax is a factor for firms to hedge. This because
hedging can lead to larger debt capacity and tax deduction, and this research was
the first evidence that suggested that hedging can increase debt capacity and firm
value. They find no evidence support about the relationship between hedging and
tax convexity. Graham and Rogers (2002) point out that there is a positive
relationship between hedging and debt capacity. In fact they demonstrate that
hedging can increase debt capacity but higher leverage can increase the incentive
to hedge. Their findings show that firms facing high expected distress costs would
hedge more with derivatives. Another research done by Carter, Rogers and
Simkins (2003) demonstrate that the value increase from hedging increases with
capital investment. The results show that in the airline industry investor value
hedging more because they expect hedging can protect the ability for firms to
invest in wicked times.
The second front of research is related to the reduction of financial distress
costs. Risk management strategies allow reducing the total risk exposure of a firm,
making the financial distress less likely to happen or reducing the costs.
Smith and Stutz (1985) show, by a quantitative model, that hedging reduces the
probability of a firm to incur in a financial distress situation and thus reduce its
expected costs. Financial distress costs and crisis costs have a negative impact
on the shareholder wealth. In fact hedging becomes more profitable with the
increment of long term debt because the probability that the firm is going to face
these costs is directly related to the amount of these debt respects to the asset
value. Therefore, is possible to conclude stating that a proper analysis of financial

12
distress’ costs should take into account both, the probability of encountering these
problems and also any related costs.
An important aspect of hedging is that if it increases the firm value, at the
same time it shifts this wealth from shareholders to bondholders, and this makes
shareholders poorest. At least there are two ways in which the market creates
pressure implementation of hedging policies. The first is because hedging allows
firms to reduce their debt cost. But if the probability of failure would be relevant,
the gain resulting from the non-hedging policy would be sufficient to overcome the
costs associated with the loss of reputation, because the firms’ reputation is
important only if allow it to not fail. On the other hand, hedging provides a means
through which it is possible to reduce the costs of distress imposed by bond
covenants. That because, hedging, reducing the content of the overall risk of the
company, could make the debts more safe and secure and then ensure that the
contracts do not become binding.
1.4: Underinvestment problems.
About the relationship between hedging and investment opportunities has to
be taken in to account that firms often rise capital through internal capital and/or
external capital. But a capital increase by internal funds is less costly than one
done using external funds. That explain why firms to raise their capital use internal
funds firstly. So, the third front of the research is the one related to
underinvestment problem. This phenomenon arise when the firm’s internal cash
generation is not enough to fund growth opportunities and the funding from
external sources is so expensive that lead the company to cut the investment level
under the optimal level. Myers (1977) in his paper stated that investment
opportunities must be assessed in relation to the possible conflict of interest
between shareholders (holders of residual rights) and holders of debt (holders of
fixed charges). Froot, Scharfstein and Stein (1993) with their research show that
when external funds are more costly for firms than internally generated funds,
there will be a benefit to hedging. Thus can be stated that hedging helps the firm
to reduce the volatility/variability of internal funds assuring that it has enough
internal funds that can be used for investment opportunities and reduce the
possibility of underinvestment. The findings of this research have been extended
by Gay and Nam (1998). These researchers examined the relationship between
the use of derivatives and underinvestment hypothesis. Their study analyses the

13
interaction effects among a firm’s investment opportunities, cash stocks, and
internally generated funds to distinguish clearly the role of the underinvestment
hypothesis. The study starts from the underinvestment problem as a determinant
of corporate hedging policy. Have been found that there is a positive relationship
between firm’s derivative use and its growth opportunities. The research
demonstrate that firms with enhanced investment opportunities use more
derivative instruments when they have relatively low cash stocks. At the same time
firms with a positive correlation between investment expenditures and internal
cash flows, tend to have a smaller derivative exposure, and this suggests that they
could use natural hedgers.
1.5: Positive role of hedging.
The firsts authors whose investigate the positive role of hedging are Allayannis
and Weston (2001). They analyse if the use of foreign currency derivative (FCDs)
is related with higher firm market value captured by Tobin’s Q. The sample is
composed by 720 large US non-financial firms over the time period 1990-1995.
The results show that, in a sample of firms with foreign sales, there is a positive
relation between the use of FCDs and firm value, and the hedging premium is
around 4.78% of firm value. Therefore the results show that in those years which
the dollar has appreciated, the hedging premium is much larger. The results from
the analysis made by Carter, Rogers and Simkins (2003) are consistent with the
ones of Allayannis and Weston (2001), because they show that the jet fuel
hedging is positive related to airlines firm value, and the hedging premium is in
range of 12-16%.
1.6: Managerial Theory of Risk Management.
Through information asymmetry managers have more information than
outsiders. Thus can be stated that the decision concerning the use of hedging
instruments, the types and the dimension depends on a manager’s utility function,
on a manager’s views about the market and on the visibility of the firm’s
accounting information. About the manager’s utility function, have to be taken in to
account the theory of Williamson (1964). This theory assumes that the utility
maximization is a manager’s solo objective. It is only in a corporate form of
business organization that a self-interest seeking manager can maximize his own
utility, since there exists a separation of ownership and control. So, manager can

14
use their discretion to frame and execute policies which would maximize their own
utilities rather than maximizing the shareholder’s utilities. This represents the
principal-agent problem2. Smith and Stutz (1985) with their research show that
managers’ risk aversion can lead them to hedge but they do not necessarily do so.
They point out that the hedging decisions for managers can be influenced by a
linear or convex compensation function. If the firm’s compensation function is
convex the less the firm is expected to hedge, in the other hand when managers
have significant fraction of the firm, is expect the firm to hedge more (linear
function). De Marzo and Duffie (1995) stated that the optimal hedging policy
adopted by managers depends on the type of accounting information available to
shareholders. Therefore hedging could help outside investors to observe
manager’s ability. Breeden and Viswanathan (1998) in their research examine the
importance of manager reputation. The key idea is that managers with greater
skills in relation to the management of certain types of risks want to be sure to be
able to communicate effectively in the market such superior ability. Therefore, their
aim is to minimize the uncertainty about its performance. To do this, managers will
tend to cover only the risks that they cannot control properly and with respect to
which they do not have any special skills management. The authors argue that
hedging reducing the volatility entails costs in terms of decrease in the value of the
equity. Managers, therefore, undertake hedging policies only if they believe they
have skills that are superior to other managers in the industry to offset these costs.
The managers “less able” instead generally choose not to cover, either because
their costs will be higher, and groped for the lot. Tufano (1996), analyzing the
North American gold mining industry he tests whether cross-sectional differences
in risk management activity can be explained by academic theory, such as those
firms which more likely face financial distress would have more extensive risk
management, otherwise risk management would be linked to risk aversion of
managers. His findings suggests that firms whose managers hold greater equity
stakes manage more gold price risks and those whose managers hold options
may manage less gold price risks. His results are consistent with those of Smith
and Stulz (1985).
There are other firm characteristic that can be related to hedging.
2 The Principal-Agent problem is part of the agency theory, because it develops when a principal creates an environment in
which the agent has incentives to align its interests with those of the principal, typically through incentives. Therefore, the
principal crates incentives for the agent to act as the principal wants, because the principal faces information asymmetry and risk with regards to whether the agent has effectively completed a contract. (Michael Jensen and William H. Meckling).

15
The agency cost is a phenomenon that affects the opportunistic behavior that
management can implement for their own exclusive benefit or for the benefit of its
shareholders and to the detriment of third party lenders. Tufano (1998) recognizes
and documents that the practice of risk management can be designed to protect
investment with a negative net present value for the shareholders and are able to
increase personal wealth managers.
Nance, Smith and Smithson (1993) with their research tested the hypothesis that
hedging increases firm’s value by reducing expected taxes, expected costs of
financial distress or other agency costs. This test has been done using survey data
related to the use of forwards, futures, swaps and options by firms combined with
data on firms characteristics collected by Compustat. The analysis shows that
firms using hedge instruments are larger, have higher research and development
expenditure, have more growth opportunities and have higher dividends. Mian
(1996), his paper provides empirical evidence on the corporate hedging decision.
Finding show that larger firms are more likely to hedge and this supports the
hypothesis that there are economies of scale in hedging and that hedging activities
are more influenced by information and transaction consideration than by the cost
of rising capital.
1.7: Empirical Evidence.
Empirically, the use of derivatives by firms appears to be widespread. A large
number of studies have documented the extent and nature of derivatives use by
non-financial firms. Some of these studies are based on survey data and other are
based on disclosed data. The 90s were marked by a series of investigations
whose purpose is to demonstrate and quantify from an empirical point of view the
link between firm value and hedging risks. In this framework there are researches
of various authors who have set themselves the goal of verifying whether the firms
use those instruments with the same goals supported by theory.
The most quoted empirical investigation is the one of Nance, Smith and
Smithson (1993). In their research they identify several motivations to explain why
hedging increase the firm value. They define the hedging instruments such as the
use of "off-balance sheet" instruments as opposed to the techniques of reducing
the volatility of the results of "on-balance sheet" such as the creation of special
funds or the conclusion of insurance contracts. The study wants to provide
empirical evidence of the theoretical hypotheses about the utility of hedging

16
proposed in the literature, not only related with taxation, but also with regard to the
costs of financial distress, to the underinvestment problem and the agency costs.
For the purpose of research, the authors have collected by a survey addressed to
the Chief Executive Officer of the companies belonging to the Fortune 500 and
S&P 400. The analysis provides a first evidence of the hypothesis that states that
firms which have a convex tax rates function hedge more, whilst there is no
empirical evidence about the correlation between hedging and the possibility of
incurring in a financial distress situation. Finally, the authors found evidence of a
positive correlation between R&D expenditure and the use of derivative
instruments. Block and Gallagher (1986) and Booth, Smith and Stulz (1984), in
their researches, they argued that hedging programs exhibit informational scale
economies and that larger firms are more likely to employ managers with the
specialized information to manage a hedging program employing these
instruments. This arguments imply that large firms are more likely to hedge.
Dolde (1993) with his research has been the first to confirm the hypothesis
about the probability to incur in financial distress stated by Smith and Stulz (1985).
He examined Fortune 500 companies by survey. His research shows that there is
a positive relationship between leverage and financial distress expected costs,
therefore firms with high level of leverage decide to hedge against financial risks
that can occur. Also this study show the positive relationship between R&D costs
and hedging, as the theory states.
Bodnar et al. (1995) have done the first surveys assessing the use of
derivative instruments.3 Their surveys attempts to sample the entire U.S. non-
financial corporate (listed) population. They find that usage is not widespread and
is more common among large firms. They also try to understand the reasons that
justify this utilization. Their focus on the prevalence of derivative usage, reason for
use or non-use and preference among different instruments, including concerns
about risk management programs and internal control issues.
Berkman and Bradbury (1996) they studied the financial accounts of 166 firms
listed on the New Zealand Stock Exchange that had to report the fair value and
notional value of all their off-and on-balance sheet financial instruments. Their
results show that derivative usage increases with certain financial features such as
leverage, tax losses, size, the proportion of shares held by directors and the
dividend payout ratio. Firms whit high interest coverage and high liquidity hedge
3 Called the Wharton Surveys.

17
less. Also is shown that the use of derivative is not related with short-term asset
growth, and this instrument might be used by firms that experienced difficulties in
varying their operating activities in response to changes in economic variables.
Furthermore the analysis demonstrates that hedging can be used to exploit
economies of scale associated with transaction costs and firms with sophisticated
financial management are more likely to hedge. Companies that use derivatives
tend to be more highly geared and have higher dividend payout ratios than their
non-user counterparts. The authors concluded that companies use derivatives to
reduce the cost of financial distress and to increase the present value of tax
losses, and they suggested that when firms are attempting lower agency costs,
and in the meanwhile have low dividend payout ratio and a high proportion of
liquid assets, are less likely to hedge
Detailed data on derivative use is available only for few industries, such as the
one investigated by Tufano (1996). His study represents the most historically
important contribution associated to the Managerial Theory of Risk Management.
In this research have been used a sample of firms belonging to a single industry,
the gold extraction. This sector is characterized by some special features that
make it ideal for a survey on risk management. First of all, this type of business
face a common exposure and the substantial fluctuations in the price of gold that
financial markets are able to cope with a wide range of financial instruments. In
addition, companies in this sector have adopted a rich variety of policies aimed at
managing the risks involved in such volatility and finally the data related to the
implementation of these policies are public. In accordance with the assumptions
made by Smith and Stulz (1985), Tufano focuses on risk aversion of the manager
as a cause of Financial Risk Management. As demonstrated by Smith and Stulz
(1985), firms whose managers hold more stock options and therefore have a more
convex payoff structure tend to hedge less the volatility of gold price. In addition,
firms whose managers have greater wealth invested in shares of the company, are
more likely to hedge against commodity risk.
The Geczy, Minton and Schrand (1997) research is an investigation based on
corporate derivative information collected directly by annual reposts. This study
examines the use of currency derivatives with a sample of 372 non-financial firms
in the U.S.. They identify firm characteristics that have not been considered in
earlier studies and address issues of endogeneity. Also, they extended the market
imperfections theories by considering how the costs of using hedging can affect

18
firms’ decision to use currency derivatives. Their findings show that firms with the
greatest economies of scale in implementing and maintaining a risk management
program are more likely to use currency derivative4.
Grant and Marshall (1997) they have surveyed the treasurers of large UK firms
about their use of derivatives instruments. Their results shows a widespread use
of derivatives instruments as swaps, forwards and options. The mainly instrument
used to hedge themselves against risk exposure are interest rate and currency
risks instruments, but at the same time they shows that is increasing the use of
derivatives instruments to manage commodity and equity risks.
There is another study by Hakkarainen et al. (1997) on European firms that is
independent of the Wharton surveys. This research reports results of a survey
made in 1994 about the management of interest rate risk by the top 1000 largest
Finnish non-financial companies.
Gay and Nam (1998) focused on the underinvestment problem and the aim of
their research is to find empirical evidence to what stated by the literature about
underinvestment problem. As discussed in the previous paragraph, the study
analyses the interaction effects among a firm’s investment opportunities, cash
stocks, and internally generated funds to distinguish clearly the role of the
underinvestment hypothesis. The study starts from the underinvestment problem
as a determinant of corporate hedging policy. Have been found that there is a
positive relationship between firm’s derivative use and its growth opportunities.
The research demonstrate that firms with enhanced investment opportunities use
more derivative instruments when they have relatively low cash stocks. At the
same time firms with a positive correlation between investment expenditures and
internal cash flows, tend to have a smaller derivative exposure, and this suggests
that they could use natural hedgers.
Bodnar and Gebhardt (1999) completed two direct application of the Wharton
surveys for Germany and show that German firms are more likely to use derivative
contracts than U.S. firms. There is another research, done by Alkeback and
Hagelin (1999) who provides evidence about the use of derivatives instruments
among Swedish non-financial companies. This study compared its results with
those presented in Bodnar et al. (1995) without taking in to account the differences
in size and industry classification. The survey results show that between Swedish
firms there is a marked lack of knowledge about derivatives instruments.
4 Geczy, Minton and Schrand (1997).

19
There are other researches that indicated that non-financial firms were not
using derivatives for speculative purposes.5 One is the anonymous survey done by
Graham, Clifford and Smith (1999) published a second investigation liked with the
one done by Nance, Smith and Smithson published in 1993. In this research,
Smith and Graham used different method. They collected 80.000 firm-year
observations using Compustat and they find that approximately 50 percent of
corporation face convex tax functions. Among these 50 percent, roughly one-
quarter of these firms have potential tax savings from hedging that appear
material, in extreme cases firms can save expected tax liability exceed 40 percent.
While 25 percent have concave tax functions. Can be stated that firms facing
convexity tax-function, hedging lowers expected tax liabilities, thereby providing an
incentive to hedge. The Graham and Rogers research appeared in the Journal of
Finance in April 2002. The study analyses data from the Electronic Data Gathering
and Retrieval of the SEC (Securities and Exchange Commission). The authors
concluded their analysis stating that companies hedge to increase the borrowing
capacity in order to increase the value of the company due to the increased
exploitation of the tax shield but do not engage in hedging policies when there is a
convex tax function.
Jalivand, Switzer and Tang (2000) their research show that there is similarities
and differences between Canadian, American and European risk managers. The
results suggest that the use of derivatives is more widespread in Canada than in
the USA and continental Europe.
Loderer and Pichler (2000) they surveyed 165 Swiss listed firms in 1996 and
get 96 responses. Their sample contain more large Swiss listed firms, and those
have an higher exposure to currency risk. they want to investigate risk
management policies of Swiss industrial firms. The results show that less than
40% of the sample can quantify its exposure to currency risk, even though most of
the sample reports using derivatives.
Fatemi and Glaum (2000) have done a study of risk management practices in
large non-financial German firms. The research suggests as the scope of risk
management expands, firms are likely to cover a larger number of areas of an
organization’s activities as well as the variety of risks including financial,
environmental, industry and operational.
5 Francis and Stephan (1993), Berkman and Bradbury (1996) and Graham and Rogers (2002).

20
De Ceuster et al (2000) analysed the use of derivatives by large Belgium non-
financial firms. They have surveyed 344 non-financial firms but got response from
74 companies. Data show that 65.8% of the companies used derivatives
instruments. Bigger companies are more likely to use derivatives respect to small
companies. The propensity to use derivatives depends also to the industry sector,
in fact chemical companies are more likely to hedge. The interest rate and
commodity risk are the mainly risks whose are hedged.
Mallin et al. (2001) surveyed the use of derivatives instruments among non-
financial listed firms in the UK and compared their findings to the results in Bodnar
et al. (1995). They found derivative usage among larger UK companies, but in
earnings as the primary objective for using derivatives.
Allayannis and Ofek (2001) with their paper examines the use of foreign
currency derivative and the impact on exchange rate risk by S&P 500 non-financial
firms in the time period 1992-1993. They show that there is a positive relationship
between the level of foreign debt and the ratio of foreign sales over total sales.
Moreover the study finds that the use of foreign currency derivatives significantly
reduces the exchange rate risk that companies face. Furthermore, firms also use
foreign debt as an alternative or in conjunction with foreign currency derivatives.
Keloharju and Niskanen (2001) analyzed 44 non-financial listed companies
during 1985-1991. The results show that the export-to-net-sales is positive and
highly significant, that companies raise FX debt to hedge their foreign currency
exposures, that larger firms are more likely to borrow foreign currencies and that is
shown by a positive and highly significant log total book assets variable, that there
is a significant and positive interest differential, furthermore the industrial
concentration variable, dividend yield and the return on book assets are not
significant but have the expected sign.
Guay and Kothari (2003) find that despite the widespread corporate use of
interest rate and foreign exchange derivatives, the dollar impact of these contracts
on earnings and cash flow appears to be rather modest. They also point out that is
quite plausible that firms that hedge using derivatives also engage in other risk
management activities, and that combined effect of these risk management
strategies significantly raises the value of the firm.
Kedia and Mozumdar (2003) they examine the use of foreign currency
denominated debt as a hedging instruments by large U.S. firms. They found strong
21
evidence that firms issue foreign currency debt in order to hedge exchange rate
exposures.
Geczy, Minton and Schrand (1997) showed that some firms do not disclose in
their annual reports the derivative instruments as speculative instruments and in
some cases contradict their annual reports statements where they disclose the
use of derivatives for hedging purposes only.
Faulkender (2005), his paper explores why managers are timing the interest
rate market. His analysis is based on a very large, hand-collected dataset of swap
activity. The results shows that swap usage and the choice of interest rate
exposure are primarily driven by a desire to meet consensus earnings forecasts
and to raise managerial pay.
El-Masry (2006) investigates the reasons for using or not derivatives
instruments by 401 UK non-financial firms. This paper investigates the extent to
which the derivatives have used and how they are used. The results suggest that
larger firms are more likely to use derivatives than medium and smaller firms, at
the same time public companies are more likely to use derivatives than private
firms, and derivatives usage is greatest among international firms. The companies
that do not use derivatives is because their exposure is not significant and another
important reason that lead companies to not use derivatives is about disclosures
of derivatives that is activity required under FASB rules, and costs of establishing
and maintaining derivatives programmes exceed the expected benefits. UK
companies use derivatives because want to hedge foreign exchange risk and
interest rate risk, and another important reason for using hedging with derivatives
is managing the volatility in cash flows
Judge (2006b) examining the academic debate identified the five main
theoretical explanation for corporate hedging in the minimization of corporate tax
liabilities, in the reduction of the expected costs of financial distress, in the
mitigation of the conflict of interest between shareholders and bondholders, in the
improving of the coordination between financing and investment policy and in the
maximization of the value of the manager’s wealth. Further his study supports the
economies of scale arguments and provides further evidence for the expected
costs of financial distress being an important factor for the decision to hedge
foreign currency risk by using an alternative definition of hedging. Previous studies
define hedgers as a firm that use derivatives. However these instruments also can

22
be used for speculative purposes and about that Judge6 states that if the motives
for optimal hedging and speculation are correlated empirically results might not
distinguish between these two activities.
Bartram, Brown and Conrad (2011) with their approach measured the effects
of hedging on a firm’s exposure to risk. They used this method on a large sample
of companies operating in 47 countries, and their results show that the use of
derivatives is related with lower cash flow volatility, idiosyncratic and systematic
risk.
Bodnar, Consolandi, Gabbi e Jaiswal-Dale (2013) they have done a web-
based survey, on Italian non-financial firms, about risk management practices and
the use of derivatives instruments to manage risk, time period September 2007
January 2008. The results show that the most common risk faced by Italian non-
financial firms is the foreign currency risk. Foreign currency options and swaps.
are positively related to the level of managerial education and the involvement with
international trade. At the same time the use of interest rate derivative depends on
the firm size, location, firm rating and on the manager background.
6 Judge (2006a).

23
CHAPTER 2: RISKS
2.1: Risk evolution.
Until now literature has not provided a global definition of the concept of risk.
There are many definitions of risk but most of these tend to highlight its downside
The Oxford Dictionary defines it as a “situation involving exposure to danger”,
while the Italian Zanichelli-Zingarelli Dictionary gives the following definition
“possibilità di conseguenze dannose o negative a seguito di circostanze non
sempre prevedibili”7.
During the Renaissance the concept of risk began to assume importance.
Pellicelli (2004) e Chiappori (2008) state that the origin of the concept of risk can
be linked to the Hammurabi Code. This code bears some traces of a type of risk-
sharing contract that contains both credit and insurance elements. Bernstein
(1998) analysed the etymology of the word risk. It derives from the old Italian word
“risicàre” that is “osare”8, thus, the word risk can be understood as a choice rather
than expectation of an uncertain fate. Pascal and Fermat in the late 1964 kept up
a written correspondence about bets and from this emerged an essay about
probability. For the first time a mathematical basis related to the theory of
probability was formulated, and this established the basis for future developments
of instruments that can be used to measure risk, those instruments are still in use
today.
The economist Frank H. Knight in 1921 formulated the first definition of risk.
He began with the distinction between risk and uncertainty. Risk must be
understood as “randomness with knowable probabilities”, while uncertainty must
be understood as “randomness with unknowable probabilities”. Some Italian
authors have studied the relationship between risk and uncertainty. One of whom
is Sassi (1940). With his research he showed that uncertainty, in its broadest
sense, is a generic state that prevents a complete understanding, and that it
always forms the basis of risk. Demaria (1950) proposed a tripartite division
between uncertainty, risk and temporary uncertainty. Finally, Bertini (1987) in his
study states that risk is generally connected to situations of cognitive impediment
mainly of the subjective type, while uncertainty is associated with objective
circumstances which are external to the cognitive capacity of the individual.
7 “Possibility of harmful or negative consequences due to circumstances not always foreseeable”.
8 “Osare” in English can be translated as “to dare”.
24
With the research of Von Neumann and Morgenstern (1944), economic
theories have accepted and shared Knight’s (1921 definition of risk). These two
authors were the first proponents of the Expected utility Theory. This states that
under conditions of uncertainty, individuals should always choose, according to a
rational model, the alternatives that offer them the highest utility. About thirty years
later Kaheman e Tversky (1979) developed the Prospect Theory, which is based
on a subjective reference point in managerial choices as well as investment
choices. This affirms a vision of risk concerned with quantitative-statistical
methods of measurement, and at the same time a vision related to a subjective
perception of reality.
Taking into account what is stated above a conclusion can be drawn on the
concept of risk and it can be qualified as a relative concept that depends on both
the expectations and the capacity of the subject affected.
By the early nineties a general standard of acceptance for the identification
and classification of risk was established, especially with regard to the dimensions
of organizational performance and joint business - COSO Framework 19929. The
Combined Code (1999)10 was the first organic compendium of corporate
governance rules in which risk management was considered among the
components of a good qualifying business management system, while the Turnbull
Report (1999)11 emphasized the relationship between systematic risk
management and value creation. During the same year, 1999, the “Codice di
Autodisciplina” (Code of Conduct)12 was drawn up in Italy in which the
responsibility for the identification and management of business risks was explicitly
attributed to government bodies. In 2002 in the United States the Sarbanes-Oxley
Act was enacted the purpose of which was to make internal systems control and
the audit systems more effective and independent and to empower government
bodies on risk management and on the correct disclosure information conveyed to
the market.
The role played by national and international regulations regarding the
disclosure of business risks is also important. On the one hand, these are
designed to provide comprehensive and transparent information to stakeholders,
9 CoSo Framework 1992: The Committee of Sponsoring Organizations od the Treadway Commission 1992. In 2004 it gave
the following definition of risk: “risk is the possibility that an event will occur and adversely affect the achievement of objectives”. 10
Combined Code: London Stock Exchange (1999). 11
Turnbull Report (1999): Institute of Chartered Accountants of England and Wales (1999). 12
Codice di Autodisciplina: Borsa Italiana (1999).

25
on the other hand, to encourage companies to adopt instruments aimed at risk
management.
2.2: Risks classification.
Several risk classifications are set out in literature, each one highlights certain
properties and characteristics.
Initially attention will be paid to a classification that is not very common in
literature but which is essential from the point of view of the management of
medium size business13. This classification makes a macro division between
business risks and associated risks14. Candiotto (1996) defines the first type of risk
as the risk that stems from the choices related to the primary activities of the value
chain and is measured by the resulting effects on company and stakeholders.
Prandi (2008) on the other hand, defines associated risks as those that relate to
ball side management components which are influenced by numerous external
variables. Their technical-operational nature requires specific attention and
measurement with the aim of reducing the potential impact through a preventive
safeguard action or through the use of transfer instruments. The latter can be
subdivided into two types: traditional risks, in which are included assets risks,
product risks and human resources risks; and the other type is called new risks;
these regard environmental risks, administrative offense risks and compliance risk.
This macro division shows a methodology for the analysis and the management of
the business dynamics.
What kind of impact can risks have in the business system?
The impact is direct when the consequences generated by the event directly
affect the company's resources, otherwise the impact can be indirect when the
effects indirectly affect the assets of the company. These two types of impacts
described above have specific forms of prevention and insurance coverage.
Finally, the impacts can be consequential as the consequence of direct and
indirect impacts affect the image of the company and its reputation, furthermore
they can increase the losses of market share. There are no forms of insurance
which cover reputation.
13
It was decided to refer to this classification because the empirical analysis, which will be explained in the following chapters, relates to the use of derivatives by the UK and Italian non-financial listed Small and Medium Enterprises (SMEs). 14
Prandi P. (2010), Il risk management. Teoria e pratica nel rispetto della normativa, Economia & Management, Franco Angeli, pp. 57-60.

26
There are principally two classifications of risk events that are closely
connected with risk management. The first classification distinguishes between
pure risks and speculative risks. Pure risks are those risks that have only an
unfavorable perspective and therefore are considered insurable. Tarallo (2000),
Giorgino and Travaglini (2008) defined pure risks as those risks that arise from
random events. When these events occur, they usually determine outcomes which
can be observed immediately in the short term and the physical and economic
consequences of the event can be reduced or contained through the adoption of
timely measures. Pure risks can be positive and negative. These risks are in turn
managed by ex-post control and by risk transfer activities.
At the same time speculative risks are those risks whose occurrence may lead
to additional costs or profits. Tarallo (2000) in his investigation states that a
company faces this kind of risk when has to bear an economic risk. The firm
choose its strategic position because it produces assets or provides services in
order to meet efficiency or quality parameters that allow it to generates revenues
and profits. The risks described below can be identified as speculative risks:
Strategic risk: this relates to the degree of prosecutions of corporate
strategies.
Operational risk: this includes those risks which are linked with business
production processes.
Financial risk: this concerns all the risks arising from financial structure,
from the performance of the financial markets and from the transactions made
with third parties. Within this category are the following risk factors, Giorgino
and Travaglini (2008)
• Exchange rate risk,
• Commodity risk,
• Interest rate risk,
• Liquidity Risk,
• Credit risk.
According to Floreani (2005) and Guelfi (2009) speculative risks are
characterized by a gradual realization over time, by a delayed performance and
examination, by the economic effects that progressively occur and by the lack of
intervention to reduce the negative economic consequence of the events
These types of risks are not insurable. The main way to hedge against the
speculative risks is hedging.
27
2.2.1: Financial Risk
Financial business risks are those that arise from the routine activity of a
company and are linked to the price of instruments traded on financial markets.
There are two types: internal risks which encompass all those risks arising from
the financial management policy adopted by the company, and external risks that
relate to those risks which arise from the market. In this latter category we can
include foreign exchange risk, interest rate risk, commodity risk and credit risk.
The existence of financial markets in which these are traded determines that
business flows can be quantitatively estimated and evaluated by techniques widely
shared among operators and that most of the financial risks incorporate a
systematic component which can affect their assessment and management.
Finally, the principal techniques used in managing financial risk are represented
by hedging instruments.
Financial risks can be part of an active and/or passive management. An active
management of risks exists when market prices do not necessarily reflect the
value of the traded flows. Those involved will need to be able to make a
quantitative assessment of risk which goes beyond that indicated by the market
price. It is possible to take advantage of arbitrage opportunities and sophisticated
evaluation systems and privileged information are required. Passive management
is based on the notion that, when this approach is adopted management is not
able to realise an effective quantitative evaluation of the risks traded beyond than
that which is expressed by market prices.
2.2.1.1: Exchange Rate Risk.
The exchange rate risk represents the sensitivity of economic and financial
flows of the company to exchange rates. The deferral of payments and receipts,
combined with the volatile nature of currency markets causes uncertainty
regarding payments and collections, as well as uncertainty related to revenues
and/or costs. This risk is the most well-known risk. It represents a crucial problem
because in this era of trade globalization, it plays a central role since even small
businesses operate in foreign currencies.
The traditional classification distinguishes four types of exchange rate risk:
Settlement risk: Facile (1996) states that the assumption of the existence of
this risk is based on “a time interval between the definition of the contractual

28
conditions and the conclusion of the financial transaction, during which the risk
of foreign exchange market is subject to change”. This specific type of risk
could affect both the importer (or an operator paid in foreign currency) and the
exporter (or an investor in foreign securities). The former is affected because
when a payment or refund must be made in a currency other than national
there is the risk of an appreciation of the level of the foreign currency against
the domestic currency. With respect to the latter when a payment is received in
foreign currency, there is the risk of depreciation of the currency against the
national currency. It is easy to identify this risk and it is linear because each
unit change in the exchange rate corresponds to a proportional change in the
business marginal variation.
Economic Risk: this refers to the risk that changes in exchange rates
produce on prices related to those market sectors in which the company
operates.
Competitive Risk: this is the risk which arises from changes in competitive
relations as a consequence of increases in the foreign exchange market
different costing systems and revenue structures with respect to competitors. It
is hard to identify this risk when the company finds itself in a situation
characterized by multiple competitors and by production which is located in
countries with different currencies.
Translation Risk: this relates to the conversion of foreign currency balance
sheet assets in the national currency at the end of the year.
These four types of exchange rate risks are interconnected. A firm operating in
markets with currency other than its national currency is exposed to changes in
market rates and this could produce negative exchange rate effects on the
company’s income statement, consequently this could also affect its competitive
position and could generate further short term and long term effects. This risk can
be managed through instruments such as buying and selling currency futures and
options on exchange rates. There is a wide range of options that allow firms to
manage their exchange rate risks and they are extremely flexible and adaptable to
any specific requirement. The use of these financial instruments requires specific
expertise.

29
2.2.1.2: Interest Rate Risk
The interest rate risk (IRR) is more insidious than the exchange rate risk
because it usually involves a longer period and represents the sensitivity of the
business cash flows on interest rates. The fluctuations generated by IRR can
impact both parts of the company balance sheet, especially the passive side
because most companies have different types of debt exposure – long, medium
and short terms debt maturity. Changes in interest rates could represent a
risk/opportunity to be exploited in order to benefit from the level of interest rates;
fixing the cost of debt for an extended period of time could allow the company to
benefit from the optimal cost structure which guarantees the cost of debt in the
long term. Any interest paid or received on a fixed basis does not represent a real
risk, as it has been fixed in advance.
2.2.1.3: Commodity Risk
The commodity risk refers to the uncertainties of future market values and to
the size of the future income determined by the fluctuation in commodity prices.
This topic covers all industrial companies because none of them can operate
without the use of raw materials. There is a directly proportional link between
exposure to price risk and production costs, furthermore the higher the risk is, the
more likely it is that the increase of the commodity price will be reflected on the
final sale price. For this type of risk it is also possible to make a further
classification:
Settlement Risk: this is typical in those markets where the price of raw
materials is based on a quotation value and therefore fixed on the day of
delivery.
Economic-Competitive Risk: this risk is supported by those parties
(producers/users) that have not fixed the price of the commodities, therefore
they are at a disadvantage compared to those competitors who have
adequately dealt with such a risk of or who have purchased their good in the
most favorable period.
Replacement Risk: this is the risk in which strong variations in prices lead to
a shift in demand towards other products. This risk in the long term can
generate devastating consequences for those companies that are not able to
convert their structures to adapt to the market changes.

30
2.2.1.4: Credit Risk
Sironi (2005) states that credit risk can be understood as “the possibility that
an unexpected change in the creditworthiness of a counterparty could generate a
corresponding unexpected change in the fair value of the related credit exposure”.
Thus credit risk can be understood as a default and migration risk, risk as an
unexpected event and risk as credit exposure. Anolli e Gualtieri (1999) have
defined credit risk as “the possibility that a debtor fails to comply even in part with
its obligations: this event is the so-called default”
It is possible classify this risk as follow:
Default Risk & Migration Risk: this is the risk of a deterioration in the
creditworthiness of a counterparty (downgrade). This downgrade could be due
by a debtor’s downgrade rating, by an agency or by trust analysts of the
creditor bank.
Recovery Risk: this refers to the possibility that the rate of recovery, related
to counterparty exposure and consequent insolvency, turns out to be lower
than the one originally estimated by the bank.
Risk Exposure: this is a typical risk of credit lines and has an aleatory value,
furthermore it refers to the actual amount of the loan at the time of insolvency.
Spread Risk: this is the risk wherebye the risk premium (spread) is
increased due to requirements in capital markets.
2.3: Risk Classification Basel I Basel II and Basel III.
The revision of the Basel Accord on capital requirements for banks (Basel I
and II) has prompted companies to enhance resources and instruments for risk
management.
With Basel I credit risk was measured for all businesses in the same way. It did
not take into account the time factor (as the temporal structure of maturities) and
excluded risk factors such as operational risk.
Basel II scaled the pattern of minimum capital requirements through a more
structured and efficient system of weighting, Resti (2008). It sets out, on three
pillars, the level of capitalization that supervisors require from banks:
Pillar I - Minimum Capital Requirements: this pillar contains all the
regulations on banking capital requirements to cover risks that financial
institutions assume. In particular, it introduces a new solvency coefficient,

31
which alongside credit risk, considers the market risks together with a new
concept of risk; operational risk.
Pillar II - Supervisory Review Process: this pillar states that taking into
account business strategies in terms of capitalization and risk-taking, central
banks will have greater discretion in assessing the banks’ capital adequacy,
and imposes higher coverage that could exceed the minimum requirements.
Pillar III - Market Discipline: transparency rules are provided to give public
information on capital levels, on risks and on their management.
With regard to credit risk, taking into account what is stated above, Basel II
introduced two important innovations, first it allowed for the use of risk mitigation
instruments such as traditional forms of collateral and collateral on financial and
real assets, together with more innovative forms such as financial derivatives.
Furthermore it recognized internal models for the assessment of credit risk,
counterparty risk and transaction risk.
Another important novelty is the opportunity granted to intermediaries which
allows them to adopt several alternatives in order to calculate the minimum capital
requirements against credit risk:
Standard Approach: this approach uses assesments established by the
supervisory authority. The assessment of corporate borrowers (or to be given)
will be carried out by external rating agencies specifically authorized by the
Financial Regulator. Depending on the rating assigned,different weighting for
the calculation of the provision of capital will be used. Depending on the type of
business the weighting varies:
Tab. 1 – Weighting for the calculations.
Firm Type Turnover (T) Financing Weighting
Corporate > € 50 millions > € 1 million Rating based
SME Corporate € 5 millions < T < € 50 millions > € 1 million Rating based
Retail T < € 50 millions < € 1 million Fix at 75%
Source: author’s elaboration.
Internal Ratings Based Approach (IRB): This model is a calculation system
based on quantitative input by which the capital requirement (K) is measured.
Part of this requirement, the expected loss (EL) is represented by the following
equation:
EL = EAD x PD x LGD x M

32
Where PD (Probability of Default) indicates the probability that the customer
shall be in default in a year, the EAD (Exposure at Default) shows what will be
the exact amount borrowed at the time of insolvency, the LGD (Loss Given
Default) suggests what percentage of the loan, less recoveries, will be lost if
the party is in default, and finally M (Maturity) explains how value in the
medium-long term is reduced if the customer is solvent but worsens its credit
rating.
The IRB approach, is divided into:
• Foundation Approach (IRB Base): in which banks use their own
valuations to estimate the PD and adopt system valuations for the other
variables.
• Advanced Approach (IRB Advanced): in this model banks use their
own valuations for all variables in the model including maturity (M).
A common feature of all these approaches is the role played by collaterals (risk
migrants), which allow discounts to be obtained on the calculation of capital
requirements. There are two types of collaterals: personal collaterals, when they
are issued by governments, banks, and trust companies with high credit ratings,
and collateral such as cash, gold, stocks and qualified bonds or funds (simple
approach) or other listed stocks (integral approach).
What were the impacts of Basel II on the relationship bank-firm?
Under the Basel II agreement, lenders have to set aside capital to cover risks
connected with their business activities, and the amount of capital to be set aside
depends on the credit risk related to corporate borrowers. Banks ask companies to
reduce their financial risk in order to improve their credit rating15 and thus to
reduce their venture capital constrained in terms of loans issued to borrowers.
Lower constrained venture capital means that the banks are able to use this
capital in alternative ways. A reverse scenario is characterized by losses of
investment opportunities, where costs would necessarily fall on businesses
through increases in interest rates for those considered to be more risky.
Basel II implies that the financing costs for a firm are always linked to the
rating of the borrowers. This means that the reduction of financial costs
necessarily comes about through an increase in capital and a consequent
improvement in the corporate credit rating.
15
Thereby lessening the credit risk.

33
Basel III is a set of new rules on Banking Supervision in response to the recent
financial crisis. It came into operation in early 2013 and a long transitional period
was foreseen (up to 1 September 2019). This approach was adopted in order to
facilitate a gradual adjustment of the operational strategies of banks on economic
recovery and avoid relapse. Its goals are to prevent excessive risk taking by
operators, to reinforce the financial system and to establish a level playing field.
The measures that will be implemented will address the financial
intermediaries and include:
The introduction of minimum standards of liquidity: two rules were
introduced:
• Liquidity Coverage Ratio16: this rule requires banks to maintain a
stock of liquid assets that can overcome a phase of heightened outflow
of funds for a period of 30 days without having to resort to the market or
refinancing at the central bank.
• Net Stable Funding Ratio17: this rule requires that sources of stable
funding are able to finance less liquid assets, and are needed to
increase medium and long term funding.
The definition of regulatory capital, together with the establishment of higher
capital requirements: this confirmed the function of heritage as a garrison
essential for the stability of financial intermediaries. Adequate and increased
quality levels of capital increase banks’ ability to cope with losses and ensure
that intermediaries are able to take advantage of growth opportunities and to
support families and businesses, also in moments of difficulty. Furthermore,
more stringent requirements in terms of instruments and high-quality assets
were envisaged, while the total capital requirement at 8% of risk-weighted
assets remained unchanged.18.
Better coverage of market risk and counterparty risk: new rules provided
that some key parameters for the calculation of requirements, such as value at
risk and correlations between activities, have to be calculated taking into
account conditions of stress.
The reduction of the level of leverage: a minimum capital requirement (Tier
1) that banks must hold relative to total assets not risk-weighted (leverage
16
According to this rule, the ratio between high quality liquid assets and total net cash outflows in 30 days, must be greater than or equal to 100%. 17
According to this rule, the ratio between the available stable funding (Funds) and the stable funding request (Assets) must
be greater than or equal to 100% 18
Common Equity increased from 2% to 4.5% and Tier1 increased from 4% to 6%.

34
ratio) was established. This was determined in such a way as to capture all
activities of a bank (and balance sheet) and is neutral with respect to different
accounting rules.
Of the counter-cyclical measures in order to reduce the pro-cyclical
prudential rules: measures to reduce the pro-cyclicality of prudential rules have
been planned and consequently banks are required to hold more capital
resources than the minimum (Buffer). Two sizes:
• Banks must be equipped with a capital buffer above the regulatory
minimum (equal to 2.5 % of common equity ratio of assets risk).
• Introduction of an additional mechanism to ensure that banks build
up capital resources in the early stages of excessive growth of the
overall credit.
What is the philosophy and what are the consequences that lie at the basis of
Basel III?
All transactions that a bank performs involve risk and therefore potential
losses. The stronger the risk, the higher the potential losses are, and therefore the
greater the amount of money that banks must set aside to protect themselves.
It must be borne in mind that the new provisions increase the percentage of
capital that banks must set aside for safety.Thus the banks will have to incur an
increase in costs and this will eventually be passed on to their customers in terms
of increased commissions and spreads on bank loans. Company valuations will be
more careful and specific with respect to at least two decisions: whether to lend
and how much money to lend, together with decisions relating to the costs and
conditions to apply.

35
CHAPTER 3: METHODOLOGY
3.1: Data Collection
This research intends to investigates how and why UK and Italian non-financial
listed Small and Medium Enterprises (SMEs) used derivatives instruments during
the time period 2005-2012. It wants to focus only on non-financial firms because
they should concentrate their efforts on hedging transactions, meanwhile financial
companies have risk management activities related with hedging and trading
transactions. Furthermore the decision to focus on SMEs is due because, has
shown in the table below, seems that no one have done investigation on the use of
financial derivatives by Italian non-financial listed SMEs.
Tab. 2 – Summary of the most important empirical studies on hedging demands
Author/s Publication
Year Size Firm Type Source Country/s
Time
Period Aim
Nance et al. 1993 434 Non-
Financial Survey USA 1986 Derivatives
Dolde 1993 244
Fortune
500
Companies
Survey USA NO Info Derivatives
Bodnar et
al. 1995 530
Non-
Financial
Compustat
&
Survey
USA 1994 Derivatives
Berkman
and
Bradbury
1996 244 Non-
Financial
Annual
Reports
New
Zeland 1994 Derivatives
Mian 1996 169 Non-
Financial
Annual
Reports USA 1992
FX and IR
Derivatives
Tufano 1996 48 Gold
Mining Survey USA 1991-1993
Commodity
Price
Derivatives
Geczy et al. 1997 372 Non-
Financial
Annual
Reports USA 1991
FX
Derivatives
Grant and
Marshall 1997 250
Top 250
UK
Companies
Survey UK 1994,1995 Derivatives
Hakkarainen
et al. 1997 84
Non-
Financial Survey Finland 1994 Derivatives
Gay and
Nam 1998 486
Non-
Financial
Swaps
Monitor
Database
USA 1995 All and IR
Derivatives
Bodnar and 1999 126 Non- Survey Germany 1997 Derivatives

36
Gebhardt Financial
Alkeback
and Hagelin 1999 163
Non-
Financial Survey Swedish 1996 Derivatives
Jalivand,
Switzer and
Tang
2000 154 Non-
Financial
Survey &
Montreal
Exchange
Database
Canada 1996 Derivatives
Loderer and
Pichler 2000 96
Non-
Financial Survey Switzerland 1996
Currency
Risk
De Ceuster
et al. 2000 73
CCs &
Top200
Firms
Survey Belgium 1997 Derivatives
Allayannis
and Ofek 2001 724
Non-
Financial
Annual
Reports USA 1992-1993
FX
Derivatives
Keloharju
and
Niskanen
2001 44 Non-
Financial Survey Finland 1985-1991
Foreign
Currency
Debt
Mallin et al. 2001 231 Non-
Financial Survey UK 1997 Derivatives
Graham and
Rodgers 2002 442
Non-
Financial
SEC’s
EDGAR -
Compustat
USA 1994 or
1995
FX and IR
Derivatives
Bison,
Pelizzon
and Sartore
2002 150 Non-
Financial
Annual
Reports Italy 1994-1999 Derivatives
Guay and
Kothary 2003 234
Non-
Financial Compustat USA 1997
FX, IR,
Commodity
Price
Derivatives
Kedia and
Mozumdar 2003 523
Non-
Financial &
Non-
Utilities
Compustat
& Moody’s
Investor
Services
USA 1996
Foreign
Curremcy-
Denominated
Debt
Geczy,
Minton and
Schrand
2004 372
US
Industrial
Corporation
Fortune’s
1991 List &
Annual
Reports
USA 1990 Currency
Derivatives
Faulkender 2005 133 Chemical
Industry
SDC
Platinum,
DealScan,
EDGAR,
Compustat
USA 1994-1999 Interest Rate
Derivatives
El-Masry 2006 401 Non-
Financial
Survey &
FAME UK
March-May
2001 Derivatives
Judge 2006 400 Non-
Financial
FT500,
Survey & UK 1995 Derivatives
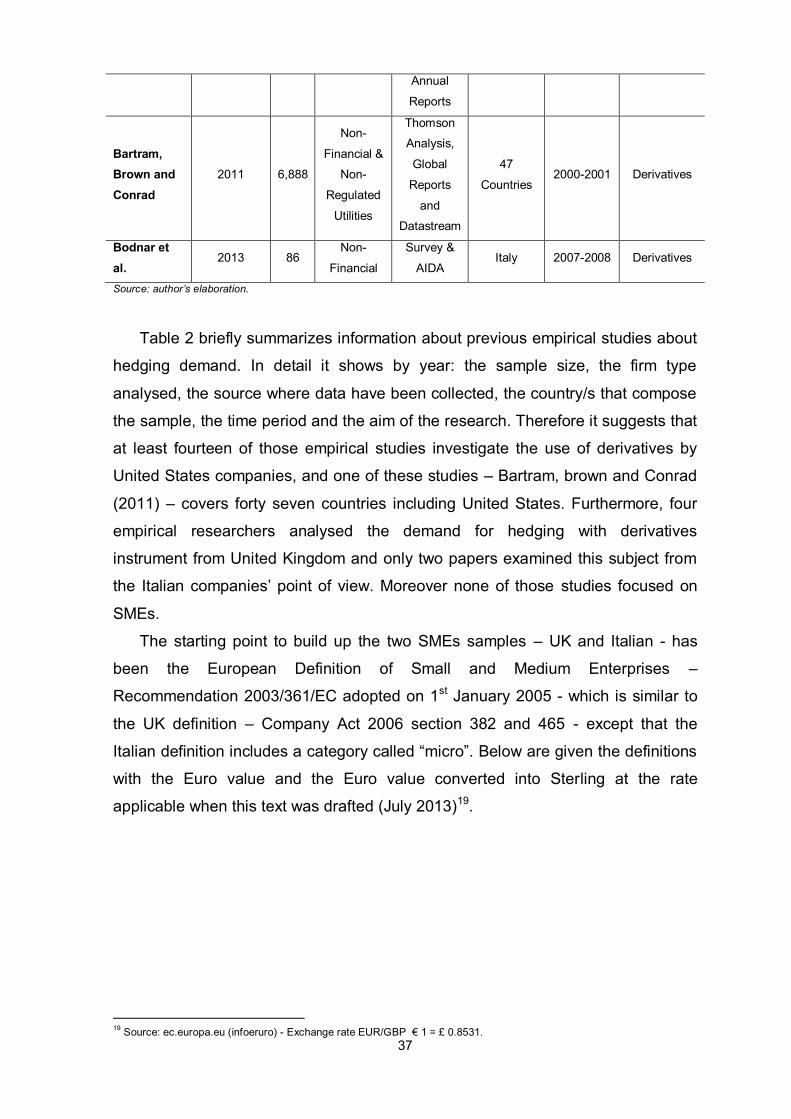
37
Annual
Reports
Bartram,
Brown and
Conrad
2011 6,888
Non-
Financial &
Non-
Regulated
Utilities
Thomson
Analysis,
Global
Reports
and
Datastream
47
Countries 2000-2001 Derivatives
Bodnar et
al. 2013 86
Non-
Financial
Survey &
AIDA Italy 2007-2008 Derivatives
Source: author’s elaboration.
Table 2 briefly summarizes information about previous empirical studies about
hedging demand. In detail it shows by year: the sample size, the firm type
analysed, the source where data have been collected, the country/s that compose
the sample, the time period and the aim of the research. Therefore it suggests that
at least fourteen of those empirical studies investigate the use of derivatives by
United States companies, and one of these studies – Bartram, brown and Conrad
(2011) – covers forty seven countries including United States. Furthermore, four
empirical researchers analysed the demand for hedging with derivatives
instrument from United Kingdom and only two papers examined this subject from
the Italian companies’ point of view. Moreover none of those studies focused on
SMEs.
The starting point to build up the two SMEs samples – UK and Italian - has
been the European Definition of Small and Medium Enterprises –
Recommendation 2003/361/EC adopted on 1st January 2005 - which is similar to
the UK definition – Company Act 2006 section 382 and 465 - except that the
Italian definition includes a category called “micro”. Below are given the definitions
with the Euro value and the Euro value converted into Sterling at the rate
applicable when this text was drafted (July 2013)19.
19
Source: ec.europa.eu (infoeruro) - Exchange rate EUR/GBP € 1 = £ 0.8531.

38
Tab. 3 – EU SMEs Definition.20
Category Headcount Turnover Balance Sh. Total
Medium < 250 ≤ € 50 million
≤ £ 43 million
≤ € 43 million
≤ £ 37 million
Small < 50 ≤ € 10 million
≤ £ 9 million
≤ € 10 million
≤ £ 9 million
Micro < 10 ≤ € 2 million
≤ £ 2 million
≤ € 2 million
≤ £ 2 million
Source: author’s elaboration. The Euro value converted into Sterlin have been done using the following exchange rate:
Exchange rate EUR/GBP € 1 = £ 0.8531 from ec.europa.eu (infoeruro).
Data have been collected from two different sources Bureaux Van Dijk
databases (BVD) and Annual Reports (AR).
Beginning with the definition of SMEs and using Bureaux Van Dijk databases21
the two sample of UK and Italian non-financial listed SMEs have been created. In
those samples are included all the companies that in 2005, at least, recorded
between 10 and 250 number of employees and between 2 million and 50 million
Euro (£ 2 million and £ 43 million) turnover. Once these two sample have been
constructed have been collected, from FAME database for the UK companies and
from AIDA database for the Italian companies, all the necessary variables to
perform the calculation needed for this research.
Furthermore, since there are no databases that provide information on the use
of financial instruments used by companies to cover themselves against risk
exposure, it was decided to collect these data from the firms’ annual reports
instead of doing a survey. Because annul reports give a larger quantity and quality
information than surveys do. Moreover, the Italian database – AIDA – does not
split the Italian companies turnover into “Italian Turnover” and “Export Turnover”
as FAME – UK database – does22, so AIDA gives only the macro variable. Thus
this information, only for the Italian sample, has been collected in the annual
reports of each firm. To do that have been taken into account what the Italian and
the European accounting legislations states23.
Therefore the information about the use of financial derivatives by the UK and
Italian SMEs, the types of these instruments - Foreign Exchange (FX), Interest
Rate (IR) and Commodity – and the Italian “Export Turnover” have been handly
20
All the amounts in Sterling are rounded. 21
FAME for UK sample and AIDA for Italian sample. 22
FAME provides the macro data “Turnover” and the micro data “UK Turnover” and “Export Turnover”. 23
Codice Civile (Civil Law) Article 2427 points 6 and 10 and International Accounting Standard (IAS) 14.

39
collected for all the companies that are in the two samples – 166 firms for UK and
66 firms for Italy – over the time period of eight years 2005-2012.
During the process of data collection have been noticed a better quality and
quantity of the firms’ financial statements in annual reports due to the changes in
the reporting standards over the time period. And “larger” companies with more
international dimension presented higher quality information about their strategies.
Meanwhile, smaller companies disclosed essential information about their hedging
strategies, and when they used financial derivatives gave limited information about
the instrument adopted.
To obtain these data have been implemented two different methods. When the
format of the annual report does not allowed to use keywords to catch these
information, that was found looking into those sections where debt and risk
information were specified throughout the document. Otherwise, when annual
report presented a new format, the hedging information has been obtained by
implementing a keywords search approach to find the financial risk management
section in the notes to the account in annual reports for each year of 2005-2012.
The data collection process includes the search for annual reports and the search
for relevant hedging data in the reports. The keywords used have been: financial
risk, derivative, notional, market risk, foreign exchange, foreign currency, forward
contract, swap, interest rate. So, when a keyword is found, the surrounding text is
read and interpreted to decide the value of hedging variable.
Therefore the UK sample is composed by a list of 166 UK non-financial listed
companies and the Italian sample includes a list of 66 Italian non-financial listed
companies. Those samples do not comprise financial firms because these
companies may have different motivations for using financial derivatives
instruments instead of hedging purposes.
3.2: Methodology
The study uses two balanced panel data sets, UK and Italian, as the firm data
are built over a time period of eight years with multiple cross sections for each
year. A panel data like this has a larger number of observation points which
increase the degree of freedom and reduce the collinearity between independent
variables, resulting in improved efficiency of the econometric estimates (Hsiao
2003). The validity of the estimation results is also increased as panel data set
control for omitted variables (Hsiao 2003).

40
Have been used a binary variable to classify whether a firm is using derivatives
or not. That variable takes the value 1 if the firm uses derivatives and 0 if
otherwise or there is no information disclosed in the annual report. A derivative
user can be defined as a firm that provide qualitative information about any
derivative use in the annual report.
This study implemented a logit model because the dependent variables are
binary variables and that requires the use of a model that allow to do the analysis
of binary outcomes. The analysis is divided in two steps. In the first step, due to a
large number of explanatory variables with the financial information of the firms in
the samples, have been needed to reduce them to create the best possible model.
In this regards has been run the Univariate Logit Regression for all the
independent variables, to identify the most significant variables. So, each
significant variable has been selected as candidate for run the multivariate model.
The Univariate Logit Regression has been run for all the explanatory variables in
relation with three main dependent variables. The first is “Use” which intend to test
if firms use derivatives as hedging instrument or otherwise and the results show
whose explanatory variables are theoretically more influential in the decision of
hedging. The second and the third dependent binary variables are foreign
exchange (FX use) and interest rate (IR use) dummies and is tested the
significance of the different proxies for these specific hedging instruments.
The second step is the Multivariate Logit Regression whose purpose is to
capture the correlation of the observation within a firm. It intends to examine the
determinants of hedging hypotheses using a dependent binary variable that takes
value 1 when the firm is hedging and 0 otherwise. Have been decided to use a
logit model because it overcomes the limitations of the linear probability model
(LPM) because it uses the maximum likelihood estimation (MLE) to calculate the
regression coefficients. This model maximizes the probability that unobserved
dependent and independent variables occur together. The model that is used by
the Logit regression is written as24:
Li = ln (Pi/(1-Pi)) = β1 + β2Xi + µi
With logit regression can be obtained three information:
24
Gujarati and Porter (2009), p.555.

41
Estimated Coefficients: that gives the change in the logit function given a
change in the independent variable.
Odds Ratio: that is the probability of the event happens divided by the
probability of the event does not happens, in this context the event is the
probability to hedge or not.
Marginal Effect: that measures the actual change in probability.
On this way is possible to determine the effect of the explanatory variables
on the decision of hedging.

42
CHAPTER 4: HYPOTHESES
4.1: Introduction.
Three different dependent dummy variables have been used to measure the
hedging activities by UK and Italian non–financial Small and Medium Enterprises.
The first dependent variable is Hedgers (Use) and tests the firm’ likelihood on
using derivatives instruments. The second is IR Hedgers (IR Users) which tests
the probability that a firm hedges by derivatives, and the third variable is FX
Hedgers (FX Users) whose aims is the same of the one defined above – Hedgers
and IR Hedgers.
Based on a comprehensive review of the existent literature have been
identified six main research hypotheses.
4.1.1: H1 – Financial Distress.
A financial distress situation can occur when a firm is not able to meet or
presents difficulty to pay off its financial obligations to its creditors. Hence, a
company can incur in a situation like this when it has high fixed costs, illiquid
assets or revenues that are sensible to the economic downturns. Smith and Stulz
(1985) with their research showed that companies increased their value with
hedging because this allowed them to smooth taxable income reducing expected
tax liabilities. At the same time they confirmed that hedging can reduce the costs
of financial distress. Therefore, companies seems to have a positive relationship
between the financial distress and the probability to hedge. In fact, higher is the
probability of a financial distress for a firm higher will be the probability that it is
going to hedge.
To test these hypotheses have been used the following proxies:
Interest Coverage ratio (IC): this is used to determine how easily a firm can
pay interest on outstanding debt. The lower is this ratio more higher is the
probability to incur into a financial distress situation. Thus there is a negative
relationship between IC ratio and the expected decision to hedge as argued by
Judge (2006), Bartram et al. (2009) and Geczy et al. (1997). Have to be taken
in to account that when this ratio is 1.5 or lower it means that the firm’s ability
to meets interest expenses could be questionable. And a ratio below 1 means
that the firm is not generating enough revenues to cover interest expenses.

43
Leverage ratio: it is a financial measure that gives an idea of the ability of a
firm to meet its financial obligations. So, firms with higher leverage are keener
to incur in distressed situation therefore are more likely to hedge. Thus, can be
stated that should be a positive relationship between leverage and the
probability to hedge. Higher leverage imply that the firms will have a higher
probability of ending up in a distressed situation and thus are more likely to
hedge. As stated by Campello, Lin, Ma and Zou (2011), Bartram et al. (2009)
and Graham and Rogers (2002).
Profitability ratio: this ratio shows a firm’s overall efficiency and
performance. This macro ratio can be divided in two types, the margin ratios
that represent the firm’s ability to translate sales into profits at various stages of
measurement, and the returns ratios that show the firm’s ability to measure the
overall efficiency of the firm in generating returns for its shareholders. Bartram
et al. (2009) argued that firm’s with higher profitability could have a lower
probability to incur in a financial distress situation thus are less likely to hedge.
But Glaum (2002) stated that firm’s with higher profitability will enable
managers to conduct a more selective hedging strategy to take bets in the
financial markets, so there should be a positive relationship between hedging
and profitability.
Debt Maturity ratio: this ratio refers to the short term and long term contracts
between the issuer and the investors. It is measured by long term borrowings
as a percentage of total debt, Bartram et al. (2009). So, could be stated that
firms having long debt maturities are more likely to hedge, this because longer
debt maturities can indicate a potentially higher amount of debt.
Z-Score ratio - (Altman 1968): this ratio is used to predict the probability that
a firm will goes into bankruptcy within two years. It is used to predict corporate
defaults and it is used as a control measure for the financial distress status of
firms in academic studies. The Altman Z-score ratio is based on five financial
ratios that can be calculated from data found on a company's annual report.
There are several version of this ratio, in this research has been use the one
for listed companies. Below the z-score formula used:
z-score = 1.2A + 1.4B + 3.3C + 0.6D + 0.9E 25
A= Working Capital/Total Assets
25
Altman (1968), “Financial Ratios, Discriminant Analysis and the Prediction of Corporate Bankruptcy”, The Journal of Finance, vol. 23 pp. 589-609.

44
B = Retained Earnings/Total Assets
C = Earnings Before Interest & Tax/Total Assets
D = Market Value of Equity/Total Liabilities
E = Sales/Total Assets
Tab. 4 – H1 Financial Distress Proxies.
Measure Predictions
IC -
Leverage +
Profitability +/-
Debt maturity +
Z-Score -
Source: author’s elaboration.
4.1.2: H2 – Underinvestment Costs.
Bessembinder (1991) and Myers (1977) with their research show that when
leverage is hight the asymmetric information can lead to underinvestment.
Bessembinder (1991) states that hedging can increase the debt capacity reducing
the probability of financial distress and thus changes the default states of the firm,
making the firm able to reduce the costs of underinvestment and accomplish lower
borrowing costs. Froot, Scharfstein and Stein (1993) in their analysis show that
hedging ensure firms to have enough internal founds to exploit attractive
investment opportunities an thus increase the shareholders’ value. Furthermore
they suggest that whereas imperfect capital markets make external financing
policy, smaller firms and firth higher investment opportunities are more likely to
hedge.
To test these hypotheses have been used the following proxies:
Capital Expenditure over sales ratio: this ratio measures the level of
investments that a firm is making into its future. It compares the capital
expenditure to sales in a given period. This measure has been used by Tufano
(1996), Geczy et al. (1997), Graham and Rogers (2002) and Judge (2006).
Market to Book ratio: this ratio is used to find the value of a company
comparing its book value with its market value. This ratio has been use by
Froot et al. (1993).
It is expected a positive relationship between these ratios and the probability to
hedge, because theories predict a positive association between investment
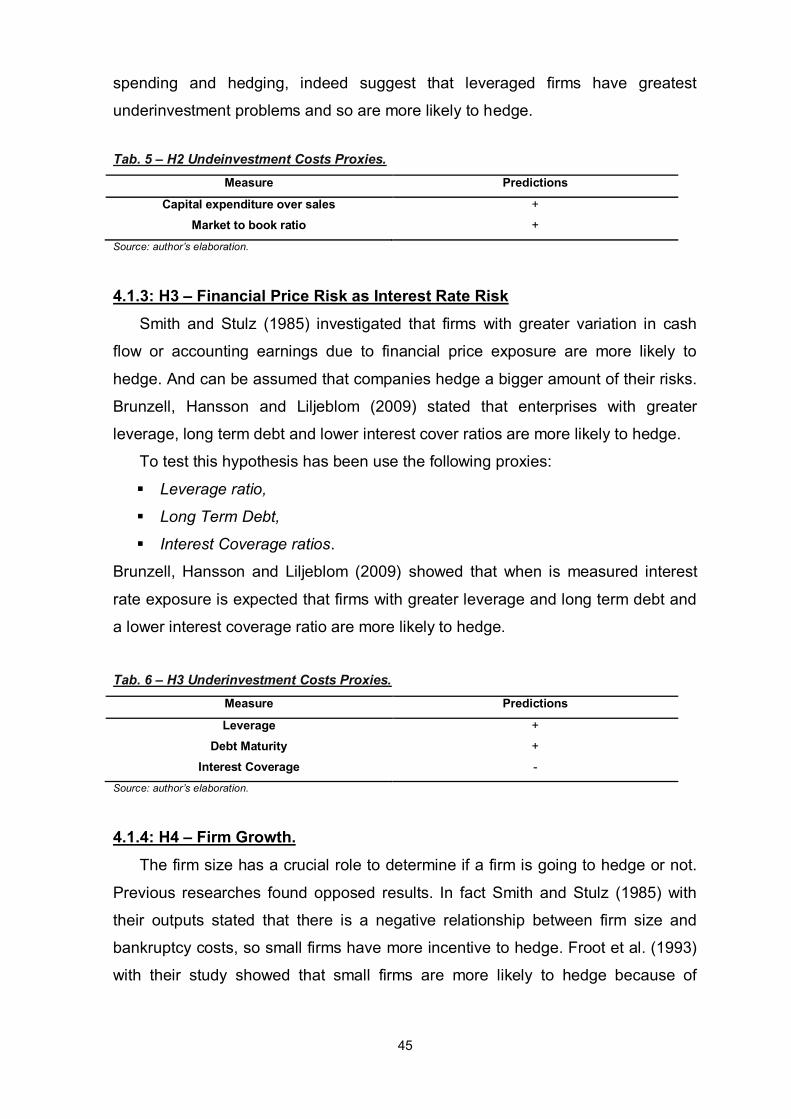
45
spending and hedging, indeed suggest that leveraged firms have greatest
underinvestment problems and so are more likely to hedge.
Tab. 5 – H2 Undeinvestment Costs Proxies.
Measure Predictions
Capital expenditure over sales +
Market to book ratio +
Source: author’s elaboration.
4.1.3: H3 – Financial Price Risk as Interest Rate Risk
Smith and Stulz (1985) investigated that firms with greater variation in cash
flow or accounting earnings due to financial price exposure are more likely to
hedge. And can be assumed that companies hedge a bigger amount of their risks.
Brunzell, Hansson and Liljeblom (2009) stated that enterprises with greater
leverage, long term debt and lower interest cover ratios are more likely to hedge.
To test this hypothesis has been use the following proxies:
Leverage ratio,
Long Term Debt,
Interest Coverage ratios.
Brunzell, Hansson and Liljeblom (2009) showed that when is measured interest
rate exposure is expected that firms with greater leverage and long term debt and
a lower interest coverage ratio are more likely to hedge.
Tab. 6 – H3 Underinvestment Costs Proxies.
Measure Predictions
Leverage +
Debt Maturity +
Interest Coverage -
Source: author’s elaboration.
4.1.4: H4 – Firm Growth.
The firm size has a crucial role to determine if a firm is going to hedge or not.
Previous researches found opposed results. In fact Smith and Stulz (1985) with
their outputs stated that there is a negative relationship between firm size and
bankruptcy costs, so small firms have more incentive to hedge. Froot et al. (1993)
with their study showed that small firms are more likely to hedge because of

46
greater information asymmetry and because the external financing are more costly
due to higher transaction costs.
To test this hypothesis has been use the following proxies:
Ln total assets: this proxy has been used also by Graham, and Rodgers
(2002), Guay and Kothary (2003), Nguyen and Faff (2003), Bartram et al.
(2004), Judge (2006) and by Campello, Lin, Ma and Zou (2011).
Ln total sales.
Ln market capitalization.
Tab. 7 – H4 Firm Growth.
Measure Predictions
Ln Total Assets +
Ln Total Sales +
Ln Market Capitalization +
Source: author’s elaboration.
4.1.5: H5 – Overseas Operations and Foreign Exchange Risk.
Firms that have operation in foreign markets are more exposed to financial
risks such as exchange rate. Hence these companies should be more likely to
hedge by derivatives instruments to cover themselves against foreign currency
exposure. Berkman and Bradbury (1996) with their research found that one of the
main factors that influences the manager’s decisions to use derivatives or not is
the level of the overseas operations. Dominguez and Tesar (2001) demonstrated
that firms that work in an high internationalized industry are more likely to hedge
their exchange rate exposure. Judge (2006b) showed that companies with greater
percentage of foreign sales or foreign assets are more likely to hedge.
To test this hypothesis has been use the foreign sales over total sales proxy.
And is expected that it has a positive relationship with hedging, especially with
foreign exchange derivatives use.
Tab. 8 – H5 Overseas Operations.
Measure Predictions
Foreign Sales over Total sales +
Source: author’s elaboration.

47
4.1.6: H6 – Hedging Substitutes.
The use of hedging substitutes help firms to reduce their probability to incur
into a financial distress situation and support agency problem costs, Nance et al.
(1993). They also show that imposing dividend restrictions can be lowed the
probability for a firm to incur in a financial distress situation. Haushalter (2000)
shows that the relationship between dividend behavior and the decision to hedge
can be positive and negative. Judge (2006) and Bartram et al. (2009) and Geczy
et al. (1997) in their researches show that firms investing in more liquid or less
risky assets will be less likely to hedge.
Tab. 9 – H6 Hedging Substitutes.
Measure Predictions
Dividend Yield +
Liquidity -
Source: author’s elaboration.
4.2: Summary of Measures and Predictions
A brief summary of the six research hypotheses:
H1: Firms with higher probability of financial distress are more likely to hedge.
H2: Firms exposed to underinvestment costs (firms with high leverage or with
more growth opportunities) are more likely to hedge.
H3: Firms facing interest rate exposure are more likely to hedge a larger portion of
their exposure.
H4: Larger firms are more likely to hedge due to benefits of economies of scales
by engaging risk management activities.
H5: Companies with high degree of overseas operations are more likely to hedge.
H6: Firms using hedging substitutes are less likely to hedge.
The table below presents the variables predictions derived from the hedging
theory and literature. Have to be taken in to account that one measure can proxy
more than one argument at the same time.

48
Tab. 9 – Measure and Predictions.
Independent Variables
ID Measures Predictions
H1 H2 H3 H4 H5 H6
Debt/Equity DEBTOEQUITY Leverage + + +
Debt/Capital DEBTTOCAPITAL Leverage + + +
LT-Debt/Capital LTDEBTCAPITAL Leverage + + +
LT-Debt/equity LTDEBTEQ Leverage + + +
Liabilities/Assets LIABASSETS Leverage + + +
Gearing Ratio GEARINGRAT Leverage + + +
Book value Leverage
BVLEV Leverage + + +
Market Value Leverage
MVLEV Leverage + + +
EBIT/Int. Payments
EBITINT IC - -
EBITDA/Int. Payments
EBITDAINT IC - -
Interest Cover Ratio
INTERESTCOVERX IC - -
Assets Cover Ratio
ASSETCOBERX IC - -
Berryratio BERRYRATIO IC - -
Grossmargin GROSSMARGIN IC - -
Short Term Borrowing
STDTPCT Debt Maturity -
Long Term Borrowing
LTDTPCT Debt Maturity +
Current Ratio CRAT Liquidity - -
Quick Ratio QRAT Liquidity - -
Liquidity Ratio LIQUIDITYRATIOX Liquidity - -
Shareholders liquidity ratio
SHAREHOLDERSLIQUIDITYRATIO Liquidity - -
Solvency ratio asset based
SOLVENCYRATIOASSETBASED Liquidity - -
ROC ROC Profitability
ROE ROE Profitability
Profit Margin PROFITMARGIN Profitability
Return on Shareholders’ Funds
RETURNONSHAREHOLDERSFUNDS Profitability
Return on Total Assest
ROA Profitability
EBIT Margin EBITMARGIN Profitability - +
EBITDA Margin EBITDAMARGIN Profitability - +
Z-Score ZSC Likelihood of default
-
Capital Expenditure/Sales
CAPEXPSALES Growth Opportunities
+
Market to Book ratio
MTB Growth Opportunities
+
Ln Market Capitalization
LNMACP Firm Size - - +
Ln Total Sales LNTS Firm Size - - +
Ln Total Assets LNTA Firm Size - - +
Dividend Yield DIVYIELD Dividend Behaviour
- +
Foreign Sales % FSPCT Foreign Exposure
+ +
Source: author’s elaboration.

49
4.3: Dependent Variables
The dependent variables that have been used in this study are binary variables
and take the value 1 if a firm in the sample use derivatives and 0 if otherwise. It
wants to identify specific firm characteristics that might determine a firm’s decision
to hedge. This method is applied also for the other two dependent variables, FX
Hedgers and IR Hedgers. In both cases the dummy variable assumes the value 1
when the firm is using FX derivatives instruments (or IR derivatives instruments)
and 0 otherwise. Using these as dependent variables allow the research to identify
which firm’s characteristics determine the firm’s decision to use the specific types
of derivatives, FX derivatives and IR derivative.
4.4: Independent Variables
Below is reported a table summarizing all the independent variables that have
been used to analyse the objectives of this research.

50
Tab. 10 – Definitions and data sources.
VARIABLES DEFINITION SOURCE
Z-SCORE 1.2(working capital/total assets) + 1.4(retained earnings/total assets) + 3.3(earnings before interest and taxes/total assets) + 0.6(market value of equity/total liabilities) + 0.9(sales/total assets)
Bureaux van Dijk
EBIT/ INT. PAYMENTS EBIT/Int. Payments Bureaux van Dijk
EBITDA/INT. PAYMNENTS EBITDA/Int. Payments Bureaux van Dijk
DIVIDEND YIELD Dividend Yield – close Bureaux van Dijk
DEBT/EQUITY Total debt/Shareholder’s Equity Bureaux van Dijk
DEBT/ CAPITAL Total debt/ Total capital Bureaux van Dijk
LT-DEBT/CAPITAL Long term debt/Capital Available Bureaux van Dijk
LT-DEBT/EQUITY Long term debt/ Shareholder’s Equity Bureaux van Dijk
LIABILITIES/ASSETS Total liabilities/Total Assets Bureaux van Dijk
LEVERAGE Geraing ratio Gearingratio = - ((Short Term Loans &Overdafts+Long Term Liabilities)/Shareholders Funds))x100
Bureaux van Dijk
BOOK VALUE LEVERAGE Total debt /(Total Equity + Total Debt) Bureaux van Dijk
MARKET VALUE LEVERAGE
Total debt/(Total assets –Total equity + Market capitalization)
Bureaux van Dijk
LN MARKET CAPITALIZATION
Ln market capitalization Market capitalization (The market value of a listed company is calculated by multiplying its share price by the number of shares outstanding)
Bureaux van Dijk
LN TOTAL SALES Turnover Bureaux van Dijk
LN TOTAL ASSETS Ln Total Assets Bureaux van Dijk
CURRENT RATIO Current assets/Current Liabilities Bureaux van Dijk
QUICK RATIO (Current assets-Inventories)/Current liabilities Bureaux van Dijk
CAPITAL EXPENDITURE/SALES
Capital expenditure/sales Bureaux van Dijk
MARKET TO BOOK RATIO (Total assets-Total equity + market capitalization)/Total assets
Bureaux van Dijk
ROC (Net income- Dividends)/Total Capital Bureaux van Dijk
ROE Net Income/Capital Bureaux van Dijk
SHORT-TERM BORROWING
Short-Term Borrowing/Total debt Bureaux van Dijk
LONG-TERM BORROWING Long-Term Borrowing/Total debt Bureaux van Dijk
FOREIGN SALES Foreign Sales/Total Sales Annual Report
LIQUIDITY RATIO (Current Assets- Stock & W.I.P.)/Current Liabilities
Bureaux van Dijk
SHAREHOLDERS LIQUIDITY RATIO
Shareholders’ Funds/ Long term liabilities Bureaux van Dijk
SOLVENCY RATIO (ASSET BASED) (%)
Shareholders’ Funds/Total Assets Bureaux van Dijk
ASSET COVER Total Assets/Long Term Debt Bureaux van Dijk
PROFIT MARGIN (%) Profit(Loss) before tax/Turnover Bureaux van Dijk
RETURN ON SHAREHOLDERS’ FUNDS (%)
(Profit(Loss) before tax/Shareholders ‘Funds)% Bureaux van Dijk
RETURN ON TOTAL ASSETS (%)
(Profit(Loss) before tax/Total Assets)% Bureaux van Dijk
INTEREST COVER (%) Profit (Loss) before Interest/ -Interest Paid Bureaux van Dijk
GROSS MARGIN (%) Gross Profit/Turnover Bureaux van Dijk
BARRY RATIO (%) -((Gross Profit+Other Operating Income pre OP)/(Administration Expenses + Exceptional Items pre OP))
Bureaux van Dijk
EBIT MARGIN (%) Operating Profit/Turnover Bureaux van Dijk
EBITDA MARGIN (%) EBITDA/Turnover Bureaux van Dijk Source: author’s elaboration.

51
CHAPTER 5: EMPIRICAL ANALYISIS
5.1: Methodology
This study employs a balanced panel data set as the firm-data is constructed
over a time period of 8 years (2005-2012) with multiple cross sections for each
year. A panel data set has a larger number of observation points which increase
the degree of freedom and reduce the collinearity between independent variables,
resulting in improved efficiency of economic estimates (Hsiao, 2003). The validity
of the estimation results is also increased as a panel data set control for omitted
variables (Hsiao, 2003).
This study employs a method to examine if there are any firm level factors that
determine a firm’s decision to hedge by using a multivariate logit regression.
5.1.1: Outliers
Winsorization is used to prevent any disturbance in the estimation outputs
caused by outliers. As some of the variables may contain extreme values, it could
create skewness in the samples and this the variables may not be normally
distributed (Allayannis and Ofek, 2001). The winsorization process removes any
outliers by truncate the extreme values outside a fixed number of standard
deviations from the mean, so that these extreme values will be equal to the
highest or lowest number inside the parameter (Hellerstein, 2008). Moreover, the
natural log has been applied on some variables to mitigate the problem of
heteroscedasticity. To test for the normality of the variables this study uses the
Shapiro-Wilk test where the null hypothesis states that the variable is normally
distributed. As the test shows rejection of the null hypothesis this study takes use
of robust (heteroscedastic) standard errors to mitigate the problem of
heterogeneity and lack of normally distributed data.
5.1.2: Multicollinearity
When two or more explanatory variables in a model are correlated could arise
the problem of multicollinearity. Therefore to determine which independent
variables have the highest theoretical relevance to hedging, have been used the
Wald chi-square statistic. It can be used to determine the statistical significance of
each explanatory variable, where the null hypothesis is that the coefficient in a
logit regression model is equal to zero.

52
5.2: Descriptive statistics UK non-financial listed SMEs
The data sample consists of 1328 firm-year observations. The table below
shows the activity and the types of derivatives of hedging and the most used
derivatives and derivative combinations for the firm-year observations in the UK
sample. Panel A shows that 23.84% of the sample is classified as using
derivatives to hedge. Panel B shows that 55.21% of the derivative users disclosed
in their annual reports that they used IR derivatives, 51.74% used FX derivatives
and 1.74% Commodity derivatives. The most used derivative combination was FX
and IR derivatives 7.64%. Further, Panel D and E show that the most used FX
derivative is FX Forwards 83.89%. The most commonly used IR derivative is IR
Swaps 96.86%. Most used derivative combination is FX Forwards and IR Swaps
7.64%. The fact that forward contracts and swaps are more commonly used than
options could be because of the cost required to pay upfront when buying an
option. Forwards contracts and swaps require no such premium payment upfront
but are quoted with a bid-ask spread, which means the buyer will always get the
highest price and the seller the lowest price.
Tab. 11 - Hedging activity and types of derivatives used by UK non-financial SMEs.
This table presents data on the hedging activity with derivatives disclosed in the annual reports amongst the
sample of 166 firms from the year 2005-2012. Panel data A shows the number of derivative users and non-
users. Panel B presents data on the type of derivatives used. Panel C presents the combination of derivatives
used and distinguishes between FX derivatives users, IR derivative users and Commodity users. Panel D and
E present data on the most commonly used derivatives within the groups of FX and IR derivatives. Panel F
shows the most common combinations of FX and IR derivatives used.
Panel A: Derivative Use N %
Use 288 23.84%
Do not use 920 76.16%
Total 1208 100%
Panel B: Types of derivatives used (calculated as a
percentage of 288 derivative users – Panel A)
N %
IR 159 55.21%
FX 149 51.74%
Commodity 5 1.74%

53
Panel C: Combination of derivative used N %
FX only 125 43.40%
IR only 136 47.22%
Commodity only 2 0.69%
FX & IR only 22 7.64%
FX & Commodity only 2 0.69%
IR & Commodity only 1 0.35%
Total 288 100.00%
Panel D: Most used FX derivatives (calculated as a
percentage of 149 derivative users – Panel B)
N %
FX Forwards 125 83.89%
FX Swaps 1 0.67%
FX Options 5 3.36%
FX Futures 2 1.34%
Panel E: Most used IR derivatives (calculated as a
percentage of 159 derivative users – Panel B)
N %
IR Forwards 0 0.00%
IR Swaps 154 96.86%
IR Options 5 3.14%
IR Futures 0 0.00%
Panel F: Combination of FX and IR derivative used
(calculated as a percentage of 288 derivative users –
Panel A)
N %
FX Forwards only 101 35.07%
FX Options only 4 1.39%
FX Futures only 2 0.69%
IR Swaps only 132 45.83%
IR Options only 5 1.74%
FX Forwards + FX Swaps only 1 0.35%
FX Forwards + FX Options only 1 0.35%
FX Forwards + IR Swaps only 22 7.64%

54
Source: author’s elaboration of data handily collected from annual reports of UK non-financial listed SMEs.
The table below (Table 12) examines the differences in firm characteristics
between hedgers and non-hedgers through the mean difference test and the
Wilcoxon rank sum test. Looking into the financial distress measures can be seen
that those are significantly higher for users than non-users derivatives. In more
detail, about the leverage proxies first of all have been stated that four out of eight
variables are significant and three out of four significant proxies are higher for the
hedgers. And those are debt equity ratio, long term debt equity and market value.
This shows what has been assumed by the literature that firms with higher
leverage are more likely to hedge because are more keener to incur in financial
distress situations.
Have been tested eight profitability measures and five of these are significant
variables such as profit margin, return on shareholders’ funds, return on total
assets, EBIT margin and EBITDA margin. The results show what has been stated
by Glaum (2002) that hedgers are those firms with higher profitability.
Five proxies have been use to test the relationship between interest coverage
ratio and hedgers. These ratios show how easily a firm can pays interests on
outstanding debt. Three of these are significant variables and two of these show
that derivative users have higher interest coverage ratios. That is inconsistent with
what the literature says because it states that there is a negative relationship
between this ratio and the probability to hedge. So hedgers should have lower
ratio because this would mean that they are more likely to go in a distressed
situation. Asset coverage ratio is the only significant variable that shows the
negative relationship.
About the debt maturity ratios both of them are significant and are consistent
with the literature because the long term borrowing variable is significant for the
hedgers and that shows that firms with long term debt maturity are more likely to
hedge to cover themselves against expected future risk fluctuations.
The two proxies used to test the growth opportunities are both significant but
only capital expenditure reflects what stated by the literature that companies
hedge because investment.
To measure the financial price risk have been use mainly three proxies the
foreign sales, leverage ratio and the interest coverage ratio. Foreign sales and
leverage ratios show that there is a positive relationship between hedging and

55
financial price exposure. The interest coverage ratios show that firms that have a
higher financial exposure are more likely to hedge and that is in contrast with what
is stated by the literature because should exist a negative relationship. The foreign
sales variable has been used also to test the relationship between hedging and
overseas operations and as shown firms facing higher operations in foreign
markets have been used hedging instruments to protect themselves against this
risk.
All the variables measuring firm size are significantly higher for hedgers and
that is consistent with the fact that higher firms enjoy information and transaction
costs scale economies by engaging in risk management activities.
Finally to test the relationship between hedging and the use of other
instruments to hedge have been used five liquidity proxies and three of them are
significant such as current ratio, shareholder’s liquidity ratio and solvency ratio
asset based. Only the shareholder’s liquidity ratio shows the right relationship
stated by the literature such as more liquid is a firm less likely to hedge it is.
Tab. 12 - Mean difference test of hedgers vs non-hedgers.
This table presents the results from the Mean difference test and the Wilcoxon rank sum test. The tests are
performed on a rage of independent variables between derivatives users versus non-users, where ***, ** and *
indicate the significance at 1%, 5% and 10% respectively.
Variable Hedgers
Non-
Hedgers T-Stat Wilcoxon rank sum test
N Mean N Mean Diff T-stat Sig. H&NH Z Sign.
ZSC 234 1,13 563 0,99 -0,14 -1,48 0,14 H=NH -0,67 0,50 DIVYIELD 152 3,42 242 3,66 0,24 0,89 0,40 H=NH 0,64 0,52 LEVERAGE
DEBTEQUITY 172 40,64 455 15,69 -24,96 -2,52 0,01
*** H>NH -3,63 0,00
DEBTCAPITAL 172 0,27 455 0,31 0,05 0,60 0,55 H=NH -1,51 0,13 LTDEBTCAPITAL 187 0,20 515 0,19 -0,01 -0,41 0,68 H=NH -2,98 0,00
LTDEBTEQUITY 187 0,40 515 0,26 -0,14 -2,34 0,02
** H>NH -4,18 0,00
LIABASSETS 259 0,44 729 0,50 0,06 3,14 0,00
*** H<NH 2,24 0,03
GEARINGRAT 268 53,43 752 54,66 1,23 0,22 0,83 H=NH -2,16 0,03 BV 172 0,31 455 0,31 0,00 0,02 0,99 H=NH -1,71 0,09
MKTV 156 0,42 347 0,35 -0,07 -3,29 0,00
*** H>NH -3,16 0,00
LIQUIDITY
CRAT 286 2,37 911 2,11 -0,26 -1,87 0,06
* H>NH -1,62 0,11
QRAT 187 1,71 534 1,60 -0,11 -1,01 0,31 H=NH -1,40 0,16 LIQUIDITYRATIOX 286 1,78 911 1,80 0,01 0,11 0,91 H=NH 0,48 0,63 SHAREHOLDERSLIQUIDITY
RATIOX 266 25,03 731 36,30 11,27 1,70
0,09 *
H<NH 1,58 0,11
SOLVENCYRATIOASSETBA
SED 285 56,99 902 51,30 -5,69 -3,36
0,00 ***
H>NH -2,19 0,03
PROFITABILITY ROC 112 0,02 172 0,03 0,02 1,27 0,21 H=NH 0,65 0,52

56
ROE 277 -0,01 868 -0,12 -0,10 -1,48 0,14 H=NH -0,86 0,39
PROFITMARGIN 260 6,18 847 -0,94 -7,12 -4,46 0,00
*** H>NH -4,01 0,00
RETURNONSHAREHOLDER
SFUNDS 282 1,96 849 -7,54 -9,50 -2,41
0,02 **
H>NH -1,67 0,10
RETURNONTOTALASSETS 286 2,45 910 -4,52 -6,97 -3,82 0,00
*** H>NH -2,73 0,01
EBITMARGIN 280 6,32 888 -7,51 -13,83 -4,07 0,00
*** H>NH -5,55 0,00
EBITDAMARGIN 280 14,62 886 2,61 -12,01 -4,24 0,00
*** H>NH -5,65 0,00
GROSSMARGIN 241 45,83 770 48,33 2,49 1,44 0,15 H=NH 1,17 0,24 IC
EBITINP 248 30,13 696 -17,55 -47,67 -2,98 0,00
*** H>NH -4,37 0,00
EBITDAINP 248 63,30 696 12,79 -50,51 -2,57 0,01
*** H>NH -3,75 0,00
INTERESTCOVERX 252 23,89 673 16,14 -7,75 -1,44 0,15 H=NH -2,61 0,01
ASSETCOVERX 187 41,97 503 73,06 31,09 2,50 0,01
*** H<NH 3,95 0,00
BERRYRATIO 241 1,20 767 1,12 -0,07 -1,22 0,22 H=NH -4,20 0,00 GROWTH
OPPORTUNITY
CAPEXPSALES 32 0,00 261 -0,04 -0,05 -1,98 0,05
** H>NH -0,52 0,60
MKTTBRAT 253 0,44 681 0,49 0,05 2,64 0,01
*** H<NH 1,79 0,07
DEBT MATURITY
STBORROW 172 0,37 455 0,47 0,11 3,92 0,00
*** H<NH 4,18 0,00
LTBORROW 172 0,63 455 0,53 -0,11 -3,92 0,00
*** H>NH -4,18 0,00
FIRM SIZE
LNMKTCAP 254 3,11 680 2,48 -0,63 -5,94 0,00
*** H>NH -6,35 0,00
LNTOTSALES 272 10,00 858 9,32 -0,68
-10,11 0,00
*** H>NH
-10,13
0,00
LNTOTASSETS 277 10,47 869 9,52 -0,94
-10,74
0,00 ***
H>NH -
11,08 0,00
FOREIGN
EXCHANGE
FOREIGNSALES 272 0,32 858 0,25 -0,07
-2,78
0,01 ***
H>NH -1,76 0,08
Source: author’s elaboration – FAME database.
The tables below provide differences in means between FX derivative users
versus non-FX derivative users and IR derivative users versus non-IR derivative
users with and without bias.
First of all must be done a comparison of the results from the next two tables –
table 13 and table 14 - that gives an overview of which characteristics are
important in case of hedging with FX derivative no bias and IR derivatives no bias.
Those tables show that FX derivative users no bias have three out of eight non-
significant leverage variables that are debt equity, debt capital and long term debt
equity. It could be explained by the fact that the non-FX derivative users no bias
should be IR derivative users no bias. In fact if look to the table 14 (IR hedgers
non bias) the debt equity and the long term debt equity are both significant and
show that higher leveraged firms are more likely to hedge. The fact that IR

57
derivative users have higher variables form the non-users could be explain
because higher leveraged firms (firms with more debt, thus higher level of IR
exposure) would be more concerned about interest changes on loans than lower
leveraged firms, they are more likely to use IR derivatives than FX derivatives.
As expected FX hedgers no bias has a higher foreign sales variable that can
be explain by the fact that companies with higher foreign exposure are more likely
to hedge. And at the same time for the IR hedgers no bias the long term borrow
variable is significant for those firms who have a long term debt exposure and that
can be justified by the fact that those firms want to cover themselves against any
fluctuation in interest rates risk. Furthermore IR derivative users no bias have one
out of five higher significant variables of IC for hedgers.
Tab. 13 - Mean difference test of FX hedgers vs non-FX hedgers (no bias).
This table presents the results from the Mean difference test and the Wilcoxon rank sum test. The tests are
performed on a rage of independent variables between FX derivatives users versus non-FX derivative users
no bias, where ***, ** and * indicate the significance at 1%, 5% and 10% respectively.
Variable
Hedgers Non-
Hedgers T-Stat Wilcoxon rank sum test
N Mean N Mean Diff T-stat Sig
n. H&NH Z Sign.
ZSC 121 1,60 563 0,99 -0,61 -4,98 0,00
*** H>NH -5,13 0,00
DIVYIELD 76 3,28 242 3,66 0,39 1,05 0,29 H=NH 1,02 0,31 LEVERAGE DEBTEQUITY 65 19,19 456 17,52 -1,67 -0,13 0,89 H=NH -0,19 0,85 DEBTCAPITAL 65 0,24 456 0,31 0,08 0,69 0,49 H=NH 1,93 0,05
LTDEBTCAPITAL 67 0,12 515 0,19 0,07 1,69 0,09
* H<NH 2,25 0,02
LTDEBTEQUITY 67 0,21 515 0,26 0,04 0,44 0,66 H=NH 1,49 0,14
LIABASSETS 127 0,38 729 0,50 0,12 4,90 0,00
*** H<NH 4,97 0,00
GEARINGRAT 136 25,99 752 54,81 28,82 3,92 0,00
*** H<NH 3,99 0,00
BV 65 0,20 456 0,31 0,11 2,57 0,01
*** H<NH 2,45 0,01
MKTV 62 0,26 348 0,35 0,09 2,89 0,00
*** H<NH 2,72 0,01
LIQUIDITY
CRAT 148 2,66 911 2,11 -0,56 -3,19 0,00
*** H>NH -5,24 0,00
QRAT 105 2,02 534 1,60 -0,42 -3,10 0,00
*** H>NH -4,12 0,00
LIQUIDITYRATIOX 148 2,20 911 1,80 -0,40 -2,76 0,01
*** H>NH -3,72 0,00
SHAREHOLDERSLIQUIDITY
RATIOX 132 42,34 731 36,29 -6,05 -0,65 0,51 H=NH -4,13 0,00
SOLVENCYRATIOASSETBA
SED 148 62,54 902 51,26 -11,28 -4,99
0,00 ***
H>NH -4,93 0,00
PROFITABILITY
ROC 148 7,36 903 -3,81 -11,17 -2,20 0,03
** H>NH -3,38 0,00
ROE 142 0,01 868 -0,11 -0,12 -1,29 9,20 H=NH -2,00 0,05 PROFITMARGIN 145 6,23 847 -0,86 -7,09 -3,57 0,00 H>NH -3,67 0,00

58
*** RETURNONSHAREHOLDER
SFUNDS 147 8,44 849 -7,43 -15,87 -3,04
0,00 ***
H>NH -3,19 0,00
RETURNONTOTALASSETS 148 5,61 910 -4,45 -10,07 -4,08 0,00
*** H>NH -4,34 0,00
EBITMARGIN 147 4,17 888 -7,42 -11,59 -2,79 0,01
*** H>NH -3,54 0,00
EBITDAMARGIN 147 10,47 886 2,71 -7,77 -2,32 0,02
** H>NH -3,08 0,00
GROSSMARGIN 131 46,20 771 48,37 2,17 0,98 0,33 H=NH 0,86 0,39 IC
EBITINP 120 64,45 697 -17,52 -81,98 -3,59 0,00
*** H>NH -5,79 0,00
EBITDAINP 120 121,0
8 697 12,78 -108,31 -3,86
0,00 ***
H>NH -6,19 0,00
INTERESTCOVERX 122 45,85 674 16,12 -29,72 -3,91 0,00
*** H>NH -4,95 0,00
ASSETCOVERX 65 89,51 503 73,31 -16,20 -0,78 0,44 H=NH -2,67 0,01 BERRYRATIO 131 1,21 768 1,12 -0,09 -1,26 0,21 H=NH -4,55 0,00 GROWTH
OPPORTUNITY
CAPEXPSALES 17 -0,03 261 -0,04 -0,02 -0,58 0,56 H=NH -0,58 0,56
MKTTBRAT 135 0,37 681 0,49 0,12 4,52 0,00
*** H<NH 4,54 0,00
DEBT MATURITY STBORROW 65 0,47 456 0,47 0,00 0,00 1,00 H=NH 0,10 0,92 LTBORROW 65 0,53 456 0,53 0,00 0,00 1,00 H=NH -0,10 0,92 FIRM SIZE
LNMKTCAP 135 3,07 680 2,48 -0,59 -4,35 0,00
*** H>NH -4,54 0,00
LNTOTSALES 142 10,14 858 9,32 -0,82 -9,20 0,00
*** H>NH -9,74 0,00
LNTOTASSETS 142 10,13 869 9,53 -0,60 -5,34 0,00
*** H>NH -6,88 0,00
FOREIGN
EXCHANGE
FOREIGNSALES 142 0,44 858 0,25 -0,19 -6,13 0,00
*** H>NH -5,23 0,00
Source: author’s elaboration – FAME database.
Tab. 14 - Mean difference test of IR hedgers vs non-IR hedgers (no bias).
This table presents the results from the Mean difference test and the Wilcoxon rank sum test. The tests are
performed on a rage of independent variables between IR derivatives users versus non-IR derivative users no
bias, where ***, ** and * indicate the significance at 1%, 5% and 10% respectively.
Variable
Hedgers Non-
Hedgers T-Stat Wilcoxon rank sum test
N Mean N Mean Diff T-stat Sig
n. H&NH Z Sign.
ZSC 132 0,73 563 0,99 0,26 2,26 0,02
** H<NH 4,01 0,00
DIVYIELD 90 3,37 242 3,66 0,30 0,87 0,38 H=NH 0,60 0,55 LEVERAGE
DEBTEQUITY 122 40,18 456 17,52 -22,66 -1,96 0,05
** H>NH -4,36 0,00
DEBTCAPITAL 122 0,28 456 0,31 0,03 0,37 0,71 H=NH -3,23 0,00
LTDEBTCAPITAL 135 0,25 515 0,19 -0,05 -1,68 0,09
* H>NH -5,69 0,00
LTDEBTEQUITY 135 0,48 515 0,26 -0,22 -3,19 0,00
*** H>NH -6,75 0,00
LIABASSETS 151 0,49 729 0,50 0,01 0,34 0,74 H=NH -0,99 0,32
GEARINGRAT 152 75,00 752 54,81 -20,19 -2,74 0,01
*** H>NH -6,70 0,00
BV 122 0,36 456 0,31 -0,05 -1,52 0,13 H=NH -3,86 0,00

59
MKTV 109 0,50 348 0,35 -0,15 -6,34 0,00
*** H>NH -6,00 0,00
LIQUIDITY CRAT 158 1,96 911 2,11 0,15 0,83 0,40 H=NH 3,71 0,00
QRAT 90 1,36 534 1,60 0,24 1,74 0,08
* H<NH 2,00 0,05
LIQUIDITYRATIOX 158 1,31 911 1,80 0,49 3,56 0,00
*** H<NH 5,14 0,00
SHAREHOLDERSLIQUIDITY
RATIOX 154 8,64 731 36,29 27,65 3,45
0,00 ***
H<NH 5,91 0,00
SOLVENCYRATIOASSETBA
SED 157 51,92 902 51,26 -0,66 -0,30 9,76 H=NH 1,36 0,18
PROFITABILITY ROC 158 1,13 903 -3,81 -4,94 -1,00 0,32 H=NH 0,09 0,93 ROE 154 -0,01 868 -0,11 -0,11 -1,23 0,22 H=NH 0,29 0,77
PROFITMARGIN 137 5,87 847 -0,86 -6,73 -3,15 0,00
*** H>NH -2,67 0,01
RETURNONSHAREHOLDER
SFUNDS 155 -1,03 849 -7,43 -6,40 -1,24 0,22 H=NH 0,18 0,86
RETURNONTOTALASSETS 158 0,90 910 -4,45 -5,36 -2,25 0,02
** H>NH -0,36 0,72
EBITMARGIN 153 11,41 888 -7,42 -18,83 -4,25 0,00
*** H>NH -5,44 0,00
EBITDAMARGIN 153 19,70 886 2,71 -16,99 -4,55 0,00
*** H>NH -6,04 0,00
GROSSMARGIN 123 46,95 771 48,37 1,42 0,62 0,54 H=NH 0,12 0,91 IC EBITINP 147 9,92 697 -17,52 -27,45 -1,37 0,17 H=NH -1,68 0,09 EBITDAINP 147 21,50 697 12,78 -8,72 -0,37 0,71 H=NH -0,45 0,66 INTERESTCOVERX 150 11,63 674 16,12 4,50 0,73 0,47 H=NH 0,11 0,91
ASSETCOVERX 138 16,90 503 73,31 56,41 4,23 0,00
*** H<NH 6,98 0,00
BERRYRATIO 123 1,22 768 1,12 -0,10 -1,14 0,25 H=NH -2,34 0,02 GROWTH
OPPORTUNITY
CAPEXPSALES 14 0,00 261 -0,04 -0,05 -1,36 0,18 H=NH 0,28 0,78 MKTTBRAT 137 0,49 681 0,49 0,00 -0,09 0,93 H=NH -1,59 0,11 DEBT MATURITY
STBORROW 122 0,30 456 0,47 0,17 5,80 0,00
*** H<NH 5,93 0,00
LTBORROW 122 0,70 456 0,53 -0,17 -5,80 0,00
*** H>NH -5,93 0,00
FIRM SIZE
LNMKTCAP 138 3,21 680 2,48 -0,74 -5,52 0,00
*** H>NH -6,09 0,00
LNTOTSALES 149 9,92 858 9,32 -0,60 -6,95 0,00
*** H>NH -6,82 0,00
LNTOTASSETS 154 10,80 869 9,53 -1,27 -11,34 0,00
*** H>NH
-10,68
0,00
FOREIGN
EXCHANGE
FOREIGNSALES 149 0,21 858 0,25 0,04 1,33 0,18 H=NH 1,47 0,14 Source: author’s elaboration – FAME database.
The next two tables show the differences in means between FX hedgers and
IR hedgers. They show that also in this scenario is verified what stated for FX and
IR hedgers no bias about the leverage and the Interest coverage proxies. So that
debt equity, debt capital and long term debt equity are the only three leverage
variables that are no significant – see table 15 that shows the results about FX
hedgers. And the firsts two of these variables are significant in the table 16
showing the results for the IR hedgers. Furthermore the significant variables as

60
interest coverage proxies still the same for IR and FX hedgers. That strengthens
what have been said before.
Tab. 15 - Mean difference test of FX hedgers vs non-FX hedgers (bias).
This table presents the results from the Mean difference test and the Wilcoxon rank sum test. The tests are
performed on a rage of independent variables between FX derivatives users versus non-FX derivative users,
where ***, ** and * indicate the significance at 1%, 5% and 10% respectively.
VARIABLE
Hedgers Non-
Hedgers T-Stat Wilcoxon rank sum test
N Mean N Mean Diff T-stat Sig
n. H&NH Z Sign.
ZSC 121 1,60 676 0,93 -0,68 -5,72 0,00
*** H>NH -6,04 0,00
DIVYIELD 76 3,28 318 3,64 0,36 1,03 0,30 H=NH 1,04 0,30 LEVERAGE DEBTEQUITY 65 19,19 562 22,93 3,73 0,26 0,80 H=NH 0,57 0,57 DEBTCAPITAL 65 0,24 562 0,31 0,07 0,62 0,53 H=NH 2,63 0,01
LTDEBTCAPITAL 67 0,12 635 0,20 0,08 2,02 0,04
** H<NH 3,23 0,00
LTDEBTEQUITY 67 0,21 635 0,30 0,09 0,96 0,34 H=NH 2,60 0,01
LIABASSETS 127 0,38 861 0,50 0,12 5,10 0,00
*** H<NH 5,38 0,00
GEARINGRAT 136 25,99 884 58,70 32,71 4,47 0,00
*** H<NH 5,23 0,00
BV 65 0,20 562 0,32 0,13 2,94 0,00
*** H<NH 3,25 0,00
MKTV 62 0,26 441 0,38 0,12 4,04 0,00
*** H<NH 3,92 0,00
LIQUIDITY
CRAT 148 2,66 104
9 2,10 -0,56 -3,12
0,00 ***
H>NH -5,56 0,00
QRAT 105 2,02 616 1,56 -0,46 -3,48 0,00
*** H>NH -4,50 0,00
LIQUIDITYRATIOX 148 2,20 104
9 1,74 -0,46 -3,25
0,00 ***
H>NH -4,31 0,00
SHAREHOLDERSLIQUIDITY
RATIOX 132 42,34 865 31,91 -10,43 -1,21 0,23 H=NH -5,37 0,00
SOLVENCYRATIOASSETBA
SED 148 62,54
1039
51,26 -11,28 -5,18 0,00
*** H>NH -5,34 0,00
PROFITABILITY
ROC 148 7,36 104
1 -3,58 -10,94 -2,25
0,02 **
H>NH -3,69 0,00
ROE 142 0,01 100
3 -0,10 -0,11 -1,25 0,21 H>NH -2,22 0,03
PROFITMARGIN 145 6,23 962 -0,09 -6,32 -3,14 0,00
*** H>NH -3,37 0,00
RETURNONSHAREHOLDER
SFUNDS 147 8,44 984 -7,20 -15,64 -3,09
0,00 ***
H>NH -3,45 0,00
RETURNONTOTALASSETS 148 5,61 104
8 -4,05 -9,66 -4,09
0,00 ***
H>NH -4,56 0,00
EBITMARGIN 147 4,17 102
1 -5,40 -9,57 -2,18
0,03 **
H>NH -2,81 0,01
EBITDAMARGIN 147 10,47 101
9 4,78 -5,70 -1,55 0,12 H=NH -2,26 0,02
GROSSMARGIN 131 46,20 880 47,96 1,76 0,80 0,42 H=NH 0,73 0,47 IC
EBITINP 120 64,45 824 -15,14 -79,60 -3,78 0,00
*** H>NH -5,93 0,00
EBITDAINP 120 121,0
8 824 12,23 -108,86 -4,21
0,00 ***
H>NH -6,56 0,00
INTERESTCOVERX 122 45,85 803 14,06 -31,78 -4,54 0,00 H>NH -5,35 0,00

61
*** ASSETCOVERX 65 89,51 625 62,04 -27,46 -1,44 0,15 H=NH -3,79 0,00 BERRYRATIO 131 1,21 877 1,13 -0,08 -1,10 0,27 H=NH -4,25 0,00 GROWTH
OPPORTUNITY
CAPEXPSALES 17 -0,03 276 -0,04 -0,01 -0,42 0,67 H=NH -0,58 0,56
MKTTBRAT 135 0,37 799 0,49 0,12 4,74 0,00
*** H<NH 5,03 0,00
DEBT MATURITY STBORROW 65 0,47 562 0,44 -0,03 -0,85 0,40 H=NH -0,76 0,45 LTBORROW 65 0,53 562 0,56 0,03 0,85 0,40 H=NH 0,76 0,45 FIRM SIZE
LNMKTCAP 135 3,07 799 2,58 -0,49 -3,62 0,00
*** H>NH -3,72 0,00
LNTOTSALES 142 10,14 988 9,39 -0,75 -8,56 0,00
*** H>NH -9,31 0,00
LNTOTASSETS 142 10,13 100
4 9,70 -0,43 -3,62
0,00 ***
H>NH -5,37 0,00
FOREIGN
EXCHANGE
FOREIGNSALES 142 0,44 988 0,24 -0,20 -6,59 0,00
*** H>NH -5,63 0,00
Source: author’s elaboration – FAME database.
Tab. 16 - Mean difference test of IR hedgers vs non-IR hedgers (bias).
This table presents the results from the Mean difference test and the Wilcoxon rank sum test. The tests are
performed on a rage of independent variables between IR derivatives users versus non-IR derivative users,
where ***, ** and * indicate the significance at 1%, 5% and 10%respectively.
Variable
Hedgers Non-
Hedgers T-Stat Wilcoxon rank sum test
N Mean N Mean Diff T-stat Sig
n. H&NH Z Sign.
ZSC 132 0,73 665 1,09 0,36 3,12 0,00
*** H<NH 5,14 0,00
DIVYIELD 90 3,37 304 3,63 0,26 0,80 0,43 H=NH 0,55 0,58 LEVERAGE
DEBTEQUITY 122 40,18 505 18,28 -21,90 -1,96 0,05
** H>NH -4,43 0,00
DEBTCAPITAL 122 0,28 505 0,30 0,02 0,28 0,78 H=NH -3,74 0,00
LTDEBTCAPITAL 135 0,25 567 0,18 -0,06 -2,03 0,04
** H>NH -6,29 0,00
LTDEBTEQUITY 135 0,48 567 0,25 -0,23 -3,34 0,00
*** H>NH -7,27 0,00
LIABASSETS 151 0,49 837 0,48 -0,01 -0,41 0,68 H=NH -1,94 0,05
GEARINGRAT 152 75,00 868 50,72 -24,28 -3,46 0,00
*** H>NH -7,55 0,00
BV 122 0,36 505 0,30 -0,06 -1,97 0,05
** H>NH -4,46 0,00
MKTV 109 0,50 394 0,33 -0,17 -7,06 0,00
*** H>NH -6,67 0,00
LIQUIDITY
CRAT 158 1,96 103
9 2,20 0,24 1,39 0,17 H<NH 4,51 0,00
QRAT 90 1,36 631 1,67 0,31 2,19 0,03
** H<NH 2,60 0,01
LIQUIDITYRATIOX 158 1,31 103
9 1,87 0,56 4,04
0,00 ***
H<NH 5,82 0,00
SHAREHOLDERSLIQUIDITY
RATIOX 154 8,64 843 37,80 29,16 3,62
0,00 ***
H<NH 6,81 0,00
SOLVENCYRATIOASSETBA
SED 157 51,92
1030
52,78 0,86 0,40 0,69 H=NH 2,24 0,03
PROFITABILITY
ROC 158 1,13 103
1 -2,73 -3,86 -0,82 0,41 H=NH 0,66 0,51

62
ROE 154 -0,01 991 -0,10 -0,10 -1,15 0,25 H=NH 0,61 0,54
PROFITMARGIN 137 5.87 970 0.01 -5.86 -2.84 0.00
*** H>NH -2.32 0.02
RETURNONSHAREHOLDER
SFUNDS 155 -1,03 976 -5,82 -4,79 -0,96 0,34 H=NH 0,67 0,50
RETURNONTOTALASSETS 158 0,90 103
8 -3,43 -4,33 -1,88
0,06 *
H<NH 0,29 0,77
EBITMARGIN 153 11,41 101
5 -6,55 -17,96 -4,18
0,00 ***
H>NH -5,27 0,00
EBITDAMARGIN 153 19,70 101
3 3,35 -16,35 -4,57
0,00 ***
H>NH -5,95 0,00
GROSSMARGIN 123 46,95 888 47,84 0,89 0,39 0,70 H=NH -0,15 0,88 IC EBITINP 147 9,92 797 -7,78 -17,70 -0,91 0,36 H=NH -0,69 0,49 EBITDAINP 147 21,50 797 26,91 5,41 0,23 0,82 H=NH 0,65 0,51 INTERESTCOVERX 150 11,63 775 19,54 7,91 1,22 0,22 H=NH 1,02 0,31
ASSETCOVERX 138 16,90 552 76,56 59,66 4,35 0,00
*** H<NH 7,56 0,00
BERRYRATIO 123 1,22 885 1,13 -0,09 -1,11 0,26 H=NH -1,91 0,01 GROWTH
OPPORTUNITY
CAPEXPSALES 14 0,00 279 -0,04 -0,04 -1,27 0,20 H=NH 0,35 0,73 MKTTBRAT 137 0,49 797 0,47 -0,02 -0,83 0,41 H=NH -2,53 0,01 DEBT MATURITY
STBORROW 122 0,30 505 0,48 0,18 5,98 0,00
*** H<NH 6,11 0,00
LTBORROW 122 0,70 505 0,52 -0,18 -5,98 0,00
*** H>NH -6,11 0,00
FIRM SIZE
LNMKTCAP 138 3,21 796 2,55 -0,67 -4,98 0,00
*** H>NH -5,67 0,00
LNTOTSALES 149 9,92 981 9,41 -0,51 -5,81 0,00
*** H>NH -5,58 0,00
LNTOTASSETS 154 10,80 992 9,59 -1,21 -11,02 0,00
*** H>NH
-10,25
0,00
FOREIGN
EXCHANGE
FOREIGNSALES 149 0,21 981 0,27 0,06 2,06 0,04
** H<NH 2,05 0,04
Source: author’s elaboration – FAME database.
Summary Mean difference test and Wilcoxon rank sum test
What can be concluded is that companies using derivatives are those with an
higher level of leverage and that can be explained by the fact that higher
leveraged firms – enterprises with more debt and thus higher level of interest rate
exposure – would be more concerned about the interest changes on loans than
lower leveraged firms. And that is shown in table 12 by the fact that three out of
four significant leverage variables are higher for hedgers and in table 14 and 16
where all the five significant variables are higher for IR hedgers. And the debt
maturity proxies in the same tables shows that firms facing long term borrowing
are more likely to use hedge instruments as derivatives. But at the same time the
use of FX derivative can be justified by the fact that in tables 12, 13 and 15 the
foreign sales variable is significant and higher for hedgers.

63
5.2.1: Univariate logit regression: UK non-financial listed SMEs
With the mean difference test and the rank sum test have been examined the
different features between hedgers and non-hedgers. In this paragraph are going
to be presented the results of univariate logit tests run with all the variables
examined in the previous part. By doing this is get an estimated idea of the effect
of every individual variable in the decision of hedging, so can choose with more
confidence the most significant variables to run multivariate logit regression and
construct the best model to explain the determinants of hedging. The same test
has been run to check the effect of every variable on users of derivatives, users of
FX derivatives and users of IR derivatives without bias.
The leverage measure for hedgers and IR hedgers is market value leverage
because it is significant and it has a positive coefficient. The FX hedgers has
liability assets as most significant variable but have to be taken into account that it
has a negative coefficient. These results are consistent with the one shown in
tables 12, 13 and 14 where those proxies are higher for hedgers and IR hedgers.
Liquidity variables present different results for different groups. For users and
FX derivative users the significant liquidity ratio is solvency ratio asset based, but it
has a positive coefficient that is in contrast with what the literature says. That it is
also shown in tables 12 and 13. For the IR derivative users the liquidity ratio is
significant and have a negative coefficient so a negative influence in the hedging
decision and it agrees with what stated in table 14.
Profitability variable for FX derivative users is ROA, for IR derivative users is
EBITDA Margin and for Users is Profit Margin. All of these variables have a
positive coefficient as stated by the literature. Furthermore this positive
relationship is verified also by the mean difference test tables 12, 13 and 14.
Interest coverage the most significant variable for Users is EBIT interest
payment but it has a wrong coefficient, thus at the same time as IC measure with a
negative coefficient there is Asset coverage ratio. About the FX derivatives users,
Interest coverage ratio represents the most significant variable but with a negative
coefficient. IR Users as significant variable Asset coverage ratio that has a
negative coefficient as expected. In fact also in the previous tests have been
shown that what the literature says is not verified by our data.
About the firm growth in the group of derivative users and FX derivative users
the variable with more relevance is mark to book ratio and has negative coefficient
as not predicted. But for IR derivative users there is no firm growth significant

64
variables. Also through the mean difference test there is a negative relationship
between growth opportunity and hedging that could be explained by the fact that
the sample is composed by SMEs and could be that those companies do not
intends to use derivatives to hedge growth opportunity, could be that they use
other tools.
Debt maturity variable for users and IR derivative users is the long term debt
(ltborrow) and it is the most significant debt maturity variable and as the literature
says and the previous test shown there is a positive relationship. For FX derivative
users there is no debt maturity significant variables. That agrees with what have
been shown in the mean difference test.
To capture the effect of the firm size the natural log of total sales is the variable
with more relevance for users and FX derivative user. IR derivative users have
natural log of total assets as significant variable to be explain that. In all of these
cases the previous results confirms what have been just stated.
To measure the risk of default and dividend yield we have used the z-score
and dividend yield respectively because they are the only variables available in
their respective categories, although dividend yield is not significant when it is
anlaysed in all of the groups and the z-score is statistically significant in the group
of IR and FX users but in the FX users its coefficient is positive instead of
negative.

65
Tab. 17 - Univariate Logit of hedgers.
This table presents the results from univariate logit regression using a binary variable equal to 1 if firms use
derivatives and 0 if otherwise. The table presents the number of observations, coefficients, robust standard
errors, z-statistics, p-values and Wald chi-square statistics. ***, ** and * indicate the significance at 1%, 5%
and 10% respectively.
Variables N Coeff
Robust
std.errors Z-stat
p-
value chi2
Zsc 797 0,097 0,062 1,58 0,11 2,50
Divyield 394 -0,033 0,038 -0,85 0,39 0,73
LEVERAGE
debtequity 627 -1,018 ** 0,001 2,26 0,02 5,12
debtcapital 627 -0,061 0,088 -0,69 0,49 0,47 ltdebtcapital 702 0,109 0,236 0,46 0,64 0,21 ltdebtequity 702 0,266 *** 0,105 2,54 0,01 6,43
liabassets 988 -0,970 *** 0,284 -3,41 0,00 11,62 gearingrat 1020 0,000 0,001 -0,23 0,81 0,06 Bv 627 -0,005 0,243 -0,02 0,98 0,00
Mktv 503 1,378 *** 0,424 3,25 0,00 10,57
LIQUIDITY
Crat 1197 0,057 * 0,303 1,87 0,06 3,50 Qrat 721 0,067 0,065 1,03 0,30 1,06
liquidityratiox 1197 -0,005 0,042 -0,11 0,91 0,01 shareholdersliquidityratiox
997 -0,002 * 0,001 -1,64 0,10 2,69
solvencyratioassetbased
1187 0,010 *** 0,003 3,83 0,00 14,68
PROFITABILITY
Roc 1189 0,002 ** 0,001 2,37 0,02 5,63
Roe 1145 0,117 * 0,064 1,83 0,07 3,34 profitmargin 1107 0,153 *** 0,003 4,39 0,00 19,30 returnonsharehol
dersfunds 1131 0,003 *** 0,001 2,55 0,01 6,49
Returnontotalassets
1196 0,133 *** 0,003 4,10 0,00 16,78
ebitmargin 1168 0,008 *** 0,002 2,74 0,01 7,51 ebitdamargin 1166 0,008 *** 0,003 3,25 0,00 10,57 grossmargin 1011 -0,005 0,003 -1,48 0,14 2,19
IC
Ebitinp 944 0,001 *** 0,000 3,30 0,00 10,90 ebitdainp 944 0,001 *** 0,000 2,65 0,01 7,02 interestcoverx 925 0,001 0,009 1,47 0,14 2,17
assetcoverx 690 -0,002 ** 0,001 -2,04 0,04 4,16 berryratio 1008 0,102 0,084 1,21 0,23 1,47
GROWTH OP. capexpsales 293 3,281 ** 1,477 2,22 0,03 4,93
mkttbrat 934 -0,828 *** 0,282 -2,93 0,00 8,60
DEBT MATURITY stborrow 627 -1,199 *** 0,328 -3,66 0,00 13,38
ltborrow 627 1,198 *** 0,328 3,66 0,00 13,37
FIRM SIZE lnmktcap 934 0,303 *** 0,055 5,47 0,00 29,90 lntotsales 1130 0,799 *** 0,084 9,54 0,00 91,01
lntotassets 1146 0,557 *** 0,059 9,51 0,00 90,42
FOREIGN
EXPOSURE foreignsales 1130 0,550 *** 0,202 2,72 0,01 7,42
Source: author’s elaboration – FAME database.

66
Tab. 18 - Univariate Logit of IR (bias).
This table presents the results from univariate logit regression using a binary variable equal to 1 if firms hedge
with IR derivatives and 0 if otherwise. The table presents the number of observations, coefficients, robust
standard errors, z-statistics, p-values and Wald chi-square statistics. ***, ** and * indicate the significance at
1%, 5% and 10% respectively.
Variables N Coeff
Robust
std.errors Z-stat
p-
value chi2
Zsc 797 -0,222 *** 0,060 -3,68 0,00 13,52
Divyield 394 -0,037 0,045 -0,82 0,41 0,67
LEVERAGE
debtequity 627 0,001 * 0,001 1,84 0,07 3,40
debtcapital 627 -0,032 0,110 -0,29 0,77 0,08 ltdebtcapital 702 0,589 ** 0,288 2,05 0,04 4,19 ltdebtequity 702 0,402 *** 0,114 3,52 0,00 12,41
liabassets 988 0,139 0,274 0,51 0,61 0,26 gearingrat 1020 0,003 *** 0,001 3,90 0,00 15,19 Bv 627 0,532 ** 0,232 2,29 0,02 5,25
Mktv 503 3,301 *** 0,465 7,10 0,00 50,37
LIQUIDITY
Crat 1197 -0,067 0,070 -0,96 0,34 0,92 Qrat 721 -0,243 ** 0,120 -2,03 0,04 4,13
liquidityratiox 1197 -0,344 *** 0,116 -2,97 0,00 8,80 shareholdersliquidityratiox
997 -0,019 0,013 -1,49 0,14 2,23
solvencyratioassetbased
1187 -0,001 0,003 -0,52 0,60 0,28
PROFITABILITY
Roc 1189 0,001 0,001 1,22 0,22 1,49
Roe 1145 0,119 * 0,064 1,86 0,06 3,47 profitmargin 1107 0,012 *** 0,005 2,52 0,01 6,34 returnonsharehol
dersfunds 1131 0,002 0,001 1,17 0,24 1,37
returnontotalassets
1196 0,007 *** 0,003 2,70 0,01 7,28
ebitmargin 1168 0,012 *** 0,005 2,60 0,01 6,77 ebitdamargin 1166 0,012 *** 0,004 3,19 0,00 10,19 grossmargin 1011 -0,002 0,004 -0,41 0,68 0,17
IC
Ebitinp 944 0,000 0,000 1,50 0,14 2,24 ebitdainp 944 0,000 0,000 -0,41 0,68 0,17 interestcoverx 925 -0,002 0,002 -1,21 0,23 1,46
assetcoverx 690 -0,011 ** 0,005 -2,27 0,02 5,15 berryratio 1008 0,115 0,120 0,96 0,34 0,92
GROWTH OP. capexpsales 293 3,916 2,153 1,35 0,18 1,83
mkttbrat 934 0,270 0,266 1,02 0,31 1,03
DEBT MATURITY stborrow 627 -2,226 *** 0,418 -5,33 0,00 28,40
ltborrow 627 2,226 *** 0,418 5,33 0,00 28,40
FIRM SIZE lnmktcap 934 0,316 *** 0,067 4,74 0,00 22,46 lntotsales 1130 0,557 *** 0,081 6,88 0,00 47,40
lntotassets 1146 0,695 *** 0,070 9,94 0,00 98,71
FOREIGN
EXPOSURE foreignsales 1130 -0,583 ** 0,271 -2,15 0,03 4,62
Source: author’s elaboration – FAME database.

67
Tab. 19 - Univariate Logit of FX (bias).
This table presents the results from univariate logit regression using a binary variable equal to 1 if firms hedge
with FX derivatives and 0 if otherwise. The table presents the number of observations, coefficients, robust
standard errors, z-statistics, p-values and Wald chi-square statistics. ***, ** and * indicate the significance at
1%, 5% and 10% respectively.
Variables N Coeff
Robust
std.errors Z-stat
p-
value chi2
Zsc 797 0,586 *** 0,098 5,93 0,00 35,15
Divyield 394 0,052 0,052 -0,99 0,32 0,98
LEVERAGE
debtequity 627 0,000 0,001 -0,40 0,69 0,16
debtcapital 627 -0,085 0,065 -1,32 0,19 1,75 ltdebtcapital 702 -0,805 *** 0,271 -2,97 0,00 8,83 ltdebtequity 702 -0,183 0,158 -1,16 0,25 1,33
liabassets 988 -2,542 *** 0,462 -5,50 0,00 30,24 gearingrat 1020 -0,012 *** 0,004 -3,49 0,00 12,15 Bv 627 -2,067 *** 0,656 -3,15 0,00 9,91
Mktv 503 -2,677 *** 0,614 -4,36 0,00 19,03
LIQUIDITY
Crat 1197 0,105 *** 0,029 3,59 0,00 12,89 Qrat 721 0,247 *** 0,067 3,67 0,00 13,48
liquidityratiox 1197 0,141 *** 0,040 3,49 0,00 12,17 shareholdersliquidityratiox
997 0,001 0,001 1,33 0,18 1,76
solvencyratioassetbased
1187 0,024 *** 0,004 5,77 0,00 33,28
PROFITABILITY
Roc 1189 0,004 *** 0,001 3,45 0,00 11,92
Roe 1145 0,137 0,093 1,48 0,14 2,19 profitmargin 1107 0,014 *** 0,003 3,86 0,00 14,93 returnonsharehol
dersfunds 1131 0,008 *** 0,002 3,81 0,00 14,50
returnontotalassets
1196 0,025 *** 0,006 4,21 0,00 17,73
ebitmargin 1168 0,005 *** 0,002 3,15 0,00 9,92
ebitdamargin 1166 0,004 *** 0,001 2,75 0,01 7,55
grossmargin 1011 -0,003 0,004 -0,88 0,38 0,77
IC
Ebitinp 944 0,002 *** 0,000 4,03 0,00 16,28 ebitdainp 944 0,001 *** 0,000 3,90 0,00 15,17
interestcoverx 925 0,004 *** 0,001 4,13 0,00 17,07 assetcoverx 690 0,001 0,001 1,49 0,14 2,23 berryratio 1008 0,111 * 0,061 1,82 0,07 3,32
GROWTH OP. capexpsales 293 0,888 0,832 1,07 0,29 1,14 mkttbrat 934 -2,314 *** 0,442 -5,24 0,00 27,42
DEBT MATURITY stborrow 627 0,359 0,437 0,82 0,41 0,67
ltborrow 627 -0,359 0,437 -0,82 0,41 0,67
FIRM SIZE lnmktcap 934 0,231 *** 0,065 3,57 0,00 12,75
lntotsales 1130 0,884 *** 0,107 8,25 0,00 68,14 lntotassets 1146 0,237 *** 0,053 4,50 0,00 20,24
FOREIGN
EXPOSURE foreignsales 1130 1,514 *** 0,242 6,27 0,00 39,28
Source: author’s elaboration – FAME database.
In the table below have been summarized in order by significance, all the
significant independent variables for each dependent binary variable. To build up
the multivariate regression for each proxy have been taken into account the
independent variables that the dependent variables have in common and at the
same time whose who have the high number of observations.26
26
The data sample consists of 1328 firm-year observations.

68
Tab. 20 - Summary independent variables for multivariate model.
HEDGERS No. Obs. IR No. Obs. FX No. Obs.
Z-Score 797 Z-Score 797 Leverage Liability Assets 988 Market Value 503 Liability Assets 988 Market Value 503 Gearing Ratio 1020 Market Value 503 Long Term Debt Equity
702 Long Term Debt Equity
702 Gearing Ratio 1020
Debt Equity 627 Book Value Leverage
627 Book Value Leverage
627
Long Term Debt Capital
702 Long Term Debt Capital
702
Liquidity Solvency Ratio Asset Based
1187 Debt Equity 627 Solvency Ratio Asset Based
1187
Currency Ratio 1197 Liquidity Ratio 1197 Quick Ratio 721 Shareholders Liquidity Ratio
997 Quick Ratio 721 Currency Ratio 1197
Liquidity Ratio
Profitability Profit Margin 1107 EBITDA Margin 1166 ROA 1196 ROA 1196 ROA 1196 Profit Margin 1107 EBITDA Margin 1166 EBIT Margin 1168 Return on
Shareholders Funds
1131
EBIT Margin 1168 Profit Margin 1107 ROC 1189 Return on Shareholders’ Funds
1131 ROE 1145
ROC 1189 ROE 1145
Interest Coverage EBIT Interest Payment
944 Asset Coverage 690 Interest Cover 925
EBITDA Interest Payment
944 EBIT Interest Payment
944
Asset Coverage Ratio
690 EBITDA Interest Payment
944
Berry Ratio 1008
Growth Opportunities Market To Book Ratio
934 Market To Book Ratio
934
Capital Expenditure
293
Debt Maturity Long Term Borrow 627 Long Term Borrow 627 Short Term Borrow 627 Short Term Borrow 627
Firm Size Ln Total Sales 1130 Ln Total Assets 1146 Ln Total Sales 1130 Ln Total Assets 1146 Ln Total Sales 1130 Ln Total Assets 1146 Ln Market Capitalization
934 Ln Market Capitalization
934 Ln Market Capitalization
934
Foreign Exposure Foreign Sales 1130 Foreign Sales 1130 Foreign Sales 1130 Source: author’s elaboration.

69
5.2.2: Multivariate logit regression: UK non-financial listed SMEs
To run the Multivariate logit regression have been used the following
independent variables:
Tab. 21 - Summary independent variables and relative literature.
Independent Variables Literature
Z-SCORE Altman (1968)
Leverage
Market Value Stulz (1996) Leland (1998)
Liquidity
Solvency Ratio Asset Based Froot (1993)
Currency Ratio
Quick Ratio
Profitability
Profit Margin Glaum (2002) Bartram et al. (2009)
ROA
Return on Shareholders’ Funds
ROC
ROE
Interest Coverage
EBIT Interest Payment Geczy (1997) Judge (2006)
Bartrmam et al. (2009)
Asset Coverage
Growth Opportunities
Market To Book Ratio Myers (1977) Bressembinder (1991)
Froot et al. (1993)
Debt Maturity
Long Term Borrow Stulz (1996) Leland (1998)
Short Term Borrow
Firm Size
Ln Total Sales Graham and Rodgers (2002) Judge (2006)
Campello et al. (2011) Ln Total Assets
Foreign Exposure
Foreign Sales Smith and Stulz (1985) Allayannis and Ofek (2001)
Source: author’s elaboration.

70
Univariate tests have given an indication of the relationship between
hedging and the different firm characteristics. However, these tests tend to be
weak since the interaction between different independent variables is not taken
into account. The table below presents the results from a cluster-specific logit
regression between the probability of hedging and several independent variables.
The results in model 1-7 suggest that firm size and hedging substitute ratios are
the most significant variables to determine the probability of hedging. The first
showing a positive relationship between the use of derivatives and the firm’s
dimension. In the other hand, hedging substitute measure highlight that small and
medium enterprises which use hedging substitute are less likely to hedge by
derivatives instruments.
Foreign sale has been used as a proxy for foreign exposure. It has a
positive coefficient in six out of seven of the models studied but at the same time
in four out of seven is not significant. The positive coefficients support what have
been said by Smith and Stulz (1985). Their idea was that firms with more foreign
exposure are more likely to hedge. Allayannis and Ofek (2001) with their findings
suggested that the foreign sales is the most significant factor in explaining the use
of derivatives.
Leverage and debt maturity. The variables that have been used (market
value leverage and long term borrow) show that there is a positive relationship
with the probability of hedging. That is consistent with what Stulz (1996) and
Leland (1998) demonstrated, that is the existence of a strong relation between
debt and hedging. They showed how companies hedging reduce the likelihood of
bankruptcy and therefore are able to increase their level of debt. In fact market
value of leverage has the greatest elasticity and odds value. In model 3 an
increase of 1% in leverage would argument the probability of hedging by 23.44%
and the odds of using derivative for companies with greater leverage is 3.18 times
higher than for companies with low leverage ratios.
Solvency ratio assets based has been used as liquidity variable and as
predicted has a negative impact in hedging probability and that is consistent with
Froot et al. (1993). They predicted a negative association between liquidity and
hedging.
The Interest Coverage proxies used have been EBIT Interest Payments and
Asset coverage ratio, these variables are all significant but EBIT Interest Payment

71
has a positive coefficient instead of negative as the theories of Froot et al. (1993)
say. For them the volatility seems to have opposite effects. They affirmed that
hedging reduces cash flow volatility leading to better rates for financing, therefore
those companies with higher rates of volatility are more likely to use derivatives in
order to reduce the financial risk and get an easier and better conditions access
for funding.
The profitability variables that have been employed to measure the
relationship with the probability of hedging are profit margin and the return on total
assets. These two variables have a positive coefficient and are significant. Bartram
et al. (2009) argue that firms having a lower probability of financial distress are
less likely to hedge. Glaum (2002) argues that firms with high profitability will
enable managers to conduct a more selective hedging strategy to take bets in the
financial markets, thus there should be a positive relationship between hedging
and profitability.
After analyzing all variables can be concluded that the decision of using
derivatives as hedging instruments is closely related to factors determining the
liquidity costs, the firm size and the overseas operations, the variables of these
proxies are significant in almost all the models.
The market to book ratio has been used as a proxy of underinvestment
costs. It is significant in all the seven models but at the same time it has a negative
coefficient instead of positive. The literature says that is expected that companies
with more growth opportunities are more likely to hedge in order to protect
investments and get a constant flow of financing avoiding unexpected
disturbances, Froot et al. (1993).
The last two tables show the results for models having as dependent
variable the probability of using FX and IR derivative respectively.
The Table 25 shows the relationship between the probability that a firm
hedges with IR derivatives and proxies for incentives to hedge. The market value
leverage and short and long term borrow are important factor in determining
whether to hedge with IR derivatives. The most important factor as financial
distress proxies is leverage, and also it is the one who is ranked as the most
important variable when comparing the marginal effect across models, which gives
strong support to the notion that firms’ with more exposure to interest rate changes
are more likely to hedge. According to Bessembinder (1991) and Myers (1977),
the significantly positive effect of leverage on the likelihood of hedging is

72
consistent with the notion that asymmetric information can lead to
underinvestment when leverage is high, resulting in increased agency costs which
creates incentives for firms to hedge.
Scale economies also create benefits for small and medium firms to hedge,
which is indicated by the positive relationship between firm size and IR hedging.
The last table suggests that FX exposure resulting from foreign operating
revenues is an important factor in determining whether firm hedges FX risks. This
support the argument that firms with more volatile income resulting from changes
in the exchange rate are more likely to hedge with FX derivatives, which is
supported by the findings in the multivariate logit regression. As for the hedgers,
there is a positive link between firm size and probability of hedging and that
supports scale economies hypothesis. The liquidity ratios are negative related to
hedge with FX derivatives, which is consistent with the notion that firms can invest
in more liquid and less risky assets and thus reduce the probability of financial
distress.
With the multivariate analysis have been tried to identify a model with all the
most significant variables. Hence, have been started creating the model with the
most significant variables and then based on trial and error method adding other
variables have been tried to find those that are meaningful to create the model
with the largest number of explanatory variables which reflects the best possible
decision of hedging. At the end have been obtained a model composed of six
independent variables statistically significant: ROA, market to book ratio, foreign
sales, natural log of total assets and solvency ratio asset based – Model 5.
As might be expected when this model has been applied to specific cases
as the probability of using foreign exchange derivatives or interest rate derivatives
have been found that some variables are no longer significant. For IR Hedgers
those variables are: ROA and market to book ratio. Whilst for FX Hedgers all these
variables are significant.
Looking into the summary statistics of each table is possible to demonstrate
why model 5 has been choose as the best model. Taking into account the
summary table related to the probability of hedging (Use) model 5 has the highest
number of observation (914) and correctly predicted the 75.00% of the derivatives
users and the 59.76% of the no derivatives users. Thus the 36.11 % of the sample
are misclassified cases. But the same model at the same time when predicts the
probability of hedging by IR its correctly predicted only the 35.90% would use

73
derivatives and the 89.49% would not use those instruments. So the 18.48% of the
sample are misclassified cases. For the probability of hedging instruments by FX
the 18.87% of the sample are misclassified cases so the 45.45% would use
derivatives and 87.54% would not use derivatives. In both the probability tables of
Use and FX Hedgers the chi square is high, respectively 102.33% for Use and
98.82% for FX Hedgers but for IR hedgers the chi square is 55.05%.
Is interesting focusing on the numbers of users and non-users displayed in
table 25 and 26. The table 25 shows the probability of hedging by IR derivative
and the data show that over 78 observation as users only 28 are classified as
users IR derivatives and at the same time there are 50 misclassified non
derivatives users, so that could be explained in two ways the first is that the 47
misclassified IR users could be FX users or otherwise they should not be users. In
all the seven model the sensitivity is very lower for IR derivative users compared
with the one in table of the FX hedging. But at the same time the sensitivity is
higher in table 24. About the misclassification for the Probability of hedging by FX
derivatives presents a similar situation with the one presented by the IR
derivatives users so could justify the misclassification.

74
Tab. 24 - Logit Regression on the probability of hedging (Use).
This table presents logit regression estimates of the relation between the probability that a firm hedge as proxies for incentives to hedge (Panel A). the dependent variable
equals 1 if a firm provides qualitative information of any derivative use in the annual report, an 0 if otherwise. The model presents log of odds coefficients (Coef.), marginal
effects (ME), odds ratios and the respective p-values in parenthesis. The estimated coefficients give the change in the logit function given a change in the independent
variable. The marginal effect (elasticities) measures the actual change (percentage change) in the probability of hedging for 1% increase in the independent variable. The
higher the elasticity’ value more important is the variable in the model. The odds ratio gives the likelihood of Y = 1 when X is increased by one unit. The p-values are
calculated using the robust (heteroscedastic) standard errors. ***, ** and * indicate the significance at 1%, 5% and 10% respectively.
Indep.
Variables
MOD.1 MOD.2 MOD.3 MOD.4 MOD.5 MOD.6 MOD.7
Coeff. ME Odds Coeff. ME Odds Coeff. ME Odds Coeff. ME Odds Coeff. ME Odds Coeff. ME Odds Coeff. ME Odds
EBIT INT PAYMENT
0.002
(0.003)
***
0.000
(0.002)
***
1.002
(0.003)
***
ASSETCOVERX
-
0.001
(0.292)
-
0.000
(0.291)
0.999
(0.292)
MKTV
1.156
(0.017)
**
0.234
(0.017)
**
3.176
(0.017)
**
PROFIT MARGIN
0.008
(0.069)
*
0.001
(0.068)
*
1.008
(0.069)
*
ROA
0.010
(0.057)
*
0.002
(0.053)
*
0.010
(0.057)
*
ST BORROW
-
0.996
(0.007)
***
-
0.201
(0.006)
***
0.370
(0.007)
***
LT BORROW
0.995
(0.007)
***
0.201
(0.006)
***
2.706
(0.007)
***
MKTTBRAT
-
73.587
(0.007)
***
-
14.136
(0.005)
***
0.000
(0.007)
***
-
77.580
(0.017)
**
-
15.841
(0.016)
**
0.000
(0.017)
**
-
75.952
(0.025)
**
-
15.407
(0.023)
**
0.000
(0.025)
**
-
80.844(
0.002)
***
-
14.106
(0.001)
***
0.000
(0.002)
***
-
67.703
(0.007)
***
-
12.138
(0.005)
***
-
67.703
(0.007)
***
-
78.911
(0.019)
**
-
15.970
(0.018)
**
0.000
(0.019)
**
-
78.916
(0.019)
**
-
15.971
(0.018)
**
0.000
(0.019)
**
FOREIGN SALES
0.251
(0.299)
*
0.048
(0.299)
*
1.285
(0.299)
*
0.014
(0.962)
*
0.003
(0.962)
*
1.014
(0.962)
*
-
0.101
(0.737)
-
0.020
(0.737)
0.904
(0.737)
0.278
(0.237)
0.048
(0.237)
1.320
(0.237)
0.469
(0.034)
**
0.084
(0.034)
**
0.469
(0.034)
**
0.020
(0.948)
0.004
(0.948)
1.020
(0.948)
0.020
(0.948)
0.004
(0.948)
1.020
(0.948)
LN SALES
0.679
(0.000)
***
0.138
(0.000)
***
1.971
(0.000)
***
0.730
(0.000)
***
0.127
(0.000)
***
2.075
(0.000)
***
0.649
(0.000)
***
0.131
(0.000)
***
1.913
(0.000)
***
-0.786
(0.020)
**
-0.159
(0.018)
**
0.456
(0.020)
**

75
LN ASSETS
0.462
(0.000)
***
0.089
(0.000)
***
1.589
(0.000)
***
0.464
(0.000)
***
0.095
(0.000)
***
1.590
(0.000)
***
0.515
(0.000)
***
0.092
(0.000)
***
0.515
(0.000)
***
Q-RATIO
SOLVENCY RATIO
-
0.727
(0.008)
***
-
0.139
(0.006)
***
0,483
(0.008)
***
-
0.774
(0.017)
**
-
0.158
(0.016)
**
0.461
(0.017)
**
-
0.752
(0.026)
**
-
0.153
(0.025)
**
0.471
(0.026)
**
-
0.795
(0.002)
***
-
0.139
(0.001)
***
0.451
(0.002)
***
-
0.672
(0.007)
***
-
0.121
(0.006)
***
0.672
(0.015)
**
-
0.786
(0.020)
**
-
0.159
(0.018)
**
0.456
(0.020)
**
-
0.786
(0.020)
**
-
0.159
(0.018)
**
0.456
(0.020)
**
Z-SCORE
_cons
67.568
(0.013)
**
2,2e+2
9
(0.013)
**
72.003
(0.026)
**
1,9e+3
1
(0.026)
**
67.800
(0.045)
**
2.8e+2
9
(0.045)
**
71.933
(0.006)
***
1.7e+3
1
(0.006)
***
61.180
(0.015)
**
61.180
(0.015)
**
72.063
(0.033)
**
2e+31
(0.033)
**
71.020
(0.035)
**
7.4e+30
(0.035)
**
Source: author’s elaboration – FAME database.
Summary Statistic for Logit Regression.
Statistics MOD.1 MOD.2 MOD.3 MOD.4 MOD.5 MOD.6 MOD.7
N. 752 532 498 860 914 498 498
No. of Users 224 163 153 229 248 153 153
Classified as Users 182 132 127 173 186 122 122
Classified as Non-
Users 42 31 26 56 62 31 31
Sensitivity 81.25% 80.98% 83.01% 75.55% 75.00% 79.74% 79.74%
No. of Non-Users 528 369 345 631 666 345 345
Classified as users 264 186 181 247 268 184 184
Classified as Non-
Users 264 183 164 384 398 161 161
Specificity 50.00% 49.59% 47.54% 60.86% 59.76% 46.67% 46.67%
Correctly Specified 59.31% 59.21% 58.43% 64.77% 63.89% 56.83% 56.83%
Chi-Square 85.54% 54.53% 52.04% 99.22% 102.33% 53.92% 53.91%
Probability 0.0000 0.0000 0.0000 0.0000 0.0000 0.0000 0.0000 Pseudo R-Square 0.0934 0.0832 0.0847 0.0995 0.0958 0.0878 0.0877
Log pseudo likelihood -415.23412 -300.546 -281.1772 -448.7783 -483.1410 -280.2411 -280.2424
Source: author’s elaboration – FAME database.

76
Tab. 25 - Logit Regression on the probability of hedging (IR).
This table presents logit regression estimates of the relation between the probability that a firm hedge with IR derivatives as proxies for incentives to hedge. The dependent
variable equals 1 if a firm provides qualitative information of any derivative use in the annual report, an 0 if otherwise. The model presents log of odds coefficients (Coef.),
marginal effects (ME), odds ratios and the respective p-values in parenthesis. The estimated coefficients give the change in the logit function given a change in the
independent variable. The marginal effect (elasticities) measures the actual change (percentage change) in the probability of hedging for 1% increase in the independent
variable. The higher the elasticity’ value more important is the variable in the model. The odds ratio gives the likelihood of Y = 1 when X is increased by one unit. The p-
values are calculated using the robust (heteroscedastic) standard errors. ***, ** and * indicate the significance at 1%, 5% and 10% respectively.
Indep.
Variables
MOD.1 MOD.2 MOD.3 MOD.4 MOD.5 MOD.6 MOD.7
Coeff. ME Odds Coeff. ME Odds Coeff. ME Odds Coeff. ME Odds Coeff. ME Odds Coeff. ME Odds Coeff. ME Odds
EBIT INT PAYMENT
-
0.000
(0.989)
-
0.000
(0.989)
0.999
(0.989)
ASSETCOVERX
-
0.012
(0.034)
**
-
0.001
(0.002)
***
0.988
(0.008)
***
MKTV
3.037
(0.000)
***
0.352
(0.000)
***
20.835
(0.000)
***
PROFIT MARGIN
0.012
(0.085)
*
0.001
(0.084)
*
1.012
(0.085)
*
ROA 0.001
(0.930)
0.000
(0.930)
1.001
(0.930)
ST BORROW
-
1.644
(0.008)
***
-
0.197
(0.005)
***
0.193
(0.008)
***
LT BORROW
1.644
(0.008)
***
0.197
(0.005)
***
5.177
(0.008)
***
MKTTBRAT
-
0.327
(0.656)
-
0.037
(0.655)
0.721
(0.656)
-
1.916
(0.053)
*
-
0.190
(0.044)
**
0.147
(0.053)
*
-
2.927
(0.011)
**
-
0.339
(0.007)
***
0.053
(0.011)
**
-
1.186
(0.123)
-
0.123
(0.117)
0.305
(0.123)
-
0.186
(0.800)
-
0.019
(0.800)
0.830
(0.800)
-
1.854
(0.059)
*
-
0.222
(0.052)
*
0.156
(0.059)
*
-
1.854
(0.059)
*
0.197
(0.005)
***
5.177
(0.008)
***
FOREIGN SALES
-
1.029
(0.008)
***
-
0.117
(0.008)
***
0.357
(0.008)
***
-
0.957
(0.025)
**
-
0.095
(0.037)
**
0.384
(0.025)
**
-
1.231
(0.008)
***
-
0.143
(0.007)
***
0.292
(0.008)
***
-
0.982
(0.017)
**
-
0.102
(0.015)
**
0.374
(0.017)
**
-
0.949
(0.015)
**
-
0.097
(0.015)
**
0.387
(0.015)
**
-
1.146
(0.016)
**
-
0.137
(0.013)
**
0.318
(0.016)
**
-
1.146
(0.016)
**
-
0.137
(0.013)
**
0.318
(0.016)
**
LN SALES
0.702
(0.000)
***
0.081
(0.000)
***
2.017
(0.000)
***
0.683
(0.000)
***
0.071
(0.000)*
**
1,981
(0.000)
***
0.696
(0.000)
***
0.083
(0.000)
***
2.005
(0.000)
***
0.696
(0.000)
***
0.088
(0.000)
***
2.005
(0.000)
***
LN ASSETS 0.651 0.074 1.917 0.561 0.056 1.752 0.677 0.069 1.968

77
(0.000)
***
(0.000)
***
(0.000)
***
(0.000)
***
(0.001)
***
(0.000)
***
(0.000)
***
(0.000)
***
(0.000)
***
Q-RATIO
-
0.249
(0.071)
*
-
0.028
(0.066)
*
0.779
(0.071)
*
-
0.353
(0.033)
**
-
0.035
(0.039)
**
0.702
(0.033)
**
-
0.208
(0.296)
-
0.024
(0.287)
0.812
(0.296)
-
0.318
(0.045)
**
-
0.033
(0.038)
**
0.728
(0.045)
**
-
0.288
(0.038)
***
-
0.029
(0.035)
**
0.749
(0.038)
**
-
0.354
(0.093)
*
-
0.042
(0.086)
*
0.702
(0.093)
*
-
0.354
(0.093)
*
-
0.042
(0.086)
*
0.702
(0.086)
*
SOLVENCY RATIO
Z-SCORE
-
0.080
(0.650)
0.009
(0.649)
1.083
(0.650)
0.204
(0.327)
0.020
(0.320)
1.227
(0.327)
-
0.101
(0.577)
-
0.012
(0.578)
0.904
(0.577)
-
0.585
(0.000)
***
-
0.061
(0.000)
***
0.557
(0.000)
***
-
0.027
(0.038)
**
-
0.029
(0.035)
**
0.749
(0.038)
**
-
0.131
(0.453)
-
0.016
(0.454)
0.877
(0.453)
-
0.131
(0.453)
-
0.016
(0.454)
0.877
(0.453)
_cons
-
7.620
(0.000)
***
0.001
(0.000)
***
-
5.509
(0.001)
***
4.1e-03
(0.001)
***
-
7.630
(0.000)
***
0.000
(0.000)
***
-
6.582
(0.000)
***
0.557
(0.000)
***
-
7.908
(0.000)
***
0.000
(0.000)
***
-
5.928
(0.004)
***
0.003
(0.004)
***
-
7.572
(0.000)
***
0.000
(0.000)
***
Source: author’s elaboration – FAME database.
Summary Statistic for Logit Regression.
Statistics MOD.1 MOD.2 MOD.3 MOD.4 MOD.5 MOD.6 MOD.7
N. 470 373 356 507 525 356 356
No. of Users 77 70 63 72 78 63 63
Classified as Users 30 42 12 26 28 36 36
Classified as Non-
Users 47 28 51 49 50 27 27
Sensitivity 38.96% 60.00% 19.05% 34.67% 35.90% 57.14% 57.14%
No. of Non-Users 393 303 293 432 447 293 293
Classified as users 53 65 12 58 47 8 61
Classified as Non-
Users 340 238 281 374 400 285 232
Specificity 38.96% 78.55% 95.90% 86.57% 89.49% 97.27% 79.18%
Correctly Specified 78.72% 75.07% 82.30£ 78.90% 81.52% 82.58% 75.28%
Chi-Square 47.91% 54.40% 50.66% 41.16% 55.05% 47.86% 38.66%
Probability 0.0000 0.0000 0.0000 0.0000 0.0000 0.0000 0.0000 Pseudo R-Square 0.1143 0.1510 0.1524 0.0969 0.1248 0.1440 0.1163
Log pseudo likelihood -185.65042 -152.89319 -140.8361 -191.9024 -193.0930 -142.2396 -146.8384
Source: author’s elaboration – FAME database.

78
Tab. 26 - Logit Regression on the probability of hedging (FX).
This table presents logit regression estimates of the relation between the probability that a firm hedge with FX derivatives as proxies for incentives to hedge. The dependent
variable equals 1 if a firm provides qualitative information of any derivative use in the annual report, an 0 if otherwise. The model presents log of odds coefficients (Coef.),
marginal effects (ME), odds ratios and the respective p-values in parenthesis. The estimated coefficients give the change in the logit function given a change in the
independent variable. The marginal effect (elasticities) measures the actual change (percentage change) in the probability of hedging for 1% increase in the independent
variable. The higher the elasticity’ value more important is the variable in the model. The odds ratio gives the likelihood of Y = 1 when X is increased by one unit. The p-
values are calculated using the robust (heteroscedastic) standard errors. ***, ** and * indicate the significance at 1%, 5% and 10% respectively.
Indep.
Variables
MOD.1 MOD.2 MOD.3 MOD.4 MOD.5
Coeff. ME Odds Coeff. ME Odds Coeff. ME Odds Coeff. ME Odds Coeff. ME Odds
EBIT INT PAYMENT
0.000
(0.675)
0.000
(0.675)
1.000
(0.675)
ASSETCOVERX
0.001
(0.235)
0.000
(0.239)
1.001
(0.235)
MKTV
-
4.097
(0.000)
***
-
0.271
(0.000)
***
0.017
(0.000)
***
PROFIT MARGIN
-
0.009
(0.149)
-
0.001
(0.150)
0.991
(0.149)
ROA
-
0.036
(0.005)
***
-
0.003
(0.006)
***
0.964
(0.005)
***
ST BORROW
LT BORROW
MKTTBRAT
-
80.036
(0.029)
**
-
7.154
(0.026)
**
0.000
(0.029)
**
-
46.185
(0.319)
-
3.472
(0.314)
0.000
(0.319)
-
44.835
(0.343)
-
2.961
(0.339)
0.000
(0.340)
-
88.880
(0.011)
**
-
8.025
(0.010)
***
0.000
(0.011)
**
-
74.556
(0.028)
**
-
7.146
(0.025)
**
0.000
(0.028)
**
FOREIGN SALES
1.067
(0.001)
***
0.095
(0.001)
***
2.908
(0.000)
***
0.124
(0.002)
***
0.093
(0.002)
***
3.442
(0.002)
***
1.660
(0.000)
***
0.110
(0.000)
***
5.260
(0.000)
***
0.914
(0.002)
***
0.082
(0.003)
***
2.495
(0.002)
***
1.137
(0.000)
***
0.109
(0.000)
***
3.118
(0.000)
***
LN SALES
0.580
(0.000)
***
0.052
(0.000)
***
1.786
(0.000)
***
0.558
(0.002)
***
0.042
(0.002)
***
3.442
(0.002)
***
0.827
(0.000)
***
0.055
(0.000)
***
2.286
(0.000)
***
0.747
(0.000)
***
0.067
(0.000)
***
2.111
(0.000)
***
LN ASSETS
0.424
(0.000)
***
0.041
(0.000)
***
1.529
(0.000)
***
Q-RATIO
SOLVENCY - - - - - - - - - -

79
RATIO 0.775
(0.034)
**
0.069
(0.032)
**
0.460
(0.034)
**
0.453
(0.328)
0.034
(0.323)
0.636
(0.328)
0.449
(0.342)
0.023
(0.338)
0.638
(0.342)
0.858
(0.014)
**
0.077
(0.013)
**
0.424
(0.014)
**
0.723
(0.033)
**
0.069
(0.030)
**
0.485
0.033
**
Z-SCORE
0.605
(0.000)
***
0.054
(0.000)
***
1.831
(0.000)
***
0.482
(0.004)
***
0.036
(0.002)
***
1.619
(0.004)
***
0.391
(0.015)
**
0.026
(0.014)
**
1.478
(0.015)
**
0.732
(0.000)
***
0.066
(0.013)
**
2.079
(0.000)
***
1.202
(0.000)
***
0.115
(0.000)
***
3.327
(0.000)
***
_cons
70.135
(0.055)
*
2.9e+30
(0.055)
*
37.111
(0.424)
1.3e+1
6
(0.424)
35.017
(0.459)
1.6e+1
5
(0.459)
76.821
(0.028)
**
2.3e+3
3
(0.028)
**
65.489
(0.054)
*
2.8E+2
8
(0.054)
*
Source: author’s elaboration – FAME database.
Summary Statistic for Logit Regression.
Statistics MOD.1 MOD.2 MOD.3 MOD.4 MOD.5
N. 688 531 498 747 795
No. of Users 107 60 62 118 121
Classified as Users 52 19 28 64 55
Classified as Non-Users 55 41 34 54 66
Sensitivity 48.60% 31.67% 45.16% 54.24% 45.45%
No. of Non-Users 581 471 436 629 674
Classified as users 82 29 45 83 84
Classified as Non-Users 499 442 391 546 590
Specificity 85.89% 93.84% 89.68% 86.80% 87.54%
Correctly Specified 80.09% 86.82% 84.14% 81.66% 81.13%
Chi-Square 95.14% 41.90% 70.05% 111.53% 98.82%
Probability 0.0000 0.0000 0.0000 0.0000 0.0000 Pseudo R-Square 0.1600 0.1119 0.1871 0.1711 0.1457
Log pseudo likelihood -249.7635 -166.34738 -152.1217 -270.1340 -289.6630
Source: author’s elaboration – FAME database.

80
Summary Multivariate Logit Regression
Table 17 shows the estimation results for the extent to which firms hedge their risk
exposure with derivatives instruments as users, interest rate and foreign exchange
hedgers. The table shows seven different model specifications that have been obtained
from different combinations of explanatory variables. All seven models estimated the three
different dependent variables, the hedgers, the interest rate hedgers and the foreign
exchange hedgers, and include one at a time measures such as interest coverage ratios,
leverage ratio, profitability ratios, debt maturity ratios, growth opportunity ratio, financial
price risk and overseas operation ratio, firm size ratios, hedging substitutes ratios and
likelihood of default ratio. The results show that estimates can be quite different depending
on the dependent variable used. In model 1 when have been tested the relationship
between hedgers and the other six hypotheses has been excluded the z-score variable
because since univariate logit regression this variable it was insignificant. At the same time
has to be taken in to account that as firm size and liquidity variables have been used the
one who’s in the univariate logit regression where more significant taking in to account the
dependent variable tested. At this point the analysis should concentrate on the estimated
results provided by the model specification which uses as dependent variable “use”.
Looking in the previous tables is shown that models run using “use” as dependent variable
get a higher chi2 compared to the others. So it is believed that “use” better captures the
decision to hedge. In model 2 is shown that the estimate asset coverage ratio is very
insignificant (p-value 0.292), on the other hand the most significant coefficient is market
value leverage because it has the higher coefficient (1.156) compared with the one of the
other variables that have been used to test the relationship between hedging and financial
distress exposure.
This results show that market value leverage has been used as a leverage proxy and it
measures how leveraged a firm is and its degree of leverage is often a measure of risk.
Therefore could be stated that firms with higher leverage ratio may not be able to generate
enough cash to satisfy their debt obligations, so they might face bankruptcy or default
scenarios, thus are more likely to hedge. Another important aspect is that market value
leverage is the variable with the highest significant coefficient for all the dependent
variables (USE, IR and FX) and for IR and FX hedgers it is more significant and has an
higher coefficient (IR: 3.037 and FX: 4.097). therefore this strengthens the fact that firms
enter into IR and FX derivatives contracts to limit their risks and thus their debt exposure.

81
This is reinforced by the fact that long term and short term borrow, debt maturity proxies,
are both significant and with a high coefficient, but only for USE and IR. That could be
explained as FX hedgers are used to cover more the companies against financial risk
exposure related to overseas operations. In fact the row testing the foreign sales suggests
that the highest coefficients are those in the FX hedgers column, and that demonstrate a
positive relationship between hedging and FX derivative use. Firm size is another measure
who plays an important role because data show that larger is the company higher is the
probability that it is going to hedge with derivative instruments. That could be related to
economies of scale. Furthermore liquidity ratios (quick ratio and solvency ratio), which
have been used to test the relationship between hedging substitutes and derivatives use,
show that when companies decide to implement alternative instruments to cover
themselves against risk exposure they do not use at the same time derivative instruments.
After all market to book ratio tested the dependence between hedging and growth
opportunity. This ratio has a negative coefficient and shows that the higher the growth
opportunities of the leveraged firm the lower the corporate demand for hedging. That could
be explained by the fact that the sample tested is composed by non-financial SMEs listed
in the UK market. Moreover risk management at firm level is economically possible only if
the increase in firm value is higher than the hedging costs and shareholders personally do
not be support any costs.

82
Tab. 27 - Empirical results: summary table about the corporate demand for financial derivatives
Indep.
Variables
MOD.1 MOD.2 MOD.3 MOD.4 MOD.5 MOD.6 MOD.7
USE. IR FX USE. IR FX USE. IR FX USE. IR FX USE. IR FX USE. IR FX USE. IR FX
EBIT INT PAYMENT
0.002
(0.003)
***
-
0.000
(0.989)
0.000
(0.675)
ASSETCOVERX
-
0.001
(0.292)
-
0.012
(0.034)
**
0.001
(0.235)
MKTV
1.156
(0.017)
**
3.037
(0.000)
***
-
4.097
(0.000)
***
PROFIT MARGIN
0.008
(0.069)
*
0.012
(0.085)
*
-
0.009
(0.149)
ROA
0.010
(0.057)
*
0.001
(0.930
-
0.036
(0.005)
***
ST BORROW
-
0.996
(0.007)
***
-
1.644
(0.008)
***
-
0.034
(0.948)
LT BORROW
0.995
(0.007)
***
1.644
(0.008)
***
0.034
(0.948)
MKTTBRAT
-73.587
(0.007)
***
-
0.327
(0.656)
-
80.036
(0.029)
**
-77.580
(0.017)
**
-
1.916
(0.053)
*
-
46.185
(0.319)
-75.952
(0.025)
**
-
2.927
(0.011)
**
-
44.835
(0.343)
-
80.844(
0.002)
***
-
1.186
(0.123)
-
88.880
(0.011)
**
-67.703
(0.007)
***
-
0.186
(0.800)
-
74.556
(0.028)
**
-78.911
(0.019)
**
-
1.854
(0.059)
*
-
33.534
(0.467)
- 78.916
(0.019)
**
-
1.854
(0.059)
*
-
33.534
(0.467)
FOREIGN SALES
0.251
(0.299)
*
-
1.029
(0.008)
***
1.067
(0.001)
***
0.014
(0.962)
*
-
0.957
(0.025)
**
0.124
(0.002)
***
-
0.101
(0.737)
-
1.231
(0.008)
***
1.660
(0.000)
***
0.278
(0.237)
-
0.982
(0.017)
**
0.914
(0.002)
***
0.469
(0.034)
**
-
0.949
(0.015)
**
1.137
(0.000)
***
0.020
(0.948)
-
1.146
(0.016)
**
1.354
(0.001)
***
0.020
(0.948)
-
1.146
(0.016)
**
1.354
(0.001)
***
LN SALES -

83
0.580
(0.000)
***
0.558
(0.002)
***
0.679
(0.000)
***
0.702
(0.000)
***
0.827
(0.000)
***
0.730
(0.000)
***
0.683
(0.000)
***
0.747
(0.000)
***
0.649
(0.000)
***
0.696
(0.000)
***
0.575
(0.002)
***
0.786
(0.020)
**
0.696
(0.000)
***
0.575
(0.002)
***
LN ASSETS
0.462
(0.000)
***
0.651
(0.000)
***
0.464
(0.000)
***
0.561
(0.000)
***
0.515
(0.000)
***
0.677
(0.000)
***
0.424
(0.000)
***
Q-RATIO
-
0.249
(0.071)
*
-
0.353
(0.033)
**
-
0.208
(0.296)
-
0.318
(0.045)
**
-
0.288
(0.038)
***
-
0.354
(0.093)
*
-
0.354
(0.093)
*
SOLVENCY
RATIO
-
0.727
(0.008)
***
-
0.775
(0.034)
**
-
0.774
(0.017)
**
-
0.453
(0.328)
-
0.752
(0.026)
**
-
0.449
(0.342)
-
0.795
(0.002)
***
-
0.858
(0.014)
**
-
0.672
(0.007)
***
-
0.723
(0.033)
**
-
0.786
(0.020)
**
-
0.322
(0.484)
-
0.786
(0.020)
**
-
0.322
(0.484)
Z-SCORE
-
0.080
(0.650)
0.605
(0.000)
***
0.204
(0.327)
0.482
(0.004)
***
-
0.101
(0.577)
0.391
(0.015)
**
-
0.585
(0.000)
***
0.732
(0.000)
***
-
0.027
(0.038)
**
1.202
(0.000)
***
-
0.131
(0.453)
0.549
(0.001)
***
-
0.131
(0.453)
0.549
(0.001)
***
_cons
67.568
(0.013)
**
-
7.620
(0.000)
***
70.135
(0.055)
*
72.003
(0.026)
**
-
5.509
(0.001)
***
37.111
(0.424)
67.800
(0.045)
**
-
7.630
(0.000)
***
35.017
(0.459)
71.933
(0.006)
***
-
6.582
(0.000)
***
76.821
(0.028)
**
61.180
(0.015)
**
-
7.908
(0.000)
***
65.489
(0.054)
*
72.063
(0.033)
**
-
5.928
(0.004)
***
24.094
(0.601)
71.020
(0.035)
**
-
7.572
(0.000)
***
24.060
(0.602)
Source: author’s elaboration – FAME database.

84
5.3: Descriptive statistics Italian non-financial listed SMEs
The data sample consists of 528 firm-year observations. The table below
shows the activity and the types of derivatives of hedging, the most used
derivatives and derivative combinations for the firm-year observations in the Italian
sample. Panel A shows that 32.95% of the sample is classified as using
derivatives to hedge. Panel B shows that 87.93% of the derivative users disclosed
in their annual reports that they used IR derivatives and 37.36% used FX
derivatives. Further, Panel D and E suggest that the most used FX derivative is FX
Forwards 75.38% and the most commonly used IR derivative is IR Swaps 97.39%.
The most used derivative combination is FX Forwards and IR Swaps 13.22%. The
fact that forward contracts and swaps are more commonly used than options could
be because of the cost required to pay upfront when buying an option. Forwards
contracts and swaps require no such premium payment upfront but are quoted
with a bid-ask spread, which means the buyer will always get the highest price and
the seller the lowest price.
Tab. 28 - Hedging activity and types of derivatives used by Italian non-financial SMEs.
This table presents data on the hedging activity with derivatives disclosed in the annual reports amongst the
sample of 66 firms from the year 2005-2012. Panel data A shows the number of derivative users and non-
users. Panel B presents data on the type of derivatives used. Panel C presents the combination of derivatives
used and distinguishes between FX derivatives users and IR derivative users. Panel D and E present data on
the most commonly used derivatives within the groups of FX and IR derivatives. Panel F shows the most
common combinations of FX and IR derivatives used.
Panel A: Derivative Use N %
Use 174 32.95%
Do not use 354 67.05%
Total 528 100%
Panel B: Types of derivatives used (calculated as a
percentage of 174 derivative users – Panel A)
N %
IR 153 87.93%
FX 65 37.36%

85
Panel C: Combination of derivative used N %
FX only 21 12.07%
IR only 109 62.64%
FX & IR only 44 25.29%
Total 174 100.00%
Panel D: Most used FX derivatives (calculated as a
percentage of 65 derivative users – Panel B)
N %
FX Forwards 49 75.38%
FX Swaps 8 12.31%
FX Options 8 12.31%
Panel E: Most used IR derivatives (calculated as a
percentage of 153 derivative users – Panel B)
N %
IR Swaps 149 97.39%
IR Options 3 1.96%
Panel F: Combination of FX and IR derivative used
(calculated as a percentage of 174 derivative users –
Panel A)
N %
FX Forwards only 16 9.19%
IR Swaps only 112 64.37%
FX Forwards + FX Options only 2 1.15%
FX Forwards + IR Swaps only 23 13.22%
FX Forwards + IR Swaps + FX Swaps only 5 2.87%
FX Options + IR Swaps only 3 1.72%
FX Forwards + FX Swaps + FX Options + IR Swaps only 3 1.72%
IR Swaps + IR Options only 3 1.72%
Source: author’s elaboration of data handily collected from annual reports of UK non-financial listed SMEs.
The table below examines the differences in firm characteristics between
hedgers and non-hedgers through the mean difference test and the Wilcoxon rank
sum test. To analyse the relationship between financial distress and hedging have
been used the following measures. The leverage proxies have two out of eight
significant variables and the long term debt capital is higher for hedgers. This

86
shows what has been assumed by the literature that firms with higher leverage are
more likely to hedge because are more keener to incur in financial distress
situations.
Have been tested seven profitability measures and three of these are
significant variables such as ROC, ROE and profit margin. The results
demonstrate what has been stated by Glaum (2002) that hedgers are those firms
with higher profitability.
Four proxies have been use to test the relationship between interest coverage
ratio and hedging. These ratios show how easily a firm can pays interests on
outstanding debt. Only one of these variables is significant and non hedgers have
higher interest coverage ratios. That is consistent with what the literature says
because there is a negative relationship between this ratio and the probability to
hedge.
About the debt maturity ratios both of them are significant and are consistent
with the literature because the long term borrowing variable is significant for the
hedgers which shows that firms with long term debt maturity are more likely to
hedge to cover themselves against expected future fluctuations.
To test the growth opportunities have been used the market to book ratio that
is insignificant.
As measures of financial price risk (IR and FX) have been used three proxies
the foreign sales, leverage ratio and the interest coverage ratio. Foreign sales is
not significant and the leverage ratios show that there is a positive relationship
between hedging and financial price exposure. The interest coverage ratio
suggests that firms with lower ratio are more likely to hedge and that agrees with
what is stated by the literature. The foreign sales variable has been used also to
test the relationship between hedging and overseas operations and it is not
significant.
All the variables measuring firm size are significantly higher for hedgers and
that is consistent with the fact that higher firms enjoy information and transaction
costs scale economies by engaging in risk management activities.
Finally to test the relationship between hedging and the use of other
instruments to hedge have been implemented five liquidity proxies and four of
them are significant such as current ratio, quick ratio, liquidity ratio and
shareholders liquidity ratio. Noone shows the right relationship stated by the
literature such as more liquid is a firm less likely to hedge it is.
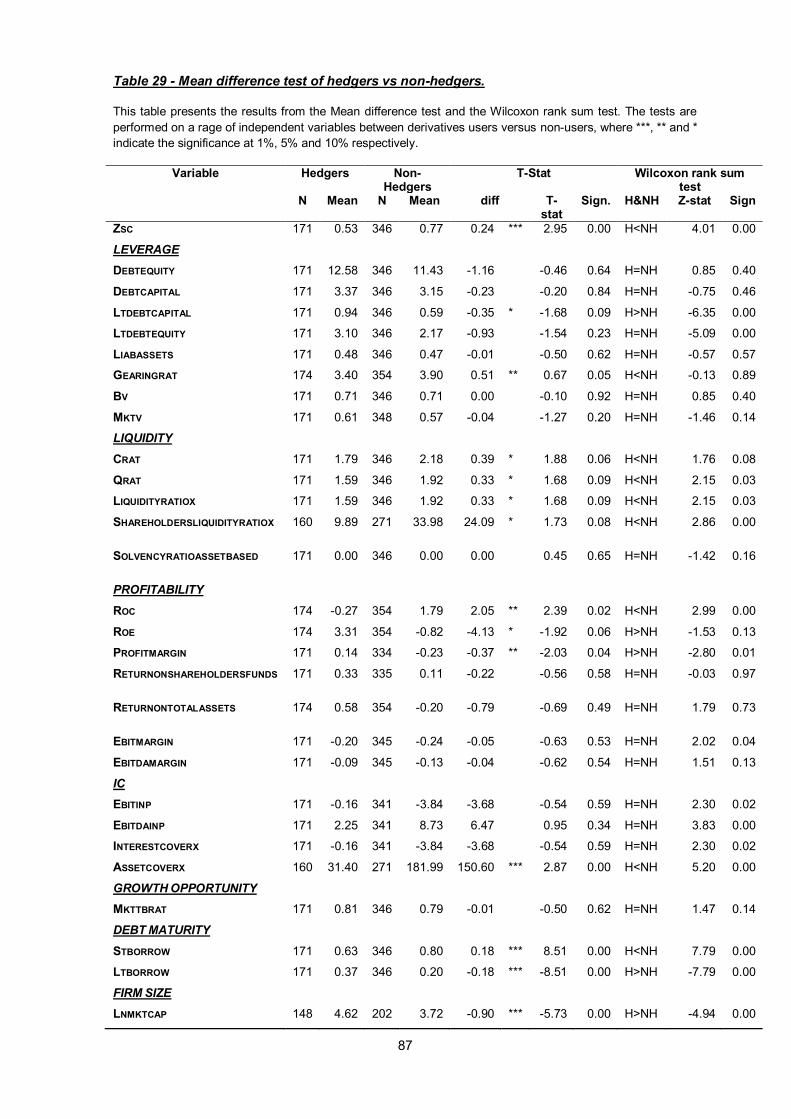
87
Table 29 - Mean difference test of hedgers vs non-hedgers.
This table presents the results from the Mean difference test and the Wilcoxon rank sum test. The tests are
performed on a rage of independent variables between derivatives users versus non-users, where ***, ** and *
indicate the significance at 1%, 5% and 10% respectively.
Variable Hedgers Non-Hedgers
T-Stat Wilcoxon rank sum test
N Mean N Mean diff T-stat
Sign. H&NH Z-stat Sign
ZSC 171 0.53 346 0.77 0.24 *** 2.95 0.00 H<NH 4.01 0.00
LEVERAGE
DEBTEQUITY 171 12.58 346 11.43 -1.16 -0.46 0.64 H=NH 0.85 0.40
DEBTCAPITAL 171 3.37 346 3.15 -0.23 -0.20 0.84 H=NH -0.75 0.46
LTDEBTCAPITAL 171 0.94 346 0.59 -0.35 * -1.68 0.09 H>NH -6.35 0.00
LTDEBTEQUITY 171 3.10 346 2.17 -0.93 -1.54 0.23 H=NH -5.09 0.00
LIABASSETS 171 0.48 346 0.47 -0.01 -0.50 0.62 H=NH -0.57 0.57
GEARINGRAT 174 3.40 354 3.90 0.51 ** 0.67 0.05 H<NH -0.13 0.89
BV 171 0.71 346 0.71 0.00 -0.10 0.92 H=NH 0.85 0.40
MKTV 171 0.61 348 0.57 -0.04 -1.27 0.20 H=NH -1.46 0.14
LIQUIDITY
CRAT 171 1.79 346 2.18 0.39 * 1.88 0.06 H<NH 1.76 0.08
QRAT 171 1.59 346 1.92 0.33 * 1.68 0.09 H<NH 2.15 0.03
LIQUIDITYRATIOX 171 1.59 346 1.92 0.33 * 1.68 0.09 H<NH 2.15 0.03
SHAREHOLDERSLIQUIDITYRATIOX 160 9.89 271 33.98 24.09 * 1.73 0.08 H<NH 2.86 0.00
SOLVENCYRATIOASSETBASED 171 0.00 346 0.00 0.00 0.45 0.65 H=NH -1.42 0.16
PROFITABILITY
ROC 174 -0.27 354 1.79 2.05 ** 2.39 0.02 H<NH 2.99 0.00
ROE 174 3.31 354 -0.82 -4.13 * -1.92 0.06 H>NH -1.53 0.13
PROFITMARGIN 171 0.14 334 -0.23 -0.37 ** -2.03 0.04 H>NH -2.80 0.01
RETURNONSHAREHOLDERSFUNDS 171 0.33 335 0.11 -0.22 -0.56 0.58 H=NH -0.03 0.97
RETURNONTOTALASSETS 174 0.58 354 -0.20 -0.79 -0.69 0.49 H=NH 1.79 0.73
EBITMARGIN 171 -0.20 345 -0.24 -0.05 -0.63 0.53 H=NH 2.02 0.04
EBITDAMARGIN 171 -0.09 345 -0.13 -0.04 -0.62 0.54 H=NH 1.51 0.13
IC
EBITINP 171 -0.16 341 -3.84 -3.68 -0.54 0.59 H=NH 2.30 0.02
EBITDAINP 171 2.25 341 8.73 6.47 0.95 0.34 H=NH 3.83 0.00
INTERESTCOVERX 171 -0.16 341 -3.84 -3.68 -0.54 0.59 H=NH 2.30 0.02
ASSETCOVERX 160 31.40 271 181.99 150.60 *** 2.87 0.00 H<NH 5.20 0.00
GROWTH OPPORTUNITY
MKTTBRAT 171 0.81 346 0.79 -0.01 -0.50 0.62 H=NH 1.47 0.14
DEBT MATURITY
STBORROW 171 0.63 346 0.80 0.18 *** 8.51 0.00 H<NH 7.79 0.00
LTBORROW 171 0.37 346 0.20 -0.18 *** -8.51 0.00 H>NH -7.79 0.00
FIRM SIZE
LNMKTCAP 148 4.62 202 3.72 -0.90 *** -5.73 0.00 H>NH -4.94 0.00

88
LNTOTSALES 171 10.30 345 9.68 -0.62 *** -6.55 0.00 H>NH -6.00 0.00
LNTOTASSETS 171 12.09 346 10.68 -1.41 *** -10.94
0.00 H>NH -10.19 0.00
FOREIGN EXCHANGE
FOREIGNSALES 59 0.25 39 0.25 0.00 0.05 0.96 H=NH 1.26 0.21
Source: author’s elaboration – AIDA database and Annual Reports for foreign sales measure.
In the following table are provided the differences in means between FX
derivative users versus non-FX derivative users and IR derivative users versus
non-IR derivative users with and without bias.
First of all must be done a comparison of the results from the next two tables –
table 30 and table 31 - that gives an overview of which characteristics are
important in case of hedging with FX derivative no bias and IR derivatives no bias.
The data reported in table 31 show that IR hedgers have only one significant
leverage variable, long term debt capital that is consistent with what stated by the
literature and at the same time hedgers have higher firm size variables then non
hedgers and that is consistent with scale economies. Long term debt borrow as
proxy of debt maturity is a significant variable for IR users. Hedgers have higher
long term debt that could be explain as their intention to cover themshelves
against risk exposure. But at the same time this variable is statistically significant
also for FX hedgers, with a positive relationship that could be explained as the
companies likelihood to hedge to cover themselves against currency risk exposure
due to foreign debt exposure.
Tab. 30 - Mean difference test of FX hedgers vs non-FX hedgers (no bias).
This table presents the results from the Mean difference test and the Wilcoxon rank sum test. The tests are
performed on a rage of independent variables between FX derivatives users versus non-FX derivative users
no bias, where ***, ** and * indicate the significance at 1%, 5% and 10% respectively.
Variable Hedgers Non-Hedgers
T-Stat Wilcoxon rank sum test
N Mean N Mean diff T-stat
Sign. H&NH Z-stat
Sign
ZSC 64 0.51 346 0.77 0.25 ** 2.01 0.05 H<NH 3.20 0.00
LEVERAGE
DEBTEQUITY 64 12.03 346 11.43 -0.60 -0.23
0.81 H=NH -0.71
0.48
DEBTCAPITAL 64 2.89 346 3.15 0.26 0.16 0.87 H=NH -0.51
0.61
LTDEBTCAPITAL 64 0.79 346 0.59 -0.20 -0.76
0.45 H=NH -3.42
0.00
LTDEBTEQUITY 64 2.73 346 2.17 -0.56 -0.73
0.46 H=NH -2.98
0.00
LIABASSETS 64 0.47 346 0.47 0.00 - 0.88 H=NH - 0.72

89
0.15 0.36
GEARINGRAT 65 2.33 354 3.90 1.57 1.47 0.14 H=NH 0.23 0.82
BV 64 0.74 346 0.71 -0.03 -0.99
0.32 H=NH -0.71
0.48
MKTV 64 0.58 348 0.57 -0.01 -0.25
0.81 H=NH -0.47
0.64
LIQUIDITY
CRAT 64 1.70 346 2.18 0.48 1.55 0.12 H=NH 0.33 0.74
QRAT 64 1.49 346 1.92 0.43 1.46 0.15 H=NH 0.67 0.50
LIQUIDITYRATIOX 64 1.49 346 1.92 0.43 1.46 0.15 H=NH 0.67 0.50
SHAREHOLDERSLIQUIDITYRATIOX 59 23.69 271 33.98 10.29 0.45 0.65 H=NH 1.56 0.12
SOLVENCYRATIOASSETBASED 64 0.00 346 0.00 0.00 0.90 0.37 H=NH 0.29 0.77
PROFITABILITY
ROC 65 -3.19 354 1.79 4.98 *** 3.85 0.00 H<NH 4.73 0.00
ROE 65 3.51 354 -0.82 -4.33 -1.32
0.19 H=NH -1.27
0.20
PROFITMARGIN 64 -0.06 334 -0.23 -0.17 -0.61
0.54 H=NH -0.61
0.54
RETURNONSHAREHOLDERSFUNDS 64 1.06 335 0.11 -0.95 * -1.65
0.10 H>NH -0.11
0.91
RETURNONTOTALASSETS 65 -1.13 354 -0.20 0.93 0.51 0.61 H=NH 3.17 0.00
EBITMARGIN 64 -0.42 345 -0.24 0.17 1.48 0.14 H=NH 4.72 0.00
EBITDAMARGIN 64 -0.29 345 -0.13 0.16 1.58 0.11 H=NH 4.83 0.00
IC
EBITINP 64 -3.03 341 -3.84 -0.81 -0.07
0.94 H=NH 3.14 0.00
EBITDAINP 64 0.02 341 8.73 8.71 0.78 0.43 H=NH 4.28 0.00
INTERESTCOVERX 64 -3.03 341 -3.84 -0.81 -0.07
0.94 H=NH 3.14 0.00
ASSETCOVERX 59 70.37 271 181.99 111.63 1.29 0.20 H=NH 2.37 0.02
GROWTH OPPORTUNITY
MKTTBRAT 64 0.82 346 0.79 -0.03 -0.84
0.40 H=NH -0.17
0.87
DEBT MATURITY
STBORROW 64 0.65 346 0.80 0.15 *** 5.04 0.00 H<NH 3.99 0.00
LTBORROW 64 0.35 346 0.20 -0.15 *** -5.04
0.00 H>NH -3.92
0.00
FIRM SIZE
LNMKTCAP 57 4.94 202 3.72 -1.22 *** -6.07
0.00 H>NH -5.26
0.00
LNTOTSALES 64 10.08 345 9.68 -0.39 *** -2.75
0.01 H>NH -2.14
0.03
LNTOTASSETS 64 12.10 346 10.68 -1.42 *** -7.70
0.00 H>NH -7.10
0.00
FOREIGN EXCHANGE
FOREIGNSALES 23 0.44 39 0.25 -0.19 -1.46
0.15 H=NH -1.39
0.16
Source: author’s elaboration – AIDA database and Annual Reports for foreign sales measure.

90
Tab. 31 - Mean difference test of IR hedgers vs non-IR hedgers (no bias).
This table presents the results from the Mean difference test and the Wilcoxon rank sum test. The tests are
performed on a rage of independent variables between IR derivatives users versus non-IR derivative users no
bias, where ***, ** and * indicate the significance at 1%, 5% and 10% respectively.
Variable Hedgers Non-Hedgers
T-Stat Wilcoxon rank sum test
N mean N Mean diff T-stat
Sign. H&NH Z-stat
Sign
ZSC 151 0.51 346 0.77 0.26 *** 3.06 0.00 H<NH 4.16 0.00
LEVERAGE
DEBTEQUITY 151 11.27 346 11.43 0.16 0.06 0.95 H=NH 1.47 0.14
DEBTCAPITAL 151 3.58 346 3.15 -0.44 -0.37 0.71 H=NH -0.50 0.61
LTDEBTCAPITAL 151 0.98 346 0.59 -0.39 * -1.79 0.07 H>NH -6.49 0.00
LTDEBTEQUITY 151 3.19 346 2.17 -1.02 -1.61 0.11 H=NH -4.92 0.00
LIABASSETS 151 0.48 346 0.47 -0.01 -0.36 0.72 H=NH -0.39 0.70
GEARINGRAT 153 3.48 354 3.90 0.42 0.52 0.60 H=NH 0.05 0.96
BV 151 0.70 346 0.71 0.01 0.57 0.57 H=NH 1.47 0.14
MKTV 151 0.61 348 0.57 -0.05 -1.42 0.16 H=NH -1.63 0.10
LIQUIDITY
CRAT 151 1.82 346 2.18 0.35 1.62 0.11 H=NH 1.72 0.09
QRAT 151 1.65 346 1.92 0.27 1.31 0.19 H=NH 1.68 0.09
LIQUIDITYRATIOX 151 1.65 346 1.92 0.27 1.31 0.19 H=NH 1.68 0.09
SHAREHOLDERSLIQUIDITYRATIOX 141 10.95 271 33.98 23.03 1.56 0.12 H=NH 2.85 0.00
SOLVENCYRATIOASSETBASED 151 0.00 346 0.00 0.00 -0.10 0.92 H=NH -1.95 0.05
PROFITABILITY
ROC 153 0.24 354 1.79 1.55 * 1.75 0.08 H<NH 2.47 0.01
ROE 153 3.79 354 -0.82 -4.61 ** -2.03 0.04 H>NH -1.66 0.10
PROFITMARGIN 151 0.20 334 -0.23 -0.43 ** -2.24 0.03 H>NH -3.89 0.00
RETURNONSHAREHOLDERSFUNDS 151 0.38 335 0.11 -0.27 -0.64 0.52 H=NH -0.91 0.36
RETURNONTOTALASSETS 153 1.07 354 -0.20 -1.27 -1.06 0.29 H=NH 1.30 0.20
EBITMARGIN 151 -0.18 345 -0.24 -0.06 -0.83 0.41 H=NH 1.34 0.18
EBITDAMARGIN 151 -0.08 345 -0.13 -0.06 -0.79 0.43 H=NH 0.63 0.53
IC
EBITINP 151 0.32 341 -3.84 -4.16 -0.58 0.56 H=NH 1.94 0.05
EBITDAINP 151 2.35 341 8.73 6.37 0.88 0.38 H=NH 3.58 0.00
INTERESTCOVERX 151 0.32 341 -3.84 -4.16 -0.58 0.56 H=NH 1.94 0.05
ASSETCOVERX 141 31.22 271 181.99 150.77 *** 2.70 0.01 H<NH 5.75 0.00
GROWTH OPPORTUNITY
MKTTBRAT 151 0.79 346 0.79 0.00 0.11 0.91 H=NH 2.09 0.04
DEBT MATURITY
STBORROW 151 0.61 346 0.80 0.20 *** 9.11 0.00 H<NH 8.18 0.00
LTBORROW 151 0.39 346 0.20 -0.20 *** -9.11 0.00 H>NH -8.18 0.00

91
FIRM SIZE
LNMKTCAP 131 4.67 202 3.72 -0.96 *** -5.83 0.00 H>NH -5.04 0.00
LNTOTSALES 151 10.30 345 9.68 -0.62 *** -6.28 0.00 H>NH -5.76 0.00
LNTOTASSETS 151 12.19 346 10.68 -1.51 *** -11.08
0.00 H>NH -10.14
0.00
FOREIGN EXCHANGE
FOREIGNSALES 53 0.24 39 0.25 0.01 0.14 0.89 H=NH 1.71 0.09
Source: author’s elaboration – AIDA database and Annual Reports for foreign sales measure.
The next two tables show the differences in means between FX hedgers
and IR hedgers. Those tables affirms what have been affirmed by the previous two
tables (table 30 and 31). The main differences between FX hedgers with and
without bias is that in table 32 the foreign sales variable is statistically significant
and is higher for FX hedgers, that strengths what the literature stated. The table 33
presents the mean difference test run for IR hedgers and shows that z-score is
statistically significant and higher for hedgers meanwhile in the table 32 it was
higher for non-hedger and that is consistent with what is stated in the literature.
Tab. 32 - Mean difference test of FX hedgers vs non-FX hedgers (bias).
This table presents the results from the Mean difference test and the Wilcoxon rank sum test. The tests are
performed on a rage of independent variables between FX derivatives users versus non-FX derivative users,
where ***, ** and * indicate the significance at 1%, 5% and 10% respectively.
Variable Hedgers Non-Hedgers
T-Stat Wilcoxon rank sum test
N mean N mean diff T-stat
Sign. H&NH Z-stat
Sign
ZSC 64 0.51 453 0.71 0.20 * 1.69 0.09 H<NH 2.82 0.00
LEVERAGE
DEBTEQUITY 64 12.21 453 11.75 -0.45 -0.13
0.90 H=NH -1.12
0.26
DEBTCAPITAL 64 2.89 453 3.27 0.38 0.24 0.81 H=NH -0.33
0.74
LTDEBTCAPITAL 64 0.79 453 0.69 -0.10 -0.34
0.74 H=NH -2.37
0.02
LTDEBTEQUITY 64 2.73 453 2.44 -0.29 -0.34
0.74 H=NH -2.12
0.03
LIABASSETS 64 0.47 453 0.47 0.00 -0.04
0.96 H=NH -0.22
0.83
GEARINGRAT 65 2.33 463 1.48 -0.85 1.48 0.14 H=NH 0.34 0.74
BV 64 0.74 453 0.71 -0.04 -1.16
0.24 H=NH -1.13
0.26
MKTV 64 0.58 455 0.58 0.00 0.03 0.97 H=NH -0.08
0.94
LIQUIDITY
CRAT 64 1.69 453 2.10 0.40 1.37 0.17 H=NH -0.11
0.92
QRAT 64 1.49 453 1.86 0.37 1.31 0.19 H=NH 0.23 0.82
LIQUIDITYRATIOX 64 1.49 453 1.86 0.37 1.31 0.19 H=NH 0.23 0.82

92
SHAREHOLDERSLIQUIDITYRATIOX 59 23.69 372 25.25 1.56 0.08 0.94 H=NH 1.00 0.32
SOLVENCYRATIOASSETBASED 64 0.00 453 0.00 0.00 1.00 0.32 H=NH 0.78 0.44
PROFITABILITY
ROC 65 -3.19 463 1.71 4.90 *** 4.03 0.00 H<NH 4.72 0.00
ROE 65 3.51 463 0.12 -3.38 -1.10
0.27 H=NH -1.10
0.27
PROFITMARGIN 64 -0.06 441 -0.11 -0.06 -0.21
0.83 H=NH -1.01
0.31
RETURNONSHAREHOLDERSFUNDS 64 1.06 442 0.06 -1.00 * -1.79
0.07 H>NH -0.03
0.98
RETURNONTOTALASSETS 65 -1.13 463 0.22 1.35 0.83 0.41 H=NH 3.33 0.00
EBITMARGIN 64 -0.42 452 -0.20 0.22 ** 2.03 0.04 H<NH 1.42 0.16
EBITDAMARGIN 64 -0.29 452 -0.09 0.20 ** 2.15 0.03 H<NH 5.17 0.00
IC
EBITINP 64 -3.03 448 -2.55 0.48 0.05 0.96 H=NH 3.32 0.00
EBITDAINP 64 0.02 448 7.50 7.48 0.77 0.44 H=NH 4.55 0.00
INTERESTCOVERX 64 -3.03 448 -2.55 0.48 0.05 0.96 H=NH 3.32 0.00
ASSETCOVERX 59 70.37 372 134.92 64.56 0.87 0.39 H=NH 1.42 0.16
GROWTH OPPORTUNITY
MKTTBRAT 64 0.82 453 0.79 -0.03 -0.90
0.37 H=NH -0.60
0.55
DEBT MATURITY
STBORROW 64 0.65 453 0.76 0.11 *** 3.39 0.00 H<NH 2.70 0.01
LTBORROW 64 0.35 453 0.24 -0.11 *** -3.39
0.00 H>NH -2.70
0.01
FIRM SIZE
LNMKTCAP 57 4.94 293 3.94 -1.01 *** -4.69
0.00 H>NH -4.64
0.00
LNTOTSALES 64 10.08 452 9.86 -0.21 -1.52
0.13 H=NH -0.74
0.46
LNTOTASSETS 64 12.10 453 11.01 -1.09 *** -5.44
0.00 H>NH -5.59
0.00
FOREIGN EXCHANGE
FOREIGNSALES 23 0.44 75 0.19 -0.25 *** -2.59
0.01 H>NH -2.55
0.01
Source: author’s elaboration – AIDA database and Annual Reports for foreign sales measure.
Tab. 33- Mean difference test of IR hedgers vs non-IR hedgers (bias).
This table presents the results from the Mean difference test and the Wilcoxon rank sum test. The tests are
performed on a rage of independent variables between IR derivatives users versus non-IR derivative users,
where ***, ** and * indicate the significance at 1%, 5% and 10%respectively.
Variable Hedgers Non-Hedgers
T-Stat Wilcoxon rank sum test
N mean N Mean diff T-stat
Sign. H&NH Z-stat
Sign
ZSC 151 0.51 366 0.76 0.26 *** 3.05 0.00 H>NH 4.08 0.00
LEVERAGE
DEBTEQUITY 151 11.27 366 12.03 0.76 0.29 0.77 H=NH 1.74 0.08
DEBTCAPITAL 151 3.58 366 3.07 -0.51 -0.44 0.66 H=NH -0.40
0.69

93
LTDEBTCAPITAL 151 0.98 366 0.59 -0.39 * -1.82 0.07 H<NH -6.44
0.00
LTDEBTEQUITY 151 3.19 366 2.18 -1.01 -1.61 0.11 H=NH -4.73
0.00
LIABASSETS 151 0.48 366 0.47 -0.01 -0.30 0.77 H=NH -4.73
0.00
GEARINGRAT 153 3.48 375 3.84 0.36 0.45 0.65 H=NH 0.13 0.89
BV 151 0.70 366 0.72 0.02 0.87 0.39 H=NH 1.74 0.81
MKTV 171 0.61 348 0.57 -0.04 -1.27 0.20 H=NH 1.74 0.08
LIQUIDITY
CRAT 151 1.82 366 2.14 0.32 1.50 0.14 H=NH 1.65 0.10
QRAT 151 1.65 366 1.88 0.23 1.15 0.25 H=NH 1.44 0.15
LIQUIDITYRATIOX 151 1.65 366 1.88 0.23 1.15 0.25 H=NH 1.44 0.15
SHAREHOLDERSLIQUIDITYRATIOX 141 10.95 290 31.88 20.94 1.46 0.14 H=NH 2.76 0.01
SOLVENCYRATIOASSETBASED 151 0.00 366 0.00 0.00 -0.35 0.72 H=NH -2.19
0.03
PROFITABILITY
ROC 153 0.24 375 1.46 1.22 1.37 0.17 H=NH 2.09 0.04
ROE 153 3.79 375 -0.78 -4.57 ** -2.05 0.04 H>NH -1.67
0.09
PROFITMARGIN 151 0.20 354 -0.24 -0.43 ** -2.33 0.02 H>NH -4.26
0.00
RETURNONSHAREHOLDERSFUNDS 151 0.38 355 0.11 -0.27 -0.67 0.50 H=NH -1.37
0.17
RETURNONTOTALASSETS 153 1.07 375 -0.36 -1.42 -1.21 0.23 H=NH 0.96 0.34
EBITMARGIN 151 -0.18 365 -0.25 -0.07 -0.09 0.36 H=NH 1.06 0.29
EBITDAMARGIN 151 -0.08 365 -0.14 -0.06 -0.87 0.39 H=NH 0.28 0.78
IC
EBITINP 151 0.32 361 -3.84 -4.16 -0.59 0.55 H=NH 1.63 0.10
EBITDAINP 151 2.35 361 8.33 5.98 0.85 0.40 H=NH 3.25 0.00
INTERESTCOVERX 151 0.32 361 -3.84 -4.16 -0.59 0.55 H=NH 1.63 0.10
ASSETCOVERX 141 31.22 290 172.21 140.99 *** 2.61 0.01 H<NH 5.86 0.00
GROWTH OPPORTUNITY
MKTTBRAT 151 0.79 366 0.80 0.01 0.38 0.70 H=NH 2.36 0.02
DEBT MATURITY
STBORROW 151 0.61 366 0.80 0.20 *** 9.06 0.00 H<NH 8.16 0.00
LTBORROW 151 0.39 366 0.20 -0.20 *** -9.06 0.00 H>NH -8.16
0.00
FIRM SIZE
LNMKTCAP 131 4.67 219 3.76 -0.92 *** -5.70 0.00 H>NH -4.96
0.00
LNTOTSALES 151 10.30 365 9.72 -0.58 *** -5.94 0.00 H>NH -5.43
0.00
LNTOTASSETS 151 12.19 366 10.72 -1.47 *** -11.03
0.00 H>NH -9.97
0.00
FOREIGN EXCHANGE
FOREIGNSALES 53 0.24 45 0.26 0.02 0.27 0.79 H=NH 2.01 0.04
Source: author’s elaboration – AIDA database and Annual Reports for foreign sales measure.

94
Summary Mean difference test and Wilcoxon rank sum test
What can be concluded is that the most important factor that determine if an
Italian non-financial listed SME goes hedging is its size. Because in all the mean
difference tests is the most significant measure. Furthermore the debt maturity is
another element that could influence the likelihood of a SME to enters into a
derivative contract. The debt maturity proxies shows that firms facing long term
borrowing are more likely to use derivatives as hedging instruments.

95
5.3.1: Univariate logit regression: Italian non-financial listed SMEs
In the next table are presented the results from the univariate logit tests run
with all the independent variables. By doing this is given an estimated idea of the
effects of every individual explanatory variable in the decision of hedging, so can
be choosen with more confidence the most significant proxies to run multivariate
logit regression and construct the best model to explain the determinants of
hedging. The same test have been run to check the effect of every variable on
Hedgers, FX Hedgers and IR Hedgers with and without bias.
The leverage measure for hedgers is long term debt capital ratio because it is
significant and it has a positive coefficient. This variable is also the leverage
measure for IR derivative users because significant and with a positive coefficient.
About the FX derivative users, gearing ratio represents the leverage measure
because it is the only significant proxy but has to be taken into account that it has
a negative coefficient. In the previous section where have been discussed the
mean defference test, the table 29 showed that Hedgers and IR hedgers no bias
had this variable as significant variable and it was right with the literature.
Liquidity variables are the same for Hedgers and FX hedgers such as: current
ratio, quick ratio and liquidity ratio. Current ratio is one with the higest chi-square
and all of these variables have a negative coefficient as literature states. However
IR derivative users have not significant liquidity ratios. The mean difference test
showed that only Hedgers had significant liquidity variables.
Profitability variables for Users are mainly three: ROC, ROE and Profit Margin,
but the latter two are significant and have a positive coefficient. Also IR Hedgers
have ROE and Profit Margin as significant variables with a positive relationship
with the probability to hedge. At the same time for FX Hedgers have four
significant profitability variable: ROC, EBITDA Margin, EBIT Margin and Return on
Shareholders Funds. But the first three variables have a negative coefficient.
Hedgers and IR Hedgers haven’t Interest Coverage significant variables. At
the same time EBITDA Interest Payments is the FX Users significant variable and
has a negative coefficient as expected from the literature.
About the firm growth in anyone of the groups the market to book ratio is
significant but for the users and the FX derivative users it has a positive coefficient
as the literature states.

96
Debt maturity variables for all the dependent variables are the long term
borrow and short borrow are the most significant variable with a positive and
negative coefficients.
The natural log of total assets and the natural log of total sales are the
variables that can be used to capture the effect of the firm size, because they are
statistically significant with a positive coefficient.
As a overseas operation variable has been used the foreign sales. This
variable is statistically significant with a positive coefficient only for FX derivative
users.
To measure the risk of default have been used the variable z-score because it
is the only variable available in this category. Z-score is statistically significant in
all groups with a negative coefficient.

97
Tab. 34 - Univariate Logit of hedgers.
This table presents the results from univariate logit regression using a binary variable equal to 1 if firms use
derivatives and 0 if otherwise. The table presents the number of observations, coefficients, robust standard
errors, z-statistics, p-values and Wald chi-square statistics. ***, ** and * indicate the significance at 1%, 5%
and 10% respectively.
Variables N Coeff Robust
std.errors Z-stat
p-value
chi2
zsc 517 -0.324 *** 0.108 -3.00 0.00 8.99
LEVERAGE debtequity 517 0.002 0.004 0.44 0.66 0.19 debtcapital 517 0.002 0.008 0.20 0.84 0.04 ltdebtcapital 517 0.065 * 0.039 1.66 0.10 2.76 ltdebtequity 517 0.021 0.136 1.52 0.13 2.32 liabassets 517 0.198 0.374 0.53 0.60 0.28 gearingrat 528 -0.008 0.013 -0.64 0.52 0.41 bv 517 0.040 0.373 0.11 0.92 0.01 mktv 519 0.367 0.259 1.41 0.16 2.00
LIQUIDITY crat 517 -0.093 ** 0.046 -2.04 0.04 4.17 qrat 517 -0.086 * 0.047 -1.83 0.07 3.35 liquidityratiox 517 -0.086 * 0.047 -1.83 0.07 3.35
shareholdersliquidityratiox
431 -0.002 0.003 -0.84 0.40 0.70
solvencyratioassetbased
517 -18.600 35.891 -0.52 0.60 0.27
PROFITABILITY roc 528 -0.024 ** 0.010 -2.42 0.02 5.84 roe 528 0.008 ** 0.004 2.16 0.03 4.68 profitmargin 505 0.108 ** 0.054 2.00 0.05 3.98
returnonshareholdersfunds
506 0.013 0.023 0.57 0.57 0.32
returnontotalassets
528 0.005 0.006 0.86 0.39 0.73
ebitmargin 516 0.077 0.098 0.79 0.43 0.62 ebitdamargin 516 0.086 0.111 0.77 0.44 0.60
IC ebitinp 512 0.001 0.001 0.83 0.41 0.68 ebitdainp 512 -0.001 0.001 -1.22 0.22 1.48 interestcoverx 512 0.001 0.001 0.83 0.41 0.68 assetcoverx 431 -0.002 0.001 -1.12 0.26 1.27
GROWTH OP mkttbrat 517 0.209 0.363 0.58 0.57 0.33
DEBT MATURITY
stborrow 517 -3.183 *** 0.428 -7.44 0.00 55.40
ltborrow 517 3.183 *** 0.428 7.44 0.00 55.40
FIRM SIZE lnmktcap 350 0.431 *** 0.083 5.22 0.00 27.29 lntotsales 516 0.653 *** 0.103 6.33 0.00 40.03 lntotassets 517 0.773 *** 0.098 7.91 0.00 62.54
FOREIGN EXPOSURE
foreignsales 98 -0.025 0.450 -0.06 0.96 0.00
Source: author’s elaboration – AIDA database and Annual Reports for foreign sales measure.

98
Tab. 35 - Univariate Logit of IR (bias).
This table presents the results from univariate logit regression using a binary variable equal to 1 if firms hedge
with IR derivatives and 0 if otherwise. The table presents the number of observations, coefficients, robust
standard errors, z-statistics, p-values and Wald chi-square statistics. ***, ** and * indicate the significance at
1%, 5% and 10% respectively.
Variables N Coeff Robust
std.errors Z-stat
p-value
chi2
zsc 517 -0.348 *** -0.110 -3.16 0.00 9.96
LEVERAGE debtequity 517 -0.001 0.004 -0.27 0.79 0.07 debtcapital 517 0.003 0.008 0.43 0.67 0.19 ltdebtcapital 517 0.070 * 0.039 1.81 0.07 3.28 ltdebtequity 517 0.022 0.014 1.60 0.11 2.56 liabassets 517 0.123 0.384 0.32 0.75 0.10 gearingrat 528 -0.006 0.013 -0.43 0.67 0.19 bv 517 -0.350 0.380 -0.92 0.36 0.85 mktv 519 0.437 * 0.263 1.66 0.10 2.75
LIQUIDITY crat 517 -0.076 0.047 -1.62 0.11 2.62 qrat 517 -0.059 0.046 -1.27 0.20 1.62 liquidityratiox 517 -0.059 0.046 -1.27 0.20 1.62
shareholdersliquidityratiox
431 -0.002 0.002 -0.82 0.41 0.68
solvencyratioassetbased
517 14.632 36.432 0.40 0.69 0.16
PROFITABILITY roc 528 -0.014 0.010 -1.47 0.14 2.16 roe 528 0.009 ** 0.004 2.33 0.02 5.44 profitmargin 505 0.131 ** 0.060 2.16 0.03 4.66
returnonshareholdersfunds
506 0.016 0.025 0.66 0.51 0.43
returnontotalassets
528 0.010 0.006 1.56 0.12 2.43
ebitmargin 516 0.120 0.101 1.18 0.24 1.40 ebitdamargin 516 0.130 0.118 1.10 0.27 1.21
IC ebitinp 512 0.001 0.001 0.99 0.32 0.98 ebitdainp 512 -0.001 0.001 -1.20 0.23 1.44 interestcoverx 512 0.001 0.001 0.99 0.32 0.98 assetcoverx 431 -0.002 0.002 -0.99 0.32 0.98
GROWTH OP mkttbrat 517 -0.161 0.367 -0.44 0.66 0.19
DEBT MATURITY
stborrow 517 -3.435 *** 0.440 -7.81 0.00 60.96
ltborrow 517 3.435 *** 0.440 7.81 0.00 60.96
FIRM SIZE lnmktcap 350 0.431 *** 0.083 5.17 0.00 26.71 lntotsales 516 0.618 *** 0.104 5.94 0.00 35.31 lntotassets 517 0.789 *** 0.098 8.01 0.00 64.23
FOREIGN EXPOSURE
foreignsales 98 -0.132 0.548 -0.24 0.81 0.06
Source: author’s elaboration – AIDA database and Annual Reports for foreign sales measure.

99
Table 36 - Univariate Logit of FX (bias).
This table presents the results from univariate logit regression using a binary variable equal to 1 if firms hedge
with FX derivatives and 0 if otherwise. The table presents the number of observations, coefficients, robust
standard errors, z-statistics, p-values and Wald chi-square statistics. ***, ** and * indicate the significance at
1%, 5% and 10% respectively.
Variables N Coeff Robust
std.errors Z-stat
p-value
chi2
zsc 517 -0.265 * 0.151 -1.75 0.08 3.07
LEVERAGE debtequity 517 0.001 0.005 0.13 0.90 0.02 debtcapital 517 -0.003 0.014 -0.20 0.84 0.04 ltdebtcapital 517 0.019 0.055 0.34 0.74 0.11 ltdebtequity 517 0.006 0.015 0.44 0.66 0.19 liabassets 517 0.025 0.483 0.05 0.96 0.00 gearingrat 528 -0.075 * 0.039 -1.91 0.06 3.63 bv 517 0.702 0.590 1.19 0.23 1.42 mktv 519 -0.014 0.286 -0.05 0.96 0.00
LIQUIDITY crat 517 -0.114 ** 0.056 -2.03 0.04 4.11 qrat 517 -0.116 ** 0.059 -1.96 0.05 3.85 liquidityratiox 517 -0.116 ** 0.059 -1.96 0.05 3.85
shareholdersliquidityratiox
431 0.000 0.002 -0.07 0.94 0.00
solvencyratioassetbased
517 -65.880 58.810 -1.12 0.26 1.25
PROFITABILITY roc 528 -0.055 *** 0.014 -3.81 0.00 14.54 roe 528 0.007 0.005 1.38 0.17 1.91 profitmargin 505 0.015 0.076 0.20 0.84 0.04
returnonshareholdersfunds
506 0.073 ** 0.034 2.17 0.03 4.73
returnontotalassets
528 -0.009 0.008 -1.07 0.28 1.15
ebitmargin 516 -0.261 *** 0.101 -2.58 0.01 6.68 ebitdamargin 516 -0.307 *** 0.113 -2.71 0.01 7.37
IC ebitinp 512 0.000 0.001 -0.12 0.91 0.01 ebitdainp 512 -0.001 * 0.001 -1.67 0.09 2.80 interestcoverx 512 0.000 0.001 -0.12 0.91 0.01 assetcoverx 431 0.000 0.000 -0.96 0.34 0.93
GROWTH OP mkttbrat 517 0.602 0.588 1.02 0.31 1.05
DEBT MATURITY
stborrow 517 -1.709 *** 0.563 -3.04 0.00 9.22
ltborrow 517 1.709 *** 0.563 3.04 0.00 9.22
FIRM SIZE lnmktcap 350 0.419 *** 0.100 4.19 0.00 17.53 lntotsales 516 0.205 * 0.113 1.81 0.07 3.28 lntotassets 517 0.425 *** 0.080 5.34 0.00 28.48
FOREIGN EXPOSURE
foreignsales 98 1.882 * 1.039 1.81 0.07 3.28
Source: author’s elaboration – AIDA database and Annual Reports for foreign sales measure.
In the table below have been summarized in order by significance, all the
significant independent variables for each dependent binary variable. To build up
the multivariate regression for each proxy have been taken into account the
independent variables that the dependent variables have in common and at the
same time whose who have the high number of observations.27
27
The data sample consists of 528 firm-year observations.
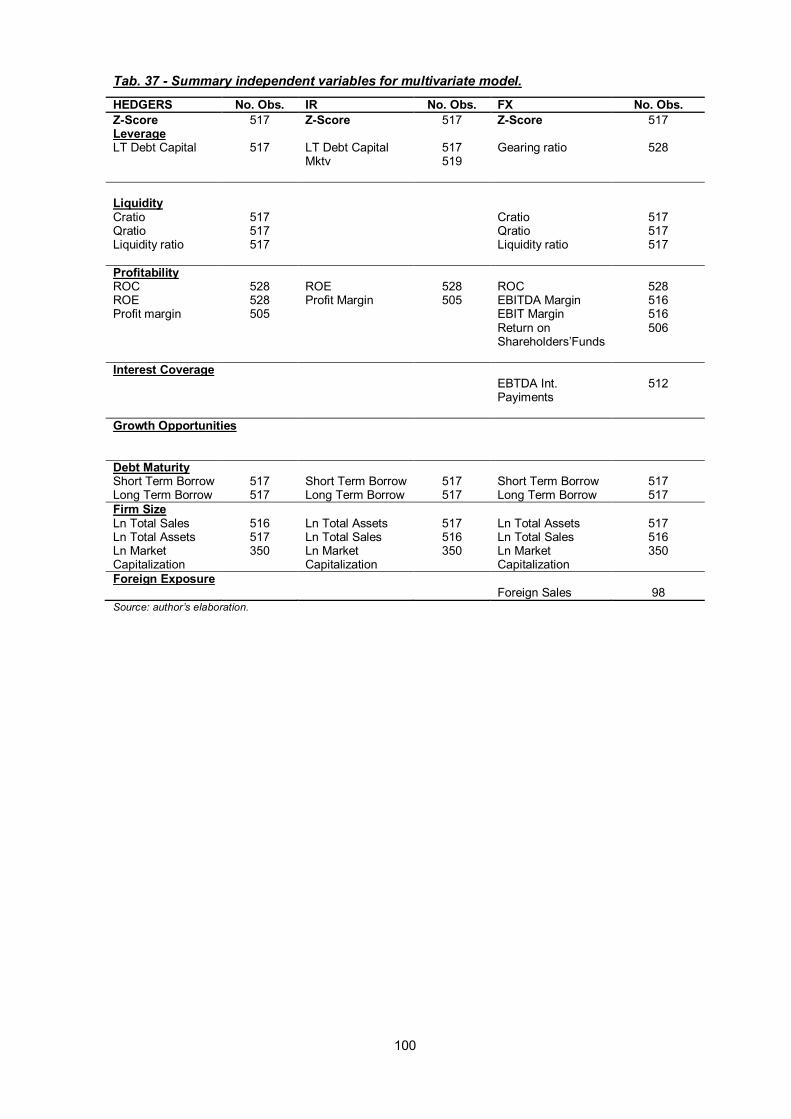
100
Tab. 37 - Summary independent variables for multivariate model.
HEDGERS No. Obs. IR No. Obs. FX No. Obs.
Z-Score 517 Z-Score 517 Z-Score 517 Leverage LT Debt Capital 517 LT Debt Capital 517 Gearing ratio 528 Mktv 519
Liquidity Cratio 517 Cratio 517 Qratio 517 Qratio 517 Liquidity ratio 517 Liquidity ratio 517
Profitability ROC 528 ROE 528 ROC 528 ROE 528 Profit Margin 505 EBITDA Margin 516 Profit margin 505 EBIT Margin 516 Return on
Shareholders’Funds 506
Interest Coverage EBTDA Int.
Payiments 512
Growth Opportunities
Debt Maturity Short Term Borrow 517 Short Term Borrow 517 Short Term Borrow 517 Long Term Borrow 517 Long Term Borrow 517 Long Term Borrow 517
Firm Size Ln Total Sales 516 Ln Total Assets 517 Ln Total Assets 517 Ln Total Assets 517 Ln Total Sales 516 Ln Total Sales 516 Ln Market Capitalization
350 Ln Market Capitalization
350 Ln Market Capitalization
350
Foreign Exposure Foreign Sales 98 Source: author’s elaboration.

101
5.3.2: Multivariate logit regression: Italian non-financial listed SMEs
To run the Multivariate logit regression have been used the following
independent variables:
Table 38 - Summary independent variables and relative literature.
Independent Variables Literature
Z-SCORE Altman (1968)
Leverage
LT Debt Capital Stulz (1996) Leland (1998)
Gearing ratio
Liquidity
CRatio Geczy et al. (1999) Bartrtam et al. (2009)
Liquidity Ratio
Profitability
ROC Glaum (2002) Bartram et al. (2009)
ROE
Interest Coverage
EBITDA Interest Payments Froot et al. (1993)
Growth Opportunities
Market To Book Ratio Myers (1977) Bressembinder (1991)
Froot et al. (1993)
Debt Maturity
Long Term Borrow Stulz (1996) Leland (1998)
Short Term Borrow
Firm Size
Ln Total Sales Graham and Rodgers (2002) Judge (2006)
Campello et al. (2011) Ln Total Assets
Foreign Exposure
Foreign Sales Smith and Stulz (1985) Allayannis and Ofek (2001)
Source: author’s elaboration.
The Univariate test explained the relationship between hedging and different
firms characteristics. The problem is that previous tests did not take into account
the interaction between different independent variables. For this motivation have
been run a logit regression between the probability of hedging and several

102
explanatory variables. The results in model 1-7 suggest that firm size is the most
significant variable to determine the probability for a firm to hedge. The variable
shows that there is a positive relationship between firm size and the probability to
hedge, therefore can be expected that bigger firms are more likely to hedge.
Foreign sales has been used as a proxy to measure the foreign exposure, but
in all the seven models it is statistically insignificant. Indeed, also in the mean
difference test and in the univariate logit regression this variable had not a
significant coefficient.
The variables that have been used as measures of leverage and debt maturity
are long term debt capital, gearing ratio, short and long term borrow. They show
that exist a positive relationship between them and the probability to hedge, that it
is consistent with what Stulz (1996) and Leland (1998) demonstrated on how
companies that hedge are able to reduce their likelihood of bankruptcy and
therefore are able to increase their level of debt. The results suggest that long
term borrow and leverage measures have a very high elasticity and odds values.
What said right now have been predicted also in the mean difference test where all
of these variables were significant and hedgers had an higher mean than the non-
hedgers.
As liquidity ratio proxy has been used the current ratio but is not statistically
significant in all the seven models. Infact looking back to the previous test, in
particular to the mean difference tests, is shown that it is significant but non-
hedgers presents an higher mean respect the hedgers, which suggests that more
liquid is a firm more likely it uses hedging substitutes than derivatives instruments.
The Interest Coverage ratio used is the EBITDA Interest Payments. It is
significant and has a negative coefficient as the theory of Froot et al. (1993) states.
With their research showed that hedging reduces cash flow volatility leading to
better rates for financing, therefore those companies with higher rates of volatilities
are more likely to use derivatives in order to reduce the financial risk and get an
easier and better conditions access for funding.
Profitability proxies employed to measure the relationship with the probability
of hedging are return on capital (ROC) and return on equity (ROE) and both of
them are not significant.
What argued above suggests that the decision of using derivatives as hedging
instruments is closely related to factors determining the firm size and the financial
distress situation measured by debt maturity proxies and leverage proxies.

103
The table 40 shows the relationship between the probability that a firm hedgs
with IR derivatives and proxies for incentives to hedge. The natural log of total
assets is the most significant variable, at the same time debt maturity (DM)
variables are important factors in determining whether to hedge with IR
derivatives. Long term debt borrow is the most important financial distress
measure when comparing the marginal effect across models, which gives strong
support to the notion that firm’s with more long term debt exposure are more likely
to hedge. According to Bessembinder (1991) and Myers (1977), the significantly
positive effects of leverage on the likelihood of hedging is consistent with the
notion that asymmetric information can lead to underinvestment when leverage is
high, resulting in increased agency costs which creates incentives for firms to
hedge.
Table 41 suggests that FX exposure is an important factor in determining
whether firms hedge FX risks. This supports the argument that firms with more
volatile income resulting from changes in the exchange rate are more likely to
hedge with FX derivatives, which is supported by the findings in the multivariate
logit regression, where three out of seven models show a positive and statistical
relationship between hedging and foreign sales. As demonstrated for hedgers and
IR hedgers, also for FX hedgers the firm size proxy used suggests the existence of
a positive relationship between firm size and the probability that a firm hedges and
that supports scale economies hypothesis. The liquidity measure used has been
the current ratio and in six out of seven model have a significant and negative
coefficient as the literature states. This shows that Italian non-financial listed SMEs
are less likely to hedge against foreign currency exposure by derivative
instruments when the company uses alternative instruments.
With the multivariate analysis have been tried to identify a model with all the
most significant variables. Hence, have been started creating the model with the
most significant variables and then based on trial and error method adding other
variables have been tried to find those that are meaningful to create the model
with the largest number of explanatory variables which reflects the best possible
decision of hedging. At the end have been obtained a model composed of two
independent variables statistically significant: long term debt capital and atural log
of total assets – Model 1.
As might be expected when this model has been applied to specific cases
as the probability of using foreign exchange derivatives or interest rate derivatives

104
have been found that some variables are no longer significant. For FX Hedgers
the long term debt capital is not statistically significant whilst for Hedgers and IR
Hedgers all these variables are significant.
Looking into the summary statistics of each table is possible to demonstrate
why model 5 has been choose as the best model. Taking into account the
summary table related to the probability of hedging (Use) model 1 correctly
predicted the 77.97% of the derivatives users and the 73.68% of the no derivatives
users. Thus the 23.71 % of the sample are misclassified cases. But the same
model at the same time when predicts the probability of hedging by IR its correctly
predicted the 81.13% would use derivatives and the 79.55% would not use those
instruments. So the 19.59% of the sample are misclassified cases. For the
probability of hedging instruments by FX the 98.96% of the sample are
misclassified cases so the 4.35% would use derivatives and 95.95% would not use
derivatives. IR Hedgers are those with the higher chi square (46.86%) meanwhile
the FX Hedgers have the lower chi square (13.47%), that could be explained by
the fact that the 87.93% of the Italian non-financial listed SMEs used IR
derivatives.
Is interesting focusing on the numbers of users and non-users displayed in
table 40 and 41. The table 28 shows the probability of hedging by IR derivative
and the data show that over 53 observation as users 43 are classified as users IR
derivatives and at the same time there are 10 misclassified non derivatives users.
At the same time is interesting to see that data about the FX hedgers in table 41
states that ove 23 observation as users only 1 is classified as user FX instruments
and the others 22 obseravtions are classified as non-users. In all the seven model
the sensitivity is very higher for IR derivative users compared with the Hedgers
and FX hedgers tables. But at the same time the specificity is higher in table 16
(FX hedgers). Therefore the misclassification presented by FX Hedgers is not
clearly clarified by the data present in the IR table. So could be assumed that
could be that the Italian sample from presents misclassification about the use of
foreign exchange derivatives as hedging instruments.

105
Tab. 39 - Logit Regression on the probability of hedging (Use).
This table presents logit regression estimates of the relation between the probability that a firm hedge as proxies for incentives to hedge (Panel A). The dependent variable equals 1 if
a firm provides qualitative information of any derivative use in the annual report, an 0 if otherwise. The model presents log of odds coefficients (Coef.), marginal effects (ME), odds
ratios and the respective p-values in parenthesis. The estimated coefficients give the change in the logit function given a change in the independent variable. The marginal effect
(elasticities) measures the actual change (percentage change) in the probability of hedging for 1% increase in the independent variable. The higher the elasticity’ value more important
is the variable in the model. The odds ratio gives the likelihood of Y = 1 when X is increased by one unit. The p-values are calculated using the robust (heteroscedastic) standard
errors. ***, ** and * indicate the significance at 1%, 5% and 10% respectively.
Indep.
Variables
MOD.1 MOD.2 MOD.3 MOD.4 MOD.5 MOD.6 MOD.7
Coeff. ME Odds Coeff. ME Odds Coeff. ME Odds Coeff. ME Odds Coeff. ME Odds Coeff. ME Odds Coeff. ME Odds
LT DEBT CAPITAL
2.354
(0.010)
***
0.282
(0.000)
***
10.528
(0.010)
***
GEARING RATIO
0.622
(0.010)
***
0.110
(0.000)
***
1.862
(0.010)
***
ROC
-
0.030
(0.342)
-
0.007
(0.343)
0.970
(0.342)
ROE
-
0.006
(0.696)
-
0.001
(0.697)
0.994
(0.696)
EBITDA INT PAY
-
0.571
(0.025)
**
-
0.014
(0.033)
**
0.945
(0.025)
**
ST BORROW
-
3.610
(0.008)
***
-
0.808
(0.006)
***
0.027
(0.008)
***
LT BORROW
3.610
(0.008)
***
0.808
(0.006)
***
36.970
(0.008)
***
MKTTBRAT
-
3.017
(0.244)
-
0.362
(0.303)
0.049
(0.244)
-
2.503
(0.330)
-
0.446
(0.344)
0.082
(0.330)
-
2.439
(0.304)
-
0.566
(0.303)
0.087
(0.304)
-
2.283
(0.343)
-
0.530
(0.342)
0.102
(0.343)
-
0.291
(0.610)
-
0.309
(0.610)
0.275
(0.610)
-
1.421
(0.564)
-
0.318
(0.566)
0.241
(0.564)
-
1.421
(0.564)
-
0.318
(0.566)
0.241
(0.564)
FOREIGN SALES
0.143
(0.837)
0.017
(0.838)
1.153
(0.837)
0.067
(0.919)
0.012
(0.919)
1.069
(0.919)
0.054
(0.922)
0.012
(0.922)
1.056
(0.922)
0.002
(0.997)
0.005
(0.997)
1.002
(0.997)
-
0.010
(0.855)
-
0.025
(0.855)
0.902
(0.855)
0.224
(0.736)
0.050
(0.736)
1.251
(0.736)
0.224
(0.736)
0.050
(0.736)
1.251
(0.736)
LN ASSETS
1.105
(0.020)
**
0.132
(0.115)
3.018
(0.020)
***
1.703
(0.000)
***
0.303
(0.000)
***
5.489
(0.000)
***
1.724
(0.000)
***
0.400
(0.000)
***
5.604
(0.000)
***
1.612
(0.000)
***
0.374
(0.000)
***
5.014
(0.000)
***
1.344
(0.003)
***
0.321
(0.003)
***
3.833
(0.003)
***
0.946
(0.061)
*
0.212
(0.062)
*
2.574
(0.061)
*
0.946
(0.061)
*
0.212
(0.062)
*
2.574
(0.061)
*
CRATIO 0.243
(0.170)
0.029
(0.205)
1.275
(0.170)
0.329
(0.100)
0.059
(0.078)
1.390
(0.100)
0.132
(0.461)
0.031
(0.459)
1.141
(0.461)
0.128
(0.463)
0.030
(0.461)
1.136
(0.463)
0.306
(0.228)
0.073
(0.221)
1.358
(0.228)
-
0.014
(0.945)
-
0.003
(0.946)
0.986
(0.945)
-
0.014
(0.945)
-
0.003
(0.946)
0.986
(0.945)

106
*
Z-SCORE 0.149
(0.660)
0.018
(0.679)
1.161
(0.660)
0.270
(0.428)
0.048
(0.435)
1.310
(0.428)
0.538
(0.133)
0.125
(0.133)
1.713
(0.133)
0.450
(0.230)
0.104
(0.229)
1.568
(0.230)
0.754
(0.051)
*
0.180
(0.057)
*
2.125
(0.051)
*
0.318
(0.343)
0.071
(0.345)
1.374
(0.343)
0.318
(0.343)
0.071
(0.345)
1.374
(0.343)
_cons
-
10.657
(0.065)
*
0.000
(0.065)
*
-
18.655
(0.003)
***
7.93-09
(0.003)
***
-
17.401
(0.002)
***
0.000
(0.002)
***
-
16.200
(0.003)
***
0.000
(0.003)
***
-
14..147
(0.006)
***
0.000
(0.006)
***
-
6.580
(0.296)
0.001
(0.296)
-
10.190
(0.079)
*
0.000
(0.079)
*
Source: author’s elaboration – AIDA database and Annual Reports for foreign sales measure.
Summary Statistic for Logit Regression.
Statistics MOD.1 MOD.2 MOD.3 MOD.4 MOD.5 MOD.6 MOD.7
N. 97 97 97 97 97 97 97
No. of Users 59 59 59 59 59 59 59
Classified as Users 46 51 45 46 50 46 46
Classified as Non-Users 13 8 14 13 9 913 13
Sensitivity 77.97% 86.44% 76.27% 77.97% 84.75% 77.97% 77.97%
No. of Non-Users 38 38 38 38 38 38 38
Classified as users 10 14 18 19 16 12 12
Classified as Non-Users 28 24 20 19 22 26 26
Specificity 73.68% 63.16% 52.63% 50.00% 57.89% 68.42% 68.42%
Correctly Specified 76.29% 77.32% 67.01% 67.01% 74.23% 74.23% 74.23%
Chi-Square 33.62% 32.32% 22.48% 21.71% 31.19% 29.78% 29.78%
Probability 0.0000 0.0000 0.0010 0.0014 0.0000 0.0000 0.0000
Pseudo R-Square 0.2589 0.2488 0.1731 0.1671 0.2401 0.2293 0.2293
Log pseudo
likelihood -48.131512 -48.783157 -53.703583 -54.089008 -49.351322 -50.054822 -50.054822
Source: author’s elaboration – AIDA database and Annual Reports for foreign sales measure.

107
Tab. 40 - Logit Regression on the probability of hedging (IR).
This table presents logit regression estimates of the relation between the probability that a firm hedge with IR derivatives as proxies for incentives to hedge. The dependent variable
equals 1 if a firm provides qualitative information of any derivative use in the annual report, an 0 if otherwise. The model presents log of odds coefficients (Coef.), marginal effects
(ME), odds ratios and the respective p-values in parenthesis. The estimated coefficients give the change in the logit function given a change in the independent variable. The marginal
effect (elasticities) measures the actual change (percentage change) in the probability of hedging for 1% increase in the independent variable. The higher the elasticity’ value more
important is the variable in the model. The odds ratio gives the likelihood of Y = 1 when X is increased by one unit. The p-values are calculated using the robust (heteroscedastic)
standard errors. ***, ** and * indicate the significance at 1%, 5% and 10% respectively.
Indep.
Variables
MOD.1 MOD.2 MOD.3 MOD.4 MOD.5 MOD.6 MOD.7
Coeff. ME Odds Coeff. ME Odds Coeff. ME Odds Coeff. ME Odds Coeff. ME Odds Coeff. ME Odds Coeff. ME Odds
LT DEBT CAPITAL
2.694
(0.005)
***
0.348
(0.000)
***
14.792
(0.005)
***
GEARING RATIO
0.479
(0.054)
*
0.104
(0.020)
**
1.614
(0.054)
*
ROC
-
0.022
(0.506)
-
0.005
(0.506)
0.977
(0.506)
ROE 0.006
(0.687)
0.001
(0.687)
1.006
(0.687)
EBITDA INT PAY
-
0.035
(0.122)
-
0.008
(0.127)
0.964
(0.122)
ST BORROW
-
4.287
(0.003)
***
-
1.029
(0.002)
***
0.013
(0.003)
***
LT BORROW
4.287
(0.003)
***
1.029
(0.002)
***
72.762
(0.003)
***
MKTTBRAT
-
1.679
(0.503)
-
0.217
(0.533)
0.186
(0.503)
-
1.546
(0.533)
-
0.337
(0.539)
0.212
(0.533)
-
1.594
(0.490)
-
0.392
(0.491)
0.202
(0.490)
-
1.854
(0.437)
-
0.456
(0.437)
0.156
(0.437)
-
0.815
(0.736)
-
0.202
(0.736)
0.442
(0.736)
-
0.419
(0.867)
-
0.100
(0.868)
0.657
(0.867)
-
0.419
(0.867)
-
0.100
(0.868)
0.657
(0.867)
FOREIGN SALES
-
0.092
(0.879)
-
0.011
(0.879)
0.912
(0.879)
-
0.127
(0.822)
-
0.027
(0.822)
0.880
(0.822)
-
0.128
(0.805)
-
0.031
(0.805)
0.879
(0.805)
-
0.153
(0.771)
-
0.037
(0.771)
0.857
(0.771)
-
0.235
(0.653)
-
0.058
(0.654)
0.790
(0.653)
0.019
(0.974)
0.004
(0.974)
1.019
(0.974)
0.019
(0.974)
0.004
(0.974)
1.019
(0.974)
LN ASSETS
1.738
(0.001)
***
0.224
(0.056)
**
5.689
(0.001)
***
2.218
(0.000)
***
0.484
(0.000)
***
9.197
(0.000)
***
2.269
(0.000)
***
0.558
(0.000)
***
9.674
(0.000)
***
2.097
(0.000)
***
0.516
(0.000)
***
8.148
(0.000)
***
1.981
(0.000)
***
0.491
(0.000)
***
7.251
(0.000)
***
1.499
(0.006)
***
0.360
(0.006)
***
4.477
(0.006)
***
1.499
(0.006)
***
0.360
(0.006)
***
4.477
(0.006)
***
CRATIO 0.294
(0.134)
0.038
(0.171)
1.343
(0.134)
0.347
(0.107)
0.075
(0.086)
*
1.416
(0.107)
0.173
(0.378)
0.042
(0.376)
1.189
(0.378)
0.179
(0.347)
0.044
(0.345)
1.196
(0.347)
0.262
(0.272)
0.065
(0.269)
1.300
(0.272)
-
0.030
(0.899)
-
0.007
(0.899)
0.969
(0.899)
-
0.030
(0.899)
-
0.007
(0.899)
0.969
(0.899)
Z-SCORE
0.337
0.043
1.401
0.398
0.086
1.488
0.654
0.161
1.924
0.418
(0.292)
0.102
(0.292)
1.519
(0.292)
0.749
0.185
2.115
0.529
(0.135)
0.127
(0.138)
1.697
(0.135)
0.529
(0.135)
0.127
(0.138)
1.697
(0.135)

108
(0.354)
(0.416)
(0.354)
(0.262)
(0.273)
(0.262)
(0.096)
*
(0.096)
*
(0.096)
*
(0.056)
*
(0.058)
*
(0.056)
*
_cons
-
19.561
(0.002)
***
3.2e-09
(0.002)
***
-
25.479
(0.000)
***
8.6e-12
(0.000)
***
-
24.723
(0.000)
***
1.8e-11
(0.000)
***
-
22.444
(0.000)
***
1.8e-10
(0.000)
***
-
22.097
(0.000)
***
2.5e-10
(0.000)
***
-
13.586
(0.038)
**
1.3e-06
(0.038)
**
-
17.874
(0.004)
***
1.7e-08
(0.004)
***
Source: author’s elaboration – AIDA database and Annual Reports for foreign sales measure.
Summary Statistic for Logit Regression.
Statistics MOD.1 MOD.2 MOD.3 MOD.4 MOD.5 MOD.6 MOD.7
N. 97 97 97 97 97 97 97
No. of Users 53 53 53 53 53 53 53
Classified as Users 43 44 43 43 45 43 43
Classified as Non-Users 10 9 10 10 8 10 10
Sensitivity 81.13% 83.82% 81.13% 81.13% 84.91% 81.13% 81.13%
No. of Non-Users 44 44 44 44 44 44 44
Classified as users 9 8 13 12 13 11 11
Classified as Non-Users 35 36 31 32 31 33 33
Specificity 79.55% 81.82% 70.45% 72.73% 70.45% 75.00% 75%
Correctly Specified 80.41% 82.47% 76.29% 77.32% 78.35% 78.35% 78.35%
Chi-Square 46.87% 40.06% 33.82% 33.54% 37.78% 43.82% 43.82%
Probability 0.0000 0.0000 0.0000 0.0000 0.0000 0.0000 0.0000
Pseudo R-Square 0.3507 0.2998 0.2531 0.2510 0.2827 0.3279 0.3279
Log pseudo likelihood -43.381332 -46.787286 -49.907269 -50.048889 -47.927789 -44.904983 -44.904983
Source: author’s elaboration – AIDA database and Annual Reports for foreign sales measure.

109
Tab. 41 - Logit Regression on the probability of hedging (FX).
This table presents logit regression estimates of the relation between the probability that a firm hedge with FX exposure as proxies for incentives to hedge. The dependent variable
equals 1 if a firm provides qualitative information of any derivative use in the annual report, an 0 if otherwise. The model presents log of odds coefficients (Coef.), marginal effects
(ME), odds ratios and the respective p-values in parenthesis. The estimated coefficients give the change in the logit function given a change in the independent variable. The marginal
effect (elasticities) measures the actual change (percentage change) in the probability of hedging for 1% increase in the independent variable. The higher the elasticity’ value more
important is the variable in the model. The odds ratio gives the likelihood of Y = 1 when X is increased by one unit. The p-values are calculated using the robust (heteroscedastic)
standard errors. ***, ** and * indicate the significance at 1%, 5% and 10% respectively.
Indep.
Variables
MOD.1 MOD.2 MOD.3 MOD.4 MOD.5 MOD.6 MOD.7
Coeff. ME Odds Coeff. ME Odds Coeff. ME Odds Coeff. ME Odds Coeff. ME Odds Coeff. ME Odds Coeff. ME Odds
LT DEBT CAPITAL
-
0.074
(0.556)
-
0.011
(0.553)
0.928
(0.556)
GEARING RATIO
0.981
(0.698)
-
0.002
(0.696)
0.981
(0.698)
ROC
-
0.079
(0.054)
*
-
0.011
(0.048)
**
0.924
(0.054)
*
ROE
-
0.026
(0.194)
-
0.003
(0.171)
0.974
(0.194)
EBITDA INT PAY
-
0.076
(0.038)
**
-
0.009
(0.007)
***
0.926
(0.038)
**
ST BORROW
-
3.884
(0.008)
***
-
0.555
(0.009)
***
0,020
(0.008)
***
LT BORROW
3.884
(0.008)
***
0.555
(0.009)
***
48.644
(0.008)
***
MKTTBRAT 1.115
(0.733)
0.170
(0.732)
3.051
(0.733)
2.315
(0.794)
0.128
(0.793)
2.315
(0.794)
0.897
(0.778)
0.129
(0.778)
2.454
(0.778)
2.090
(0.555)
0.301
(0.548)
8.089
(0.555)
0.944
(0.772)
0.113
(0.774)
2.571
(0.772)
0.293
(0.932)
0.041
(0.932)
1.341
(0.932)
0.293
(0.932)
0.041
(0.932)
1.341
(0.932)
FOREIGN SALES
1.734
(0.127)
0.264
(0.137)
5.666
(0.127)
6.085
(0.112)
0.277
(0.123)
6.085
(0.112)
1.915
(0.083)
*
0.275
(0.090)
*
6.791
(0.083)
*
1.871
(0.102)
0.270
(0.110)
6.499
(0.102)
1.941
(0.114)
0.234
(0.151)
6.971
(0.114)
2.595
(0.034)
**
0.371
(0.044)
**
13.406
(0.034)
***
2.595
(0.034)
***
0.371
(0.044)
**
13.406
(0.034)
**
LN ASSETS
0.740
(0.114)
0.113
(0.107)
2.097
(0.114)
2.018
(0.131)
0.107
(0.125)
2.018
(0.131)
1.152
(0.037)
**
0.165
(0.031)
**
3.164
(0.037)
**
0.995
(0.064)
*
0.143
(0.051)
*
2.706
(0.064)
*
0.832
(0.106)
0.100
(0.086)
*
2.298
(0.106)
-
0.213
(0.702)
-
0.030
(0.701)
0.808
(0.702)
-
0.213
(0.702)
-
0.030
(0.701)
0.808
(0.702)
CRATIO -
0.690
-
0.105
0.501
0.503
-
0.105
0.503
-
0.692
-
0.099
0.500
-
0.781
-
0.112
0.457
-
0.586
-
0.070
0.556
-
0.878
-
0.125
0.415
-
0.878
-
0.125
0.415
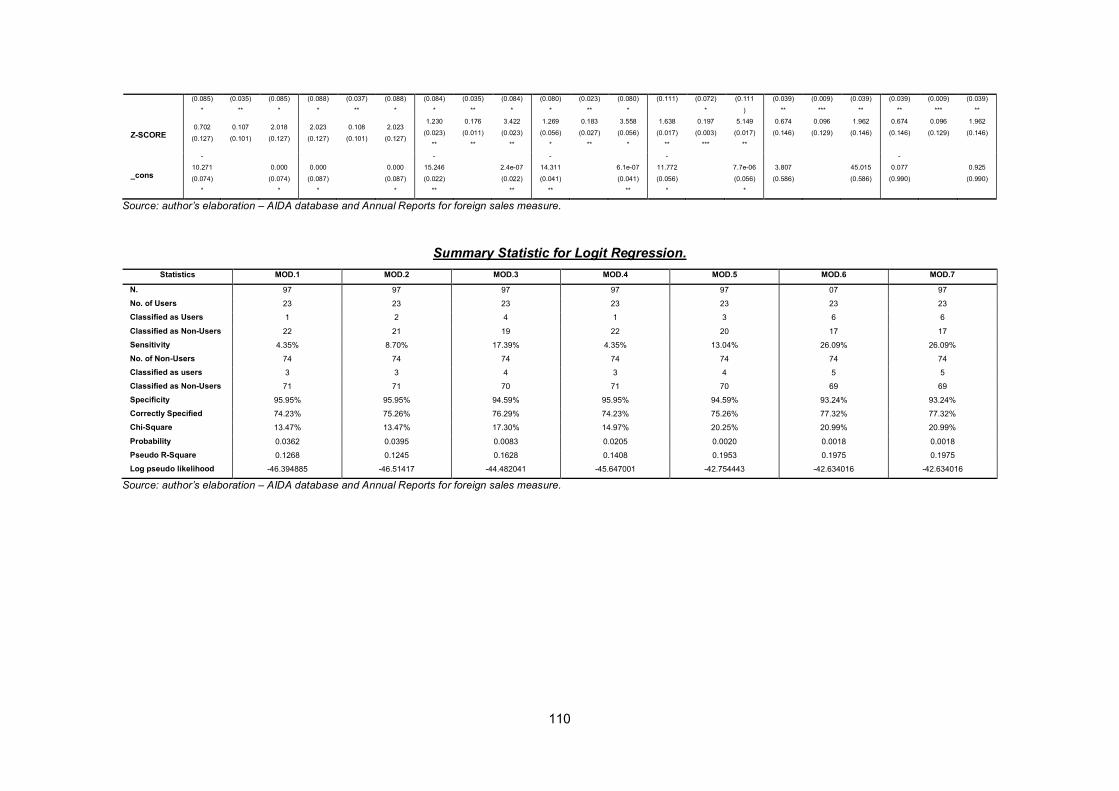
110
(0.085)
*
(0.035)
**
(0.085)
*
(0.088)
*
(0.037)
**
(0.088)
*
(0.084)
*
(0.035)
**
(0.084)
*
(0.080)
*
(0.023)
**
(0.080)
*
(0.111)
(0.072)
*
(0.111
)
(0.039)
**
(0.009)
***
(0.039)
**
(0.039)
**
(0.009)
***
(0.039)
**
Z-SCORE 0.702
(0.127)
0.107
(0.101)
2.018
(0.127)
2.023
(0.127)
0.108
(0.101)
2.023
(0.127)
1.230
(0.023)
**
0.176
(0.011)
**
3.422
(0.023)
**
1.269
(0.056)
*
0.183
(0.027)
**
3.558
(0.056)
*
1.638
(0.017)
**
0.197
(0.003)
***
5.149
(0.017)
**
0.674
(0.146)
0.096
(0.129)
1.962
(0.146)
0.674
(0.146)
0.096
(0.129)
1.962
(0.146)
_cons
-
10.271
(0.074)
*
0.000
(0.074)
*
0.000
(0.087)
*
0.000
(0.087)
*
-
15.246
(0.022)
**
2.4e-07
(0.022)
**
-
14.311
(0.041)
**
6.1e-07
(0.041)
**
-
11.772
(0.056)
*
7.7e-06
(0.056)
*
3.807
(0.586)
45.015
(0.586)
-
0.077
(0.990)
0.925
(0.990)
Source: author’s elaboration – AIDA database and Annual Reports for foreign sales measure.
Summary Statistic for Logit Regression.
Statistics MOD.1 MOD.2 MOD.3 MOD.4 MOD.5 MOD.6 MOD.7
N. 97 97 97 97 97 07 97
No. of Users 23 23 23 23 23 23 23
Classified as Users 1 2 4 1 3 6 6
Classified as Non-Users 22 21 19 22 20 17 17
Sensitivity 4.35% 8.70% 17.39% 4.35% 13.04% 26.09% 26.09%
No. of Non-Users 74 74 74 74 74 74 74
Classified as users 3 3 4 3 4 5 5
Classified as Non-Users 71 71 70 71 70 69 69
Specificity 95.95% 95.95% 94.59% 95.95% 94.59% 93.24% 93.24%
Correctly Specified 74.23% 75.26% 76.29% 74.23% 75.26% 77.32% 77.32%
Chi-Square 13.47% 13.47% 17.30% 14.97% 20.25% 20.99% 20.99%
Probability 0.0362 0.0395 0.0083 0.0205 0.0020 0.0018 0.0018
Pseudo R-Square 0.1268 0.1245 0.1628 0.1408 0.1953 0.1975 0.1975
Log pseudo likelihood -46.394885 -46.51417 -44.482041 -45.647001 -42.754443 -42.634016 -42.634016
Source: author’s elaboration – AIDA database and Annual Reports for foreign sales measure.

111
Summary Multivariate Logit Regression
Table 42 shows the estimation results for the extent to which firms hedge their
risk exposure with derivatives instruments as users (USE), interest rate (IR) and
foreign exchange (FX) hedgers. It shows the seven different models specifications
that have been obtained from different combinations of explanatory variables. All
seven models estimated the three different dependent variables, the hedgers, the
interest rate hedgers and the foreign exchange hedgers, and include one at a time
measures such as interest coverage ratios, leverage ratio, profitability ratios, debt
maturity ratios, growth opportunity ratio, financial price risk ratio and overseas
operation ratio, firm size ratios, hedging substitutes ratios and likelihood of default
ratio.
Previous tables showed that when the seven model have been run testing the
IR hegers they get an higher chi-squarecomparted to the others. So it is belived
that IR hedgers better capture the decision to hedge. Data suggest that estimates
can be quite similar for Hedgers and IR hedgers because they have mainly the
same significant variables. That could be explained because hedgers, as
dependent variable, includes all those firms that used all types of derivatives and
those who do not, further has to be taken into account that the Italian sample is
characterized by the fact that 87.93% of the derivative users disclosed in their
annual reports that they used IR derivatives. Meanwhile all the three dependent
variables have in common the fact the most important proxy of financial distress is
debt maturity as long term debt borrow, that has the highest coefficient.
Furthermore it suggest that the Italian non-fianancial listed SMEs are more likely to
use derivatives instruments on long term basis. That could be explained by high
costs that they have to support entering into a derivative contract.

112
Tab. 42 - Empirical results: summary table about the corporate demand for financial derivatives
Indep.
Variables
MOD.1 MOD.2 MOD.3 MOD.4 MOD.5 MOD.6 MOD.7
USE IR FX USE IR FX USE IR FX USE IR FX USE IR FX USE IR FX USE IR FX
LT DEBT CAPITAL
2.354
(0.010)
***
2.694
(0.005)
***
-
0.074
(0.556)
GEARING RATIO
0.622
(0.010)
***
0.479
(0.054)
*
0..981
(0.698)
ROC
-
0.030
(0.342)
-
0.022
(0.506)
-
0.079
(0.054)
*
ROE
-
0.006
(0.696)
0.006
(0.687)
-
0.026
(0.194)
EBITDA INT PAY
-
0.571
(0.025)
**
-
0.035
(0.122)
-
0.076
(0.038)
**
ST BORROW
-
3.610
(0.008)
***
-
4.287
(0.003)
***
-
3.884
(0.008)
***
LT BORROW
3.610
(0.008)
***
4.287
(0.003)
***
3.884
(0.008)
***
MKTTBRAT
-
3.017
(0.244)
-
1.679
(0.503)
1.115
(0.733)
-
2.503
(0.330)
-
1.546
(0.533)
2.315
(0.794)
-
2.439
(0.304)
-
1.594
(0.490)
0.897
(0.778)
-
2.283
(0.343)
-
1.854
(0.437)
2.090
(0.555)
-
0.291
(0.610)
-
0.815
(0.736)
0.944
(0.772)
-
1.421
(0.564)
-
0.419
(0.867)
0.293
(0.932)
-
1.421
(0.564)
-
0.419
(0.867)
0.293
(0.932)
FOREIGN SALES
0.143
(0.837)
-
0.092
(0.879)
1.734
(0.127)
0.067
(0.919)
-
0.127
(0.822)
6.085
(0.112)
0.054
(0.922)
-
0.128
(0.805)
1.915
(0.083)
*
0.002
(0.997)
-
0.153
(0.771)
1.871
(0.102)
-
0.010
(0.855)
-
0.235
(0.653)
1.941
(0.114)
0.224
(0.736)
0.019
(0.974)
2.595
(0.034)
**
0.224
(0.736)
0.019
(0.974)
2.595
(0.034)
***
LN ASSETS
1.105
(0.020)
**
1.738
(0.001)
***
0.740
(0.114)
1.703
(0.000)
***
2.218
(0.000)
***
2.018
(0.131)
1.724
(0.000)
***
2.269
(0.000)
***
1.152
(0.037)
**
1.612
(0.000)
***
2.097
(0.000)
***
0.995
(0.064)
*
1.344
(0.003)
***
1.981
(0.000)
***
0.832
(0.106)
0.946
(0.061)
*
1.499
(0.006)
***
-
0.213
(0.702)
0.946
(0.061)
*
1.499
(0.006)
***
-
0.213
(0.702)
CRATIO 0.243
(0.170)
0.294
(0.134)
-
0.690
(0.085)
*
0.329
(0.100)
0.347
(0.107)
0.503
(0.088)
*
0.132
(0.461)
0.173
(0.378)
-
0.692
(0.084)
*
0.128
(0.463)
0.179
(0.347)
-
0.781
(0.080)
*
0.306
(0.228)
0.262
(0.272)
-
0.586
(0.111)
-
0.014
(0.945)
-
0.030
(0.899)
-
0.878
(0.039)
**
-
0.014
(0.945)
-
0.030
(0.899)
-
0.878
(0.039)
**
Z-SCORE 0.149
(0.660)
0.337
(0.354)
0.702
(0.127)
0.270
(0.428)
0.398
(0.262)
2.023
(0.127)
0.538
(0.133)
0.654
(0.096)
*
1.230
(0.023)
**
0.450
(0.230)
0.418
(0.292)
1.269
(0.056)
*
0.754
(0.051)
*
0.749
(0.056)
*
1.638
(0.017)
**
0.318
(0.343)
0.529
(0.135)
0.674
(0.146)
0.318
(0.343)
0.529
(0.135)
0.674
(0.146)
_cons -
10.657
-
19.561
-
10.271
-
18.655
-
25.479
0.000
-
17.401
-
24.723
-
15.246
-
16.200
-
22.444
-
14.311
-
14..147
-
22.097
-
11.772
-
6.580
-
13.586
3.807
-
10.190
-
17.874
-
0.077

113
(0.065)
*
(0.002)
***
(0.074)
*
(0.003)
***
(0.000)
***
(0.087)
*
(0.002)
***
(0.000)
***
(0.022)
**
(0.003)
***
(0.000)
***
(0.041)
**
(0.006)
***
(0.000)
***
(0.056)
*
(0.296)
(0.038)
**
(0.586)
(0.079)
*
(0.004)
***
(0.990)
Source: author’s elaboration – AIDA database and Annual Reports for foreign sales measure.

114
5.4: United Kingdom vs Italian non-financial listed SMEs
This analysis attempted to track the utilization of derivatives instruments by UK and
Italian non-financial listed Small and Medium Enterprises (SMEs) during the time period
2005-2012. The UK sample is composed by 1328 firm-year observations meanwhile the
Italian has 528 firm-year observations.
In figure 1 is shown that the use of derivatives was most common among medium
firms – almost 90 percent, followed by small and micro companies. Indeed, was expected
this positive relationship between size and derivative usage because the derivative
markets show significant economies of scale. Those results are consistent with the
findings of Bodnar et al. (1995) and Berkman et al. (1997). But has to be taken into
account that Warmer’s in 1977 with his research demonstrate that between direct costs of
bankruptcy and firm size there is a negative relationship.
By industry sector28, the use of derivatives by Italian SMEs was most common among
manufacturing companies (36.21%), followed by professional, scientific and technical
activities (17.24%) and industrial and commercial firms (13.22%). About the UK sample it
is characterized by 22.57% of manufacturing companies that used derivatives instruments,
the 21.18% of the hedger were information and commercial firms meanwhile the 19.10%
were professional, scientific and technical activities. Therefore as could be expected in
both samples manufacturing firms indicated a higher usage of derivatives, and this could
be explained by the fact that manufacturing companies are more exposed to foreign
exchange risks. UK small and medium enterprises are on average more exposed to
foreign exchange risk than Italian, because in the European Union they trade with their
national currency that is sterling and not Euro.
Another important fact that has to be taken into account matching the UK and Italian
samples is what have been reported in the tables referring to the hedging activities and
types of derivatives used by the UK and Italian non-financial listed SMEs. Indeed, data
show that the 87.93% of the Italian derivative users disclosed in their annual reports that
they used interest rate derivatives and the most common type has been interest rate swap
(IRS). Meanwhile, the 55.21% of United Kingdom firms disclosed in their annual reports
that they hedged by IR derivatives and 51.74% hedged by FX derivatives. Therefore there
is a substantial difference in hedging type between the Italian and the UK small and
28
See Annex E: Standard Industrial Classification of Economic Activities SIC 2007

115
medium enterprises, furthermore the univariate and the multivariate results strengthened
that assumptions.
The summary multivariate logit regression tables shows that firm size is statistically
significant with a positive relationship in both of the samples, thus larger Italian and UK
small and medium enterprises are more likely to hedge. But, in almost all UK models the
foreign sales and the liquidity measures are statistical significant variables, the first with a
positive coefficient and the second with a negative one. Those explanatory variables in the
Italian sample are never significant, except in few exceptional models. Also the market to
book ratio is statistically significant only in the UK sample but with a negative coefficient.
About the financial distress measures, the results suggest that the two best proxies in both
samples are leverage and debt maturity. But the Italian multivariate logit regression used
as leverage variables the long term debt and the gearing ratio which have a statistical
positive coefficients for two dependent variables (Hedgers and IR Hedgers), meanwhile
the UK model used the market value leverage who had a positive and statistical significant
coefficient when the dependent variables were Hedgers and IR Hedgers and a statistical
high negative coefficient when FX Hedgers are tested. The other explanatory proxies such
as interest coverage ratios and profitability ratios in both samples had very low coefficient.

116
Fig.1 - Derivative usage by SMEs in United Kingdom and Italy
Micro, Small and Medium indicates the percentage of firms that disclosed in their annual reports that used derivatives according to firm size, where a turnover value equal or less than
€ 2 million (£ 2 million) was considered micro, more than € 2 million (£ 2 million) but equal or less than € 10million (£ 9million) was considered small and more than € 10 (£ 9 million)
equal or less than € 50 (£ 43 million) million was considered medium.
Source: author’s elaboration –Annual Reports data, STATA..
020
40
60
80
100
Percent
Micro Small Medium1.5 2.5
020
40
60
80
100
Percent
Micro Small Medium1.5 2.5
117
CONCLUSIONS
This research employs two unique datasets to examine why and how United
Kingdom and Italian non-financial listed Small and Medium Enterprises (SMEs)
used financial derivative instruments such as currency derivatives, interest rate
derivatives and commodity derivatives, during the time period 2005-2012.
From the European Definition of SMEs using Bureaux Van Dijk databases –
FAME (UK) AIDA (Italy) – have built up the two samples and collected all the
necessary variables to perform the calculation needed for this research.
Meanwhile, hedging data have been handily collected from the annual reports
published on the websites of each firm, and for the Italian sample have been
handily collected data about the overseas operations.
The univariate and multivariate logit tests help to understand which are the
main factors that could lead an UK and an Italian non-financial listed small and
medium enterprise to hedge with derivatives. The firm size proxies that have been
used are statistically significant in all of the models in both samples, and it could
be explained as: the high costs related to the use of derivatives are unaffordable
for small businesses and they play a key role in decisions to adopt a risk
management strategy that includes the use of these instruments. The findings are
in line with the results obtained by Froot et al. (1993), Nance et al. (1993) and
Judge (2006b).
The UK sample shows that foreign sale is a significant variable in almost all
the models as foreign risk and overseas operation measure. Furthermore, it has a
higher level of significance being 1% in all those models having FX hedgers as
dependent variable. This is consistent with Berkman et Bradbourgy (1996) stated
in their research. Meanwhile, in the Italian sample foreign sale variable is not
significant in almost all of the models, that could be explained because only the
37% of the firms in the sample disclosed in their annual reports the use of FX
derivatives, furthermore Italian companies trade in the European market with their
national currency that is Euro.
The interest rate exposure is relevant in both samples but it is higher in the
Italian. The proxies used to test this phenomenon are leverage and debt maturity.
For the Italian sample the debt maturity and long term debt over capital are the
best variables that explain the relationship between financial distress and the use
of interest rate derivatives by Italian SMEs. Instead, market value leverage is the

118
best variable with debt maturity in the UK sample that best explain this
relationship. The meaningfulness of these variables can be justified by the fact that
SMEs have an high long term debt exposure therefore are more likely to face
interest risks exposure. And an higher interest exposure lead to higher borrow
costs, which in turn affect the company leverage and higher is its leverage
exposure higher is its probability to incur into a financial distress situation.
Therefore, bigger SMEs are more likely to hedge against this type of risk. Here is
confirmed what stated by Smith and Stulz (1985) about the financial distress, with
what Campello, Lin Ma and Zou (2011), Bartram et al. (2009) and Graham and
Roger (2002) argued about leverage ratio.
The Froot, Scharfestein and Stein (1993) theory about the growth opportunities
and the likelihood to hedge has been tested using the market to book ratio. This
variable in the Italian sample was not significant in all the model, meanwhile in the
UK sample it was statistically significant with a negative coefficient instead of
positive.
Some analogy can be found comparing the results with those obtained in
previous studies about European countries. Particularly, the firm size is a key
variable because the benefits derived from economies of scale are a huge
incentive for the adoption of derivatives by SMEs.
In contrast to the analysis carried out in the United States, in the Italian sample
the market to book ratio is not significant in all the models, meanwhile in the UK
sample it is statistically significant with a negative coefficient. Further, compared to
other European research in the Italian sample the exchange rate proxies and the
substitute of hedging variables used have no significant coefficients in all of the
models tested.
While in both samples, the variables used to measure interest rate such as
leverage and debt maturity are statistically significant with a high coefficient.
The most discriminating variable in the decision to use derivatives in the UK
and Italian samples is the firm size, because is the only factor that in all the
models is statistically significant with the higher marginal effect: larger is the firms
higher is the probability that it is going to hedge by derivative instruments.
The unique aspect of this research is that it investigates this important issue of
Italian and United Kingdom non-financial listed Small and Medium Enterprises.
However it should be noted that a further research is required in this area,

119
especially estimating and managing interest rate and foreign exchange exposure
and their determinants of UK and Italian firms.

120
REFERENCES
Alkeback and Hagelin (1999), “Derivatives usage by non-financial firms in Sweden
with an international comparison”, Journal of International Financial Management
and Accounting, vol. 10 pp. 105-120.
Allayannis. and Ofek (2001), “Exchange rate exposure, hedging, and the use of
foreign currency derivatives”, Journal of International Money and Finance, vol. 20
pp. 273-296.
Allayannis and Weston (2001), “Exchange-Rate hedging: financial versus
operational strategies”, The American Economic Review, vol. 95 pp. 391-395.
Altman (1968), “Financial Ratios, Discriminant Analysis and the Prediction of
Corporate Bankruptcy”, The Journal of Finance, vol. 23 pp. 589-609
Anolli e Gualtieri (1999), “La misurazione del rischio di credito nella gestione delle
banche”, Il Mulino, Bologna.
Bartram, Brown and Fehle (2009), “International evidence on financial derivatives
usage”, Financial Management, vol. 38 pp.185-206.
Bartram, Brown and Conrad (2011), “The effects of derivatives on firm risk and
value”, Journal of Finance and Quantitative Analysis, vol. 46 pp. 967-999.
Berkman and Bradbury (1996), “Empirical evidence on corporate use of
derivatives”, Financial Management, vol. 25 pp. 5-13.
Bernstein. (1998), “Against the Gods. The remarkable story of risk”, Jhon Wiley &
Sons, Hoboken, N.J.
Bessembinder (1991), “Forward Contracts and Firm Value Investment Incentive
and Contracting Effects”, The Journal of Financial and Quantitative Analysis, vol.
26 pp.519-532.
Bertini (1987), “Introduzione allo studio dei rischi nell’economia aziendale”, Giuffrè,
Milano.
Block and Gallagher (1986), “The Use of Interest Rate Futures and Options by
Corporate Financial Managers”, Financial Management, vol. 15 pp. 73-78.
Bodnar, Hayat, Marston, Smithson (1995), “ Wharton survey of derivative usage
by U.S. non-financial firms”, Financial Management, vol. 24 pp. 104-114.
Bodnar, Consolandi, Gabbi e Jaiswal-Dale (2013), “Risk Management for Italian
Non-Financial Firms: Currency and Interest Rate Exposure”, European Financial
Management, vol. 19 pp. 887-910.
Bodnar and Gebhardt (1999), “Derivative usage in risk management by U.S. and
German non-financial firms: a comparative survey”, Journal of International
financial Management and Accounting, vol.10 pp.153-187.

121
Booth, Smith and Stulz (1984), “The Use of Interest Futures by Financial
Institutions”, Journal of Bank Research, vol. 15 pp. 15-20.
Breeden and Viswanathan (1998), “Why do firms hedge? An asymmetric
information model”, Working Paper, Fuqua School of Business, Duke University.
Brunzell, Hansson, Liljeblom (2009), “The Use of Derivatives in Nordic Firms”,
working papers series.
Campello, Lin, Ma, and Zou (2011), “The Real and Financial Implication of
Corporate Hedging”, The Journal of Finance, vol. 66 pp.1615-1647.
Candiotto R. (1996), “L’area strategica “Aziende” nelle imprese di assicurazione”,
Giuffrè, Milano.
Carter, Rogers and Simkins (2003), “Fuel hedging in the airline industry: the case
of southwest airlines”, working paper series.
Chiappori (2008), “Il risk management nella storia, paper presentato alla riunione
annuale di Assicurazioni Generali”, Venice.
Clifford, Smith and Stulz (1985), “The determinants of firm’s hedging policies”,
Journal of Finance and Quantitative Analysis, vol. 20 pp.391-405.
De Ceuster, Laveren, Lodewyckx (2000), “A Survey into the Use of Derivatives by
Large Non-Financial Firms Operating in Belgium”, European Financial
Management, vol. 6 pp.301-318.
De Marzo and Duffie (1995), “Corporate Incentives for Hedge Accounting”, The
Review of Financial Studies, vol. 8 pp.743-771.
Demaria (1950), “Logica della produzione e della occupazione”, Malfasi, Milano.
Dolde (1993), “The trajectory of corporate financial risk management”, Journal of
Applied Corporate Finance, vol. 6 pp.33-41.
Dominguez and Tesar (2001), “Trade and Exposure”, School of Public Policy The
University of Michigan, Discussion Paper n. 466.
El-Masry (2006), “Derivatives use and risk management practices by U.K. non-
financial companies”, Managerial Finance, vol. 32 pp. 137-159.
Facile (1996), “La gestione dei rischi finanziari nell’azienda industriale”, Milano, Il
Sole 24 Ore.
Fatemi and Glaum (2000), “Risk management practices of German firms”,
Managerial Finance, vol. 26 pp. 1-17.
Fatemi and Luft (2002), “Corporate risk management Costs and benefits”, Global
Finance Journal, vol. 13 pp. 29-38.

122
Faulkender (2005), “Hedging or Market Timing? Selecting the Interest Rate
Exposure of Corporate Debt”, Journal of Finance, vol. 60 pp. 931-962.
Floreani (2005), “Introduzione al risk management. Un approccio integrato alla
gestione dei rischi aziendali”, Etas Libri, Parma.
Froot, Scharfstein and Stein (1993), “Risk Management: coordinating corporate
investment and financing policies”, Journal of Finance, American Finance
Association, vol. 48 pp. 1629-1658.
Gay and Nam (1998), “The underinvestment problem and corporate derivatives
use”, Financial Management, vol. 27 pp. 53-69.
Geczy, Minton and Schrand (1997), “Why firms use currency derivatives”, The
Journal of Finance, vol.52 pp. 1323-1354.
Glaum (2002), “The determinants of selective hedging - Evidence from German
non-financial corporations”, Journal of Applied Corporate Finance, vol. 14 pp. 108-
121.
Graham and Rogers (2002), “Do firms hedge in response to tax incentives?”, The
Journal of Finance, vol. 62, pp. 815-839.
Graham, Clifford and Smith (1999), “Tax incentives to hedge”, The Journal of
Finance, vol. 54 pp. 2241-2262.
Grant and Marshall (1997), “Large UK companies and derivatives”, European
Financial Management, vol. 3 pp. 191-208.
Giorgino, Travaglini (2008), “Il risk management nelle imprese italiane”, Edizioni Il
Sole 24 Ore, Milano.
Guay and Kothari (2003), “How much do firms hedge with derivatives?, Journal of
Financial Economics, vol. 70 pp. 423-461.
Guelfi S. (2009), “Governo del rischio competitivo di impresa”, Giappichelli, Torino.
Gujarati & Porter (2009), “Basic Econometrics”, Fifth edition, New York: The
McGraw-Hill International Edition.
Hakkarainen, Kasanen and Puttonen (1997), “Interest rate risk management in
major Finnish firms”, European Financial Management, vol. 3 pp. 255-268.
Haushalter (2000), “Financing policy, Basic Risk, and Corporate Hedging:
Evidence from Oil and Gas Producers”, Journal of Finance, vol. 55 pp. 107-152.
Hellerstein (2008), “Quantitative data clearing for large databases”, EECS
Computer Science Division, UC Berkeley.
Hsiao (2003), “Analysis of panel data”, Second edition. Cambridge University
press 2003.

123
Jalilvand, Switzer and Tang (2000), “A global perspective on the use of derivatives
for corporate risk management decisions”, Managerial Finace, vol. 26 pp.29-38.
Judge (2006a), “The Determinants of foreign Currency Hedging by U.K. Non-
Financial Firms”, Multinatinoal Finance Journal, vol. 10, pp. 1-41.
Judge (2006b), “Why Do Firms Hedge? A review of the Evidence”, Issues in
Finance and Monetary Polocy.
Judge (2006c), “Why and how UK firms hedge”, European Financial Management,
vol. 12 pp. 407-441.
Kahneman and Tversky (1979), “Prospect theory: An analysis of decisions under
risk”, Econometrica 47, pp. 313-327.
Kedia and Mozumdar (2003), “Foreign Currency Denominated Debt: An Empirical
Examination”, The Journal of Business, vol. 76 pp. 521-546.
Keloharju and Niskanen (2001), “Why Do Firms Raise Foreign Currency
Denominated Debt? Evidence from Finland”, European Financial Management,
vol. 7 pp. 481-496.
Knight (1921), “Risk, Uncertainty and Profit”, Houghton Mifflin Co., Boston.
Leland (1998), “Agency Costs, Risk Management and Capital Structure”, Journal
of Finance, vol.53 pp. 1213-1243.
Lintner (1965), “The Valuation of Risk Assets and Selection of Risky Investments
in Stock Portfolioss and Capital Budgets”, Review of Economics and Statistics, vol.
47 pp.13-37.
Loderer and Pichler (2000), “Firms do you know your currency risk exposure?
Survey results”, Journal of Empirical Finance, vol. 7 pp. 217-344.
Mallin, Ow-Yong and Reynolds (2001), “Derivatives usage in UK non-financial
listed companies”, The European Journal of Finance, vol. 7 pp. 63-91.
Markowitz (1952), “Portfolio selection: efficient diversification of investments”, The
Journal of Finance, vol. 7 pp. 77-91, March.
Mian (1996), “ Evidence on corporate hedging policy”, Journal of Finance and
quantitative analysis, vol. 31 pp. 419-439.
Modigliani and Miller (1958), “The Cost of Capital, Corporation Finance, and the
Theory of Investment”, American Economic Review, vol. 48 pp. 261-297.
Mossin (1966), “Equilibrium in a Capital Asset Market”, Econometrica, vol. 34 pp.
768-83.
Myers (1977), “The determinants of corporate borrowing”, Journal of Financial
Economics, vol. 5 pp.147-175.

124
Nance, Smith and Smithson (1993), “ On the determinants of corporate hedging”,
the Journal of Finance, vol. 48 pp.267-284.
Nguyen and Faff (2003), “Further Evidence on the Corporate Use of Derivatives in
Australia: The Case of Foreign Currency and Interest Rate Instruments”,
Australian Journal of Management, vol. 28 pp. 307-317.
Pellicelli (2004), “La gestione dei rischi nelle imprese”, Giappichelli, Torino.
Prandi (2008), “La metodologia di analisi dei prodotti derivati”, Brescia & Futuro,
anno XIX, n. 1, Brescia.
Prandi (2010), “Il risk management. Teoria e pratica nel rispetto della normative”,
Economia & Management, Franco Angeli, pp. 57-60
Resti A. (2008), “Il Secondo Pilastro di Basilea e la sfida del capitale economico”,
Bancaria Editrice, Roma.
Sassi S. (1940), “Il sistema dei rischi di impresa”, Vallardi, Milano.
Sharpe (1964), “Capital Asset Prices: A Theory of Market Equilibrium under
Conditions of Risk”, Journal of Finance, vol. 19 pp. 425-442.
Siroini (2005), “Il credito: evoluzione e innovazione nei criteri di valutazione”, in
Forestieri G., Corporate e Investment banking, Egea.
Smith and Stulz (1985), “The detrminants of firms’hedging policies, Journal of
Finance and Quantitative Analysis, vol. 20 pp.391-405.
Tarallo (2000), “La gestione integrata dei rischi puri e speculativi”, Franco Angeli,
Milano.
Tufano (1996), “Who manages risk? An empirical examination of risk management
practices in the gold industry”, The Journal of Finance, vol. 51 pp.1097-1137.
Tufano (1998), “Agency costs of corporate risk management”, Financial
Management, vol. 27 pp. 67-77.
Von Neumann, Morgenstern (1944), “Theory of Games and Economic Behavior”,
Princeton University Press, New jersey.
Warner(1977), “Bankrupt Costs: Some Evidence”, The Journal of Finance, vol.32
pp. 337- 347.
Williamson (1964), “The economics of discretionary behavior: Managerial
objectives in a theory of the firm”, Prentice-Hall, Englewood Cliffs, NJ.

125
Annex A: Univariate logit regression results - UK sample
Tab. 43 - Univariate Logit of IR (no bias)
This table presents the results from univariate logit regression using a binary variable equal to 1 if firms hedge
with IR derivatives and 0 if otherwise. The table presents the number of observations, coefficients, robust
standard errors, z-statistics, p-values and Wald chi-square statistics. ***, ** and * indicate the significance at
1%, 5% and 10% respectively.
Variables N Coeff
Robust std.errors
Z-stat p-
value chi2
Zsc 797 -0.222 *** 0.060 -3.68 0.00 13.52
Divyield 394 -0.037 0.045 -0.82 0.41 0.67
LEVERAGE
debtequity 627 0.001 * 0.001 1.84 0.07 3.40
debtcapital 627 -0.032 0.110 -0.29 0.77 0.08 ltdebtcapital 702 0.589 ** 0.288 2.05 0.04 4.19 ltdebtequity 702 0.402 *** 0.114 3.52 0.00 12.41
liabassets 988 0.139 0.274 0.51 0.61 0.26 gearingrat 1020 0.003 *** 0.001 3.90 0.00 15.19 Bv 627 0.532 ** 0.232 2.29 0.02 5.25
Mktv 503 3.301 *** 0.465 7.10 0.00 50.37
LIQUIDITY
Crat 1197 -0.067 0.070 -0.96 0.34 0.92
Qrat 721 -0.243 ** 0.120 -2.03 0.04 4.13 liquidityratiox 1197 -0.344 *** 0.116 -2.97 0.00 8.80 shareholdersliquidityratiox
997 -0.019 0.013 -1.49 0.14 2.23
solvencyratioassetbased
11877 -0.001 0.003 -0.52 0.60 0.28
PROFITABILITY
Roc 1189 0.001 0.001 1.22 0.22 1.49 Roe 1145 0.119 * 0.064 1.86 0.06 3.47 profitmargin 1107 0.012 *** 0.005 2.52 0.01 6.34
returnonshareholdersfunds
1131 0.002 0.001 1.17 0.24 1.37
returnontotalass
ets 1196 0.007 *** 0.003 2.70 0.01 7.28
ebitmargin 1168 0.012 *** 0.005 2.60 0.01 6.77 ebitdamargin 1166 0.012 *** 0.004 3.19 0.00 10.19
grossmargin 1011 -0.002 0.004 -0.41 0.68 0.17
IC
Ebitinp 944 0.000 0.000 1.50 0.14 2.24 ebitdainp 944 0.000 0.000 -0.41 0.68 0.17
interestcoverx 925 -0.002 0.002 -1.21 0.23 1.46 assetcoverx 690 -0.011 ** 0.005 -2.27 0.02 5.15 berryratio 1008 0.115 0.120 0.96 0.34 0.92
GROWTH OP. capexpsales 293 3.916 2.153 1.35 0.18 1.83 mkttbrat 934 0.270 0.266 1.02 0.31 1.03
DEBT MATURITY stborrow 627 -2.226 *** 0.418 -5.33 0.00 28.40
ltborrow 627 2.226 *** 0.418 5.33 0.00 28.40
FIRM SIZE lnmktcap 934 0.316 *** 0.067 4.74 0.00 22.46
lntotsales 1130 0.557 *** 0.081 6.88 0.00 47.40 lntotassets 1146 0.695 *** 0.070 9.94 0.00 98.71
FOREIGN
EXPOSURE foreignsales 1130 -0.583 ** 0.271 -2.15 0.03 4.62
Source: author’s elaboration – FAME database.

126
Tab. 44 - Univariate Logit of FX (no bias).
This table presents the results from univariate logit regression using a binary variable equal to 1 if firms hedge
with FX derivatives and 0 if otherwise. The table presents the number of observations, coefficients, robust
standard errors, z-statistics, p-values and Wald chi-square statistics. ***, ** and * indicate the significance at
1%, 5% and 10% respectively.
Variables N Coeff
Robust
std.errors Z-stat
p-
value chi2
Zsc 797 0.586 *** 0.098 5.93 0.00 35.15
Divyield 394 0.052 0.052 -0.99 0.32 0.98
LEVERAGE
debtequity 627 0.000 0.001 -0.40 0.69 0.16
debtcapital 627 -0.085 0.065 -1.32 0.19 1.75 ltdebtcapital 702 -0.805 *** 0.271 -2.97 0.00 8.83 ltdebtequity 702 -0.183 0.158 -1.16 0.25 1.33
liabassets 988 -2.542 *** 0.462 -5.50 0.00 30.24 gearingrat 1020 -0.012 *** 0.004 -3.49 0.00 12.15 Bv 627 -2.067 *** 0.656 -3.15 0.00 9.91
Mktv 503 -2.677 *** 0.614 -4.36 0.00 19.03
LIQUIDITY
Crat 1197 0.105 *** 0.029 3.59 0.00 12.89 Qrat 721 0.247 *** 0.067 3.67 0.00 13.48
liquidityratiox 1197 0.141 *** 0.040 3.49 0.00 12.17 shareholdersliquidityratiox
997 0.001 0.001 1.33 0.18 1.76
solvencyratioassetbased
1187 0.024 *** 0.004 5.77 0.00 33.28
PROFITABILITY
Roc 1189 0.004 *** 0.001 3.45 0.00 11.92
Roe 1145 0.137 0.093 1.48 0.14 2.19 profitmargin 1107 0.014 *** 0.003 3.86 0.00 14.93 returnonsharehol
dersfunds 1131 0.008 *** 0.002 3.81 0.00 14.50
returnontotalassets
1196 0.025 *** 0.006 4.21 0.00 17.73
ebitmargin 1168 0.005 *** 0.002 3.15 0.00 9.92
ebitdamargin 1166 0.004 *** 0.001 2.75 0.01 7.55
grossmargin 1011 -0.003 0.004 -0.88 0.38 0.77
IC
Ebitinp 944 0.002 *** 0.000 4.03 0.00 16.28 ebitdainp 944 0.001 *** 0.000 3.90 0.00 15.17
interestcoverx 925 0.004 *** 0.001 4.13 0.00 17.07 assetcoverx 690 0.001 0.001 1.49 0.14 2.23 berryratio 1008 0.111 * 0.061 1.82 0.07 3.32
GROWTH OP. capexpsales 293 0.888 0.832 1.07 0.29 1.14 mkttbrat 934 -2.314 *** 0.442 -5.24 0.00 27.42
DEBT MATURITY stborrow 627 0.359 0.437 0.82 0.41 0.67
ltborrow 627 -0.359 0.437 -0.82 0.41 0.67
FIRM SIZE
lnmktcap 934 0.231 *** 0.065 3.57 0.00 12.75 lntotsales 1130 0.884 *** 0.107 8.25 0.00 68.14 lntotassets 1146 0.237 *** 0.053 4.50 0.00 20.24
FOREIGN
EXPOSURE foreignsales 1130 1.514 *** 0.242 6.27 0.00 39.28
Source: author’s elaboration – FAME database.

127
Annex B: Multivariate logit results – UK sample
Tab. 45 - Logit Regression on the probability of hedging (IR no bias).
This table presents logit regression estimates of the relation between the probability that a firm hedge with IR derivatives as proxies for incentives to hedge. The dependent
variable equals 1 if a firm provides qualitative information of any derivative use in the annual report, an 0 if otherwise. The model presents log of odds coefficients (Coef.),
marginal effects (ME), odds ratios and the respective p-values in parenthesis. The estimated coefficients give the change in the logit function given a change in the
independent variable. The marginal effect (elasticities) measures the actual change (percentage change) in the probability of hedging for 1% increase in the independent
variable. The higher the elasticity’ value more important is the variable in the model. The odds ratio gives the likelihood of Y = 1 when X is increased by one unit. The p-
values are calculated using the robust (heteroscedastic) standard errors. ***, ** and * indicate the significance at 1%, 5% and 10% respectively.
Indep.
Variables
MOD.1 MOD.2 MOD.3 MOD.4 MOD.5 MOD.6 MOD.7
Coeff. ME Odds Coeff. ME Odds Coeff. ME Odds Coeff. ME Odds Coeff. ME Odds Coeff. ME Odds Coeff. ME Odds
EBIT INT PAYMENT
-
0.000
(0.977)
-
0.000
(0.977)
0.999
(0.977)
ASSETCOVERX
-
0.010
(0.048)
**
-
0.231
(0.049)
**
0.989
(0.048)
**
MKTV
2.475
(0.002)
***
0.335
(0.002)
***
11.883
(0.002)
***
PROFIT
MARGIN
0.009
(0.152)
0.001
(0.152)
1.009
(0.152)
ROA
-
0.008
(0.649)
-
0.000
(0.650)
0.991
(0.649)
ST
BORROW
-
1.595
(0.011)
**
-
0.216
(0.008)
***
0.202
(0.011)
**
LT BORROW
1.595
(0.011)
**
0.216
(0.008)
***
4.932
(0.011)
**
MKTTBRAT
-
0.531
(0.482)
-
0.071
(0.480)
0.587
(0.482)
-
1.875
(0.059)
*
-
0.102
(0.067)
*
0.153
(0.059)
*
-
2.796
(0.017)
**
-
0.379
(0.011)
**
0.061
(0.017)
**
-
1.484
(0.056)
*
-
0.179
(0.051)
*
0.226
(0.056)
*
-
0.427
(0.572)
-
0.051
(0.571)
0.652
(0.572)
-
1.976
(0.051)
*
-
0.268
(0.044)
**
0.138
(0.051)
*
-
1.976
(0.051)
*
-
0.268
(0.044)
**
0.138
(0.051)
*
FOREIGN
SALES
-
0.904
(0.026)
**
-
0.120
(0.024)
**
0.204
(0.026)
**
0.829
(0.061)
*
0.071
(0.000)
***
0.436
(0.061)
*
-
1.070
(0.026)
**
-
0.145
(0.024)
**
0.342
(0.026)
**
-
1.023
(0.017)
**
-
0.123
(0.015)
**
0.359
(0.017)
**
-
0.822
(0.041)
**
-
0.099
(0.040)
**
0.439
(0.041)
**
-
0.941
(0.060)
*
-
0.128
(0.056)
*
0.389
(0.060)
*
-
0.941
(0.060)
*
-
0.128
(0.056)
*
0.389
(0.060)
*
LN SALES

128
0.768
(0.000)
***
0.104
(0.000)
***
2.157
(0.000)
***
0.849
(0.000)
***
0.102
(0.000)
***
2.337
(0.000)
***
0.783
(0.000)
***
0.106
(0.000)
***
2.188
(0.000)
***
0.783
(0.000)
***
0.106
(0.000)
***
2.188
(0.000)
***
LN ASSETS
0.660
(0.000)
***
0.088
(0.000)
***
1.935
(0.000)
***
0.577
(0.000)
***
-
0.040
(0.042)
**
1.781
(0.000)
***
0.733
(0.000)
***
0.089
(0.000)
***
2.082
(0.000)
***
Q-RATIO
-
0.253
(0.066)
*
-
0.033
(0.062)
*
0.776
(0.066)
*
-
0.328
(0.043)
**
-
0.040
(0.042)
**
0.719
(0.043)
**
-
0.153
(0.440)
-
0.020
(0.434)
0.858
(0.440)
-
0.319
(0.044)
*
-
0.038
(0.037)
**
0.726
(0.044)
**
-
0.302
(0.031)
**
-
0.036
(0.028)
**
0.739
(0.031)
**
-
0.277
(0.181)
-
0.037
(0.173)
0.757
(0.181)
-
0.277
(0.181)
-
0.037
(0.173)
0.757
(0.181)
SOLVENCY RATIO
Z-SCORE 0.204
(0.281)
0.027
(0.275)
1.226
(0.281)
0.274
(0.204)
0.033
(0.194)
1.35
(0.204)
-
0.070
(0.709)
-
0.009
(0.710)
0.932
(0.709)
-
0.476
(0.004)
***
-
0.057
(0.003)
***
0.621
(0.004)
***
0.210
(0.464)
0.025
(0.465)
1.233
(0.464)
-
0.047
(0.798)
-
0.006
(0.799)
0.953
(0.798)
-
0.047
(0.798)
-
0.006
(0.799)
0.953
(0.798)
_cons
-
7.577
(0.000)
***
0.001
(0.000)
***
-
5.749
(0.001)
***
0.003
(0.001)
***
-
8.113
(0.000)
***
0.000
(0.000)
***
-
7.971
(0.000)
***
0.000
(0.000)
***
-
8.432
(0.000)
***
0.000
(0.000)
***
-
6.818
(0.001)
***
0.001
(0.001)
***
-
8.414
(0.000)
***
0.000
(0.000)
***
Source: author’s elaboration – FAME database.
Summary Statistic for Logit Regression.
Statistics MOD.1 MOD.2 MOD.3 MOD.4 MOD.5 MOD.6 MOD.7
N. 398 330 310 430 444 310 310
No. of Users 77 70 65 75 78 63 63
Classified as Users 35 47 40 30 32 40 40
Classified as Non-
Users 42 23 23 45 46 23 23
Sensitivity 45.45% 67.14% 63.49% 40.00% 41.03% 63.49% 63.49%
No. of Non-Users 321 260 247 355 366 247 247
Classified as users 61 68 56 57 55 63 63
Classified as Non-
Users 260 192 191 298 311 184 184
Specificity 81.00% 73.85% 77.33% 83.94% 84.97% 74.49% 74.49%
Correctly Specified 74.12% 72.42% 74.52% 76.28% 77.25% 72.26% 72.26%
Chi-Square 44.53% 49.49% 41.40% 42.67% 51.32% 38.62% 38.62%
Probability 0.0000 0.0000 0.0000 0.0000 0.0000 0.0000 0.0000
Pseudo R-Square 0.1139 0.1451 0.1323 0.1072 0.1244 0.1234 0.1234
Log pseudo likelihood -173.23633 -145.78173 -135.80085 -177.6772 -180.69657 -137.19141 -137.19141
Source: author’s elaboration – FAME database.

129
Tab. 46 - Logit Regression on the probability of hedging (FX no bias).
This table presents logit regression estimates of the relation between the probability that a firm hedge with FX derivatives as proxies for incentives to hedge. The dependent
variable equals 1 if a firm provides qualitative information of any derivative use in the annual report, an 0 if otherwise. The model presents log of odds coefficients (Coef.),
marginal effects (ME), odds ratios and the respective p-values in parenthesis. The estimated coefficients give the change in the logit function given a change in the
independent variable. The marginal effect (elasticities) measures the actual change (percentage change) in the probability of hedging for 1% increase in the independent
variable. The higher the elasticity’ value more important is the variable in the model. The odds ratio gives the likelihood of Y = 1 when X is increased by one unit. The p-
values are calculated using the robust (heteroscedastic) standard errors. ***, ** and * indicate the significance at 1%, 5% and 10% respectively.
Indep.
Variables
MOD.1 MOD.2 MOD.3 MOD.4 MOD.5
Coeff. ME Odds Coeff. ME Odds Coeff. ME Odds Coeff. ME Odds Coeff. ME Odds
EBIT INT PAYMENT
-
0.000
(0.783)
-
0.000
(0.782)
0,999
(0.783)
ASSETCOVERX
0.001
(0.149)
0.000
(0.151)
1.001
(0.149)
MKTV
-
4.261
(0.000)
***
-
0.402
(0.000)
***
0.014
(0.000)
***
PROFIT MARGIN
-
0.022
(0.008)
***
-
0.002
(0.007)
***
0.977
(0.008)
***
ROA
-
0.072
(0.000)
***
-
0.009
(0.000)
***
0.930
(0.000)
***
ST BORROW
LT BORROW
MKTTBRAT
-
1.937
(0.020)
**
-
0.254
(0.016)
**
0.144
(0.020)
**
-
0.362
(0.698)
-
0.039
(0.697)
0.695
(0.698)
0.002
(0.998)
0.000
(0.998)
1.002
(0.998)
-
3.666
(0.000)
***
-
0.386
(0.000)
***
0.025
(0.000)
***
-
2.642
(0.002)
***
-
0.331
(0.001)
***
0.071
(0.002)
***
FOREIGN SALES
0.558
(0.134)
0.073
(0.138)
1.747
(0.134)
0.702
(0.121)
0.077
(0.125)
2.019
(0.121)
0.967
(0.059)
*
0.091
(0.064)
*
2.630
(0.059)
*
0.414
(0.267)
0.043
(0.270)
1.512
(0.267)
0.601
(0.094)
*
0.075
(0.095)
*
1.823
(0.094)
*
LN SALES
0.954
(0.000)
***
0.090
(0.000)
***
2.597
(0.000)
***
1.117
(0.000)
***
0.117
(0.000)
***
3.055
(0.000)
***
LN ASSETS 0.301
(0.024)
0.039
(0.018)
1.352
(0.024)
0.296
(0.073)
0.032
(0.060)
1.345
(0.073)
0.732
(0.000)
0.091
(0.000)
2.080
(0.000)
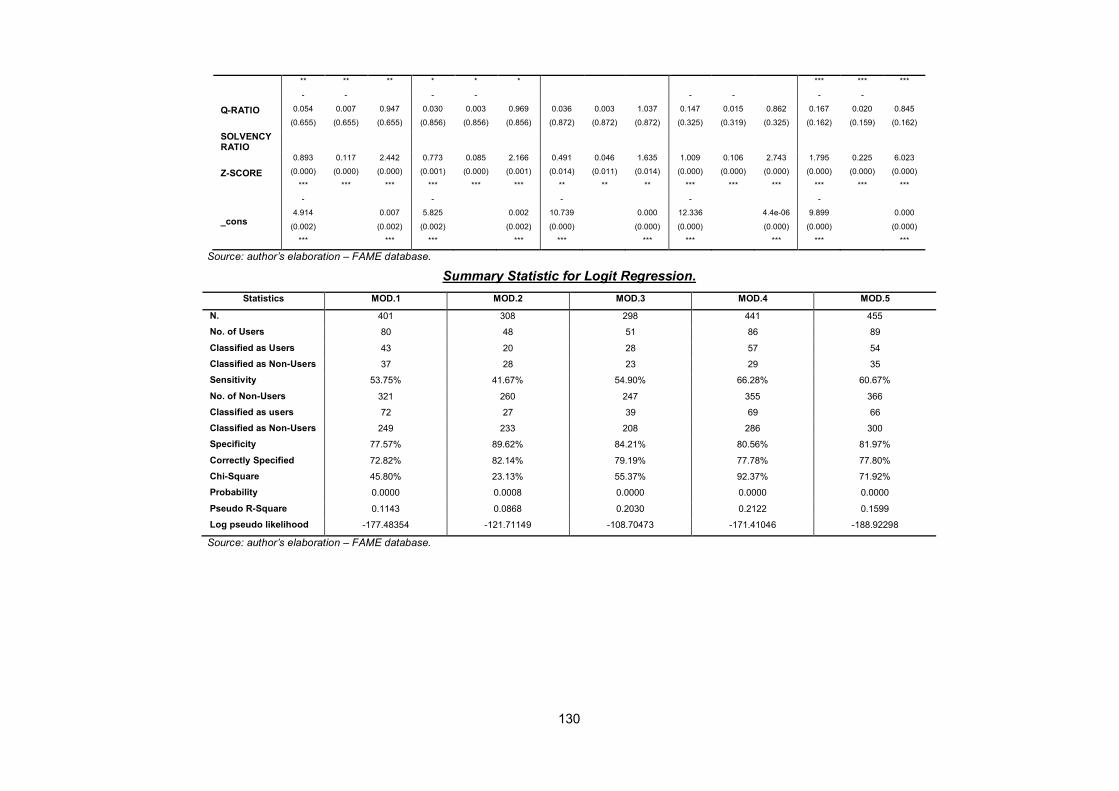
130
** ** ** * * * *** *** ***
Q-RATIO
-
0.054
(0.655)
-
0.007
(0.655)
0.947
(0.655)
-
0.030
(0.856)
-
0.003
(0.856)
0.969
(0.856)
0.036
(0.872)
0.003
(0.872)
1.037
(0.872)
-
0.147
(0.325)
-
0.015
(0.319)
0.862
(0.325)
-
0.167
(0.162)
-
0.020
(0.159)
0.845
(0.162)
SOLVENCY RATIO
Z-SCORE
0.893
(0.000)
***
0.117
(0.000)
***
2.442
(0.000)
***
0.773
(0.001)
***
0.085
(0.000)
***
2.166
(0.001)
***
0.491
(0.014)
**
0.046
(0.011)
**
1.635
(0.014)
**
1.009
(0.000)
***
0.106
(0.000)
***
2.743
(0.000)
***
1.795
(0.000)
***
0.225
(0.000)
***
6.023
(0.000)
***
_cons
-
4.914
(0.002)
***
0.007
(0.002)
***
-
5.825
(0.002)
***
0.002
(0.002)
***
-
10.739
(0.000)
***
0.000
(0.000)
***
-
12.336
(0.000)
***
4.4e-06
(0.000)
***
-
9.899
(0.000)
***
0.000
(0.000)
***
Source: author’s elaboration – FAME database.
Summary Statistic for Logit Regression.
Statistics MOD.1 MOD.2 MOD.3 MOD.4 MOD.5
N. 401 308 298 441 455
No. of Users 80 48 51 86 89
Classified as Users 43 20 28 57 54
Classified as Non-Users 37 28 23 29 35
Sensitivity 53.75% 41.67% 54.90% 66.28% 60.67%
No. of Non-Users 321 260 247 355 366
Classified as users 72 27 39 69 66
Classified as Non-Users 249 233 208 286 300
Specificity 77.57% 89.62% 84.21% 80.56% 81.97%
Correctly Specified 72.82% 82.14% 79.19% 77.78% 77.80%
Chi-Square 45.80% 23.13% 55.37% 92.37% 71.92%
Probability 0.0000 0.0008 0.0000 0.0000 0.0000
Pseudo R-Square 0.1143 0.0868 0.2030 0.2122 0.1599
Log pseudo likelihood -177.48354 -121.71149 -108.70473 -171.41046 -188.92298
Source: author’s elaboration – FAME database.

131
Annex C: Univariate logit regression results – Italian sample
Tab. 47 - Univariate Logit of IR (no bias).
This table presents the results from univariate logit regression using a binary variable equal to 1 if firms hedge
with IR derivatives and 0 if otherwise. The table presents the number of observations, coefficients, robust
standard errors, z-statistics, p-values and Wald chi-square statistics. ***, ** and * indicate the significance at
1%, 5% and 10% respectively.
Variables N Coeff Robust
std.errors Z-stat
p-value
chi2
zsc 497 -0.352 0.117 -3.15 0.00 9.91
LEVERAGE debtequity 497 0.000 0.004 -0.06 0.10 0.00 debtcapital 497 0.003 0.008 0.36 0.72 0.13 ltdebtcapital 497 0.070 0.039 1.77 0.08 3.14 ltdebtequity 497 0.022 0.014 1.59 0.11 2.53 liabassets 497 0.151 0.384 0.39 0.70 0.15 gearingrat 507 -0.006 0.013 -0.49 0.62 0.24 bv 497 -0.231 0.380 -0.61 0.54 0.37 mktv 499 0.422 0.264 1.60 0.11 2.56
LIQUIDITY crat 497 -0.082 * 0.047 -1.75 0.08 3.07 qrat 497 -0.068 0.047 -1.45 0.15 2.11 liquidityratiox 497 -0.068 0.047 -1.45 0.15 2.11
shareholdersliquidityratiox
412 -0.002 0.002 -0.08 0.41 0.69
solvencyratioassetbased
497 4.324 36.346 0.12 0.91 0.01
PROFITABILITY roc 507 -0.019 * 0.010 -1.84 0.07 3.40 roe 507 0.009 0.004 2.31 0.21 5.36 profitmargin 485 0.124 ** 0.059 2.11 0.04 4.46
returnonshareholdersfunds
486 0.015 0.024 0.63 0.53 0.40
returnontotalassets
507 0.009 0.006 1.36 0.17 1.85
ebitmargin 496 0.108 0.100 1.08 0.28 1.17 ebitdamargin 496 0.117 0.116 1.01 0.31 1.02
IC ebitinp 492 0.001 0.001 0.94 0.35 0.88 ebitdainp 492 -0.001 0.001 -1.21 0.23 1.46 interestcoverx 492 0.001 0.001 0.94 0.35 0.88 assetcoverx 412 -0.002 0.002 -1.03 0.30 1.06
GROWTH OP mkttbrat 497 -0.047 0.367 -0.13 0.90 0.02
DEBT MATURITY
stborrow 497 -3.511 *** 0.453 -7.75 0.00 60.13
ltborrow 497 3.511 *** 0.453 7.75 0.00 60.13
FIRM SIZE lnmktcap 333 0.450 *** 0.086 5.21 0.00 27.10 lntotsales 496 0.664 *** 0.107 6.19 0.00 38.32 lntotassets 497 0.791 *** 0.100 7.94 0.00 62.98
FOREIGN EXPOSURE
foreignsales 92 -0.071 0.484 -0.15 0.88 0.02
Source: author’s elaboration – AIDA database and Annual Reports for foreign sales measure.

132
Table 48 - Univariate Logit of FX (no bias).
This table presents the results from univariate logit regression using a binary variable equal to 1 if firms hedge
with FX derivatives and 0 if otherwise. The table presents the number of observations, coefficients, robust
standard errors, z-statistics, p-values and Wald chi-square statistics. ***, ** and * indicate the significance at
1%, 5% and 10% respectively.
Variables N Coeff Robust
std.errors Z-stat
p-value
chi2
zsc 410 -0.303 ** 0.143 -2.12 0.03 4.50
LEVERAGE debtequity 410 0.001 0.006 0.23 0.82 0.05 debtcapital 410 -0.002 0.015 -0.14 0.89 0.02 ltdebtcapital 410 0.044 0.056 0.80 0.42 0.64 ltdebtequity 410 0.015 0.018 0.85 0.40 0.07 liabassets 410 0.083 0.475 0.18 0.86 0.03 gearingrat 419 -0.075 * 0.040 -1.88 0.06 3.54 bv 410 0.583 0.555 1.05 0.29 1.10 mktv 412 0.100 0.279 9.36 0.72 0.13
LIQUIDITY crat 410 -0.135 ** 0.062 -2.18 0.03 4.76 qrat 410 -0.135 ** 0.064 -2.09 0.04 4.36 liquidityratiox 410 -0.135 ** 0.064 -2.09 0.04 4.36
shareholdersliquidityratiox
330 0.000 0.001 -0.37 0.71 0.14
solvencyratioassetbased
410 -56.320 52.277 -1.08 0.28 1.16
PROFITABILITY roc 419 -0.052 *** 0.014 -3.67 0.00 13.48 roe 419 0.008 * 0.005 1.67 0.10 2.78 profitmargin 398 0.042 0.072 0.58 0.56 0.34
returnonshareholdersfunds
399 0.063 ** 0.031 2.03 0.04 4.11
returnontotalassets
419 -0.005 0.007 -0.68 0.49 0.47
ebitmargin 409 -0.194 * 0.101 -1.92 0.06 3.68 ebitdamargin 409 -0.233 ** 0.114 -2.04 0.04 4.16
IC ebitinp 405 0.000 0.001 0.16 0.87 0.03 ebitdainp 405 -0.001 0.001 -1.55 0.12 2.39 interestcoverx 405 0.000 0.001 0.16 0.87 0.03 assetcoverx 330 -0.001 0.000 -1.22 0.22 1.48
GROWTH OP mkttbrat 410 0.527 0.525 1.00 0.32 1.01
DEBT MATURITY
stborrow 410 -2.549 *** 0.574 -4.44 0.00 19.70
ltborrow 410 2.549 *** 0.574 4.44 0.00 19.70
FIRM SIZE lnmktcap 259 0.667 *** 0.138 4.84 0.00 23.38 lntotsales 409 0.389 *** 0.124 3.14 0.00 9.89 lntotassets 410 0.728 *** 0.121 6.02 0.00 36.25
FOREIGN EXPOSURE
foreignsales 62 0.954 0.652 1.46 0.14 2.14
Source: author’s elaboration – AIDA database and Annual Reports for foreign sales measure.
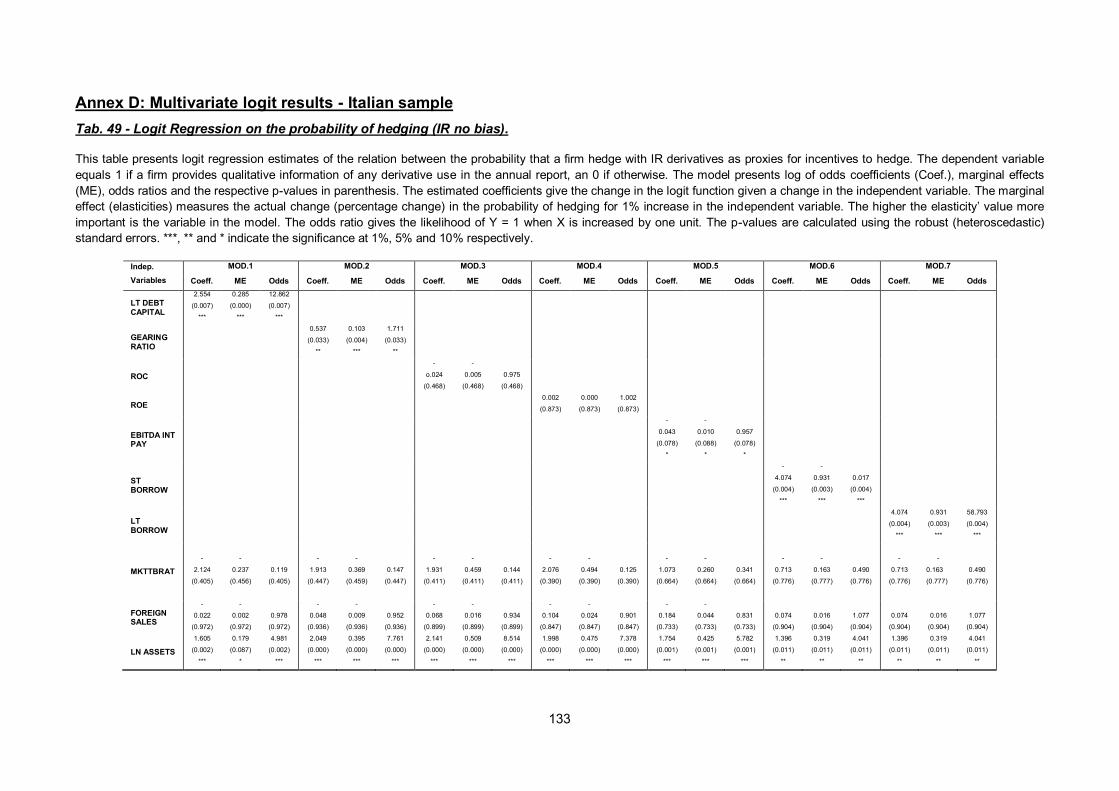
133
Annex D: Multivariate logit results - Italian sample
Tab. 49 - Logit Regression on the probability of hedging (IR no bias).
This table presents logit regression estimates of the relation between the probability that a firm hedge with IR derivatives as proxies for incentives to hedge. The dependent variable
equals 1 if a firm provides qualitative information of any derivative use in the annual report, an 0 if otherwise. The model presents log of odds coefficients (Coef.), marginal effects
(ME), odds ratios and the respective p-values in parenthesis. The estimated coefficients give the change in the logit function given a change in the independent variable. The marginal
effect (elasticities) measures the actual change (percentage change) in the probability of hedging for 1% increase in the independent variable. The higher the elasticity’ value more
important is the variable in the model. The odds ratio gives the likelihood of Y = 1 when X is increased by one unit. The p-values are calculated using the robust (heteroscedastic)
standard errors. ***, ** and * indicate the significance at 1%, 5% and 10% respectively.
Indep.
Variables
MOD.1 MOD.2 MOD.3 MOD.4 MOD.5 MOD.6 MOD.7
Coeff. ME Odds Coeff. ME Odds Coeff. ME Odds Coeff. ME Odds Coeff. ME Odds Coeff. ME Odds Coeff. ME Odds
LT DEBT CAPITAL
2.554
(0.007)
***
0.285
(0.000)
***
12.862
(0.007)
***
GEARING RATIO
0.537
(0.033)
**
0.103
(0.004)
***
1.711
(0.033)
**
ROC
-
o.024
(0.468)
-
0.005
(0.468)
0.975
(0.468)
ROE 0.002
(0.873)
0.000
(0.873)
1.002
(0.873)
EBITDA INT PAY
-
0.043
(0.078)
*
-
0.010
(0.088)
*
0.957
(0.078)
*
ST BORROW
-
4.074
(0.004)
***
-
0.931
(0.003)
***
0.017
(0.004)
***
LT BORROW
4.074
(0.004)
***
0.931
(0.003)
***
58.793
(0.004)
***
MKTTBRAT
-
2.124
(0.405)
-
0.237
(0.456)
0.119
(0.405)
-
1.913
(0.447)
-
0.369
(0.459)
0.147
(0.447)
-
1.931
(0.411)
-
0.459
(0.411)
0.144
(0.411)
-
2.076
(0.390)
-
0.494
(0.390)
0.125
(0.390)
-
1.073
(0.664)
-
0.260
(0.664)
0.341
(0.664)
-
0.713
(0.776)
-
0.163
(0.777)
0.490
(0.776)
-
0.713
(0.776)
-
0.163
(0.777)
0.490
(0.776)
FOREIGN SALES
-
0.022
(0.972)
-
0.002
(0.972)
0.978
(0.972)
-
0.048
(0.936)
-
0.009
(0.936)
0.952
(0.936)
-
0.068
(0.899)
-
0.016
(0.899)
0.934
(0.899)
-
0.104
(0.847)
-
0.024
(0.847)
0.901
(0.847)
-
0.184
(0.733)
-
0.044
(0.733)
0.831
(0.733)
0.074
(0.904)
0.016
(0.904)
1.077
(0.904)
0.074
(0.904)
0.016
(0.904)
1.077
(0.904)
LN ASSETS
1.605
(0.002)
***
0.179
(0.087)
*
4.981
(0.002)
***
2.049
(0.000)
***
0.395
(0.000)
***
7.761
(0.000)
***
2.141
(0.000)
***
0.509
(0.000)
***
8.514
(0.000)
***
1.998
(0.000)
***
0.475
(0.000)
***
7.378
(0.000)
***
1.754
(0.001)
***
0.425
(0.001)
***
5.782
(0.001)
***
1.396
(0.011)
**
0.319
(0.011)
**
4.041
(0.011)
**
1.396
(0.011)
**
0.319
(0.011)
**
4.041
(0.011)
**

134
CRATIO
0.304
(0.124)
0.034
(0.177)
1.356
(0.124)
0.373
(0.085)
*
0.072
(0.062)
*
1.453
(0.085)
*
0.193
(0.333)
0.045
(0.329)
1.213
(0.333)
0.194
(0.316)
0.046
(0.255)
1.214
(0.316)
0.315
(0.219)
0.076
(0.213)
1.371
(0.219)
0.014
(0.954)
0.003
(0.954)
1.014
(0.954)
0.014
(0.954)
0.003
(0.954)
1.014
(0.954)
Z-SCORE 0.309
(0.389)
0.034
(0.454)
1.362
(0.389)
0.331
(0.351)
0.064
(0.366)
1.392
(0.351)
0.630
(0.098)
*
0.150
(0.099)
*
1.878
(0.098)
*
0.449
(0.255)
0.106
(0.255)
1.567
(0.255)
0.750
(0.052)
*
0.181
(0.057)
*
2.118
(0.052)
*
0.484
(0.167)
0.110
(0.172)
1.623
(0.167)
0.484
(0.167)
0.110
(0.172)
1.623
(0.167)
_cons
-
17.555
(0.007)
***
2.3e-08
(0.007)
***
-
23.261
(0.000)
***
7.9e-11
(0.000)
***
-
22.915
(0.000)
***
1.1e-10
(0.000)
***
-
21.075
(0.000)
***
7.0e-10
(0.000)
***
-
19.238
(0.001)
***
4.4e-09
(0.001)
***
-
12.297
(0.065)
*
4.5e-06
(0.065)
*
-
16.371
(0.010)
***
7.7e-08
(0.010)
***
Source: author’s elaboration – AIDA database and Annual Reports for foreign sales measure.
Summary Statistic for Logit Regression.
Statistics MOD.1 MOD.2 MOD.3 MOD.4 MOD.5 MOD.6 MOD.7
N. 91 91 91 91 91 91 91
No. of Users 53 53 53 53 53 53 53
Classified as Users 43 44 43 43 46 43 43
Classified as Non-Users 10 9 10 10 7 10 10
Sensitivity 81.13% 83.02% 81.13% 81.13% 86.79% 81.13% 81.13%
No. of Non-Users 38 38 38 38 38 38 38
Classified as users 8 9 13 13 14 10 10
Classified as Non-Users 30 29 25 25 24 28 28
Specificity 78.95% 76.32% 65.79% 65.79% 63.16% 73.68% 73.68%
Correctly Specified 80.22% 80.22% 74.73% 74.73% 76.92% 78.02% 78.02%
Chi-Square 41.14% 36.17% 28.92% 28.41% 34.20% 38.04% 38.04%
Probability 0.0000 0.0000 0.0001 0.0001 0.0000 0.0000 0.0000
Pseudo R-Square 0.3327 0.2925 0.2339 0.2298 0.2765 0.3076 0.3076
Log pseudo likelihood -41.264965 -43.749998 -47.373148 -47.627049 -44.735995 -42.816868 -42.816868
Source: author’s elaboration – AIDA database and Annual Reports for foreign sales measure.

135
Tab. 50 - Logit Regression on the probability of hedging (FX no bias).
This table presents logit regression estimates of the relation between the probability that a firm hedge with FX exposure as proxies for incentives to hedge. The dependent variable
equals 1 if a firm provides qualitative information of any derivative use in the annual report, an 0 if otherwise. The model presents log of odds coefficients (Coef.), marginal effects
(ME), odds ratios and the respective p-values in parenthesis. The estimated coefficients give the change in the logit function given a change in the independent variable. The marginal
effect (elasticities) measures the actual change (percentage change) in the probability of hedging for 1% increase in the independent variable. The higher the elasticity’ value more
important is the variable in the model. The odds ratio gives the likelihood of Y = 1 when X is increased by one unit. The p-values are calculated using the robust (heteroscedastic)
standard errors. ***, ** and * indicate the significance at 1%, 5% and 10% respectively.
Indep.
Variables
MOD.1 MOD.2 MOD.3 MOD.4 MOD.5 MOD.6 MOD.7
Coeff. ME Odds Coeff. ME Odds Coeff. ME Odds Coeff. ME Odds Coeff. ME Odds Coeff. ME Odds Coeff. ME Odds
LT DEBT CAPITAL
3.311
(0.001)
***
0.773
(0.002)
***
27.427
(0.001)
***
GEARING RATIO
1.553
(0.001)
***
0.326
(0.001)
***
4.726
(0.001)
***
ROC
-
0.068
(0.123)
-
0.015
(0.111)
0.933
(0.123)
ROE
-
0.030
(0.244)
-
0.006
(0.234)
0.970
(0.244)
EBITDA INT PAY
-
0.075
(0.045)
**
-
0.014
(0.005)
***
0.927
(0.045)
**
ST BORROW
-
5.271
(0.003)
***
-
1.200
(0.004)
***
0.005
(0.003)
***
LT BORROW
5.271
(0.003)
***
1.200
(0.004)
***
194.706
(0.003)
***
MKTTBRAT
-
1.214
(0.824)
-
0.283
(0.825)
0.296
(0.824)
-
1.929
(0.742)
-
0.406
(0.741)
0.145
(0.742)
1.288
(0.770)
0.288
(0.769)
3.628
(0.770)
1.361
(0.771)
0.307
(0.770)
3.903
(0.771)
-
0.645
(0.891)
-
0.121
(0.891)
0.524
(0.891)
1.559
(0.772)
0.355
(0.771)
4.755
(0.772)
1.559
(0.772)
0.355
(0.771)
4.755
(0.772)
FOREIGN SALES
1.825
(0.260)
0.426
(0.268)
6.203
(0.260)
2.916
(0.113)
0.613
(0.113)
18.477
(0.006)
***
0.989
(0.307)
0.221
(0.310)
2.689
(0.307)
1.107
(0.381)
0.249
(0.385)
3.025
(0.381)
1.157
(0.417)
0.217
(0.428)
3.180
(0.417)
2.151
(0.177)
0.489
(0.188)
8.596
(0.177)
2.151
(0.177)
0.489
(0.188)
8.596
(0.177)
LN ASSETS 0.034
(0.959)
0.008
(0.959)
1.035
(0.959)
2.069
(0.006)
***
0.435
(0.004)
***
7.919
(0.006)
***
1.305
(0.019)
**
0.292
(0.016)
**
3.688
(0.019)
**
1.349
(0.030)
**
0.304
(0.024)
**
3.855
(0.030)
**
1.078
(0.055)
*
0.202
(0.048)
**
2.940
(0.055)
*
0.055
(0.925)
0.012
(0.965)
1.057
(0.925)
0.055
(0.925)
0.012
(0.925)
1.057
(0.925)
CRATIO -
0.421
-
0.098
0.655
0.614
0.129
1.849
-
0.537
-
0.120
0.584
-
0.618
-
0.139
0.538
-
0.069
-
0.013
0.932
-
1.032
-
0.235
0.355
-
1.032
-
0.235
0.355

136
(0.466)
(0.461)
(0.466)
(0.204)
(0.195)
(0.204)
(0.308)
(0.296)
(0.308)
(0.265)
(0.251)
(0.265)
(0.903)
(0.903)
(0.903)
(0.089)
*
(0.080)
*
(0.089)
*
(0.089)
*
(0.080)
*
(0.089)
*
Z-SCORE 0.258
(0.677)
0.060
(0.676)
1.295
(0.677)
0.848
(0.183)
0.178
(0.172)
2.336
(0.183)
0.934
(0.098)
*
0.209
(0.087)
*
2.545
(0.098)
*
1.236
(0.134)
0.279
(0.121)
3.444
(0.134)
1.379
(0.074)
*
0.258
(0.039)
**
3.972
(0.074)
*
0.593
(0.279)
0.135
(0.281)
1.810
(0.279)
0.593
(0.279)
0.135
(0.281)
1.810
(0.279)
_cons
-
1.162
(0.876)
0.312
(0.876)
-
28.647
(0.002)
***
3.6e-13
(0.002)
***
-
16.407
(0.023)
**
7.4e-08
(0.023)
**
-
17.018
(0.038)
**
4.0e-08
(0.038)
**
-
12.874
(0.058)
*
2.5e-06
(0.058)
*
1.866
(0.796)
6.468
(0.796)
-
3.404
(0.600)
0.033
(0.600)
Source: author’s elaboration – AIDA database and Annual Reports for foreign sales measure.
Summary Statistic for Logit Regression.
Statistics MOD.1 MOD.2 MOD.3 MOD.4 MOD.5 MOD.6 MOD.7
N. 61 61 61 61 61 61 61
No. of Users 23 23 23 23 23 23 23
Classified as Users 13 14 11 10 11 10 10
Classified as Non-Users 10 9 12 13 12 13 13
Sensitivity 56.52% 60.87% 47.83% 43.38% 47.83% 43.38% 43.38%
No. of Non-Users 38 38 38 38 38 38 38
Classified as users 4 5 6 6 8 6 6
Classified as Non-Users 34 33 32 32 30 32 32
Specificity 89.47% 86.84% 84.21% 84.21% 78.95% 84.21% 84.21%
Correctly Specified 77.05% 77.05% 70.49% 68.85% 67.21% 68.85% 68.85%
Chi-Square 23.93% 26.48% 11.53% 10.37% 16.78% 20.01% 20.01%
Probability 0.0005 0.0002 0.0734 0.1101 0.0101 0.0028 0.0028
Pseudo R-Square 0.2960 0.3276 0.1426 0.1282 0.2076 0.2475 0.2475
Log pseudo likelihood -28.454006 -27.179225 -34.654963 -35.236036 -32.029625 -30.413871 -30.41387
Source: author’s elaboration – AIDA database and Annual Reports for foreign sales measure.

137
Annex E: Standard Industrial Classification of Economic Activities SIC 2007
Tab.51 – SIC 2007.
Standard Industrial Classification of Economic Activities (SIC) is used to classify business establishments and
other standard units by the type of economic activity in which they are engaged. The new version of these
codes (SIC 2007) was adopted by the UK as from 1st January 2008.
SIC 2007 Description
SECTION
A
Agriculture, Forestry and Fishing
01110 Growing of cereals (except rice), leguminous crops and oil seeds
01120 Growing of rice
01130 Growing of vegetables and melons, roots and tubers
01140 Growing of sugar cane
01150 Growing of tobacco
01160 Growing of fibre crops
01190 Growing of other non-perennial crops
01210 Growing of grapes
01220 Growing of tropical and subtropical fruits
01230 Growing of citrus fruits
01240 Growing of pome fruits and stone fruits
01250 Growing of other tree and bush fruits and nuts
01260 Growing of oleaginous fruits
01270 Growing of beverage crops
01280 Growing of spices, aromatic, drug and pharmaceutical crops
01290 Growing of other perennial crops
01300 Plant propagation
01410 Raising of dairy cattle
01420 Raising of other cattle and buffaloes
01430 Raising of horses and other equines
01440 Raising of camels and camelids
01450 Raising of sheep and goats
01460 Raising of swine/pigs
01470 Raising of poultry
01490 Raising of other animals
01500 Mixed farming
01610 Support activities for crop production
01621 Farm animal boarding and care
01629 Support activities for animal production (other than farm animal boarding and care) n.e.c.
01630 Post-harvest crop activities
01640 Seed processing for propagation
01700 Hunting, trapping and related service activities
02100 Silviculture and other forestry activities

138
02200 Logging
02300 Gathering of wild growing non-wood products
02400 Support services to forestry
03110 Marine fishing
03120 Freshwater fishing
03210 Marine aquaculture
03220 Freshwater aquaculture
SECTION
B
Mining and Quarrying
05101 Deep coal mines
05102 Open cast coal working
05200 Mining of lignite
06100 Extraction of crude petroleum
06200 Extraction of natural gas
07100 Mining of iron ores
07210 Mining of uranium and thorium ores
07290 Mining of other non-ferrous metal ores
08110 Quarrying of ornamental and building stone, limestone, gypsum, chalk and slate
08120 Operation of gravel and sand pits; mining of clays and kaolin
08910 Mining of chemical and fertilizer minerals
08920 Extraction of peat
08930 Extraction of salt
08990 Other mining and quarrying n.e.c.
09100 Support activities for petroleum and natural gas mining
09900 Support activities for other mining and quarrying
SECTION
C
Manufacturing
10110 Processing and preserving of meat
10120 Processing and preserving of poultry meat
10130 Production of meat and poultry meat products
10200 Processing and preserving of fish, crustaceans and molluscs
10310 Processing and preserving of potatoes
10320 Manufacture of fruit and vegetable juice
10390 Other processing and preserving of fruit and vegetables
10410 Manufacture of oils and fats
10420 Manufacture of margarine and similar edible fats
10511 Liquid milk and cream production
10512 Butter and cheese production
10519 Manufacture of other milk products
10520 Manufacture of ice cream
10611 Grain milling

139
10612 Manufacture of breakfast cereals and cereals-based food
10620 Manufacture of starches and starch products
10710 Manufacture of bread; manufacture of fresh pastry goods and cakes
10720 Manufacture of rusks and biscuits; manufacture of preserved pastry goods and cakes
10730 Manufacture of macaroni, noodles, couscous and similar farinaceous products
10810 Manufacture of sugar
10821 Manufacture of cocoa and chocolate confectionery
10822 Manufacture of sugar confectionery
10831 Tea processing
10832 Production of coffee and coffee substitutes
10840 Manufacture of condiments and seasonings
10850 Manufacture of prepared meals and dishes
10860 Manufacture of homogenized food preparations and dietetic food
10890 Manufacture of other food products n.e.c.
10910 Manufacture of prepared feeds for farm animals
10920 Manufacture of prepared pet foods
11010 Distilling, rectifying and blending of spirits
11020 Manufacture of wine from grape
11030 Manufacture of cider and other fruit wines
11040 Manufacture of other non-distilled fermented beverages
11050 Manufacture of beer
11060 Manufacture of malt
11070 Manufacture of soft drinks; production of mineral waters and other bottled waters
12000 Manufacture of tobacco products
13100 Preparation and spinning of textile fibres
13200 Weaving of textiles
13300 Finishing of textiles
13910 Manufacture of knitted and crocheted fabrics
13921 Manufacture of soft furnishings
13922 manufacture of canvas goods, sacks, etc.
13923 manufacture of household textiles
13931 Manufacture of woven or tufted carpets and rugs
13939 Manufacture of other carpets and rugs
13940 Manufacture of cordage, rope, twine and netting
13950 Manufacture of non-wovens and articles made from non-wovens, except apparel
13960 Manufacture of other technical and industrial textiles
13990 Manufacture of other textiles n.e.c.
14110 Manufacture of leather clothes
14120 Manufacture of workwear
14131 Manufacture of other men's outerwear

140
14132 Manufacture of other women's outerwear
14141 Manufacture of men's underwear
14142 Manufacture of women's underwear
14190 Manufacture of other wearing apparel and accessories n.e.c.
14200 Manufacture of articles of fur
14310 Manufacture of knitted and crocheted hosiery
14390 Manufacture of other knitted and crocheted apparel
15110 Tanning and dressing of leather; dressing and dyeing of fur
15120 Manufacture of luggage, handbags and the like, saddlery and harness
15200 Manufacture of footwear
16100 Sawmilling and planing of wood
16210 Manufacture of veneer sheets and wood-based panels
16220 Manufacture of assembled parquet floors
16230 Manufacture of other builders' carpentry and joinery
16240 Manufacture of wooden containers
16290 Manufacture of other products of wood; manufacture of articles of cork, straw and plaiting
materials
17110 Manufacture of pulp
17120 Manufacture of paper and paperboard
17211 Manufacture of corrugated paper and paperboard, sacks and bags
17219 Manufacture of other paper and paperboard containers
17220 Manufacture of household and sanitary goods and of toilet requisites
17230 Manufacture of paper stationery
17240 Manufacture of wallpaper
17290 Manufacture of other articles of paper and paperboard n.e.c.
18110 Printing of newspapers
18121 Manufacture of printed labels
18129 Printing n.e.c.
18130 Pre-press and pre-media services
18140 Binding and related services
18201 Reproduction of sound recording
18202 Reproduction of video recording
18203 Reproduction of computer media
19100 Manufacture of coke oven products
19201 Mineral oil refining
19209 Other treatment of petroleum products (excluding petrochemicals manufacture)
20110 Manufacture of industrial gases
20120 Manufacture of dyes and pigments
20130 Manufacture of other inorganic basic chemicals
20140 Manufacture of other organic basic chemicals
20150 Manufacture of fertilizers and nitrogen compounds

141
20160 Manufacture of plastics in primary forms
20170 Manufacture of synthetic rubber in primary forms
20200 Manufacture of pesticides and other agrochemical products
20301 Manufacture of paints, varnishes and similar coatings, mastics and sealants
20302 Manufacture of printing ink
20411 Manufacture of soap and detergents
20412 Manufacture of cleaning and polishing preparations
20420 Manufacture of perfumes and toilet preparations
20510 Manufacture of explosives
20520 Manufacture of glues
20530 Manufacture of essential oils
20590 Manufacture of other chemical products n.e.c.
20600 Manufacture of man-made fibres
21100 Manufacture of basic pharmaceutical products
21200 Manufacture of pharmaceutical preparations
22110 Manufacture of rubber tyres and tubes; retreading and rebuilding of rubber tyres
22190 Manufacture of other rubber products
22210 Manufacture of plastic plates, sheets, tubes and profiles
22220 Manufacture of plastic packing goods
22230 Manufacture of builders ware of plastic
22290 Manufacture of other plastic products
23110 Manufacture of flat glass
23120 Shaping and processing of flat glass
23130 Manufacture of hollow glass
23140 Manufacture of glass fibres
23190 Manufacture and processing of other glass, including technical glassware
23200 Manufacture of refractory products
23310 Manufacture of ceramic tiles and flags
23320 Manufacture of bricks, tiles and construction products, in baked clay
23410 Manufacture of ceramic household and ornamental articles
23420 Manufacture of ceramic sanitary fixtures
23430 Manufacture of ceramic insulators and insulating fittings
23440 Manufacture of other technical ceramic products
23490 Manufacture of other ceramic products n.e.c.
23510 Manufacture of cement
23520 Manufacture of lime and plaster
23610 Manufacture of concrete products for construction purposes
23620 Manufacture of plaster products for construction purposes
23630 Manufacture of ready-mixed concrete
23640 Manufacture of mortars
142
23650 Manufacture of fibre cement
23690 Manufacture of other articles of concrete, plaster and cement
23700 Cutting, shaping and finishing of stone
23910 Production of abrasive products
23990 Manufacture of other non-metallic mineral products n.e.c.
24100 Manufacture of basic iron and steel and of ferro-alloys
24200 Manufacture of tubes, pipes, hollow profiles and related fittings, of steel
24310 Cold drawing of bars
24320 Cold rolling of narrow strip
24330 Cold forming or folding
24340 Cold drawing of wire
24410 Precious metals production
24420 Aluminium production
24430 Lead, zinc and tin production
24440 Copper production
24450 Other non-ferrous metal production
24460 Processing of nuclear fuel
24510 Casting of iron
24520 Casting of steel
24530 Casting of light metals
24540 Casting of other non-ferrous metals
25110 Manufacture of metal structures and parts of structures
25120 Manufacture of doors and windows of metal
25210 Manufacture of central heating radiators and boilers
25290 Manufacture of other tanks, reservoirs and containers of metal
25300 Manufacture of steam generators, except central heating hot water boilers
25400 Manufacture of weapons and ammunition
25500 Forging, pressing, stamping and roll-forming of metal; powder metallurgy
25610 Treatment and coating of metals
25620 Machining
25710 Manufacture of cutlery
25720 Manufacture of locks and hinges
25730 Manufacture of tools
25910 Manufacture of steel drums and similar containers
25920 Manufacture of light metal packaging
25930 Manufacture of wire products, chain and springs
25940 Manufacture of fasteners and screw machine products
25990 Manufacture of other fabricated metal products n.e.c.
26110 Manufacture of electronic components
26120 Manufacture of loaded electronic boards

143
26200 Manufacture of computers and peripheral equipment
26301 Manufacture of telegraph and telephone apparatus and equipment
26309 Manufacture of communication equipment other than telegraph, and telephone apparatus and
equipment
26400 Manufacture of consumer electronics
26511 Manufacture of electronic measuring, testing etc. equipment, not for industrial process control
26512 Manufacture of electronic industrial process control equipment
26513 Manufacture of non-electronic measuring, testing etc. equipment, not for industrial process
control
26514 Manufacture of non-electronic industrial process control equipment
26520 Manufacture of watches and clocks
26600 Manufacture of irradiation, electromedical and electrotherapeutic equipment
26701 Manufacture of optical precision instruments
26702 Manufacture of photographic and cinematographic equipment
26800 Manufacture of magnetic and optical media
27110 Manufacture of electric motors, generators and transformers
27120 Manufacture of electricity distribution and control apparatus
27200 Manufacture of batteries and accumulators
27310 Manufacture of fibre optic cables
27320 Manufacture of other electronic and electric wires and cables
27330 Manufacture of wiring devices
27400 Manufacture of electric lighting equipment
27510 Manufacture of electric domestic appliances
27520 Manufacture of non-electric domestic appliances
27900 Manufacture of other electrical equipment
28110 Manufacture of engines and turbines, except aircraft, vehicle and cycle engines
28120 Manufacture of fluid power equipment
28131 Manufacture of pumps
28132 Manufacture of compressors
28140 Manufacture of taps and valves
28150 Manufacture of bearings, gears, gearing and driving elements
28210 Manufacture of ovens, furnaces and furnace burners
28220 Manufacture of lifting and handling equipment
28230 Manufacture of office machinery and equipment (except computers and peripheral equipment)
28240 Manufacture of power-driven hand tools
28250 Manufacture of non-domestic cooling and ventilation equipment
28290 Manufacture of other general-purpose machinery n.e.c.
28301 Manufacture of agricultural tractors
28302 Manufacture of agricultural and forestry machinery other than tractors
28410 Manufacture of metal forming machinery
28490 Manufacture of other machine tools

144
28910 Manufacture of machinery for metallurgy
28921 Manufacture of machinery for mining
28922 Manufacture of earthmoving equipment
28923 Manufacture of equipment for concrete crushing and screening and roadworks
28930 Manufacture of machinery for food, beverage and tobacco processing
28940 Manufacture of machinery for textile, apparel and leather production
28950 Manufacture of machinery for paper and paperboard production
28960 Manufacture of plastics and rubber machinery
28990 Manufacture of other special-purpose machinery n.e.c.
29100 Manufacture of motor vehicles
29201 Manufacture of bodies (coachwork) for motor vehicles (except caravans)
29202 Manufacture of trailers and semi-trailers
29203 Manufacture of caravans
29310 Manufacture of electrical and electronic equipment for motor vehicles and their engines
29320 Manufacture of other parts and accessories for motor vehicles
30110 Building of ships and floating structures
30120 Building of pleasure and sporting boats
30200 Manufacture of railway locomotives and rolling stock
30300 Manufacture of air and spacecraft and related machinery
30400 Manufacture of military fighting vehicles
30910 Manufacture of motorcycles
30920 Manufacture of bicycles and invalid carriages
30990 Manufacture of other transport equipment n.e.c.
31010 Manufacture of office and shop furniture
31020 Manufacture of kitchen furniture
31030 Manufacture of mattresses
31090 Manufacture of other furniture
32110 Striking of coins
32120 Manufacture of jewellery and related articles
32130 Manufacture of imitation jewellery and related articles
32200 Manufacture of musical instruments
32300 Manufacture of sports goods
32401 Manufacture of professional and arcade games and toys
32409 Manufacture of other games and toys, n.e.c.
32500 Manufacture of medical and dental instruments and supplies
32910 Manufacture of brooms and brushes
32990 Other manufacturing n.e.c.
33110 Repair of fabricated metal products
33120 Repair of machinery
33130 Repair of electronic and optical equipment

145
33140 Repair of electrical equipment
33150 Repair and maintenance of ships and boats
33160 Repair and maintenance of aircraft and spacecraft
33170 Repair and maintenance of other transport equipment n.e.c.
33190 Repair of other equipment
33200 Installation of industrial machinery and equipment
SECTION
D
Electricity, gas, steam and air conditioning supply
35110 Production of electricity
35120 Transmission of electricity
35130 Distribution of electricity
35140 Trade of electricity
35210 Manufacture of gas
35220 Distribution of gaseous fuels through mains
35230 Trade of gas through mains
35300 Steam and air conditioning supply
SECTION
E
Water supply, sewerage, waste management and remediation activities
36000 Water collection, treatment and supply
37000 Sewerage
38110 Collection of non-hazardous waste
38120 Collection of hazardous waste
38210 Treatment and disposal of non-hazardous waste
38220 Treatment and disposal of hazardous waste
38310 Dismantling of wrecks
38320 Recovery of sorted materials
39000 Remediation activities and other waste management services
SECTION
F
Construction
41100 Development of building projects
41201 Construction of commercial buildings
41202 Construction of domestic buildings
42110 Construction of roads and motorways
42120 Construction of railways and underground railways
42130 Construction of bridges and tunnels
42210 Construction of utility projects for fluids
42220 Construction of utility projects for electricity and telecommunications
42910 Construction of water projects
42990 Construction of other civil engineering projects n.e.c.
43110 Demolition
43120 Site preparation

146
43130 Test drilling and boring
43210 Electrical installation
43220 Plumbing, heat and air-conditioning installation
43290 Other construction installation
43310 Plastering
43320 Joinery installation
43330 Floor and wall covering
43341 Painting
43342 Glazing
43390 Other building completion and finishing
43910 Roofing activities
43991 Scaffold erection
43999 Other specialised construction activities n.e.c.
SECTION
G
Wholesale and retail trade; repair of motor vehicles and motorcycles
45111 Sale of new cars and light motor vehicles
45112 Sale of used cars and light motor vehicles
45190 Sale of other motor vehicles
45200 Maintenance and repair of motor vehicles
45310 Wholesale trade of motor vehicle parts and accessories
45320 Retail trade of motor vehicle parts and accessories
45400 Sale, maintenance and repair of motorcycles and related parts and accessories
46110 Agents selling agricultural raw materials, livestock, textile raw materials and semi-finished
goods
46120 Agents involved in the sale of fuels, ores, metals and industrial chemicals
46130 Agents involved in the sale of timber and building materials
46140 Agents involved in the sale of machinery, industrial equipment, ships and aircraft
46150 Agents involved in the sale of furniture, household goods, hardware and ironmongery
46160 Agents involved in the sale of textiles, clothing, fur, footwear and leather goods
46170 Agents involved in the sale of food, beverages and tobacco
46180 Agents specialised in the sale of other particular products
46190 Agents involved in the sale of a variety of goods
46210 Wholesale of grain, unmanufactured tobacco, seeds and animal feeds
46220 Wholesale of flowers and plants
46230 Wholesale of live animals
46240 Wholesale of hides, skins and leather
46310 Wholesale of fruit and vegetables
46320 Wholesale of meat and meat products
46330 Wholesale of dairy products, eggs and edible oils and fats
46341 Wholesale of fruit and vegetable juices, mineral water and soft drinks
46342 Wholesale of wine, beer, spirits and other alcoholic beverages

147
46350 Wholesale of tobacco products
46360 Wholesale of sugar and chocolate and sugar confectionery
46370 Wholesale of coffee, tea, cocoa and spices
46380 Wholesale of other food, including fish, crustaceans and molluscs
46390 Non-specialised wholesale of food, beverages and tobacco
46410 Wholesale of textiles
46420 Wholesale of clothing and footwear
46431 Wholesale of audio tapes, records, CDs and video tapes and the equipment on which these
are played
46439 Wholesale of radio, television goods & electrical household appliances (other than records,
tapes, CD's & video tapes and the equipment used for playing them)
46440 Wholesale of china and glassware and cleaning materials
46450 Wholesale of perfume and cosmetics
46460 Wholesale of pharmaceutical goods
46470 Wholesale of furniture, carpets and lighting equipment
46480 Wholesale of watches and jewellery
46491 Wholesale of musical instruments
46499 Wholesale of household goods (other than musical instruments) n.e.c
46510 Wholesale of computers, computer peripheral equipment and software
46520 Wholesale of electronic and telecommunications equipment and parts
46610 Wholesale of agricultural machinery, equipment and supplies
46620 Wholesale of machine tools
46630 Wholesale of mining, construction and civil engineering machinery
46640 Wholesale of machinery for the textile industry and of sewing and knitting machines
46650 Wholesale of office furniture
46660 Wholesale of other office machinery and equipment
46690 Wholesale of other machinery and equipment
46711 Wholesale of petroleum and petroleum products
46719 Wholesale of other fuels and related products
46720 Wholesale of metals and metal ores
46730 Wholesale of wood, construction materials and sanitary equipment
46740 Wholesale of hardware, plumbing and heating equipment and supplies
46750 Wholesale of chemical products
46760 Wholesale of other intermediate products
46770 Wholesale of waste and scrap
46900 Non-specialised wholesale trade
47110 Retail sale in non-specialised stores with food, beverages or tobacco predominating
47190 Other retail sale in non-specialised stores
47210 Retail sale of fruit and vegetables in specialised stores
47220 Retail sale of meat and meat products in specialised stores
47230 Retail sale of fish, crustaceans and molluscs in specialised stores

148
47240 Retail sale of bread, cakes, flour confectionery and sugar confectionery in specialised stores
47250 Retail sale of beverages in specialised stores
47260 Retail sale of tobacco products in specialised stores
47290 Other retail sale of food in specialised stores
47300 Retail sale of automotive fuel in specialised stores
47410 Retail sale of computers, peripheral units and software in specialised stores
47421 Retail sale of mobile telephones
47429 Retail sale of telecommunications equipment other than mobile telephones
47430 Retail sale of audio and video equipment in specialised stores
47510 Retail sale of textiles in specialised stores
47520 Retail sale of hardware, paints and glass in specialised stores
47530 Retail sale of carpets, rugs, wall and floor coverings in specialised stores
47540 Retail sale of electrical household appliances in specialised stores
47591 Retail sale of musical instruments and scores
47599 Retail of furniture, lighting, and similar (not musical instruments or scores) in specialised store
47610 Retail sale of books in specialised stores
47620 Retail sale of newspapers and stationery in specialised stores
47630 Retail sale of music and video recordings in specialised stores
47640 Retail sale of sports goods, fishing gear, camping goods, boats and bicycles
47650 Retail sale of games and toys in specialised stores
47710 Retail sale of clothing in specialised stores
47721 Retail sale of footwear in specialised stores
47722 Retail sale of leather goods in specialised stores
47730 Dispensing chemist in specialised stores
47741 Retail sale of hearing aids
47749 Retail sale of medical and orthopaedic goods in specialised stores (not incl. hearing aids)
n.e.c.
47750 Retail sale of cosmetic and toilet articles in specialised stores
47760 Retail sale of flowers, plants, seeds, fertilizers, pet animals and pet food in specialised stores
47770 Retail sale of watches and jewellery in specialised stores
47781 Retail sale in commercial art galleries
47782 Retail sale by opticians
47789 Other retail sale of new goods in specialised stores (not commercial art galleries and
opticians)
47791 Retail sale of antiques including antique books in stores
47799 Retail sale of other second-hand goods in stores (not incl. antiques)
47810 Retail sale via stalls and markets of food, beverages and tobacco products
47820 Retail sale via stalls and markets of textiles, clothing and footwear
47890 Retail sale via stalls and markets of other goods
47910 Retail sale via mail order houses or via Internet
47990 Other retail sale not in stores, stalls or markets

149
SECTION
H
Transportation and storage
49100 Passenger rail transport, interurban
49200 Freight rail transport
49311 Urban and suburban passenger railway transportation by underground, metro and similar
systems
49319 Other urban, suburban or metropolitan passenger land transport (not underground, metro or
similar)
49320 Taxi operation
49390 Other passenger land transport
49410 Freight transport by road
49420 Removal services
49500 Transport via pipeline
50100 Sea and coastal passenger water transport
50200 Sea and coastal freight water transport
50300 Inland passenger water transport
50400 Inland freight water transport
51101 Scheduled passenger air transport
51102 Non-scheduled passenger air transport
51210 Freight air transport
51220 Space transport
52101 Operation of warehousing and storage facilities for water transport activities
52102 Operation of warehousing and storage facilities for air transport activities
52103 Operation of warehousing and storage facilities for land transport activities
52211 Operation of rail freight terminals
52212 Operation of rail passenger facilities at railway stations
52213 Operation of bus and coach passenger facilities at bus and coach stations
52219 Other service activities incidental to land transportation, n.e.c.
52220 Service activities incidental to water transportation
52230 Service activities incidental to air transportation
52241 Cargo handling for water transport activities
52242 Cargo handling for air transport activities
52243 Cargo handling for land transport activities
52290 Other transportation support activities
53100 Postal activities under universal service obligation
53201 Licensed carriers
53202 Unlicensed carriers
SECTION I Accommodation and food service activities
55100 Hotels and similar accommodation
55201 Holiday centres and villages
55202 Youth hostels

150
55209 Other holiday and other collective accommodation
55300 Recreational vehicle parks, trailer parks and camping grounds
55900 Other accommodation
56101 Licenced restaurants
56102 Unlicenced restaurants and cafes
56103 Take-away food shops and mobile food stands
56210 Event catering activities
56290 Other food services
56301 Licenced clubs
56302 Public houses and bars
SECTION
J
Information and communication
58110 Book publishing
58120 Publishing of directories and mailing lists
58130 Publishing of newspapers
58141 Publishing of learned journals
58142 Publishing of consumer and business journals and periodicals
58190 Other publishing activities
58210 Publishing of computer games
58290 Other software publishing
59111 Motion picture production activities
59112 Video production activities
59113 Television programme production activities
59120 Motion picture, video and television programme post-production activities
59131 Motion picture distribution activities
59132 Video distribution activities
59133 Television programme distribution activities
59140 Motion picture projection activities
59200 Sound recording and music publishing activities
60100 Radio broadcasting
60200 Television programming and broadcasting activities
61100 Wired telecommunications activities
61200 Wireless telecommunications activities
61300 Satellite telecommunications activities
61900 Other telecommunications activities
62011 Ready-made interactive leisure and entertainment software development
62012 Business and domestic software development
62020 Information technology consultancy activities
62030 Computer facilities management activities
62090 Other information technology service activities
63110 Data processing, hosting and related activities

151
63120 Web portals
63910 News agency activities
63990 Other information service activities n.e.c.
SECTION
K
Financial and insurance activities
64110 Central banking
64191 Banks
64192 Building societies
64201 Activities of agricultural holding companies
64202 Activities of production holding companies
64203 Activities of construction holding companies
64204 Activities of distribution holding companies
64205 Activities of financial services holding companies
64209 Activities of other holding companies n.e.c.
64301 Activities of investment trusts
64302 Activities of unit trusts
64303 Activities of venture and development capital companies
64304 Activities of open-ended investment companies
64305 Activities of property unit trusts
64306 Activities of real estate investment trusts
64910 Financial leasing
64921 Credit granting by non-deposit taking finance houses and other specialist consumer credit
grantors
64922 Activities of mortgage finance companies
64929 Other credit granting n.e.c.
64991 Security dealing on own account
64992 Factoring
64999 Financial intermediation not elsewhere classified
65110 Life insurance
65120 Non-life insurance
65201 Life reinsurance
65202 Non-life reinsurance
65300 Pension funding
66110 Administration of financial markets
66120 Security and commodity contracts dealing activities
66190 Activities auxiliary to financial intermediation n.e.c.
66210 Risk and damage evaluation
66220 Activities of insurance agents and brokers
66290 Other activities auxiliary to insurance and pension funding
66300 Fund management activities
SECTION Real estate activities

152
L
68100 Buying and selling of own real estate
68201 Renting and operating of Housing Association real estate
68202 Letting and operating of conference and exhibition centres
68209 Other letting and operating of own or leased real estate
68310 Real estate agencies
68320 Management of real estate on a fee or contract basis
SECTION
M
Professional, scientific and technical activities
69101 Barristers at law
69102 Solicitors
69109 Activities of patent and copyright agents; other legal activities n.e.c.
69201 Accounting and auditing activities
69202 Bookkeeping activities
69203 Tax consultancy
70100 Activities of head offices
70210 Public relations and communications activities
70221 Financial management
70229 Management consultancy activities other than financial management
71111 Architectural activities
71112 Urban planning and landscape architectural activities
71121 Engineering design activities for industrial process and production
71122 Engineering related scientific and technical consulting activities
71129 Other engineering activities
71200 Technical testing and analysis
72110 Research and experimental development on biotechnology
72190 Other research and experimental development on natural sciences and engineering
72200 Research and experimental development on social sciences and humanities
73110 Advertising agencies
73120 Media representation services
73200 Market research and public opinion polling
74100 specialised design activities
74201 Portrait photographic activities
74202 Other specialist photography
74203 Film processing
74209 Photographic activities not elsewhere classified
74300 Translation and interpretation activities
74901 Environmental consulting activities
74902 Quantity surveying activities
74909 Other professional, scientific and technical activities n.e.c.
74990 Non-trading companynon trading

153
75000 Veterinary activities
SECTION
N
Administrative and support service activities
77110 Renting and leasing of cars and light motor vehicles
77120 Renting and leasing of trucks and other heavy vehicles
77210 Renting and leasing of recreational and sports goods
77220 Renting of video tapes and disks
77291 Renting and leasing of media entertainment equipment
77299 Renting and leasing of other personal and household goods
77310 Renting and leasing of agricultural machinery and equipment
77320 Renting and leasing of construction and civil engineering machinery and equipment
77330 Renting and leasing of office machinery and equipment (including computers)
77341 Renting and leasing of passenger water transport equipment
77342 Renting and leasing of freight water transport equipment
77351 Renting and leasing of air passenger transport equipment
77352 Renting and leasing of freight air transport equipment
77390 Renting and leasing of other machinery, equipment and tangible goods n.e.c.
77400 Leasing of intellectual property and similar products, except copyright works
78101 Motion picture, television and other theatrical casting activities
78109 Other activities of employment placement agencies
78200 Temporary employment agency activities
78300 Human resources provision and management of human resources functions
79110 Travel agency activities
79120 Tour operator activities
79901 Activities of tourist guides
79909 Other reservation service activities n.e.c.
80100 Private security activities
80200 Security systems service activities
80300 Investigation activities
81100 Combined facilities support activities
81210 General cleaning of buildings
81221 Window cleaning services
81222 Specialised cleaning services
81223 Furnace and chimney cleaning services
81229 Other building and industrial cleaning activities
81291 Disinfecting and exterminating services
81299 Other cleaning services
81300 Landscape service activities
82110 Combined office administrative service activities
82190 Photocopying, document preparation and other specialised office support activities
82200 Activities of call centres

154
82301 Activities of exhibition and fair organisers
82302 Activities of conference organisers
82911 Activities of collection agencies
82912 Activities of credit bureaus
82920 Packaging activities
82990 Other business support service activities n.e.c.
SECTION
O
Public administration and defence; compulsory social security
84110 General public administration activities
84120 Regulation of health care, education, cultural and other social services, not incl. social security
84130 Regulation of and contribution to more efficient operation of businesses
84210 Foreign affairs
84220 Defence activities
84230 Justice and judicial activities
84240 Public order and safety activities
84250 Fire service activities
84300 Compulsory social security activities
SECTION
P
Education
85100 Pre-primary education
85200 Primary education
85310 General secondary education
85320 Technical and vocational secondary education
85410 Post-secondary non-tertiary education
85421 First-degree level higher education
85422 Post-graduate level higher education
85510 Sports and recreation education
85520 Cultural education
85530 Driving school activities
85590 Other education n.e.c.
85600 Educational support services
SECTION
Q
Human health and social work activities
86101 Hospital activities
86102 Medical nursing home activities
86210 General medical practice activities
86220 Specialists medical practice activities
86230 Dental practice activities
86900 Other human health activities
87100 Residential nursing care facilities
87200 Residential care activities for learning difficulties, mental health and substance abuse

155
87300 Residential care activities for the elderly and disabled
87900 Other residential care activities n.e.c.
88100 Social work activities without accommodation for the elderly and disabled
88910 Child day-care activities
88990 Other social work activities without accommodation n.e.c.
SECTION
R
Arts, entertainment and recreation
90010 Performing arts
90020 Support activities to performing arts
90030 Artistic creation
90040 Operation of arts facilities
91011 Library activities
91012 Archives activities
91020 Museums activities
91030 Operation of historical sites and buildings and similar visitor attractions
91040 Botanical and zoological gardens and nature reserves activities
92000 Gambling and betting activities
93110 Operation of sports facilities
93120 Activities of sport clubs
93130 Fitness facilities
93191 Activities of racehorse owners
93199 Other sports activities
93210 Activities of amusement parks and theme parks
93290 Other amusement and recreation activities n.e.c.
SECTION
S
Other service activities
94110 Activities of business and employers membership organisations
94120 Activities of professional membership organisations
94200 Activities of trade unions
94910 Activities of religious organisations
94920 Activities of political organisations
94990 Activities of other membership organisations n.e.c.
95110 Repair of computers and peripheral equipment
95120 Repair of communication equipment
95210 Repair of consumer electronics
95220 Repair of household appliances and home and garden equipment
95230 Repair of footwear and leather goods
95240 Repair of furniture and home furnishings
95250 Repair of watches, clocks and jewellery
95290 Repair of personal and household goods n.e.c.
96010 Washing and (dry-)cleaning of textile and fur products

156
96020 Hairdressing and other beauty treatment
96030 Funeral and related activities
96040 Physical well-being activities
96090 Other service activities n.e.c.
SECTION
T
Activities of households as employers; undifferentiated goods- and services-producing
activities of households for own use
97000 Activities of households as employers of domestic personnel
98000 Residents property management
98100 Undifferentiated goods-producing activities of private households for own use
98200 Undifferentiated service-producing activities of private households for own use
SECTION
U
Activities of extraterritorial organisations and bodies
99000 Activities of extraterritorial organisations and bodies
99999 Dormant Company
Source: ompany House