Embed Size (px)
Citation preview
1
Dr. Chayanin KerdpholngarmOffice of Insurance Commission
Thailand26th January 2012
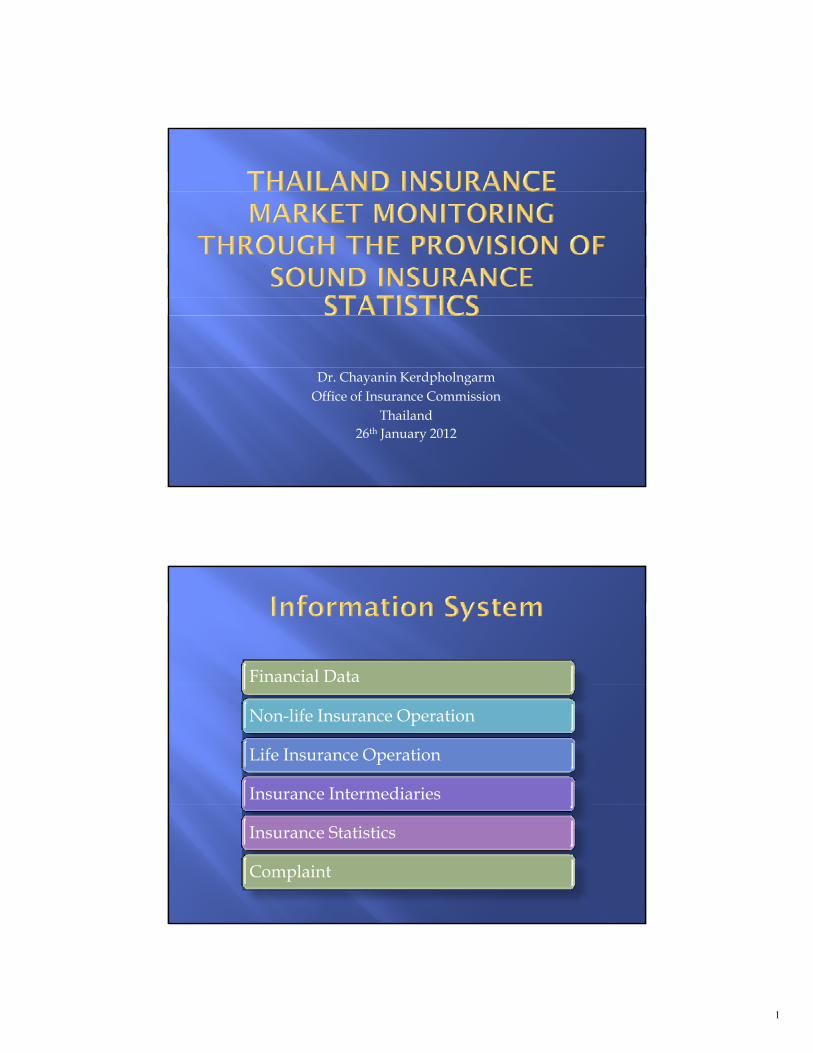
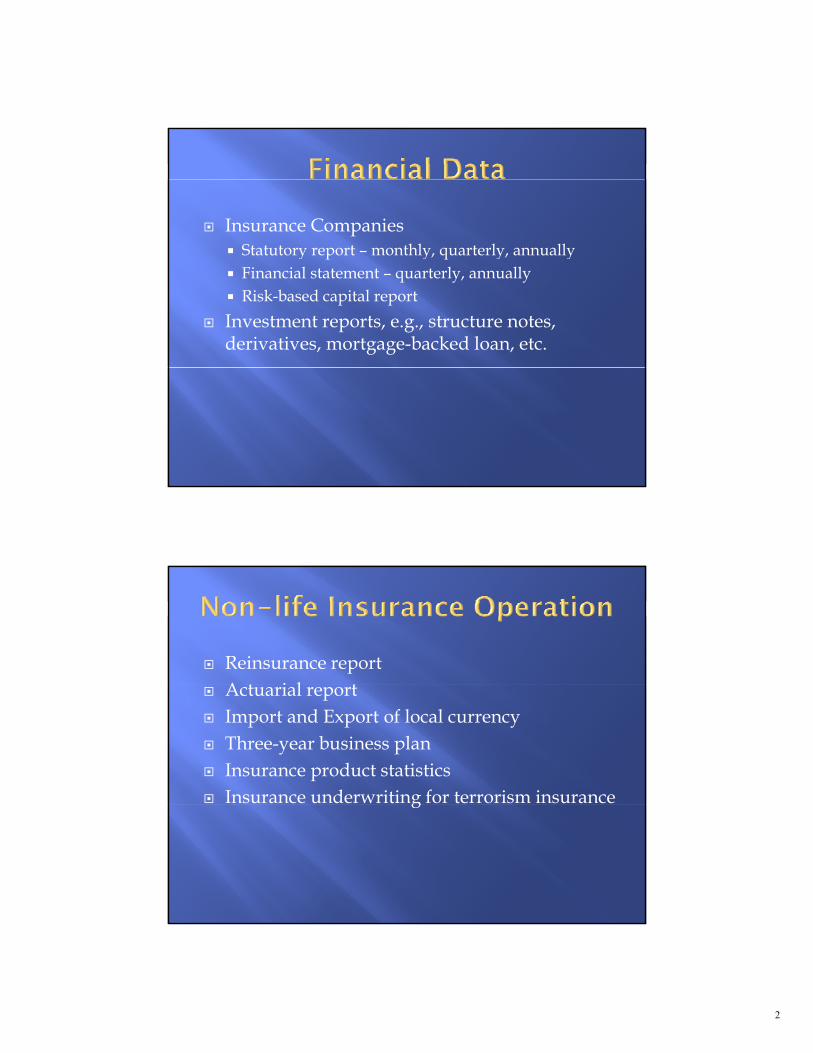
Financial Data
Non-life Insurance Operation
Life Insurance Operation
Insurance Intermediaries
Insurance Statistics
Complaint
2
Insurance CompaniesSt tut r r p rt m nthl u rt rl nnu ll Statutory report – monthly, quarterly, annually
Financial statement – quarterly, annually Risk-based capital report
Investment reports, e.g., structure notes, derivatives, mortgage-backed loan, etc.
Reinsurance reportA t i l t Actuarial report
Import and Export of local currency Three-year business plan Insurance product statistics Insurance underwriting for terrorism insuranceg
3
Life product statisticsI t t li k d i d t t ti ti Investment-linked insurance product statistics
Statistics for product pricing Actuarial report Three-year business plan Import and Export of local currency p p y
Juristic person insurance brokerFin n i l r p rt Financial report
Direct insurance and reinsurance arrangement Income and expense – for banks only
Insurance agent Registration
4
Premium written by provinces or branchesP i itt b di t ib ti h l Premium written by distribution channel
Statistics of employee in insurance companies
Total Foreign Foreign Total
Thaijoint
ventureBranch Thai
joint venture
Branch
Companies Domestic Domestic
Number of Company Market share (%)
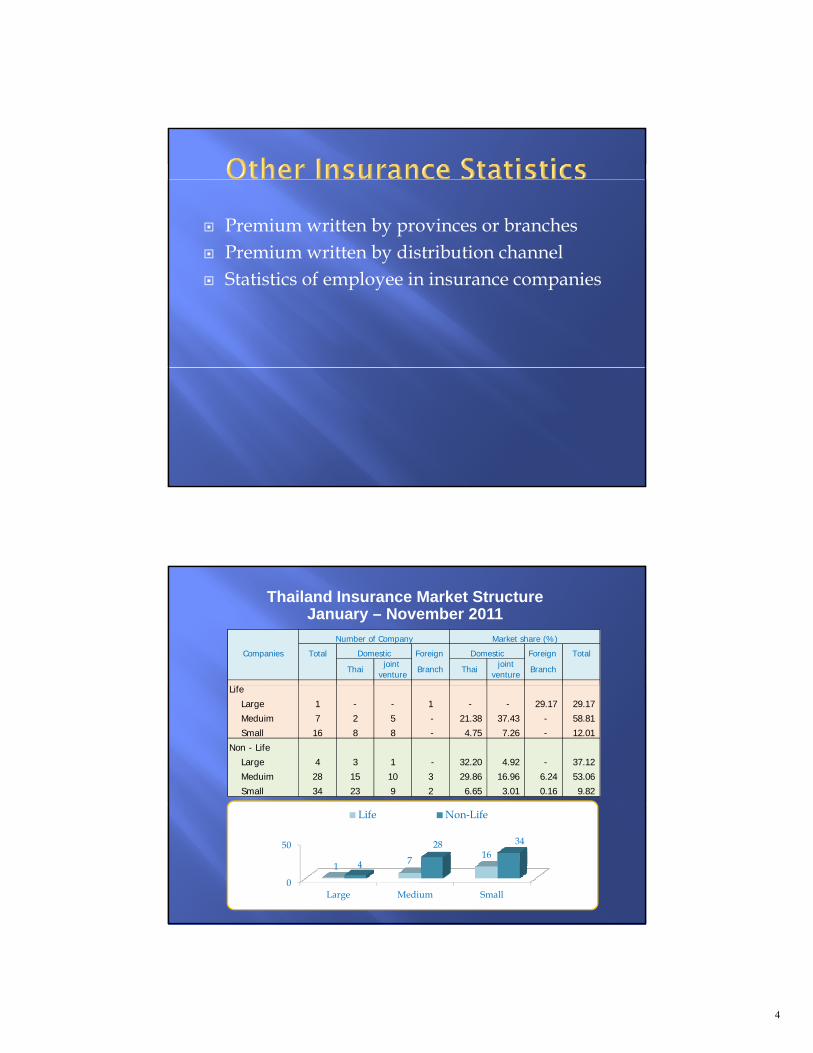
Thailand Insurance Market Structure January – November 2011
Life
Large 1 - - 1 - - 29.17 29.17
Meduim 7 2 5 - 21.38 37.43 - 58.81
Small 16 8 8 - 4.75 7.26 - 12.01
Non - Life
Large 4 3 1 - 32.20 4.92 - 37.12
Meduim 28 15 10 3 29.86 16.96 6.24 53.06
Small 34 23 9 2 6.65 3.01 0.16 9.82
0
50
Large Medium Small
17
164
28 34
Life Non-Life
5
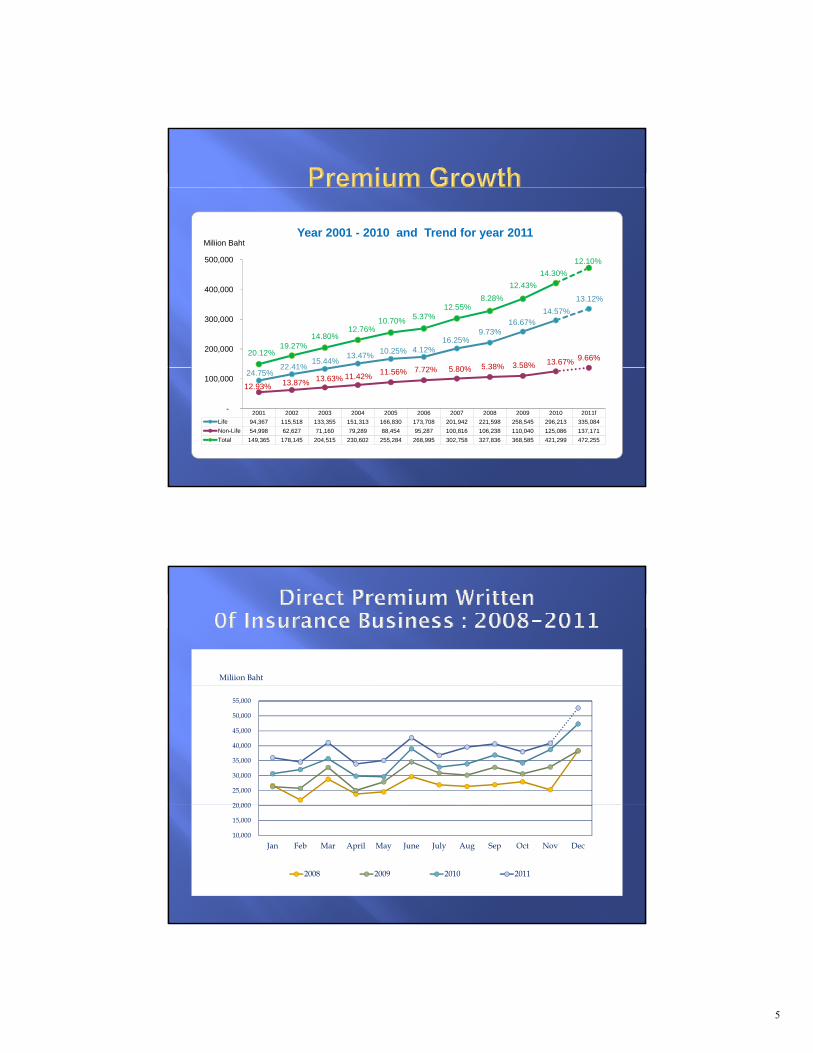
Miliion BahtYear 2001 - 2010 and Trend for year 2011
22 41%15.44%
13.47%10.25% 4.12%
16.25%9.73%
16.67%14.57%
13.12%
7 72% 5 80% 5 38% 3.58% 13.67% 9.66%20.12%
19.27%14.80%
12.76%10.70% 5.37%
12.55%8.28%
12.43%
14.30%
12.10%
200,000
300,000
400,000
500,000
2001 2002 2003 2004 2005 2006 2007 2008 2009 2010 2011f
Life 94,367 115,518 133,355 151,313 166,830 173,708 201,942 221,598 258,545 296,213 335,084
Non-Life 54,998 62,627 71,160 79,289 88,454 95,287 100,816 106,238 110,040 125,086 137,171
Total 149,365 178,145 204,515 230,602 255,284 268,995 302,758 327,836 368,585 421,299 472,255
24.75%22.41%
12.93% 13.87% 13.63% 11.42%11.56% 7.72% 5.80% 5.38% 3.58%
-
100,000
Miliion Baht
20 000
25,000
30,000
35,000
40,000
45,000
50,000
55,000
10,000
15,000
20,000
Jan Feb Mar April May June July Aug Sep Oct Nov Dec
2008 2009 2010 2011
6
33 675
39,426 100,000
120,000
140,000
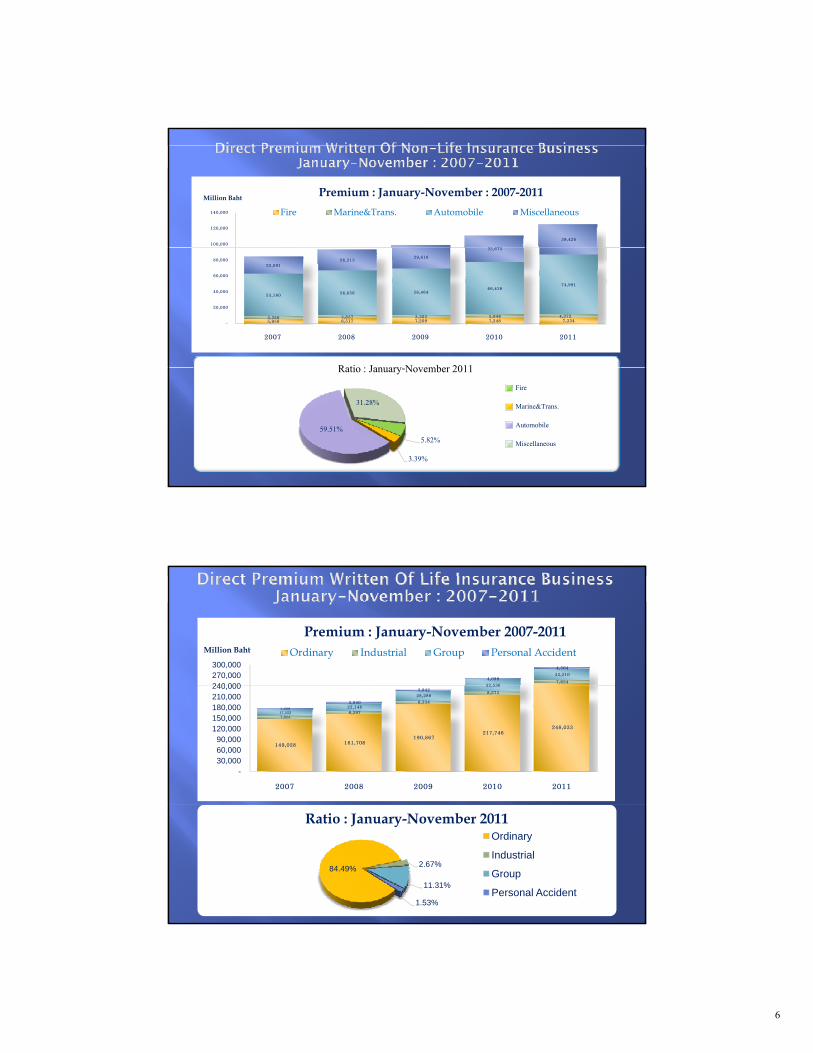
Million Baht Premium : January-November : 2007-2011
Fire Marine&Trans. Automobile Miscellaneous
R ti J N b 2011
5,958 6,517 7,209 7,248 7,334 3,356 3,837 3,303 3,946 4,272
53,180 56,856 58,464
66,438 74,991
22,091
26,213 29,816
33,675
-
20,000
40,000
60,000
80,000
2007 2008 2009 2010 2011
5.82%
3.39%
59.51%
31.28%
Ratio : January-November 2011Fire
Marine&Trans.
Automobile
Miscellaneous
7,824 32 536
33,210 4,099
4,504
240 000 270,000 300,000
Million Baht
Premium : January-November 2007-2011Ordinary Industrial Group Personal Accident
149,028 161,708 190,867
217,746 248,033
7,924
8,397
8,334
8,273
17,522
22,148
28,288
32,536
3,609
3,840
3,942
- 30,000 60,000 90,000
120,000 150,000 180,000 210,000 240,000
2007 2008 2009 2010 2011
84.49%2.67%
11.31%
1.53%
Ratio : January-November 2011Ordinary
Industrial
Group
Personal Accident
7
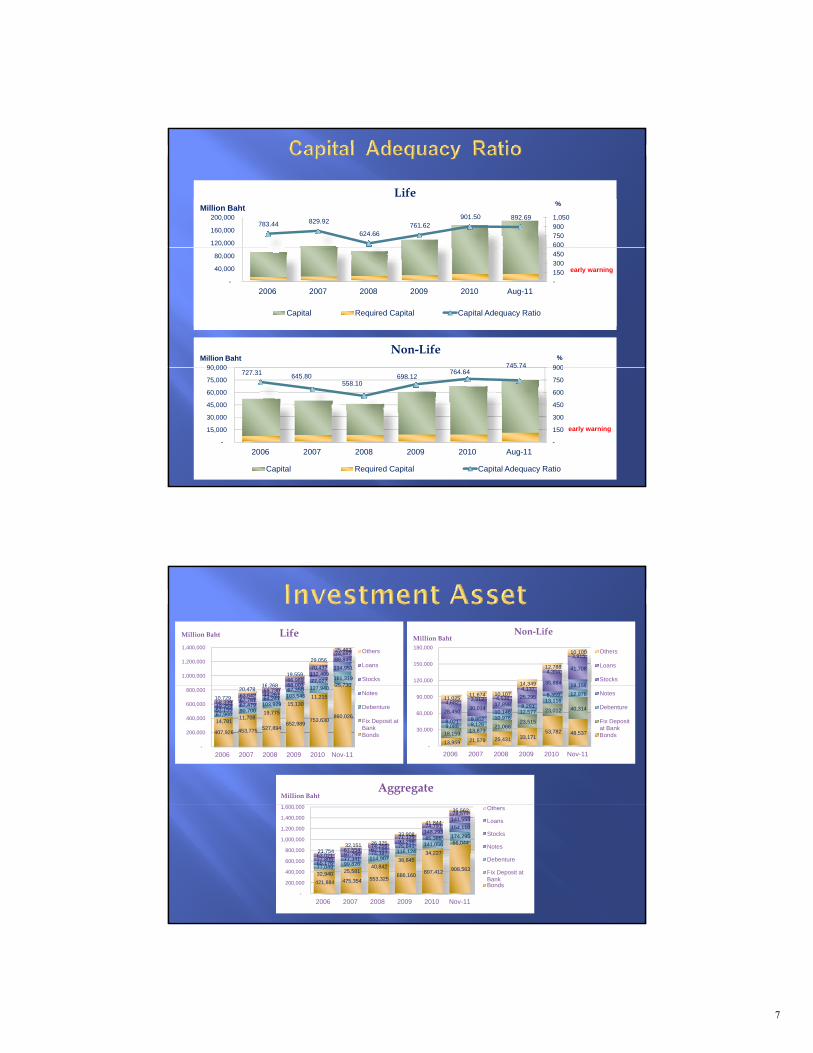
901 50 892 69
Million Baht
%Life
Capital Required Capital Capital Adequacy Ratio 783.44 829.92
624.66 761.62
901.50 892.69
600 750 900 1,050
120,000
160,000
200,000 Million Baht
%
Life
783.44 829.92
624.66 761.62
901.50 892.69
- 150 300 450 600 750 900 1,050
-
40,000
80,000
120,000
160,000
200,000
2006 2007 2008 2009 2010 Aug-11
early warning
- 150 300 450
-
40,000
80,000
2006 2007 2008 2009 2010 Aug-11
early warning
Capital Required Capital Capital Adequacy Ratio
745.74 90090 000
%Million BahtNon-Life
727.31 645.80 558.10
698.12 764.64
745.74
-
150
300
450
600
750
900
-
15,000
30,000
45,000
60,000
75,000
90,000
2006 2007 2008 2009 2010 Aug-11
early warning
Capital Required Capital Capital Adequacy Ratio
19 15935,884
41,708 4,354
3,915
14,349
12,788
10,100
120,000
150,000
180,000
Million BahtNon-Life
Others
Loans
Stocks25 730
161,319 77,027
134,951
68 003
112,409
99,845
66,989
70,437
74,662
16 268
19,559
29,056
25,462
1,000,000
1,200,000
1,400,000
Million Baht Life
Others
Loans
Stocks
13,959 21,579 25,431 33,171 53,782 48,537 18,159
13,873 21,066
23,515
23,012 40,314
9,088 9,126 10,978
12,577
13,116 12,976
8,021 9,862 10,146
8,291
8,359
19,159
28,450 30,014
17,898 25,295
,
4,682 3,912 4,536
4,137
11,025 11,674 10,107
14,349
-
30,000
60,000
90,000
2006 2007 2008 2009 2010 Nov-11
Notes
Debenture
Fix Deposit at BankBonds 407,926 453,775 527,894
652,989 753,630
860,026 14,781
11,708 19,775
15,130 11,215
25,730
67,960 90,700
103,929
103,546
127,940
57,155 67,479
64,241
67,350
49,354 67,781
44,267
68,003
58,339 63,642
69,730
10,729
20,478 16,268
-
200,000
400,000
600,000
800,000
2006 2007 2008 2009 2010 Nov-11
Notes
Debenture
Fix Deposit at BankBonds
Million BahtAggregate
421,884 475,354 553,325 686,160
807,412 908,563 32,940 25,581
40,842 38,645
34,227
66,044
77,049 99,826
114,907 116,124
141,056
174,295
65,176 77,341
74,387 75,641
85,385
154,110
77,805 97,795
62,165
93,298
148,293
141,553
63,021 67,554
74,266
71,125
74,791
78,577
21,754 32,151 26,375
33,908
41,844
35,562
-
200,000
400,000
600,000
800,000
1,000,000
1,200,000
1,400,000
1,600,000
2006 2007 2008 2009 2010 Nov-11
Others
Loans
Stocks
Notes
Debenture
Fix Deposit at BankBonds
8
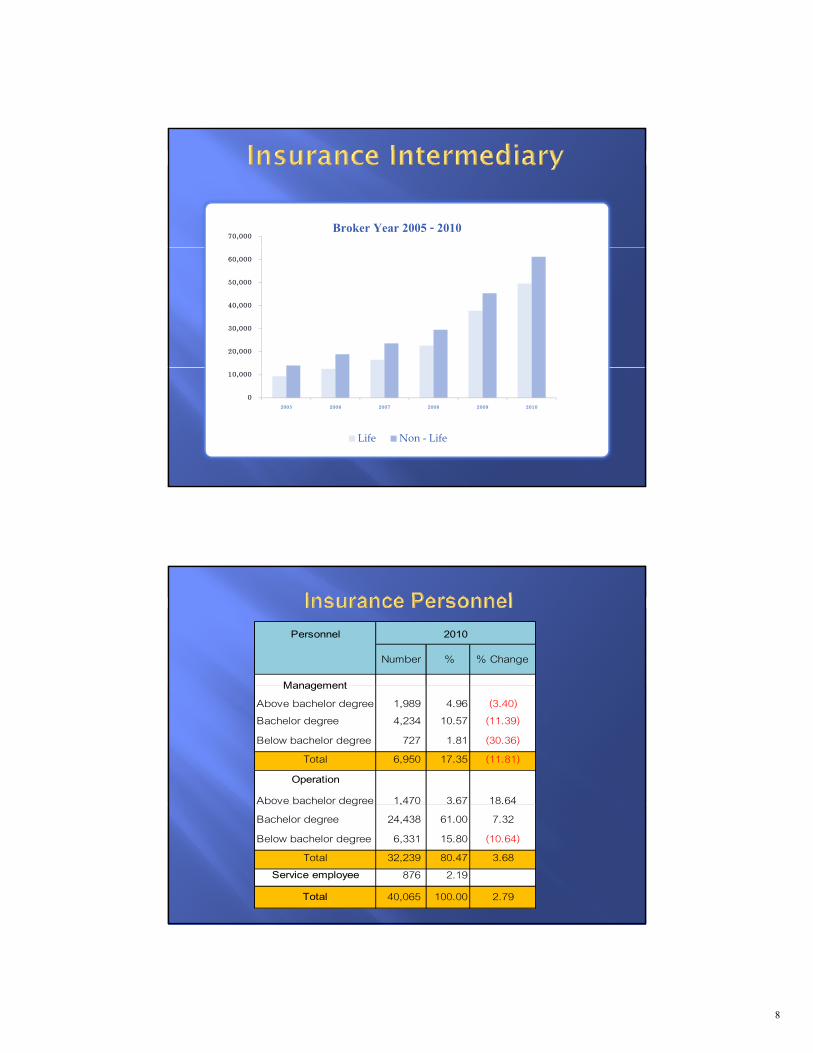
70,000Broker Year 2005 - 2010
20,000
30,000
40,000
50,000
60,000
0
10,000
2005 2006 2007 2008 2009 2010
Life Non - Life
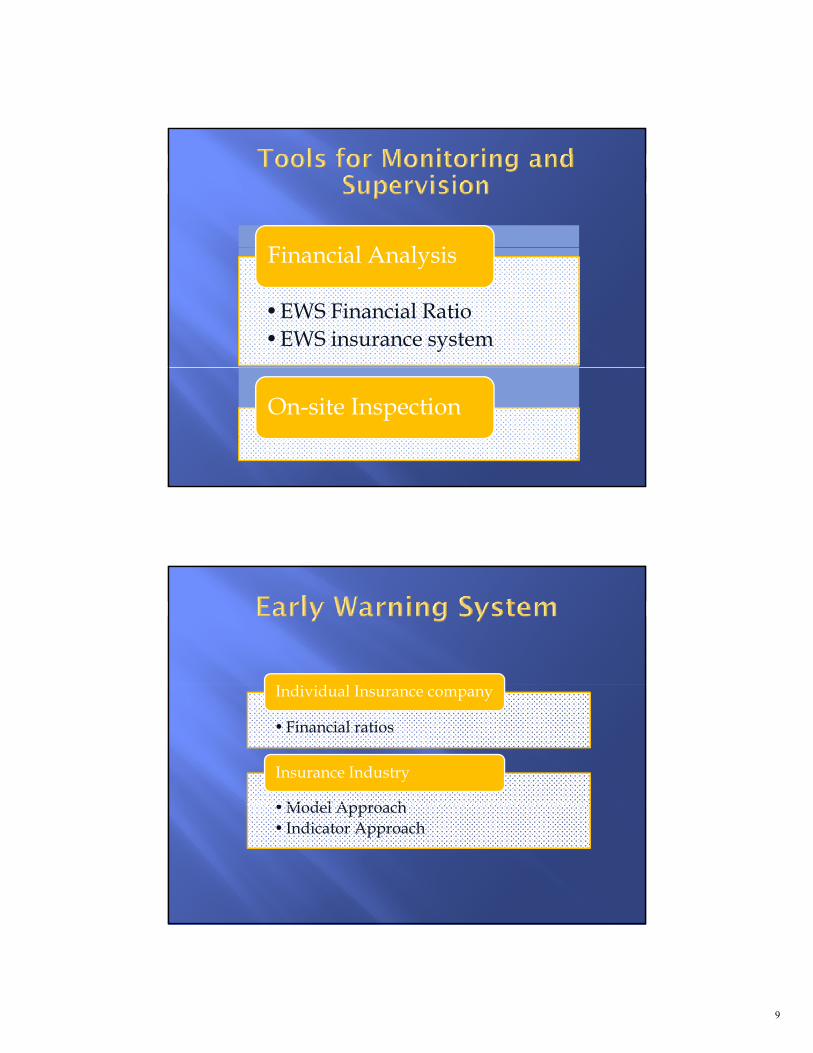
Personnel
Number % % Change
Management
2010
ManagementAbove bachelor degree 1,989 4.96 (3.40)Bachelor degree 4,234 10.57 (11.39)Below bachelor degree 727 1.81 (30.36)
Total 6,950 17.35 (11.81)Operation
Above bachelor degree 1,470 3.67 18.64g ,Bachelor degree 24,438 61.00 7.32Below bachelor degree 6,331 15.80 (10.64)
Total 32,239 80.47 3.68Service employee 876 2.19
Total 40,065 100.00 2.79
9
Fi i l A l i
•EWS Financial Ratio•EWS insurance system
Financial Analysis
On-site Inspection
d d l
• Financial ratios
Individual Insurance company
• M d l A h
Insurance Industry
• Model Approach• Indicator Approach
10
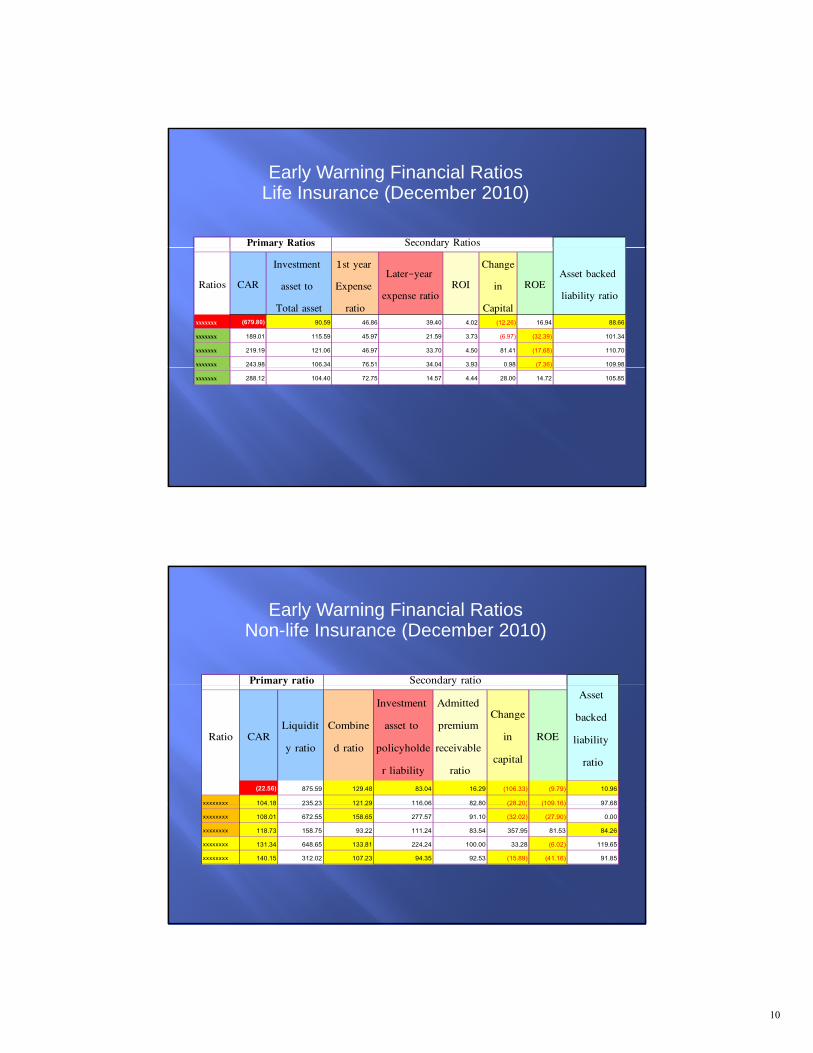
Secondary RatiosPrimary Ratios
Early Warning Financial Ratios Life Insurance (December 2010)
Ratios CAR
Investment
asset to
Total asset
1st year
Expense
ratio
Later-year
expense ratioROI
Change
in
Capital
ROEAsset backed
liability ratio
xxxxxxx (679.80) 90.59 46.86 39.40 4.02 (12.26) 16.94 88.66
xxxxxxx 189.01 115.59 45.97 21.59 3.73 (6.97) (32.39) 101.34
xxxxxxx 219.19 121.06 46.97 33.70 4.50 81.41 (17.68) 110.70
xxxxxxx 243.98 106.34 76.51 34.04 3.93 0.98 (7.36) 109.98
yy
( )
xxxxxxx 288.12 104.40 72.75 14.57 4.44 28.00 14.72 105.85
Secondary ratioPrimary ratio
Early Warning Financial Ratios Non-life Insurance (December 2010)
Ratio CARLiquidit
y ratio
Combine
d ratio
Investment
asset to
policyholde
r liability
Admitted
premium
receivable
ratio
Change
in
capital
ROE
xxxxxxx (22.56) 875.59 129.48 83.04 16.29 (106.33) (9.79) 10.96
xxxxxxxx 104.18 235.23 121.29 116.06 82.80 (28.20) (109.16) 97.68
Asset
backed
liability
ratio
yy
xxxxxxxx 104.18 235.23 121.29 116.06 82.80 (28.20) (109.16) 97.68xxxxxxxx 108.01 672.55 158.65 277.57 91.10 (32.02) (27.90) 0.00xxxxxxxx 118.73 158.75 93.22 111.24 83.54 357.95 81.53 84.26xxxxxxxx 131.34 648.65 133.81 224.24 100.00 33.28 (6.02) 119.65xxxxxxxx 140.15 312.02 107.23 94.35 92.53 (15.89) (41.16) 91.85
11
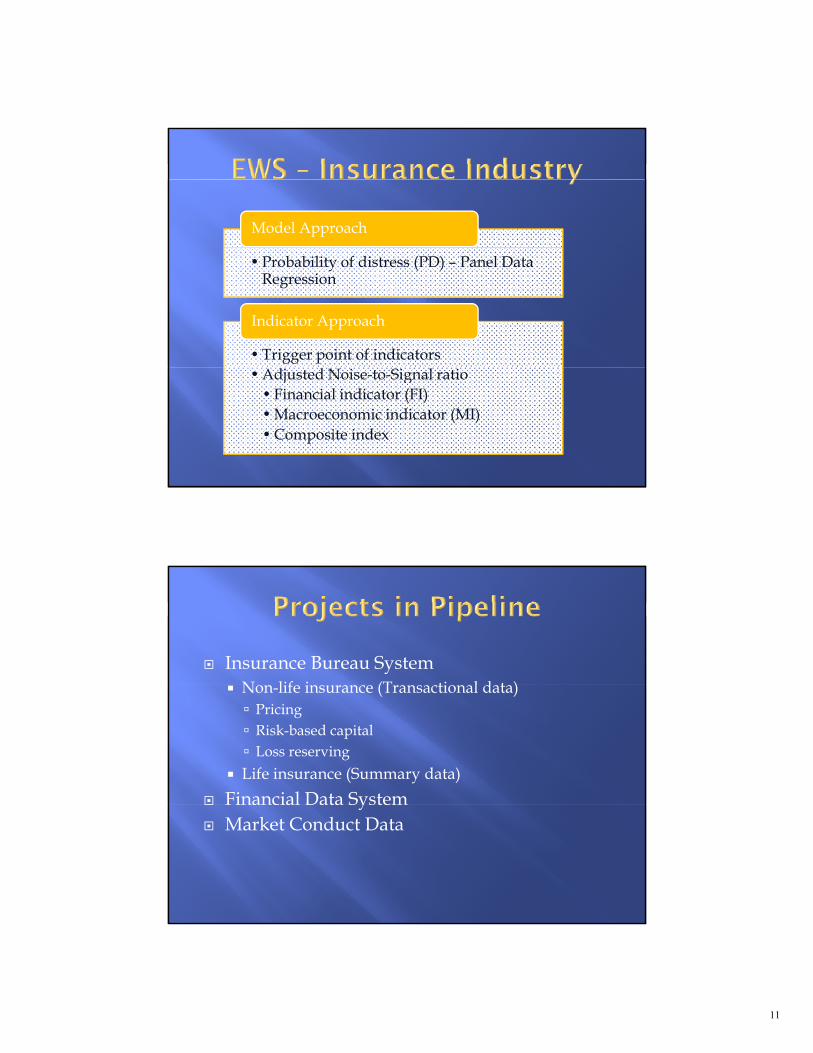
Model Approach
• Probability of distress (PD) – Panel Data Regression
• Trigger point of indicators
Indicator Approach
• Adjusted Noise-to-Signal ratio• Financial indicator (FI)• Macroeconomic indicator (MI)• Composite index
Insurance Bureau SystemN n lif in ur n (Tr n ti n l d t ) Non-life insurance (Transactional data) Pricing Risk-based capital Loss reserving
Life insurance (Summary data)
Financial Data SystemFinancial Data System Market Conduct Data

12