Embed Size (px)
Citation preview
Financial Constraints and Girls Post-Primary Education:
Evidence from a School Fee Elimination Program in Gambia∗
Moussa P. Blimpo†
University of OklahomaOusman Gajigo‡
The African Development Bank
Todd Pugatch§
Oregon State University
March 12, 2015
Abstract
We assess the impact of a large-scale tuition waiver program for girls on the quan-tity, composition, and achievement of students. The gradual rollout of the programacross geographic regions provides identifying variation in the policy. The program in-creased both access to secondary education and learning outcomes. We find increasesin the number of girls and boys taking the high school exit exam, as well as increasesin the share of students enrolling in private school. Combined scores for math andEnglish increased by about 0.1 standard deviations for girls and boys in response tothe program. These findings together suggest that financial constraints remain seri-ous barriers to post-primary education and that efforts to expand access to secondaryeducation can also improve learning outcomes.
JEL Classification: O15, I21, C93.
∗The authors would like to thank the Gambia office of the West African Examinations Council for providing test score data
and the Gambian Ministry of Basic and Secondary Education for providing details on the program. We thank Kehinde Ajayi
and Paul Thompson for helpful comments. We also thank Andrew Spaeth for research assistance. The authors assume full
responsibility for any errors.†Email: [email protected]‡Email: [email protected]§Email: [email protected]
1
1 Introduction
Most countries in Sub-Saharan Africa have experienced large expansions of access to primary
education over the past two decades. For example, the number of primary school children
has doubled between 1998 and 2009 in countries like Burkina Faso, Madagascar, Mali, and
Mozambique.1 Despite such success at the primary level, net secondary enrollment remains
low in the least developed countries, at 35% for boys and 29% for girls between 2008-2011.2
Large gender enrollment gaps in many Sub-Saharan African countries pose additional chal-
lenges for girls seeking to pursue their education beyond the primary grades. One potential
explanation for the low and stagnating secondary enrollment figures may be financial con-
straints. Relative to primary school, the overall cost of attending secondary school is much
larger due to higher tuition fees, higher opportunity costs as children are older and may
earn more on the labor market, and transport costs associated with fewer secondary school
choices, especially in rural areas. To date, only a handful of countries in the region, such as
South Africa, Ghana, and The Gambia, offer large scale tuition-free secondary education or
some form of financial aid through various scholarship programs.
The Gambia has been a pioneer in promoting access to secondary education, offering
fee-free public schooling for girls in grades 7-12 on a nearly national scale for more than
a decade. In this paper, we evaluate this policy, known as the girls’ scholarship program,
on students’ progress and learning outcomes. Two features of the policy make it especially
suited for rigorous evaluation. First, the program was rolled out to different regions on a
staggered schedule between 2001-2004. This allows us to use the regions that received the
program later as a control group, exploiting variation in program receipt over time and across
regions. Second, the program exclusively targeted girls, allowing us to measure differential
effects between boys and girls within the same regions. To our knowledge, this is the first
paper to evaluate the impact of a large-scale tuition waiver program at the secondary school
1Source: EdStats, World Bank.2Source: UNESCO Institute for Statistics (UIS), based on selected countries where data is available.
2
level in Africa.3
We find that the program had important effects on both access and student achievement.
The policy substantially increased the number of high school exit exam test takers in both
public and private schools.4 The average age of test-takers also increased, suggesting that
the policy helped keep students in schools or induced some students whose studies were
interrupted to return. In terms of learning outcomes, we find an average effect of 0.19
standard deviations for girls and 0.15 standard deviations for boys on the standardized
English test score. The combined effect on both Math and English is about 0.1 standard
deviations for both boys and girls. In recent years, The Gambian government has engaged
several initiatives toward improving learning outcomes (Blimpo et al., 2011; Pugatch &
Schroeder, 2014). However, the findings from this study suggest that those efforts need not
come at the expense of expanding access.
As mentioned previously, the study occurs against a backdrop of sustained attention
among both policymakers and researchers to primary education, with relatively less empha-
sis on the secondary level. Expanded access to primary education resulted from concerted
policies, both internationally and nationally, aimed at removing financial constraints through
school fee elimination and other measures. Enrollments in primary schools have accelerated
in many countries since the 1990 Jomtien conference where over 150 countries adopted the
Education For All initiative. This commitment was renewed during the Dakar Framework
for Action in 2000 where among other things, tuition removals as well as the removal of
other cost barriers were targeted. Over the past two decades, more than twenty African
countries have waived tuition from primary education and many more have some form of
targeted programs to ease access to the most disadvantaged populations. Several recent com-
prehensive literature reviews concluded that the great majority of interventions that reduced
3Blimpo (2014) evaluated the effect of financial incentives on secondary school children in Benin and foundlarge gains on test scores. This policy, however, did not target access directly and provided no additionalresources upfront.
4Related work by one of this study’s authors also found a large enrollment effect of the policy for therelevant age group using household survey data (Gajigo, 2012).
3
tuition fees and other costs increased enrollment, suggesting that financial constraints are
among the most important barriers to access to primary education (Petrosino et al., 2012;
Krishnaratne et al., 2013; Murnane & Ganimian, 2014).
These great successes on access have been achieved amid recent but growing concerns
about the quality of education and potential degradation of learning outcomes (Pritchett,
2013). More recent research has focused on the impact of some these access-oriented policies
not only on enrollment but also on learning outcomes. For example, Kazianga et al. (2013)
found that a comprehensive program that included school construction and student atten-
dance incentives increased substantially both enrollment and test scores of primary school
students in Burkina Faso. A similar, but experimental study, which brought community
schools to Afghan villagers found equally large effect on both enrollment and test scores
(Burde & Linden, 2013). In Kenya, Lucas & Mbiti (2012a) found that elimination of pri-
mary school fees led to substantial gains on enrollments with very little negative effect on
the test score of those who would have attended in the absence of the tuition waiver. These
studies suggest that at least at the primary school level, the tradeoff between expanding
access and learning outcomes might be less pronounced than one might think.
Given these successes in improving access and (to a lesser extent) learning in primary
education, for many countries the logical next step is to improve access and outcomes in sec-
ondary education. Fewer policies and studies have focused on secondary education, however.
Early results from an ongoing study on a scholarship program in Ghana found large enroll-
ment effects among scholarship winners relative to the control group three years after the
program started (Duflo et al., 2009). They concluded that financial barriers might be crucial
at the secondary level as well. Outside of Africa, Muralidharan & Prakash (2013) evaluated
a program that substantially reduced girls’ cost of attending secondary school through pro-
vision of bicycles, increasing enrollment by 30% and cutting the gender gap by 40%. Yet
major gaps in understanding remain, particularly with regard to student achievement. A
review of the post-primary schooling literature by Banerjee et al. (2013) concluded, “Despite
4
the overarching positive results of price-based policies in increasing school enrollment and
attendance, the evidence on the effects of price reductions on student performance is less
conclusive” (p. 21).
We contribute to that literature by being the first to evaluate a large-scale tuition elimina-
tion policy for secondary education in Africa, as previously mentioned. We use administrative
data on the universe of standardized test scores in The Gambia from 1998-2012; we are the
first researchers to obtain and analyze this data. We also contribute to the broader literature
on efforts to close the gender gap in access and learning. Several other studies have evalu-
ated similar programs targeting girls (Kim et al. 1999a, Kim et al. 1999b, and Chaudhury
& Parajuli 2010 for Pakistan; Filmer & Schady 2008 for Cambodia; Kremer et al. 2009 for
Kenya; Baird et al. 2011 for Malawi; Begum et al. 2012 for Bangladesh; and the previously
mentioned Kazianga et al. 2013 and Muralidharan & Prakash 2013 for Burkina Faso and
India, respectively), with a consensus finding that reducing the cost of attendance leads to
gains in enrollment. Of these, however, only Baird et al. (2011) examines learning outcomes
among secondary school students as we do, using a program that is more local in scope than
our setting.
In the next section, we describe the education system in The Gambia and the girls’
scholarship program. Sections 3-4 present the methodology and data we use for analysis.
Section 5 presents results, and Section 6 concludes.
2 Contextual Background
In the Gambian education system, the first 9 years are formally known as the Basic Cycle.
This includes 6 years of primary school (grades 1-6) and 3 years of Upper Basic School (middle
school, grades 7-9). High school, known locally as Senior Secondary School, consists of grades
10-12. The West African Senior School Certificate Examination (WASSCE, hereafter the
Grade 12 exam), instituted in 1998, is administered at the end of grade 12, and is required
5

for advancing to the tertiary level (i.e., university). The exam is administered by the West
African Examination Council (WAEC), a regional institution that conducts examinations in
the 4 former British colonies in West Africa (Gambia, Ghana, Nigeria and Sierra Leone).5
WAEC generates exam questions each year in consultations with the Ministry of Edu-
cation, based on existing curricula. Accordingly, the exam measures achievement in specific
subjects, rather than innate ability. Students choose a minimum of 6 and a maximum of
9 subjects, but the core and mandatory subjects are Mathematics and English, which will
be our focus. There is no fixed passing mark for the exam. Because the exam is based on
curricula designed by the Ministry of Education, and these have not undergone any major
change, the exam questions should be comparable over time.
There is a structured system in the way the exam is conducted. Each year, sealed
questions are delivered at the test centers the day before the scheduled exam.6 On the
day of the exam, teachers from other schools serve as invigilators (proctors). The exams
are centrally graded by WAEC. This structure is similar to the way national exams are
conducted in other countries (Kremer et al., 2009).
Like other African countries, The Gambia charges fees for public school attendance.
The Gambia levies fees beginning in grade 7, as primary education is nominally free for
public schools. Students are still responsible for purchasing textbooks, uniforms and other
materials, leading students to bear costs even at the primary school level.
The scholarship program for female middle and high school students started as an ini-
tiative funded jointly by UNICEF, the World Bank, and the International Monetary Fund
through the Highly Indebted Poor Countries program and the Gambian government. The
goal of the program is to increase overall student enrollment but with a specific focus on
reducing the gender gap in education. The program pays mandatory school fees for all girls
5Students also take an exam at the end of grade 9, also administered by WAEC, as a requirement formatriculation into high school. Because this exam was introduced in 2003, there is only one pre-treatmentregion-year available in the data. We therefore focus on the Grade 12 exam in this paper.
6Schools serve as test centers. In almost all cases, students take the exams at the school they attend.
6
in grades 7-12 in the regions in which it is implemented.7 The only criteria for benefitting
from the program are gender (female) and attending a public middle or high school.8
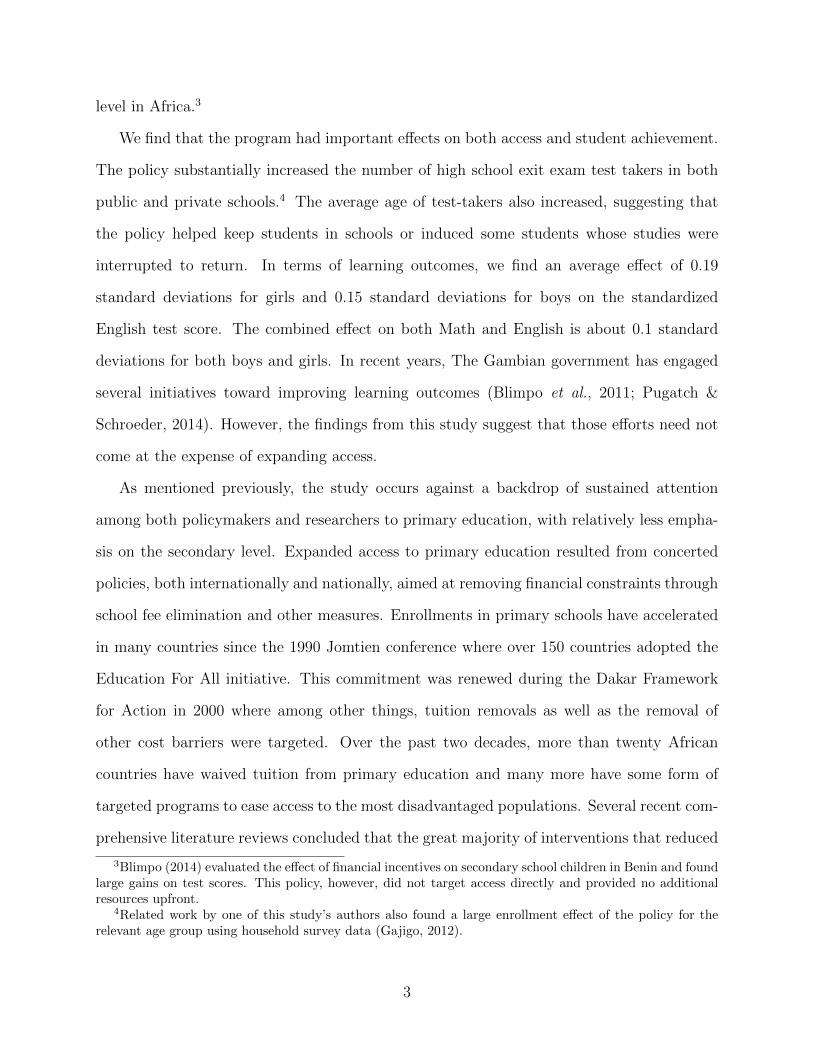
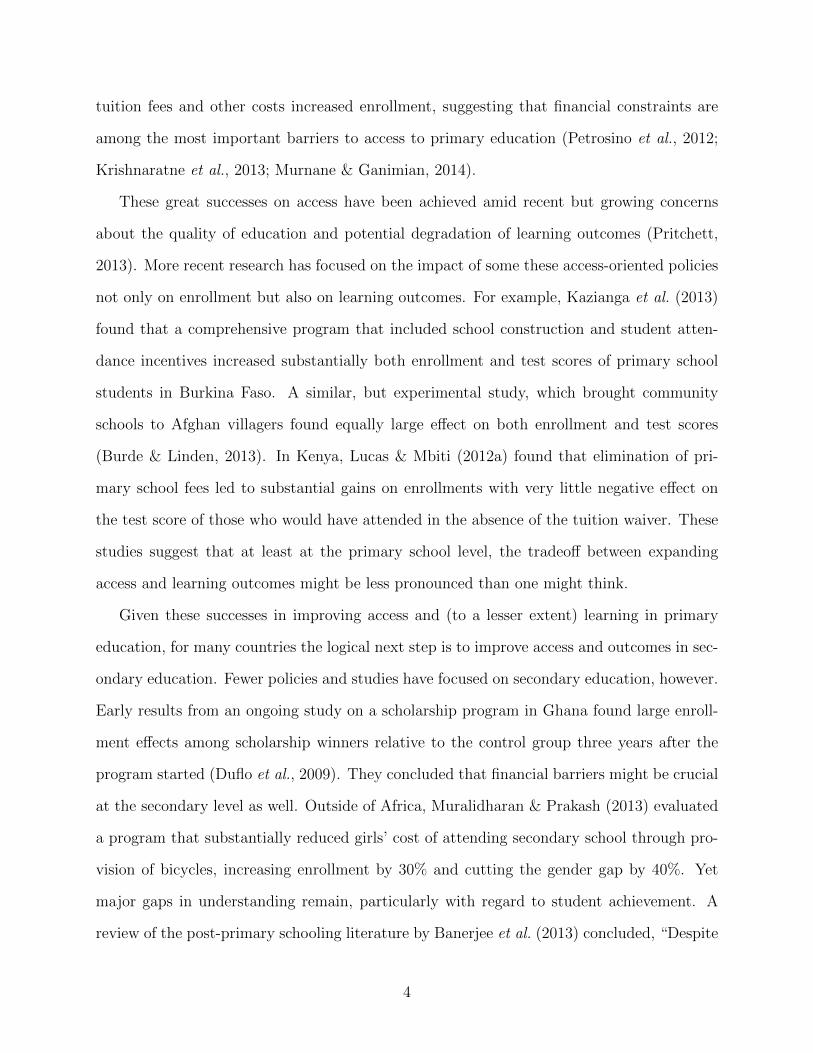
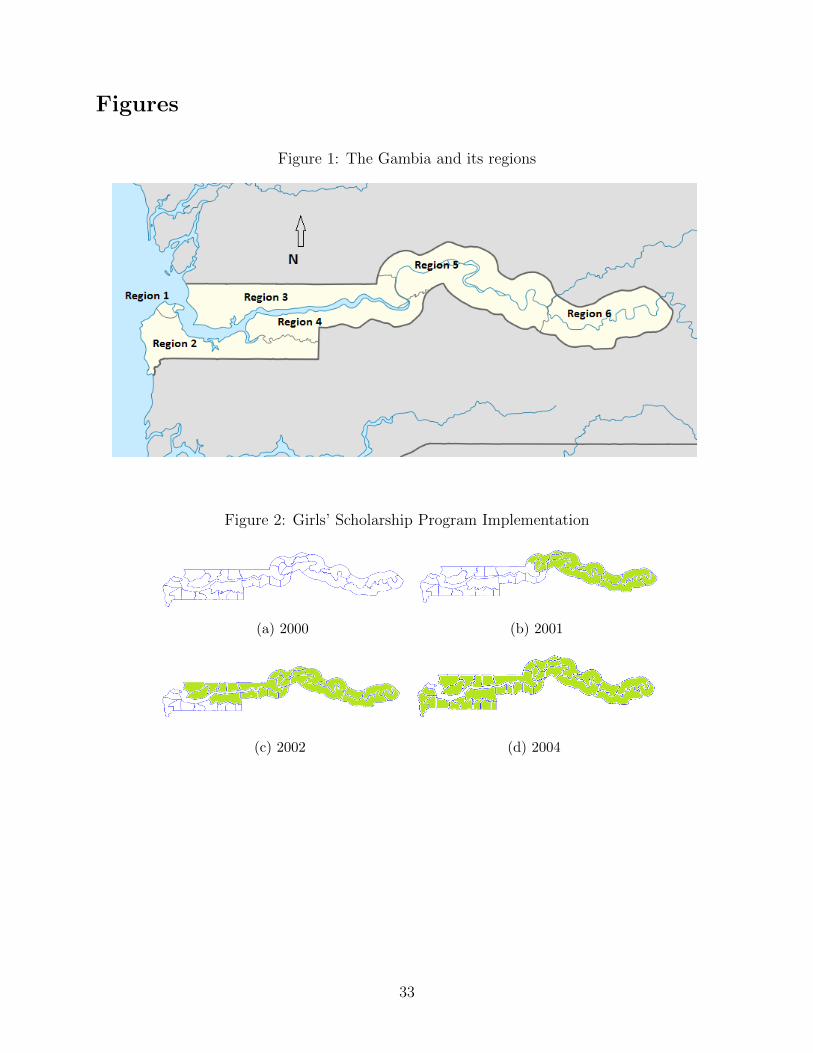
The scholarship program was introduced in 2001 for Regions 5 and 6 only.9 The program
was extended to Regions 3 and 4 in the following year. Two academic years later, the
program was further scaled to include Region 2 in 2004. The scholarship program has
not been extended to Region 1, which is the most urbanized region, and relatively more
developed. Figure 1 provides a map of Gambia’s regions, while Figure 2 shows the rollout
of the program over time.
To implement the program, a specially-designated Ministry of Education administrator
handles the disbursement of funds between the program and schools. The regional offices of
the Ministry verify the enrollment figures provided by individual schools before the scholar-
ship funds are transferred. Therefore, at no point do the beneficiary households handle the
money, thereby removing any chance of the scholarship funds being diverted for other pur-
poses. The average cost of the program per student was US$48, US$43, US$42 and US$43 in
2001, 2002, 2003 and 2004, respectively Gambia Ministry of Basic and Secondary Education
(2004).10 The program was widely publicized through local media, as well as through several
workshops in various regions of the country.
This program was the only large-scale policy aimed at increasing secondary school access
in the country during our sample period. Other national policies focused on primary edu-
cation, and no other policy coincided with the scholarship program in geographic scope and
timing. Nonetheless, a supplementary scholarship program targeting a subset of secondary
7The major sub-national units in The Gambia are 6 regions. Below these sub-national units, there are43 districts as of 2013.
8For purposes of this paper, public schools refer to both government and grant-aided schools, the latterof which are publicly funded but administered privately. Both types of public schools are eligible for thescholarship program, while private schools are not.
9We follow the Gambian convention in referring to the 2000-2001 academic year as 2001, to 2001-2002 as2002, and so on.
10The average value changed over time because of changes in the exchange rate (the average value of a USdollar per Gambian Dalasi was approximately 13, 15, 20, 27 between 2000 and 2003) and also changes inthe composition of students covered (middle and high school students) over time as the program got scaled.
7
schools in Region 2 was implemented during the sample period,11 as was a program offering
a salary premium to primary school teachers in all rural areas excluding Region 2 (Pugatch
& Schroeder, 2014). We therefore checked the robustness of all analysis to the omission
of Region 2 and found qualitatively similar results (omitted for brevity but available upon
request ). We have little remaining concern about confounding factors that may threaten
the identification of the impact of this particular program.
3 Methodology
This paper analyzes the effect of the Gambian girls’ scholarship program on student learning
using administrative data on standardized test scores. The staggered rollout of the program
across regions provides an opportunity to compare outcomes in regions that received the
program early with those that received it late. Additionally, the targeting of the program to
girls allows for comparisons between male and female students within a region after receipt
of the program.
Following the difference-in-differences strategy of Gajigo (2012), we estimate the following
regression separately for boys and girls:
yicrt = βDrt +Xicrtγ + δc + θt + εicrt (1)
where yicrt is the outcome (i.e., test score) of student i at test center c in region r in year t; Drt
is a dummy for whether the scholarship program was implemented in region r at time t; X is a
vector of individual characteristics, including a constant; and δ and θ are test center and time
fixed effects, respectively. The coefficient β is the difference-in-differences estimate of the
effect of the program because it compares changes in test performance of students in regions
that received the program to changes in regions that did not. The identifying assumption is
11The Ambassador Girls Scholarship Program, led by USAID, targeted both girls and boys in selectedsecondary schools in Region 2. It went beyond the program studied in this paper by covering school fees,books, uniforms, and school supplies. However, its oldest recipients entered 12th grade in 2012, the last yearof our data, meaning that the two scholarship programs overlap for only one region-year in our sample.
8
that in the absence of the program, changes in outcomes in regions that received the program
early would have been the same as in regions that received the program late. We examine
the validity of this assumption by testing for common pre-treatment trends across regions.
Equation (1) establishes the region as the unit of treatment and estimates the average
effect of the program on male and female students separately. Because the program elim-
inated fees for girls only, however, we can also explore differential changes in performance
between male and female students by pooling the sample and modifying the specification to:
yicrt = φfemaleicrt + βDrt + ρDrt ∗ femaleicrt +Xicrtγ + δc + θt + εicrt (2)
where female is a dummy variable and all other notation is as before. In this triple-difference
specification, the coefficient ρ captures any differences in program impact between male and
female students.
Additionally, we can use variation in the length of program exposure among students to
estimate the marginal effect of program duration on learning. For instance, students in 2004
will have had one year of program exposure if they attended school in Region 2, but 3 years
of exposure in Regions 3-4 and 4 years in Regions 5-6. Within regions, students in different
cohorts will also vary in their exposure. Region 6 students in 12th grade in 2001 will have
one year of program exposure, while 11th graders will have two years of exposure when they
take the exam the following year. Regressions that use variation in length of exposure to
the program will take the form:
yicrt = βyrsexposedrt +Xicrtγ + δc + θt + εicrt (3)
where yrsexposed measures the duration of a student’s exposure to the scholarship program
based on the date of program rollout by region combined with the test date. yrsexposed
ranges from zero, for students not exposed to the scholarship in their region, to 6, for students
whose region received the scholarship since they attended grade 7.
9
In other words, we modify the main difference-in-difference specification (1) to allow the
treatment effect to vary according to length of a student’s exposure. Similarly, replacing the
treatment indicator D with yrsexposed in the triple-difference specification (2) estimates
whether the effect of program exposure varies between boys and girls.
We cluster all standard errors by test center, of which there are 32.
4 Data
Outcome data are the universe of student-level test score records of the West African Exam-
inations Council (WAEC). Subject-level scores are available for each student for 1998-2012,
allowing for several years of pre-treatment outcomes for each region.12 We omit Region 1
(Banjul, the capital) from all analysis because of its dissimilarity with the rest of the coun-
try. We also omit private schools because they were ineligible for the scholarship program.
However, all raw test results are converted to z-scores based on the universe of results in a
given year, including students from private schools and Region 1. This allows us to interpret
scores relative to the national norm. It also explains why mean z-scores tend to be negative
in our estimation sample.
Omitting private schools drops 25% of test-takers. This high percentage could bias
results if students sort non-randomly into public and private high schools in response to the
scholarship. In 2004, when program rollout was complete, only 2 of 35 districts had both a
public and private high school (grades 10-12). By 2012, the last year for which we have data,
this figure had grown to 9. We will therefore assess whether the growth in private school
enrollment was related to the scholarship program.
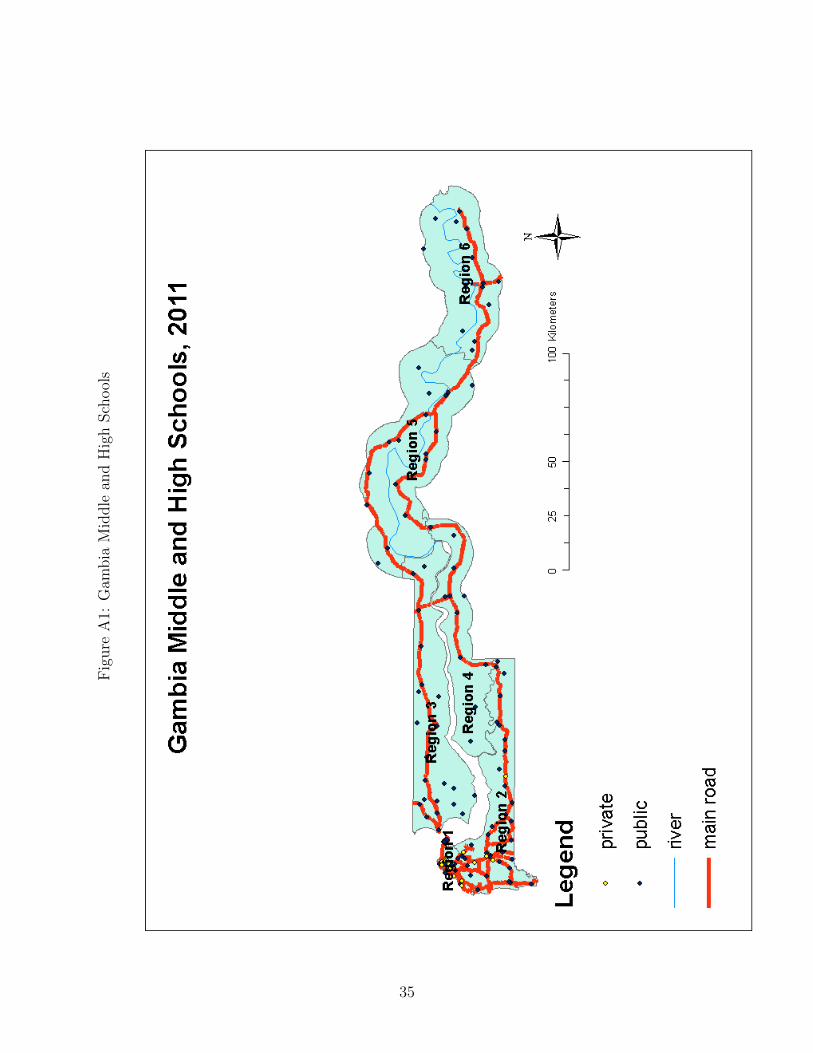
However, all of these private schools are located in the urban districts of Region 2, near
the capital, as shown in Figure A1.13 Students in most areas are therefore constrained
12We omit data from 2004 because student gender is missing for that year.13The map shows schools in 2011, the most recent year for which location data are available. Region 1
schools are excluded from the estimation sample but shown on the map for illustration. Not all schools inthe sample appear on the map due to missing location data.
10
to attend their local public school. As mentioned above, our analysis changes little when
excluding Region 2 from the sample, suggesting that competition from private schools does
not influence our results.
We also use data from the 1998 wave of the Integrated Household Survey (IHS) to ex-
plore heterogeneity in results by district characteristics. This survey, which is conducted
by the Gambia Bureau of Statistics, is nationally representative and collects information on
assets, demographic and socioeconomic information. In the 1998 survey, slightly over 1,900
households were covered including approximately 4,500 school-aged children.
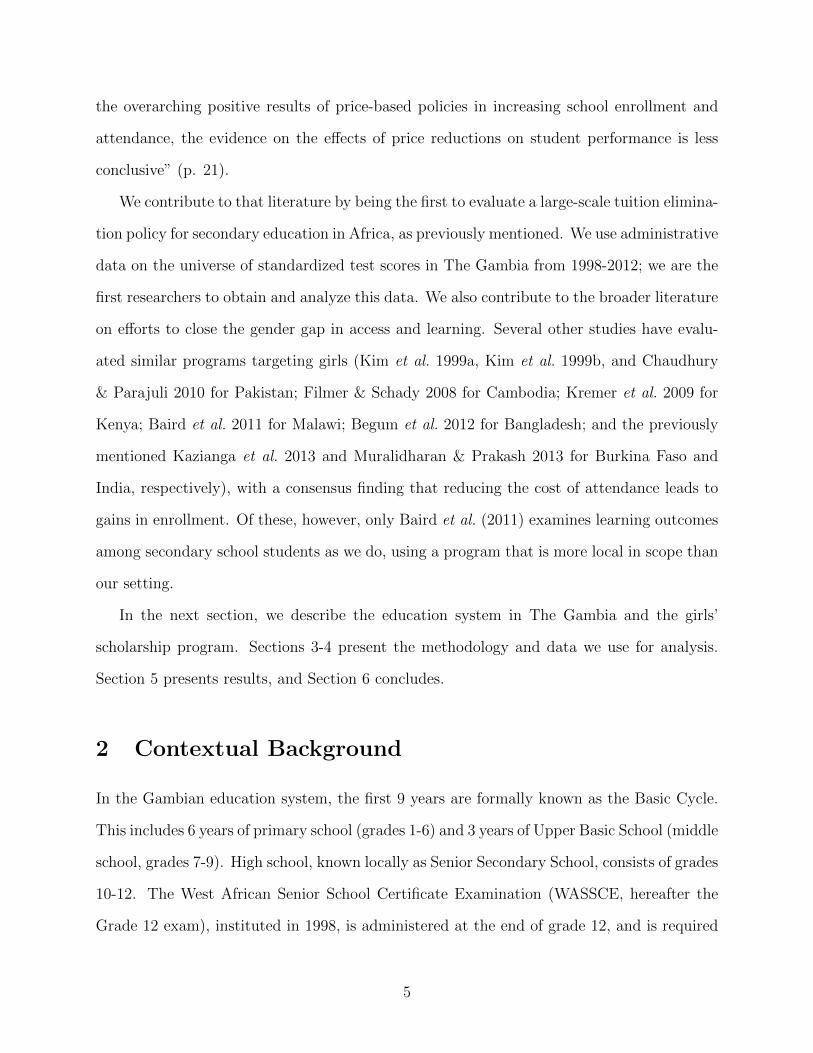
The Gambia made considerable strides in reducing the gender enrollment gap since im-
plementing the scholarship program.14 Figure 3 shows Ministry of Education data on the
female enrollment percentage over time for each grade. Two key facts are apparent from
the figure. First, the female enrollment percentage increased over time for all grades. Sec-
ond, females comprise a lower share of enrollment as grade level increases (with only a few
exceptions). Females will therefore be under-represented among test-takers relative to their
enrollment shares in their corresponding schools.15
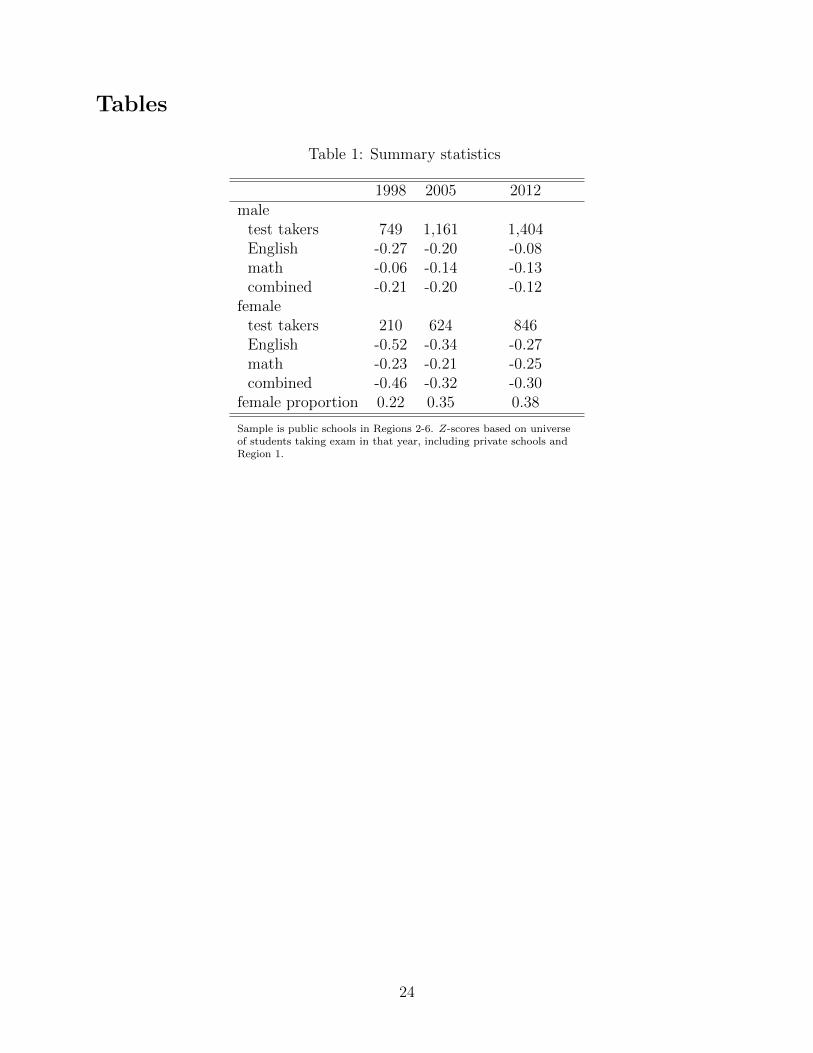
Test-taking patterns follow these enrollment trends. Table 1 presents summary statistics
separately for boys and girls. The number of test-takers is relatively small in 1998, partic-
ularly for girls; the 210 girls taking the test that year represent only 22% of the total. By
2005, when all regions had the girls’ scholarship program for at least two years, the num-
ber of students taking the exam nearly doubled and the female share rose to 35%. These
upward trends continued through 2012, the last year of available data. For both boys and
girls, performance improved in English over this time, but stagnated or fell in math. Overall,
performance improved for both boys and girls in the sample period. Figure A2 shows the full
time series of scores by region-group, separately by subject and gender. The paths of scores
are noisy, underscoring the need for a regression framework to control for school-, time-, and
14All data presented in this and subsequent analysis are for public schools only, unless stated otherwise.15The enrollment data do not track individual students over time, making it impossible for us to construct
grade progression rates without making additional assumptions.
11
student-level effects.
5 Results
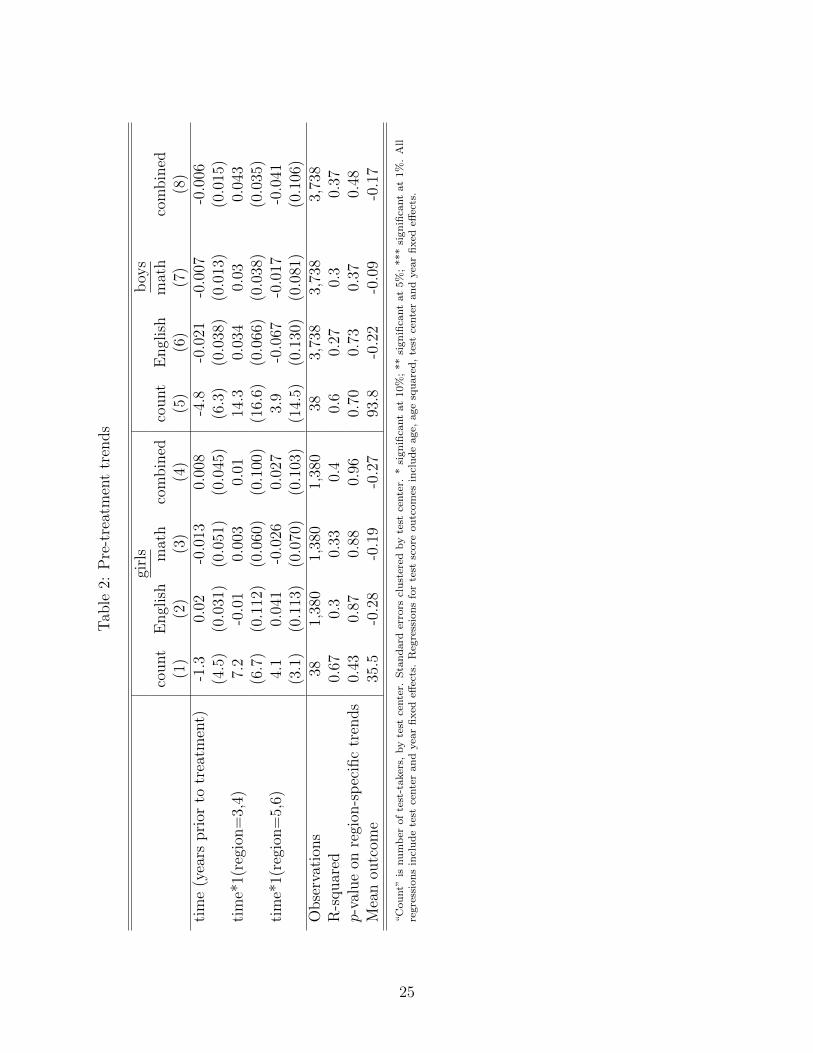
5.1 Pre-treatment outcome trends
Before presenting estimates of the program’s impact, we first check the validity of our iden-
tifying assumption of common outcome trends between regions that received the program
early and those that received it late. To do so, we rescale time so that t = 0 corresponds to
the year of treatment receipt in each region and limit the sample to pre-treatment periods
only. We then regress outcomes on a time trend and its interaction with indicators for re-
gions 5 and 6 (which received the program first, in 2001) and regions 3 and 4 (which received
the program in 2002). Statistically significant coefficients on these interaction terms would
indicate differential pre-treatment trends among regions, calling into question the identifying
assumption of our difference-in-differences strategy.
Table 2, column (1) shows results for the count of girls taking the exam, by test center.
The coefficients on the time trend-region interactions are not significant, either separately
or jointly (the final row of the table presents the p-value of the joint hypothesis test). The
analogous regression for boys in column (5) also provides no evidence of differential trends.
The remaining columns of the table present results for test scores at the student level,
separately for English and math as well as the combined English and math score. These
regressions also include the student’s age (measured continuously, based on date of birth)
and age squared. Again, there is no evidence of differential pre-treatment trends by region.16
16In the pre-treatment period there are only 11 test centers, which will likely lead our test center-clusteredstandard errors to overstate the precision of our estimates. However, this bias would lead us to over-rejectthe null of no differential trends, whereas we fail to reject the null in all specifications.
12
5.2 Enrollment and sorting in response to scholarship
The scholarship program could affect learning outcomes by altering the quantity of students
taking exams, the composition of students, or the learning resources available to them. We
examine each of these channels before presenting the main results.
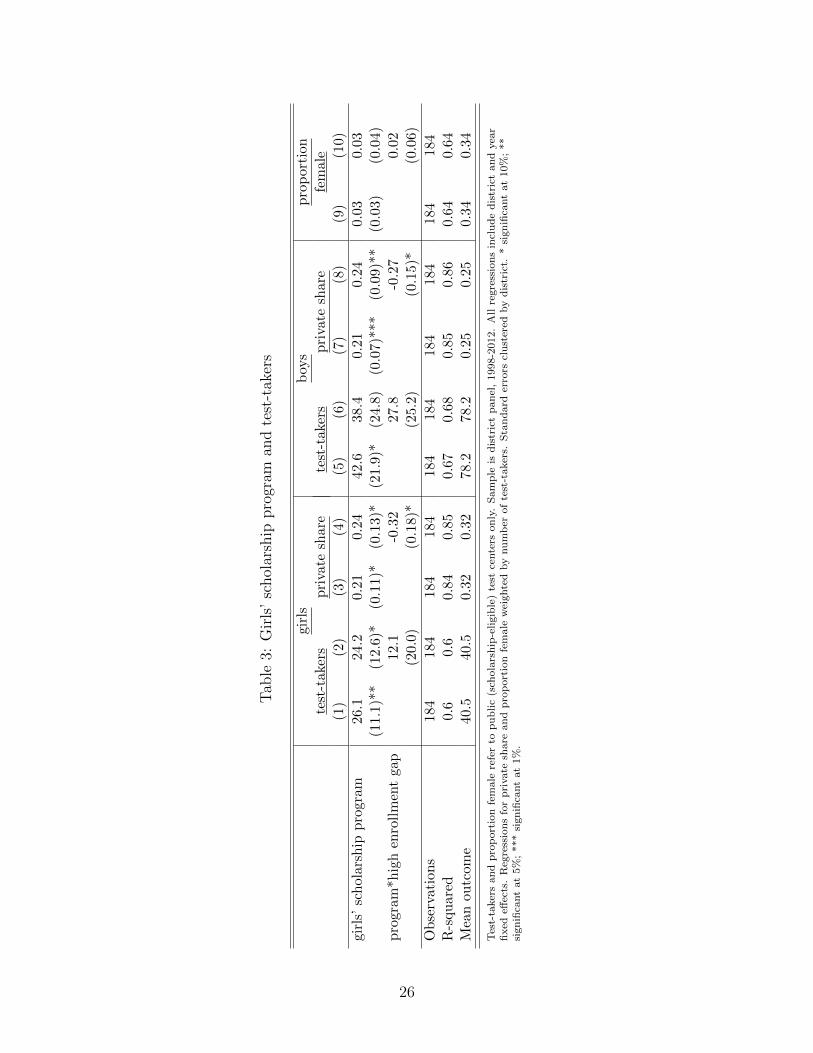
In Table 3, we present estimates of the effect of the girls’ scholarship program on the
number of test-takers and the proportion from private schools. Here, we aggregate the data
by district, as this is the relevant level for any public-private competition.17 In column (1),
the coefficient on program receipt indicates that 26.1 additional girls per district took the
exam in regions that received the program early relative to those that did not, significant at
5%. In column (2) we include an interaction between program receipt and “high enrollment
gap,” which is an indicator for whether the test center’s district was below the median en-
rollment rate for secondary school-aged children (ages 13-18) in 1998.18 Areas with a high
enrollment gap have the highest potential influx of students from introduction of the schol-
arship. The coefficient on this interaction term is positive as expected, but not statistically
different from zero.
Columns (3)-(4) of Table 3 repeat the exercise with the share of female test-takers in
private schools as the outcome. The scholarship led to a 21.1 percentage point increase in
this share, significant at 10%. However, the interaction term in column (4) reverses this effect
in high enrollment gap districts. In fact, these districts saw a reduction in the private school
share of 8 percentage points. The results are consistent with flight to private schools due to
space limitations or perceived lower quality of public schools in response to the scholarship.
In high enrollment gap districts, however, students are more likely to lack the means or
opportunity to exit to private schools.
Columns (5)-(8) examine the same outcomes for boys, with largely similar results. In-
17There was only one private test center-year in the pre-treatment period, making it impossible to identifythe program effect separately from test center dummies among the sample of private test centers.
18The strategy resembles that of Lucas & Mbiti (2012a,b), which study the effect of free primary schoolingin Kenya.
13
creases in the number of boys taking the exam are somewhat surprising, given that the
program targeted girls. Yet since boys constitute the majority enrolled in the high school
grades (see Figure 3), they are therefore likely to be more prevalent at the test-taking mar-
gin, making possible relatively large spillover effects of the program.19 Columns (9)-(10) find
no significant effects of the program on the proportion of test-takers who are female, though
the coefficients are positive. Overall the program appears to have increased the number of
students taking the exam and to have hastened the growth of private schools.
Given these increases in the number of test-takers and their shift to private schools, we
are also interested in whether the characteristics of test takers changed. Table A1 compares
test takers in public and private schools.20 Compared to private school students, students in
public schools earn higher scores, particularly in English (0.16 standard deviations for girls
and 0.22 for boys). Although we cannot determine whether these patterns reflect pre-existing
differences between these students or higher quality of instruction in public schools, public
school students are also younger and (for boys) less likely to be absent from the exam,21
suggesting that weaker students sort into private schools.
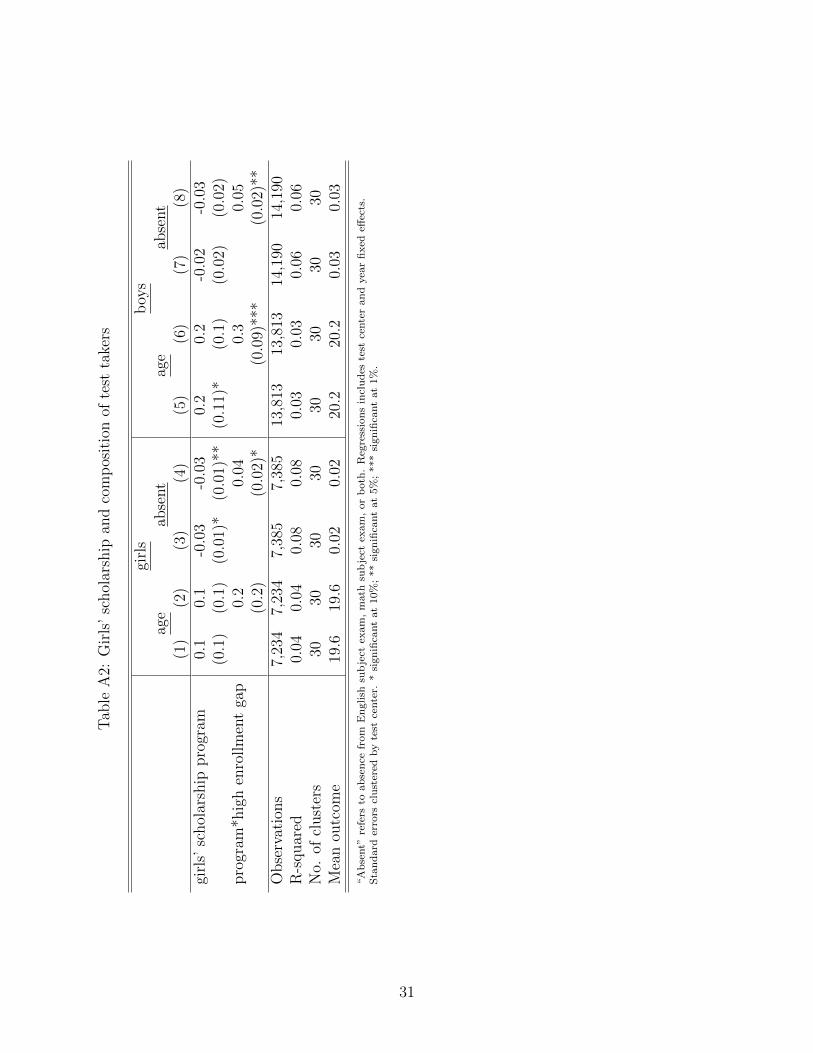
Table A2 explores whether the scholarship program changed the composition of test
takers within public schools. Although the characteristics available for study in the data
are limited, we can check if test takers are older or more likely to be absent in response to
the scholarship, either of which would be evidence of negative selection. In columns (1) and
(5), we find that students in scholarship areas are older, though the difference is significant
only for boys. The interaction between the program and the high enrollment gap indicator
is also positive, with boys in these areas a half year older than pre-treatment test takers in
19Other programs that targeted girls for reduced schooling costs have also shown increases in male enroll-ment (Kim et al., 1999a; Begum et al., 2012), which the authors explain as a spillover to male siblings. Ourdata do not allow us to distinguish siblings among test takers or enrolled in other grades, however.
20Due to the lack of pre-treatment observations for private schools (just one private test center-year in thepre-treatment period), we cannot use the regression specification in (1) to compare public and private schoolstudents. Instead, Table A1 limits the sample to post-treatment observations and checks for differences inmeans.
21Here, absence refers to students who registered for the exam but do not have a score on either the mathor English subject test, both of which are required. Including enrolled students in Grade 12 who did notregister for the exam could make these rates even higher.
14

low enrollment gap districts. These results suggest that the scholarship retained some older
students, or induced those whose studies were interrupted to return to school. In column
(3), we find that girls were 3 percentage points less likely to be absent from the exam due
to the scholarship, though this effect is reversed in high enrollment gap districts, with the
same coefficient pattern for boys. The pattern is consistent with the scholarship increasing
students’ perceived readiness for the exam overall, but with the marginal student in high
enrollment gap areas less prepared to take the exam.22
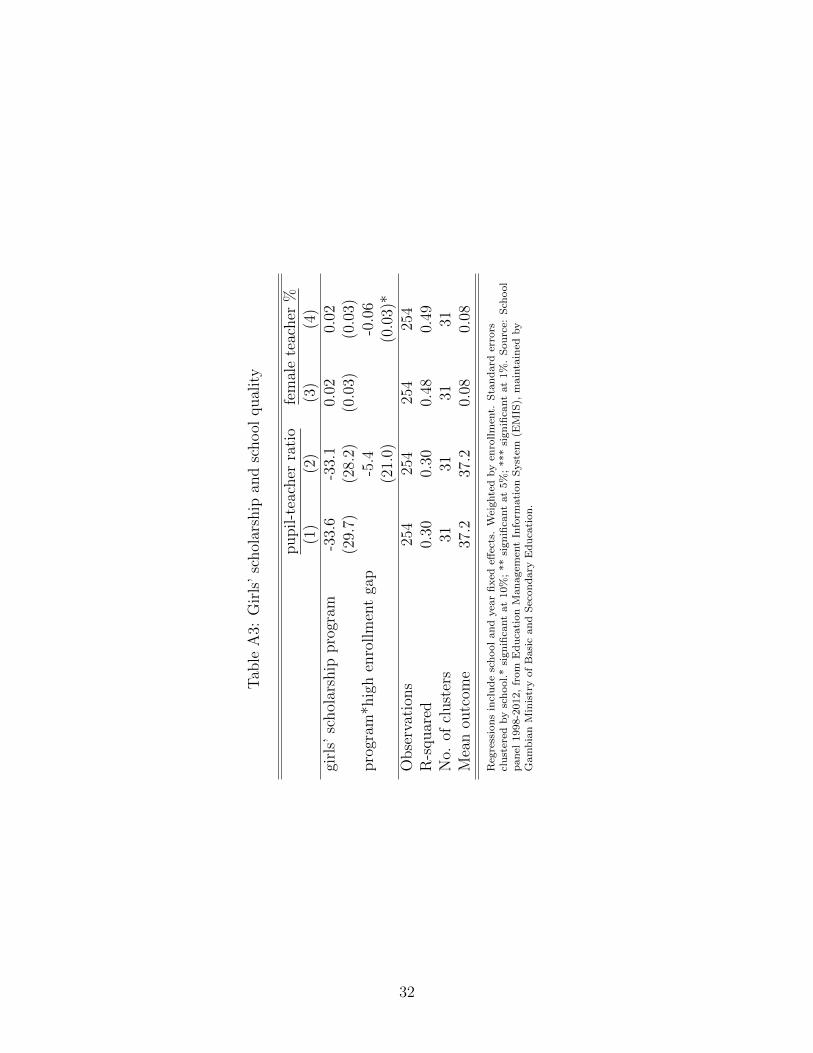
In addition to changes in the number and composition of students, changes in enrollment
can also be accompanied by changes in school quality. Table A3 explores this possibility for
high schools (grades 10-12), using the limited school quality data we have from the Ministry
of Education. In the first two columns, we find no evidence of significant changes in the
pupil-teacher ratio in response to the scholarship program. In column (4), we find that
the percentage of female teachers in high enrollment gap districts fell 6 percentage points
more than in low-gap districts in response to the program, significant at 10%. This decline
is notable given the male dominance in the teaching profession in The Gambia (the mean
female teacher percentage in our data is 8%).23 These effects on student composition and
school quality will be useful to bear in mind when interpreting results.
5.3 Student learning
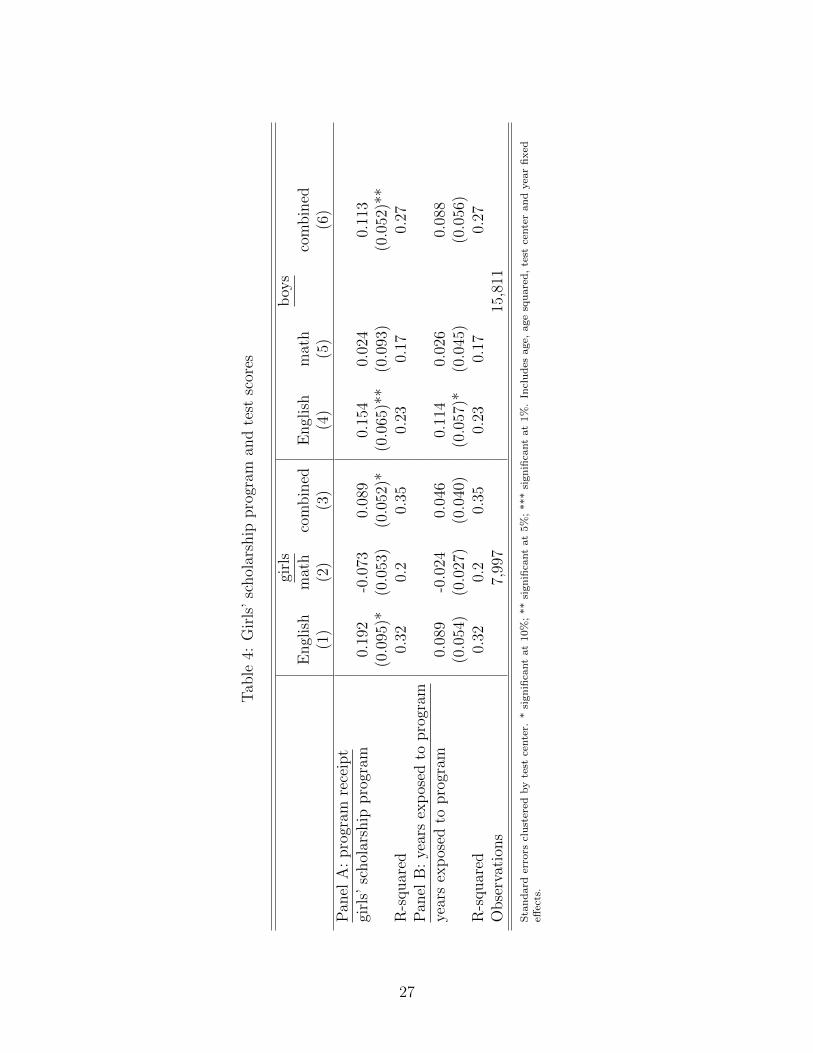
Table 4, Panel (A) presents results from the main difference-in-difference regression (1).
The program increased English scores and combined English and math scores for girls and
boys. In English, the effect sizes are .19 standard deviations for girls and .15 for boys,
with the estimate for boys more precise (5% versus 10%). Combined English and math
22The implications of these patterns of absences on test performance in response to the scholarship areambiguous. If students are absent because they are likely to fail the exam, then lower absence rates couldlead to higher average ability among remaining test takers. On the other hand, fewer absences could reflectan influx of marginal test takers who were less concerned about performance, leading to lower quality amongtest takers.
23We had also hoped to look at whether the proportion of certified teachers changed in response to thescholarship, but data on teacher certification is recorded only for a subset of years, leaving only 5 pre-treatment observations in the school panel.
15
scores increased by .09 standard deviations for girls and .11 for boys, with the estimates
for boys again more precise. Panel (B) shows that additional years of program exposure
had no significant effects on test scores for either girls or boys. The effect on boys’ learning
outcomes may reflect peer effect in way that is consistent with Hoxby (2000) who found
evidence that gender composition is one avenue through which peer effect operate and found
that in classroom with more girls there are significant math test score gains for boys.
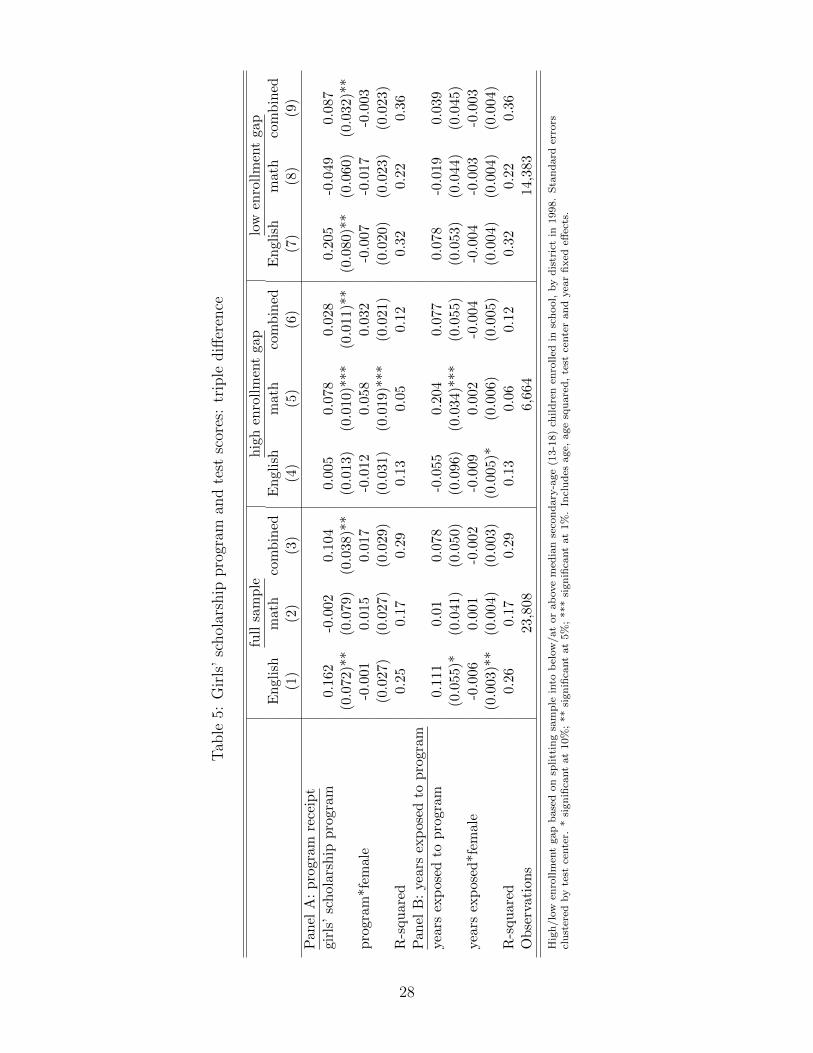
Even with no effect on female students on average, comparing changes in their outcomes
to male students could still be instructive. The triple-difference specification of regression
(2) makes this comparison, with results in Table 5. Panel (A), columns (1)-(3) show no
difference in program effects between female and male students in the full sample. Limiting
the sample to test centers in high enrollment gap districts in columns (4)-(6) reveals that
girls in these districts perform .06 standard deviations better in math than boys as a result
of the program, with the difference significant at 1%. No such differential effects are present
in low enrollment gap districts (columns 7-9). It is not clear, however, whether the effect in
high enrollment gap districts occurred because girls induced to take the test via scholarship
receipt are more able than boys, or if the scholarship program re-oriented school resources
and pedagogy in a way that benefitted girls more.
Table 5, Panel (B) repeats the exercise using years of program exposure as the treatment
variable. For each additional year of program exposure, girls performed .006 standard de-
viations worse than boys in English. Although this difference is statistically significant at
the 5% level, it is small, because even a girl exposed to the program from grade 7 would be
expected to perform only .006× 6 = .036 standard deviations worse in English than a boy.
A similar negative effect also appears for girls in high enrollment gap districts, but it is also
small.
16
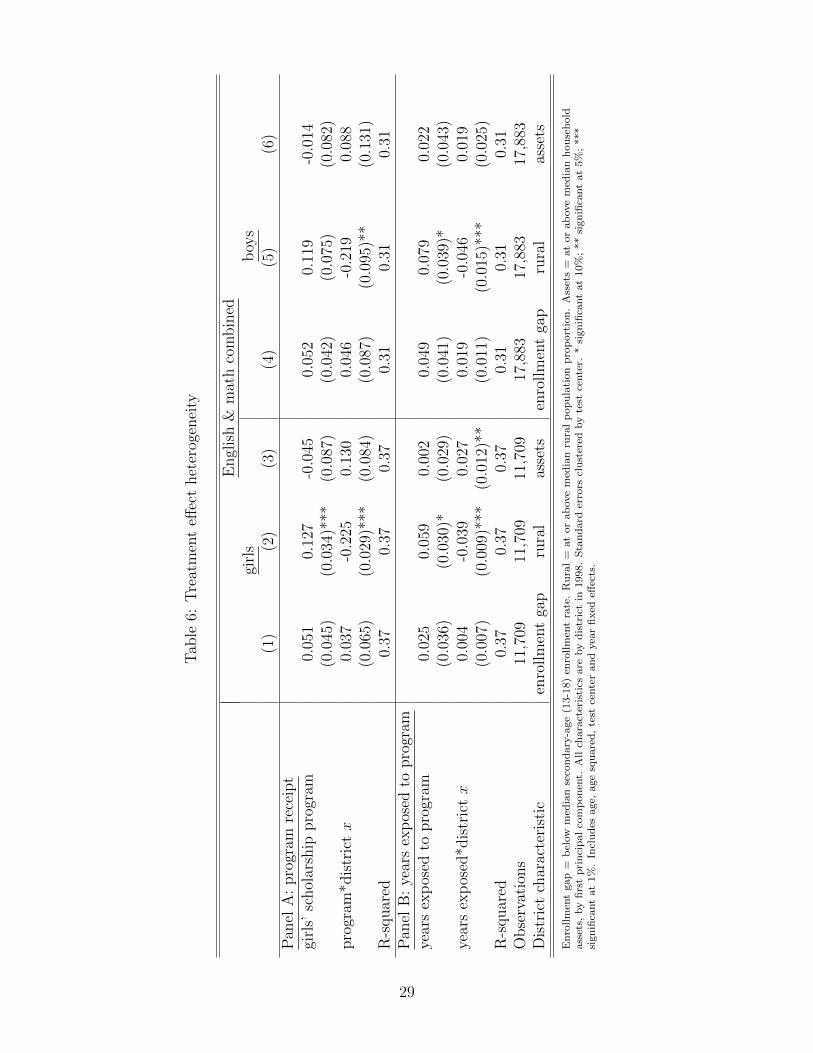
5.4 Treatment effect heterogeneity
As discussed earlier, the effect of the girls’ scholarship program on student learning is theo-
retically ambiguous. Fee elimination could free students from the need to engage in income-
generating activity or reduce stress, thereby improving performance. On the other hand, an
influx of new students could lower the quality of the average student or place strain on school
resources and harm the learning environment. We would expect these latter effects to be
more likely in places with lower existing resources among schools or households. We explore
this possibility by testing whether the program’s effect differs according to pre-treatment
characteristics. To some extent we have already done this through interactions or splitting
the sample by district enrollment gap in Tables 3 and 5 , but we expand our inquiry here.
We augment the difference-in-differences specification of equations (1) and (3) to include
interactions with pre-treatment district characteristics. These characteristics, all taken from
the 1998 Integrated Household Survey, are: an indicator for having a high enrollment gap,
defined as being below the median enrollment rate among secondary school-aged (13-18)
youth; an indicator for being at or above the median rural population percentage; and an
indicator for being at or above the median level of a household asset index.24 Table 6
shows results for combined English and math scores.25 In columns (1) and (4), we find no
differences in program impact between high- and low-enrollment gap districts, regardless of
whether the treatment is considered binary or continuous. In column (2), we find that girls
in districts with rural population percentage at or above the pre-treatment median perform
.225 standard deviations worse on math and English, or .04 standard deviations per year
of program exposure, significant at 1%. Results for boys in column (5) are similar. The
magnitude of the coefficients for the binary treatment in Panel (A) are large enough to make
the program effect negative in the most rural districts.
24The asset index is the first principal component of the following assets: bicycle, car, refrigerator, motor-cycle, sewing iron, television, radio, VCR.
25Sample sizes drop relative to Tables 4 and 5 because not all districts are represented in the 1998 householdsurvey. Because the survey is nationally representative, however, the dropped observations are missing atrandom, which will make our results less precise but still unbiased.
17
In column (6), girls in districts with a household asset index at or above the median
perform .027 standard deviations better with each additional year of program exposure,
though the effect for boys is not statistically significant. These results present some evidence,
albeit limited, that students in better-off districts gained most from the program. This result
is not surprising, as those are the districts where the program may have worked more on the
intensive margin rather than the extensive margin. That is, in better-off districts, students
would be more likely to attend school even in the absence of the program, allowing scholarship
receipt to ease finance-related stresses on academic performance. In worse-off districts, the
scholarship is more likely to retain students who otherwise would have dropped out, or induce
enrollment among less academically prepared students previously out of school.26
6 Conclusion
This paper evaluated the effect of the Gambian girls’ scholarship program on the quan-
tity, composition, and achievement of secondary school students. Our approach relied on
difference-in-differences estimation, comparing regions that received the program early to
those that received it late. We demonstrated the validity of this identification strategy by
verifying that outcome trends were similar across regions prior to treatment. We found that
the number of students taking the high school exit exam increased due to the girls’ scholar-
ship program, consistent with the presence of financial constraints on enrollment in secondary
school. These results confirm those of Gajigo (2012), who found increased enrollment among
girls aged 13-18, and extend them in two important ways. First, because our results are
based on the number of students sitting the Grade 12 exit exam, they demonstrate that
the effects of the scholarship program persisted throughout secondary school, rather than
26Limiting the sample to students who are 20 years old or less, who are less likely to have started schoollate, repeated a grade, or returned to school after dropout, leads to largely similar results as in Table 4.The exception is Math results for girls, which are -.14 standard deviations lower in response to treatment(significant at 5%). This suggests that the increased average age of students found in Table A2 is not animportant indicator of student quality, or that the direction of selection is not obvious. Results not shownbut available upon request.
18
being limited to earlier grades. Second, we find increases for both girls and boys, though the
estimates for girls are less precise.
We also find changes in the composition of students in response to the scholarship. The
scholarship increased the share of students in private schools, but only in districts with a
low secondary enrollment gap, where students are less likely to be constrained by transport
costs or lack of choice. Students were also more likely to be absent from the exam in high
enrollment gap districts, and boys were more likely to be older, consistent with their re-
enrollment in school following an interruption. We find no changes in school resources in
response to the scholarship, though data limitations prevent us from ruling out this channel
entirely.
Test scores increased in response to the scholarship, with combined English and math
scores rising by .09 standard deviations for girls and .11 standard deviations for boys. These
gains were concentrated in English (.19 s.d. for girls, .15 s.d. for boys). Evidence of learning
gains are striking, given that the marginal student induced to enroll due to the scholarship
program is likely to be of lower ability than average. A natural question to ask, therefore, is
whether the changes in student composition induced by the program can explain the results.
Our finding that the scholarship increased the share of students in private schools, where the
average student scores lower than in public schools, points in this direction. Closer inspection
suggests that sorting of weaker students into private schools cannot fully explain increases
in learning, however. Increases in private school enrollment due to the scholarship did not
occur in high enrollment gap districts, yet these districts saw gains in math in response to the
scholarship. Moreover, these gains in math were even higher for girls than for boys (.06 s.d.
greater than boys’ gains of .08 s.d.), whereas the marginal girl affected by the scholarship
program in high enrollment districts should be negatively selected. Siphoning of weaker
students to private schools is not likely to explain learning gains from the scholarship.27
27However, low enrollment gap districts saw increases in both private school enrollment and English scores.These phenomena could be related if private schools attract students with a stronger connection to theirtraditional language or focus less on English instruction, suggesting another interesting dimension alongwhich sorting could have occurred.
19
Instead, our interpretation is that the conventional view that students induced to enroll
by fee elimination are negatively selected does not hold in our context. In The Gambia,
completing high school is rare, particularly for girls. Taking the high school exit exam is a
considerable accomplishment in this context, and those who remain enrolled long enough to
do so were likely among the stronger students in earlier grades. Among the set of students in
all grades who benefitted from the scholarship program, those who remained in school long
enough to sit the exam are more likely to be positively selected, relative to both scholarship
beneficiaries and the average student.
More broadly, our results suggest that improving access to secondary education in coun-
tries where enrollment is low need not come at the expense of student learning. As developing
countries increasingly turn their attention to secondary school, finding policies to promote
both opportunity and achievement should sit high on the agenda.
20
References
Baird, Sarah, McIntosh, Craig, & Ozler, Berk. 2011. Cash or Condition? Evidence from a
Cash Transfer Experiment. Quarterly Journal of Economics, 126(4), 1709–1753.
Banerjee, Abhijit V., Glewwe, Paul, Powers, Shawn, & Wasserman, Melanie. 2013. Expand-
ing Access and Increasing Student Learning in Post-Primary Education in Developing
Countries: A Review of the Evidence. Apr.
Begum, Lutfunnahar, Islam, Asadul, & Smyth, Russell. 2012. Girls’ education, stipend
programs and the effects on younger siblings’ education. IZA Working Paper.
Blimpo, Moussa P. 2014. Team Incentives for Education in Developing Countries: A Ran-
domized Field Experiment in Benin. Forthcoming, American Economic Journal: Applied
Economics.
Blimpo, Moussa P., Evans, David K., & Lahire, Nathalie. 2011. School-Based Management
and Educational Outcomes: Lessons from a Randomized Field Experiment. Working
Paper.
Burde, Dana, & Linden, Leigh L. 2013. Bringing Education to Afghan Girls: A Random-
ized Controlled Trial of Village-Based Schools. American Economic Journal: Applied
Economics, 5(3), 2740.
Chaudhury, Nazmul, & Parajuli, Dilip. 2010. Conditional Cash Transfers and Female School-
ing: The Impact of the Female School Stipend Programme on Public School Enrolments
in Punjab, Pakistan. Applied Economics, 42(28-30), 3565–3583.
Duflo, Esther, Dupas, Pascaline, & Kremer, Michael. 2009. Returns to Secondary Schooling
in Ghana. URL: http://www.povertyactionlab.org/evaluation/returns-secondary-schooling-
ghana.
Filmer, Deon, & Schady, Norbert. 2008. Getting Girls into School: Evidence from a Scholar-
ship Program in Cambodia. Economic Development and Cultural Change, 56(3), 581–617.
Gajigo, Ousman. 2012. Closing the Education Gender Gap: Estimating the Impact of Girls
Scholarship Program in The Gambia.
Gambia Ministry of Basic and Secondary Education. 2004. Sources of Funds for the Girls
Scholarship Program. Tech. rept.
21
Hoxby, Caroline. 2000. Peer Effects in Classrooms: Learning from Gender and Race Varia-
tion. NBER Working paper 7867.
Kazianga, Harounan, Levy, Dan, Linden, Leigh L., & Sloan, Matt. 2013. The Effects of ’Girl-
Friendly’ Schools: Evidence from the BRIGHT School Construction Program in Burkina
Faso. American Economic Journal: Applied Economics, 5(3), 41–62.
Kim, Jooseop, Alderman, Harold, & Orazem, Peter F. 1999a. Can Private School Subsidies
Increase Enrollment for the Poor? The Quetta Urban Fellowship Program. World Bank
Economic Review, 13(3), 443–465.
Kim, Jooseop, Alderman, Harold, & Orazem, Peter F. 1999b. Evaluation of the Balochistan
Rural Girls’ Fellowship Program-Will rural families pay to send girls to school?
Kremer, Michael, Miguel, Edward, & Thornton, Rebecca. 2009. INCENTIVES TO LEARN.
The Review of Economics and Statistics, 91(3), 437–456.
Krishnaratne, Shari, White, Howard, & Carpenter, Ella. 2013. Quality education for all
children? What works in education in developing countries. 3ie Working Paper Number
20.
Lucas, Adrienne M., & Mbiti, Isaac M. 2012a. Access, Sorting, and Achievement: The Short-
Run Effects of Free Primary Education in Kenya. American Economic Journal: Applied
Economics, 4(4), 226–253.
Lucas, Adrienne M., & Mbiti, Isaac M. 2012b. Does Free Primary Education Narrow Gender
Differences in Schooling? Evidence from Kenya. Journal of African Economies, 21(5),
691–722.
Muralidharan, Karthik, & Prakash, Nishith. 2013. Cycling to School: Increasing Secondary
School Enrollment for Girls in India. Working Paper 19305.
Murnane, Richard J., & Ganimian, Alejandro J. 2014 (July). Improving Educational Out-
comes in Developing Countries: Lessons from Rigorous Evaluations. Working Paper 20284.
National Bureau of Economic Research.
Petrosino, Anthony, Morgan, Claire, Fronius, Trevor A., Tanner-Smith, Emily E., & Boruch,
Robert F. 2012. Interventions in Developing Nations for Improving Primary and Sec-
ondary. Campbell Systematic Reviews, 19.
Pritchett, Lant. 2013. The Rebirth of Education: Schooling Ain’t Learning. Washington,
D.C: Center for Global Development.
22
Pugatch, Todd, & Schroeder, Elizabeth. 2014. Incentives for teacher relocation: Evidence
from the Gambian hardship allowance. Economics of Education Review, 41(Aug.), 120–
136.
23
Tables
Table 1: Summary statistics
1998 2005 2012male
test takers 749 1,161 1,404English -0.27 -0.20 -0.08math -0.06 -0.14 -0.13combined -0.21 -0.20 -0.12
femaletest takers 210 624 846English -0.52 -0.34 -0.27math -0.23 -0.21 -0.25combined -0.46 -0.32 -0.30
female proportion 0.22 0.35 0.38
Sample is public schools in Regions 2-6. Z-scores based on universeof students taking exam in that year, including private schools andRegion 1.
24
Tab
le2:
Pre
-tre
atm
ent
tren
ds
girl
sb
oys
count
Engl
ish
mat
hco
mbin
edco
unt
Engl
ish
mat
hco
mbin
ed(1
)(2
)(3
)(4
)(5
)(6
)(7
)(8
)ti
me
(yea
rspri
orto
trea
tmen
t)-1
.30.
02-0
.013
0.00
8-4
.8-0
.021
-0.0
07-0
.006
(4.5
)(0
.031
)(0
.051
)(0
.045
)(6
.3)
(0.0
38)
(0.0
13)
(0.0
15)
tim
e*1(
regi
on=
3,4)
7.2
-0.0
10.
003
0.01
14.3
0.03
40.
030.
043
(6.7
)(0
.112
)(0
.060
)(0
.100
)(1
6.6)
(0.0
66)
(0.0
38)
(0.0
35)
tim
e*1(
regi
on=
5,6)
4.1
0.04
1-0
.026
0.02
73.
9-0
.067
-0.0
17-0
.041
(3.1
)(0
.113
)(0
.070
)(0
.103
)(1
4.5)
(0.1
30)
(0.0
81)
(0.1
06)
Obse
rvat
ions
381,
380
1,38
01,
380
383,
738
3,73
83,
738
R-s
quar
ed0.
670.
30.
330.
40.
60.
270.
30.
37p-
valu
eon
regi
on-s
pec
ific
tren
ds
0.43
0.87
0.88
0.96
0.70
0.73
0.37
0.48
Mea
nou
tcom
e35
.5-0
.28
-0.1
9-0
.27
93.8
-0.2
2-0
.09
-0.1
7
“C
ou
nt”
isnu
mb
erof
test
-taker
s,by
test
cente
r.S
tan
dard
erro
rscl
ust
ered
by
test
cente
r.*
sign
ifica
nt
at
10%
;**
sign
ifica
nt
at
5%
;***
sign
ifica
nt
at
1%
.A
llre
gre
ssio
ns
incl
ud
ete
stce
nte
ran
dyea
rfi
xed
effec
ts.
Reg
ress
ions
for
test
score
ou
tcom
esin
clu
de
age,
age
squ
are
d,
test
cente
ran
dyea
rfi
xed
effec
ts.
25
Tab
le3:
Gir
ls’
schol
arsh
ippro
gram
and
test
-tak
ers
girl
sb
oys
pro
port
ion
test
-tak
ers
pri
vate
shar
ete
st-t
aker
sp
riva
tesh
are
fem
ale
(1)
(2)
(3)
(4)
(5)
(6)
(7)
(8)
(9)
(10)
girl
s’sc
hol
arsh
ipp
rogr
am26
.124
.20.
210.
2442
.638
.40.
210.2
40.0
30.0
3(1
1.1)
**(1
2.6)
*(0
.11)
*(0
.13)
*(2
1.9)
*(2
4.8)
(0.0
7)**
*(0
.09)*
*(0
.03)
(0.0
4)
pro
gram
*hig
hen
roll
men
tga
p12
.1-0
.32
27.8
-0.2
70.0
2(2
0.0)
(0.1
8)*
(25.
2)(0
.15)*
(0.0
6)
Ob
serv
atio
ns
184
184
184
184
184
184
184
184
184
184
R-s
qu
ared
0.6
0.6
0.84
0.85
0.67
0.68
0.85
0.8
60.6
40.6
4M
ean
outc
ome
40.5
40.5
0.32
0.32
78.2
78.2
0.25
0.2
50.3
40.3
4
Tes
t-ta
ker
san
dp
rop
ort
ion
fem
ale
refe
rto
pu
blic
(sch
ola
rsh
ip-e
ligib
le)
test
cente
rson
ly.
Sam
ple
isd
istr
ict
pan
el,
1998-2
012.
All
regre
ssio
ns
incl
ud
ed
istr
ict
an
dyea
rfi
xed
effec
ts.
Reg
ress
ions
for
pri
vate
share
an
dp
rop
ort
ion
fem
ale
wei
ghte
dby
nu
mb
erof
test
-taker
s.S
tan
dard
erro
rscl
ust
ered
by
dis
tric
t.*
sign
ifica
nt
at
10%
;**
sign
ifica
nt
at
5%
;***
sign
ifica
nt
at
1%
.
26
Tab
le4:
Gir
ls’
schol
arsh
ippro
gram
and
test
scor
es
girl
sb
oys
Engl
ish
mat
hco
mbin
edE
ngl
ish
mat
hco
mbin
ed(1
)(2
)(3
)(4
)(5
)(6
)P
anel
A:
pro
gram
rece
ipt
girl
s’sc
hol
arsh
ippro
gram
0.19
2-0
.073
0.08
90.
154
0.02
40.
113
(0.0
95)*
(0.0
53)
(0.0
52)*
(0.0
65)*
*(0
.093
)(0
.052
)**
R-s
quar
ed0.
320.
20.
350.
230.
170.
27P
anel
B:
year
sex
pos
edto
pro
gram
year
sex
pos
edto
pro
gram
0.08
9-0
.024
0.04
60.
114
0.02
60.
088
(0.0
54)
(0.0
27)
(0.0
40)
(0.0
57)*
(0.0
45)
(0.0
56)
R-s
quar
ed0.
320.
20.
350.
230.
170.
27O
bse
rvat
ions
7,99
715
,811
Sta
nd
ard
erro
rscl
ust
ered
by
test
cente
r.*
sign
ifica
nt
at
10%
;**
sign
ifica
nt
at
5%
;***
sign
ifica
nt
at
1%
.In
clu
des
age,
age
squ
are
d,
test
cente
ran
dyea
rfi
xed
effec
ts.
27
Tab
le5:
Gir
ls’
schol
arsh
ippro
gram
and
test
scor
es:
trip
lediff
eren
ce
full
sam
ple
hig
hen
roll
men
tga
plo
wen
roll
men
tgap
En
glis
hm
ath
com
bin
edE
ngl
ish
mat
hco
mb
ined
En
gli
shm
ath
com
bin
ed(1
)(2
)(3
)(4
)(5
)(6
)(7
)(8
)(9
)
Pan
elA
:p
rogr
amre
ceip
t
girl
s’sc
hol
arsh
ipp
rogr
am0.
162
-0.0
020.
104
0.00
50.
078
0.02
80.2
05
-0.0
49
0.0
87
(0.0
72)*
*(0
.079
)(0
.038
)**
(0.0
13)
(0.0
10)*
**(0
.011
)**
(0.0
80)*
*(0
.060)
(0.0
32)*
*p
rogr
am*f
emal
e-0
.001
0.01
50.
017
-0.0
120.
058
0.03
2-0
.007
-0.0
17
-0.0
03
(0.0
27)
(0.0
27)
(0.0
29)
(0.0
31)
(0.0
19)*
**(0
.021)
(0.0
20)
(0.0
23)
(0.0
23)
R-s
qu
ared
0.25
0.17
0.29
0.13
0.05
0.12
0.3
20.2
20.3
6P
anel
B:
year
sex
pos
edto
pro
gram
year
sex
pos
edto
pro
gram
0.11
10.
010.
078
-0.0
550.
204
0.07
70.0
78
-0.0
19
0.0
39
(0.0
55)*
(0.0
41)
(0.0
50)
(0.0
96)
(0.0
34)*
**(0
.055)
(0.0
53)
(0.0
44)
(0.0
45)
year
sex
pos
ed*f
emal
e-0
.006
0.00
1-0
.002
-0.0
090.
002
-0.0
04
-0.0
04
-0.0
03
-0.0
03
(0.0
03)*
*(0
.004
)(0
.003
)(0
.005
)*(0
.006
)(0
.005
)(0
.004)
(0.0
04)
(0.0
04)
R-s
qu
ared
0.26
0.17
0.29
0.13
0.06
0.12
0.3
20.2
20.3
6O
bse
rvat
ion
s23
,808
6,66
414,3
83
Hig
h/lo
wen
rollm
ent
gap
base
don
splitt
ing
sam
ple
into
bel
ow
/at
or
ab
ove
med
ian
seco
nd
ary
-age
(13-1
8)
child
ren
enro
lled
insc
hool,
by
dis
tric
tin
1998.
Sta
nd
ard
erro
rscl
ust
ered
by
test
cente
r.*
sign
ifica
nt
at
10%
;**
sign
ifica
nt
at
5%
;***
sign
ifica
nt
at
1%
.In
clu
des
age,
age
squ
are
d,
test
cente
ran
dyea
rfi
xed
effec
ts.
28
Tab
le6:
Tre
atm
ent
effec
thet
erog
enei
ty
Engl
ish
&m
ath
com
bin
edgi
rls
boy
s(1
)(2
)(3
)(4
)(5
)(6
)P
anel
A:
pro
gram
rece
ipt
girl
s’sc
hol
arsh
ippro
gram
0.05
10.
127
-0.0
450.
052
0.11
9-0
.014
(0.0
45)
(0.0
34)*
**(0
.087
)(0
.042
)(0
.075
)(0
.082
)pro
gram
*dis
tric
tx
0.03
7-0
.225
0.13
00.
046
-0.2
190.
088
(0.0
65)
(0.0
29)*
**(0
.084
)(0
.087
)(0
.095
)**
(0.1
31)
R-s
quar
ed0.
370.
370.
370.
310.
310.
31P
anel
B:
year
sex
pos
edto
pro
gram
year
sex
pos
edto
pro
gram
0.02
50.
059
0.00
20.
049
0.07
90.
022
(0.0
36)
(0.0
30)*
(0.0
29)
(0.0
41)
(0.0
39)*
(0.0
43)
year
sex
pos
ed*d
istr
ictx
0.00
4-0
.039
0.02
70.
019
-0.0
460.
019
(0.0
07)
(0.0
09)*
**(0
.012
)**
(0.0
11)
(0.0
15)*
**(0
.025
)R
-squar
ed0.
370.
370.
370.
310.
310.
31O
bse
rvat
ions
11,7
0911
,709
11,7
0917
,883
17,8
8317
,883
Dis
tric
tch
arac
teri
stic
enro
llm
ent
gap
rura
las
sets
enro
llm
ent
gap
rura
las
sets
En
rollm
ent
gap
=b
elow
med
ian
seco
nd
ary
-age
(13-1
8)
enro
llm
ent
rate
.R
ura
l=
at
or
ab
ove
med
ian
rura
lp
op
ula
tion
pro
port
ion
.A
sset
s=
at
or
ab
ove
med
ian
hou
seh
old
ass
ets,
by
firs
tp
rin
cip
al
com
pon
ent.
All
chara
cter
isti
csare
by
dis
tric
tin
1998.
Sta
nd
ard
erro
rscl
ust
ered
by
test
cente
r.*
sign
ifica
nt
at
10%
;**
sign
ifica
nt
at
5%
;***
sign
ifica
nt
at
1%
.In
clu
des
age,
age
squ
are
d,
test
cente
ran
dyea
rfi
xed
effec
ts.
29
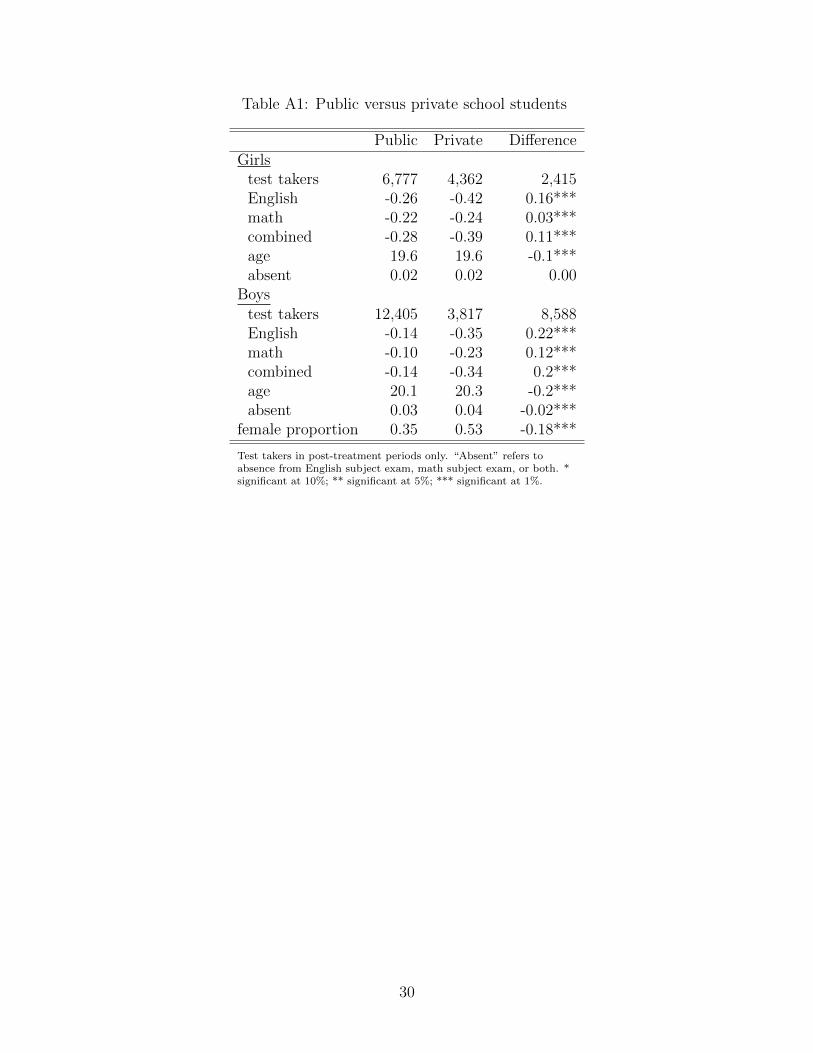
Table A1: Public versus private school students
Public Private DifferenceGirls
test takers 6,777 4,362 2,415English -0.26 -0.42 0.16***math -0.22 -0.24 0.03***combined -0.28 -0.39 0.11***age 19.6 19.6 -0.1***absent 0.02 0.02 0.00
Boystest takers 12,405 3,817 8,588English -0.14 -0.35 0.22***math -0.10 -0.23 0.12***combined -0.14 -0.34 0.2***age 20.1 20.3 -0.2***absent 0.03 0.04 -0.02***
female proportion 0.35 0.53 -0.18***
Test takers in post-treatment periods only. “Absent” refers toabsence from English subject exam, math subject exam, or both. *significant at 10%; ** significant at 5%; *** significant at 1%.
30
Tab
leA
2:G
irls
’sc
hol
arsh
ipan
dco
mp
osit
ion
ofte
stta
kers
girl
sb
oys
age
abse
nt
age
abse
nt
(1)
(2)
(3)
(4)
(5)
(6)
(7)
(8)
girl
s’sc
hol
arsh
ippro
gram
0.1
0.1
-0.0
3-0
.03
0.2
0.2
-0.0
2-0
.03
(0.1
)(0
.1)
(0.0
1)*
(0.0
1)**
(0.1
1)*
(0.1
)(0
.02)
(0.0
2)pro
gram
*hig
hen
rollm
ent
gap
0.2
0.04
0.3
0.05
(0.2
)(0
.02)
*(0
.09)
***
(0.0
2)**
Obse
rvat
ions
7,23
47,
234
7,38
57,
385
13,8
1313
,813
14,1
9014
,190
R-s
quar
ed0.
040.
040.
080.
080.
030.
030.
060.
06N
o.of
clust
ers
3030
3030
3030
3030
Mea
nou
tcom
e19
.619
.60.
020.
0220
.220
.20.
030.
03
“A
bse
nt”
refe
rsto
ab
sen
cefr
om
En
glish
sub
ject
exam
,m
ath
sub
ject
exam
,or
both
.R
egre
ssio
ns
incl
ud
este
stce
nte
ran
dyea
rfi
xed
effec
ts.
Sta
nd
ard
erro
rscl
ust
ered
by
test
cente
r.*
sign
ifica
nt
at
10%
;**
sign
ifica
nt
at
5%
;***
sign
ifica
nt
at
1%
.
31
Tab
leA
3:G
irls
’sc
hol
arsh
ipan
dsc
hool
qual
ity
pupil-t
each
erra
tio
fem
ale
teac
her
%(1
)(2
)(3
)(4
)gi
rls’
schol
arsh
ippro
gram
-33.
6-3
3.1
0.02
0.02
(29.
7)(2
8.2)
(0.0
3)(0
.03)
pro
gram
*hig
hen
rollm
ent
gap
-5.4
-0.0
6(2
1.0)
(0.0
3)*
Obse
rvat
ions
254
254
254
254
R-s
quar
ed0.
300.
300.
480.
49N
o.of
clust
ers
3131
3131
Mea
nou
tcom
e37
.237
.20.
080.
08
Reg
ress
ion
sin
clu
de
sch
ool
an
dyea
rfi
xed
effec
ts.
Wei
ghte
dby
enro
llm
ent.
Sta
nd
ard
erro
rscl
ust
ered
by
sch
ool.*
sign
ifica
nt
at
10%
;**
sign
ifica
nt
at
5%
;***
sign
ifica
nt
at
1%
.S
ou
rce:
Sch
ool
pan
el1998-2
012,
from
Ed
uca
tion
Man
agem
ent
Info
rmati
on
Syst
em(E
MIS
),m
ain
tain
edby
Gam
bia
nM
inis
try
of
Basi
can
dS
econ
dary
Ed
uca
tion
.
32
Figures
Figure 1: The Gambia and its regions
Figure 2: Girls’ Scholarship Program Implementation
(a) 2000 (b) 2001
(c) 2002 (d) 2004
33
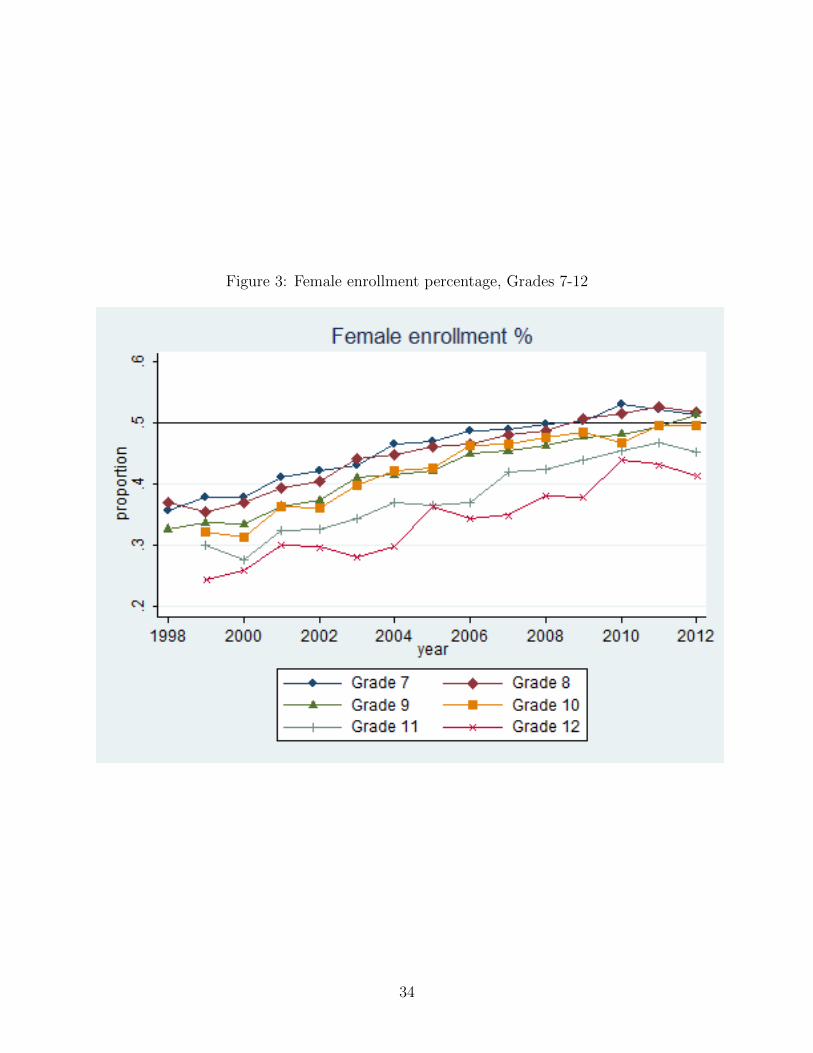
Figure 3: Female enrollment percentage, Grades 7-12
34
Fig
ure
A1:
Gam
bia
Mid
dle
and
Hig
hSch
ool
s
35
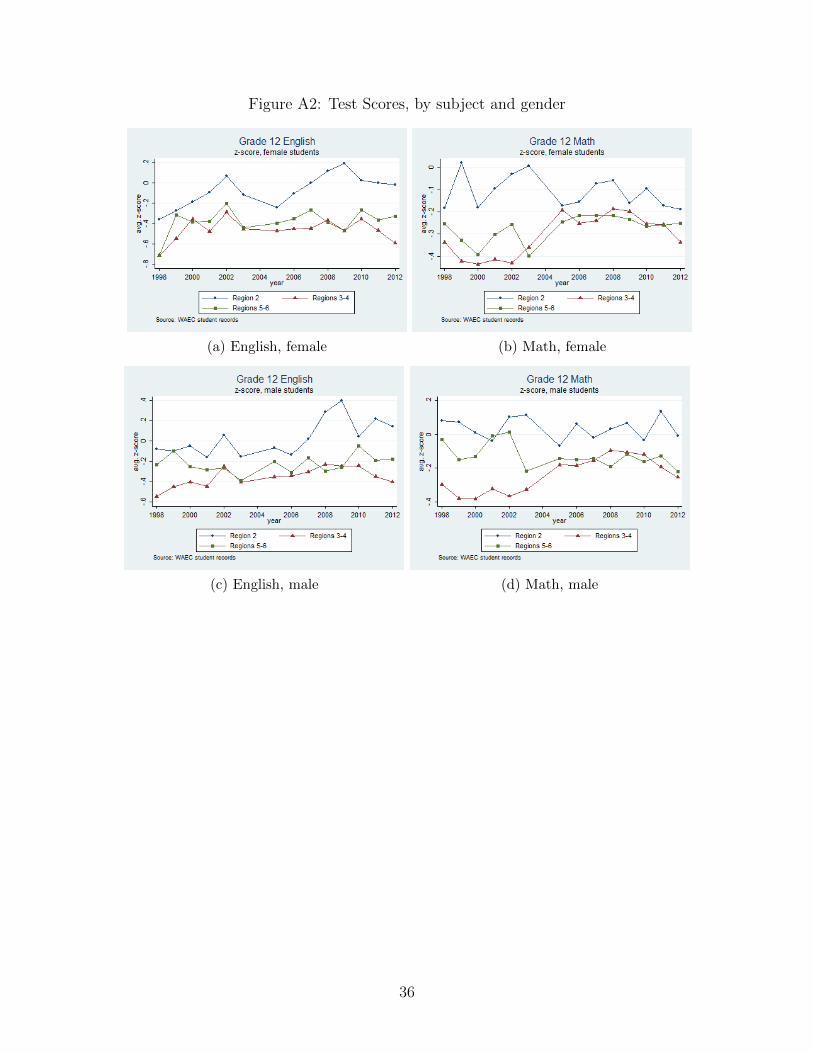
Figure A2: Test Scores, by subject and gender
(a) English, female (b) Math, female
(c) English, male (d) Math, male
36


![Primary Education (Girls) Sector Project (Loan 977-PAK[SF])](https://img.pdfslide.us/doc/110x75/577ce66d1a28abf10392ca61/primary-education-girls-sector-project-loan-977-paksf.jpg)