Embed Size (px)
Citation preview
1 1
FINANCIAL CONDITION ANALYSIS OF OREGON PUBLIC UNIVERSITIES
2021

2
TABLE OF CONTENTS
OVERVIEW 3
IMPACT OF COVID-19 8
EASTERN OREGON UNIVERSITY 9
OREGON INSTITUTE OF TECHNOLOGY 13
OREGON STATE UNIVERSITY 17
PORTLAND STATE UNIVERSITY 22
SOUTHERN OREGON UNIVERSITY 27
UNIVERSITY OF OREGON 31
WESTERN OREGON UNIVERSITY 35
APPENDIX 40

3
OVERVIEW
This report contains a broad financial evaluation of each of Oregon’s seven public universities. The objective of this report is to identify institutions in which the potential for financial stress exists.
Two perspectives are provided. The oversight perspective looks at all institutional funding, including foundation assets, and employs financial ratios to calculate a composite financial index (CFI) to provide an overall assessment of the institution’s financial health. The governance perspective is limited to the education and general (E&G) fund, sometimes called the general fund, of the institution in which the financial activity related to instruction, research and public service is collected.
For the oversight perspective, the process starts with the identification of relevant financial indicators after which standards are then defined. The extent to which an institution meets all the standards will then provide insight as to whether or not the institution could potentially experience financial stress in the future. The best approach is to compare an institution to itself over time, rather than comparing peer to peer.
As such, this analysis considers each institution across all funds (i.e. general fund, plant fund, auxiliary fund, etc.) and includes component units (i.e. a foundation) that are included in the university’s annual financial report. The framework for this analysis is a book called Strategic Financial Analysis for Higher Education written by KPMG and Prager, Sealy & Co. It has been in use since its first publication in the 1980’s and is widely used by trustees, senior managers, financial analysts, and credit analysts to properly assess institutions of higher education. A version of this framework is also used by the US Department of Education in their financial responsibility score currently used to assess private institutions.
The governance perspective is a bit narrower in scope in that it only considers the E&G, or general fund, of the institution. The other funds are considered self-balancing, and although transfers between funds can and do occur, the general fund is often where governing board decision making is concentrated since it represents the majority of the institution’s financial activity.
Information related to the governance perspective is presented for each institution alongside the calculations for the financial rations and CFI. The remainder of this section discusses the calculation of the financial ratios and other qualitative metrics used to consider an institution’s financial health.
FINANCIAL ANALYSIS IN HIGHER EDUCATION
The overall financial health of an institution can be assessed via two dimensions of inquiry. First, is the institution financially capable of successfully carrying out its current programs? Second, is the institution able to carry out its intended programs well into the future? Along those two dimensions, four key financial questions need to be asked. A financial ratio is designed to measure the answer for each question.
Two perspectives are provided. An oversight perspective, focused on all funds including foundation assets and a governance perspective focused solely on the general fund.

4
Primary Reserve Ratio
This ratio measures the financial strength and flexibility of the institution by comparing expendable net assets to total expenses, providing a snapshot of how long the institution could continue operating without additional revenue. A decline in the primary
reserve ratio indicates expenses are growing faster than revenues and certainly faster than the growth in expendable net assets.
Viability Ratio
The viability ratio measures one of the most basic elements of financial health: debt coverage. It considers what expendable net assets are available to cover long-term debt should the institution need to immediately settle its obligations. This ratio is similar to
a coverage ratio used in the private sector to indicate the ability of an organization to cover its long-term debt.
Expendable net assets, in this circumstance, are those resources that are readily available to the institution. Typically, this includes unrestricted assets plus those assets that are restricted but expendable. Assets that are restricted but not expendable, like capital assets, are excluded. Donor assets are typically restricted but included if they are expendable. An example is endowment assets. The restricted but expendable portion is the current year earnings while the restricted but not expendable portion is the corpus of the endowment.
Return on Net Assets Ratio
This ratio measures total economic return during the fiscal year. It answers the question “are they better off financially than they were a year ago?” It shows an institution’s total economic return. A positive return on net assets means an institution is increasing
its net assets and is likely to have increased financial flexibility and ability to invest in strategic priorities. A negative return on net assets ratio may indicate the opposite, unless the negative ratio is the result of strategic
Are resources sufficient and flexible enough to support the
mission?
Primary Reserve Ratio
Are debt resources managed strategically
to advance the mission?
Viability Ratio
Does asset performance and
management support the strategic direction?
Return on Net Assets Ratio
Do operating results indicate the institution
is living within available resources?
Net Operating Revenues
Ratio
Expendable Net Assets
Total Expenses
Expendable Net Assets
Long-Term Debt
Change in Net Assets
Total Net Assets

5
investments. A temporary decline in this ratio could be reasonable should it reflect a strategy to improve the institution’s financial condition.
Net Operating Revenues Ratio
The net operating revenues ratio indicates whether total operating activities for the fiscal year generated a surplus or created a deficit. It attempts to demonstrate whether an institution is living within its available resources. Continuing
negative operating revenues ratios may indicate that an institution does not currently have capacity to develop a stronger fund balance or make strategic operating investments without the use of existing fund balance, expense reductions, or revenue enhancements.
Composite Financial Index
A widely accepted metric called the Composite Financial Index (CFI) is often used to address these four key questions. The CFI blends the four core financial ratios into one metric, providing a more balanced view of an institution’s finances. Measuring the index over time provides a glimpse as to the progress institutions are making toward achieving financial goals.
This report includes calculated CFIs for Oregon’s seven public universities for the past four fiscal years including 2017 through 2020. Some of the institutions report these same ratios and the CFI for their boards. The calculations can differ slightly depending on the data used. Our calculations are based solely on audited financial statement information while the institutions often use more granular data from their accounting systems.
BENCHMARKS
Ratio Benchmark
Primary Reserve Ratio >0.4
Viability Ratio >1.0
Return on Net Assets >6%
Net Operating Revenues >4%
Composite Financial Index No Benchmark
Adjusted Composite Financial Index* >3.0
*adjusted to remove pension and other post-employment benefits (OPEB) liabilities
Net Operating Income
Total Operating Revenue

6
ACCOUNTING PRACTICE
Changes in accounting practice can affect the calculations. For example, Governmental Accounting Standards Board (GASB) Statements No. 68, 71 and 75 all attempt to improve financial reporting by accounting for pension-related and other postemployment benefit (OPEB) liabilities. The impact of these statements was the reduction in expendable net assets leading to a reduction in both the primary reserve and viability ratios as well as higher benefits expense leading to a reduction in the net operating revenues ratio. The additional liability is significant, accounting for approximately one third of total liabilities.
This report includes the CFI calculated both with these liabilities and also adjusted to remove them. The value of pension and OPEB liabilities is actuarially determined and subject to a number of assumptions driven by demographics and other factors. The discount rate assumption is particularly sensitive; each 1% change equals a 25-30% change in the net liability.
Effective for FY2019, new guidance was issued by the Financial Accounting Standards Board (FASB) in Accounting Standards Update (ASU) 2016-14 (topic 958) which altered the categories of net assets presented for the foundations. Consequently, the calculation of expendable net assets was affected. Two ratios use the expendable net assets.
Occasionally changes in accounting practice, namely through the issuance of new guidance, will cause financial statements to be restated retroactively. Restated numbers will be incorporated in the analysis as appropriate. As a result, calculations for an institution for a given fiscal year may change in future reports.
ADDITIONAL INDICATORS
In addition to the CFI, a more robust understanding is obtained through a number of additional indicators. These include the monthly days cash on hand liquidity metric and qualitative measures including enrollment fluctuations, the dependency of revenues, audit findings and accreditation sanctions.
Enrollment Fluctuations
Consistent enrollments are integral to financial health. Net tuition revenue is typically the largest source of E&G revenue. The distribution of state funding is also influenced by enrollments. Extraordinary fluctuations in enrollment can cause volatility within these primary revenue sources. Credit rating agencies rely on enrollment data to determine student demand and market position both of which are factors in ratings analysis.
Enrollment data for all seven of the public universities is included in the appendix. This data looks at fall fourth week full-time student equivalent (FTE) enrollment going back to the 2002-03 academic year. Across all institutions, enrollment between 2002-03 and 20010-11 grew 20.7% in total with all of the institutions experiencing growth during that time. The trend has been decidedly different in the past decade. Since 2011-12, enrollment has declined 4.8% across all institutions with only two (OSU and OIT) experiencing growth during that time. Future demographics of Oregon suggest enrollments will struggle to increase as the number of 18-25-year-old residents stagnates.

7
Dependency of Revenues
The over reliance on any one source of revenue can subject an institution to volatility and risk should that revenue source substantially change. Considering each revenue source’s percentage of total revenue gives some indication of an over dependence. There is no universally excepted benchmark for this metric or definition of over dependence; however, the collection of more than 50% of total revenue from one source is often considered a reasonable benchmark indicating over reliance.
Considering the FY2020 E&G fund financial data for all seven public universities, net revenue is expressed as a percentage of the total of all E&G revenue. For all seven, 66% of E&G fund revenue comes from tuition with four at 60% or more with one institution near 80%. With such a dependence on net tuition revenue, the sensitivity of the institution’s overall financial health to enrollment is magnified.
Audit Findings
The institutions are required to have an external audit performed of their annual financial reports every year. The auditor expresses an opinion of the financial statements, control systems, and other management issues. Any material weaknesses identified by the auditor would raise the level of concern about the institution’s financial condition. The HECC is not aware of any material weaknesses identified by the external auditors.
Accreditation Sanctions
Actions taken by the regional accrediting body are also considered. Oregon is served by the Northwest Commission on Colleges and Universities (NWCCU). The 2020 accreditation standards, specifically 2.E.1 through 2.E.3, used by NWCCU include reference to the financial stability and control expected of each institution and represent good practice. Accreditation is a prerequisite for an institution to participate in federal financial aid programs and is therefore fundamental to an institution’s financial viability. The HECC is not aware of any current accreditation sanctions affecting the public universities.
DATA SOURCES AND APPENDIX
Data for the calculations in this report came from the Audited Financial Reports for each institution and related foundation. Enrollment data came from HECC’s Office of Research and Data. General fund activity and tuition collection information came from survey data provided by the institutions.
Financial ratio calculations and general fund data is included within the body of the report for each individual institution. Summary financial data across all seven of the institutions is included in the appendix including more detail on tuition collections.
8
THE IMPACT OF COVID-19
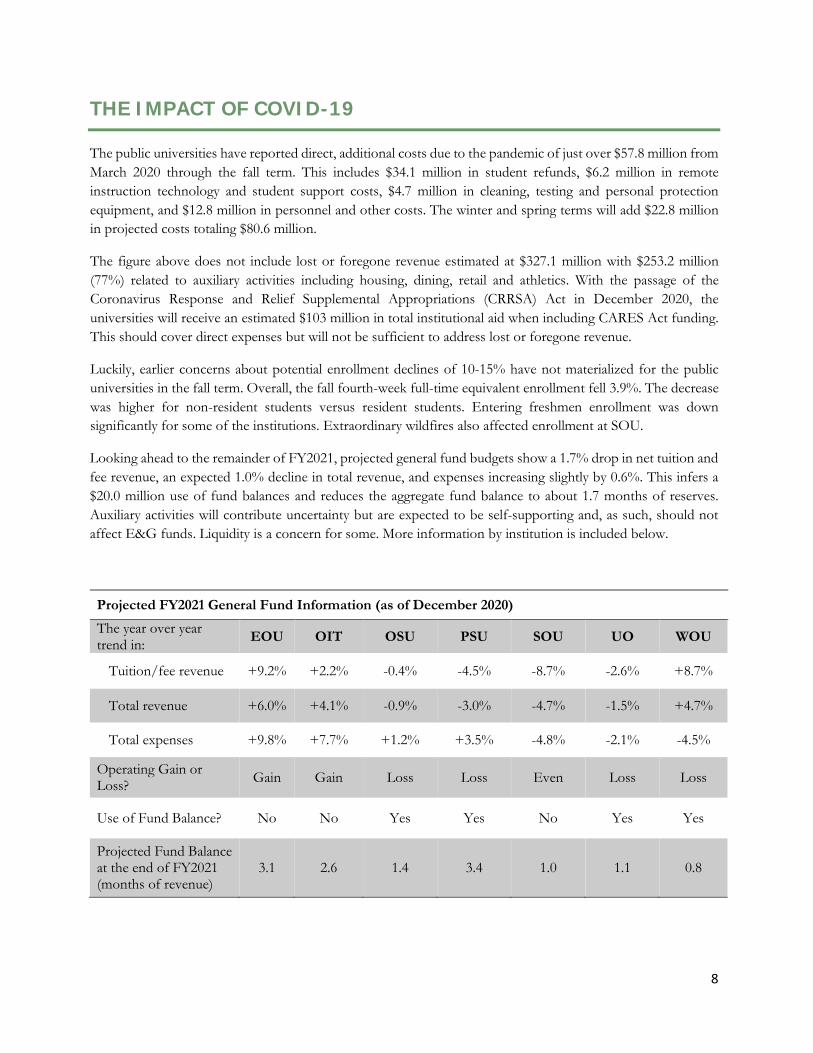
The public universities have reported direct, additional costs due to the pandemic of just over $57.8 million from March 2020 through the fall term. This includes $34.1 million in student refunds, $6.2 million in remote instruction technology and student support costs, $4.7 million in cleaning, testing and personal protection equipment, and $12.8 million in personnel and other costs. The winter and spring terms will add $22.8 million in projected costs totaling $80.6 million.
The figure above does not include lost or foregone revenue estimated at $327.1 million with $253.2 million (77%) related to auxiliary activities including housing, dining, retail and athletics. With the passage of the Coronavirus Response and Relief Supplemental Appropriations (CRRSA) Act in December 2020, the universities will receive an estimated $103 million in total institutional aid when including CARES Act funding. This should cover direct expenses but will not be sufficient to address lost or foregone revenue.
Luckily, earlier concerns about potential enrollment declines of 10-15% have not materialized for the public universities in the fall term. Overall, the fall fourth-week full-time equivalent enrollment fell 3.9%. The decrease was higher for non-resident students versus resident students. Entering freshmen enrollment was down significantly for some of the institutions. Extraordinary wildfires also affected enrollment at SOU.
Looking ahead to the remainder of FY2021, projected general fund budgets show a 1.7% drop in net tuition and fee revenue, an expected 1.0% decline in total revenue, and expenses increasing slightly by 0.6%. This infers a $20.0 million use of fund balances and reduces the aggregate fund balance to about 1.7 months of reserves. Auxiliary activities will contribute uncertainty but are expected to be self-supporting and, as such, should not affect E&G funds. Liquidity is a concern for some. More information by institution is included below.
Projected FY2021 General Fund Information (as of December 2020) The year over year trend in: EOU OIT OSU PSU SOU UO WOU
Tuition/fee revenue +9.2% +2.2% -0.4% -4.5% -8.7% -2.6% +8.7%
Total revenue +6.0% +4.1% -0.9% -3.0% -4.7% -1.5% +4.7%
Total expenses +9.8% +7.7% +1.2% +3.5% -4.8% -2.1% -4.5%
Operating Gain or Loss? Gain Gain Loss Loss Even Loss Loss
Use of Fund Balance? No No Yes Yes No Yes Yes
Projected Fund Balance at the end of FY2021 (months of revenue)
3.1 2.6 1.4 3.4 1.0 1.1 0.8

9
EASTERN OREGON UNIVERSITY
FINANCIAL RATIOS SUMMARY
Ratio FY20 FY19 FY18 FY17 Benchmark
Primary Reserve Ratio 0.18 0.15 0.17 0.21 >0.4
Viability Ratio 0.54 0.41 0.44 0.49 >1.0
Return on Net Assets 4.9% 2.2% 3.8% -0.2% >6%
Net Operating Revenues (4.0%) (3.9%) (8.3%) (2.9%) >4%
Composite Financial Index 1.10 0.66 0.56 0.72 N/A
Adjusted CFI* 3.34 2.52 2.20 4.14 >3.0
*adjusted to remove pension and OPEB related liabilities
PRIMARY RESERVE RATIO
Are resources sufficient and flexible enough to support the mission?
Amounts in $ Thousands 2017 2018 2019 2020
Expendable Net Assets $12,284 $10,268 $9,302 $11,357
University/Foundation $6,355/$5,929 $2,925/$7,343 $3,305/$5,997 $3,837/$7,520
Expenses $58,004 $59,887 $62,597 $64,152
Calculated Ratio 0.21 0.17 0.15 0.18
EOU’s primary reserve ratio has improved year over year due to a 22.1% increase in expendable net assets balanced against a constrained 2.5% increase in expenses. Much of that growth in assets has occurred within the foundation. This improvement is important since a low primary reserve ratio indicates that available resources are not sufficient or flexible enough to support the institution’s mission in the future.

10
VIABILITY RATIO
Are debt resources managed strategically to advance the mission?
Amounts in $ Thousands 2017 2018 2019 2020
Expendable Net Assets $12,284 $10,268 $9,302 $11,357
Total Long-Term Debt $25,014 $23,474 $22,823 $21,210
Calculated Ratio 0.49 0.44 0.41 0.54
EOU’s viability ratio has improved as well. The value of total expendable net assets has improved while the outstanding balance of long-term debt continues to decline. EOU’s viability ratio as a result of FY2020 is at the point where they can cover 54 cents out of every dollar currently owed with expendable net assets. The long-term debt amount noted above does not include the currently estimated $21.9 million in net pension and benefits liabilities recorded by EOU.
RETURN ON NET ASSETS RATIO
Does asset performance and management support the strategic direction?
Amounts in $ Thousands 2017 2018 2019 2020
Total Change in Net Position ($145) $2,603 $1,568 $3,528
Total Beginning Net Position $68,992 $68,274 $70,877 $72,445
Calculated Ratio (0.2%) 3.8% 2.2% 4.9%
The return on net assets ratio demonstrates whether an institution is financially better off than in previous years. It shows an institution’s total economic return. A positive return on net assets ratio means an institution is increasing its net assets and is likely to have increased financial flexibility and ability to invest in strategic priorities. A negative return on net assets ratio may indicate the opposite, unless the negative ratio is the result of strategic investments. EOU has shown significant improvement in this ratio over the past four years.

11
NET OPERATING REVENUES RATIO
Do operating results indicate the institution is living within available resources?
Amounts in $ Thousands 2017 2018 2019 2020
Net Operating Income ($1,622) ($4,586) ($2,322) ($2,456)
Total Operating Revenues $55,635 $55,301 $60,275 $61,696
Calculated Ratio (2.9%) (8.3%) (3.9%) (4.0%)
EOU’s net operating revenues ratio remained relatively stable the past few years, although negative during all of them. Continuing negative operating revenues ratios may indicate that an institution does not currently have capacity to develop a stronger fund balance or make strategic operating investments without the use of existing fund balances, expense reductions, or revenue enhancements.
COMPOSITE FINANCIAL INDEX
RATIO ANALYSIS SUMMARY
Overall, EOU is in a stable, and improving, financial position. They have improved the level of expendable net assets, improved the performance of existing assets, and have improved their overall liquidity position. Still, EOU’s financial position is potentially precarious and sensitive to enrollment changes as well as the balance between state formula revenues and other sources of revenue.
0.0
1.0
2.0
3.0
4.0
5.0
FY17 FY18 FY19 FY20
Benchmark Unadjusted Adjusted
12
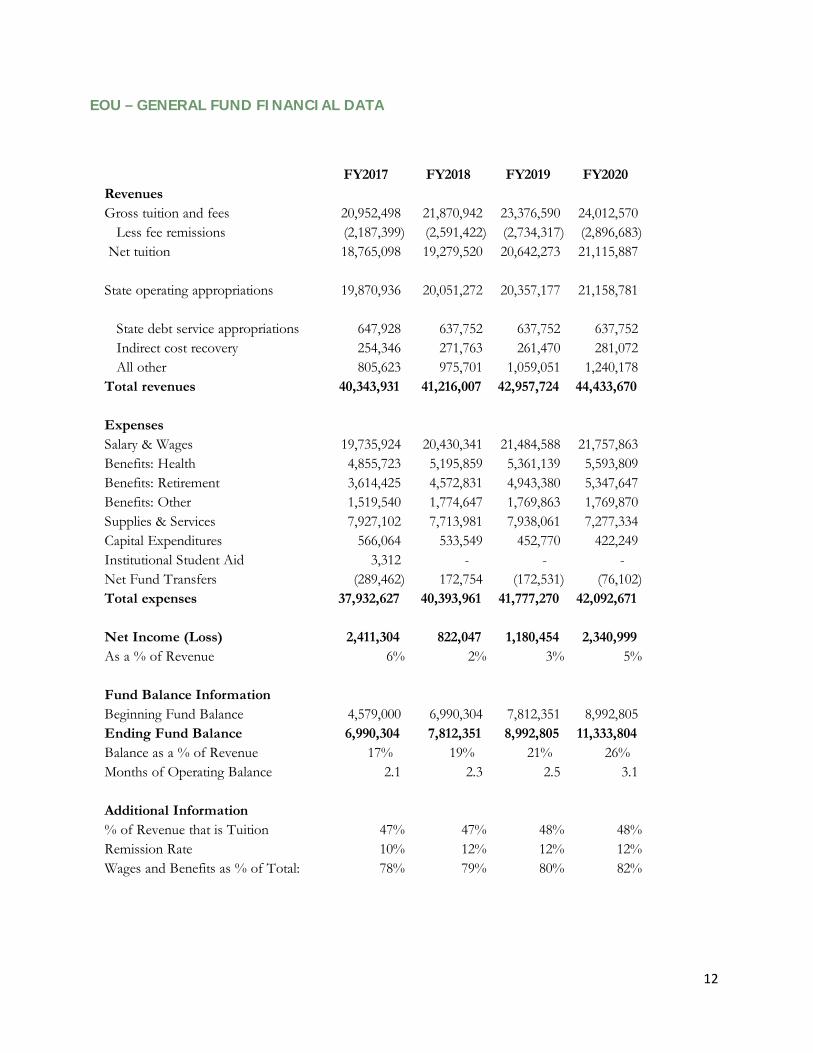
EOU – GENERAL FUND FINANCIAL DATA
FY2017 FY2018 FY2019 FY2020RevenuesGross tuition and fees 20,952,498 21,870,942 23,376,590 24,012,570 Less fee remissions (2,187,399) (2,591,422) (2,734,317) (2,896,683)
Net tuition 18,765,098 19,279,520 20,642,273 21,115,887
State operating appropriations 19,870,936 20,051,272 20,357,177 21,158,781
State debt service appropriations 647,928 637,752 637,752 637,752 Indirect cost recovery 254,346 271,763 261,470 281,072 All other 805,623 975,701 1,059,051 1,240,178
Total revenues 40,343,931 41,216,007 42,957,724 44,433,670
ExpensesSalary & Wages 19,735,924 20,430,341 21,484,588 21,757,863 Benefits: Health 4,855,723 5,195,859 5,361,139 5,593,809 Benefits: Retirement 3,614,425 4,572,831 4,943,380 5,347,647 Benefits: Other 1,519,540 1,774,647 1,769,863 1,769,870 Supplies & Services 7,927,102 7,713,981 7,938,061 7,277,334 Capital Expenditures 566,064 533,549 452,770 422,249 Institutional Student Aid 3,312 - - - Net Fund Transfers (289,462) 172,754 (172,531) (76,102) Total expenses 37,932,627 40,393,961 41,777,270 42,092,671
Net Income (Loss) 2,411,304 822,047 1,180,454 2,340,999 As a % of Revenue 6% 2% 3% 5%
Fund Balance InformationBeginning Fund Balance 4,579,000 6,990,304 7,812,351 8,992,805 Ending Fund Balance 6,990,304 7,812,351 8,992,805 11,333,804 Balance as a % of Revenue 17% 19% 21% 26%Months of Operating Balance 2.1 2.3 2.5 3.1
Additional Information% of Revenue that is Tuition 47% 47% 48% 48%Remission Rate 10% 12% 12% 12%Wages and Benefits as % of Total: 78% 79% 80% 82%

13
OREGON INSTITUTE OF TECHNOLOGY
FINANCIAL RATIOS SUMMARY
Ratio FY20 FY19 FY18 FY17 Benchmark
Primary Reserve Ratio 0.32 0.30 0.39 0.41 >0.4
Viability Ratio 0.76 0.71 0.83 0.79 >1.0
Return on Net Assets 11.6% 10.6% 8.0% 8.2% >6%
Net Operating Revenues (2.2%) (6.1%) (8.6%) 2.1% >4%
Composite Financial Index 2.48 1.98 1.85 2.73 N/A
Adjusted CFI* 3.95 2.89 2.74 4.76 >3.0
*adjusted to remove pension and OPEB related liabilities
PRIMARY RESERVE RATIO
Are resources sufficient and flexible enough to support the mission?
Amounts in $ Thousands 2017 2018 2019 2020
Expendable Net Assets $32,300 $32,538 $29,832 $31,240
University/Foundation $16,678/$15,622 $13,098/$19,440 $10,313/$20,073 $10,870/$8,423
Expenses $78,147 $84,064 $98,770 $96,331
Calculated Ratio 0.41 0.39 0.30 0.32
OIT’s primary reserve ratio had been right at the benchmark in FY17 and FY18 but fell in FY19. In FY20, the ratio has improved but is still under the benchmark. OIT has continued to reduce expenses (tied to a reduction in FTE). With no other significant draws on reserves, OIT is maintaining reserves at a reasonable level by balancing expenses with revenues. Still, this could leave the institution without the means to invest in new programs or opportunities.

14
VIABILITY RATIO
Are debt resources managed strategically to advance the mission?
Amounts in $ Thousands 2017 2018 2019 2020
Expendable Net Assets $32,300 $32,538 $29,832 $31,420
Total Long-Term Debt $41,091 $39,343 $41,861 $41,443
Calculated Ratio 0.79 0.83 0.71 0.76
OIT’s expendable net assets grew by 3.4% from FY19 to FY20 after a drop between FY18 and FY19. By the same token, OIT’s viability ratio increased slightly between FY19 and FY20 after falling between FY18 and FY 19. As a result, and although their viability ratio is below the benchmark, it appears the institution is in a relatively stable position.
RETURN ON NET ASSETS RATIO
Does asset performance and management support the strategic direction?
Amounts in $ Thousands 2017 2018 2019 2020
Total Change in Net Position $7,754 $8,121 $11,618 $14,005
Total Beginning Net Position $94,403 $101,391 $109,512 $121,130
Calculated Ratio 8.2% 8.0% 10.6% 11.6%
The return on net assets ratio demonstrates whether an institution is financially better off than in previous years. It shows an institution’s total economic return. A positive return on net assets ratio means an institution is increasing its net assets and is likely to have increased financial flexibility and ability to invest in strategic priorities. A negative return on net assets ratio may indicate the opposite, unless the negative ratio is the result of strategic investment in strategies that will enhance net assets in the future. OIT’s performance on this ratio was both stable and above the established benchmark during the past four years.

15
NET OPERATING REVENUES RATIO
Do operating results indicate the institution is living within available resources?
Amounts in $ Thousands 2017 2018 2019 2020
Net Operating Income $1,612 ($6,787) ($5,796) ($2,053)
Total Operating Revenues $77,782 $78,980 $95,070 $94,278
Calculated Ratio 2.1% (8.6%) (6.1%) (2.2%)
The net operating revenues ratio indicates whether total operating activities for the fiscal year generated a surplus or created a deficit. It attempts to demonstrate whether an institution is living within its available resources. OIT’s net operating revenues ratio has been negative the past three years and has decreased slightly since FY 17. Although the losses are relatively small, continuing negative operating revenues ratios may indicate that an institution does not currently have capacity to develop a stronger fund balance or make strategic operating investments without the use of existing fund balance, expense reductions, or revenue enhancements.
COMPOSITE FINANCIAL INDEX
RATIO ANALYSIS SUMMARY
Overall, OIT remains financially stable with a relatively strong financial position. Short-term declines in their financial ratios in the past year, due in part to extraordinary OMIC expenses, are not likely indicative of any longer-term financial risk.
0.0
1.0
2.0
3.0
4.0
5.0
FY17 FY18 FY19 FY20
Benchmark Unadjusted Adjusted
16
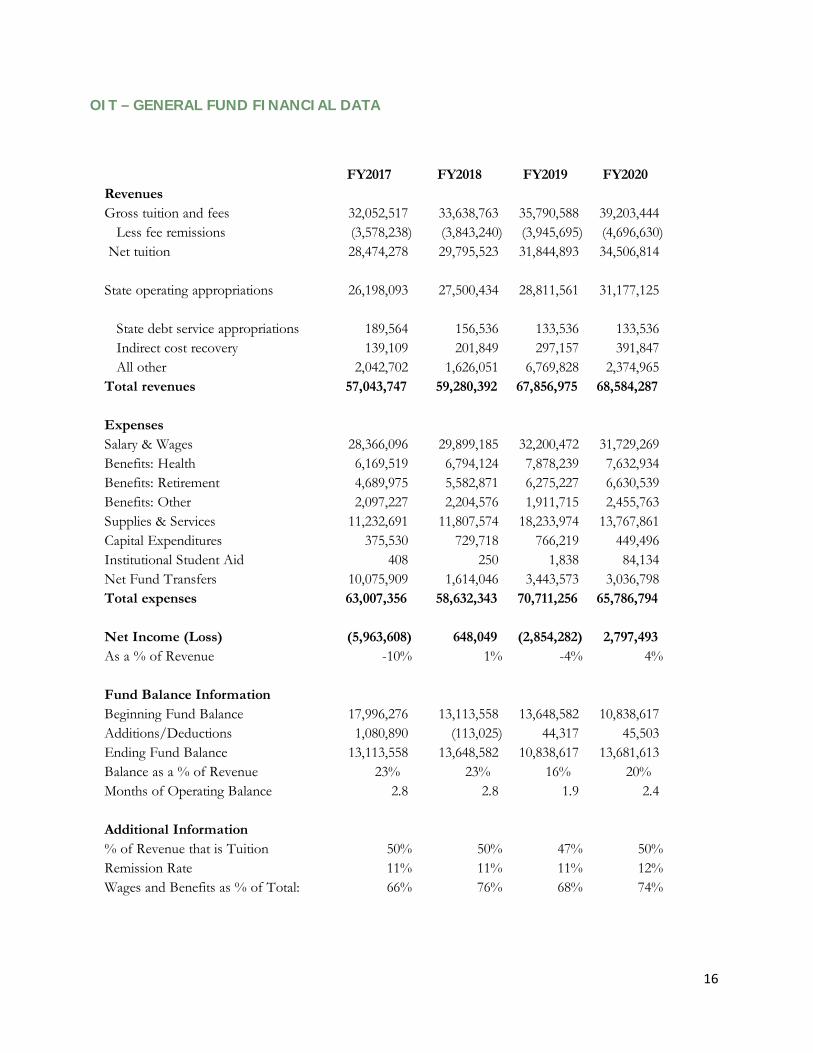
OIT – GENERAL FUND FINANCIAL DATA
FY2017 FY2018 FY2019 FY2020RevenuesGross tuition and fees 32,052,517 33,638,763 35,790,588 39,203,444 Less fee remissions (3,578,238) (3,843,240) (3,945,695) (4,696,630)
Net tuition 28,474,278 29,795,523 31,844,893 34,506,814
State operating appropriations 26,198,093 27,500,434 28,811,561 31,177,125
State debt service appropriations 189,564 156,536 133,536 133,536 Indirect cost recovery 139,109 201,849 297,157 391,847 All other 2,042,702 1,626,051 6,769,828 2,374,965
Total revenues 57,043,747 59,280,392 67,856,975 68,584,287
ExpensesSalary & Wages 28,366,096 29,899,185 32,200,472 31,729,269 Benefits: Health 6,169,519 6,794,124 7,878,239 7,632,934 Benefits: Retirement 4,689,975 5,582,871 6,275,227 6,630,539 Benefits: Other 2,097,227 2,204,576 1,911,715 2,455,763 Supplies & Services 11,232,691 11,807,574 18,233,974 13,767,861 Capital Expenditures 375,530 729,718 766,219 449,496 Institutional Student Aid 408 250 1,838 84,134 Net Fund Transfers 10,075,909 1,614,046 3,443,573 3,036,798 Total expenses 63,007,356 58,632,343 70,711,256 65,786,794
Net Income (Loss) (5,963,608) 648,049 (2,854,282) 2,797,493 As a % of Revenue -10% 1% -4% 4%
Fund Balance InformationBeginning Fund Balance 17,996,276 13,113,558 13,648,582 10,838,617 Additions/Deductions 1,080,890 (113,025) 44,317 45,503 Ending Fund Balance 13,113,558 13,648,582 10,838,617 13,681,613 Balance as a % of Revenue 23% 23% 16% 20%Months of Operating Balance 2.8 2.8 1.9 2.4
Additional Information% of Revenue that is Tuition 50% 50% 47% 50%Remission Rate 11% 11% 11% 12%Wages and Benefits as % of Total: 66% 76% 68% 74%

17
OREGON STATE UNIVERSITY
FINANCIAL RATIOS SUMMARY
Ratio FY20 FY19 FY18 FY17 Benchmark
Primary Reserve Ratio 0.09 0.15 0.25 0.27 >0.4
Viability Ratio 0.20 0.32 0.59 0.71 >1.0
Return on Net Assets 3.1% 4.0% 3.4% 4.2% >6%
Net Operating Revenues (3.4%) (2.6%) (4.6%) (1.8%) >4%
Composite Financial Index 0.46 0.86 1.13 1.58 N/A
Adjusted CFI* 2.02 2.08 2.35 4.53 >3.0
*adjusted to remove pension and OPEB related liabilities
PRIMARY RESERVE RATIO
Are resources sufficient and flexible enough to support the mission?
Amounts in $ Thousands 2017 2018 2019 2020
Expendable Net Assets $330,750 $322,690 $203,810 $132,561
University/Foundation $37,551/$293,199 $2,087/$327,310 ($37,515)/$241,325 ($108,275)/$240,836
Expenses $1,235,207 $1,306,489 $1,357,631 $1,420,271
Calculated Ratio 0.27 0.25 0.15 0.09
OSU’s primary reserve ratio was relatively steady before dropping significantly at a level well short of the established benchmark. Expendable net assets have dropped 35.4% the past two years largely due to an increase in Net Investment in Capital Assets and much smaller growth in Total Net Position.
The reasons for this drop are largely twofold. First, accounting rule changes on foundation assets, which principally impacted the much larger of OSU’s two foundations, OSU’s main foundation, saw a $70M drop in expendable assets even as foundation assets overall increased. It did not have as much of an impact on OSU’s second foundation, its agricultural research foundation, whose assets are much smaller. Second, OSU’s capital

18
assets increased $70M from FY 18 to FY 19 as projects were completed, an increase which is subtracted out of their expendable net assets. OSU’s Net Position has been growing at a steady rate, as has their net investment in Capital Assets. Both are these signs of financial stability.
Overall, OSU’s primary reserve ratio equates to two months’ worth of expenses, which puts them at some risk if revenues were to decline. However, OSU’s position may be somewhat stronger than this as their foundation assets actually increased, indicating they may have more flexibility than it might appear at first.
VIABILITY RATIO
Are debt resources managed strategically to advance the mission?
Amounts in $ Thousands 2017 2018 2019 2020
Expendable Net Assets $330,750 $305,452 $203,810 $132,562
Total Long-Term Debt $467,324 $521,425 $642,982 $651,332
Calculated Ratio 0.71 0.59 0.32 0.20
OSU’s viability ratio has declined since FY18 due to three factors. First, as with the primary reserve ratio there was a $70M increase in capital assets. Second, again as with the primary reserve ratio, there was a $70M drop in foundation expendable assets due to accounting rule changes even as foundation assets as a whole grew. Third, OSU increased its long-term debt by $60M from FY17 to FY18 and by $10.5M from FY19 to FY20. At this point, OSU could cover just twenty cents of every dollar owed with currently available assets. Consideration of new debt should include this analysis. However, as with the primary reserve ratio, the re-classification of OSU’s foundation assets may make their performance on this ratio appear worse than it actually is.
RETURN ON NET ASSETS RATIO
Does asset performance and management support the strategic direction?
Amounts in $ Thousands 2017 2018 2019 2020
Total Change in Net Position $58,610 $49,281 $59,743 $46,814
Total Beginning Net Position $1,389,112 $1,434,877 $1,485,196 $1,528,237
Calculated Ratio 4.2% 3.4% 4.0% 3.1%
The return on net assets ratio demonstrates whether an institution is financially better off than in previous years displaying an institution’s total economic return. A positive return on net assets ratio indicates an institution is

19
increasing its net assets and is likely to have increased financial flexibility and ability to invest in strategic priorities. A negative return on net assets ratio may indicate the opposite, unless the negative ratio is the result of strategic investment in strategies that will enhance net assets in the future. OSU’s performance on this ratio was stable at a level just below the benchmark the past four years, indicating financial stability.
NET OPERATING REVENUES RATIO
Do operating results indicate the institution is living within available resources?
Amounts in $ Thousands 2017 2018 2019 2020
Net Operating Income ($21,657) ($58,448) ($34,168) ($46,984)
Total Operating Revenues $1,213,550 $1,269,717 $1,323,463 $1,367,428
Calculated Ratio (1.8%) (4.6%) (2.6%) (3.4%)
The net operating revenues ratio indicates whether total operating activities for the fiscal year generated a surplus or created a deficit. OSU’s net operating revenues ratio has been negative the past four years and at relatively stable levels since FY17. Although the losses are relatively small, continuing negative operating revenues ratios may indicate that an institution does not currently have capacity to develop a stronger fund balance or make strategic operating investments without the use of existing fund balance, expense reductions, or revenue enhancements.
COMPOSITE FINANCIAL INDEX
0.0
1.0
2.0
3.0
4.0
5.0
FY17 FY18 FY19 FY20
Benchmark Unadjusted Adjusted
20
RATIO ANALYSIS SUMMARY
Overall, OSU’s finances are in a relatively stable position. Although there was a sharp drop between FY17 and FY18, it stabilized between FY18 and FY19. OSU remains well positioned financially to fulfill its mission and carry out its fiduciary responsibilities.

21
OSU – GENERAL FUND FINANCIAL DATA
FY2017 FY2018 FY2019 FY2020RevenuesGross tuition and fees 387,963,322 407,197,656 421,774,551 441,286,120 Less fee remissions (37,680,269) (39,918,755) (42,746,331) (46,160,336)
Net tuition 350,283,053 367,278,901 379,028,220 395,125,784
State operating appropriations 117,656,107 125,467,980 135,686,951 146,511,849
State debt service appropriations 1,084,152 1,072,584 1,072,584 1,072,584 Indirect cost recovery 38,942,493 42,057,377 41,471,387 42,502,851 All other 25,487,930 27,052,954 30,442,249 34,304,852
Total revenues 533,453,736 562,929,795 587,701,391 619,517,920
ExpensesSalary & Wages 267,341,287 279,480,083 295,551,671 304,993,459 Benefits: Health 51,420,069 54,819,115 58,363,725 61,240,623 Benefits: Retirement 43,942,573 53,680,508 55,501,500 63,165,647 Benefits: Other 37,356,848 37,931,930 40,769,100 42,415,275 Supplies & Services 98,560,991 104,839,742 114,123,087 116,646,816 Capital Expenditures 6,926,741 4,754,414 9,994,979 7,529,763 Institutional Student Aid 893,243 1,274,923 1,706,882 1,948,792 Net Fund Transfers 12,243,897 25,085,848 22,512,848 15,957,179 Total expenses 518,685,650 561,866,563 598,523,791 613,897,554
Net Income (Loss) 14,768,086 1,063,233 (10,822,401) 5,620,366 As a % of Revenue 3% 0% -2% 1%
Fund Balance InformationBeginning Fund Balance 68,563,430 83,331,516 84,394,749 73,572,348 Ending Fund Balance 83,331,516 84,394,749 73,572,348 79,192,714 Balance as a % of Revenue 16% 15% 13% 13%Months of Operating Balance 1.9 1.8 1.5 1.5
Additional Information% of Revenue that is Tuition 66% 65% 64% 64%Remission Rate 10% 10% 10% 10%Wages and Benefits as % of Total: 77% 76% 75% 77%
22
PORTLAND STATE UNIVERSITY
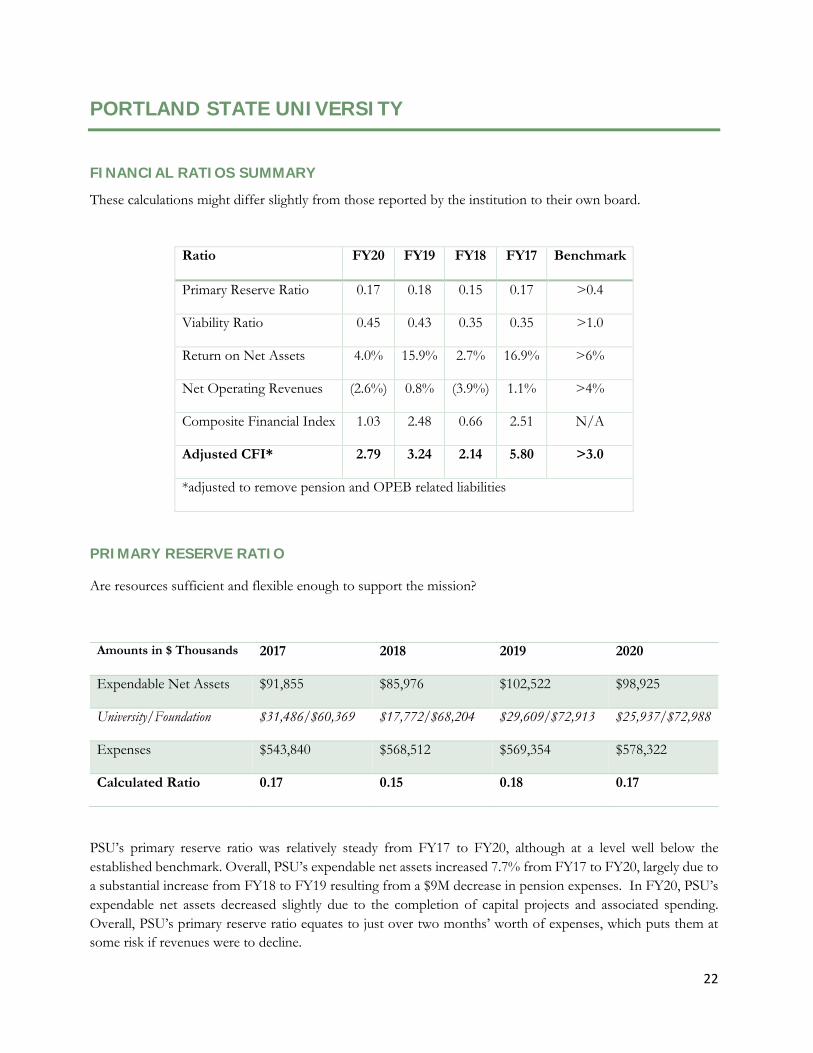
FINANCIAL RATIOS SUMMARY These calculations might differ slightly from those reported by the institution to their own board.
Ratio FY20 FY19 FY18 FY17 Benchmark
Primary Reserve Ratio 0.17 0.18 0.15 0.17 >0.4
Viability Ratio 0.45 0.43 0.35 0.35 >1.0
Return on Net Assets 4.0% 15.9% 2.7% 16.9% >6%
Net Operating Revenues (2.6%) 0.8% (3.9%) 1.1% >4%
Composite Financial Index 1.03 2.48 0.66 2.51 N/A
Adjusted CFI* 2.79 3.24 2.14 5.80 >3.0
*adjusted to remove pension and OPEB related liabilities
PRIMARY RESERVE RATIO
Are resources sufficient and flexible enough to support the mission?
Amounts in $ Thousands 2017 2018 2019 2020
Expendable Net Assets $91,855 $85,976 $102,522 $98,925
University/Foundation $31,486/$60,369 $17,772/$68,204 $29,609/$72,913 $25,937/$72,988
Expenses $543,840 $568,512 $569,354 $578,322
Calculated Ratio 0.17 0.15 0.18 0.17
PSU’s primary reserve ratio was relatively steady from FY17 to FY20, although at a level well below the established benchmark. Overall, PSU’s expendable net assets increased 7.7% from FY17 to FY20, largely due to a substantial increase from FY18 to FY19 resulting from a $9M decrease in pension expenses. In FY20, PSU’s expendable net assets decreased slightly due to the completion of capital projects and associated spending. Overall, PSU’s primary reserve ratio equates to just over two months’ worth of expenses, which puts them at some risk if revenues were to decline.

23
VIABILITY RATIO
Are debt resources managed strategically to advance the mission?
Amounts in $ Thousands 2017 2018 2019 2020
Expendable Net Assets $91,855 $85,976 $102,522 $98,925
Total Long-Term Debt $265,020 $247,472 $239,001 $221,572
Calculated Ratio 0.35 0.35 0.43 0.45
PSU’s viability ratio has increased substantially over the past three years, from 0.35 in FY18 to 0.45 in FY20. This increase was due largely both to the $9M decrease in pension expense in FY19 as well as an $18M drop in long-term debt in FY20 due to the retirement of some long-term bonds. Despite this improvement, at this point, PSU could cover just forty-five cents of every dollar owed with currently available assets. As a result, PSU should strongly consider limiting new debt until this picture improves.
RETURN ON NET ASSETS RATIO
Does asset performance and management support the strategic direction?
Amounts in $ Thousands 2017 2018 2019 2020
Total Change in Net Position $67,987 $12,419 $75,704 $22,315
Total Beginning Net Position $401,586 $465,136 $477,555 $553,259
Calculated Ratio 16.9% 2.7% 15.9% 4.0%
The return on net assets ratio demonstrates whether an institution is financially better off than in previous years. It shows an institution’s total economic return. PSU’s performance on this ratio was well above the benchmark in FY17 and FY19 and dropped to about half the benchmark for FY18 and was just below the benchmark in FY20. These swings were due primarily to the completion of large capital projects in fiscal years 17 and 19, which increased PSU’s net position. In FY20, PSU saw an increase due to completion in capital projects that was offset by depreciation and increased capital spending. The volatility in this ratio, albeit at a relatively strong level, indicates that PSU may have some additional resources to invest should this trend continue.

24
NET OPERATING REVENUES RATIO
Do operating results indicate the institution is living within available resources?
Amounts in $ Thousands 2017 2018 2019 2020
Net Operating Income $5,859 ($21,345) $4,867 (14,459)
Total Operating Revenues $554,980 $554,132 $578,400 $563,962
Calculated Ratio 1.1% (3.9%) 0.8% (2.6%)
The net operating revenues ratio indicates whether total operating activities for the fiscal year generated a surplus or created a deficit. It attempts to demonstrate whether an institution is living within its available resources. PSU’s net operating revenues ratio was just above zero in fiscal years 17 and 19 and slightly negative in FY18 and FY20. The negative ratio in FY20 was largely due to a combination of decreased enrollment (which has been a trend for the past several years) combined with a substantial loss in auxiliary revenues due to the pandemic, which is likely to be larger in the current fiscal year due to the continuing inability to operate auxiliary services at anywhere close to normal levels. This negative ratio indicates PSU does not currently have capacity to develop a stronger fund balance or make strategic operating investments without the use of existing fund balance, expense reductions, or revenue enhancements.
COMPOSITE FINANCIAL INDEX
0.0
1.0
2.0
3.0
4.0
5.0
FY17 FY18 FY19 FY 20
Benchmark Unadjusted Adjusted

25
RATIO ANALYSIS SUMMARY
Overall, PSU’s finances have been largely stable despite some drops in FY18 and FY20. PSU had an unadjusted CFI of near 3.0 in two of the four years examined in this report, indicating that its finances are in a relatively strong position and that it is not likely to be unable to meet is fiduciary responsibilities in the near term. However, should enrollment continue to decline, or auxiliary services continue to be impacted to the same extent in future years as they are currently due to pandemic related restrictions, PSU may face potential longer-term financial issues but is relatively well positioned in the short to mid-term to weather financial stresses.

26
PSU – GENERAL FUND FINANCIAL DATA
FY2017 FY2018 FY2019 FY2020RevenuesGross tuition and fees 234,982,158 240,681,375 240,674,823 233,173,571 Less fee remissions (20,530,674) (22,737,697) (21,100,540) (20,535,846)
Net tuition 214,451,484 217,943,679 219,574,284 212,637,725
State operating appropriations 86,595,683 93,205,018 96,604,069 104,835,509
State debt service appropriations 2,240,976 2,182,248 2,182,248 2,182,248 Indirect cost recovery 10,584,033 10,925,243 11,621,777 11,086,809 All other 12,383,047 10,815,053 19,411,451 15,613,029
Total revenues 326,255,223 335,071,241 349,393,829 346,355,320
ExpensesSalary & Wages 169,430,156 174,978,679 179,464,327 179,116,546 Benefits: Health 28,185,526 28,758,037 28,919,047 29,227,897 Benefits: Retirement 29,523,363 34,430,801 35,538,750 39,892,115 Benefits: Other 20,348,376 21,044,659 20,693,209 22,572,384 Supplies & Services 60,062,149 62,441,001 62,942,625 59,977,155 Capital Expenditures 1,783,871 1,481,927 1,973,124 1,476,974 Institutional Student Aid 263,973 317,413 710,650 945,554 Net Fund Transfers 4,291,693 2,790,392 1,391,201 2,188,249 Total expenses 313,889,106 326,242,909 331,632,933 335,396,874
Net Income (Loss) 12,366,117 8,828,332 17,760,896 10,958,446 As a % of Revenue 4% 3% 5% 3%
Fund Balance InformationBeginning Fund Balance 55,096,681 67,462,798 76,291,130 94,052,026 Ending Fund Balance 67,462,798 76,291,130 94,052,026 105,010,472 Balance as a % of Revenue 21% 23% 27% 30%Months of Operating Balance 2.5 2.7 3.2 3.6
Additional Information% of Revenue that is Tuition 66% 65% 63% 61%Remission Rate 9% 9% 9% 9%Wages and Benefits as % of Total: 79% 79% 80% 81%

27
SOUTHERN OREGON UNIVERSITY
FINANCIAL RATIOS SUMMARY
Ratio FY20 FY19 FY18 FY17 Benchmark
Primary Reserve Ratio (0.04) 0.03 0.08 0.10 >0.4
Viability Ratio (0.10) 0.07 0.16 0.21 >1.0
Return on Net Assets (5.0%) (2.9%) 15.3% 11.2% >6%
Net Operating Revenues (10.5%) (9.3%) (3.7%) (4.1%) >4%
Composite Financial Index (1.50) (0.85) 1.59 1.25 N/A
Adjusted CFI* 0.78 1.15 3.53 4.24 >3.0
*adjusted to remove pension and OPEB related liabilities
PRIMARY RESERVE RATIO
Are resources sufficient and flexible enough to support the mission?
Amounts in $ Thousands 2017 2018 2019 2020
Expendable Net Assets $10,275 $7,553 $3,418 ($4,269)
University/Foundation $1,861/$8,414 ($3,480)/$11,033 ($8,560)/$11,697 ($14,560)/$10,291
Expenses $98,187 $95,756 $101,930 $106,526
Calculated Ratio 0.10 0.08 0.03 (0.04)
SOU’s primary reserve has fallen substantially over the past four years and in FY20 fell below zero. A low primary reserve ratio indicates that available resources may not be sufficient or flexible enough to support the institution’s mission. The decline from FY19 to FY20 was primarily due to net pension expenses, and increased university operating expenses.

28
VIABILITY RATIO
Are debt resources managed strategically to advance the mission?
Amounts in $ Thousands 2017 2018 2019 2020
Expendable Net Assets $10,275 $7,553 $3,137 ($4,269)
Total Long-Term Debt $48,679 $45,935 $44,743 $42,463
Calculated Ratio 0.21 0.16 0.07 (0.10)
The value of total expendable net assets has been declining since FY17. As a result, in FY20 SOU’s viability ratio dropped below zero, meaning they do not currently have the expendable resources to cover existing long-term debt. While long-term debt continues to decline, available expendable net assets have also declined.
RETURN ON NET ASSETS RATIO
Does asset performance and management support the strategic direction?
Amounts in $ Thousands 2017 2018 2019 2020
Total Change in Net Position $11,419 $17,415 ($3,728) ($6,367)
Total Beginning Net Position $102,229 $113,648 $130,289 $126,561
Calculated Ratio 11.2% 15.3% (2.9%) (5.0%)
The return on net assets ratio demonstrates whether an institution is financially better off than in previous years. It shows an institution’s total economic return. A positive return on net assets ratio means an institution is increasing its net assets and is likely to have increased financial flexibility and ability to invest in strategic priorities. A negative return on net assets ratio may indicate the opposite, unless the negative ratio is the result of strategic investment in activities that will enhance net assets in the future.
SOU’s performance on this ratio is continuing to decline due to increasing expenses and revenue declines. This negative ratio limits SOU’s financial flexibility going forward.

29
NET OPERATING REVENUES RATIO
Do operating results indicate the institution is living within available resources?
Amounts in $ Thousands 2017 2018 2019 2020
Net Operating Income ($3,851) ($3,454) ($8,655) ($10,139)
Total Operating Revenues $93,151 $92,302 $93,275 96,388
Calculated Ratio (4.1%) (3.7%) (9.3%) (10.5%)
The net operating revenues ratio indicates whether total operating activities for the fiscal year generated a surplus or created a deficit. It attempts to demonstrate whether an institution is living within its available resources. SOU’s net operating revenues ratio has been increasingly negative the past four years, although the decrease from FY19 to FY20 was less drastic than the prior year. Continued negative operating revenues may indicate an institution does not have the capacity to develop a stronger fund balance or make strategic operating investments without the use of existing fund balance, expense reductions, or revenue enhancements.
COMPOSITE FINANCIAL INDEX
RATIO ANALYSIS SUMMARY
Overall, SOU faces a challenging financial future. Given declining enrollment and increasing expenses, the need remains clear to further reengineer the institution to identify opportunities while preserving academic quality. SOU has made strides in the past couple years demonstrating they understand the financial position they are in, and are working to turn it around.
-2.0
-1.0
0.0
1.0
2.0
3.0
4.0
5.0
FY17 FY18 FY19 FY20
Benchmark Unadjusted Adjusted

30
SOU – GENERAL FUND FINANCIAL DATA
FY2017 FY2018 FY2019 FY2020RevenuesGross tuition and fees 37,698,244 41,003,792 41,003,163 42,531,939 Less fee remissions (3,586,840) (4,243,385) (3,637,765) (3,964,601)
Net tuition 34,111,404 36,760,407 37,365,398 38,567,338
State operating appropriations 21,360,666 21,093,467 21,471,767 22,894,661
State debt service appropriations 179,160 179,160 179,160 179,160 Indirect cost recovery 200,424 206,958 150,967 162,151 All other 3,113,341 2,597,260 2,862,313 2,291,262
Total revenues 58,964,995 60,837,252 62,029,605 64,094,572
ExpensesSalary & Wages 31,008,806 31,763,153 33,013,914 33,507,243 Benefits: Health 6,878,403 7,331,563 7,305,707 7,312,370 Benefits: Retirement 5,703,198 6,841,000 7,007,008 7,881,244 Benefits: Other 2,674,014 2,838,967 3,018,151 3,275,289 Supplies & Services 8,907,896 9,093,321 11,555,647 10,377,891 Capital Expenditures 193,507 193,744 176,436 99,152 Institutional Student Aid - - - Net Fund Transfers 2,266,381 2,481,400 1,738,814 1,913,438 Total expenses 57,632,205 60,543,147 63,815,677 64,366,627
Net Income (Loss) 1,332,790 294,105 (1,786,072) (272,055) As a % of Revenue 2.3% 0.5% -2.9% -0.4%
Fund Balance InformationBeginning Fund Balance 6,876,514 6,845,089 7,139,194 5,353,122 Ending Fund Balance 6,845,089 7,139,194 5,353,122 5,081,067 Balance as a % of Revenue 11.6% 11.7% 8.6% 7.9%Months of Operating Balance 1.4 1.4 1.0 1.0
Additional Information% of Revenue that is Tuition 58% 60% 60% 60%Remission Rate 10% 10% 9% 9%Wages and Benefits as % of Total: 80% 81% 79% 81%

31
UNIVERSITY OF OREGON
FINANCIAL RATIOS SUMMARY
Ratio FY20 FY19 FY18 FY17 Benchmark
Primary Reserve Ratio 0.33 0.72 0.69 0.70 >0.4
Viability Ratio 0.55 1.12 0.96 1.01 >1.0
Return on Net Assets 2.8% 9.1% 3.0% 29.2% >6%
Net Operating Revenues (4.4%) (2.0%) (4.7%) (4.0%) >4%
Composite Financial Index 1.26 3.58 2.58 5.31 N/A
Adjusted CFI* 3.20 4.63 3.74 7.25 >3.0
*adjusted to remove pension and OPEB related liabilities
PRIMARY RESERVE RATIO
Are resources sufficient and flexible enough to support the mission?
Amounts in $ Thousands 2017 2018 2019 2020
Expendable Net Assets $757,194 $764,401 $831,506 $518,515
University/Foundation $41,151/$716,043 $2,593/$761,808 ($36,425)/$867,931 ($68,995)/$587,510
Expenses $1,080,401 $1,103,329 $1,160,391 $1,593,043
Calculated Ratio 0.70 0.69 0.72 0.33
UO’s primary reserve ratio was relatively steady from FY17 to FY19, at a level well above the established benchmark. In FY20 the primary reserve ratio dropped below the benchmark, primarily due to increased investment in capital assets, primarily a one-time capital project, Hayward Field. A significant portion of the expendable net assets were restricted foundation gifts, that were then transferred to the university in order to complete the project. .

32
Overall, UO’s primary reserve ratio equates to three months’ worth of expenses. However, this is due to almost entirely to foundation assets which are restricted but expendable. Indeed, without foundation assets, UO’s expendable net position in FY20 would have been negative, indicating that they likely do not have the level of flexibility it may first appear.
VIABILITY RATIO
Are debt resources managed strategically to advance the mission?
Amounts in $ Thousands 2017 2018 2019 2020
Expendable Net Assets $757,194 $764,401 $831,506 $518,515
Total Long-Term Debt $751,454 $793,529 $744,041 $944,297
Calculated Ratio 1.01 0.96 1.12 0.55
UO’s viability ratio was stable from FY17 to FY19 at a level just below the benchmark due to strong overall expendable net assets. In FY20 the ratio dropped below the benchmark. As with the primary reserve ratio, this is primarily due to an increase in capital investments, due to the transfer of foundation funds for the Hayward Field project. At this point, UO could cover just over half of every dollar in debt owed with currently available assets. Again, this is due to the UO’s foundation assets.
RETURN ON NET ASSETS RATIO
Does asset performance and management support the strategic direction?
Amounts in $ Thousands 2017 2018 2019 2020
Total Change in Net Position $543,785 $72,183 $224,878 $75,840
Total Beginning Net Position $1,860,764 $2,390,144 $2,462,327 $2,687,205
Calculated Ratio 29.2% 3.0% 9.1% 2.8%
The return on net assets ratio demonstrates whether an institution is financially better off than in previous years. It shows an institution’s total economic return. UO’s performance on this ratio was well above the benchmark in FY19 and dropped to just under half the benchmark for FY20. These swings were due primarily to increases in foundation assets during FY19. A return on net assets ratio at this level indicates that UO has less financial flexibility going forward.

33
NET OPERATING REVENUES RATIO
Do operating results indicate the institution is living within available resources?
Amounts in $ Thousands 2017 2018 2019 2020
Net Operating Income ($42,114) ($49,050) ($23,296) ($67,796)
Total Operating Revenues $1,060,861 $1,053,085 $1,137,095 $1,525,247
Calculated Ratio (4.0%) (4.7%) (2.0%) (4.4%)
The net operating revenues ratio indicates whether total operating activities for the fiscal year generated a surplus or created a deficit. It attempts to demonstrate whether an institution is living within its available resources. UO’s net operating revenues ratio has been slightly negative during the past four years. Although these losses were small, continuing negative operating revenues ratios may indicate that an institution does not currently have capacity to develop a stronger fund balance or make strategic operating investments without the use of existing fund balance, expense reductions, or revenue enhancements.
COMPOSITE FINANCIAL INDEX
RATIO ANALYSIS SUMMARY
Overall, UO’s financial position is diminished compared to the previous year. The CFI dropped below the benchmark in FY20, and it is generally trending down. While the UO has faced considerable financial pressures the last few years, the negative CFI trends are magnified due to the flow of restricted capital gifts into and out of the Foundation during the last few years.
0.01.02.03.04.05.06.07.08.0
FY17 FY18 FY19 FY20
Benchmark Unadjusted Adjusted

34
UO – GENERAL FUND FINANCIAL DATA
FY2017 FY2018 FY2019 FY2020RevenuesGross tuition and fees 444,251,249 460,850,634 462,631,526 478,616,619 Less fee remissions (42,666,154) (45,617,725) (44,177,455) (53,611,282)
Net tuition 401,585,095 415,232,909 418,454,072 425,005,337
State operating appropriations 65,999,988 70,210,908 71,910,651 78,719,195
State debt service appropriations 801,356 801,356 801,359 801,356 Indirect cost recovery 21,895,847 22,610,802 24,619,477 25,087,226 All other 21,757,674 17,503,613 16,763,428 15,857,545
Total revenues 512,039,960 526,359,588 532,548,986 545,470,659
ExpensesSalary & Wages 256,363,605 250,646,818 257,825,362 264,475,179 Benefits: Health 53,067,352 - - - Benefits: Retirement 43,685,075 - - - Benefits: Other 42,836,196 162,360,252 167,111,389 182,613,758 Supplies & Services 79,327,868 83,444,653 96,141,367 89,236,178 Capital Expenditures 7,437,754 5,011,157 5,215,820 3,721,532 Institutional Student Aid 4,444,108 5,430,091 5,882,527 5,515,265 Net Fund Transfers 20,542,861 13,045,334 11,829,666 7,007,520 Total expenses 507,704,819 519,938,305 544,006,131 552,569,432
Net Income (Loss) 4,335,142 6,421,283 (11,457,144) (7,098,773) As a % of Revenue 1% 1% -2% -1%
Fund Balance InformationBeginning Fund Balance 67,430,541 73,534,267 77,206,732 63,821,675 Net Operating 4,335,142 6,421,283 (11,457,144) (7,098,773) Accounting Adjustments 1,818,584 (1,879,287) (1,927,913) (2,250,903) Ending Fund Balance 73,584,267 78,076,263 63,821,675 54,471,999 Balance as a % of Revenue 14% 15% 12% 10%Months of Operating Balance 1.7 1.8 1.4 1.2
Additional Information% of Revenue that is Tuition 78% 79% 79% 78%Remission Rate 10% 10% 10% 11%Wages and Benefits as % of Total: 78% 79% 78% 81%

35
WESTERN OREGON UNIVERSITY
FINANCIAL RATIOS SUMMARY
Ratio FY20 FY19 FY18 FY17 Benchmark
Primary Reserve Ratio 0.09 0.24 0.23 0.21 >0.4
Viability Ratio 0.21 0.48 0.47 0.42 >1.0
Return on Net Assets (1.0%) 7.2% 7.3% (2.5%) >6%
Net Operating Revenues (16.1%) (1.3%) (1.8%) (5.6%) >4%
Composite Financial Index (0.91) 1.65 1.58 0.22 N/A
Adjusted CFI* 1.12 2.67 2.94 4.64 >3.0
*adjusted to remove pension and OPEB related liabilities
PRIMARY RESERVE RATIO
Are resources sufficient and flexible enough to support the mission?
Amounts in $ Thousands 2017 2018 2019 2020
Expendable Net Assets $24,267 $25,716 $26,676 $11,222
University/Foundation $18,487/$5,780 $19,692/$6,024 $19,949/$6,727 $4,154/$7,068
Expenses $115,215 $112,452 $112,157 $118,920
Calculated Ratio 0.21 0.23 0.24 0.09
WOU’s primary reserve ratio had been largely stable from FY 17-19 but fell in FY20, and remained short of the benchmark. Overall, WOU’s expendable net assets fell 53.8%, with the entire decrease occurring between FY19 and FY20. The sharp decline was due to a number of factors including the cash purchase of a building for WOU Salem operations, reduced student enrollment, and increased operating expenses. PERS costs alone increased $3.1M from FY19 to FY20. With a low level of reserves (just over a month), WOU is at potential risk should institutional finances worsen.

36
VIABILITY RATIO
Are debt resources managed strategically to advance the mission?
Amounts in $ Thousands 2017 2018 2019 2020
Expendable Net Assets $24,267 $25,716 $26,676 $11,222
Total Long-Term Debt $58,040 $55,184 $55,205 $52,370
Calculated Ratio 0.42 0.47 0.48 0.21
As with its primary reserve ratio, WOU’s viability ratio fell substantially from FY19 to FY20 due to the reasons described above, declines in enrollment and operating revenues along with PERS increases. At the present time, WOU can cover just 21 cents of every dollar currently owed, indicating it should not increase current levels of debt as doing so might further imperil its financial position.
RETURN ON NET ASSETS RATIO
Does asset performance and management support the strategic direction?
Amounts in $ Thousands 2017 2018 2019 2020
Total Change in Net Position ($2,367) $6,670 $7,044 ($1,031)
Total Beginning Net Position $95,277 $91,651 $98,321 $105,364
Calculated Ratio (2.5%) 7.3% 7.2% (1.0%)
The return on net assets ratio demonstrates whether an institution is financially better off than in previous years. It shows an institution’s total economic return. WOU showed substantial improvement in this ratio from FY17 to FY18, which was sustained in FY19, both of which were just above the established benchmark. As with its other ratios, WOU saw a sharp decline in FY20 to a slightly negative level, although not a level that, on its own, would cause much concern. It is worth monitoring WOU’s performance to see if this trend continues to determine if WOU will have additional assets to invest in the short to mid-term.

37
NET OPERATING REVENUES RATIO
Do operating results indicate the institution is living within available resources?
Amounts in $ Thousands 2017 2018 2019 2020
Net Operating Income ($6,102) ($1,973) ($1,419) ($16,470)
Total Operating Revenues $108,287 $110,479 $110,738 $102,451
Calculated Ratio (5.6%) (1.8%) (1.3%) (16.1%)
As with their other ratios, WOU’s net operating revenues ratio decreased sharply in FY20 after remaining relatively stable over the prior two years. However, WOU has seen negative net operating revenues ratios the past four years. This sharp decline was due principally to declines of over 20% in both student tuition and fees (enrollment) and auxiliary revenues. The enrollment decline continued a trend WOU had experienced for the past several years while the auxiliary revenue drop was due principally to operational changes related to the pandemic.
These are among the reasons WOU is engaged in a holistic process to “right size” its institution and stabilize its financial position. These efforts are necessary because continuing to generate negative net operating revenues may indicate an institution does not currently have the capacity to develop a stronger fund balance or make strategic operating investments without the use of existing fund balance, expense reductions, or revenue enhancements.
COMPOSITE FINANCIAL INDEX
-2.0
-1.0
0.0
1.0
2.0
3.0
4.0
5.0
FY17 FY18 FY19 FY20
Benchmark Unadjusted Adjusted

38
RATIO ANALYSIS SUMMARY
As noted by WOU itself and in the press, WOU’s finances, and their institution as a whole, are undergoing challenging times. WOU’s current efforts to “right size” their institution is necessary and will hopefully produce positive benefits for the institution. This is particularly important in a challenging fiscal environment and one where enrollment is expected to continue to decline. These efforts should be closely monitored and evaluated for their impact on the institution and its finances.
39
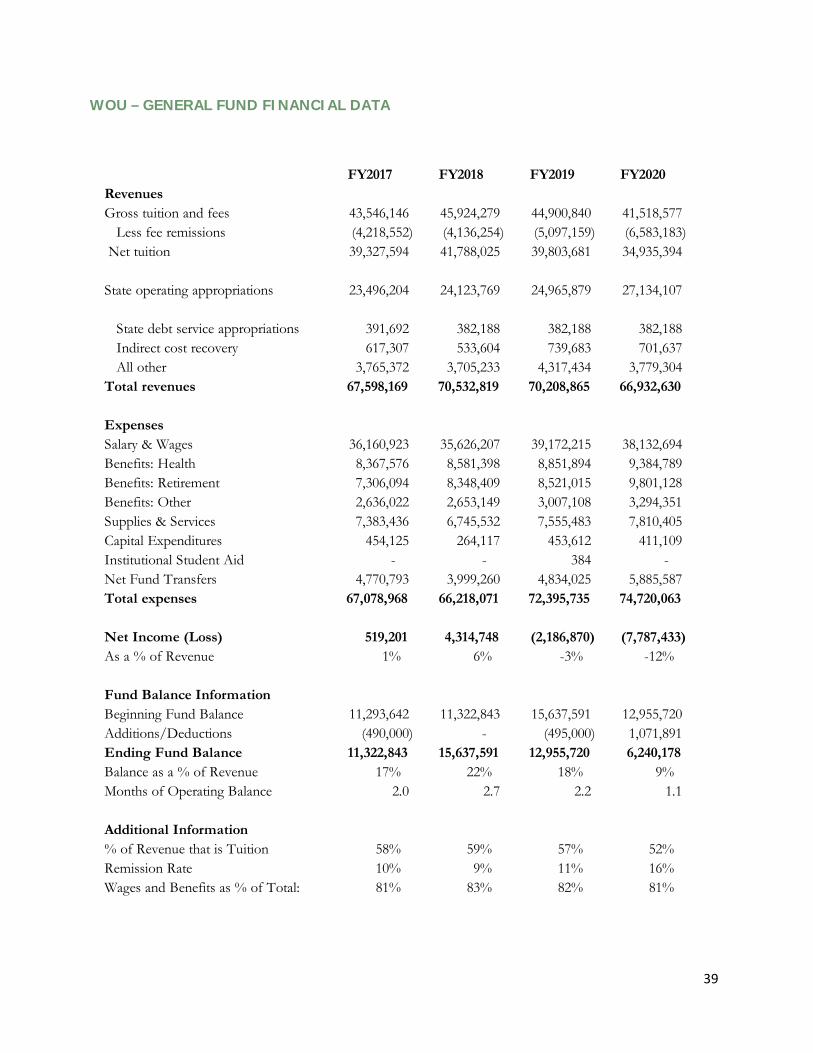
WOU – GENERAL FUND FINANCIAL DATA
FY2017 FY2018 FY2019 FY2020RevenuesGross tuition and fees 43,546,146 45,924,279 44,900,840 41,518,577 Less fee remissions (4,218,552) (4,136,254) (5,097,159) (6,583,183)
Net tuition 39,327,594 41,788,025 39,803,681 34,935,394
State operating appropriations 23,496,204 24,123,769 24,965,879 27,134,107
State debt service appropriations 391,692 382,188 382,188 382,188 Indirect cost recovery 617,307 533,604 739,683 701,637 All other 3,765,372 3,705,233 4,317,434 3,779,304
Total revenues 67,598,169 70,532,819 70,208,865 66,932,630
ExpensesSalary & Wages 36,160,923 35,626,207 39,172,215 38,132,694 Benefits: Health 8,367,576 8,581,398 8,851,894 9,384,789 Benefits: Retirement 7,306,094 8,348,409 8,521,015 9,801,128 Benefits: Other 2,636,022 2,653,149 3,007,108 3,294,351 Supplies & Services 7,383,436 6,745,532 7,555,483 7,810,405 Capital Expenditures 454,125 264,117 453,612 411,109 Institutional Student Aid - - 384 - Net Fund Transfers 4,770,793 3,999,260 4,834,025 5,885,587 Total expenses 67,078,968 66,218,071 72,395,735 74,720,063
Net Income (Loss) 519,201 4,314,748 (2,186,870) (7,787,433) As a % of Revenue 1% 6% -3% -12%
Fund Balance InformationBeginning Fund Balance 11,293,642 11,322,843 15,637,591 12,955,720 Additions/Deductions (490,000) - (495,000) 1,071,891 Ending Fund Balance 11,322,843 15,637,591 12,955,720 6,240,178 Balance as a % of Revenue 17% 22% 18% 9%Months of Operating Balance 2.0 2.7 2.2 1.1
Additional Information% of Revenue that is Tuition 58% 59% 57% 52%Remission Rate 10% 9% 11% 16%Wages and Benefits as % of Total: 81% 83% 82% 81%

40
APPENDIX
Publ
ic U
nive
rsiti
es E
nrol
lmen
tFT
E Co
unt,
All S
tude
nts,
Fal
l Fou
rth
Wee
k
EOU
OIT
OSU
PSU
SOU
UO
WO
UTO
TAL
2002
-03
2,55
1
2,38
0
18,1
24
15
,564
4,24
3
19,1
28
4,
380
66
,369
2003
-04
2,41
2
2,41
3
18,3
10
16
,362
4,31
2
19,3
01
4,
324
67
,433
2004
-05
2,34
2
2,41
0
18,1
41
16
,348
4,02
1
19,7
50
4,
140
67
,151
2005
-06
2,42
4
2,31
6
18,1
72
16
,812
3,85
3
19,6
97
4,
106
67
,378
2006
-07
2,33
2
2,21
2
18,2
05
16
,981
3,76
2
19,6
09
4,
011
67
,111
2007
-08
2,29
4
2,26
7
18,3
81
17
,299
3,76
5
19,4
96
4,
201
67
,703
2008
-09
2,38
9
2,38
1
18,7
67
18
,753
3,85
0
20,7
62
4,
412
71
,315
2009
-10
2,64
7
2,58
8
20,3
04
19
,996
3,93
0
21,6
89
4,
697
75
,851
2010
-11
2,83
8
2,57
6
21,9
94
20
,476
4,52
4
22,6
31
5,
049
80
,090
2011
-12
2,90
6
2,62
4
23,0
66
20
,459
4,67
8
23,4
50
5,
127
82
,309
2012
-13
2,90
3
2,80
9
23,9
57
20
,226
4,57
3
23,3
78
5,
106
82
,953
2013
-14
2,69
4
2,94
1
25,0
23
20
,270
4,35
1
23,2
30
4,
974
83
,483
2014
-15
2,39
2
2,90
5
25,4
31
20
,214
4,34
7
22,8
32
4,
761
82
,883
2015
-16
2,27
4
3,10
8
25,8
78
20
,162
4,40
8
22,5
98
4,
513
82
,941
2016
-17
2,22
1
3,23
9
26,5
27
19
,721
4,29
3
22,6
29
4,
529
83
,159
2017
-18
2,15
2
3,23
6
26,8
65
19
,563
4,38
3
22,2
07
4,
452
82
,857
2018
-19
2,17
1
3,21
8
26,7
79
19
,252
4,20
4
22,0
81
4,
310
82
,015
2019
-20
2,13
3
3,24
7
27,1
20
18
,816
4,02
9
22,1
05
4,
068
81
,520
2020
-21
2,12
4
3,21
4
27,0
13
17
,428
3,51
2
21,2
63
3,
769
78
,323
10 Y
ear C
hang
e (1
1-12
to 2
0-21
)-2
6.9%
22.5
%17
.1%
-14.
8%-2
4.9%
-9.3
%-2
6.5%
-4.8
%
1 Ye
ar C
hang
e (1
9-20
to 2
0-21
)-0
.4%
-1.0
%-0
.4%
-7.4
%-1
2.8%
-3.8
%-7
.4%
-3.9
%
+20.
7%
-4.8
%

41
FY20
20 G
ener
al F
und
Fina
ncia
l Dat
a(a
mou
nts i
n $
thou
sand
s)
EOU
OIT
OSU
PSU
SOU
UO
WO
UTO
TAL
Gros
s tui
tion
and
fees
24,0
13
39
,203
441,
286
233,
174
42,5
32
47
8,61
7
41
,519
1,30
0,34
3
Les
s fee
rem
issio
ns(2
,897
)
(4
,697
)
(4
6,16
0)
(2
0,53
6)
(3
,965
)
(5
3,61
1)
(6
,583
)
(1
38,4
49)
Net
tuiti
on21
,116
34,5
07
39
5,12
6
21
2,63
8
38
,567
425,
005
34,9
35
1,
161,
894
Stat
e ap
prop
riatio
ns21
,159
31,1
77
14
6,51
2
10
4,83
6
22
,895
78,4
48
27
,134
432,
160
Stat
e de
bt se
rvic
e63
8
13
4
1,
073
2,
182
17
9
1,
073
38
2
5,
660
In
dire
ct co
st re
cove
ry28
1
39
2
42
,503
11,0
87
16
2
25
,087
702
80,2
14
Al
l oth
er1,
240
2,
375
34
,305
15,6
13
2,
291
15
,858
3,77
9
75,4
61
To
tal r
even
ues
44,4
34
68
,584
619,
518
346,
355
64,0
95
54
5,47
1
66
,933
1,75
5,38
9
Sala
ry &
Wag
es21
,758
31,7
29
30
4,99
3
17
9,11
7
33
,507
264,
475
38,1
33
87
3,71
2
Be
nefit
s: He
alth
5,59
4
7,63
3
61,2
41
29
,228
7,31
2
-
9,
385
12
0,39
2
Be
nefit
s: Re
tirem
ent
5,34
8
6,63
1
63,1
66
39
,892
7,88
1
-
9,
801
13
2,71
8
Be
nefit
s: O
ther
1,77
0
2,45
6
42,4
15
22
,572
3,27
5
182,
614
3,29
4
258,
397
Supp
lies &
Ser
vice
s7,
277
13
,768
116,
647
59,9
77
10
,378
89,2
36
7,
810
30
5,09
4
Ca
pita
l Exp
endi
ture
s42
2
44
9
7,
530
1,
477
99
3,72
2
411
14,1
10
In
stitu
tiona
l Stu
dent
Aid
-
84
1,94
9
946
-
5,
515
-
8,49
4
Net
Fun
d Tr
ansf
ers
(76)
3,03
7
15,9
57
2,
188
1,
913
7,
008
5,
886
35
,913
Tota
l exp
ense
s42
,093
65,7
87
61
3,89
8
33
5,39
7
64
,367
552,
569
74,7
20
1,
748,
830
Net
Inco
me
(Los
s)2,
341
2,
797
5,
620
10
,958
(272
)
(7,0
99)
(7,7
87)
6,55
9
As a
% o
f Rev
enue
5%4%
1%3%
-0.4
%-1
%-1
2%0.
4%
Addi
tiona
l Dat
a:%
of R
even
ue th
at is
Tui
tion
48%
50%
64%
61%
60%
78%
52%
66%
Rem
issio
n Ra
te12
%12
%10
%9%
9%11
%16
%11
%Pe
rson
nel a
s % o
f Tot
al82
%74
%77
%81
%81
%81
%81
%79
%

42
FY20
20 T
uitio
n Co
llect
ions
and
Rem
issio
n In
form
atio
n
Inst
itutio
n R
esid
ent T
uitio
n N
onre
side
nt
Tuiti
on
Oth
er T
uitio
n*
Tot
al T
uitio
n Co
llect
ed
Res
iden
t Re
mis
sion
s N
on-R
esid
ent
Rem
issi
ons
Net
Tui
tion
Colle
cted
Ea
ster
n O
rego
n Un
iver
sity
19,2
60,3
53
3,18
4,45
2
1,
567,
764
24
,012
,569
1,
819,
631
1,07
7,05
1
21
,115
,887
O
rego
n In
stitu
te o
f Tec
hnol
ogy
18,2
56,5
22
9,70
7,02
1
11
,239
,901
39,2
03,4
44
4,69
6,63
0
-
34
,506
,814
O
rego
n St
ate
Univ
ersit
y15
1,69
2,86
7
13
9,03
8,41
0
139,
423,
344
430,
154,
621
19,8
66,4
48
26
,293
,888
383,
994,
285
Port
land
Sta
te U
nive
rsity
139,
544,
915
71,2
98,5
97
22
,330
,060
233,
173,
572
11,6
59,5
23
8,
876,
323
212,
637,
726
Sout
hern
Ore
gon
Univ
ersit
y23
,469
,614
14
,251
,350
4,80
1,97
5
42,5
22,9
39
3,95
5,60
1
-
38
,567
,338
Un
iver
sity
of O
rego
n13
6,59
6,15
8
29
4,17
1,27
0
47,8
49,1
91
47
8,61
6,61
9
29
,676
,380
23,9
34,9
02
42
5,00
5,33
7
W
este
rn O
rego
n Un
iver
sity
18,7
46,9
44
9,13
7,74
7
13
,633
,885
41,5
18,5
76
4,96
4,42
7
1,
618,
756
34,9
35,3
93
TOTA
L50
7,56
7,37
3$
540,
788,
847
$ 24
0,84
6,12
0$
1,
289,
202,
340
$ 76
,638
,640
$
61,8
00,9
20$
1,
150,
762,
780
$
% o
f Tot
al39
%42
%19
%10
0%6%
5%89
%
*Oth
er tu
ition
incl
udes
onl
ine,
CTE
, pro
fess
iona
l dev
elop
men
t, et
c.
Inst
itutio
n R
esid
ent F
TE
Non
-Res
iden
t FT
E To
tal F
TE**
Res
iden
t N
on-R
esid
ent
Resi
dent
Non
-Res
iden
t Ea
ster
n O
rego
n Un
iver
sity
1,36
0
76
4
2,12
4
12,8
24
2,75
8
64
%36
%O
rego
n In
stitu
te o
f Tec
hnol
ogy
2,44
3
77
2
3,21
5
5,55
1
12,5
82
76
%24
%O
rego
n St
ate
Univ
ersit
y15
,518
11
,495
27,0
13
8,
495
9,
808
57%
43%
Port
land
Sta
te U
nive
rsity
13,4
74
3,95
4
17,4
28
9,
491
15
,786
77%
23%
Sout
hern
Ore
gon
Univ
ersit
y2,
211
1,30
1
3,51
2
8,82
8
10,9
52
63
%37
%Un
iver
sity
of O
rego
n10
,519
10
,745
21,2
63
10
,165
25
,151
49%
51%
Wes
tern
Ore
gon
Univ
ersit
y2,
911
858
3,
769
4,
734
8,
762
77%
23%
TOTA
L48
,435
29
,889
78,3
25
8,
897
$
16,0
25$
62
%38
%
**fa
ll, fo
urth
wee
k FT
E en
rollm
ent
FTE
by
Type
Net
Tui
tion
per F
TE

43