Embed Size (px)
Citation preview
Financial Capability Index
A Toolkit for Use
Introduction
I. What is Financial Capability? The financial lives of the poor are complex. Limited income and assets, uneven cash flow, and limited experience with formal financial products and services, require the poor to engage many financial partners and conduct multiple transactions that are complicated to manage. Building the financial capabilities of the poor can help better prepare them for the challenges of meeting basic needs, managing risk, and getting ahead Financial capabilities are therefore critically important in client-centered microfinance programs to reduce poverty.
Financial capability can be broadly defined as having the knowledge, skills, and attitudes to make informed judgments and effective decisions regarding the use and management of money. The concept of financial capability also implies having appropriate financial tools (e.g. financial products and services) and the opportunities to exercise financial choices in the real world. Financial capabilities develop partly through financial experience so it is inherent in most people’s lives. However, poor people often find themselves unfamiliar with the new and rapidly changing array of financial instruments available to them and lack information about the terms and conditions of these new products. This not only limits their options, but their ability to make informed decisions about using them. Financial education can complement financial experience in building financial capabilities. By focusing on basic principles of money management and skills to use financial tools, financial education promotes attitudes and behaviors that support effective money management. In recent years, there has been a growing interest among development practitioners and policy makers in building the financial capabilities of low-income households in developing countries by expanding their access to appropriate financial products and services and combining this access with financial education. However, there is still limited understanding of what financial
Financial capability : Having the knowledge, skills, and attitudes to make informed judgments and effective decisions regarding the use and management of money.
capability really means for poor people in the context of their daily financial struggles and how to measure financial capability in a meaningful way. Better understanding and measurement of financial capabilities can contribute to the design and evaluation of more appropriate financial tools and effective financial education.
II. What is the financial capability index? The financial capability index is a tool that measures the level of knowledge, skills, and attitudes needed to make informed judgments and effective decisions regarding the use and management of money. It contains a questionnaire to assess participants in three primary areas: behavior around managing money, personal characteristics relating to money management and relationships around money. The index also contains an answer key to score results.
How the financial capability index can be used The index can be used in a variety of ways. It can be used as:
• An assessment tool to measure financial capabilities across a population to identify priority target groups for a financial education program.
• A design tool to prioritize content areas for a financial education program (e.g. saving, budgeting, debt management).
• An evaluation tool to measure changes in financial capabilities of target groups over time (e.g. before and after an intervention) in order to help assess effectiveness of intervention.
Who can use the financial capability index
A range of different types of institutions can use the financial capability index. Figure 1 identifies four main groups.1
1 Adapted from CGAP. See http://www.cgap.org/p/site/c/pubs/template.rc?gbl-
searchKeywords=financial+education+stakeholders&type=Search+Vignette&Submit.x=47&Submit.y=11.

Figure 1: Financial Education Stakeholders
Each level represents a different set of players, each with its own objectives for supporting financial education and using the index. At the macro level, government ministries, central banks or regulatory agencies may use the index to advance a national agenda for financial education. However, meso level institutions, such as regional networks or umbrella associations, and micro level organizations, such as retail service providers, and financial institutions may use the index for organizational assessment or in the design and evaluation of a financial education program.
How the financial capability index was created MFO conducted research to develop the index in India, Pakistan, Malawi and Costa Rica2. The research involved:
• Exploring how low-income people in developing countries define financial capabilities
• Evaluating how definitions vary across low-income communities in countries/contexts
• Identifying common indicators of financial capabilities across countries and contexts Directed by Guy Stuart, an expert in participatory methodology and faculty member at Harvard’s Kennedy School of Government, the research used a ground-up, inductive methodology that captured participants’ own ideas about financial capabilities. Field researchers collected data through focus group discussions in which key informants first discussed what financial capabilities meant in their communities3. They then discussed and
2 The field work was conducted in collaboration with organizations that have participated in Microfinance Opportunities’ Financial Education Program, including SEWA Bank in India, Kashf Foundation in Pakistan, OIBM Bank in Malawi and Habitat for Humanity in Costa Rica. 3 Fieldwork was conducted in both urban and rural communities.
Clients
ranked households in their communities according to their levels of financial capabilities, by placing index cards with names of the different households in various ‘piles’ ranging from low to high levels of financial capability. The statements made about each ‘pile’ during discussions were systematically recorded, ranked, and weighted.
Identifying the indicators
From the most common and frequent statements made by research participants, a set of generic indicators were identified relating to 3 main categories4:
• Basic behavior around managing money (e.g. planning, saving, spending, borrowing, earning, investing, use of formal or informal financial institutions)
• Personal characteristics (e.g. prudence in spending money, confidence in making financial decisions, ability to plan ahead)
• Relationships around money (e.g. part of a reciprocal support network vs. self-sufficiency)
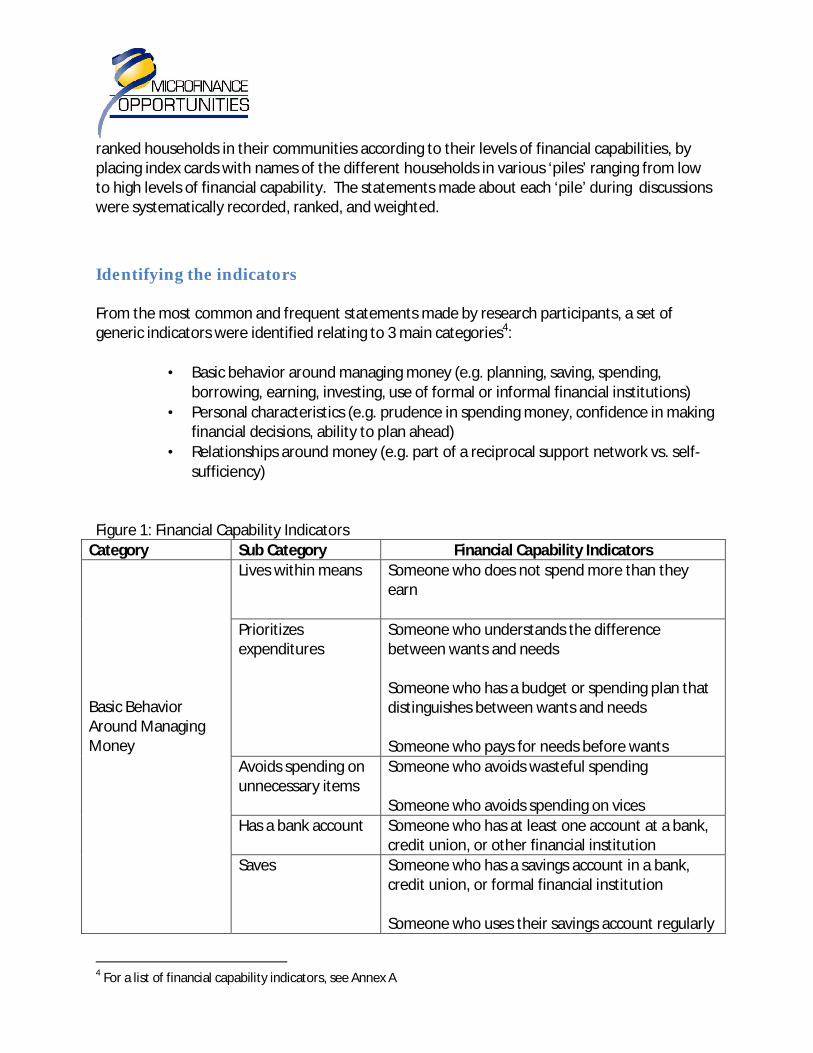
Figure 1: Financial Capability Indicators
Category Sub Category Financial Capability Indicators
Basic Behavior Around Managing Money
Lives within means Someone who does not spend more than they earn
Prioritizes expenditures
Someone who understands the difference between wants and needs Someone who has a budget or spending plan that distinguishes between wants and needs Someone who pays for needs before wants
Avoids spending on unnecessary items
Someone who avoids wasteful spending Someone who avoids spending on vices
Has a bank account Someone who has at least one account at a bank, credit union, or other financial institution
Saves Someone who has a savings account in a bank, credit union, or formal financial institution
Someone who uses their savings account regularly
4 For a list of financial capability indicators, see Annex A
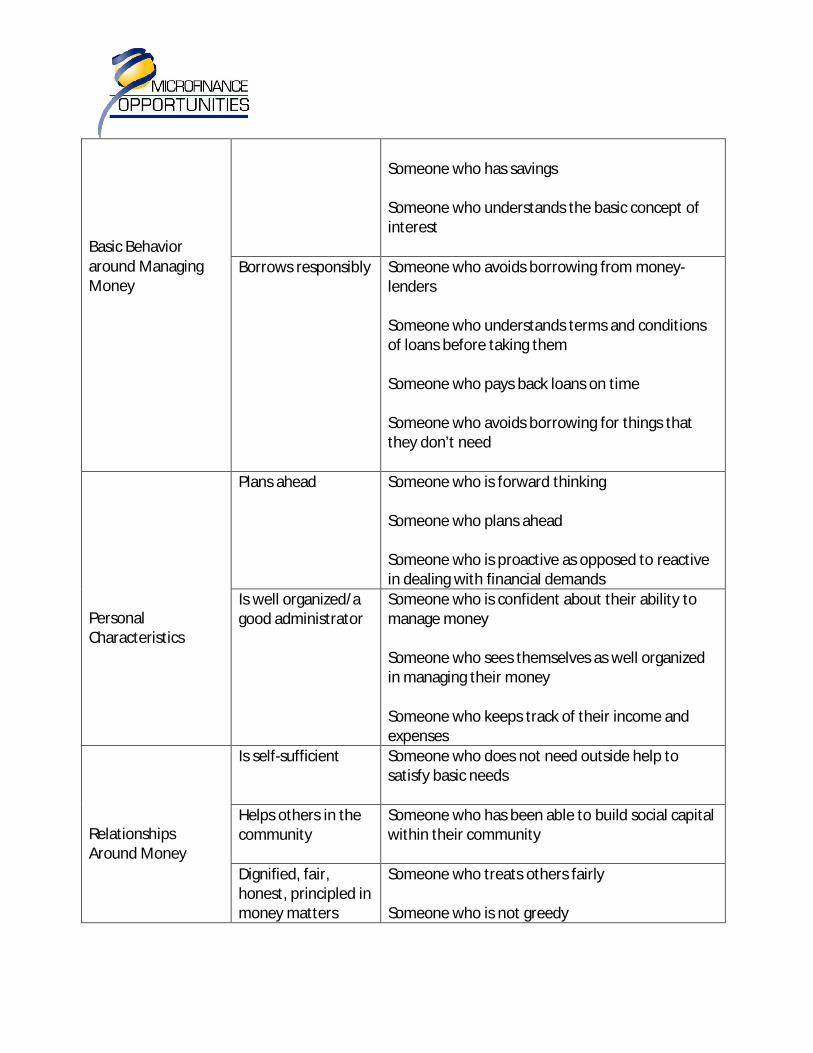
Basic Behavior around Managing Money
Someone who has savings Someone who understands the basic concept of interest
Borrows responsibly Someone who avoids borrowing from money-lenders Someone who understands terms and conditions of loans before taking them Someone who pays back loans on time Someone who avoids borrowing for things that they don’t need
Personal Characteristics
Plans ahead Someone who is forward thinking Someone who plans ahead Someone who is proactive as opposed to reactive in dealing with financial demands
Is well organized/a good administrator
Someone who is confident about their ability to manage money Someone who sees themselves as well organized in managing their money Someone who keeps track of their income and expenses
Relationships Around Money
Is self-sufficient Someone who does not need outside help to satisfy basic needs
Helps others in the community
Someone who has been able to build social capital within their community
Dignified, fair, honest, principled in money matters
Someone who treats others fairly Someone who is not greedy

Developing the questionnaire Based on the above indicators, MFO developed a questionnaire made up of 30 questions that generates an individual financial capability ‘score’ ranging from 0- 30 points for the person taking the questionnaire. The questionnaire was pilot tested in Costa Rica, Pakistan, Cambodia, Malawi and Kenya5 to assess the relevance of the indicators and the appropriateness of the questions for a cross section of low-income households. Based on feedback received in these five countries, final revisions were made to the questionnaire. The resulting ‘generic’ questionnaire can be administered to individuals or target populations, to generate individual financial capabilities scores.6
III. Overview of the toolkit This toolkit is intended to help people use the financial capability questionnaire. It includes questionnaires as well as guidance and tools on:
• Using and translating the generic financial capability index
• Adapting the financial capability index to local contexts in order to obtain results specific to an organization’s target population
• Developing a country-specific index from the ground up, drawing on an example from Malawi
• Administering the financial capability questionnaire
• Scoring and analyzing the results of the questionnaire MFO has also developed a web-based platform that can be used as an alternative or complement to this toolkit. Similar to the toolkit, the web-based platform walks users through a step by step process of a adapting and administering the generic index to their local contexts, and compiling and analyzing individual and composite scores of target populations. In addition to the toolkit, it provides a user friendly website for inputting the ‘financial capabilities’ scores, and analyzing them through different types of queries (e.g. individual respondents, according to certain socioeconomic characteristic of respondents, across projects, etc). It also provides access to a database enabling users to report data and facilitate comparison of financial capabilities across populations and countries. [PROVIDE LINK TO WEB BASED PLATFORM]
5 The index was pilot tested with some of the organizations with which it was first developed including Kashf Foundation in Pakistan, Habitat for Humanity in Costa Rica, and OIBM in Malawi. It was also tested with the ILO in Cambodia, another member of Microfinance Opportunities’ Global Financial Education Program. 6 For additional information on scoring, see ‘Scoring the Questionnaire’ section on page XX
IV. Three variations of the financial capabilities index
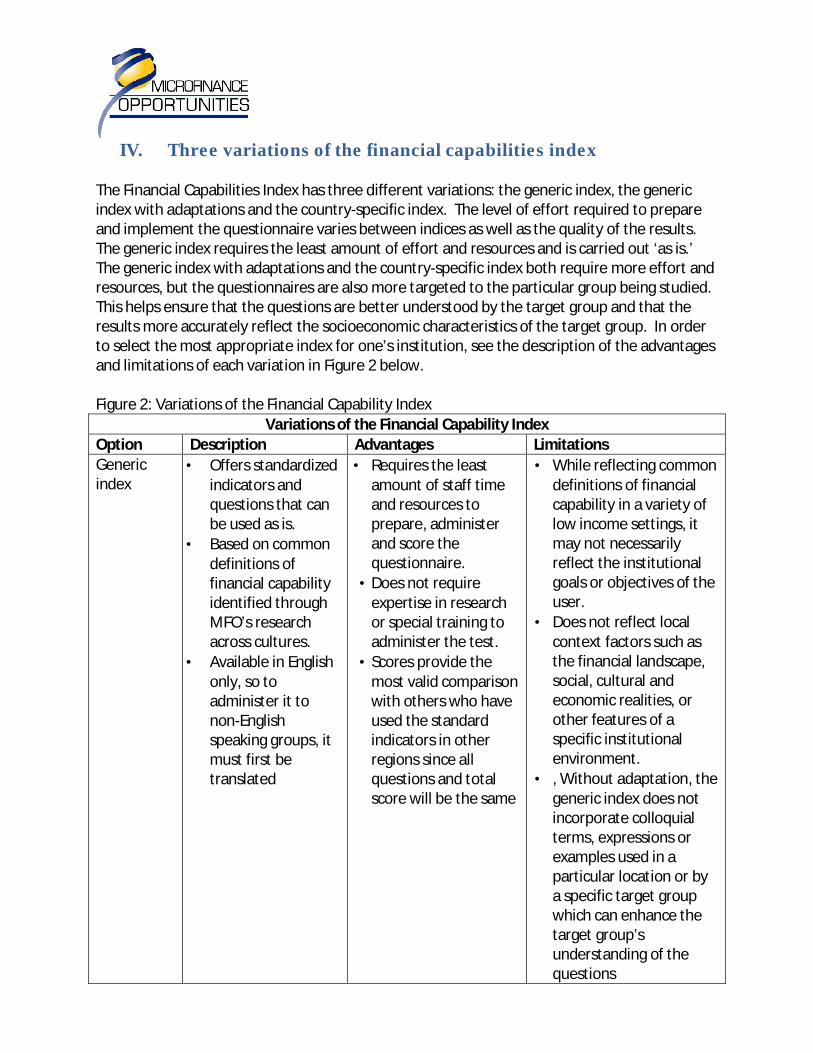
The Financial Capabilities Index has three different variations: the generic index, the generic index with adaptations and the country-specific index. The level of effort required to prepare and implement the questionnaire varies between indices as well as the quality of the results. The generic index requires the least amount of effort and resources and is carried out ‘as is.’ The generic index with adaptations and the country-specific index both require more effort and resources, but the questionnaires are also more targeted to the particular group being studied. This helps ensure that the questions are better understood by the target group and that the results more accurately reflect the socioeconomic characteristics of the target group. In order to select the most appropriate index for one’s institution, see the description of the advantages and limitations of each variation in Figure 2 below. Figure 2: Variations of the Financial Capability Index
Variations of the Financial Capability Index
Option Description Advantages Limitations
Generic index
• Offers standardized indicators and questions that can be used as is.
• Based on common definitions of financial capability identified through MFO’s research across cultures.
• Available in English only, so to administer it to non-English speaking groups, it must first be translated
• Requires the least amount of staff time and resources to prepare, administer and score the questionnaire.
• Does not require expertise in research or special training to administer the test.
• Scores provide the most valid comparison with others who have used the standard indicators in other regions since all questions and total score will be the same
• While reflecting common definitions of financial capability in a variety of low income settings, it may not necessarily reflect the institutional goals or objectives of the user.
• Does not reflect local context factors such as the financial landscape, social, cultural and economic realities, or other features of a specific institutional environment.
• , Without adaptation, the generic index does not incorporate colloquial terms, expressions or examples used in a particular location or by a specific target group which can enhance the target group’s understanding of the questions

• Some questions,
examples or indicators may not be relevant for a specific target group.
• Without a pre-test, it may be difficult to determine if low scores are based on low financial capabilities or poor understanding of questionnaire
Generic index with adaptations
• The toolkit provides guidance on how to adapt and field test questionnaire so that it is more meaningful and better understood by the target population.
• While this ‘light touch’ adaptation adds a step to the process, it is fairly simple and might involve as little as changing terms and examples in the questionnaire.
• In some cases, it also may involve adding additional questions that fit the purpose or context of the organization using it.
• The revised index can then be applied widely to the new population
• The questionnaire is more relevant for a specific target population.
• The questionnaire will be more relevant and better understood by the target group than the generic index which is applied ‘as is.’
• Requires more time and resources than the ‘generic index.’
• Requires good understanding of the target population and the local context in order to modify the questionnaire and ensure its relevance to the target group.
Country-specific index
• Allows users to develop a country-specific index, following the same participatory
• High potential for developing an index that resonates with a particular population. Results from the
• Requires the most resources- and time to develop, prepare and carry out.
• Requires staff skilled in
methodology and rigor that MFO used to develop the generic index.
questionnaire will more closely reflect the socioeconomic characteristics of the target group.
• The indicators and resulting questionnaire will be built from the ground up and will not require additional adaptation.
conducting field-based research, moderating focus group discussions, analyzing a mix of qualitative and quantitative data and designing questionnaires.
• Field research requires identification of communities where its members know each other well. This may pose a challenge in some geographic areas.
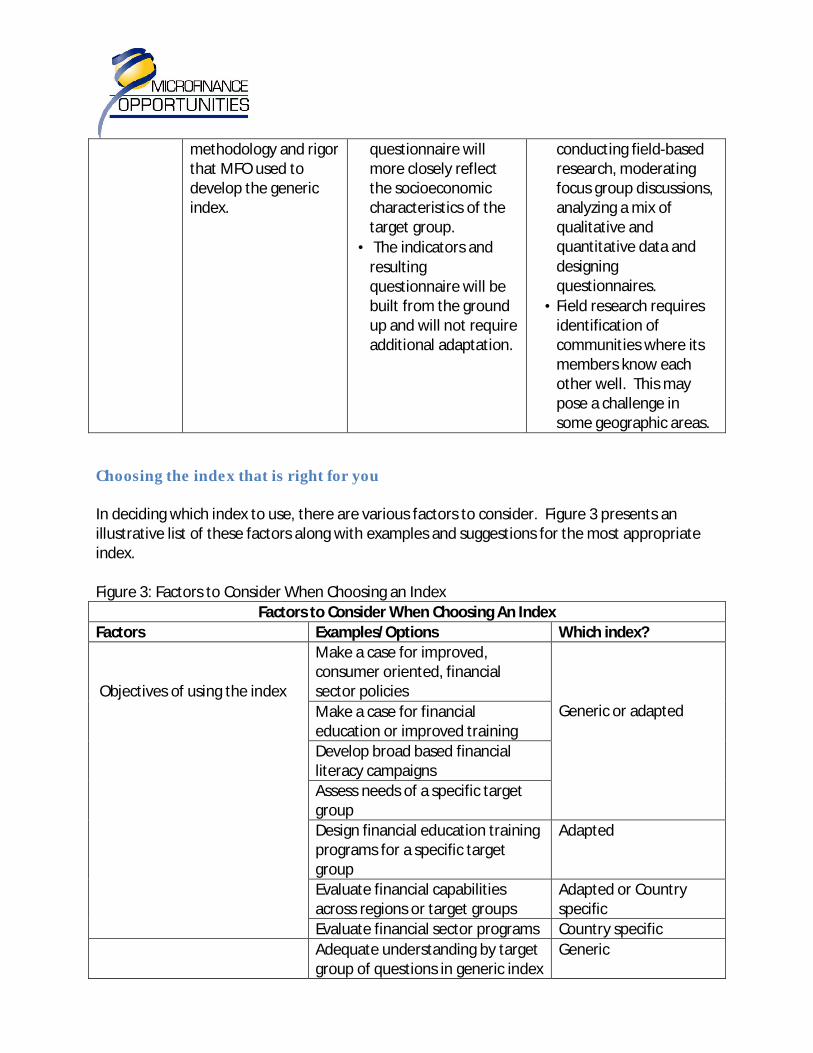
Choosing the index that is right for you In deciding which index to use, there are various factors to consider. Figure 3 presents an illustrative list of these factors along with examples and suggestions for the most appropriate index. Figure 3: Factors to Consider When Choosing an Index
Factors to Consider When Choosing An Index
Factors Examples/Options Which index?
Objectives of using the index
Make a case for improved, consumer oriented, financial sector policies
Generic or adapted
Make a case for financial education or improved training
Develop broad based financial literacy campaigns
Assess needs of a specific target group
Design financial education training programs for a specific target group
Adapted
Evaluate financial capabilities across regions or target groups
Adapted or Country specific
Evaluate financial sector programs Country specific
Adequate understanding by target group of questions in generic index
Generic

Socioeconomic characteristics of the target group
evident through pre test with small sample of target group
Poor understanding by target group of questions in generic index evident through pre test with small sample of target group
Adapted
Low literacy levels7
Adapted
Young people with little financial experience
Adapted
Medium to high income levels8 Adapted
Specific local context (e.g. financial and economic landscape) that affects financial capabilities
Stable economy Generic
Fast growing economy
Adapted
Post conflict setting Adapted
Timeframe to begin using the index
Immediate (0-1 month) Generic
Next few months (2-3months) Adapted
Within next year (6-12 months) Country Specific
Human and financial resources available
Limited time and resources available
Generic
Staff available that understand target population and local context
Adapted
Staff available who are skilled in conducting field based research, moderating focus group discussions, analyzing a mix of qualitative and quantitative data and designing questionnaires
Country Specific
The following sections will provide a detailed description and example of each of these three options and a step-by-step process for getting each variation of the ‘Financial Capabilities Index’ ready for your target group.
7 Low literacy levels also require oral administration of the questionnaire. For a discussion on how to administer the quiz with illiterate or semi-literate population, see section on ‘Administering the Index’ on page XX 8 The index was designed with low-income populations in various countries and thus may need to be adapted for
higher income levels.
The Generic Financial Capabilities Index
I. Overview of Content
The generic index is comprised of the following sections:
• An introduction explaining the purpose of the questionnaire
• A section for respondents to provide background information9 (e.g. name, location, date, client ID#, age, gender, etc.)
• The first part of questionnaire with multiple choice questions related to financial knowledge, skills and attitudes
• The second part of questionnaire with a series of statements related to financial behaviors and scaled responses to determine the extent to which the respondent agrees with the statement or believes it describes him/her
• Answer key to score the responses.10
II. The Generic Financial Capabilities Index
The following document is the Generic Financial Capabilities Index11. Note: Please choose the response you think is correct for each question.
9 The information collected from each respondent may vary according to local context, target group and institutional objectives for using the index. 10
For additional information on how to score the questionnaire, see ‘Scoring the Index’ on page XX. 11 For the correct responses see ‘Scoring the Index’ on page XX
Financial Capability Index Introduction: Welcome. Thank you for taking the ‘Financial Capability’ Index. This questionnaire will ask you a series of questions about how you manage your household finances and make financial decisions. The information obtained from the questionnaire will be used in the design of a financial education program appropriate for you and your family. If at any point while taking the questionnaire, something is unclear, please raise your hand and I will respond to your question.
Name: ___________________Location:____________________Date:________________ ID: ______________________Age:_______________________Gender:_____________ Completed Education Level: (choose most appropriate option) o None o Primary o Secondary o Post Secondary O Occupation: (choose most appropriate option)
o Self employed o Wage employed o Salaried worker o Casual worker o Unpaid worker in family business o Not working o Student
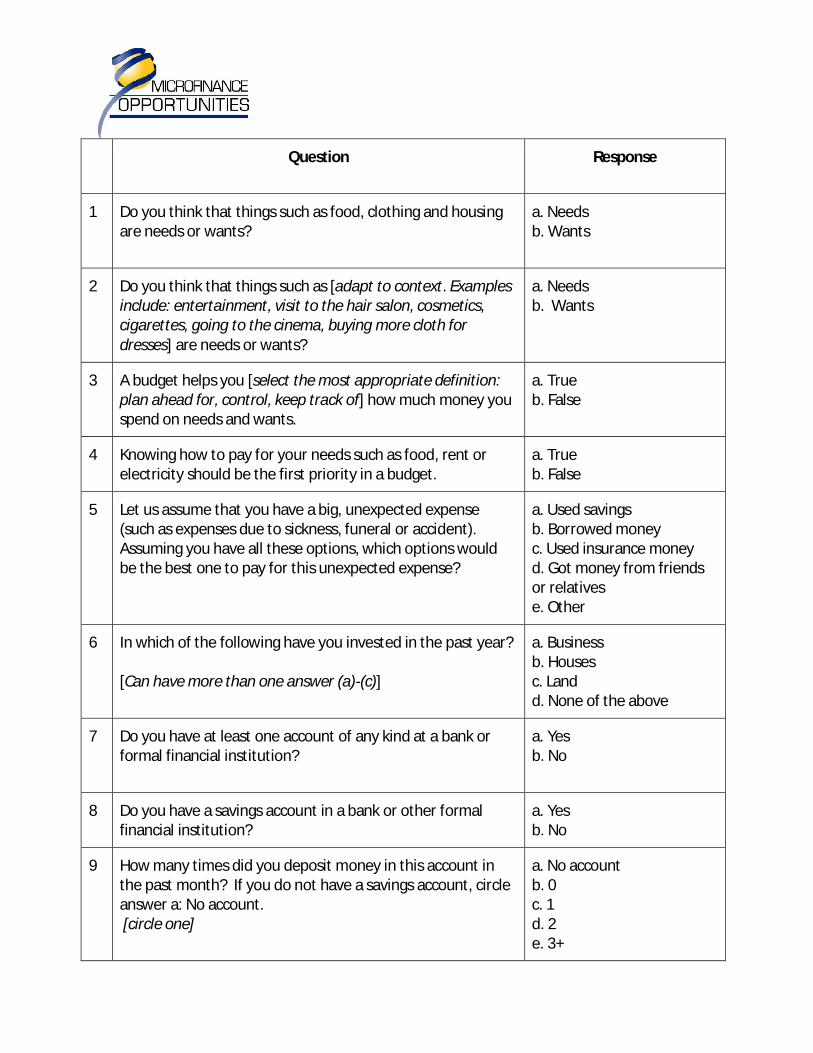
Question
Response
1 Do you think that things such as food, clothing and housing are needs or wants?
a. Needs b. Wants
2 Do you think that things such as [adapt to context. Examples include: entertainment, visit to the hair salon, cosmetics, cigarettes, going to the cinema, buying more cloth for dresses] are needs or wants?
a. Needs b. Wants
3 A budget helps you [select the most appropriate definition: plan ahead for, control, keep track of] how much money you spend on needs and wants.
a. True b. False
4 Knowing how to pay for your needs such as food, rent or electricity should be the first priority in a budget.
a. True b. False
5 Let us assume that you have a big, unexpected expense (such as expenses due to sickness, funeral or accident). Assuming you have all these options, which options would be the best one to pay for this unexpected expense?
a. Used savings b. Borrowed money c. Used insurance money d. Got money from friends or relatives e. Other
6 In which of the following have you invested in the past year? [Can have more than one answer (a)-(c)]
a. Business b. Houses c. Land d. None of the above
7 Do you have at least one account of any kind at a bank or formal financial institution?
a. Yes b. No
8 Do you have a savings account in a bank or other formal financial institution?
a. Yes b. No
9 How many times did you deposit money in this account in the past month? If you do not have a savings account, circle answer a: No account. [circle one]
a. No account b. 0 c. 1 d. 2 e. 3+

Question
Response
10 How much money does your family need to pay for next month’s expenses?
a. _______ b. I don’t know
11 Do you have enough saved (in cash and/or bank) to cover one month of your expenses?
a. Yes b. No
12 Let us assume that you save $100 in a savings account for one year. If that savings account earns 5% annual interest, how much would be in the account at the end of one year?
a. less than $100 b. between $100 and $120 c. more than $120
13 In the past year, have you borrowed from a moneylender, that is, an individual who charges for loaning you money?
a. Yes b. No
14 What questions should you always ask before borrowing money at a financial institution?
a. How long do I have to repay the loan? b. How often will I have to make payments? c. How much interest will I pay on the loan? d. All of the above questions are important to ask (a, b, c)
15 Before borrowing money from a financial institution, how do you decide how much you will borrow?
a. By asking for the highest amount the financial institution will give me b. By calculating how much money I need for my business or other purpose c. By examining my income and expenses to see how much I can afford to pay each month
16 In the past year I have received financial help from others to pay for the basic needs of my family such as food, rent, or utility bills.
a. Yes b. No

Question
Response
17 In the past year I have given money to others in my community that needed financial help.
a. Yes b. No
Note: For each statement below, please indicate:
• If it describes you always, frequently, sometimes or never [circle the response that best describes you]
• If you agree, somewhat agree, somewhat disagree or disagree with it
Questions Response
18 I can easily tell how much I earn each month.
Always Frequently Sometimes Never
19 I record how much money I spend each month.
Always Frequently Sometimes Never
20 Members of my family who live in the same house work together to pay our expenses.
Always Frequently Sometimes Never
21 I think carefully before making a spending decision.
Always Frequently Sometimes Never
22 I am organized when it comes to managing money.
Always Frequently Sometimes Never
24 I feel like I spend more than I earn.
Always Frequently Sometimes Never
25 I am fair and honest in how I deal with others when it comes to buying, selling or exchanging things.
Always Frequently Sometimes Never
26 It is OK to be late with your loan Agree Somewhat Somewhat Disagree
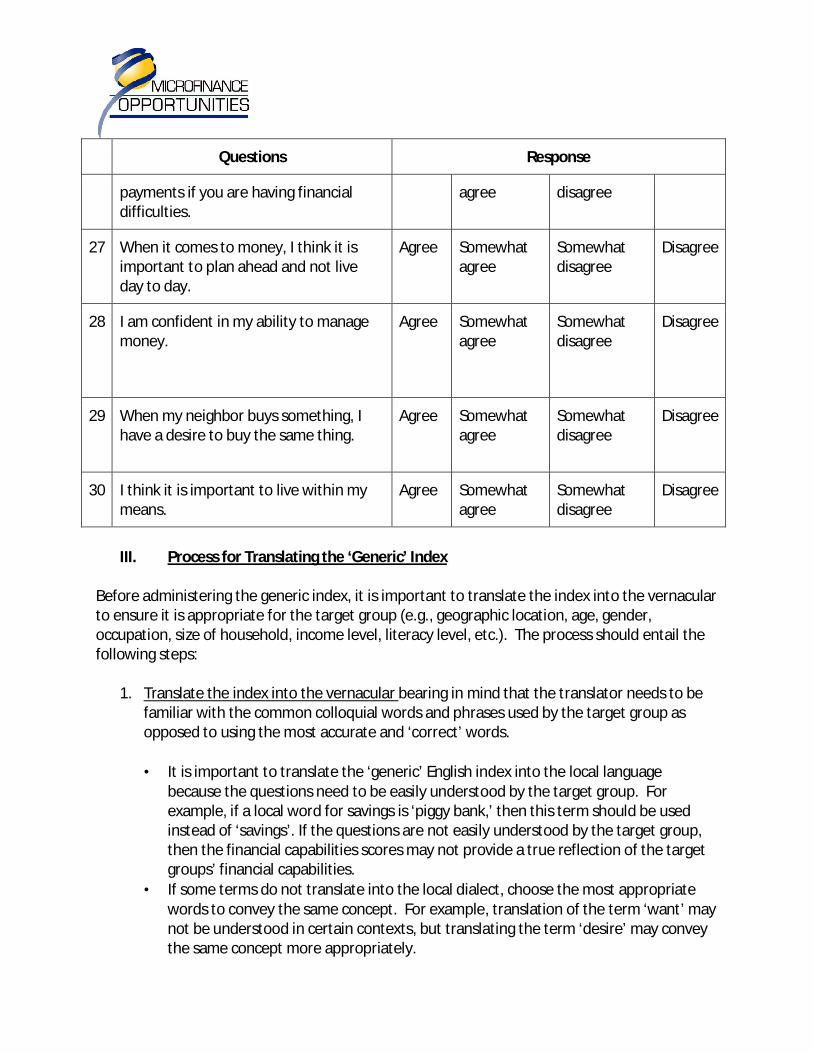
Questions Response
payments if you are having financial difficulties.
agree disagree
27 When it comes to money, I think it is important to plan ahead and not live day to day.
Agree Somewhat agree
Somewhat disagree
Disagree
28 I am confident in my ability to manage money.
Agree Somewhat agree
Somewhat disagree
Disagree
29 When my neighbor buys something, I have a desire to buy the same thing.
Agree Somewhat agree
Somewhat disagree
Disagree
30 I think it is important to live within my means.
Agree Somewhat agree
Somewhat disagree
Disagree
III. Process for Translating the ‘Generic’ Index
Before administering the generic index, it is important to translate the index into the vernacular to ensure it is appropriate for the target group (e.g., geographic location, age, gender, occupation, size of household, income level, literacy level, etc.). The process should entail the following steps:
1. Translate the index into the vernacular bearing in mind that the translator needs to be familiar with the common colloquial words and phrases used by the target group as opposed to using the most accurate and ‘correct’ words.
• It is important to translate the ‘generic’ English index into the local language because the questions need to be easily understood by the target group. For example, if a local word for savings is ‘piggy bank,’ then this term should be used instead of ‘savings’. If the questions are not easily understood by the target group, then the financial capabilities scores may not provide a true reflection of the target groups’ financial capabilities.
• If some terms do not translate into the local dialect, choose the most appropriate words to convey the same concept. For example, translation of the term ‘want’ may not be understood in certain contexts, but translating the term ‘desire’ may convey the same concept more appropriately.
2. Review the translated version and the original English version with three separate
individuals who have an excellent command of the vernacular.
• Reviewing the index with others who understand the language used on a daily basis will ensure that all terms or concepts (e.g. ‘budget’, ‘needs’ and ‘wants’) are translated into the vernacular.
• Confirming with three different people will ensure that the meanings of the questions have remained unchanged.
3. Review the translated generic index with key staff (for example: loan officers, loan
managers)
• Reviewing the index with key staff will facilitate better understanding of the questionnaire by the target group.
4. Back translate the translated generic index (translate the translated index back into
English) and compare it with the original English version of the index.
• Back translating the index will ensure the accuracy of the translation.
• This step may be possible only if your organization has the time and resources for it.
5. Test the translated index with a small sample of the target population (e.g. 3 to 5 people)
• Testing the index with the target population will ensure that all questions are understood by the target population and are appropriate for the local context.
• During testing, note any language bottlenecks or difficulties people have understanding terms.
• During testing, ensure that all terms or concepts (e.g. ‘budget’, ‘needs’ and ‘wants’) are understood.
6. Make final revisions to the index based on results from the test.
• Depending on the amount and significance of the revisions to the index, it may be necessary to review the final index with key staff or test the index again with 1-2 more people.
7. Print out the final index.
• The index is now ready to be administered to the target group.12
12 For a discussion of this process, see the section on ‘Administering the Index.’
Adapting the Generic Financial Capabilities Index
This section explains a step by step process to adapt the ‘generic’ index to a particular target group and local context so that the results more accurately reflect the financial capabilities of the specific population.
I. Process for Development of the ‘Adapted Generic Index’ Currency, and some examples, terms and expressions in the ‘generic’ index may not be entirely suitable for different contexts. In addition, some indicators or questions may not be relevant to the economic landscape or financial challenges of the target group. The following process will help practitioners modify the generic index to better suit their target groups:
1. Define the institutional objective for using the financial capability index. Institutional objectives must be first defined as they guide the overall purpose and use of the index. An institution’s objectives may include the following:
• Needs assessment: To assess financial capabilities within various groups and thus identify the most appropriate groups to receive financial education.
• Financial education design: Once the target group is defined, the index can be used to measure financial capabilities within a specific target group across various communities/regions and thus help organizations in designing appropriate financial education interventions. It can also be used to prioritize key content areas (e.g. budgeting, saving, debt management) for a financial education program
• Evaluation: To measure changes in financial capabilities over time.
The following questions can help an organization determine its objectives in using the index:
• Who do you want to use the index with? (e.g. current clients, potential clients, low-income households with different socioeconomic characteristics, households in a specific geographic location)
• What do you want to learn about this specific population? (e.g. their familiarity with financial services, their ability to manage household finances, the needs of a particular group and the type of intervention necessary to meet those needs)
• What do you want to evaluate to help in the design of the financial education intervention? (e.g. compare levels of financial capabilities across regions or target groups to determine where and with whom to deliver the financial education; identify and prioritize financial education content)
• What would you like to measure in using the index with a specific target group? (e.g. changes in financial capabilities over time; changed based on certain
socioeconomic characteristics such as gender, geographic location, age, income level, etc)
2. Identify characteristics of target group (e.g. geographic location, age, gender,
occupation, size of household, income level, literacy level, etc.).
• It is important to know the socioeconomic characteristics of the target group in order to ensure that the index is appropriate for the target group and that the answers are relevant to an institution’s objectives.
• For example: certain examples of ‘wants’ in the index may be gender sensitive or appropriate for a specific geographic area. Women may not consider cigarettes as ‘wants’ in some environments while men may consider it as such. ‘Going to the cinema’ will probably not be a commonly stated ‘want’ for a rural population that cannot access a movie theater; this type of “want” may be more suitable for urban populations.
3. Review the translated generic index13 with key staff (for example: loan officers, loan managers) and use the ‘Local Modification Chart’14 to identify areas of questionnaire to adapt15.
• It is important to keep in mind the socioeconomic characteristics of the target group when identifying areas for revision of the questionnaire
• Reviewing the index with key staff will ensure that all phrases, terms, concepts and examples within the index are understood by the target population and are appropriate for the local context.
• Reviewing the index with key staff will also ensure relevance of indicators/questions and identify if indicators/questions are missing (e.g. a local problem/issue not represented in the ‘generic’ index).
4. Adapt the translated index based on results from the Local Modification chart and
discussions with key staff. 5. Test the index with a small sample of the target group (3-5 people).
• This step is critical to ensure that the translation and modifications to the index are appropriate for the target group
13 For guidance on translation, See Section III: Process for Translating Generic Index in ‘Generic Financial Capabilities Index’ on page XX. It is necessary to test the index only once with a small sample of the target group, after it has been translated and then modified. 14
See Section II: How to Adapt the Generic Index for an example of the Local Modification Chart 15 The Adaptation process will be explained in more detail in Section II: How to Adapt the Generic Index

• During pilot testing, note any areas of confusion regarding the content (e.g. terms,
expression, examples, etc.), format of index or language bottlenecks.
• During testing, ensure that all terms or concepts (e.g. ‘budget’, ‘needs’ and ‘wants’) are understood and translated correctly.
6. Make final revisions to the index based on results from pilot test.
• Depending on the amount and significance of the revisions to the index, it may be necessary to review the final index with key staff or test the index again with 1-2 more people.
7. Print out final index.
• The index is now ready to be administered to the target group16
Note: If you plan to use the index in various regions where different dialects are common, you should repeat the adaptation and translation process to ensure the index is relevant for the populations in the new regions.
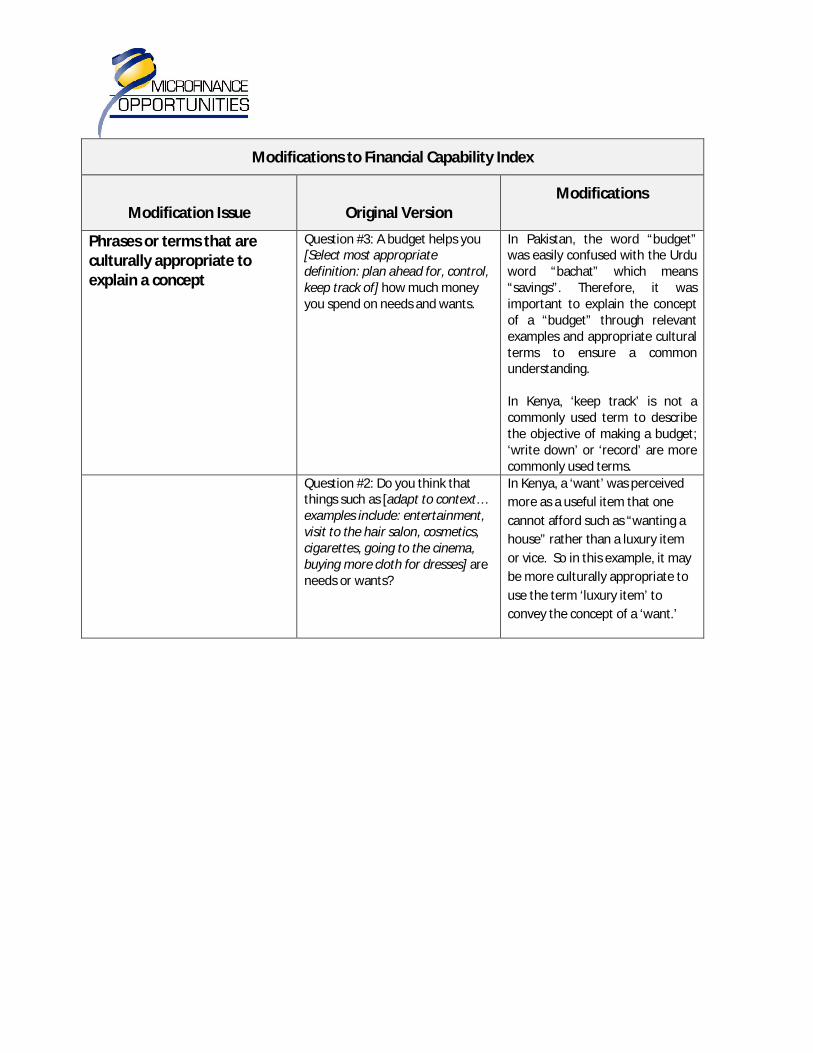
II. How to Adapt the Generic Index It may be necessary to make various types of adaptations to the ‘generic’ index to ensure relevance to the local context and target group. An illustrative list of these types of adaptations along with examples from the field can be found in the ‘Local Modification Chart’ presented in Table 3. The ‘Local Modification Chart’ is a useful tool for making simple adaptations such as adapting phrases, terms to explain indicators or examples, currency or pictures or more extensive adaptations such as modifying existing indicators.
Table 3: Local Modification Chart
Modifications to Financial Capability Index
Modification Issue Original Version
Modifications
Basic adaptations
16 For a discussion of this process see ‘Administering the Index’ on page XX
Modifications to Financial Capability Index
Modification Issue Original Version
Modifications
Phrases or terms that are culturally appropriate to explain a concept
Question #3: A budget helps you [Select most appropriate definition: plan ahead for, control, keep track of] how much money you spend on needs and wants.
In Pakistan, the word “budget” was easily confused with the Urdu word “bachat” which means “savings”. Therefore, it was important to explain the concept of a “budget” through relevant examples and appropriate cultural terms to ensure a common understanding. In Kenya, ‘keep track’ is not a commonly used term to describe the objective of making a budget; ‘write down’ or ‘record’ are more commonly used terms.
Question #2: Do you think that things such as [adapt to context… examples include: entertainment, visit to the hair salon, cosmetics, cigarettes, going to the cinema, buying more cloth for dresses] are needs or wants?
In Kenya, a ‘want’ was perceived
more as a useful item that one
cannot afford such as “wanting a
house” rather than a luxury item
or vice. So in this example, it may
be more culturally appropriate to
use the term ‘luxury item’ to
convey the concept of a ‘want.’

Modifications to Financial Capability Index
Modification Issue Original Version
Modifications
Examples of concepts in indicators (e.g. ‘needs’, ‘wants’, ‘unexpected expense’ and ‘vices’) that are culturally appropriate
Question #2: Do you think that things such as [adapt to context…examples include: entertainment, visit to the hair salon, cosmetics, cigarettes, going to the cinema, buying more cloth for dresses] are needs or wants?
In Cambodia, female members of a self-help group did not see “cigarettes” as a gender appropriate “need”. They suggested that “visits to the beauty salon or buying elaborate gifts for ceremonies” are more appropriate options. In Pakistan, buying paan’ or betel leaf to eat and mix with spices were deemed culturally appropriate needs by women. Women did not see “cigarettes” or “going to the movies” as culturally appropriate needs.
In Malawi, the examples such as “entertainment” or “going to the cinema” did not seem to be relevant “wants” for a rural population. A more relevant example of a “want” is “buying more cloth for dresses’” as people living in a rural community view this as a major luxury
Question #23: I spend more money than I should on bad habits [adapt to local context examples include, gambling, drinking, cigarettes, visits to beauty salon, buying elaborate gifts for ceremonies or new model cell phone]
In Malawi, men considered “beer drinking”, “gambling” and “prostitution” as appropriate examples of “vices”. In Pakistan, most women confused a ‘new model cell phone’ as an example of a “vice” with buying a cell phone in general, something that is deemed a necessity to most. To remedy this problem, the Urdu index specified replacement of an older model.
Modifications to Financial Capability Index
Modification Issue Original Version
Modifications
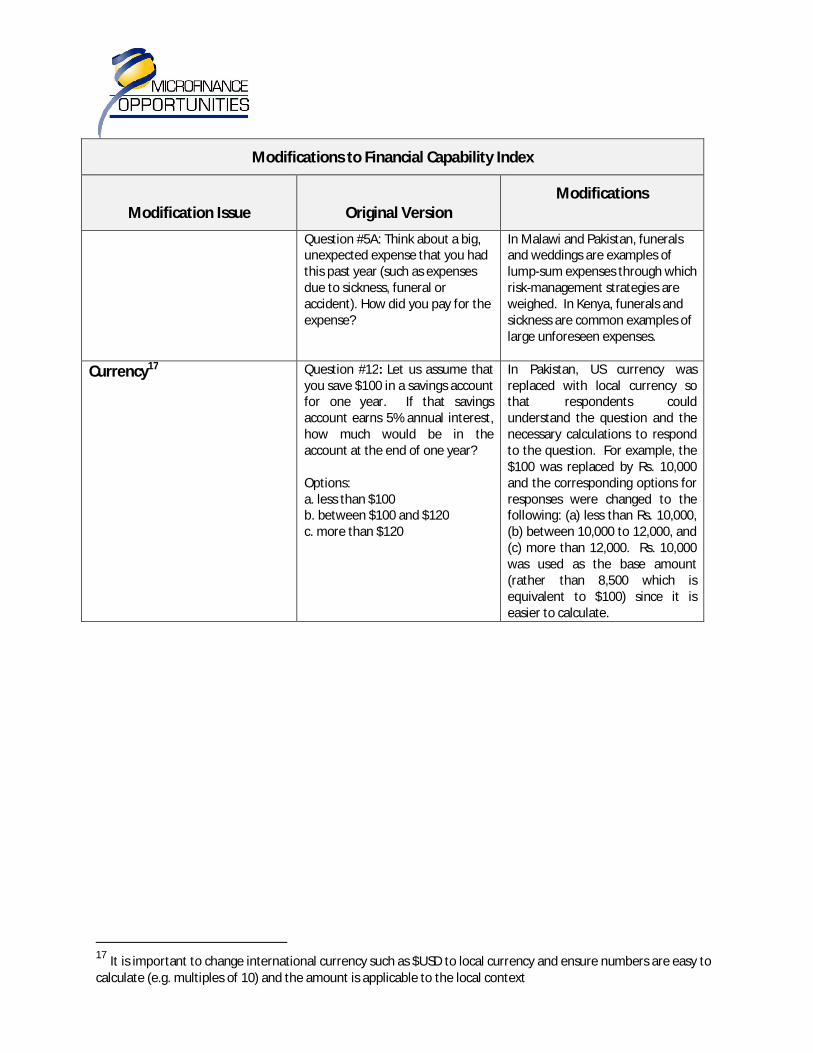
Question #5A: Think about a big, unexpected expense that you had this past year (such as expenses due to sickness, funeral or accident). How did you pay for the expense?
In Malawi and Pakistan, funerals and weddings are examples of lump-sum expenses through which risk-management strategies are weighed. In Kenya, funerals and sickness are common examples of large unforeseen expenses.
Currency17
Question #12: Let us assume that you save $100 in a savings account for one year. If that savings account earns 5% annual interest, how much would be in the account at the end of one year? Options: a. less than $100 b. between $100 and $120 c. more than $120
In Pakistan, US currency was replaced with local currency so that respondents could understand the question and the necessary calculations to respond to the question. For example, the $100 was replaced by Rs. 10,000 and the corresponding options for responses were changed to the following: (a) less than Rs. 10,000, (b) between 10,000 to 12,000, and (c) more than 12,000. Rs. 10,000 was used as the base amount (rather than 8,500 which is equivalent to $100) since it is easier to calculate.
17 It is important to change international currency such as $USD to local currency and ensure numbers are easy to calculate (e.g. multiples of 10) and the amount is applicable to the local context
Modifications to Financial Capability Index
Modification Issue Original Version
Modifications
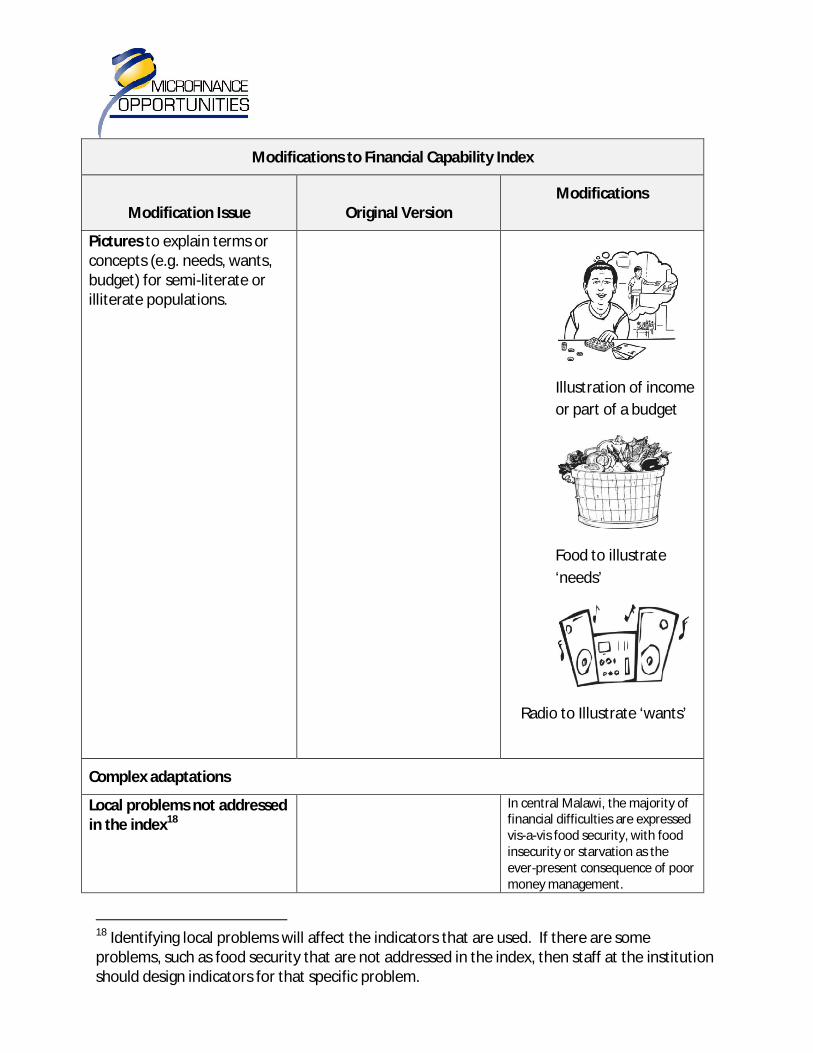
Pictures to explain terms or concepts (e.g. needs, wants, budget) for semi-literate or illiterate populations.
Illustration of income
or part of a budget
Food to illustrate
‘needs’
Radio to Illustrate ‘wants’
Complex adaptations
Local problems not addressed in the index18
In central Malawi, the majority of financial difficulties are expressed vis-a-vis food security, with food insecurity or starvation as the ever-present consequence of poor money management.
18 Identifying local problems will affect the indicators that are used. If there are some problems, such as food security that are not addressed in the index, then staff at the institution should design indicators for that specific problem.

Modifications to Financial Capability Index
Modification Issue Original Version
Modifications
Indicators
The following questions illustrate the new indicator to address the problem of food security:
• You are less likely to suffer a food shortage if you have multiple sources of income.
• I had a food shortage in the last year.
• I hold off on selling my harvest to get the best price.
Question #10: How much money does your family need to pay for next month’s expenses?
How much money does your family need next month to avoid having a food shortage?
To make complex adaptations there are two options: 1) Identify local problems not currently
addressed in index and design indicators to address these problems 2) Develop a country-
specific index using the methodology developed by MFO that captures and synthesizes a
participant’s perceptions of financial capabilities.
For example, through inductive methodology, the agrarian rural population of Malawi identified a set of new indicators that strongly influenced the design of the Malawi-specific index. These indicators were based on common problems identified in the local context such as food security. The examples from the field indicate the need to adapt the Financial Capability Index to fit the local context, socioeconomic characteristics of the target group and institutional mission. The adaptation process will help you better understand your clients’ needs as they relate directly to household financial management. After adapting the ‘generic’ index, the next step is to administer it.

Developing a Country Specific Index
Developed by Guy Stuart
I. Background A third variation of the index is the country-specific index. This section will provide guidance on how to develop a country specific index and provide an example from Malawi.
II. Process to Develop Country Specific Index The steps for developing a country specific index include the following:
1. Define the socioeconomic characteristics of population you will use the index for (e.g. income level, geographic location, gender, age, etc.)
2. Select a sample of communities for the field research 3. Identify key informants to help develop a list of households within the community 4. Conduct focus group discussions and ranking exercise with people who know the
selected households 5. Record the data from the focus group discussions 6. Code the data 7. Analyze the data 8. Construct the index based on the results of the analysis
Developing the Country Specific index requires field level research using a methodology similar to the methodology used by MFO to develop the generic index.
III. Process for Sampling
After defining the target population, the first step in the field work is sampling. Sampling should entail the following steps:
1. Define the population you will use the index for (e.g. households in a particular region, urban household, rural households, microfinance clients/potential clients, etc.
2. With a local partner organization, select three communities for the field research that share characteristics of this population
3. In each community, identify two to three key informants and develop a list of at least 60 households in the community that will be used for the financial capability ranking exercise.
• The key informants should have sufficient knowledge of the households on the list to be able to categorize them according to their wealth and literacy levels.

• The exercise works best if it involves both someone within the partner organization
who knows the client group well and someone from within the community (e.g. community leader).
• The field researcher who is conducting the interviews with the key informants will ask the key informants to identify 30 to 60 households that fall into the following 6 categories (5 to 10 in each category):
Category Wealth Status Head of Household or Spouse Literacy Status
1 Doing OK Yes
2 Doing OK No
3 Poor Yes
4 Poor No
5 Very Poor Yes
6 Very Poor No
• Wealth status variation is more important than literacy status, so focus on the former.
4. Working with the key informants the field researcher will record the following information on a spreadsheet about each household:
i. Name and occupation of head of household
ii. Name and occupation of spouse
iii. Location of home – section of community will do
iv. Other unique identifier that members of the community will recognize
v. Category (as per the above chart)
5. The field researcher will then ask the key informants to develop a list of at least 12-18 people from the community who have knowledge of the households on the wealth and literacy ranking list. They will be recruited to participate in three focus group discussions.
6. After the meeting is finished the field researcher will create cards for each household with sufficient information to allow members of the community discussing those households in the ranking exercise to identify them uniquely (see #4).
• The cards should also include the wealth/literacy category of the households that was identified by the key informants. However, this category should not appear on the card in a form that is recognized by the focus group participants. Use another

language or a number or color code that participants will not associate with a wealth/literacy category.
7. The field researcher also will enter the data on each household in an Excel worksheet entitled “Household List”.
IV. Process for Financial Literacy -- General Discussion
1. Once the cards are ready, the local partner will invite 12-18 members of the community (people identified by the key informants who know the households on the list) to attend three separate focus group discussions on the topic of financial literacy. Each focus group discussion should include four to six participants who will be asked to discuss the financial literacy of the 60 households on the list.
• It is okay if individuals in the households on the ranking lists are included in the focus group participant list, so long as they do not discuss their own status in their focus group meeting.
2. The field researcher will ask the participants to characterize households that “manage their finances well,” “do okay in managing their finances,” or “do not manage their finances well.” Questions to guide this process include:
• “When you think about a household, whether it is rich or poor, that manages and uses its money well, what comes to your mind?”
• “What is different about a household that manages and uses its money well versus a household that does not manage and use its money well?”
3. The field researcher will pose these questions in turn to each participant in the focus group, and record the statements made during the discussion as short general statements about what it means to “manage finances well, okay, or not well.”
The figure below presents examples of general statements made by focus group participants in Malawi.
General Statements from Malawi
Nice house
Invest in business
Invest in houses
Have enough money for a funeral
Do not experience food shortage
Pay school fees for children
Invest in livestock
Have a business

V. Process for Financial Literacy Ranking
1. The field researcher will ask the participants to rank the households from those best able to manage their money to those least able to manage their money.
2. The field researcher will randomly select two households from the sample and ask the group to compare them in terms of how they manage their money.
3. The process will generate a number of piles of similarly ranked households from those best able to manage their money to those least able to manage their money.
• It is important to have a minimum of four piles, and there is no maximum.
4. At the end of this process, the facilitator will ask the participants to describe the characteristics of the households in each ranking pile.
5. The group will discuss each pile in turn, and the facilitator will record these discussions in the form of short pile statements. Questions to guide this process include:
• “In terms of money management, what do the households in this pile have in
common?”
• If there are clear differences between the piles, ask them to elaborate on those
differences by asking: “Why do you say that?”
• If there are characteristics that are shared across piles, challenge this by asking: “Are
these households really so different?”
The figure below presents examples of pile statements made by focus group participants in Malawi.
Pile Statements from Malawi
Provide support to others
Nice house
Do not experience food shortage
Have livestock
Invest in livestock
Pay school fees for children
Have a business
• Neither the number of ranking piles nor the number of households that are to be put in each pile is determined in advance, although at least four separate ranking piles are required to make the process valid. As noted above, the facilitator repeats this ranking process twice more with different groups of four to six community members, so that each household in the sample is ranked on three separate occasions. This allows the field researcher to further validate the data.
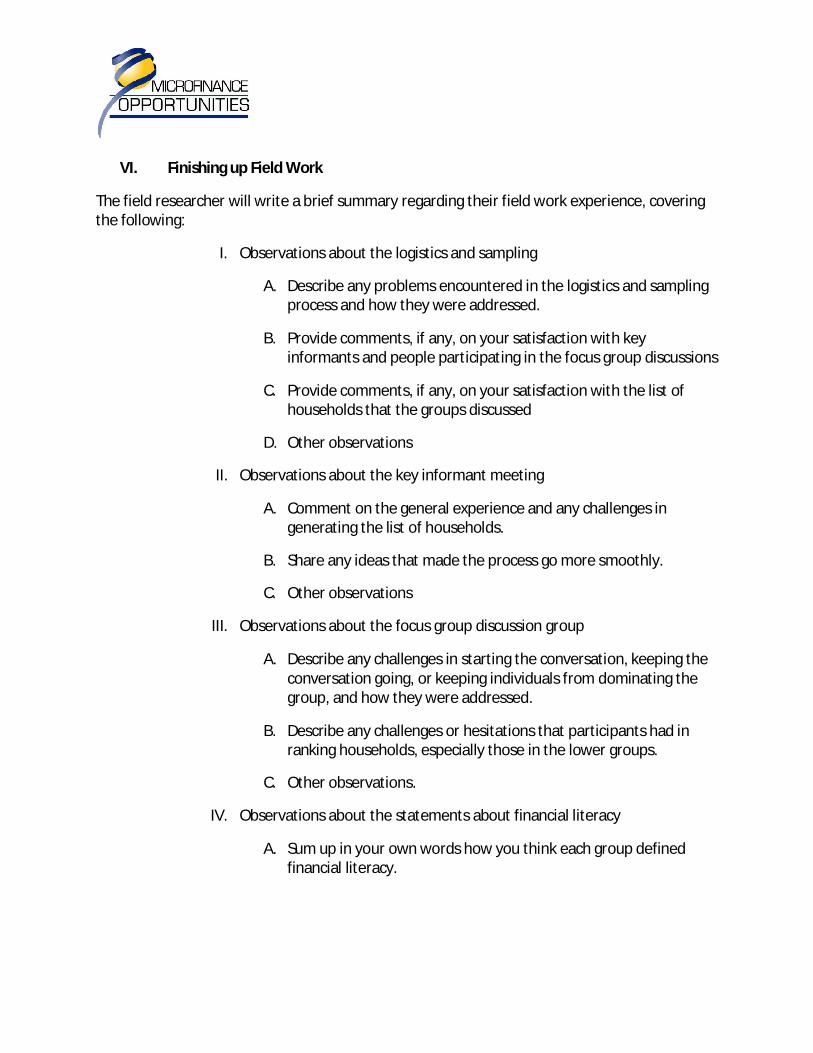
VI. Finishing up Field Work
The field researcher will write a brief summary regarding their field work experience, covering the following:
I. Observations about the logistics and sampling
A. Describe any problems encountered in the logistics and sampling process and how they were addressed.
B. Provide comments, if any, on your satisfaction with key informants and people participating in the focus group discussions
C. Provide comments, if any, on your satisfaction with the list of households that the groups discussed
D. Other observations
II. Observations about the key informant meeting
A. Comment on the general experience and any challenges in generating the list of households.
B. Share any ideas that made the process go more smoothly.
C. Other observations
III. Observations about the focus group discussion group
A. Describe any challenges in starting the conversation, keeping the conversation going, or keeping individuals from dominating the group, and how they were addressed.
B. Describe any challenges or hesitations that participants had in ranking households, especially those in the lower groups.
C. Other observations.
IV. Observations about the statements about financial literacy
A. Sum up in your own words how you think each group defined financial literacy.

Administering the Questionnaire
I. Background After translating, adapting and testing the index, the next step is to administer the questionnaire. There are various options depending on the characteristics of the target population (e.g. literacy levels, geographic location) and the human and financial resources of the institution.
II. Process for Administering the Questionnaire with Literate Population It may take on average 25 to 30 minutes to complete the questionnaire with a literate population. The process recommended for administering the questionnaire with a literate population includes these steps:
1. Organize a quiet, private space for administering the index to a group of 20 to 30 literate respondents. Limiting a group to this size will make it easier to respond to questions as they arise.
2. Introduce yourself and your organization. 3. Distribute printed copies of the questionnaire to the respondents.. 4. Ask them to fill out client ID, region, and other characteristics (e.g. gender,
age, occupation, etc.). 5. Explain that the questionnaire contains questions about how they manage
their household finances and make financial decisions. 6. Explain how the information obtained will be used, for example, to design a
financial education program appropriate for them and their families, or for other purposes as relevant.
7. Encourage them to ask questions while completing the questionnaire. 8. Walk around the room to make sure you provide answers to any questions
and provide any necessary support.
III. Process for Administering Questionnaire with Semi-Literate Population It may take between 30 to 45 minutes to administer the questionnaire with a semi-literate population. The process recommended for administering the questionnaire with a semi-literate population includes the following steps:
1. Organize a quiet, private space for administering the questionnaire to a group of 20 to 30 respondents.
2. Introduce yourself and your organization.
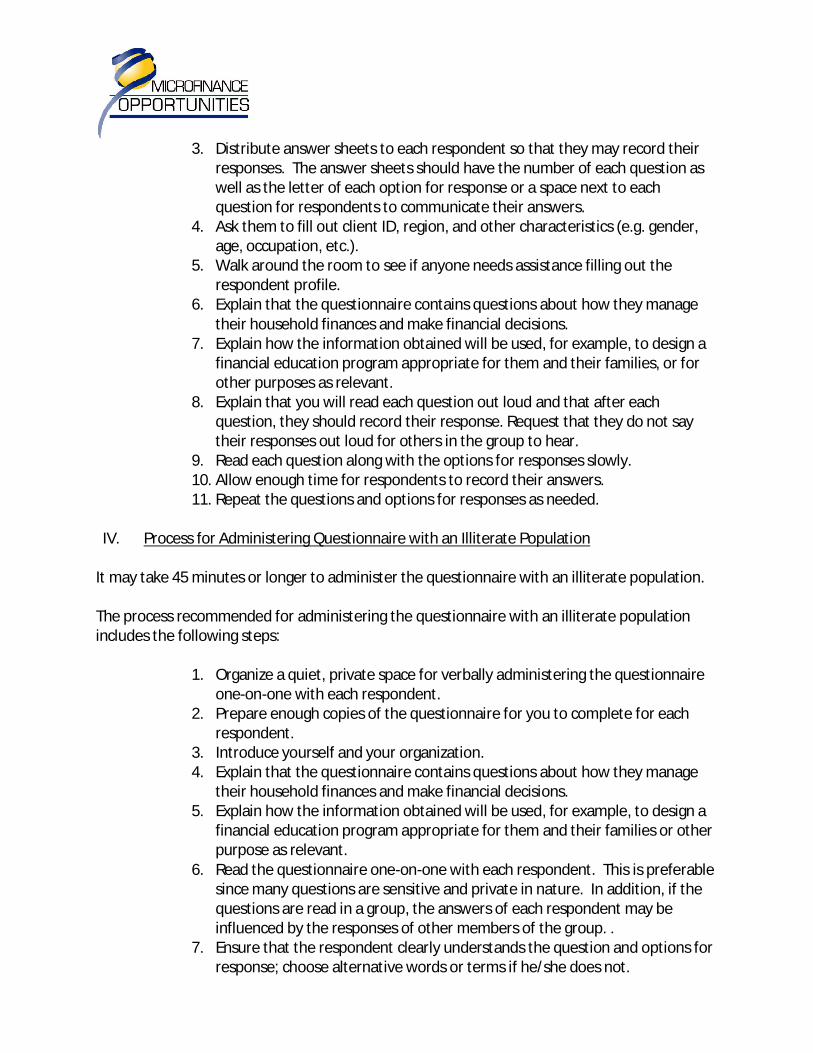
3. Distribute answer sheets to each respondent so that they may record their
responses. The answer sheets should have the number of each question as well as the letter of each option for response or a space next to each question for respondents to communicate their answers.
4. Ask them to fill out client ID, region, and other characteristics (e.g. gender, age, occupation, etc.).
5. Walk around the room to see if anyone needs assistance filling out the respondent profile.
6. Explain that the questionnaire contains questions about how they manage their household finances and make financial decisions.
7. Explain how the information obtained will be used, for example, to design a financial education program appropriate for them and their families, or for other purposes as relevant.
8. Explain that you will read each question out loud and that after each question, they should record their response. Request that they do not say their responses out loud for others in the group to hear.
9. Read each question along with the options for responses slowly. 10. Allow enough time for respondents to record their answers. 11. Repeat the questions and options for responses as needed.
IV. Process for Administering Questionnaire with an Illiterate Population
It may take 45 minutes or longer to administer the questionnaire with an illiterate population. The process recommended for administering the questionnaire with an illiterate population includes the following steps:
1. Organize a quiet, private space for verbally administering the questionnaire one-on-one with each respondent.
2. Prepare enough copies of the questionnaire for you to complete for each respondent.
3. Introduce yourself and your organization. 4. Explain that the questionnaire contains questions about how they manage
their household finances and make financial decisions. 5. Explain how the information obtained will be used, for example, to design a
financial education program appropriate for them and their families or other purpose as relevant.
6. Read the questionnaire one-on-one with each respondent. This is preferable since many questions are sensitive and private in nature. In addition, if the questions are read in a group, the answers of each respondent may be influenced by the responses of other members of the group. .
7. Ensure that the respondent clearly understands the question and options for response; choose alternative words or terms if he/she does not.

8. Record the respondent’s answers for each question in the ‘response’ column
of the questionnaire. 9. Repeat the process with each of the remaining respondents.
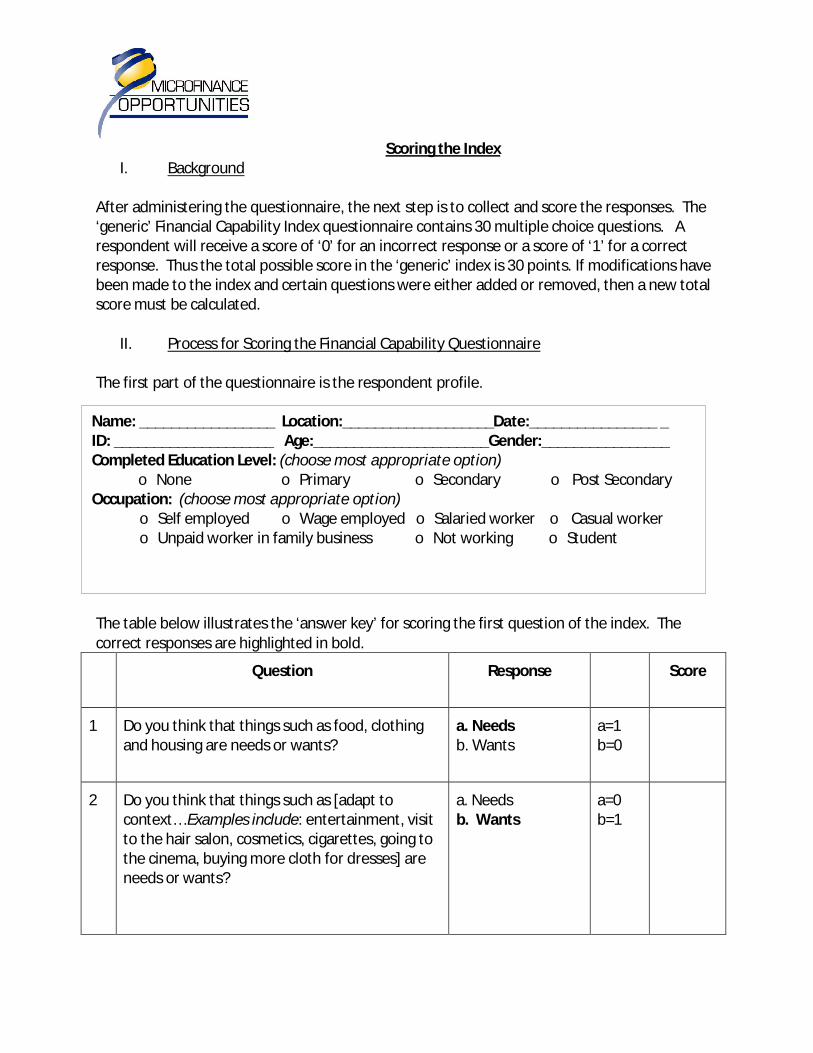
Scoring the Index
I. Background After administering the questionnaire, the next step is to collect and score the responses. The ‘generic’ Financial Capability Index questionnaire contains 30 multiple choice questions. A respondent will receive a score of ‘0’ for an incorrect response or a score of ‘1’ for a correct response. Thus the total possible score in the ‘generic’ index is 30 points. If modifications have been made to the index and certain questions were either added or removed, then a new total score must be calculated.
II. Process for Scoring the Financial Capability Questionnaire The first part of the questionnaire is the respondent profile.
The table below illustrates the ‘answer key’ for scoring the first question of the index. The correct responses are highlighted in bold.
Question
Response
Score
1 Do you think that things such as food, clothing and housing are needs or wants?
a. Needs b. Wants
a=1 b=0
2 Do you think that things such as [adapt to context… Examples include: entertainment, visit to the hair salon, cosmetics, cigarettes, going to the cinema, buying more cloth for dresses] are needs or wants?
a. Needs b. Wants
a=0 b=1
Name: _________________ Location:___________________Date:________________ _ ID: ____________________ Age:______________________Gender:________________ Completed Education Level: (choose most appropriate option) o None o Primary o Secondary o Post Secondary Occupation: (choose most appropriate option)
o Self employed o Wage employed o Salaried worker o Casual worker o Unpaid worker in family business o Not working o Student
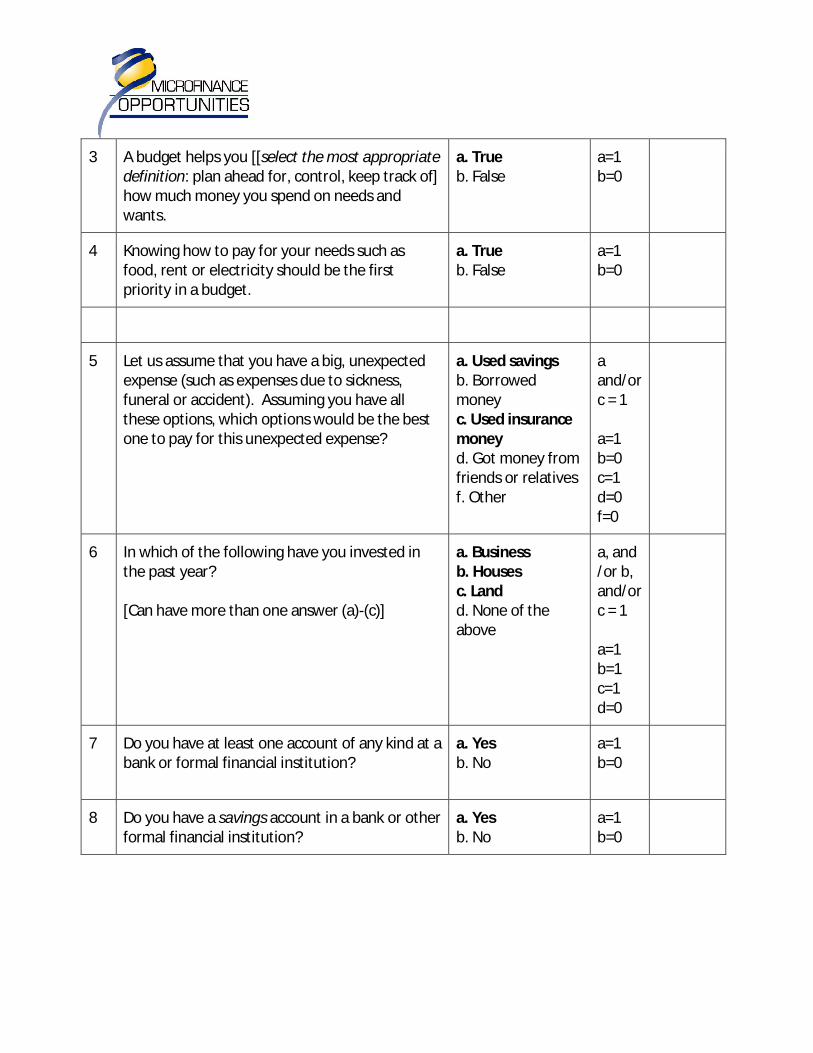
3 A budget helps you [[select the most appropriate definition: plan ahead for, control, keep track of] how much money you spend on needs and wants.
a. True b. False
a=1 b=0
4 Knowing how to pay for your needs such as food, rent or electricity should be the first priority in a budget.
a. True b. False
a=1 b=0
5 Let us assume that you have a big, unexpected expense (such as expenses due to sickness, funeral or accident). Assuming you have all these options, which options would be the best one to pay for this unexpected expense?
a. Used savings b. Borrowed money c. Used insurance money d. Got money from friends or relatives f. Other
a and/or c = 1 a=1 b=0 c=1 d=0 f=0
6 In which of the following have you invested in the past year? [Can have more than one answer (a)-(c)]
a. Business b. Houses c. Land d. None of the above
a, and /or b, and/or c = 1 a=1 b=1 c=1 d=0
7 Do you have at least one account of any kind at a bank or formal financial institution?
a. Yes b. No
a=1 b=0
8 Do you have a savings account in a bank or other formal financial institution?
a. Yes b. No
a=1 b=0
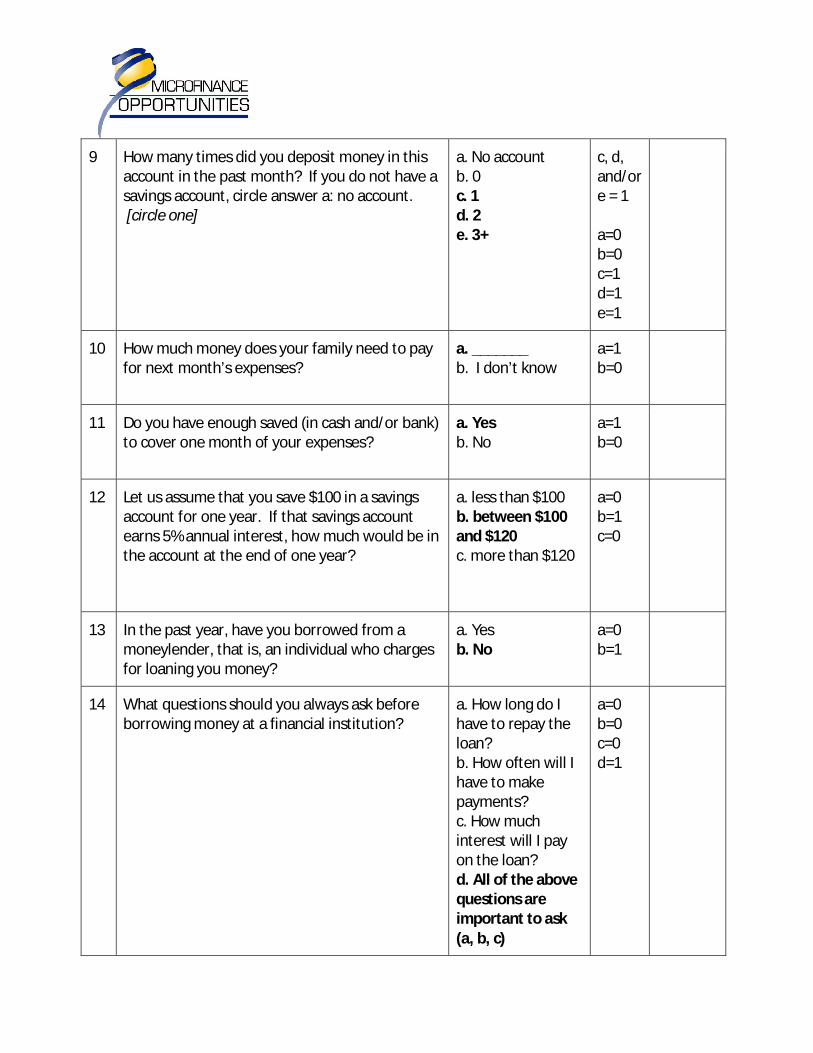
9 How many times did you deposit money in this account in the past month? If you do not have a savings account, circle answer a: no account. [circle one]
a. No account b. 0 c. 1 d. 2 e. 3+
c, d, and/or e = 1 a=0 b=0 c=1 d=1 e=1
10 How much money does your family need to pay for next month’s expenses?
a. _______ b. I don’t know
a=1 b=0
11 Do you have enough saved (in cash and/or bank) to cover one month of your expenses?
a. Yes b. No
a=1 b=0
12 Let us assume that you save $100 in a savings account for one year. If that savings account earns 5% annual interest, how much would be in the account at the end of one year?
a. less than $100 b. between $100 and $120 c. more than $120
a=0 b=1 c=0
13 In the past year, have you borrowed from a moneylender, that is, an individual who charges for loaning you money?
a. Yes b. No
a=0 b=1
14 What questions should you always ask before borrowing money at a financial institution?
a. How long do I have to repay the loan? b. How often will I have to make payments? c. How much interest will I pay on the loan? d. All of the above questions are important to ask (a, b, c)
a=0 b=0 c=0 d=1
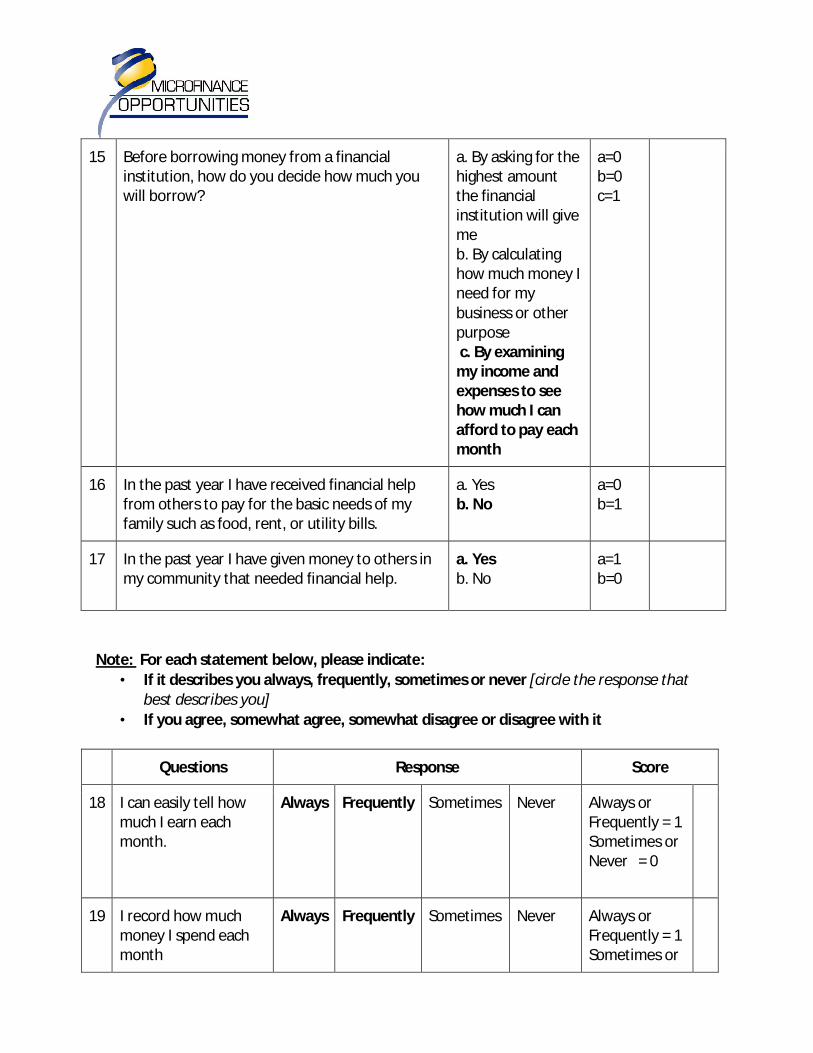
15 Before borrowing money from a financial institution, how do you decide how much you will borrow?
a. By asking for the highest amount the financial institution will give me b. By calculating how much money I need for my business or other purpose c. By examining my income and expenses to see how much I can afford to pay each month
a=0 b=0 c=1
16 In the past year I have received financial help from others to pay for the basic needs of my family such as food, rent, or utility bills.
a. Yes b. No
a=0 b=1
17 In the past year I have given money to others in my community that needed financial help.
a. Yes b. No
a=1 b=0
Note: For each statement below, please indicate:
• If it describes you always, frequently, sometimes or never [circle the response that best describes you]
• If you agree, somewhat agree, somewhat disagree or disagree with it
Questions Response Score
18 I can easily tell how much I earn each month.
Always Frequently Sometimes Never Always or Frequently = 1 Sometimes or Never = 0
19 I record how much money I spend each month
Always Frequently Sometimes Never Always or Frequently = 1 Sometimes or

Never = 0
20 Members of my family who live in the same house work together to pay our expenses
Always Frequently Sometimes Never Always or Frequently = 1 Sometimes or Never = 0
21 I think carefully before making a spending decision
Always Frequently Sometimes Never Always or Frequently = 1 Sometimes or Never = 0
22 I am organized when it comes to managing money
Always Frequently Sometimes Never Always or Frequently = 1 Sometimes or Never = 0
23 I spend more money than I should on bad habits [adapt to local context examples include, gambling, drinking, cigarettes, visits to beauty salon, buying elaborate gifts for ceremonies or new model cell phone]
Always Frequently Sometimes Never Always or Frequently = 0 Sometimes or Never = 1
24 I feel like I spend more than I earn
Always Frequently Sometimes Never Always or Frequently = 0 Sometimes or Never = 1
25 I am fair and honest in how I deal with others when it comes to buying, selling or
Always Frequently Sometimes Never Always =1 Frequently, Sometimes or Never =0
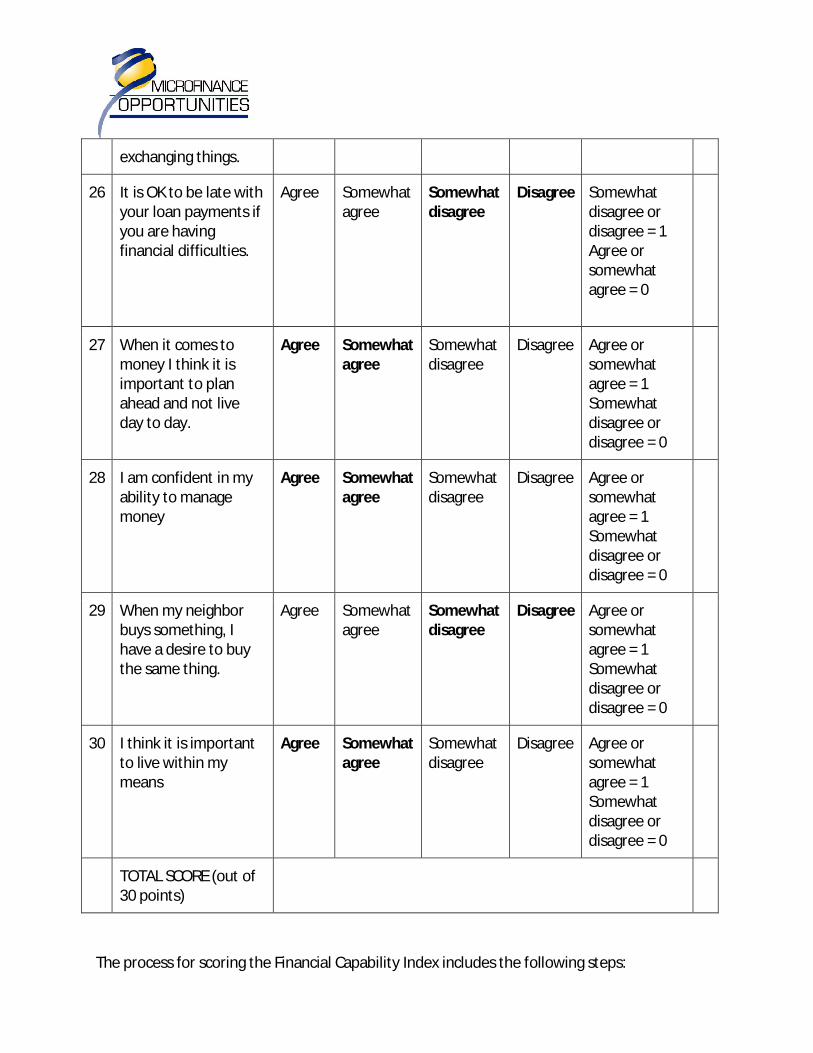
exchanging things.
26 It is OK to be late with your loan payments if you are having financial difficulties.
Agree Somewhat agree
Somewhat disagree
Disagree Somewhat disagree or disagree = 1 Agree or somewhat agree = 0
27 When it comes to money I think it is important to plan ahead and not live day to day.
Agree Somewhat agree
Somewhat disagree
Disagree Agree or somewhat agree = 1 Somewhat disagree or disagree = 0
28 I am confident in my ability to manage money
Agree Somewhat agree
Somewhat disagree
Disagree Agree or somewhat agree = 1 Somewhat disagree or disagree = 0
29 When my neighbor buys something, I have a desire to buy the same thing.
Agree Somewhat agree
Somewhat disagree
Disagree Agree or somewhat agree = 1 Somewhat disagree or disagree = 0
30 I think it is important to live within my means
Agree Somewhat agree
Somewhat disagree
Disagree Agree or somewhat agree = 1 Somewhat disagree or disagree = 0
TOTAL SCORE (out of 30 points)
The process for scoring the Financial Capability Index includes the following steps:

1. Use the “answer key” to score the index. The “answer key” highlights the correct
responses in bold under the ‘response’ column and the amount each respondent receives for correct (‘1) and incorrect responses (‘0). If there are multiple correct and incorrect responses selected for a question, a correct response should not be offset by an incorrect response.
For example in question 5, if a respondent chooses ‘savings’ and ‘borrowing money’ as
ways to pay for an unexpected response, he/she would receive a score of ‘1’. An incorrect response of ‘borrowing money’ does not offset the correct response of ‘saving.
Question
Response
Score
5 Let us assume that you have a big, unexpected expense (such as expenses due to sickness, funeral or accident). Assuming you have all these options, which options would be the best one to pay for this unexpected expense?
a. Used savings b. Borrowed money c. Used insurance money d. Got money from friends or relatives f. Other
a and/or c = 1 a=1 b=0 c=1 d=0 f=0
If there is more than one correct response a respondent can still only receive one point per question. For example in question 5, if a respondent chooses both correct answers, ‘savings’ and ‘insurance money’ as ways to pay for an unexpected response, he/she would receive a total score of ‘1’. This is applicable to other questions with more than one correct response (i.e. questions #6 and #9).
2. Record the score for each question in the ‘score’ column 3. Calculate the total ‘financial capabilities’ score for each respondent in the ‘total score’
column located at the end of the index. This is determined by the total number of questions in your index.
4. Record scores for each respondent in Excel template or using web-based platform
III. Process for Using the Web Based Platform . The web-based system is designed to be a user friendly interface to collect, score and analyze the responses for individual respondents, sub-groups of survey respondents or according to
pre-determined socioeconomic characteristics (e.g. by age, gender, geographic location, etc.), projects or clusters of questions. The process for scoring the Financial Capability Index includes the following steps:
1. Register your name, organization, title, country, region, urban/rural etc in the ‘Registration’ section
2. Register your project by entering the project start and end date. Each project will receive a unique ID number. This will allow you to compare and analyze scores across various projects. For multi-year projects record the project number and project start and end date to compare data across different time periods (e.g. 2010 vs. 2011).
3. Provide information on each respondent (e.g. gender, age, occupation, marital status, size of household, etc.) in the ‘Respondent’ section. Each respondent will receive a unique ID. This will permit scoring and analysis for sub-groups of survey respondents (e.g. by age, gender, geographic location, etc.)
4. Record responses for each respondent in the ‘Responses’ page. This will permit scoring and analysis for clusters of questions (e.g. questions related to debt management , savings or other topics)
5. If you have made adaptations to the Generic Index then record the responses to the new or adapted questions in the ‘Project-Specific Adapted Index’ section. You can modify up to 10 questions.
6. For each new project or for the same project within a different time period using an adapted index, you will need receive a new project ID and record the responses in the ‘Project-Specific Adapted Index’ section. This will ensure compatibility of questions and responses over time.
IV. Examples of Scoring
OIBM operates in the Central, Northern and Southern provinces of Malawi. It targets both men and women of low income, however puts more emphasis on targeting women. OIBM works both in rural and urban areas, with 75% of its current outreach focusing on rural areas.
In rural areas, a typical client is a farmer living of a dollar a day with little or no banking experience. A typical rural client has only a few years of primary education and no knowledge of English with little or no exposure to financial institutions.
The majority of OIBM clients from Central region are small scale tobacco growers, therefore their cash flows are very seasonal, October to March are rainy months of low or no income.
Figure 1 presents results of index scores for OIBM clients from May 2010.19
19 MFO used the financial capability index with OIBM clients in Malawi as the first step in an impact assessment. The baseline of index scores will be compared with the endline of scores for a control and treatment group. For an additional discussion of this study see section on ‘How to Use the Index Scores’

The total sample size was 100 with 45 men and 55 women. The age range was from 18 to 70. The sample was taken from a peri-urban community and a rural community. The average score on the index was 21. On average women scored higher than men with a score of 22 for women and 20 for men. The figure presents average index scores for other sub-groups or socioeconomic characteristics such as age (e.g. younger than 20, 20-40, 40-60 and older than 60), education level (e.g. none, primary, secondary and post secondary) and main source of income over the past year (e.g. wage employment, salaried employment, self-employment, casual labor, unemployed, student).
Figure 1: Result of Index Scores for OIBM Clients – May 2010
Test Results for OIBM Clients May 2010
Men
N= 45
Average Index Score
Women
N = 55
Average Index Scores
Total
N = 100
Average Index Scores
Average Score 20 22 21
Age Group
>20 16 17 17
20-40 22 24 23
40-60 20 22 21
60+ 18 20 19
Completed Education Level
None XX XX XX
Primary 10 12 11
Secondary 16 17 17
Post Secondary 24 25 25
Geographic Location
Urban 22 22 22
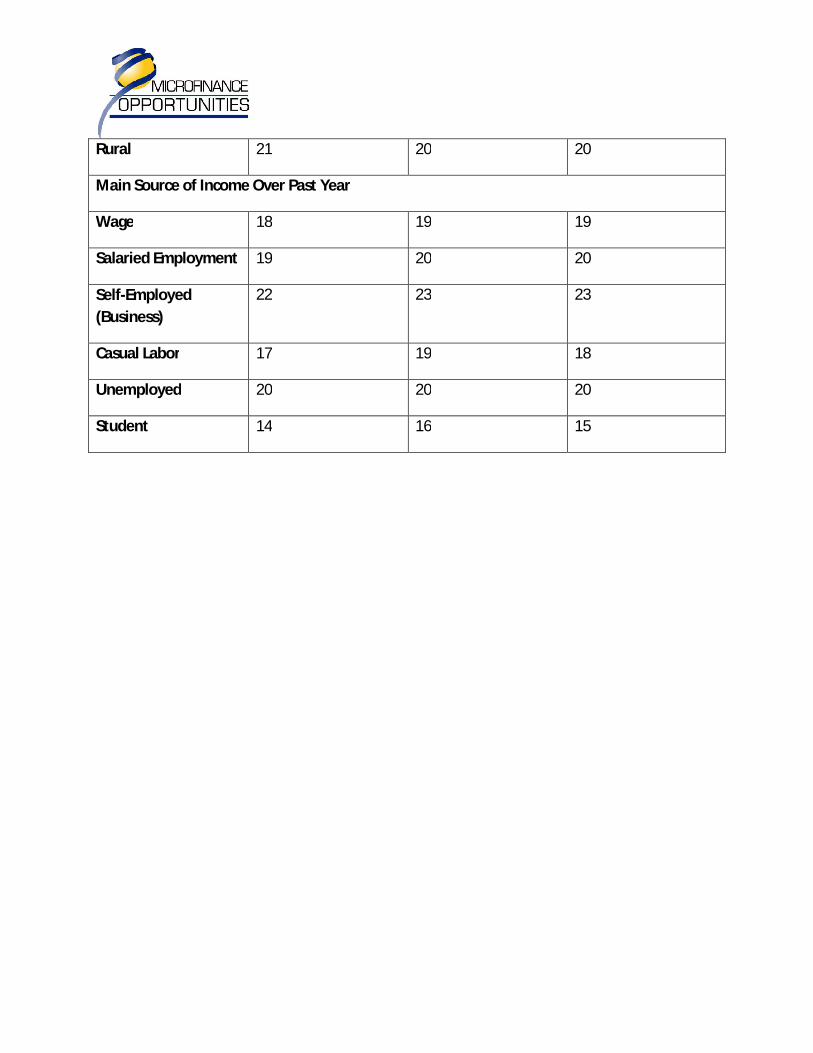
Rural 21 20 20
Main Source of Income Over Past Year
Wage 18 19 19
Salaried Employment 19 20 20
Self-Employed
(Business)
22 23 23
Casual Labor 17 19 18
Unemployed 20 20 20
Student 14 16 15

Analyzing the Results
I. Background After scoring the responses, the next step is to analyze the results. The web based platform provides a user friendly system to input, score and analyze the data generated by the ‘Financial Capability Index.’ For those who may not use the web based platform, an Excel template for scoring and analysis can be found in Annex XX.
Various levels of analysis of index scores can be made through the web based platform or Excel spreadsheet. The different types of analysis include the following:
1. Comparing scores of individual respondents 2. Comparing scores of sub-groups of survey respondents (e.g. by age, gender, geographic
location, etc.) 3. Comparing scores of clusters of questions (e.g. by financial education topic such as debt
management, savings, budgeting and financial services). 4. Comparing similar projects in different time periods 5. Comparing intervention and control group
II. Process for Analyzing Test Results through Excel spreadsheet
The process for analyzing test results through Excel includes the following steps:
1. Determine the type of analysis to perform based on project/program objectives (e.g. comparing projects, individual respondents, sub-groups of survey respondents, clusters of questions, intervention and control group)
2. Use ‘function key’ and ‘average’ and ‘median’ commands to calculate and compare mean and median scores for individual respondents or sub groups of respondents or other level of analysis
3. Use ‘function key’ and ‘Pearson’ command to determine correlations between total score and other socioeconomic characteristics
III. Process for Analyzing Test Results through Web Based Platform
The process for analyzing test results through the web based platform includes the following steps:

1. Determine the type of analysis to perform based on project/program objectives (e.g.
comparing projects, individual respondents, sub-groups of survey respondents, clusters of questions, intervention and control group)
2. Perform query through web-based platform 3. Examine output tables showing the range of scores, the means scores, and the median
scores 4. Evaluate project and respondent characteristics, answers to each question, aggregate
score, and sub-scores for up to 5 clusters of questions to be defined by MFO at various levels/queries.
5. Export tables to Excel, Access, text delimited file, Word or Power Point to perform own analysis if desired or necessary
IV. Index Results and Analysis from the Field
Figure 1 presents results of index scores for OIBM clients from May 2010.20 On average women scored higher than men with a score of 22 for women and 20 for men. One can conclude from this table that higher education, and self-employment can lead to higher financial capability scores. One can also include that those younger than 20 years old and students may have lower financial capabilities scores. The lower to middle age range of 20 – 40 years old scored higher than those younger than 20 years old and older than 40 years old. This could be directly related to fewer numbers of years since completion of education. There was no noticeable difference in scores for urban and rural population.
Figure 1: Result of Index Scores for OIBM Clients – May 2010
Test Results for OIBM Clients May 2010
Men
N= 45
Average Index Score
Women
N = 55
Average Index Scores
Total
N = 100
Average Index Scores
Average Score 20 22 21
Age Group
>20 16 17 17
20-40 22 24 23
20 MFO used the financial capability index with OIBM clients in Malawi as the first step in an impact assessment. The baseline of index scores will be compared with the endline of scores for a control and treatment group. For an additional discussion of this study see section on ‘How to Use the Index Scores’

40-60 20 22 21
60+ 18 20 19
Completed Education Level
None XX XX XX
Primary 10 12 11
Secondary 16 17 17
Post Secondary 24 25 25
Geographic Location
Urban 22 22 22
Rural 21 20 20
Main Source of Income Over Past Year
Wage 18 19 19
Salaried Employment 19 20 20
Self-Employed
(Business)
22 23 23
Casual Labor 17 19 18
Unemployed 20 20 20
Student 14 16 15
V. Interpreting Test Results
The data can be interpreted according to the type of analysis. For analysis of individual respondents, low, medium or high financial capabilities levels can be assigned to individual respondents based on the range of test scores identified below:

Range of Test Scores (out of 30 questions) 21 Level of Financial Capability
0 – 10 Low
10 – 20 Medium
20 – 30 High
Those with low to medium financial capabilities may be candidates for basic financial education, while people with higher financial capabilities scores may require financial education on more specialized topics such as remittances or microinsurance. The scores can be correlated with various socioeconomic characteristics or sub-groups of respondents (e.g. gender, age, occupation, geographic location, etc) through the web based platform or Excel spreadsheet. For example, you can determine if there is any relationship between mean or median score and gender, and if so whether the relationship is positive or negative. Or you can determine if there is any relationship between mean or median score and education level, and if so whether the relationship is positive or negative.
VI. How to Use the Index Scores
How you use the test scores depends on your organization’s initial objectives in using the index. There are three main objectives for using the index:
• As an assessment tool to measure financial capabilities across a population to identify priority target groups for a financial education program.
• As a design tool to prioritize content areas for a financial education program (e.g. saving, budgeting, debt management)
• As an evaluation tool to measure changes in financial capabilities over time The index results for individual respondent and sub-groups can be used as an assessment tool to help an organization identify whether there is a need for financial education within a specific community or within a particular sample of the existing client base. In designing a financial education program for a specific population, the index can yield data clustered in five main categories:
• budgeting/money management
• financial services
• savings
• debt management
• risk management
21
This assumes a total of 30 questions for the index. If questions have been added or removed to the generic index, the range of scores must be adjusted accordingly

If a target population scores lower in some areas than others, then an organization could choose to focus on these key problematic areas. This would ultimately impact the design of the financial education program or intervention. Once you have a financial education program in place, you can use the index to evaluate changes in financial capabilities with a particular target group. Similar projects can also be compared in different time periods. This will show whether or not financial capabilities increase over time as the type of intervention progresses and increases Examples of How Test Scores Can Be Used
A general model for effective use of the FCI is to administer it to a group exposed to a particular FE intervention of a pre- and post-exposure basis. Simultaneously, the index is administered to a comparison group, one which is not part of the FE program but matched to the exposed group on basic socioeconomic variables. The goal is to examine the relative change over time between participant and comparison groups—i.e. does the FE group become more financially capable, compared to the non-FE group? In Malawi, MFO is conducting an impact assessment over 2010-11 that employs this precise model. The study compares a sample of OIBM clients in Malawi receiving FE (participant group) and a sample not receiving FE (comparison group). The baseline of index scores will be compared with the endline of scores for both groups to assess relative differences over time. That same study employs a second methodology, the Financial Diaries, which tracks household income and expenses on a weekly basis to explore the processes that result in impact. The Diaries offers a unique “real-time” view on household financial management, capturing key moments when households implement a financial education lesson or insight. The FCI and the Diaries also work in a complementary fashion to deliver multifaceted insights on financial behavior. This is to say, the FCI focuses mostly on consumer knowledge, as well as reported behavior, while the Diaries focus on observed behavior, as it emerges in weekly transaction records. Hence the researchers can explore the interplay between knowledge and behavior, including how the two may correlate or diverge.

Annex A – How to Construct a Country Specific Index from Field Data
1. Data Recording
a. At the end of each meeting record the pile into which each household was sorted.
b. Also make sure that all pile statements are linked to a pile number.
c. Calculate the “ranking score” of each pile using the following calculation:
i. Count the number of piles = N
ii. Give the highest ranked pile the value N, and subsequent piles N-1, N-2 etc., with the last pile receiving a value of 1. Pile value = P
iii. Divide 100 by N = S
iv. Multiply P x S for each pile to get a ranking score for each pile, R, ranging from 100 to S
N = Number of piles
P = Pile value
N = highest ranked pile value
N-1 = next highest ranked pile value
N-2 = next highest ranked pile value
N-3 – next highest ranked pile value
N - …
1 = lowest ranked pile value
S (weight) = 100/N
R = Pile ranking score = P x S
2. Data Entry
a. Each field researcher will enter the following four sets of data in a spread sheet for each community in which they conduct an financial capability exercise:

i. General statements regarding financial management (General
Statements worksheet).
ii. Pile statements made about each pile, identifying the specific pile for each statement (Pile Statements worksheet).
1. There will be more than one statement per pile, so the pile ID data will have to be entered more than once for each pile.
iii. The pile ranking score for each pile (Pile Rankings worksheet).
iv. The three piles into which each household on the list was placed (Household Piles worksheet).
b. There will be separate worksheets in the Excel file for each of these data
i. Data from all three communities in which a field researcher has conducted a financial capability exercise will be entered in the same Excel file, so community identifiers will have to be entered for each entry in each worksheet.
Constructing an Index 1. Data coding
a. Code each general statement for each community according to various topics
i. Themes will emerge from the data (see examples from field work in Malawi below)
General Statements
Nice house
Invest in business
Invest in houses
Have enough money for a funeral
Do not experience food shortage
Pay school fees for children
Invest in livestock
Have a business
b. Code each pile statement under topics that emerged from the general statement coding. (see examples from previous field work in Malawi below)
Pile Statements
Provide support to others
Nice house
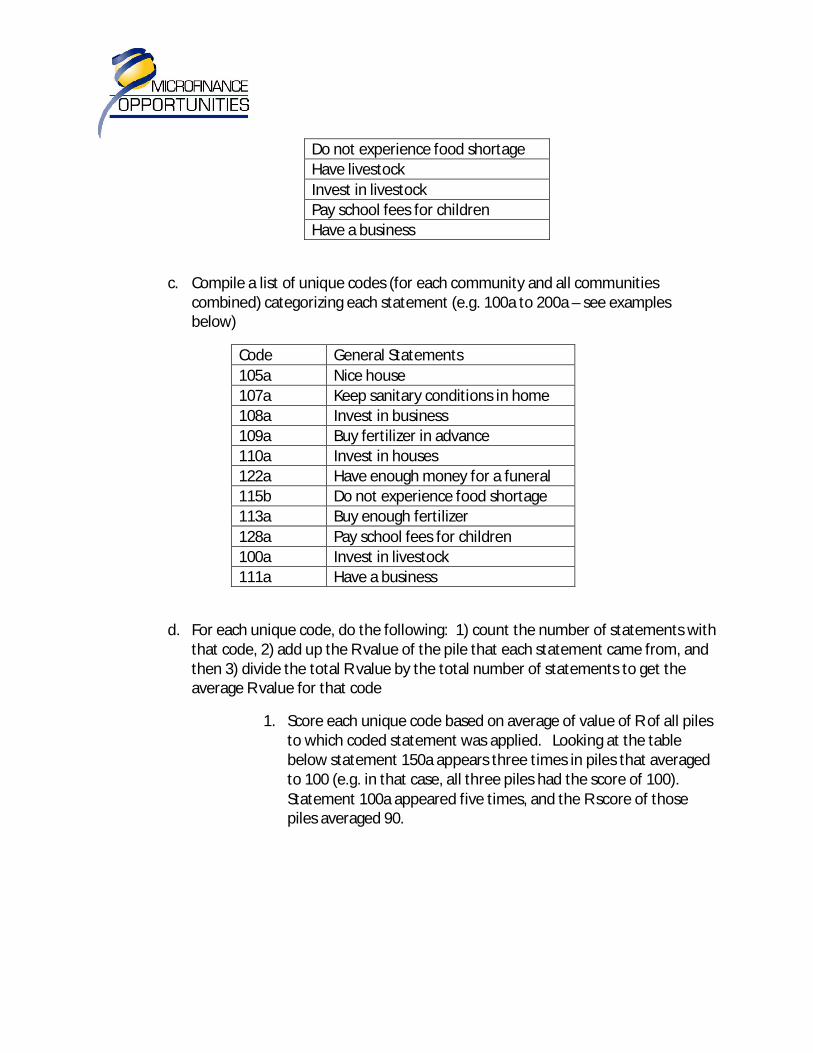
Do not experience food shortage
Have livestock
Invest in livestock
Pay school fees for children
Have a business
c. Compile a list of unique codes (for each community and all communities combined) categorizing each statement (e.g. 100a to 200a – see examples below)
Code General Statements
105a Nice house
107a Keep sanitary conditions in home
108a Invest in business
109a Buy fertilizer in advance
110a Invest in houses
122a Have enough money for a funeral
115b Do not experience food shortage
113a Buy enough fertilizer
128a Pay school fees for children
100a Invest in livestock
111a Have a business
d. For each unique code, do the following: 1) count the number of statements with that code, 2) add up the R value of the pile that each statement came from, and then 3) divide the total R value by the total number of statements to get the average R value for that code
1. Score each unique code based on average of value of R of all piles to which coded statement was applied. Looking at the table below statement 150a appears three times in piles that averaged to 100 (e.g. in that case, all three piles had the score of 100). Statement 100a appeared five times, and the R score of those piles averaged 90.
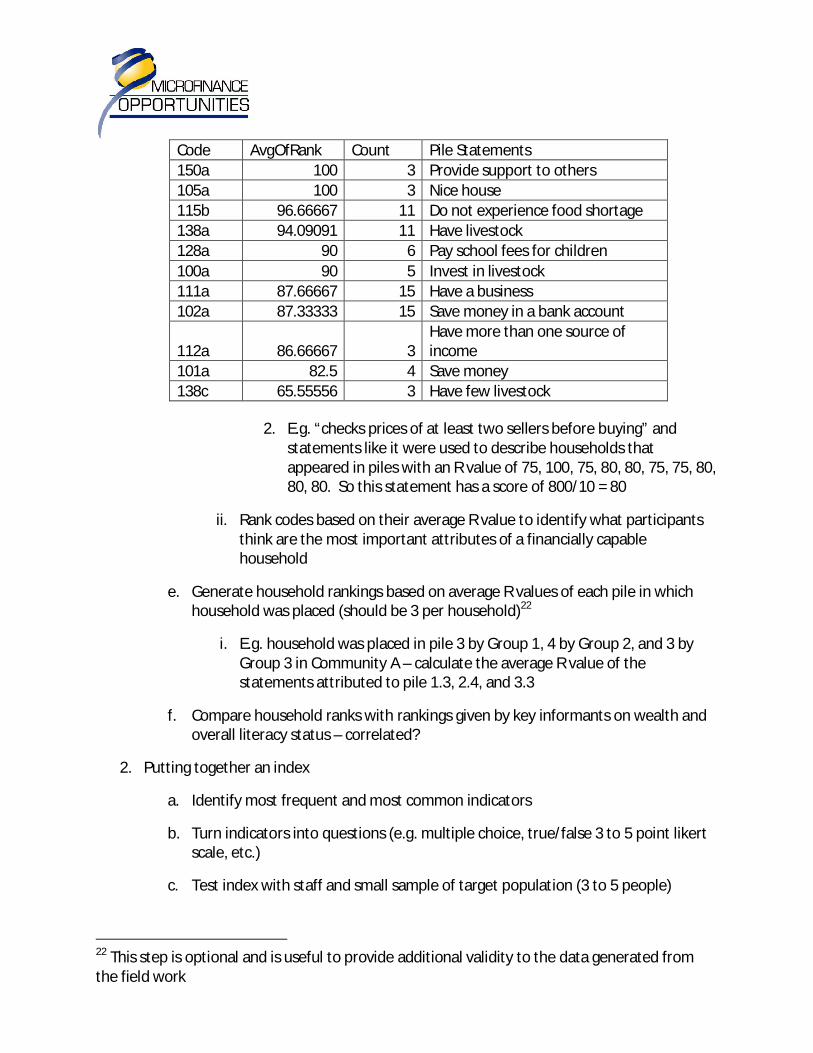
2. E.g. “checks prices of at least two sellers before buying” and statements like it were used to describe households that appeared in piles with an R value of 75, 100, 75, 80, 80, 75, 75, 80, 80, 80. So this statement has a score of 800/10 = 80
ii. Rank codes based on their average R value to identify what participants think are the most important attributes of a financially capable household
e. Generate household rankings based on average R values of each pile in which household was placed (should be 3 per household)22
i. E.g. household was placed in pile 3 by Group 1, 4 by Group 2, and 3 by Group 3 in Community A – calculate the average R value of the statements attributed to pile 1.3, 2.4, and 3.3
f. Compare household ranks with rankings given by key informants on wealth and overall literacy status – correlated?
2. Putting together an index
a. Identify most frequent and most common indicators
b. Turn indicators into questions (e.g. multiple choice, true/false 3 to 5 point likert scale, etc.)
c. Test index with staff and small sample of target population (3 to 5 people)
22 This step is optional and is useful to provide additional validity to the data generated from the field work
Code AvgOfRank Count Pile Statements
150a 100 3 Provide support to others
105a 100 3 Nice house
115b 96.66667 11 Do not experience food shortage
138a 94.09091 11 Have livestock
128a 90 6 Pay school fees for children
100a 90 5 Invest in livestock
111a 87.66667 15 Have a business
102a 87.33333 15 Save money in a bank account
112a 86.66667 3 Have more than one source of income
101a 82.5 4 Save money
138c 65.55556 3 Have few livestock

d. Modify index based on feedback gathered during pilot test

Annex B
Development of Country- Specific Index: Results from Malawi
I. Ranking of “general statements” in Malawi
Table 2 presents the most common and frequent statements generated during the general discussion about financial literacy.
Code General Statements Negative Positive AvgOfRank
105a Nice house 2 100
107a Keep sanitary conditions in home 3 100
108a Invest in business 6 100
109a Buy fertilizer in advance 6 100
110a Invest in houses 4 100
122a Have enough money for a funeral 4 100
115b Do not experience food shortage 11 96.66666667
113a Buy enough fertilizer 1 93.33333333
128a Pay school fees for children 4 90
100a Invest in livestock 10 90
111a Have a business 2 87.66666667
126a Husband and wife budget together 6 87.35294118
102a Save money in a bank account 9 87.33333333
112a Have more than one source of income 6 86.66666667
109b Do not buy fertilizer in advance 3 75
128b Does not pay school fees for children 3 60
111b Do not have a business 2 60
122b Rely on others to pay for a funeral 6 57.5
101b Do not save money 4 55
126b Husband and wife do not budget together 6 54.5
102b Do not save money in a bank account 8 49.21052632
113b Do not buy enough fertilizer 4 48.24074074
115a Experience food shortage 12 44.47916667
114a Does casual labor 2 44.44444444
134a Rely on community members to assist in case of emergency 1 32.5
125b Do not budget 3 31.94444444
116a Spend too much money on beer 8 31.9047619
133b Do not repay loans 2 26.25
135a Lazy 1 25
131b Do not have or buy basic household items 2 20
100b Does not invest in livestock 5 18.33333333
108b Does not invest in business 1 16.66666667

II. Results from Pile Statements
Table 1 presents the most common and frequent statements generated during the ranking exercise. Table 1 - Top-ranked “pile statements” in Malawi (those mentioned 1-2 times excluded)
Code AvgOfRank Count Pile Statements
150a 100 3 Provide support to others
109a 100 5 Buy fertilizer in advance
105a 100 3 Nice house
115b 96.66667 11 Do not experience food shortage
138a 94.09091 11 Have livestock
113a 93.33333 3 Buy enough fertilizer
128a 90 6 Pay school fees for children
100a 90 5 Invest in livestock
111a 87.66667 15 Have a business
126a 87.35294 17 Husband and wife budget together
102a 87.33333 15 Save money in a bank account
112a 86.66667 3 Have more than one source of income
101a 82.5 4 Save money
138c 65.55556 3 Have few livestock
140a 56.19048 7 Low income
126b 54.5 10 Husband and wife do not budget together
102b 49.21053 19 Do not save money in a bank account
113b 48.24074 18 Do not buy enough fertilizer
115a 44.47917 32 Experience food shortage
114a 44.44444 9 Does casual labor
138b 40 7 Do not have livestock
125b 31.94444 12 Do not budget
116a 31.90476 14 Spend too much money on beer
133b 26.25 4 Do not repay loans
149a 21.66667 3 Depend on others
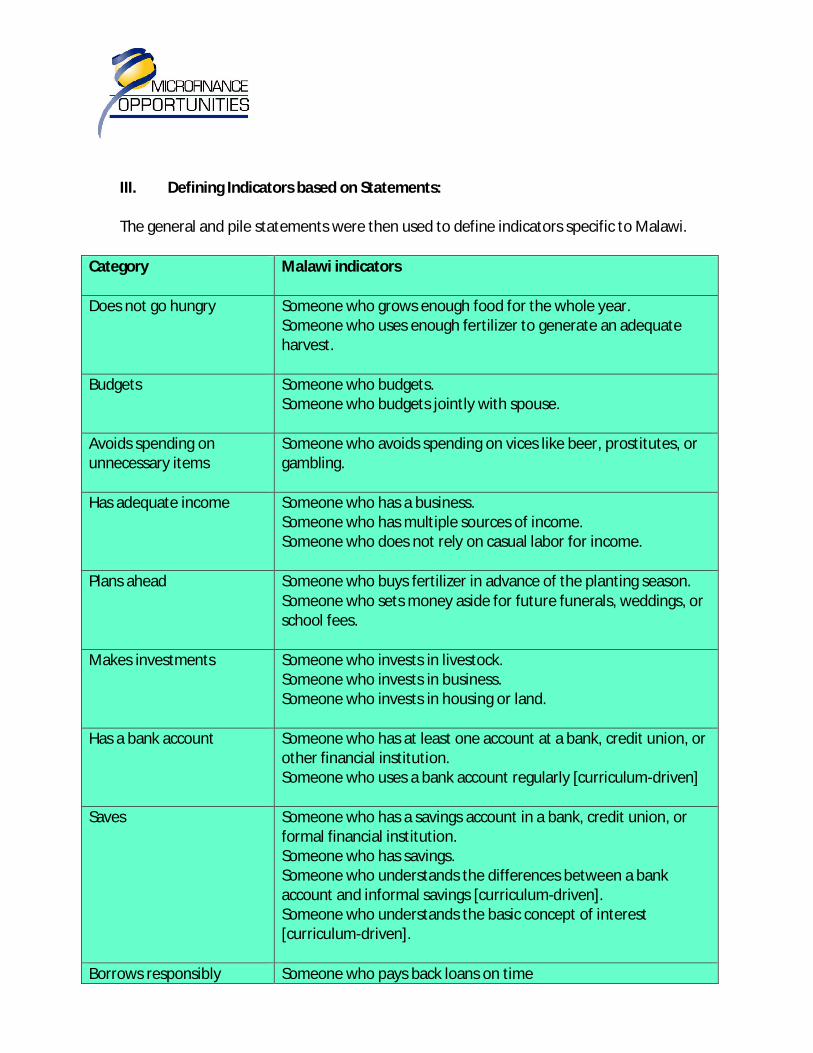
III. Defining Indicators based on Statements: The general and pile statements were then used to define indicators specific to Malawi.
Category Malawi indicators
Does not go hungry Someone who grows enough food for the whole year. Someone who uses enough fertilizer to generate an adequate harvest.
Budgets Someone who budgets. Someone who budgets jointly with spouse.
Avoids spending on unnecessary items
Someone who avoids spending on vices like beer, prostitutes, or gambling.
Has adequate income Someone who has a business. Someone who has multiple sources of income. Someone who does not rely on casual labor for income.
Plans ahead Someone who buys fertilizer in advance of the planting season. Someone who sets money aside for future funerals, weddings, or school fees.
Makes investments Someone who invests in livestock. Someone who invests in business. Someone who invests in housing or land.
Has a bank account Someone who has at least one account at a bank, credit union, or other financial institution. Someone who uses a bank account regularly [curriculum-driven]
Saves Someone who has a savings account in a bank, credit union, or formal financial institution. Someone who has savings. Someone who understands the differences between a bank account and informal savings [curriculum-driven]. Someone who understands the basic concept of interest [curriculum-driven].
Borrows responsibly Someone who pays back loans on time
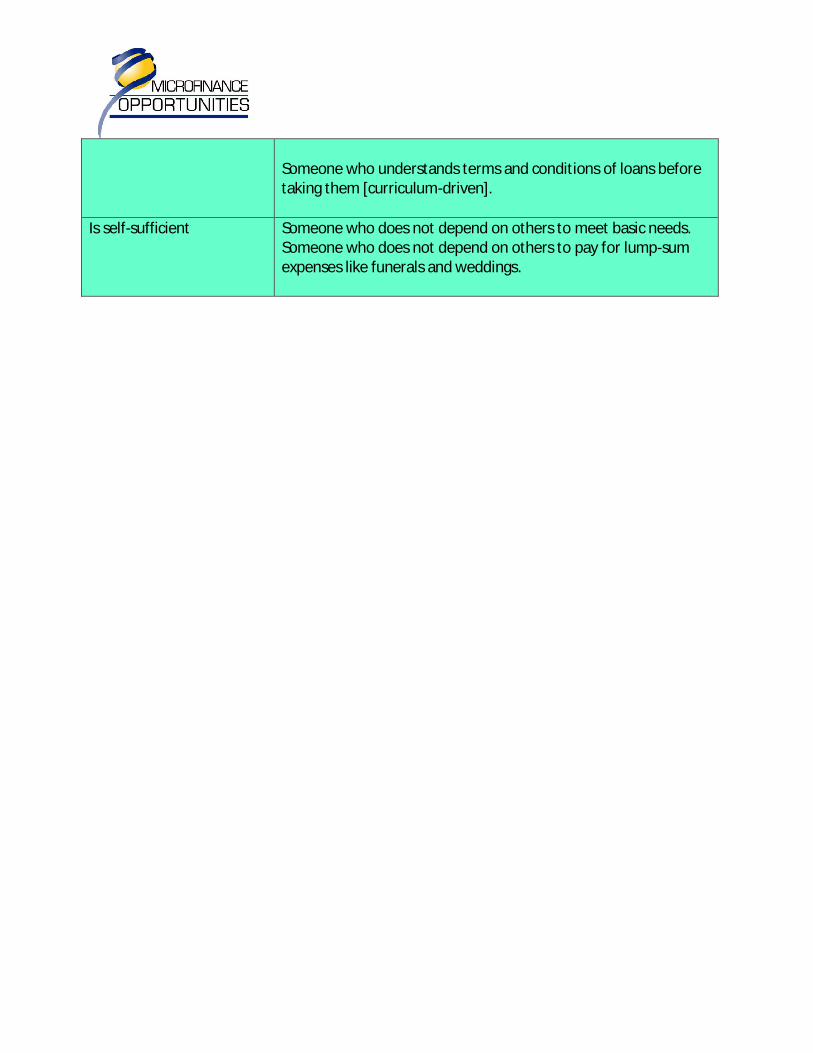
Someone who understands terms and conditions of loans before taking them [curriculum-driven].
Is self-sufficient Someone who does not depend on others to meet basic needs. Someone who does not depend on others to pay for lump-sum expenses like funerals and weddings.

IV. Developing the Malawi Questionnaire from Indicators23 Once the indicators were defined they were captured in a Malawi-specific index.
Question
Response
1 I will experience a food shortage if I don’t apply enough fertilizer to my garden.
a. True b. False
2 If I don’t buy fertilizer in advance of planting, I am more likely to experience a food shortage.
a. True b. False
3 A budget helps you keep track of how much money you spend.
a. True b. False
4 It’s not necessary for married couples to make a budget together.
a. True b. False
5 Think about a large expense that you had this past year such as a funeral or a wedding. How did you pay for the expense? [more than one response is OK] [Flag Question]
a. Used savings b. Borrowed money c. Used insurance d. Got money from friends or relatives e. Other f. Sold livestock g. Did not have a big unexpected expense
6 Let us assume that you have a big, unexpected expense such as a funeral. Assuming you have all these options, which options would be the best one to pay for this unexpected expense? [Flag Question]
a. Use savings b. Borrow money c. Use insurance d. Get money from friends or relatives e. Other f. Sell livestock
23 Compare to Index for generic index in Annex C

7 Do you have at least one account of any kind at a bank or formal financial institution?
a. Yes b. No
8 Do you have a savings account in a bank or other formal financial institution?
a. Yes b. No
9 In the past month, did you deposit money in this account? If you do not have a savings account, circle answer a: no account. [circle one]
a. No account b. no c. yes
10 Is it better to save in a bank account or to invest your money in livestock? [Flag Question]
a. bank account b. livestock
11 In which of the following have you invested in the last year? [Can have more than one answer (a)-(c)]
a. Business b. Houses c. Land d. None of the above
12 You are less likely to suffer a food shortage if you have multiple sources of income.
a. True b. False
13 How much money does your family need next month to avoid having a food shortage? [Do not give two points if both (a) and (b) apply]
a. _______ b. Have enough food stored c. I don’t know
14 Do you have enough saved (in cash and/or bank) to cover the cost of a funeral or a wedding, without suffering a food shortage?
a. Yes b. No
15 If you kept $100 in a savings account that earned 5% annual interest, how much would be in the account after one year?
a. less than $100 b. between $100 and $120 c. more than $120

16 Is it more expensive to borrow from a moneylender or from the bank?
a. moneylender b. bank
17 In the past year, have you asked for help from others to pay for the basic needs of my family such as food?
a. Yes b. No
18 In the past year, have you given money to others in my community who needed financial help?
a. Yes b. No
For each of the statements below, please indicate whether it describes you always, frequently, sometimes or never. [circle the response that best describes you]
Questions Response
19
I rely on casual labor to feed my family.
Always Frequently Sometimes Never
20
I keep track of how much money I spend each month
Always Frequently Sometimes Never
21
I hold off on selling my harvest to get the best price
Always Frequently Sometimes Never
22
I spend more money than I should on beer or gambling.
Always Frequently Sometimes Never
2 I had a food Always Frequently Sometimes Never

3 shortage in the last year.
24
It is OK to be late with your loan payments if you are having financial difficulties.
Agree Somewhat agree
Somewhat disagree
Disagree
25
I make spending decisions without consulting my spouse.
Always Frequently Sometimes Never
26
When school fees are due, I have enough money to pay for them.
Always Frequently Sometimes Never