Embed Size (px)
Citation preview

Financial and Operational Schedules & Non-GAAP ReconciliationsOctober 21ST, 2021

AT&T Inc.Financial Data
Consolidated Statements of IncomeDollars in millions except per share amountsUnaudited Third Quarter Percent Nine-Month Period Percent
2021 2020 Change 2021 2020 ChangeOperating Revenues
Service $ 34,843 $ 37,782 (7.8) % $ 112,303 $ 113,716 (1.2) %Equipment 5,079 4,558 11.4 % 15,603 12,353 26.3 %Total Operating Revenues 39,922 42,340 (5.7) % 127,906 126,069 1.5 %
Operating ExpensesCost of revenues
Equipment 5,427 4,552 19.2 % 16,324 12,622 29.3 %Broadcast, programming and operations 4,750 6,912 (31.3) % 19,891 19,555 1.7 %Other cost of revenues (exclusive of
depreciation and amortization shownseparately below) 7,649 8,375 (8.7) % 23,797 24,833 (4.2) %
Selling, general and administrative 9,207 9,266 (0.6) % 27,950 27,857 0.3 %Asset impairments and abandonments 161 73 — % 4,716 2,515 87.5 %Depreciation and amortization 5,619 7,030 (20.1) % 17,189 21,537 (20.2) %Total Operating Expenses 32,813 36,208 (9.4) % 109,867 108,919 0.9 %
Operating Income 7,109 6,132 15.9 % 18,039 17,150 5.2 %Interest Expense 1,667 1,972 (15.5) % 5,221 6,031 (13.4) %Equity in Net Income (Loss) of Affiliates 91 5 — % 184 (11) — %Other Income (Expense) — Net 2,279 (231) — % 7,499 1,589 — %Income Before Income Taxes 7,812 3,934 98.6 % 20,501 12,697 61.5 %Income Tax Expense 1,539 766 — % 4,412 3,003 46.9 %Net Income 6,273 3,168 98.0 % 16,089 9,694 66.0 %Less: Net Income Attributable to Noncontrolling Interest (355) (352) (0.9) % (1,051) (987) (6.5) %
Net Income Attributable to AT&T $ 5,918 $ 2,816 — % $ 15,038 $ 8,707 72.7 %Less: Preferred Stock Dividends (50) (54) 7.4 % (156) (138) (13.0) %Net Income Attributable to Common Stock $ 5,868 $ 2,762 — % $ 14,882 $ 8,569 73.7 %
Basic Earnings Per Share Attributable to Common Stock $ 0.82 $ 0.39 — % $ 2.07 $ 1.19 73.9 %
Weighted Average Common Shares Outstanding (000,000) 7,171 7,147 0.3 % 7,167 7,160 0.1 %
Diluted Earnings Per Share Attributable to Common Stock $ 0.82 $ 0.39 — % $ 2.07 $ 1.19 73.9 %
Weighted Average Common Shares Outstanding with Dilution (000,000) 7,202 7,173 0.4 % 7,197 7,186 0.2 %
1

AT&T Inc.Financial Data
Consolidated Balance SheetsDollars in millionsUnaudited Sep. 30, Dec. 31,
2021 2020AssetsCurrent AssetsCash and cash equivalents $ 21,270 $ 9,740 Accounts receivable – net of related allowances for credit loss of $806 and $1,221 16,304 20,215 Inventories 3,088 3,695 Prepaid and other current assets 16,568 18,358 Total current assets 57,230 52,008 Noncurrent Inventories and Theatrical Film and Television Production Costs 17,811 14,752 Property, Plant and Equipment – Net 124,419 127,315 Goodwill 133,663 135,259 Licenses – Net 112,423 93,840 Trademarks and Trade Names – Net 22,097 23,297 Distribution Networks – Net 12,408 13,793 Other Intangible Assets – Net 12,338 15,386 Investments in and Advances to Equity Affiliates 8,629 1,780 Operating Lease Right-Of-Use Assets 24,341 24,714 Other Assets 21,748 23,617 Total Assets $ 547,107 $ 525,761 Liabilities and Stockholders’ EquityCurrent LiabilitiesDebt maturing within one year $ 23,755 $ 3,470 Note payable to DIRECTV 1,180 — Accounts payable and accrued liabilities 47,926 50,051 Advanced billings and customer deposits 4,991 6,176 Dividends payable 3,749 3,741 Total current liabilities 81,601 63,438 Long-Term Debt 155,406 153,775 Deferred Credits and Other Noncurrent LiabilitiesDeferred income taxes 63,405 60,472 Postemployment benefit obligation 14,158 18,276 Operating lease liabilities 21,510 22,202 Other noncurrent liabilities 29,466 28,358 Noncurrent note payable to DIRECTV 258 — Total deferred credits and other noncurrent liabilities 128,797 129,308 Stockholders’ EquityPreferred stock — — Common stock 7,621 7,621 Additional paid-in capital 130,035 130,175 Retained earnings 41,091 37,457 Treasury stock (17,319) (17,910) Accumulated other comprehensive income 2,343 4,330 Noncontrolling interest 17,532 17,567 Total stockholders’ equity 181,303 179,240 Total Liabilities and Stockholders’ Equity $ 547,107 $ 525,761
2

AT&T Inc.Financial Data
Consolidated Statements of Cash FlowsDollars in millionsUnaudited Nine-Month Period
2021 2020Operating ActivitiesNet income $ 16,089 $ 9,694 Adjustments to reconcile net income to net cash provided by operating activities:
Depreciation and amortization 17,189 21,537 Amortization of film and television costs 8,421 6,448 Distributed (undistributed) earnings from investments in equity affiliates 102 108 Provision for uncollectible accounts 858 1,611 Deferred income tax expense 3,187 2,248 Net (gain) loss on investments, net of impairments (965) (689)Pension and postretirement benefit expense (credit) (2,870) (2,245) Actuarial (gain) loss on pension and postretirement benefits (3,021) 63 Asset impairments and abandonments 4,716 2,515
Changes in operating assets and liabilities:Receivables 57 2,321 Other current assets, inventories and theatrical film and television production costs (11,928) (7,836) Accounts payable and other accrued liabilities (2,254) (4,905) Equipment installment receivables and related sales 715 (148) Deferred customer contract acquisition and fulfillment costs 316 453
Postretirement claims and contributions (425) (409)Other - net 516 2,282 Total adjustments 14,614 23,354 Net Cash Provided by Operating Activities 30,703 33,048
Investing ActivitiesCapital expenditures (12,696) (13,283) Acquisitions, net of cash acquired (23,533) (1,215) Dispositions 9,086 428 Other - net (190) 344Net Cash Used in Investing Activities (27,333) (13,726)
Financing ActivitiesNet change in short-term borrowings with original maturities of three months or less 630 (17) Issuance of other short-term borrowings 17,476 9,440 Repayment of other short-term borrowings (2,448) (7,710) Issuance of long-term debt 9,931 31,987 Repayment of long-term debt (1,653) (37,583) Note payable to DIRECTV, net of payments of $361 1,439 — Payment of vendor financing (4,013) (1,965) Issuance of preferred stock — 3,869 Purchase of treasury stock (191) (5,483)Issuance of treasury stock 89 88 Issuance of preferred interests in subsidiaries — 1,979 Dividends paid (11,319) (11,215) Other - net (1,776) (5,158) Net Cash Provided by (Used in) Financing Activities 8,165 (21,768) Net increase (decrease) in cash and cash equivalents and restricted cash 11,535 (2,446) Cash and cash equivalents and restricted cash beginning of year 9,870 12,295 Cash and Cash Equivalents and Restricted Cash End of Period $ 21,405 $ 9,849
3

AT&T Inc.Consolidated Supplementary Data
Supplementary Financial DataDollars in millions except per share amountsUnaudited Third Quarter Percent Nine-Month Period Percent
2021 2020 Change 2021 2020 ChangeCapital expenditures
Purchase of property and equipment $ 4,666 $ 3,819 22.2 % $ 12,564 $ 13,191 (4.8) %Interest during construction - capital expenditures 38 32 18.8 % 132 92 43.5 %
Total Capital Expenditures $ 4,704 $ 3,851 22.2 % $ 12,696 $ 13,283 (4.4) %
Acquisition, net of cash acquiredBusiness acquisitions $ (26) $ 25 — % $ — $ 153 — %Spectrum acquisitions 131 16 — % 23,017 1,062 — %Interest during construction - spectrum 259 — — % 516 — — %
Total Acquisitions $ 364 $ 41 — % $ 23,533 $ 1,215 — %
Cash Paid for Programming and Produced Film/TV Content $ 4,766 $ 3,062 55.6 % $ 14,562 $ 10,281 41.6 %
Dividends Declared per Common Share $ 0.52 $ 0.52 — % $ 1.56 $ 1.56 — %
End of Period Common Shares Outstanding (000,000) 7,140 7,125 0.2 %Debt Ratio 49.7 % 44.9 % 480 BPTotal Employees 214,840 234,630 (8.4) %
4

COMMUNICATIONS SEGMENT
The Communications segment provides wireless and wireline telecom and broadband services to consumers located in the U.S. and businesses globally. The Communications segment contains three reporting units: Mobility, Business Wireline, and Consumer Wireline.
Results have been recast to remove the Video business, instead reporting those results in Corporate and Other.Segment Results
Dollars in millionsUnaudited Third Quarter Percent Nine-Month Period Percent
2021 2020 Change 2021 2020 ChangeSegment Operating Revenues
Mobility $ 19,138 $ 17,894 7.0 % $ 57,108 $ 52,445 8.9 %Business Wireline 5,938 6,261 (5.2) % 18,036 18,832 (4.2) %Consumer Wireline 3,142 3,040 3.4 % 9,380 9,202 1.9 %
Total Segment Operating Revenues 28,218 27,195 3.8 % 84,524 80,479 5.0 %
Segment Operating ContributionMobility 5,955 5,691 4.6 % 17,959 17,284 3.9 %Business Wireline 985 1,184 (16.8) % 3,093 3,567 (13.3) %Consumer Wireline 183 189 (3.2) % 776 1,102 (29.6) %
Total Segment Operating Contribution $ 7,123 $ 7,064 0.8 % $ 21,828 $ 21,953 (0.6) %
Supplementary Operating DataSubscribers and connections in thousandsUnaudited September 30, Percent
2021 2020 ChangeBroadband Connections
Broadband 15,050 14,761 2.0 %DSL 460 614 (25.1) %
Total Broadband Connections 15,510 15,375 0.9 %
Voice ConnectionsRetail Consumer Switched Access Lines 6,404 7,562 (15.3) %U-verse Consumer VoIP Connections 3,440 3,942 (12.7) %
Total Retail Voice Connections 9,844 11,504 (14.4) %
Third Quarter Percent Nine-Month Period Percent2021 2020 Change 2021 2020 Change
Broadband Net AdditionsBroadband 62 213 (70.9) % 232 102 — %DSL (33) (39) 15.4 % (106) (116) 8.6 %
Total Broadband Net Additions 29 174 (83.3) % 126 (14) — %
5

Mobility
Mobility provides nationwide wireless service and equipment.
Mobility ResultsDollars in millionsUnaudited Third Quarter Percent Nine-Month Period Percent
2021 2020 Change 2021 2020 ChangeOperating Revenues
Service $ 14,527 $ 13,883 4.6 % $ 42,921 $ 41,520 3.4 %Equipment 4,611 4,011 15.0 % 14,187 10,925 29.9 %
Total Operating Revenues 19,138 17,894 7.0 % 57,108 52,445 8.9 %
Operating ExpensesOperations and support 11,148 10,182 9.5 % 33,077 29,083 13.7 %Depreciation and amortization 2,035 2,021 0.7 % 6,072 6,078 (0.1) %
Total Operating Expenses 13,183 12,203 8.0 % 39,149 35,161 11.3 %Operating Income 5,955 5,691 4.6 % 17,959 17,284 3.9 %Equity in Net Income (Loss) of Affiliates — — — % — — — %Operating Contribution $ 5,955 $ 5,691 4.6 % $ 17,959 $ 17,284 3.9 %
Operating Income Margin 31.1 % 31.8 % (70) BP 31.4 % 33.0 % (160) BP
Supplementary Operating DataSubscribers and connections in thousandsUnaudited September 30, Percent
2021 2020 ChangeMobility Subscribers
Postpaid 80,249 75,969 5.6 %Postpaid phone 66,396 63,485 4.6 %
Prepaid 19,028 18,100 5.1 %Reseller 6,263 6,708 (6.6) %Connected Devices 90,979 75,967 19.8 %
Total Mobility Subscribers 196,519 176,744 11.2 %
Third Quarter Percent Nine-Month Period Percent2021 2020 Change 2021 2020 Change
Mobility Net AdditionsPostpaid Phone Net Additions 928 645 43.9 % 2,312 657 — %Total Phone Net Additions 1,177 776 51.7 % 2,942 880 — %
Postpaid 1,218 1,081 12.7 % 3,197 954 — %Prepaid 351 245 43.3 % 927 365 — %Reseller (164) (4) — % (357) (252) (41.7) %Connected Devices 3,468 4,203 (17.5) % 10,194 9,976 2.2 %
Total Mobility Net Additions 4,873 5,525 (11.8) % 13,961 11,043 26.4 %
Postpaid Churn 0.92 % 0.85 % 7 BP 0.91 % 0.99 % (8) BPPostpaid Phone-Only Churn 0.72 % 0.69 % 3 BP 0.72 % 0.80 % (8) BP
6

Business Wireline
Business Wireline provides advanced IP-based services, as well as traditional data services to business customers.
Results have been recast to characterize revenues as either service or equipment, consistent with the way we are managing the business unit.
Business Wireline ResultsDollars in millionsUnaudited Third Quarter Percent Nine-Month Period Percent
2021 2020 Change 2021 2020 ChangeOperating Revenues
Service $ 5,765 $ 6,079 (5.2) % $ 17,497 $ 18,271 (4.2) %Equipment 173 182 (4.9) % 539 561 (3.9) %
Total Operating Revenues 5,938 6,261 (5.2) % 18,036 18,832 (4.2) %
Operating ExpensesOperations and support 3,649 3,764 (3.1) % 11,068 11,365 (2.6) %Depreciation and amortization 1,304 1,313 (0.7) % 3,875 3,900 (0.6) %
Total Operating Expenses 4,953 5,077 (2.4) % 14,943 15,265 (2.1) %Operating Income 985 1,184 (16.8) % 3,093 3,567 (13.3) %Equity in Net Income (Loss) of Affiliates — — — % — — — %Operating Contribution $ 985 $ 1,184 (16.8) % $ 3,093 $ 3,567 (13.3) %
Operating Income Margin 16.6 % 18.9 % (230) BP 17.1 % 18.9 % (180) BP
7

Consumer Wireline
Consumer Wireline provides broadband, including fiber, and voice communication services primarily to residential customers.
Results have been recast to refine the allocation of shared infrastructure and deferred customer acquisition costs between Consumer Wireline and Video.
Consumer Wireline ResultsDollars in millionsUnaudited Third Quarter Percent Nine-Month Period Percent
2021 2020 Change 2021 2020 ChangeOperating Revenues
Broadband $ 2,290 $ 2,128 7.6 % $ 6,761 $ 6,329 6.8 %Legacy voice and data services 484 538 (10.0) % 1,507 1,679 (10.2) %Other service and equipment 368 374 (1.6) % 1,112 1,194 (6.9) %Total Operating Revenues 3,142 3,040 3.4 % 9,380 9,202 1.9 %
Operating ExpensesOperations and support 2,184 2,117 3.2 % 6,298 5,924 6.3 %Depreciation and amortization 775 734 5.6 % 2,306 2,176 6.0 %
Total Operating Expenses 2,959 2,851 3.8 % 8,604 8,100 6.2 %Operating Income 183 189 (3.2) % 776 1,102 (29.6) %Equity in Net Income (Loss) of Affiliates — — — % — — — %Operating Contribution $ 183 $ 189 (3.2) % $ 776 $ 1,102 (29.6) %
Operating Income Margin 5.8 % 6.2 % (40) BP 8.3 % 12.0 % (370) BP
Supplementary Operating DataSubscribers and connections in thousandsUnaudited September 30, Percent
2021 2020 ChangeBroadband ConnectionsTotal Broadband and DSL Connections 14,180 14,102 0.6 %
Fiber Broadband Connections 5,721 4,678 22.3 %
Voice ConnectionsRetail Consumer Switched Access Lines 2,527 2,977 (15.1) %U-verse Consumer VoIP Connections 2,843 3,361 (15.4) %
Total Retail Consumer Voice Connections 5,370 6,338 (15.3) %
Third Quarter Percent Nine-Month Period Percent2021 2020 Change 2021 2020 Change
Broadband Net AdditionsTotal Broadband and DSL Net Additions 6 158 (96.2) % 80 (17) — %
Fiber Broadband Net Additions 289 357 (19.0) % 770 791 (2.7) %
8
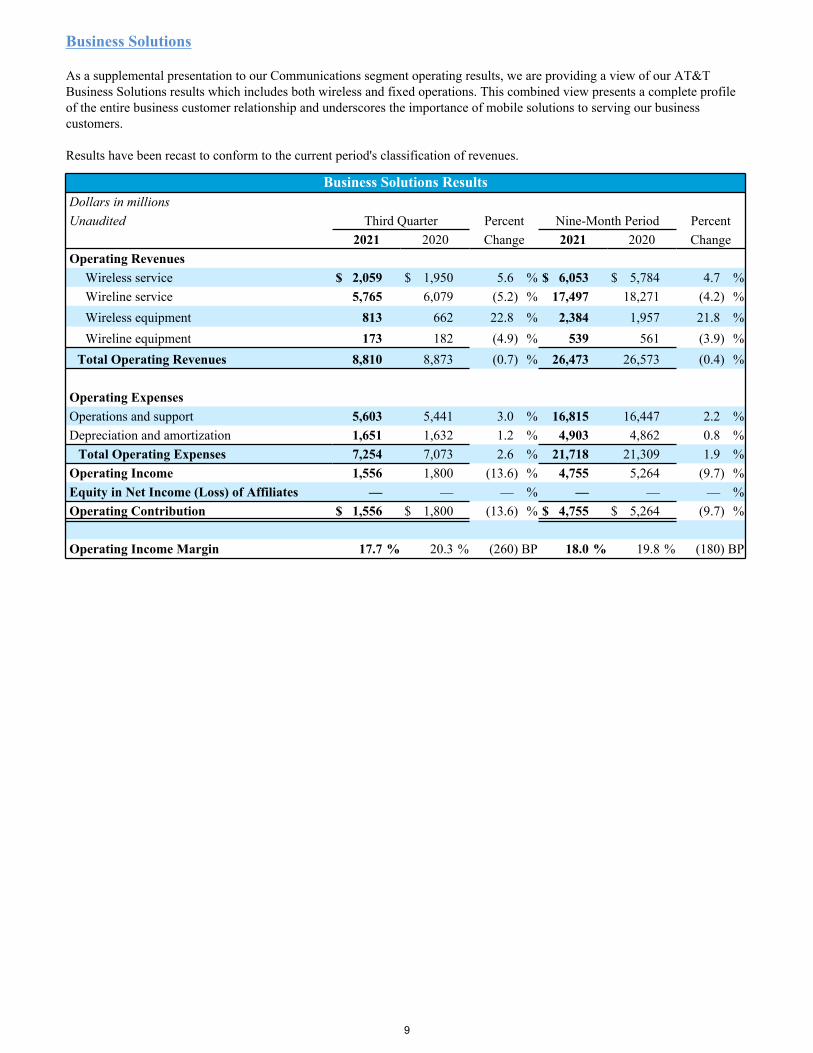
Business Solutions
As a supplemental presentation to our Communications segment operating results, we are providing a view of our AT&T Business Solutions results which includes both wireless and fixed operations. This combined view presents a complete profile of the entire business customer relationship and underscores the importance of mobile solutions to serving our business customers.
Results have been recast to conform to the current period's classification of revenues.
Business Solutions ResultsDollars in millionsUnaudited Third Quarter Percent Nine-Month Period Percent
2021 2020 Change 2021 2020 ChangeOperating Revenues
Wireless service $ 2,059 $ 1,950 5.6 % $ 6,053 $ 5,784 4.7 %Wireline service 5,765 6,079 (5.2) % 17,497 18,271 (4.2) %Wireless equipment 813 662 22.8 % 2,384 1,957 21.8 %Wireline equipment 173 182 (4.9) % 539 561 (3.9) %
Total Operating Revenues 8,810 8,873 (0.7) % 26,473 26,573 (0.4) %
Operating ExpensesOperations and support 5,603 5,441 3.0 % 16,815 16,447 2.2 %Depreciation and amortization 1,651 1,632 1.2 % 4,903 4,862 0.8 %
Total Operating Expenses 7,254 7,073 2.6 % 21,718 21,309 1.9 %Operating Income 1,556 1,800 (13.6) % 4,755 5,264 (9.7) %Equity in Net Income (Loss) of Affiliates — — — % — — — %Operating Contribution $ 1,556 $ 1,800 (13.6) % $ 4,755 $ 5,264 (9.7) %
Operating Income Margin 17.7 % 20.3 % (260) BP 18.0 % 19.8 % (180) BP
9

WARNERMEDIA SEGMENT
The WarnerMedia segment develops, produces and distributes feature films, television, gaming and other content in various physical and digital formats globally. WarnerMedia content is distributed through basic networks, Direct-to-Consumer (DTC) or theatrical, TV content and games licensing. Segment results also include Xandr advertising and Otter Media Holdings. Additional information is provided as part of the earnings material on the company’s Investor Relations website.
Segment ResultsDollars in millionsUnaudited Third Quarter Percent Nine-Month Period Percent
2021 2020 Change 2021 2020 ChangeSegment Operating Revenues
Subscription $ 3,988 $ 3,477 14.7 % $ 11,779 $ 10,142 16.1 %Content and other 3,053 2,318 31.7 % 9,103 7,510 21.2 %Advertising 1,401 1,600 (12.4) % 4,877 4,236 15.1 %
Total Segment Operating Revenues 8,442 7,395 14.2 % 25,759 21,888 17.7 %
Direct CostsProgramming 3,068 3,181 (3.6) % 10,996 8,638 27.3 %Marketing 1,096 655 67.3 % 2,929 1,750 67.4 %Other 932 734 27.0 % 2,599 2,329 11.6 %
General and administrative 1,175 913 28.7 % 3,084 3,027 1.9 %Depreciation and amortization 163 169 (3.6) % 491 494 (0.6) %Total Operating Expenses 6,434 5,652 13.8 % 20,099 16,238 23.8 %Operating Income 2,008 1,743 15.2 % 5,660 5,650 0.2 %Equity in Net Income (Loss) of Affiliates (73) 12 — % 44 31 41.9 %
Total Segment Operating Contribution $ 1,935 $ 1,755 10.3 % $ 5,704 $ 5,681 0.4 %
10

LATIN AMERICA SEGMENT
The Latin America segment provides entertainment and wireless service outside of the U.S. Our international subsidiaries conduct business in their local currency and operating results are converted to U.S. dollars using official exchange rates. The Latin America segment contains two business units: Vrio and Mexico.
Segment ResultsDollars in millionsUnaudited Third Quarter Percent Nine-Month Period Percent
2021 2020 Change 2021 2020 ChangeSegment Operating Revenues
Vrio $ 756 $ 753 0.4 % $ 2,248 $ 2,392 (6.0) %Mexico 724 643 12.6 % 2,043 1,826 11.9 %
Total Segment Operating Revenues 1,480 1,396 6.0 % 4,291 4,218 1.7 %
Segment Operating ContributionVrio 105 (34) — % 43 (101) — %Mexico (130) (143) 9.1 % (393) (461) 14.8 %
Total Segment Operating Contribution $ (25) $ (177) 85.9 % $ (350) $ (562) 37.7 %
Vrio
Vrio provides entertainment services to customers utilizing satellite technology in Latin America and the Caribbean. We agreed to sell our Vrio business and applied held-for-sale accounting in the second quarter of 2021.
Vrio ResultsDollars in millionsUnaudited Third Quarter Percent Nine-Month Period Percent
2021 2020 Change 2021 2020 ChangeOperating Revenues $ 756 $ 753 0.4 % $ 2,248 $ 2,392 (6.0) %
Operating ExpensesOperations and support 660 675 (2.2) % 1,981 2,119 (6.5) %Depreciation and amortization — 126 — % 231 400 (42.3) %
Total Operating Expenses 660 801 (17.6) % 2,212 2,519 (12.2) %Operating Income (Loss) 96 (48) — % 36 (127) — %Equity in Net Income (Loss) of Affiliates 9 14 (35.7) % 7 26 (73.1) %Operating Contribution $ 105 $ (34) — % $ 43 $ (101) — %
Operating Income Margin 12.7 % (6.4) % 1,910 BP 1.6 % (5.3) % 690 BP
Supplementary Operating DataSubscribers and connections in thousandsUnaudited September 30, Percent
2021 2020 ChangeVrio Video Subscribers 10,142 10,893 (6.9) %
Third Quarter Percent Nine-Month Period Percent2021 2020 Change 2021 2020 Change
Vrio Video Net Additions (178) 229 — % (800) (197) — %
11
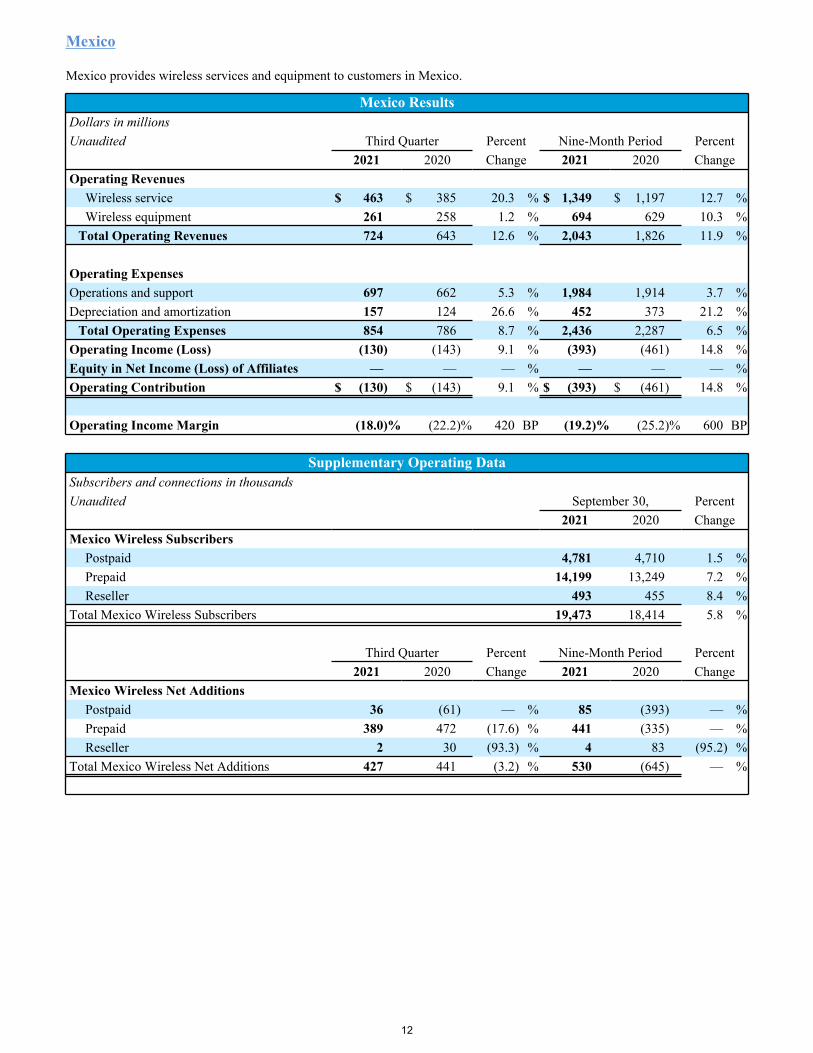
Mexico
Mexico provides wireless services and equipment to customers in Mexico.
Mexico ResultsDollars in millionsUnaudited Third Quarter Percent Nine-Month Period Percent
2021 2020 Change 2021 2020 ChangeOperating Revenues
Wireless service $ 463 $ 385 20.3 % $ 1,349 $ 1,197 12.7 %Wireless equipment 261 258 1.2 % 694 629 10.3 %
Total Operating Revenues 724 643 12.6 % 2,043 1,826 11.9 %
Operating ExpensesOperations and support 697 662 5.3 % 1,984 1,914 3.7 %Depreciation and amortization 157 124 26.6 % 452 373 21.2 %
Total Operating Expenses 854 786 8.7 % 2,436 2,287 6.5 %Operating Income (Loss) (130) (143) 9.1 % (393) (461) 14.8 %Equity in Net Income (Loss) of Affiliates — — — % — — — %Operating Contribution $ (130) $ (143) 9.1 % $ (393) $ (461) 14.8 %
Operating Income Margin (18.0) % (22.2) % 420 BP (19.2) % (25.2) % 600 BP
Supplementary Operating DataSubscribers and connections in thousandsUnaudited September 30, Percent
2021 2020 ChangeMexico Wireless Subscribers
Postpaid 4,781 4,710 1.5 %Prepaid 14,199 13,249 7.2 %Reseller 493 455 8.4 %
Total Mexico Wireless Subscribers 19,473 18,414 5.8 %
Third Quarter Percent Nine-Month Period Percent2021 2020 Change 2021 2020 Change
Mexico Wireless Net AdditionsPostpaid 36 (61) — % 85 (393) — %Prepaid 389 472 (17.6) % 441 (335) — %Reseller 2 30 (93.3) % 4 83 (95.2) %
Total Mexico Wireless Net Additions 427 441 (3.2) % 530 (645) — %
12

SUPPLEMENTAL SEGMENT RECONCILIATION
September 30, 2021
Revenues
Operationsand Support
Expenses EBITDA
Depreciationand
Amortization
OperatingIncome (Loss)
Equity in Net
Income (Loss) ofAffiliates
SegmentContribution
CommunicationsMobility $ 19,138 $ 11,148 $ 7,990 $ 2,035 $ 5,955 $ — $ 5,955 Business Wireline 5,938 3,649 2,289 1,304 985 — 985 Consumer Wireline 3,142 2,184 958 775 183 — 183
Total Communications 28,218 16,981 11,237 4,114 7,123 — 7,123 WarnerMedia 8,442 6,271 2,171 163 2,008 (73) 1,935Latin America
Vrio 756 660 96 — 96 9 105 Mexico 724 697 27 157 (130) — (130)
Total Latin America 1,480 1,357 123 157 (34) 9 (25) Segment Total 38,140 24,609 13,531 4,434 9,097 $ (64) $ 9,033 Corporate and Other
Corporate 278 1,109 (831) 129 (960) Video 2,149 1,731 418 44 374 Acquisition-related items — 130 (130) 1,012 (1,142) Certain significant items — 161 (161) — (161)
Eliminations and consolidations (645) (546) (99) — (99)
AT&T Inc. $ 39,922 $ 27,194 $ 12,728 $ 5,619 $ 7,109
Three Months EndedDollars in millionsUnaudited
13

September 30, 2020
Revenues
Operations and Support
Expenses EBITDA
Depreciation and
Amortization
Operating Income (Loss)
Equity in Net
Income (Loss) ofAffiliates
Segment Contribution
CommunicationsMobility $ 17,894 $ 10,182 $ 7,712 $ 2,021 $ 5,691 $ — $ 5,691 Business Wireline 6,261 3,764 2,497 1,313 1,184 — 1,184 Consumer Wireline 3,040 2,117 923 734 189 — 189
Total Communications 27,195 16,063 11,132 4,068 7,064 — 7,064 WarnerMedia 7,395 5,483 1,912 169 1,743 12 1,755 Latin America
Vrio 753 675 78 126 (48) 14 (34) Mexico 643 662 (19) 124 (143) — (143)
Total Latin America 1,396 1,337 59 250 (191) 14 (177) Segment Total 35,986 22,883 13,103 4,487 8,616 $ 26 $ 8,642 Corporate and Other
Corporate 628 1,175 (547) 65 (612) Video 7,014 5,887 1,127 557 570 Acquisition-related items — 38 (38) 1,921 (1,959) Certain significant items — 113 (113) — (113)
Eliminations andconsolidations (1,288) (918) (370) — (370)
AT&T Inc. $ 42,340 $ 29,178 $ 13,162 $ 7,030 $ 6,132
Three Months EndedDollars in millionsUnaudited
14

SUPPLEMENTAL SEGMENT RECONCILIATION
September 30, 2021
Revenues
Operationsand Support
Expenses EBITDA
Depreciationand
Amortization
OperatingIncome (Loss)
Equity in Net
Income (Loss) ofAffiliates
SegmentContribution
CommunicationsMobility $ 57,108 $ 33,077 $ 24,031 $ 6,072 $ 17,959 $ — $ 17,959 Business Wireline 18,036 11,068 6,968 3,875 3,093 — 3,093 Consumer Wireline 9,380 6,298 3,082 2,306 776 — 776
Total Communications 84,524 50,443 34,081 12,253 21,828 — 21,828 WarnerMedia 25,759 19,608 6,151 491 5,660 44 5,704 Latin America
Vrio 2,248 1,981 267 231 36 7 43 Mexico 2,043 1,984 59 452 (393) — (393)
Total Latin America 4,291 3,965 326 683 (357) 7 (350) Segment Total 114,574 74,016 40,558 13,427 27,131 $ 51 $ 27,182 Corporate and Other
Corporate 1,065 3,482 (2,417) 194 (2,611) Video 15,513 12,666 2,847 356 2,491 Acquisition-related items — 167 (167) 3,212 (3,379) Certain significant items — 4,773 (4,773) — (4,773)
Eliminations andconsolidations (3,246) (2,426) (820) — (820)
AT&T Inc. $ 127,906 $ 92,678 $ 35,228 $ 17,189 $ 18,039
Nine Months EndedDollars in millionsUnaudited
15

September 30, 2020
Revenues
Operations and Support
Expenses EBITDA
Depreciation and
Amortization
Operating Income (Loss)
Equity in Net
Income (Loss) ofAffiliates
Segment Contribution
CommunicationsMobility $ 52,445 $ 29,083 $ 23,362 $ 6,078 $ 17,284 $ — $ 17,284 Business Wireline 18,832 11,365 7,467 3,900 3,567 — 3,567 Consumer Wireline 9,202 5,924 3,278 2,176 1,102 — 1,102
Total Communications 80,479 46,372 34,107 12,154 21,953 — 21,953 WarnerMedia 21,888 15,744 6,144 494 5,650 31 5,681 Latin America
Vrio 2,392 2,119 273 400 (127) 26 (101) Mexico 1,826 1,914 (88) 373 (461) — (461)
Total Latin America 4,218 4,033 185 773 (588) 26 (562) Segment Total 106,585 66,149 40,436 13,421 27,015 $ 57 $ 27,072 Corporate and Other
Corporate 1,751 3,256 (1,505) 254 (1,759) Video 21,442 17,716 3,726 1,741 1,985 Acquisition-related items — 431 (431) 6,122 (6,553) Certain significant items — 2,539 (2,539) — (2,539)
Eliminations andconsolidations (3,709) (2,709) (1,000) (1) (999)
AT&T Inc. $ 126,069 $ 87,382 $ 38,687 $ 21,537 $ 17,150
Nine Months EndedDollars in millionsUnaudited
16

Discussion and Reconciliation of Non-GAAP Measures
We believe the following measures are relevant and useful information to investors as they are part of AT&T's internal management reporting and planning processes and are important metrics that management uses to evaluate the operating performance of AT&T and its segments. Management also uses these measures as a method of comparing performance with that of many of our competitors. These measures should be considered in addition to, but not as a substitute for, other measures of financial performance reported in accordance with U.S. generally accepted accounting principles (GAAP).
Free Cash Flow
Free cash flow is defined as cash from operations and cash distributions from DIRECTV classified as investing activities minus capital expenditures. Free cash flow after dividends is defined as cash from operations minus capital expenditures and dividends on common and preferred shares. Free cash flow dividend payout ratio is defined as the percentage of dividends paid on common and preferred shares to free cash flow. We believe these metrics provide useful information to our investors because management views free cash flow as an important indicator of how much cash is generated by routine business operations, including capital expenditures, and from our continued economic interest in the U.S. video operations as part of our DIRECTV equity method investment, and makes decisions based on it. Management also views free cash flow as a measure of cash available to pay debt and return cash to shareowners.
Free Cash Flow and Free Cash Flow Dividend Payout RatioDollars in millions
Third Quarter Nine-Month Period2021 2020 2021 2020
Net cash provided by operating activities1 $ 9,866 $ 12,123 $ 30,703 $ 33,048 Add: Distributions from DIRECTV classified as investing
activities — — — — Less: Capital expenditures (4,704) (3,851) (12,696) (13,283) Free Cash Flow 5,162 8,272 18,007 19,765
Less: Dividends paid (3,748) (3,741) (11,319) (11,215) Free Cash Flow after Dividends $ 1,414 $ 4,531 $ 6,688 $ 8,550 Free Cash Flow Dividend Payout Ratio 72.6 % 45.2 % 62.9 % 56.7 %1 Includes distributions from DIRECTV of $130 in the third quarter and for the nine months ended September 30, 2021.
Cash Paid for Capital Investment
In connection with capital improvements, we negotiate with some of our vendors to obtain favorable payment terms of 120 days or more, referred to as vendor financing, which are excluded from capital expenditures and reported in accordance with GAAP as financing activities. We present an additional view of cash paid for capital investment to provide investors with a comprehensive view of cash used to invest in our networks, product developments and support systems.
Cash Paid for Capital InvestmentDollars in millions
Third Quarter Nine-Month Period2021 2020 2021 2020
Capital Expenditures $ (4,704) $ (3,851) $ (12,696) $ (13,283) Cash paid for vendor financing (1,019) (611) (4,013) (1,965) Cash paid for Capital Investment $ (5,723) $ (4,462) $ (16,709) $ (15,248) FirstNet reimbursement — (64) — (143) Gross Capital Investment $ (5,723) $ (4,526) $ (16,709) $ (15,391)
17

EBITDA
Our calculation of EBITDA, as presented, may differ from similarly titled measures reported by other companies. For AT&T, EBITDA excludes other income (expense) – net, and equity in net income (loss) of affiliates, as these do not reflect the operating results of our subscriber base or operations that are not under our control. Equity in net income (loss) of affiliates represents the proportionate share of the net income (loss) of affiliates in which we exercise significant influence, but do not control. Because we do not control these entities, management excludes these results when evaluating the performance of our primary operations. EBITDA also excludes interest expense and the provision for income taxes. Excluding these items eliminates the expenses associated with our capital and tax structures. Finally, EBITDA excludes depreciation and amortization in order to eliminate the impact of capital investments. EBITDA does not give effect to cash used for debt service requirements and thus does not reflect available funds for distributions, reinvestment or other discretionary uses. EBITDA is not presented as an alternative measure of operating results or cash flows from operations, as determined in accordance with GAAP.
EBITDA service margin is calculated as EBITDA divided by service revenues.
When discussing our segment, business unit and supplemental results, EBITDA excludes equity in net income (loss) of affiliates, and depreciation and amortization from operating contribution.
These measures are used by management as a gauge of our success in acquiring, retaining and servicing subscribers because we believe these measures reflect AT&T's ability to generate and grow subscriber revenues while providing a high level of customer service in a cost-effective manner. Management also uses these measures as a method of comparing operating performance with that of many of its competitors. The financial and operating metrics which affect EBITDA include the key revenue and expense drivers for which management is responsible and upon which we evaluate performance.
We believe EBITDA Service Margin (EBITDA as a percentage of service revenues) to be a more relevant measure than EBITDA Margin (EBITDA as a percentage of total revenue) for our Mobility business unit operating margin. We also use wireless service revenues to calculate margin to facilitate comparison, both internally and externally with our wireless competitors, as they calculate their margins using wireless service revenues as well.
There are material limitations to using these non-GAAP financial measures. EBITDA, EBITDA margin and EBITDA service margin, as we have defined them, may not be comparable to similarly titled measures reported by other companies. Furthermore, these performance measures do not take into account certain significant items, including depreciation and amortization, interest expense, tax expense and equity in net income (loss) of affiliates. For market comparability, management analyzes performance measures that are similar in nature to EBITDA as we present it, and considering the economic effect of the excluded expense items independently as well as in connection with its analysis of net income as calculated in accordance with GAAP. EBITDA, EBITDA margin and EBITDA service margin should be considered in addition to, but not as a substitute for, other measures of financial performance reported in accordance with GAAP.
EBITDA, EBITDA Margin and EBITDA Service MarginDollars in millions
Third Quarter Nine-Month Period2021 2020 2021 2020
Net Income $ 6,273 $ 3,168 $ 16,089 $ 9,694 Additions:
Income Tax Expense 1,539 766 4,412 3,003 Interest Expense 1,667 1,972 5,221 6,031 Equity in Net (Income) Loss of Affiliates (91) (5) (184) 11Other (Income) Expense - Net (2,279) 231 (7,499) (1,589) Depreciation and amortization 5,619 7,030 17,189 21,537
EBITDA 12,728 13,162 35,228 38,687 Merger costs 130 38 167 431 Employee separation costs and benefit-related (gain) loss — 40 57 924 Impairments 161 73 $ 4,716 2,515 Gain on spectrum transaction — — — (900)
Adjusted EBITDA 1 $ 13,019 $ 13,313 $ 40,168 $ 41,657 1 See page 5 for additional discussion and reconciliation of adjusted items.
18

Segment and Business Unit EBITDA, EBITDA Margin and EBITDA Service MarginDollars in millions
Third Quarter Nine-Month Period2021 2020 2021 2020
Communications SegmentOperating Contribution $ 7,123 $ 7,064 $ 21,828 $ 21,953 Additions:Depreciation and amortization 4,114 4,068 12,253 12,154 EBITDA 11,237 11,132 34,081 34,107
Total Operating Revenues 28,218 27,195 84,524 80,479
Operating Income Margin 25.2 % 26.0 % 25.8 % 27.3 %EBITDA Margin 39.8 % 40.9 % 40.3 % 42.4 %
MobilityOperating Contribution $ 5,955 $ 5,691 $ 17,959 $ 17,284 Additions:Depreciation and amortization 2,035 2,021 6,072 6,078 EBITDA 7,990 7,712 24,031 23,362
Total Operating Revenues 19,138 17,894 57,108 52,445 Service Revenues 14,527 13,883 42,921 41,520
Operating Income Margin 31.1 % 31.8 % 31.4 % 33.0 %EBITDA Margin 41.7 % 43.1 % 42.1 % 44.5 %EBITDA Service Margin 55.0 % 55.5 % 56.0 % 56.3 %
Business WirelineOperating Contribution $ 985 $ 1,184 $ 3,093 $ 3,567 Additions:Depreciation and amortization 1,304 1,313 3,875 3,900 EBITDA 2,289 2,497 6,968 7,467
Total Operating Revenues 5,938 6,261 18,036 18,832
Operating Income Margin 16.6 % 18.9 % 17.1 % 18.9 %EBITDA Margin 38.5 % 39.9 % 38.6 % 39.7 %
Consumer WirelineOperating Contribution $ 183 $ 189 $ 776 $ 1,102 Additions:Depreciation and amortization 775 734 2,306 2,176 EBITDA 958 923 3,082 3,278
Total Operating Revenues 3,142 3,040 9,380 9,202
Operating Income Margin 5.8 % 6.2 % 8.3 % 12.0 %EBITDA Margin 30.5 % 30.4 % 32.9 % 35.6 %
19

Segment and Business Unit EBITDA, EBITDA Margin and EBITDA Service MarginDollars in millions
Third Quarter Nine-Month Period2021 2020 2021 2020
WarnerMedia SegmentOperating Contribution $ 1,935 $ 1,755 $ 5,704 $ 5,681 Additions:Equity in Net (Income) of Affiliates 73 (12) (44) (31) Depreciation and amortization 163 169 491 494 EBITDA 2,171 1,912 6,151 6,144
Total Operating Revenues 8,442 7,395 25,759 21,888
Operating Income Margin 23.8 % 23.6 % 22.0 % 25.8 %EBITDA Margin 25.7 % 25.9 % 23.9 % 28.1 %
Segment and Business Unit EBITDA, EBITDA Margin and EBITDA Service MarginDollars in millions
Third Quarter Nine-Month Period2021 2020 2021 2020
Latin America SegmentOperating Contribution $ (25) $ (177) $ (350) $ (562) Additions:Equity in Net (Income) of Affiliates (9) (14) (7) (26) Depreciation and amortization 157 250 683 773 EBITDA 123 59 326 185
Total Operating Revenues 1,480 1,396 4,291 4,218
Operating Income Margin -2.3 % -13.7 % -8.3 % -13.9 %EBITDA Margin 8.3 % 4.2 % 7.6 % 4.4 %
VrioOperating Contribution $ 105 $ (34) $ 43 $ (101) Additions:Equity in Net (Income) of Affiliates (9) (14) (7) (26) Depreciation and amortization — 126 231 400 EBITDA 96 78 267 273
Total Operating Revenues 756 753 2,248 2,392
Operating Income Margin 12.7 % -6.4 % 1.6 % -5.3 %EBITDA Margin 12.7 % 10.4 % 11.9 % 11.4 %
MexicoOperating Contribution $ (130) $ (143) $ (393) $ (461) Additions:Equity in Net (Income) Loss of Affiliates — — — — Depreciation and amortization 157 124 452 373 EBITDA 27 (19) 59 (88)
Total Operating Revenues 724 643 2,043 1,826
Operating Income Margin -18.0 % -22.2 % -19.2 % -25.2 %EBITDA Margin 3.7 % -3.0 % 2.9 % -4.8 %
20

Adjusting Items
Adjusting items include revenues and costs we consider non-operational in nature, including items arising from asset acquisitions or dispositions. We also adjust for net actuarial gains or losses associated with our pension and postemployment benefit plans due to the often-significant impact on our results (we immediately recognize this gain or loss in the income statement, pursuant to our accounting policy for the recognition of actuarial gains and losses). Consequently, our adjusted results reflect an expected return on plan assets rather than the actual return on plan assets, as included in the GAAP measure of income.
The tax impact of adjusting items is calculated using the effective tax rate during the quarter except for adjustments that, given their magnitude, can drive a change in the effective tax rate, in these cases we use the actual tax expense or combined marginal rate of approximately 25%.
Adjusting ItemsDollars in millions
Third Quarter Nine-Month Period2021 2020 2021 2020
Operating ExpensesMerger costs $ 130 $ 38 $ 167 $ 431 Employee separation costs and benefit-related (gain) loss1 — 40 57 924 Assets impairments and abandonment 161 73 4,716 2,515 Gain (loss) on spectrum transaction — — — (900)
Adjustments to Operations and Support Expenses 291 151 4,940 2,970 Amortization of intangible assets 1,012 1,921 3,212 6,122
Adjustments to Operating Expenses 1,303 2,072 8,152 9,092 Other DIRECTV intangible amortization (proportionate share) 392 — 392 — (Gain) loss on sale of assets (768) — (832) — Debt redemption, impairments and other 68 1,263 213 1,670 Actuarial (gain) loss (374) 63 (3,021) 63 Employee benefit-related (gain) loss1 — (64) — (22)
Adjustments to Income Before Income Taxes 621 3,334 4,904 10,803 Tax impact of adjustments 72 648 620 1,791 Tax-related items 123 — 241 — Impairment attributable to noncontrolling interest — — 81 105
Adjustments to Net Income $ 426 $ 2,686 $ 3,962 $ 8,907 1 Mark-to-market gains and losses on benefit-related investments were adjusted in 2020 reflecting more significant market volatility and uncertainty experienced as a result of the onset of the COVID-19 pandemic. Benefit-related investment gains (losses) were $(3) and $256 in the third quarter and for the first nine months of 2021 and $123 and $125 in the third quarter and for the first nine months of 2020.
Adjusted Operating Income, Adjusted Operating Income Margin, Adjusted EBITDA, Adjusted EBITDA margin, Adjusted EBITDA service margin and Adjusted diluted EPS are non-GAAP financial measures calculated by excluding from operating revenues, operating expenses and income tax expense, certain significant items that are non-operational or non-recurring in nature, including dispositions and merger integration and transaction costs, actuarial gains and losses, significant abandonments and impairment, severance and other material gains and losses. Management believes that these measures provide relevant and useful information to investors and other users of our financial data in evaluating the effectiveness of our operations and underlying business trends.
21
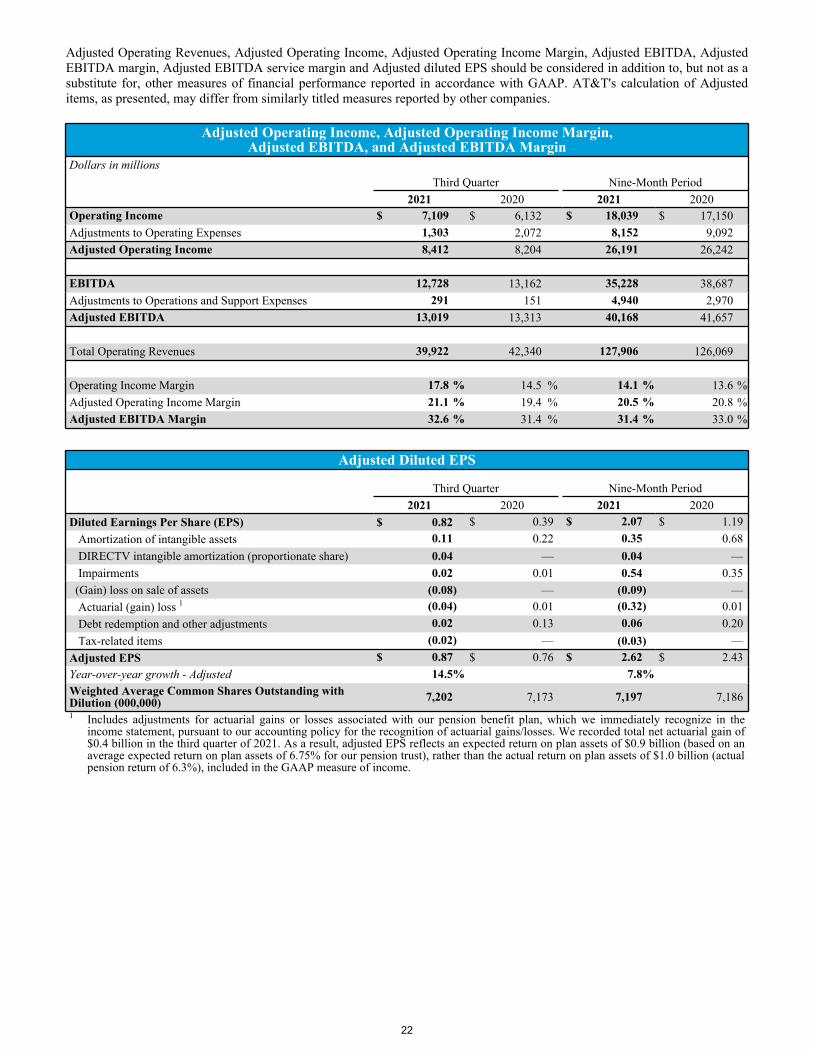
Adjusted Operating Revenues, Adjusted Operating Income, Adjusted Operating Income Margin, Adjusted EBITDA, Adjusted EBITDA margin, Adjusted EBITDA service margin and Adjusted diluted EPS should be considered in addition to, but not as a substitute for, other measures of financial performance reported in accordance with GAAP. AT&T's calculation of Adjusted items, as presented, may differ from similarly titled measures reported by other companies.
Adjusted Operating Income, Adjusted Operating Income Margin,Adjusted EBITDA, and Adjusted EBITDA Margin
Dollars in millionsThird Quarter Nine-Month Period
2021 2020 2021 2020Operating Income $ 7,109 $ 6,132 $ 18,039 $ 17,150 Adjustments to Operating Expenses 1,303 2,072 8,152 9,092 Adjusted Operating Income 8,412 8,204 26,191 26,242
EBITDA 12,728 13,162 35,228 38,687 Adjustments to Operations and Support Expenses 291 151 4,940 2,970 Adjusted EBITDA 13,019 13,313 40,168 41,657
Total Operating Revenues 39,922 42,340 127,906 126,069
Operating Income Margin 17.8 % 14.5 % 14.1 % 13.6 %Adjusted Operating Income Margin 21.1 % 19.4 % 20.5 % 20.8 %Adjusted EBITDA Margin 32.6 % 31.4 % 31.4 % 33.0 %
Adjusted Diluted EPS
Third Quarter Nine-Month Period2021 2020 2021 2020
Diluted Earnings Per Share (EPS) $ 0.82 $ 0.39 $ 2.07 $ 1.19 Amortization of intangible assets 0.11 0.22 0.35 0.68 DIRECTV intangible amortization (proportionate share) 0.04 — 0.04 — Impairments 0.02 0.01 0.54 0.35 (Gain) loss on sale of assets (0.08) — (0.09) — Actuarial (gain) loss 1 (0.04) 0.01 (0.32) 0.01 Debt redemption and other adjustments 0.02 0.13 0.06 0.20 Tax-related items (0.02) — (0.03) —
Adjusted EPS $ 0.87 $ 0.76 $ 2.62 $ 2.43 Year-over-year growth - Adjusted 14.5 % 7.8 %Weighted Average Common Shares Outstanding with Dilution (000,000) 7,202 7,173 7,197 7,186 1 Includes adjustments for actuarial gains or losses associated with our pension benefit plan, which we immediately recognize in the
income statement, pursuant to our accounting policy for the recognition of actuarial gains/losses. We recorded total net actuarial gain of $0.4 billion in the third quarter of 2021. As a result, adjusted EPS reflects an expected return on plan assets of $0.9 billion (based on an average expected return on plan assets of 6.75% for our pension trust), rather than the actual return on plan assets of $1.0 billion (actual pension return of 6.3%), included in the GAAP measure of income.
22
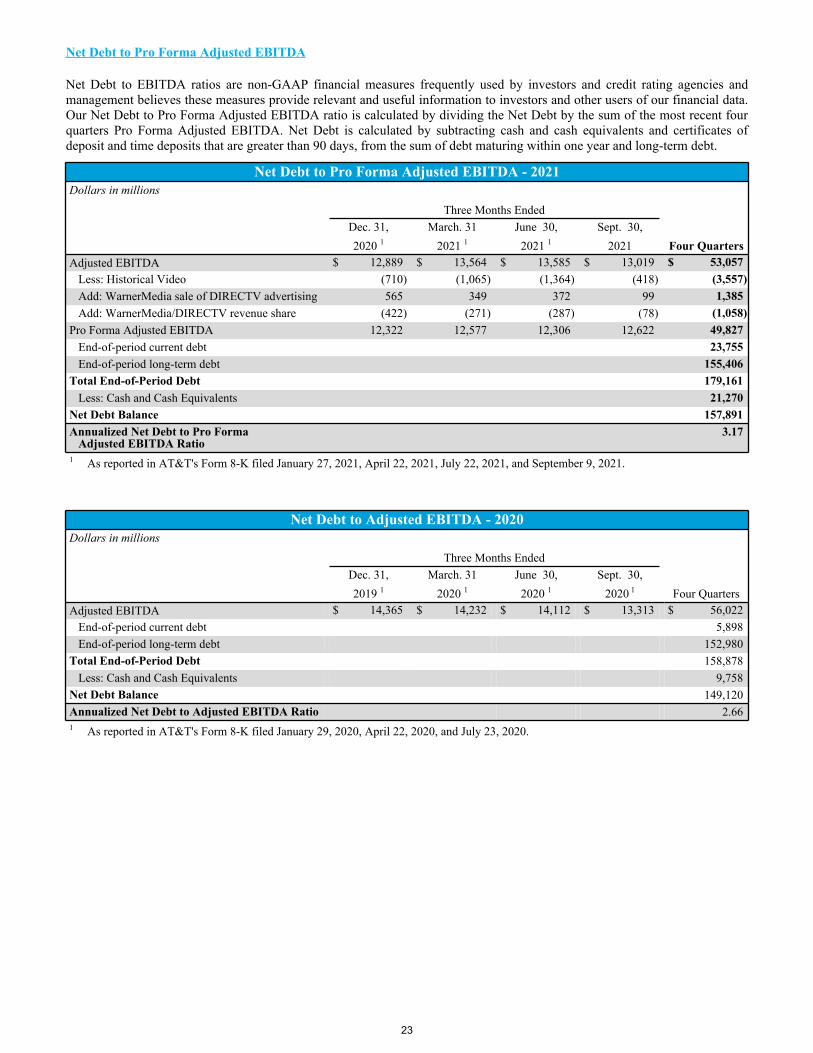
Net Debt to Pro Forma Adjusted EBITDA
Net Debt to EBITDA ratios are non-GAAP financial measures frequently used by investors and credit rating agencies and management believes these measures provide relevant and useful information to investors and other users of our financial data. Our Net Debt to Pro Forma Adjusted EBITDA ratio is calculated by dividing the Net Debt by the sum of the most recent four quarters Pro Forma Adjusted EBITDA. Net Debt is calculated by subtracting cash and cash equivalents and certificates of deposit and time deposits that are greater than 90 days, from the sum of debt maturing within one year and long-term debt.
Net Debt to Pro Forma Adjusted EBITDA - 2021Dollars in millions
Three Months EndedDec. 31, March. 31 June 30, Sept. 30,
Four Quarters2020 1 2021 1 2021 1 2021Adjusted EBITDA $ 12,889 $ 13,564 $ 13,585 $ 13,019 $ 53,057
Less: Historical Video (710) (1,065) (1,364) (418) (3,557)Add: WarnerMedia sale of DIRECTV advertising 565 349 372 99 1,385 Add: WarnerMedia/DIRECTV revenue share (422) (271) (287) (78) (1,058)
Pro Forma Adjusted EBITDA 12,322 12,577 12,306 12,622 49,827 End-of-period current debt 23,755 End-of-period long-term debt 155,406
Total End-of-Period Debt 179,161 Less: Cash and Cash Equivalents 21,270
Net Debt Balance 157,891 Annualized Net Debt to Pro Forma Adjusted EBITDA Ratio
3.17
1 As reported in AT&T's Form 8-K filed January 27, 2021, April 22, 2021, July 22, 2021, and September 9, 2021.
Net Debt to Adjusted EBITDA - 2020Dollars in millions
Three Months EndedDec. 31, March. 31 June 30, Sept. 30,
Four Quarters2019 1 2020 1 2020 1 2020 1
Adjusted EBITDA $ 14,365 $ 14,232 $ 14,112 $ 13,313 $ 56,022 End-of-period current debt 5,898 End-of-period long-term debt 152,980
Total End-of-Period Debt 158,878 Less: Cash and Cash Equivalents 9,758
Net Debt Balance 149,120 Annualized Net Debt to Adjusted EBITDA Ratio 2.66 1 As reported in AT&T's Form 8-K filed January 29, 2020, April 22, 2020, and July 23, 2020.
23

Supplemental Operational Measures
We provide a supplemental discussion of our business solutions operations that is calculated by combining our Mobility and Business Wireline operating units, and then adjusting to remove non-business operations. The following table presents a reconciliation of our supplemental Business Solutions results.
Supplemental Operational MeasureThird Quarter
September 30, 2021 September 30, 2020
MobilityBusinessWireline Adjustments1
BusinessSolutions Mobility
BusinessWireline Adjustments1
BusinessSolutions
Operating RevenuesWireless service $ 14,527 $ — $ (12,468) $ 2,059 $ 13,883 $ — $ (11,933) $ 1,950 Wireline service — 5,765 — 5,765 — 6,079 — 6,079 Wireless equipment 4,611 — (3,798) 813 4,011 — (3,349) 662 Wireline equipment — 173 — 173 — 182 — 182
Total Operating Revenues 19,138 5,938 (16,266) 8,810 17,894 6,261 (15,282) 8,873
Operating ExpensesOperations and support 11,148 3,649 (9,194) 5,603 10,182 3,764 (8,505) 5,441 EBITDA 7,990 2,289 (7,072) 3,207 7,712 2,497 (6,777) 3,432 Depreciation and amortization 2,035 1,304 (1,688) 1,651 2,021 1,313 (1,702) 1,632 Total Operating Expenses 13,183 4,953 (10,882) 7,254 12,203 5,077 (10,207) 7,073 Operating Income 5,955 985 (5,384) 1,556 5,691 1,184 (5,075) 1,800 Equity in Net Income (Loss) of Affiliates — — — — — — — — Operating Contribution $ 5,955 $ 985 $ (5,384) $ 1,556 $ 5,691 $ 1,184 $ (5,075) $ 1,800 1 Non-business wireless reported in the Communication segment under the Mobility business unit.
Results have been recast to conform to the current period's classification.
Supplemental Operational MeasureNine-Month Period
September 30, 2021 September 30, 2020
MobilityBusinessWireline Adjustments1
BusinessSolutions Mobility
BusinessWireline Adjustments1
BusinessSolutions
Operating RevenuesWireless service $ 42,921 $ — $ (36,868) $ 6,053 $ 41,520 $ — $ (35,736) $ 5,784 Wireline service — 17,497 — 17,497 — 18,271 — 18,271 Wireless equipment 14,187 — (11,803) 2,384 10,925 — (8,968) 1,957 Wireline equipment — 539 — 539 — 561 — 561
Total Operating Revenues 57,108 18,036 (48,671) 26,473 52,445 18,832 (44,704) 26,573
Operating ExpensesOperations and support 33,077 11,068 (27,330) 16,815 29,083 11,365 (24,001) 16,447 EBITDA 24,031 6,968 (21,341) 9,658 23,362 7,467 (20,703) 10,126 Depreciation and amortization 6,072 3,875 (5,044) 4,903 6,078 3,900 (5,116) 4,862 Total Operating Expenses 39,149 14,943 (32,374) 21,718 35,161 15,265 (29,117) 21,309 Operating Income 17,959 3,093 (16,297) 4,755 17,284 3,567 (15,587) 5,264 Equity in Net Income (Loss) of Affiliates — — — — — — — — Operating Contribution $ 17,959 $ 3,093 $ (16,297) $ 4,755 $ 17,284 $ 3,567 $ (15,587) $ 5,264 1 Non-business wireless reported in the Communication segment under the Mobility business unit.
Results have been recast to conform to the current period's classification.
24