Embed Size (px)
Citation preview
26/03/15 1 Корпоративная презентация Медси
Financial and Operating Results for 2014
March 2015
26/03/15 2 Корпоративная презентация Медси
OVERVIEW
26/03/15 3 Корпоративная презентация Медси
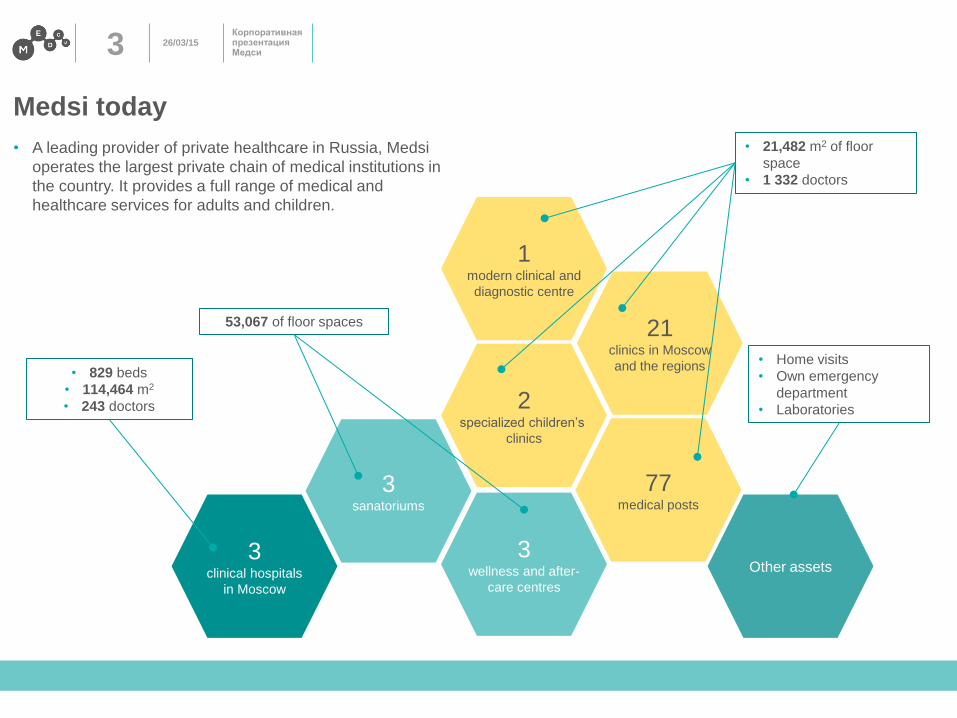
Medsi today
1
modern clinical and
diagnostic centre
21 clinics in Moscow
and the regions
2 specialized children’s
clinics
77 medical posts
3 sanatoriums
Other assets
53,067 of floor spaces
• 21,482 m2 of floor
space
• 1 332 doctors
• 829 beds
• 114,464 m2
• 243 doctors
• Home visits
• Own emergency
department
• Laboratories
3 wellness and after-
care centres
3 clinical hospitals
in Moscow
• A leading provider of private healthcare in Russia, Medsi
operates the largest private chain of medical institutions in
the country. It provides a full range of medical and
healthcare services for adults and children.
26/03/15 4 Корпоративная презентация Медси
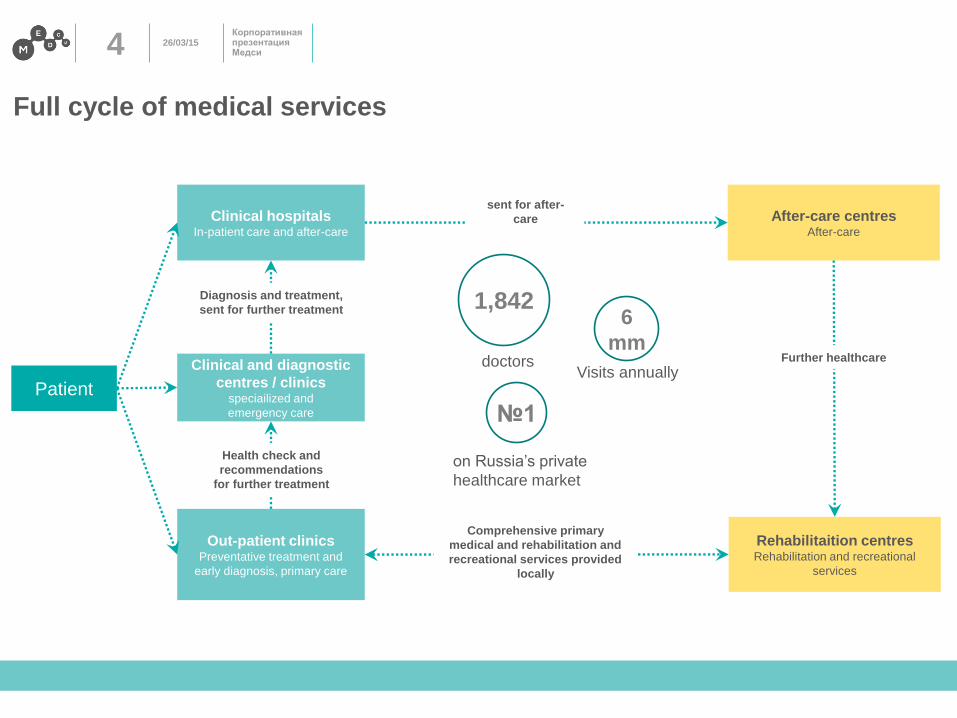
Full cycle of medical services
Clinical hospitals In-patient care and after-care
Clinical and diagnostic
centres / clinics speciailized and
emergency care
Out-patient clinics Preventative treatment and
early diagnosis, primary care
Patient
After-care centres After-care
Rehabilitaition centres Rehabilitation and recreational
services
Health check and
recommendations
for further treatment
Diagnosis and treatment,
sent for further treatment
sent for after-
care
Further healthcare
Comprehensive primary
medical and rehabilitation and
recreational services provided
locally
6
mm
1,842
Visits annually doctors
№1
on Russia’s private
healthcare market
26/03/15 5 Корпоративная презентация Медси
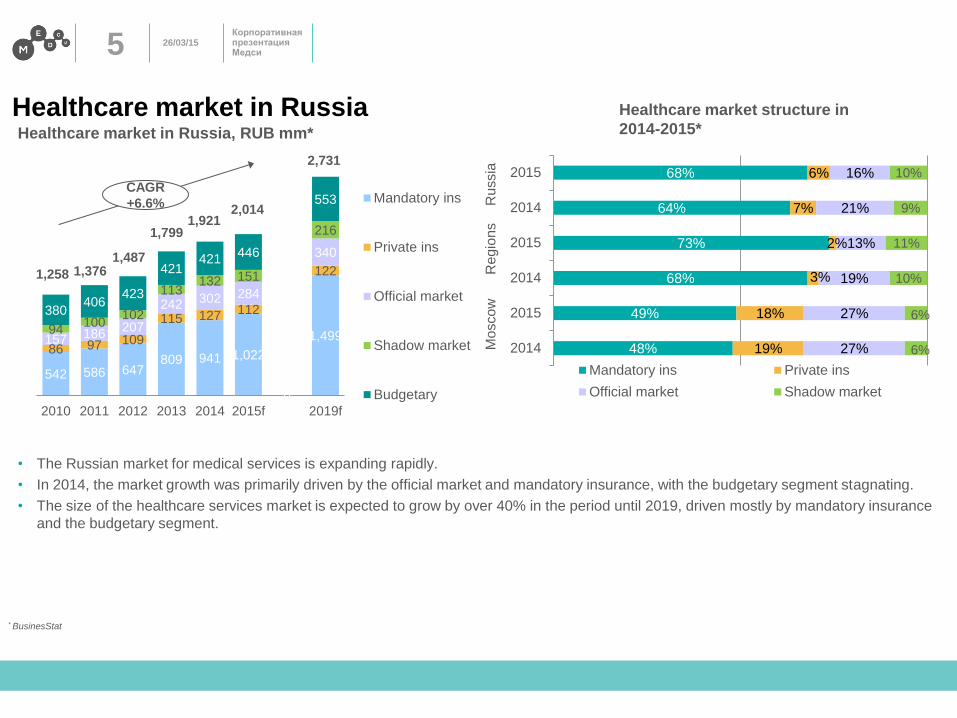
Healthcare market in Russia
542 586 647 809 941 1,022
1,499 86 97 109
115 127 112
122
157 186 207
242 302 284
340
94 100
102
113 132 151
216
380 406
423
421 421
446
0
553
2010 2011 2012 2013 2014 2015f 2019f
Mandatory ins
Private ins
Official market
Shadow market
Budgetary
1,258
CAGR
+6.6%
Healthcare market in Russia, RUB mm*
• The Russian market for medical services is expanding rapidly.
• In 2014, the market growth was primarily driven by the official market and mandatory insurance, with the budgetary segment stagnating.
• The size of the healthcare services market is expected to grow by over 40% in the period until 2019, driven mostly by mandatory insurance
and the budgetary segment.
* BusinesStat
Mo
sco
w
Re
gio
ns
Healthcare market structure in
2014-2015*
48%
49%
68%
73%
64%
68%
19%
18%
3%
2%
7%
6%
27%
27%
19%
13%
21%
16%
6%
6%
10%
11%
9%
10%
2014
2015
2014
2015
2014
2015
Mandatory ins Private ins
Official market Shadow market
Ru
ssia
2,731
2,014 1,921
1,799
1,487 1,376
26/03/15 6 Корпоративная презентация Медси
RESULTS FOR 2014
26/03/15 7 Корпоративная презентация Медси
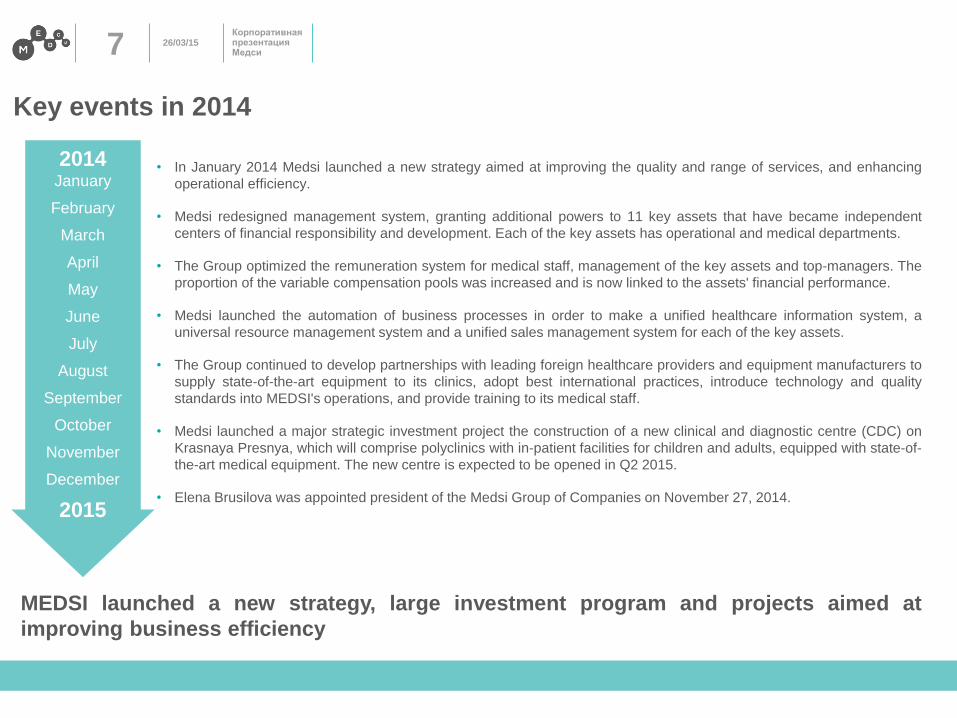
• In January 2014 Medsi launched a new strategy aimed at improving the quality and range of services, and enhancing
operational efficiency.
• Medsi redesigned management system, granting additional powers to 11 key assets that have became independent
centers of financial responsibility and development. Each of the key assets has operational and medical departments.
• The Group optimized the remuneration system for medical staff, management of the key assets and top-managers. The
proportion of the variable compensation pools was increased and is now linked to the assets' financial performance.
• Medsi launched the automation of business processes in order to make a unified healthcare information system, a
universal resource management system and a unified sales management system for each of the key assets.
• The Group continued to develop partnerships with leading foreign healthcare providers and equipment manufacturers to
supply state-of-the-art equipment to its clinics, adopt best international practices, introduce technology and quality
standards into MEDSI's operations, and provide training to its medical staff.
• Medsi launched a major strategic investment project the construction of a new clinical and diagnostic centre (CDC) on
Krasnaya Presnya, which will comprise polyclinics with in-patient facilities for children and adults, equipped with state-of-
the-art medical equipment. The new centre is expected to be opened in Q2 2015.
• Elena Brusilova was appointed president of the Medsi Group of Companies on November 27, 2014.
MEDSI launched a new strategy, large investment program and projects aimed at
improving business efficiency
2014 January
February
March
April
May
June
July
August
September
October
November
December
2015
Key events in 2014
26/03/15 8 Корпоративная презентация Медси
44%
65% 62%
In-patient Clinics Centre onBelorusskaya
In-patient 12.4%
Centre on Belorusskaya
20.4%
Clinics 58.5%
Other 8.6%
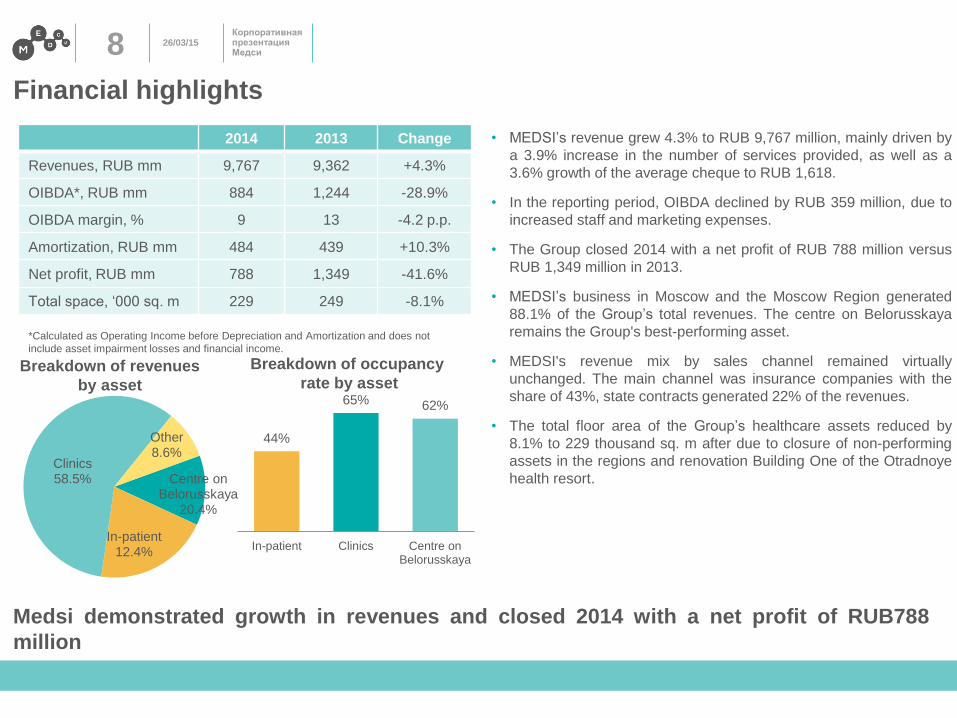
Financial highlights
2014 2013 Change
Revenues, RUB mm 9,767 9,362 +4.3%
OIBDA*, RUB mm 884 1,244 -28.9%
OIBDA margin, % 9 13 -4.2 p.p.
Amortization, RUB mm 484 439 +10.3%
Net profit, RUB mm 788 1,349 -41.6%
Total space, ‘000 sq. m 229 249 -8.1%
• MEDSI’s revenue grew 4.3% to RUB 9,767 million, mainly driven by
a 3.9% increase in the number of services provided, as well as a
3.6% growth of the average cheque to RUB 1,618.
• In the reporting period, OIBDA declined by RUB 359 million, due to
increased staff and marketing expenses.
• The Group closed 2014 with a net profit of RUB 788 million versus
RUB 1,349 million in 2013.
• MEDSI’s business in Moscow and the Moscow Region generated
88.1% of the Group’s total revenues. The centre on Belorusskaya
remains the Group's best-performing asset.
• MEDSI's revenue mix by sales channel remained virtually
unchanged. The main channel was insurance companies with the
share of 43%, state contracts generated 22% of the revenues.
• The total floor area of the Group’s healthcare assets reduced by
8.1% to 229 thousand sq. m after due to closure of non-performing
assets in the regions and renovation Building One of the Otradnoye
health resort.
Medsi demonstrated growth in revenues and closed 2014 with a net profit of RUB788
million
Breakdown of revenues
by asset
Breakdown of occupancy
rate by asset
*Calculated as Operating Income before Depreciation and Amortization and does not
include asset impairment losses and financial income.
26/03/15 9 Корпоративная презентация Медси
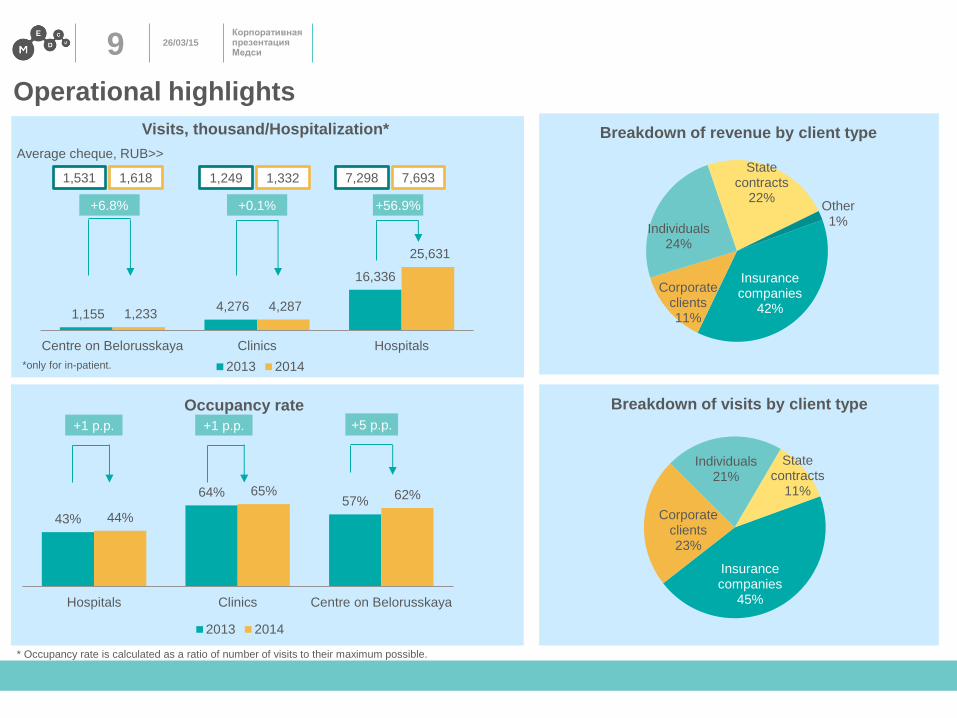
1,155 4,276
16,336
1,233 4,287
25,631
Centre on Belorusskaya Clinics Hospitals
2013 2014
Operational highlights
Occupancy rate
Visits, thousand/Hospitalization*
1,531 1,618 1,249 1,332 7,298 7,693
Average cheque, RUB>>
Insurance companies
45%
Corporate clients 23%
Individuals 21%
State contracts
11%
Breakdown of visits by client type
+1 p.p. +5 p.p.
+0.1% +6.8%
43%
64% 57%
44%
65% 62%
Hospitals Clinics Centre on Belorusskaya
2013 2014
Insurance companies
42%
Corporate clients 11%
Individuals 24%
State contracts
22% Other 1%
Breakdown of revenue by client type
+56.9%
*only for in-patient.
* Occupancy rate is calculated as a ratio of number of visits to their maximum possible.
+1 p.p.
26/03/15 10 Корпоративная презентация Медси
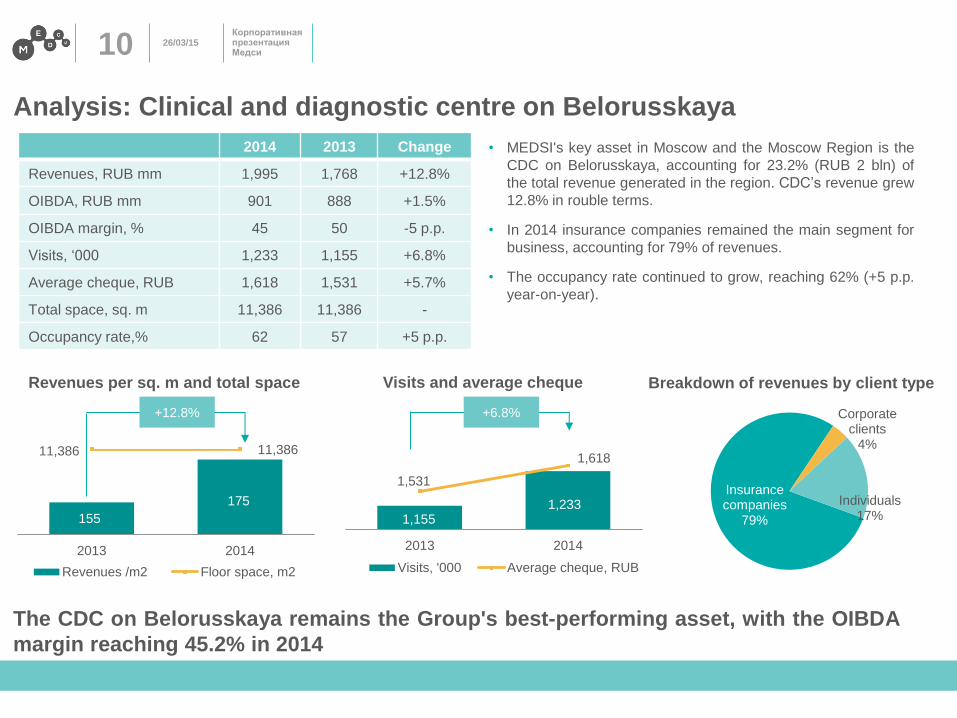
Analysis: Clinical and diagnostic centre on Belorusskaya
2014 2013 Change
Revenues, RUB mm 1,995 1,768 +12.8%
OIBDA, RUB mm 901 888 +1.5%
OIBDA margin, % 45 50 -5 p.p.
Visits, ‘000 1,233 1,155 +6.8%
Average cheque, RUB 1,618 1,531 +5.7%
Total space, sq. m 11,386 11,386 -
Occupancy rate,% 62 57 +5 p.p.
The CDC on Belorusskaya remains the Group's best-performing asset, with the OIBDA
margin reaching 45.2% in 2014
• MEDSI's key asset in Moscow and the Moscow Region is the
CDC on Belorusskaya, accounting for 23.2% (RUB 2 bln) of
the total revenue generated in the region. CDC’s revenue grew
12.8% in rouble terms.
• In 2014 insurance companies remained the main segment for
business, accounting for 79% of revenues.
• The occupancy rate continued to grow, reaching 62% (+5 p.p.
year-on-year).
Visits and average cheque
155
175
11,386 11,386
2013 2014
Revenues /m2 Floor space, m2
Revenues per sq. m and total space
+12.8% +6.8%
Insurance companies
79%
Corporate clients
4%
Individuals 17%
Breakdown of revenues by client type
1,155 1,233
1,531
1,618
2013 2014
Visits, '000 Average cheque, RUB
26/03/15 11 Корпоративная презентация Медси
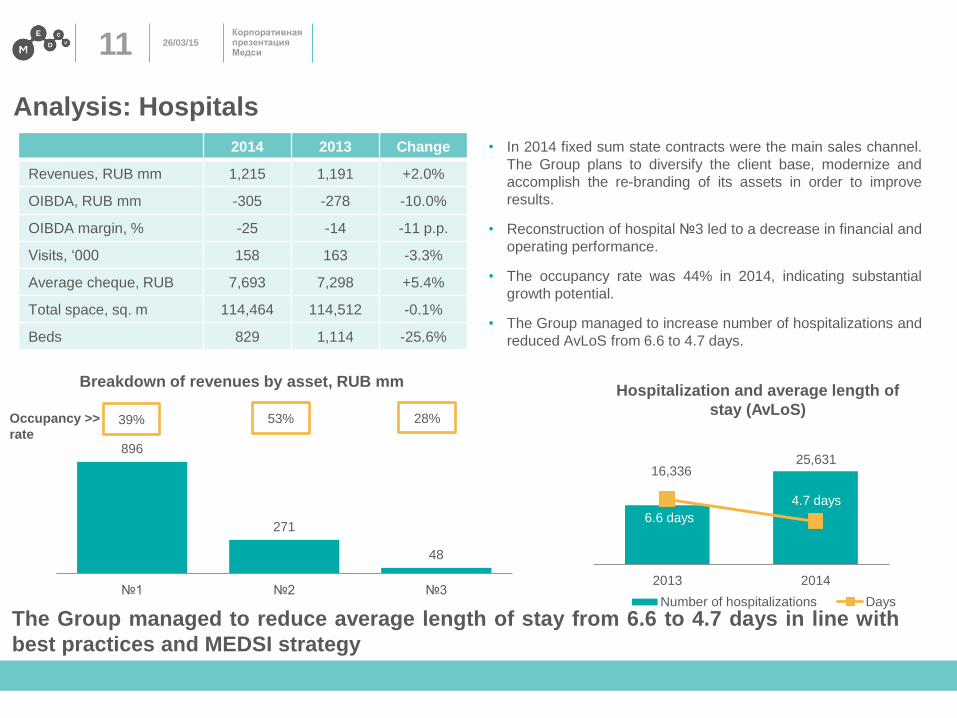
Analysis: Hospitals
2014 2013 Change
Revenues, RUB mm 1,215 1,191 +2.0%
OIBDA, RUB mm -305 -278 -10.0%
OIBDA margin, % -25 -14 -11 p.p.
Visits, ‘000 158 163 -3.3%
Average cheque, RUB 7,693 7,298 +5.4%
Total space, sq. m 114,464 114,512 -0.1%
Beds 829 1,114 -25.6%
• In 2014 fixed sum state contracts were the main sales channel.
The Group plans to diversify the client base, modernize and
accomplish the re-branding of its assets in order to improve
results.
• Reconstruction of hospital №3 led to a decrease in financial and
operating performance.
• The occupancy rate was 44% in 2014, indicating substantial
growth potential.
• The Group managed to increase number of hospitalizations and
reduced AvLoS from 6.6 to 4.7 days.
Breakdown of revenues by asset, RUB mm
The Group managed to reduce average length of stay from 6.6 to 4.7 days in line with
best practices and MEDSI strategy
896
271
48
№1 №2 №3
Occupancy >>
rate 39% 53% 28%
Hospitalization and average length of
stay (AvLoS)
16,336 25,631
2013 2014
Number of hospitalizations Days
4.7 days
6.6 days
26/03/15 12 Корпоративная презентация Медси
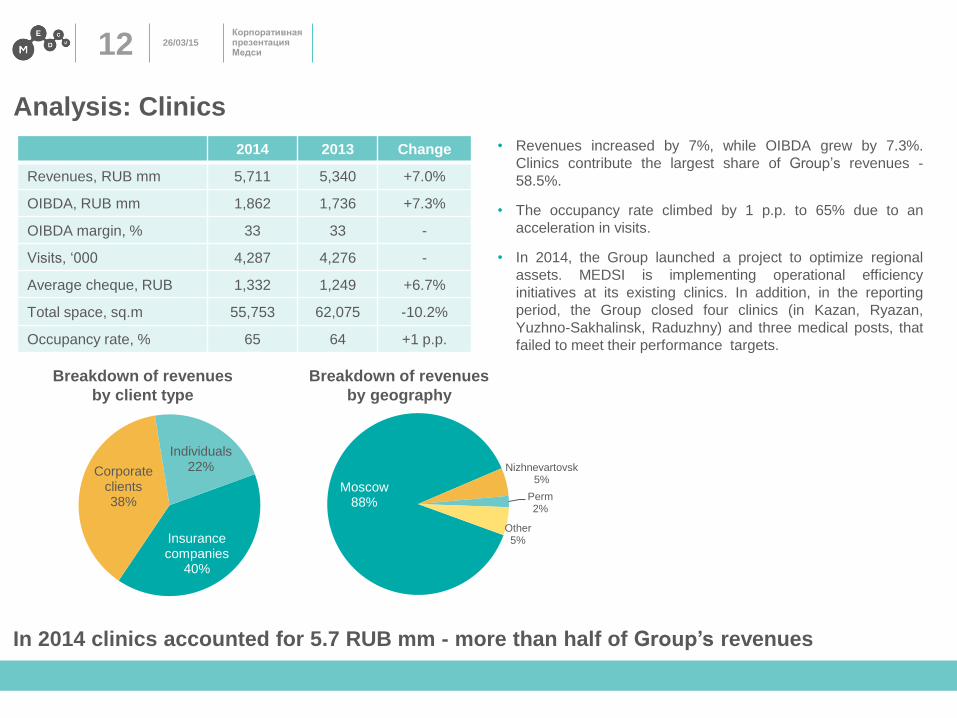
Moscow 88%
Nizhnevartovsk 5%
Perm 2%
Other 5%
Analysis: Clinics
2014 2013 Change
Revenues, RUB mm 5,711 5,340 +7.0%
OIBDA, RUB mm 1,862 1,736 +7.3%
OIBDA margin, % 33 33 -
Visits, ‘000 4,287 4,276 -
Average cheque, RUB 1,332 1,249 +6.7%
Total space, sq.m 55,753 62,075 -10.2%
Occupancy rate, % 65 64 +1 p.p.
• Revenues increased by 7%, while OIBDA grew by 7.3%.
Clinics contribute the largest share of Group’s revenues -
58.5%.
• The occupancy rate climbed by 1 p.p. to 65% due to an
acceleration in visits.
• In 2014, the Group launched a project to optimize regional
assets. MEDSI is implementing operational efficiency
initiatives at its existing clinics. In addition, in the reporting
period, the Group closed four clinics (in Kazan, Ryazan,
Yuzhno-Sakhalinsk, Raduzhny) and three medical posts, that
failed to meet their performance targets.
In 2014 clinics accounted for 5.7 RUB mm - more than half of Group’s revenues
Insurance companies
40%
Corporate clients 38%
Individuals 22%
Breakdown of revenues
by client type
Breakdown of revenues
by geography
26/03/15 13 Корпоративная презентация Медси
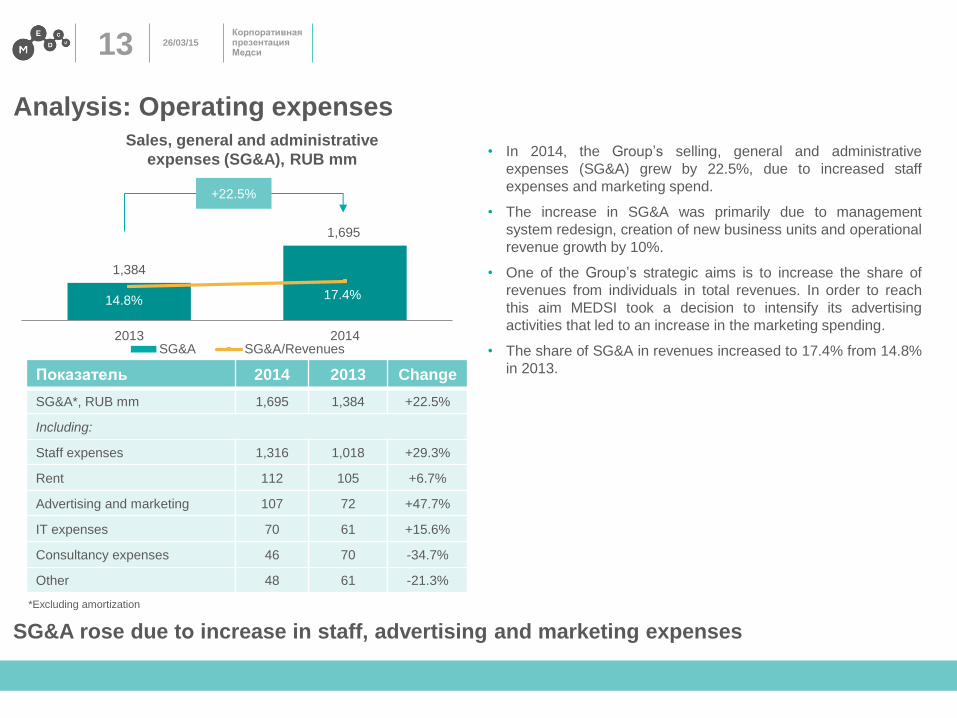
Analysis: Operating expenses
1,384
1,695
14.8% 17.4%
2013 2014SG&A SG&A/Revenues
Sales, general and administrative
expenses (SG&A), RUB mm
+22.5%
Показатель 2014 2013 Change
SG&A*, RUB mm 1,695 1,384 +22.5%
Including:
Staff expenses 1,316 1,018 +29.3%
Rent 112 105 +6.7%
Advertising and marketing 107 72 +47.7%
IT expenses 70 61 +15.6%
Consultancy expenses 46 70 -34.7%
Other 48 61 -21.3%
• In 2014, the Group’s selling, general and administrative
expenses (SG&A) grew by 22.5%, due to increased staff
expenses and marketing spend.
• The increase in SG&A was primarily due to management
system redesign, creation of new business units and operational
revenue growth by 10%.
• One of the Group’s strategic aims is to increase the share of
revenues from individuals in total revenues. In order to reach
this aim MEDSI took a decision to intensify its advertising
activities that led to an increase in the marketing spending.
• The share of SG&A in revenues increased to 17.4% from 14.8%
in 2013.
SG&A rose due tо increase in staff, advertising and marketing expenses
*Excluding amortization
26/03/15 14 Корпоративная презентация Медси
14
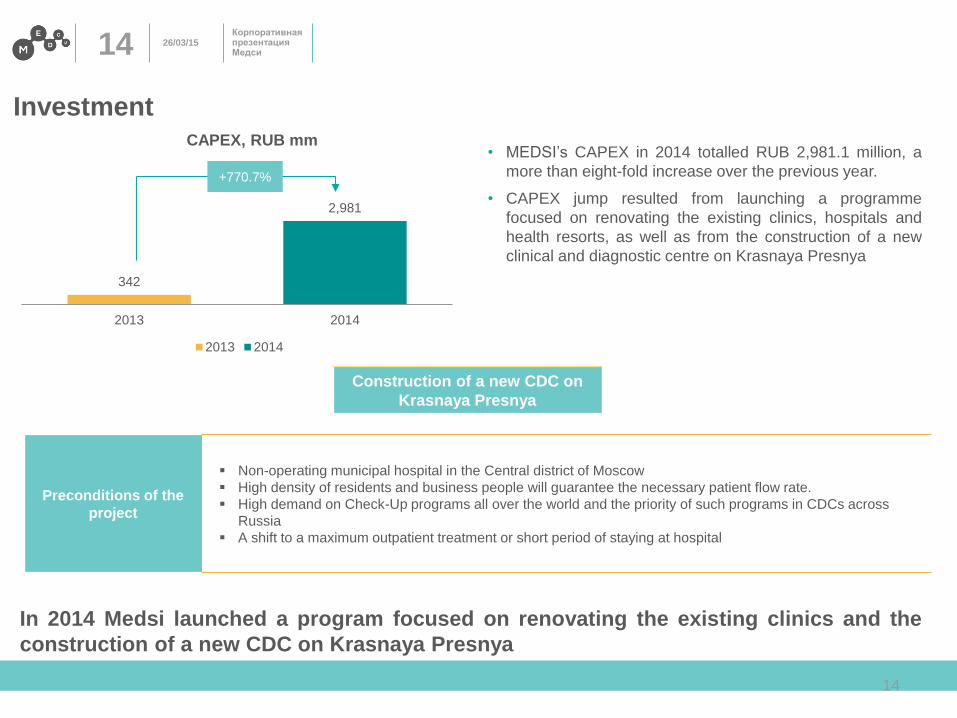
342
2,981
2013 2014
2013 2014
Investment
+770.7%
• MEDSI’s CAPEX in 2014 totalled RUB 2,981.1 million, a
more than eight-fold increase over the previous year.
• CAPEX jump resulted from launching a programme
focused on renovating the existing clinics, hospitals and
health resorts, as well as from the construction of a new
clinical and diagnostic centre on Krasnaya Presnya
CAPEX, RUB mm
Construction of a new CDC on
Krasnaya Presnya
In 2014 Medsi launched a program focused on renovating the existing clinics and the
construction of a new CDC on Krasnaya Presnya
Preconditions of the
project
Non-operating municipal hospital in the Central district of Moscow
High density of residents and business people will guarantee the necessary patient flow rate.
High demand on Check-Up programs all over the world and the priority of such programs in CDCs across
Russia
A shift to a maximum outpatient treatment or short period of staying at hospital
26/03/15 15 Корпоративная презентация Медси
15
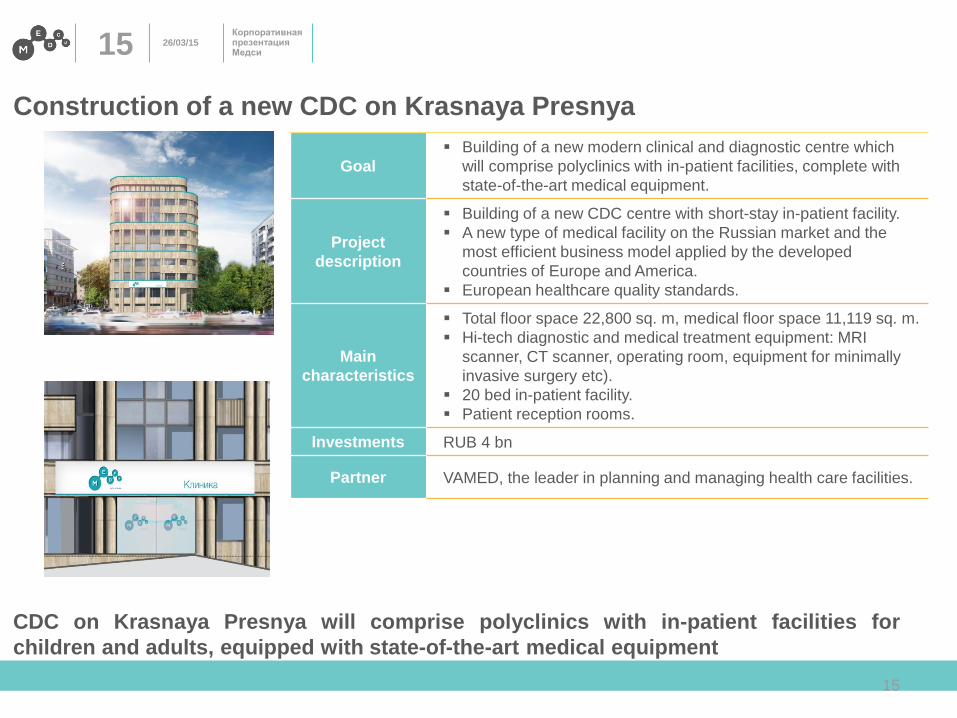
Goal
Building of a new modern clinical and diagnostic centre which
will comprise polyclinics with in-patient facilities, complete with
state-of-the-art medical equipment.
Project
description
Building of a new CDC centre with short-stay in-patient facility.
A new type of medical facility on the Russian market and the
most efficient business model applied by the developed
countries of Europe and America.
European healthcare quality standards.
Main
characteristics
Total floor space 22,800 sq. m, medical floor space 11,119 sq. m.
Hi-tech diagnostic and medical treatment equipment: MRI
scanner, CT scanner, operating room, equipment for minimally
invasive surgery etc).
20 bed in-patient facility.
Patient reception rooms.
Investments RUB 4 bn
Partner VAMED, the leader in planning and managing health care facilities.
CDC on Krasnaya Presnya will comprise polyclinics with in-patient facilities for
children and adults, equipped with state-of-the-art medical equipment
Construction of a new CDC on Krasnaya Presnya
26/03/15 16 Корпоративная презентация Медси
Analysis: Debt
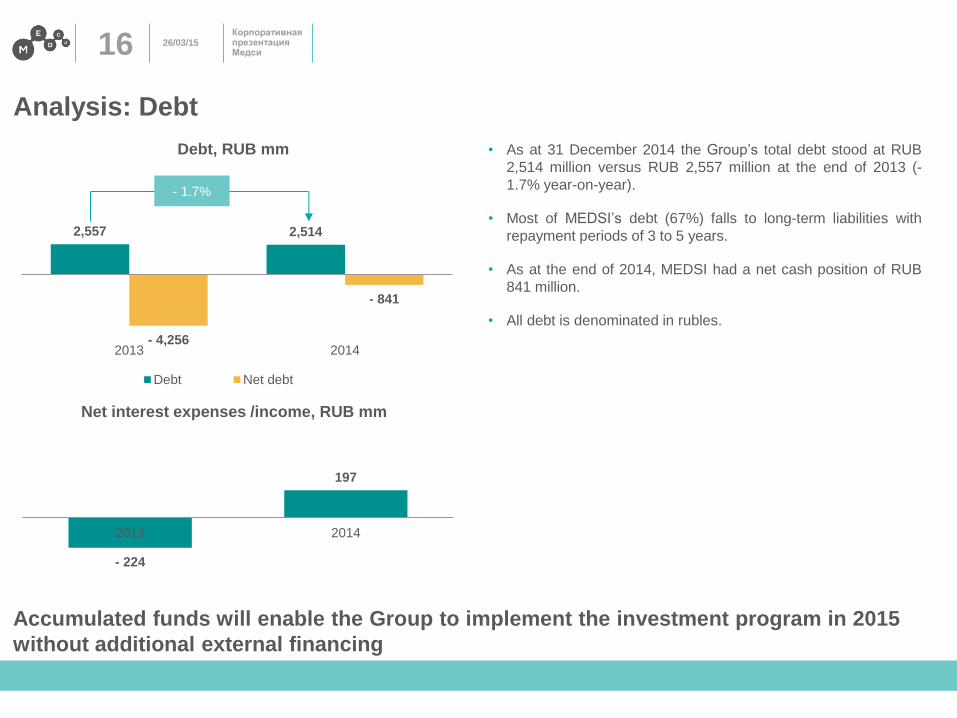
2,557 2,514
- 4,256
- 841
2013 2014
Debt Net debt
Debt, RUB mm
- 1.7%
- 224
197
2013 2014
Net interest expenses /income, RUB mm
• As at 31 December 2014 the Group’s total debt stood at RUB
2,514 million versus RUB 2,557 million at the end of 2013 (-
1.7% year-on-year).
• Most of MEDSI’s debt (67%) falls to long-term liabilities with
repayment periods of 3 to 5 years.
• As at the end of 2014, MEDSI had a net cash position of RUB
841 million.
• All debt is denominated in rubles.
Accumulated funds will enable the Group to implement the investment program in 2015
without additional external financing
26/03/15 17 Корпоративная презентация Медси
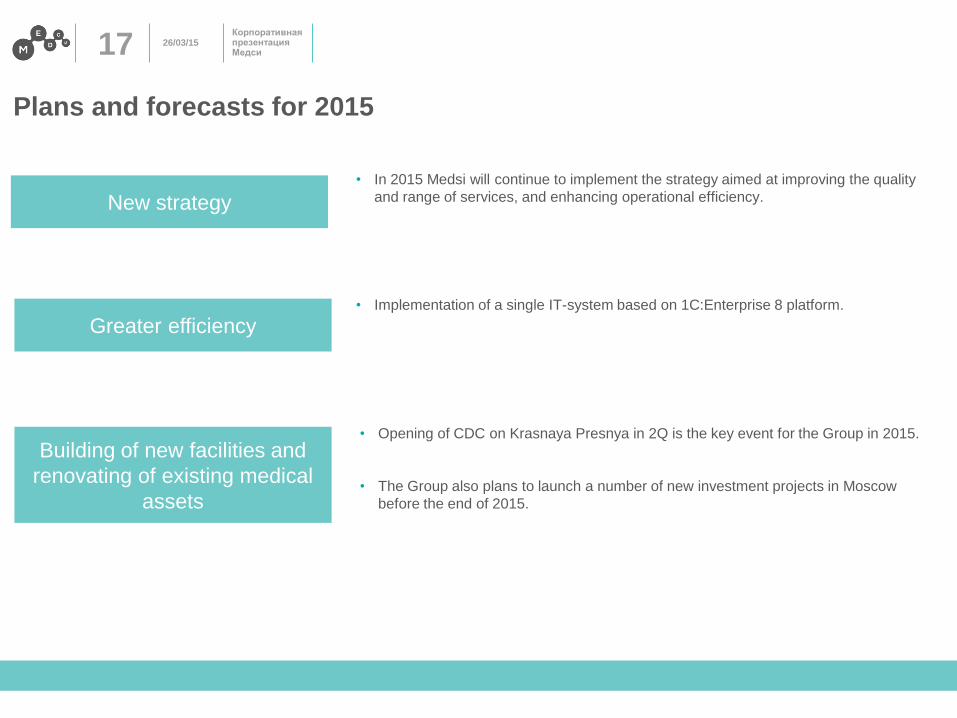
Plans and forecasts for 2015
Building of new facilities and
renovating of existing medical
assets
• Opening of CDC on Krasnaya Presnya in 2Q is the key event for the Group in 2015.
• The Group also plans to launch a number of new investment projects in Moscow
before the end of 2015.
New strategy
Greater efficiency
• In 2015 Medsi will continue to implement the strategy aimed at improving the quality
and range of services, and enhancing operational efficiency.
• Implementation of a single IT-system based on 1C:Enterprise 8 platform.