Embed Size (px)
Citation preview
FINANCIAL AND LEGAL CONSTRAINTS TOFIRM GROWTH: DOES SIZE MATTER?
Thorsten Beck, Aslı Demirgüç-Kunt and Vojislav Maksimovic
First Draft: November 2001Revised: June 2002
Abstract: Using a unique firm-level survey data base covering 54 countries, we investigate whether differentfinancial, legal and corruption issues firms report as obstacles actually affect their growth rates. Our results showthat the extent to which these factors constrain a firm’s growth depends very much on its size and that it isconsistently the smallest firms that are most adversely affected by all three obstacles. Firm growth is more affectedby obstacles in countries with underdeveloped financial and legal systems and higher corruption. Thus, policymeasures to improve financial and legal development and reduce corruption are well justified in promoting firmgrowth and particularly the development of the small and medium enterprise (SME) sector. However, our evidencealso shows that the intuitive descriptors of an “efficient” legal system are not correlated with the components of thelegal obstacle that predicts firm growth. This finding suggests that the mechanism by which the legal systems affectsfirm performance is not well understood. Our findings also provide evidence that the corruption of bank officialsconstrains firm growth in some countries. This “institutional failure” should be taken into account when modelingthe monitoring role of financial institutions in overcoming market failures due to informational asymmetries.
Keywords: Financial Development; Financing Constraints, Small and MediumEnterprises, Law and FinanceJEL Classification: G30, G10, O16, K40
Beck and Demirgüç-Kunt: World Bank; Maksimovic: Robert H. Smith School of Business at the University ofMaryland. This paper’s findings, interpretations, and conclusions are entirely those of the authors and do notnecessarily represent the views of the World Bank, its Executive Directors, or the countries they represent. Wewould like to thank Jerry Caprio, George Clarke, Simeon Djankov, Luc Laeven , Inessa Love and Maria SoledadMartinez Peria for helpful discussion.
2
FINANCIAL AND LEGAL CONSTRAINTS TO FIRM GROWTH :DOES SIZE MATTER?
ABSTRACT
Using a unique firm-level survey data base covering 54 countries, we investigate whether different financial, legal
and corruption issues firms report as obstacles actually affect their growth rates. Our results show that the extent to
which these factors constrain a firm’s growth depends very much on its size and that it is consistently the smallest
firms that are most adversely affected by all three obstacles. Firm growth is more affected by obstacles in countries
with underdeveloped financial and legal systems and higher corruption. Thus, policy measures to improve financial
and legal development and reduce corruption are well justified in promoting firm growth and particularly the
development of the small and medium enterprise (SME) sector. However, our evidence also shows that the intuitive
descriptors of an “efficient” legal system are not correlated with the components of the legal obstacle that predicts
firm growth. This finding suggests that the mechanism by which the legal systems affects firm performance is not
well understood. Our findings also provide evidence that the corruption of bank officials constrains firm growth in
some countries. This “institutional failure” should be taken into account when modeling the monitoring role of
financial institutions in overcoming market failures due to informational asymmetries.
3
1. Introduction
Corporate finance theory suggests that market imperfections, such as those caused
by underdeveloped financial and legal systems, may constrain firms’ ability to fund
investment projects. Research using firm-level data by Demirguc-Kunt and Maksimovic
(1998) bears out the importance of the financial system and the rule of law for relaxing
firms’ external financing constraints and facilitating their growth.1 While their results
show a strong effect, their conclusions are based on a sample of the largest firms in each
of the economies they study, and relies on inferring firms’ demand for external financing
from a financial model of the firm. In this paper, we use a size-stratified survey of over
4,000 firms in 54 countries to identify the financial and institutional obstacles that firms
believe affect their growth. Our econometric model permits us to determine whether or
not firm growth is in fact affected by these perceived institutional obstacles, and to test
how specific obstacles affect firms of different size.
There is considerable evidence that firm size is related to a firm’s productivity,
access to capital, survival, and profitability. As a result, determining how institutional
differences across countries affect firms of different sizes is important both for
understanding the institutions’ role in the economy and for the design of public policy.
The policy issues are substantial, as greater resources are channeled into the promotion of
small and medium sized enterprises (SMEs). The World Bank alone has approved more
than $10 billion in SME support programs in the past five years, of which $2.9 billion in
1 Work by Rajan and Zingales (1998) and Wurgler (2000) on industry growth, and on law and externalfinancing by LaPorta, Lopez-de-Silanes, Shleifer, and Vishny (1997) is discussed below.

4
the last year.2 However, the rationale for supporting SMEs’ access to capital remains
vague.
A priori it is not clear which aspects of financial and legal development facilitate
firms’ access to capital most and how they affect firms of different size.3 Large firms
internalize many of the capital allocation functions carried out by the financial markets
and financial intermediaries. To this extent, development of financial markets and
institutions should disproportionately benefit small firms. On the other hand, large firms
are most likely to tax the resources of an underdeveloped financial or legal system, since
they are more likely to depend on long-term financing and on larger loans than small
firms. Thus, it is possible that financial development would disproportionately reduce the
effect of perceived obstacles on the largest firms.
Our paper also provides evidence relevant to the reform of legal systems in
developing countries in order to promote access to external finance. Recent literature in
international corporate finance predicts a positive relation between the quality of the
“legal system,” and access to external financing. However, little is known about how
firms’ perceptions conform to the conventional notions of what makes a legal system
efficient (such as the impartiality of courts and the speed with which cases are
adjudicated). Moreover, it is not known whether these conventional notions help predict
the effect of the legal system on firm growth. We address both these issues.
Our paper also provides evidence about the potential costs of monitoring by
financial intermediaries. Several influential theoretical models and public policy
2 World Bank Group Review of Small Business Activities, 2001.3 There is vigorous debate on the precise role of the legal system on firm financing. See, for example, Rajanand Zingales (1999), Pistor (1999), Modigliani and Perotti (1998), Beck, Demirguc-Kunt and Levine(2001, 2002) and Stulz and Williamson (2001).
5
prescriptions rely on monitoring by financial intermediaries to reduce misallocation of
investment in economies with underdeveloped financial markets. Although the reduction
of agency costs caused by firms’ insiders is a major motivation for this monitoring, the
models on which the policies are based typically do not consider the possibility of agency
costs within banks. We examine the evidence that officials in financial intermediaries are
holding up the efficient allocation of capital to smaller firms by relating firm’s reports of
bank corruption to their growth rates.
Our methodology differs from the previous literature in international corporate finance in
several ways. First, we use a unique survey data base, the World Business Environment Survey
(WBES), to analyze the impact of financial, legal and corruption obstacles on firm growth for
small, medium and large firms.4 The WBES is a major cross-sectional firm level survey
conducted in developed and developing countries in 1999 led by the World Bank.5 The richness
of the data base allows us to go beyond earlier papers that infer the presence of institutional
failures from past growth performance.6 The firms that were surveyed reported how they
perceived their growth to be constrained by specific features of their financial and legal systems
in their countries and the corruption they faced. Thus, we are able to analyze (a) how firms in
different financial and legal systems perceive obstacles to growth, and (b) whether in fact there
exist relations between these perceptions and firm growth. Second, unlike previous studies
which have mainly looked at large, listed firms, in this paper we can actually investigate size
4 Surveys of corporate executives have recently been used in another context by Graham and Harvey(2001).5 World Bank created the steering committee of the WBES and many other developed and developingcountry agencies were involved under the supervision of EBRD and Harvard Center for InternationalDevelopment.6 Exceptions are Shiffer and Weder (2001) who investigate different constraints using WBES data andClarke et al (2001) who assess the impact of foreign bank entry on these constraints.

6
differences since around eighty percent of the surveyed firms are small and medium enterprises
(SMEs).
The remainder of the paper is organized as follows. In Section 2 we discuss the
hypotheses that we test. Section 3 discusses the data and summary statistics. Section 4
discusses the empirical methodology. Section 5 presents our main results. Section 6 has
conclusions and policy implications.
2. Conceptual Framework and Methodology
A developed financial system can relax firm financing constraints because well-
functioning markets and intermediaries serve as sources of capital and as mechanisms for
ensuring that investors have access to information about firms’ activities. An effective
legal system also plays an important role in relaxing financing constraints because a firm
that wishes to obtain financing, particularly long term financing, must be able to commit
credibly to controlling opportunistic behavior by corporate insiders. Measures such as
debt covenants or explicit fiduciary constraints only work if there is an effective legal
system that deters violations and demands compensation from violators.
An extensive literature, starting with LaPorta, Lopez-de-Silanes, Shleifer, and Vishny
(1998), argues that differences in legal and financial systems can explain much of the variation
across countries in firms’ financial policies and peformance. Recent empirical evidence supports
the view that the development of a country’s financial system affects firm growth and financing.
In addition to Demirguc-Kunt and Maksimovic’s (1998) firm-level results, Rajan and Zingales
(1998) show that industries that are dependent on external finance grow faster in countries with

7
better developed financial systems.7 Wurgler (2000) shows that the rate at which resources are
allocated to productive industries depends on the development of the financial system. Love
(2000) shows that the sensitivity of investment to cash flow depends negatively on financial
development. La Porta, Lopez-de-Silanes, Shleifer, and Vishny (1997) identify important
differences between legal systems and show their importance for external finance. Demirguc-
Kunt and Maksimovic (1999) show that the origin and efficiency of a legal system facilitates
firms’ access to external finance, particularly long term finance. At the country level, King and
Levine (1993), Levine and Zervos (1998) and Beck, Levine and Loayza (2000) show that
financial development promotes growth and that differences in legal origins explain differences
in financial development.
The literature has less to say about how the state of a country’s financial and legal
institutions affects firms of different sizes.8 We know that in developing economies there are
advantages in belonging to a business group (see Khanna and Krishna’s (2000) study of India).
This finding contrasts with the prevailing view in the US that the ability to escape market
monitoring by recourse to internal capital markets makes large diversified firms inefficient
(Scharfstein and Stein (2000), Rajan and Zingales (2000)).9 However, studies of business groups
in the emerging economies study firms that select to belong to such groups and it is unclear the
extent to which these results generalize to other firms and to other institutional settings. Cross-
country studies of financing choices have found different financing patterns for small and large
firms, in the use of long-term financing and trade credit (Demirguc-Kunt and Maksimovic, 1999
7 Carlin and Mayer (1999) also argue that there exists a relation between a country’s financial system andthe characteristics of industries that that prosper in the country.8 Except to study determinants of firm size by looking at the largest firms around the world. See Beck,Demirguc-Kunt and Maksimovic (2001b)9 For evidence suggesting that large diversified firms in the US economy allocate resources efficiently seeMaksimovic and Phillips (2001).
8
and 2001). However these studies rely on commercial data bases that contain listed firms so that
even the ‘small’ firms are relatively large.
While the cross-country studies suggest that less developed financial and legal
systems can constrain firms, the constraints to firm growth are not generally observed.
Therefore, in the corporate finance literature several different approaches have been used
to identify firms that are constrained. The influential study of US firms by Fazzari,
Hubbard, and Petersen (1988) uses a priori reasoning to argue that low-dividend firms are
constrained. Rajan and Zingales (1998) use the external financing by US firms as a
benchmark, under the assumption that firms in the same industries in other countries
require similar amounts of external financing. Demirguc-Kunt and Maksimovic (1998)
use a different approach. They rely on a financial planning model to obtain the maximum
growth rate that individual firms can attain without access to external finance.10 Firms
growing faster than these predicted rates are externally-financed and potentially
constrained. The next step in these studies is to relate the performance and incidence of
constrained firms to specific country characteristics, such as the level of financial and
legal development to verify that the underdevelopment constrains those firms.
While these approaches can identify the extent to which a population of firms is
financially constrained, they do not allow the investigator to observe whether a specific
market imperfection or institutional failure is affecting a specific firm. The WBES data
base we use in this paper permits this because firms report the extent to which specific
features of their business environment are obstacles to their growth. We use these reports
as evidence of the incidence and severity of institutional obstacles. We then test whether
the obstacles reported by firms are related to firms’ growth, and how this relation is
9
affected by firm size and the financial and legal development. Evidence that an obstacle
constrains firm growth exists when firms report that it does so, and when there is also a
significant negative relation between firm growth and the reported obstacle, controlling
for relevant firm and country factors.
The WBES offers rich and specific information on what the firms consider to be
obstacles to growth. For example, in addition to reporting whether the availability of
financing is an obstacle in general, firms also report whether collateral requirements,
bank bureaucracies, the need to have special connections with banks, high interest rates,
lack of money in the banking system, and access to different types of finance are
obstacles to growth.
Firms in the survey report quite a bit of detail as to what obstacles the legal
system creates: Is it the availability of laws or regulations, or consistent interpretation of
these laws? Is it the overall efficiency of the system that is lacking or confidence that the
legal system will enforce contract and property rights? Do the firms perceive the speed,
affordability, consistency, or fairness of the legal system particularly constraining?
The WBES data set also provides detailed information about corruption the firms
face. The survey reports what is most troubling for firms: is it the need to make
additional payments, not knowing the amount of these payments, or the uncertainty that
the job will be done even after the payments are made? There is also information on the
proportion of revenues paid as bribes, percentage of management’s time spent with
regulators, and the proportion of the value of contracts that need to be paid to gain access
to government contracts.
10 See Higgins (1977) for a discussion of sustainable growth rates.
10
Empirical evidence based on cross-country comparisons does suggest that
corruption has large, adverse effects on private investment and economic growth (Mauro,
1996). Corruption may increase the size of the unofficial economy and lower efficiency
since resources that are hidden may not find their highest-value uses (Shleifer and
Vishny, 1993; Johnson et al., 2000). Here, we examine whether corruption also has a
significant impact in constraining firm growth.
Of particular interest is whether firms are constrained by the existence of
corruption in financial intermediaries. The role of financial institutions in directing and
monitoring investment in underdeveloped economies has long been recognized
(Gerschenkron (1962)). More recently financial theorists have suggested that monitoring
by banks, when combined with loans of different maturity, can alleviate agency problems
that arise when firms’ insiders have private benefits and the market for corporate control
is weak (Diamond (1994)). Both the theoretical models and the policy prescriptions rely
on the absence of agency problems or corruption in banks. The WBES survey data
enables us to discover whether firms of different sizes perceive corruption in banks to be
an obstacle to obtaining finance and to test whether their perceptions are related to firms’
growth rates.
The WBES data includes firms usually excluded from commercial data bases.
Eighty percent of the surveyed firms by WBES are small and medium enterprises. Thus,
the richness of the data and its coverage enable us to investigate questions and a
population of firms we have not been able to study before. However, the methodology
has the potential disadvantage of relying on unaudited self-reporting by firms. Thus, it is
possible that unsuccessful firms may blame institutional obstacles for their poor

11
performance. This possibility has to be balanced by the likelihood that alternative data
sources used in cross-country firm-level research, such as accounting data, are also
subject to distortion. 11 With accounting data the auditing process provides a measure of
quality control. However, the quality of the audit may vary systematically across
countries and firm size. 12 Moreover, the incentives to distort accounting data are likely
to be much higher, since financial statements report publicly on the firms’ operations and
may therefore affect operational and financing decisions.
While this possibility of data bias can never be totally eliminated, we believe that
it is unlikely to be a significant source of bias in this study. The stated purpose of the
WBES survey is to evaluate the business environment, not firm performance. Firms were
asked few specific questions about their performance and these were asked at end of the
interview. This sequencing reduces the respondents need to justify their own
performance when answering the prior questions about the business environment.
Respondents were asked about a large range of business conditions and government
policies. Thus, to the extent that firms need to shift blame for poor performance to
outside forces, an unsuccessful firm that is not financially constrained is likely to find
other, more immediate, excuses for its internal failures.
In evaluating the responses we do not focus on the raw responses, but on how the
reported obstacles are related to growth as the financial and legal systems vary. Since our
descriptors of financial systems are obtained from other sources, we would not expect to
obtain a differential relation between firm growth and reported obstacles if these merely
11 See for example Kaplan and Zingales (1997) who use unaudited verbal statements characterizing firms’financial positions in US annual reports to question results of earlier classifications of firms as constrainedand unconstrained.
12
reflect the firm’s internal situation. Moreover, if biases in reporting are pertinent, they are
more likely to affect responses to general questions about obstacles then to responses
pertaining to specific obstacles to growth.13 To assess this, and as a robustness check of
our specification, below we also report estimates obtained using country-level
instrumental variables which are by construction not subject to reverse causality between
low firm performance and the respondents’ propensity to blame the business environment
for disappointing performance.
In summary, using firm-level data for 54 countries, the questions we seek to
answer are:
• How is firm growth affected by specific financial, legal and corruption obstacles
they face?
• Are small and medium size firms affected differently by different obstacles?
• Do obstacles affect firm growth differently based on the national level of financial
and legal development or corruption? Are firms of a given size constrained
everywhere in the same way, or are they constrained more severely in countries
with underdeveloped financial and legal systems and higher levels of corruption?
• Is there evidence that corruption of bank officials is a serious obstacle to small
firms in some economies?
• Are there specific features of the legal system which affect firm growth
adversely?
12 Financial data used in previous studies is also subject to potential biases because country institutionalfactors can affect the properties of accounting data. See Ball, Kothari, and Robin (2000) and Hung (2001).13 We are grateful for the referee for pointing this out.

13
3. Data and Summary Statistics
The WBES firm-level data consist of firm survey responses of over 4,000 firms
in 54 countries.14 The main purpose of the survey is to identify obstacles to firm
performance and growth around the world. Thus, the survey has a large number of
questions on the nature of financing and legal obstacles to growth, as well as corruption
issues. Information on firms is more limited but the survey includes data on firm
employment, sales, industry, growth and number of competitors. The survey also has
information on ownership, and whether the firm is an exporter or has been receiving
subsidies from national or local authorities.
In addition to the rich detail on the obstacles, one of the greatest values of this
survey is its wide coverage of small and medium firms. The survey covers three groups
of firms. Small firms are defined as those with 5 to 50 employees. Medium firms are
those that employ 51 to 500 employees and large firms are those that employ more than
500 employees. Forty percent of our observations are from small firms, another forty
percent are from medium firms and the remaining twenty percent are from large firms.
Table AI in the Appendix reports the number of firms for each country in the sample.
For each of the countries we also use data on GDP per capita, GDP in US dollars, growth
rate of GDP and inflation. In addition, we use information on financial system
development, legal development and corruption. Country level variables are 1995-1999
averages. They are compiled as discussed in Beck, Demirguc-Kunt and Levine (2000).
In Table I we summarize relevant facts about the level of economic development,
firm growth and firm level obstacles in the sample countries. Details of sources are in the
14 The survey actually covers 80 economies. However the sample is reduced because most firm-level orcountry-level variables are missing for 26 countries.
14
Appendix. The countries in the sample show a great deal of variation. They range from
Haiti, with an average GDP per capita of 369 dollars to U.S. and Germany, with per
capita incomes of around $30,000. We also provide the average annual growth rate of
per capita GDP as a control variable. If investment opportunities in an economy are
correlated, there should be a relationship between the growth rate of individual firms and
the growth rate of the economy. Average inflation rate also provides an important
control in that it is an indicator of whether local currency provides a stable measure of
value in contracting. The countries also vary significantly in the rate of inflation, from a
low of zero percent in the cases of Sweden and Argentina, up to 86 percent in the case of
Bulgaria.
Insert Table I here
Firm growth rates, reported in column 4 of Table I, are sales growth rates for
individual firms averaged over all sampled firms in each country. Firm growth rates also
show a wide dispersion, from negative rates of 19 percent for Armenia and Azerbaijan to
a positive 34 percent for Poland.
The last three columns of Table I show firm-level financing, legal and corruption
obstacles reported by firms averaged over all firms in each country. In the WBES,
enterprise managers were asked to rate the extent to which financing, legal and corruption
problems presented obstacles to the operation and growth of their businesses. The ratings
were quantified by assigning them values: 1, no obstacle; 2, minor obstacle; 3, moderate
obstacle; and 4, major obstacle. As Table I illustrates, in the large majority of the
countries firms report financing obstacles to be the most important obstacle to growth.
15
Also in general, the reported obstacles tend to be lower in developed countries such as the
U.K. and the U.S. compared to those in developing countries.
Insert Table II here
Table II contains the sample statistics of the variables we consider. In addition to
the financial, legal and corruption obstacles presented above, which capture summary
obstacles in there areas, firms were also asked more detailed questions to understand the
nature of these obstacles to growth better. We also investigate these variables.
As part of assessing the importance of financing obstacles, the firms were asked
to rate, again on a scale of one to four, how problematic different financing issues are for
the operation and growth of their business. These are: (a) collateral requirements of
banks and financial institutions, (b) bank paperwork and bureaucracy, (c) high interest
rates, (d) need for special connections with banks and financial institutions, (e) banks
lack money to lend, (f) access to foreign banks, (g) access to non-bank equity, (h) access
to export finance, (i) access to financing for leasing equipment, (j) inadequate credit and
financial information on customers, and (k) access to long term loans.
Among the specific financial obstacles to growth, high interest rates stand out at
3.24, which should be a constraint for all firms in all countries. Access to long term
loans, and bank collateral and paperwork requirements also appear to be among the larger
reported obstacles to growth.
There are also detailed questions on the legal system. Businesses were asked if
(a) information on laws and regulations were available, (b) the interpretation of laws and
regulations were consistent, and whether they were confident that the legal system will
uphold their contract and property rights in business disputes (c) now and (d) three years

16
ago. These are rated between (1) fully agree to (6) fully disagree. Further, businesses
were asked to evaluate whether their country’s courts are (a) fair and impartial, (b) honest
and uncorrupt, (c) quick, (d) affordable, (e) consistent, (f) enforced decisions. These are
rated from 1 (Always) to 6 (Never).15 Finally, businesses were asked to rate the overall
quality and efficiency of courts between (1) very good to (6) very bad.
Looking at these legal obstacles to growth, quickness of courts seems to be one of
the important obstacles with a value of 4.77. Other important obstacles include the
consistency and affordability of the courts.
The final set of questions we investigate relate to the level of corruption the firms
have to deal with. The questions are (a) whether corruption of bank officials creates a
problem (rated from 1 to 4 as described above), if (b) firms have to make “additional
payments” to get things done, (c) firms generally know what the amount of these
“additional payments” are, (d) services are delivered if the “additional payments” are
made as required, (e) it is possible to find honest agents to circumvent corrupt ones
without recourse to unofficial payments. Others include (f) the proportion of revenues
paid as bribes (increasing in payment ranked from 1 to 7)16, (g) proportion of contract
value that must be paid as “unofficial payments” to secure government contracts
(increasing in payment ranked from 1 to 6)17, (h) proportion of management’s time in
dealing with government officials about the application and interpretation of laws and
regulations (increasing in time from 1 to 6). Unless specified, answers are ranked from 1
(Always) to 6 (Never).
15 Exact ratings are: 1=Always, 2=Usually, 3=Frequently, 4=Sometimes, 5=Seldom, 6=Never.16 Exact ratings are 1=0%, 2= less than 1%, 3=1% to 1.9%, 4=2% to 9.99%, 5=10% to 12%, 6=13% to25%, and 7=greater than 25%.17 Exact rating are 1=0%, 2=up to 5%, 3=6% to 10%, 4=11% to 15%, 5=16% to 20%, 6= greater than 20%.

17
Of the specific corruption obstacles reported, the need to make additional
payments is the highest at 4.36. It is followed by inability to have recourse to honest
officials at 3.58.
One potential problem with use of survey data is that enterprise managers may
identify several obstacles, only some of which are constraining, while others can be
circumvented. For this reason, we examine the extent to which reported obstacles affect
the growth rates of firms. To do this, we obtain benchmark growth rates by controlling
for firm and country characteristics and assess whether the level of a reported obstacle
affects growth relative to this benchmark.18
As firm level controls, we use indicators of firm ownership, industry, market
structure and size. Since the sample includes firms from manufacturing, services,
construction, agriculture and other industries, we control for industry effects by including
industry dummy variables.
We also include dummy variables that identify firms as government- owned or
foreign-controlled. Government-owned firms may grow at different rates because their
objectives may differ from those of other firms or because their exposure to obstacles.
For example, they may they may have advantages dealing with the regulatory system,
and they may be less subject to crime or corruption by financial intermediaries and more
exposed to political influences. The growth rate of foreign institutions may also be
different because foreign entities may find it more difficult to deal with local judiciary or
corruption. However, they may be less affected by financing obstacles since they could
have easier access to the international financial system.
18 We do not have firm-level measures of investment opportunities, such as Tobin’s Q. Many firms in oursample are not publicly traded.

18
Growth rate of firms may also depend on the market structure they operate in.
Therefore, we also include dummy variables to capture whether the firm is an exporting
firm, whether it receives subsidies from local and national government, and the number
of competitors it faces in its market.
Finally, firm size may be a very important factor in how the firm growth is
constrained by different factors. Small firms are likely to face tougher obstacles in
obtaining finance, accessing legal systems or dealing with corruption (See for example,
Schiffer and Weder, 2001). Here, size is a dummy variable taking the value 1 for small
firms, 2 for medium firms and 3 for large firms.
Panel B of Table II shows the correlation matrix for the variables in our study.
Foreign firms and exporters have higher growth rates whereas government-owned firms
have significantly lower rates of growth. Also, firms in richer, larger, and faster growing
countries have significantly higher growth rates. As expected, higher financing, legal,
and corruption obstacles are correlated with lower firm growth rates.
Correlations also show that government-owned firms are subject to higher
financing obstacles, but lower corruption. Foreign-controlled firms and exporters, face
lower financing obstacles, as well as corruption. Financing obstacles seem to be the
highest for manufacturing firms, whereas firms in services industry are the least affected
by all obstacles. To the extent firms have greater number of competitors, they seem to
face greater financing obstacles and corruption.
All obstacles are significantly lower in richer, larger and faster growing countries,
but significantly higher in countries with higher inflation. Firms are also significantly
larger in richer, larger and faster growing countries. Firm size itself is not correlated with
19
firm growth. However, size is likely to have an indirect effect on firm growth since
larger firms face significantly lower financing, legal and corruption obstacles. Finally, all
three obstacles are highly correlated with each other so that firms that suffer from one are
also likely to suffer from others.
We have computed, but do not report, the correlations of specific obstacles with
summary financing, legal and corruption obstacles, respectively. Overall, specific
obstacles are highly correlated with the summary ones and with each other. The
correlation between the summary corruption obstacle and the corruption of bank officials
is significant and particularly high at 43 percent.
We next explore the relation between the financing, legal, and corruption
obstacles reported by firms in the WBES survey and firm size, controlling for country-
level institutional development. To capture institutional development, we use
independently computed country-level measures of the size of the financial sector,
development of the legal sector and the level of corruption. As a measure of financial
development, we use Priv, given by the ratio of domestic banking credit to the private
sector divided by GDP. Legal development is proxied by Laworder, which is an index of
the efficiency of the legal system. It is rated between 1 and 6, with higher values
indicating better legal development. Corruption is captured by Corrupt, which is an
indicator of the existence of corruption, rated between 1 to 6, with higher values
indicating less corruption
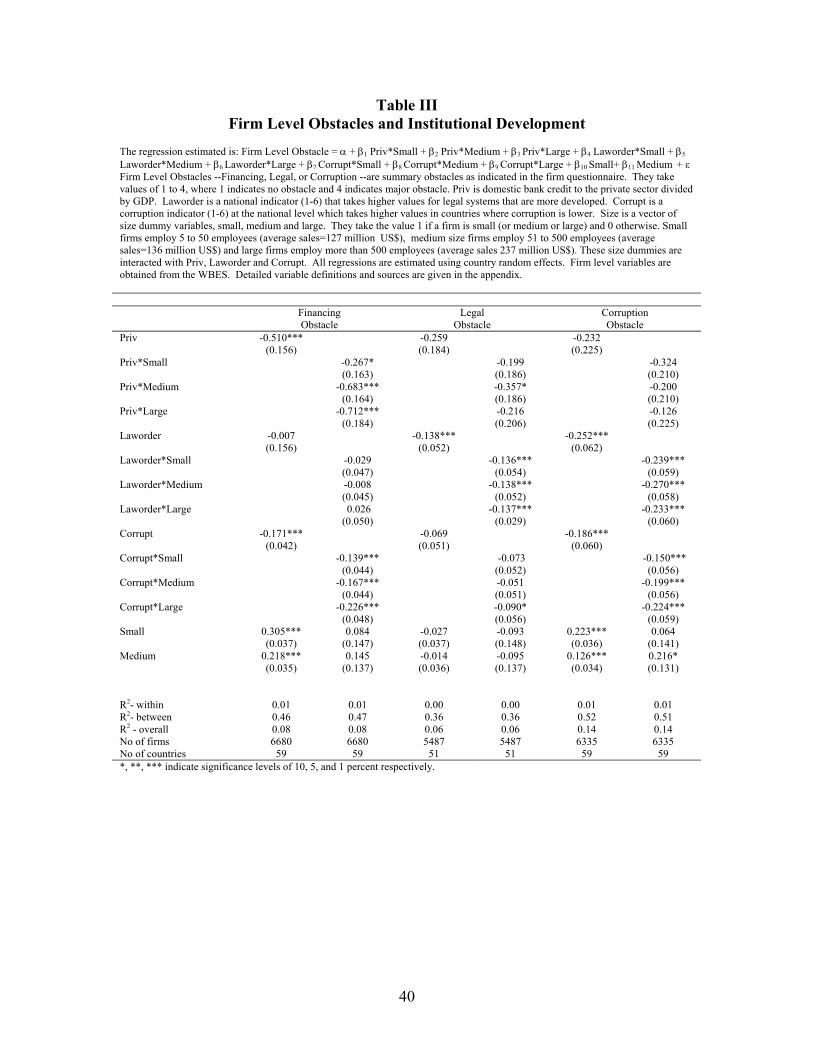
In Table III, the firm-level survey responses are regressed on size dummies and
the country-level variables. The three size dummy variables, small, medium, large, take
the value 1 if the firm is small or medium or large respectively and zero otherwise. We
20
also report specifications where country-level variables are interacted with firm size.
Inspection of Table III reveals that on average the firms’ perception of the financing and
corruption obstacles they face is related to firm size, with smaller firms reporting
significantly higher obstacles. In contrast, smaller firms report lower legal obstacles than
larger firms, but these differences are not significant.
Table III also shows that in countries with more developed financial systems and
with less country-level corruption firms report lower financing obstacles. These effects
are more significant and the coefficients are greater in absolute value for the largest
firms, particularly in the case of financial development. The indicator of the quality of
the legal system does not appear to explain the magnitude of the firm-level financing
obstacles.
The firm-level legal obstacles are significantly negatively related to the quality of
the country’s legal system. The corruption obstacles reported by firms in our sample are
higher in countries with less developed legal systems and in countries that have a higher
score on our index of corruption. These relations appear to be unrelated to firm size.
Insert Table III here
Table III shows that firm size is an important determinant of the level of financial
and corruption obstacles reported by firms even after controlling for the quality of a
country’s institutions. However, to determine if firm size really has an impact we need to
investigate both the level of the reported obstacles and how firm growth is affected by
these obstacles.
4. The Empirical Model

21
The regressions reported above indicate that there exist statistically significant
relations between different obstacles, firm size and a country’s institutional development.
However, Table II also indicates that there is a high degree of correlation between
variables of interest and other firm and country level controls. Next, we conduct
regression analysis to clarify the relationships between firm level characteristics and firm
growth.
The regression equations we estimate are of the form:
Firm Growth = α + β1 Government + β2 Foreign + β3 Exporter + β4Subsidized +
β5 No. of Competitors + β6 Manufacturing + β7 Services + β8 Inflation + β9 GDP per
capita + β10 GDP+ β11 Growth + β12 Financing + β13 Legal + β14 Corruption+ ε. (1)
All regressions are estimated using firm level data across 54 countries and country
random effects. We introduce Financial, Legal and Corruption obstacles one at a time,
and finally all together. In different regressions we substitute these summary obstacles
by specific ones.
To investigate the relation between growth and reported obstacles for different
sized firms, we estimate different specifications where we interact the size dummies with
individual obstacles. For example for the financing obstacle, we estimate:
Firm Growth = α + β1 Government + β2 Foreign + β3 Exporter + β4 Subsidized +
β5 No. of Competitors + β6 Manufacturing + β7 Services + β8 Inflation + β9 GDP per
capita + β10 GDP+ β11 Growth+ β12 Size+ β13 Financing Obstacle*Small + β14 Financing
Obstacle *Medium + β15 Financing Obstacle *Large+ ε. (2)
By comparing β13, β14 , and β15 and evaluating them at the mean level of reported
obstacle for each group of firms, it is possible to see if financing obstacles affect firm
22
growth differently for small, medium and large firms. Notice here we also introduce size
directly in the equation. Similarly, interacting size variables with the legal and corruption
obstacles allows us to see if these different obstacles constrain firm growth differently
based on size.
Next, it is of interest to find out if firms are equally constrained everywhere
around the world, or if they are constrained more in developing countries where firms
have to deal with underdeveloped financial and legal systems and face higher corruption.
In other words, while it is interesting to see that smaller firms are more constrained
everywhere around the world, for policy advice it would be more important to know if
these constraints can be relaxed through development.
To get at this issue, we include an interaction term of financing obstacles with
our measure of financial development, Priv. The use of this indicator to capture financial
development is common in the literature.19 We also introduce Priv directly in the
equation since our earlier work has shown that level of financial development affects firm
growth (see Demirguc-Kunt and Maksimovic, 1998). Thus, to investigate the impact of
financing obstacles, we estimate:
Firm Growth = α + β1 Government + β2 Foreign + β3 Exporter + β4 Subsidized +
β5 No. of Competitors+ β6 Manufacturing + β7 Services + β8 Inflation + β9 GDP per
capita + β10 GDP+ β11 Growth+ β12Priv+ β13Financing Obstacle + β14Financing Obstacle
*Priv+ ε. (3)
The coefficient of the interaction term, β14 , indicates whether an increase in
financial development has any impact on the way financial obstacles constrain firm
19 See the discussion in Beck, Demirguc-Kunt and Levine (2000).

23
growth. It is also possible to investigate if financial development relaxes these
constraints for all firms regardless of size. Then, the estimated equation becomes:
Firm Growth = α + β1 Government + β2 Foreign +β3 Exporter +β4Subsidized +
β5No. of Comp.+ β6Manuf. + β7 Services + β8 Inflation + β9 Gdp/cap + β10 GDP+ β11
Growth + β12 Priv*Small + β13 Priv*Medium+ β14 Priv*Large+ β15 Size+β16Financing
*Small +β17Financing*Medium + β18Financing*Large+β19 Financing*Small*Priv +
β20Financing*Medium*Priv + β21 Financing*Large*Priv+ ε. (4)
Then coefficients β19 , β20 and β21 would indicate if a marginal improvement in
financial development relaxes the financing constraints of small, medium and large firms
to the same extent.
We replicate the above analysis for legal obstacles to growth, by replacing Priv in
equation (3) by Laworder. In the case of corruption obstacles, we replace Priv in
equation (3) by Corrupt. As in the case of the financing obstacles, we also investigate
whether the impact of legal and corruption obstacles are relaxed to a similar extent for
different size firms for higher values of Laworder and Corrupt by estimating versions of
equation (4).
5. Results
Table IV shows how firm growth is constrained by financing, legal and corruption
obstacles, after controlling for country and firm-specific variables. When entered
individually, all reported obstacles have a negative and significant effect on firm growth
24
as expected. The last column in the table enters all three reported obstacles together. The
results show that financing and legal coefficients are both significant and negative, while
corruption loses its significance. This indicates that both financing and legal obstacles
independently reduce firm growth, and that the impact of corruption is captured by the
financial and legal obstacles which also incorporate corruption in the legal and financial
sector.
Insert Table IV here
Looking at other control variables, we see that the growth rates of government-
owned firms are slower, and that of exporters, faster. Foreign firms also appear to grow
faster, although this result is only significant at 10 percent in two specifications. We do
not observe significant differences in the growth rates of firms in different industries.
Inflation develops a significant and positive coefficient in two of the four specifications.
This probably reflects the fact that firm sales growth is given in nominal terms. Finally,
GDP growth rate and firm growth are significantly and positively correlated, indicating
that firms grow faster in an economy with greater growth opportunities. Most of the
explanatory power of the model comes from between country differences as indicated by
R2 s of 25 to 28 percent.
Insert Tables V
In Table V we look at specific indicators for financial, legal and corruption
obstacles, and investigate if their impact on growth varies by firm size. Although the
regressions also include the control variables, these coefficients are not reported for
brevity. Panel A shows that collateral requirements, bank paperwork and bureaucracy,
high interest rates, the need to have special connections with banks, lack of money in the

25
banking system, and access to financing for leasing equipment, all have significantly
constraining effects on firm growth, particularly for small and medium firms. It is
interesting to note that while access to long term loans was rated as an important
constraint by the firms, it is not significantly correlated with firm growth. This may be
because it is possible to substitute short term financing that is rolled over at regular
intervals for long term loans. Also, it is reassuring to see that those firms which claim to
be constrained by high interest rates actually grow slower, as we expect interest rates to
constrain all firms. It is also important to note that some of these factors are likely to be
correlated with lack of development of the financial system. Other potential constraints,
such as access to foreign banks, access to non-bank equity, access to export finance, or
inadequate information on customers are not significantly correlated with firm growth.
Panel A also shows that financial obstacles affect firms differently based on their
size. First column shows that the financing obstacle constrains the smallest firms the
most and the largest ones the least. Multiplying the coefficients with the mean level of
constraints for each group reveals that the magnitude of the effect for small firms is more
significant and almost double that of large ones.20 These differences become even
clearer when we look at individual financing obstacles: The largest firms are barely
affected, with only high interest rates developing a negative and significant coefficient at
5 percent. It is not surprising that large firms are also affected by high interest rates since
we expect interest rates to affect all firms. Largest firms are completely unaffected by
collateral requirements, bank bureaucracies, the need to have special connections
(probably because they already have them), banks’ lack of money or any of the access
issues. In contrast, medium size firms and particularly small firms are significantly and
26
negatively affected by collateral requirements, bank paperwork and bureaucracy, high
interest rates, the need to have special connections with banks, banks lack of money to
lend, and access to financing for leasing equipment. In addition, smallest firms are
negatively affected by obstacles on access to export finance. These results provide
evidence that financial obstacles have a much greater impact on the operation and growth
of small and medium firms.21
Panel B shows that while the summary legal obstacle has a highly significant and
negative impact on firm growth, none of the other more specific legal obstacles develop
significant coefficients. It appears that firms are able to work around these particular
obstacles although they find them annoying. Nevertheless, regressing the reported legal
obstacle on the quality of the courts, their fairness, honesty, quickness, affordability,
consistency, enforcement capacity, and the confidence in the legal system shows that
these factors are able explain about 50 percent of the cross-country variation in the legal
obstacle. Specifically, the affordability and consistency of the court system, enforcement
capacity and the confidence in the legal system develop significant coefficients.
However, using the predicted obstacle from this regression in the growth equation leads
to positive yet insignificant results. Thus, while specific obstacles are related to the
summary obstacle, they play a minor role in affecting growth. This suggests that the
usual intuitive descriptors of how a good legal system operates do a good job of
predicting survey responses but do not capture the effect of the legal system on firm
growth.
20 The values are 10.7, .8.7 and 6.0 percent per year for small, medium and large firms, respectively.21 Firm size itself, never develops a significant coefficient in the regressions, consistent with simplecorrelations reported in Table II.

27
Regarding size differences, the results are similar to financing obstacles. The legal
obstacle leaves large bank growth unaffected, while it has a negative and significant
impact on the growth rates of medium and especially small firms. This is true regardless
of the fact that the level of the obstacles are higher for larger firms. To evaluate the
economic effect of the obstacle, we multiply the estimated coefficient by the mean
reported level of the obstacle for each sub-sample of firms by size. The predicted effect
of the obstacle on annual firm growth is 2.8 percent for large firms, whereas it is 5.7
percent for medium firms, and 8.5 percent for small firms. These results indicate that
large firms are better able to adjust to the inefficiencies of the legal system. This does not
seem to be the case for small and medium enterprises which end up paying for the legal
shortcomings in terms of slower growth. Even looking at specific obstacles –which do
not capture relevant differences as well as the summary one- there is an indication that
large firms may be using legal inefficiencies to their advantage, as poor enforcement of
court decisions appear to contribute to large firm growth rates. However, there is
insufficient evidence to make such a case. As for small firms, affordability of the court
system emerges as a significant constraint, although the coefficient is significant only at
10 percent.
In Panel C we see that in addition to the corruption obstacle, the proportion of
revenues paid as bribes is also a good indicator of corruption, developing a negative and
highly significant coefficient. Again, it is the small and medium firms that are negatively
affected by corruption.22 None of the corruption obstacles develop significant signs for
large firms. The corruption obstacle is negative but significant at 10 percent for medium
22 The mean effects on firm growth are 1.6, .4.1 and 7.5 percent per year for large, medium and smallfirms, respectively.
28
sized firms and negative and highly significant for small firms. When we look at
individual obstacles, we again see that it is the small and medium enterprises that are
affected by bribes, and this time both coefficients are highly significant, although the
impact on small firm growth is larger in magnitude. The percentage of senior manager’s
time spent with officials to understand regulations reduces the growth rates of both small
and medium enterprises, but only at 10 percent significance. In addition, small firms are
significantly and negatively affected by variables that capture the corruption of bank
officials and uncertainty that services will be delivered even after bribes are paid. The
need to make payments or absence of recourse to honest officials do not develop
significant signs in regressions despite their high reported ratings as obstacles.
Insert Table VI
Next, we address the issue whether obstacles affect firms similarly in all countries
or whether the impact depends on the country’s level of financial and legal development
and corruption. Estimates of equation (3) for the financing, legal and corruption
obstacles are presented in Table VI. The results indicate that firms in financially and
legally developed countries with lower levels of corruption are less affected by firm-level
obstacles in these areas. This is true because (i) in all three cases the coefficient of the
obstacle remains negative and significant and its interaction with the relevant
development variable develops a positive and significant coefficient;23 and (ii) as we
reported in Table III, the levels of obstacles are also higher in countries with
underdeveloped financial and legal systems and higher levels of corruption.
23 Priv and Laworder do not develop significant coefficients when entered together with financing andlegal obstacles. Corruption, on the other hand does develop a positive and significant coefficient in some
29
In unreported regressions we also estimated equation (3) with each specific
obstacle. The interaction term develops a positive and significant coefficient for lack of
money in the banking system, consistent interpretation of laws, amount of bribes to be
paid, and contract value that has to be paid to government. These results are also
consistent with the hypothesis that in countries where there is less corruption, better
developed financial and legal systems, firm growth is less constrained by the factors we
examine.
Insert Table VII
Taking into account firm size makes these results even stronger. For the
financing, legal and corruption obstacles, Table VII reports results taking into account
differences in firm size when looking at the impact of national differences in how firm
level obstacles affect growth (as illustrated in equation (4) for the financing obstacle).
Column 1 of Table VIII shows that small firms are the most severely affected by
financing obstacles also in this specification. However, the interaction term of the
financing obstacle for small firms with Priv develops a positive and significant sign
which indicates that a marginal development in a country’s financial system relaxes the
financial constraints on small firms. In column 2 of the table, we see a similar result that
marginal improvements in legal efficiency are translated into relaxing of legal constraints
for small and medium firms (albeit significant at ten percent). Similarly, corruption
results reported in column 3 indicate that as countries manage to reduce corruption, the
constraining effect of corruption on the growth of small and medium firms diminishes.
specifications even when entered together with firm-level corruption obstacles, indicating that lack ofcorruption is associated with higher firm growth.
30
We perform robustness checks of our specifications to address two possible
sources of bias. Our estimates would be biased if firms that are not growing because of
internal problems systematically shift blame to the legal and financial institutions and
report high obstacles. As we note in Section 2, this type of reverse causality problem, if it
exists, is likely to be most severe in the case of the summary obstacles. To examine this
possibility we re-estimated the specifications in Table IV using Priv, Laworder and
Corrupt as instrumental variables. The coefficients of interest are reported in Panel A of
Table VIII and show that the same variables remain significant at roughly comparable
levels of significance.
Insert Table VIII
Panel B shows the relation between the obstacles and firms’ real growth. In this
specification the rate of inflation variable is dropped from the right hand side. Inspection
of Panel B reveals that adjusting the dependent variable for inflation does not alter the
results.
6. Conclusions
In this paper we investigate whether different financial, legal and corruption
obstacles firms report actually affect their growth rates. The paper makes a number of
contributions to the literature. First, by making use of a unique survey data base we are
able to investigate a rich set of obstacles reported by firms and directly test if any of these
reported obstacles are significantly correlated with firm growth rates. Second, the data
base also allows us to focus on differences in firm size since it has good coverage of
small and medium enterprises in 54 countries. Third, we investigate if the extent to
which the firms are constrained by different obstacles depends on the level of

31
development of the financial and legal system and the national level of corruption.
Finally, one of the categories of constraints we investigate is corruption, and its impact on
firm growth has not been investigated before.
Our results indicate that the extent to which financial, legal and corruption factors
constrain a firm’s growth depends very much on its size. We show that it is consistently
the smallest firms that are most adversely affected by all obstacles. Taking into account
national differences between financial and legal development and corruption, we see that
those firms that operate in underdeveloped systems with higher levels of corruption are
affected by all obstacles to a greater extent. We also see that a marginal development in
the financial and legal system and a reduction in corruption helps relax the constraints for
the small and medium firms, which are the most constrained.
All three obstacles – financial, legal, and corruption – do affect firm growth rates
adversely. But not all specific obstacles are equally important, and the ones that affect
firm growth are not necessarily the highest rated by firms. Looking at individual
financing obstacles, we see that difficulties in dealing with banks, such as bank
paperwork and bureaucracies, and the need to have special connections with them do
constrain firm growth. Collateral requirements and certain access issues –such as
financing for leasing equipment- also turn out to be significantly constraining. In
addition, macroeconomic issues captured by high interest rates and lack of money in the
banking system significantly reduce firm growth rates. These effects remain significant
even after we control for the level of financial development. Interestingly, another
obstacle that is rated very highly by firms- access to long term loans- does not affect their

32
growth rates significantly, perhaps because it is possible to substitute short term funding
for long term loans.
Legal and corruption obstacles, particularly the amount of bribes paid, the
percentage of senior management’s time spent with regulators, and corruption of bank
officials also constrain firm growth significantly. However, other obstacles such as the
quickness of courts, or the need to make additional payments, which are both rated very
highly by firms as important obstacles, do not affect firm growth significantly. These
results suggest that the surveys elicit all kinds of complaints which may appear equally
important. However, our methodology allows us to distinguish between those obstacles
that are merely annoying from those that truly constrain firm performance. Two findings
are of particular interest. First, the corruption of bank officials does affect firm growth.
This provides evidence for the existence of “institutional failure” which has to be taken
into account when modeling the monitoring role of financial institutions in overcoming
market failures due to informational asymmetries. Second, the finding that the intuitive
descriptors of an “efficient” legal system are not correlated with the components of the
summary legal obstacle that predicts firm growth suggests that the mechanism by which
the legal systems affects firm performance is not well understood yet.
Our results have important policy implications. Development institutions devote
large amount of resources to small and medium enterprises (SMEs) because the
development of the SME sector is believed to be crucial for economic growth and
poverty alleviation. This paper provides evidence that indeed small and medium sized
firms face greater financial, legal and corruption obstacles compared to large firms, and
that the constraining impact of obstacles on firm growth is inversely related to firm size.

33
The paper also shows that it is the small firms that stand to benefit the most from
improvements in financial development and reduction in corruption. Thus, efforts in this
area are well justified in promoting the development of the SME sector.

34
RERENCES
Ball, R., Kothari, S.P. and Robin, A., 2000. The effect of international institutionalfactors on properties of accounting earnings. Journal of Accounting andEconomics 29, 1-51.
Beck, Thorsten; Levine, Ross; Loayza, Norman, 2000, “Finance and the Sources ofGrowth,” Journal of Financial Economics, 58(1).
Beck, Thorsten; Demirguc-Kunt, Asli; Levine, Ross, 2000, “A New database on the Structureand Development of the Financial Sector” The World Bank Economic Review (14), 597-605.
Beck, Thorsten; Demirguc-Kunt, Asli; Levine, Ross, 2001, “Law, Endowments andFinance” World Bank mimeo.
Beck, Thorsten; Demirguc-Kunt, Asli; Levine, Ross, 2002, “Law and Finance: Why DoesLegal Origin Matter?” World Bank mimeo.
Beck, Thorsten; Demirguc-Kunt, Asli; Maksimovic, Vojislav, 2001a, Financing Patternsand Constraints: The Role of Institutions, World Bank Mimeo.
Beck, Thorsten; Demirguc-Kunt, Asli; Maksimovic, Vojislav, 2001b, Financial and LegalInstitutions and Firm Size, World Bank Mimeo.
Carlin W. and Colin Mayer, 1999, Finance, Investment and Growth, UnpublishedWorking Paper, University College, London.
Clarke, George, Robert Cull, and Maria Soledad Martinez Peria, 2001, Does ForeignBank Penetration Reduce Access to Credit in Developing Countries? Evidencefrom Asking Borrowers, World Bank Mimeo.
Demirgüç-Kunt, Asli and Vojislav Maksimovic, 1998, Law, Finance, and Firm Growth,Journal of Finance 53, 2107-2137.
Demirgüç-Kunt, Asli and Vojislav Maksimovic, 1999, Institutions, Financial MarketsAnd Firm Debt Maturity, Journal of Financial Economics.
Demirgüç-Kunt, Asli and Vojislav Maksimovic, 2001, Firms as FinancialIntermediaries: Evidence from Trade Credit Data, World Bank Working Paper.
35
Fazzari, Steven M., R. Glenn Hubbard, and Bruce C. Petersen, 1988, Financingconstraints and corporate investment, Brookings Papers on Economic Activity 19,141-195.
Gerschenkron, A., 1962, Economic backwardness in historical perspective. HarvardUniversity Press, Cambridge, MA
Graham John R., Harvey Campbell R., The theory and practice of corporate finance:evidence from the field, Journal Of Financial Economics (60)2-3 (2001) pp. 187-243.
Hung, Mingyi, 2001, Accounting standards and value relevance of financial statements:An international analysis, Journal of Accounting and Economics 30, 401-420.
Johnson, Simon; Daniel Kaufmann, John McMillan, and Christopher Woodruff, 2000,“Why do firms hide? Bribes and unofficial activity after communism,” Journal ofPublic Economics, 76, 495-520.
Kaplan, Steven N. and Luigi Zingales, 1997, Do Investment-Cash Flow SensitivitiesProvide Useful Measures of Financing Constraints? Quarterly Journal ofEconomics 112 (February 1997); 0033-5533
King, Robert G. and Levine, Ross,1993, “Finance and Growth: Schumpeter Might BeRight”, Quarterly Journal of Economics, 108, 717-38.
La Porta, Rafael; Lopez-de-Silanes, Florencio; Shleifer, Andrei; and Vishny, Robert W.1998, Law and Finance, Journal of Political Economy 106, 1113-1155.
La Porta, Rafael; Lopez-de-Silanes, Florencio; Shleifer, Andrei; and Vishny, Robert W.1997, Legal Determinants of External Finance, Journal of Finance 52, 1131-1150.
Levine, Ross and Zervos, Sara, 1998, "Stock Markets, Banks, and Economic Growth,"American Economic Review, 88(3), 537-558.
Love, Inessa, 2001, “Financial Development and Financing Constraints: InternationalEvidence from the Structural Investment Model,” World Bank Working Paper,No. 2694.
Mauro, Paul, 1996, “The Effects of Corruption on Growth, Investment and GovernmentExpenditure,” IMF Working Paper 96/98.
Modigliani, Franco and Enrico Perotti, 1998, Security versus bank finance: theimportance of a proper enforcement of legal rules, Unpublished MIT workingpaper.

36
Pistor, K., 1999. Law as a determinant of equity market development. Unpublishedworking paper, Harvard University, Cambridge, MA.
Rajan, Rhaguram and Luigi Zingales, 1998, Financial dependence and growth, AmericanEconomic Review 88, 559-587.
Rajan, Rhaguram and Luigi Zingales, L., 1999, The politics of financial development.Unpublished working paper, University of Chicago, Chicago, IL.
Schiffer, Mirjam and Beatrice Weder, 2001, Firm Size and the Business Environment:Worldwide Survey Results, IFC discussion paper number 43.
Shleifer, A. and R. Vishny, 1993, Corruption, Quarterly Journal of Economics, 108 (3),995-1025.
Stulz, Rene and Williamson, Rohan, 2001, "Culture, Openness, and Finance," Universityof Ohio mimeo.
Wurgler, J., 2000. Financial markets and the allocation of capital. Journal of Financial Economics 58, 187-214.
.

37
Table IEconomic Indicators and Obstacles to Firm Growth
GDP per capita is real GDP per capita in US$. Inflation is the log difference of the consumer price index. Growth is the growth rate of GDP incurrent US$. All country variables are 1995-1999 averages. Firm Growth is the percentage change in firm sales over the past three years (1996-99). Financing, Legal, and Corruption are summary obstacles as indicated in the firm questionnaire. They take values 1 to 4, with higher valuesindicating greater obstacles. Firm variables are averaged over all firms in each country. Detailed variable definitions and sources are given in theappendix.
GDP per capita Inflation Growth Firm Growth Financing Cons. Legal Cons. CorruptionAlbania 806.78 0.15 0.03 0.25 3.04 2.76 3.40Argentina 8000.15 0.00 0.02 0.10 3.03 2.27 2.59Armenia 844.11 0.10 0.04 -0.19 2.48 1.51 1.99Azerbaijan 407.75 0.03 0.05 -0.19 3.17 2.60 3.02Bulgaria 1414.61 0.86 -0.02 0.15 3.18 2.27 2.64Belarus 2234.91 0.71 0.07 0.09 3.31 1.55 1.88Belize 2737.70 0.01 0.00 0.13 3.14 1.54 2.00Bolivia 938.55 0.06 0.01 0.07 3.00 2.81 3.53Brazil 4491.67 0.07 0.00 0.04 2.67 2.58 2.49Canada 20548.97 0.01 0.02 0.17 2.11 1.46 1.40Chile 5002.70 0.05 0.03 0.08 2.39 1.97 1.85China 676.76 0.02 0.07 0.05 3.35 1.51 1.96Colombia 2381.19 0.16 -0.01 0.04 2.71 2.41 2.87Costa Rica 3692.47 0.12 0.04 0.25 2.63 2.24 2.59Czech Republic 5158.04 0.07 0.00 0.10 3.17 2.18 2.07Germany 30794.03 0.01 0.01 0.10 2.60 2.14 1.86Dominican Republic 1712.31 0.06 0.06 0.24 2.59 2.41 2.90Ecuador 1538.48 0.30 -0.02 -0.03 3.34 3.09 3.52Spain 15858.03 0.02 0.03 0.26 2.22 1.97 2.08Estonia 3663.49 0.10 0.05 0.61 2.44 1.70 1.92France 27719.92 0.01 0.02 0.21 2.75 1.81 1.63United Kingdom 20186.56 0.03 0.02 0.31 2.21 1.51 1.24Guatemala 1503.25 0.08 0.01 0.14 3.06 2.58 2.68Honduras 707.52 0.16 0.00 0.13 2.93 2.40 2.93Croatia 3845.27 0.05 0.05 0.09 3.32 2.69 2.56Haiti 368.73 0.14 0.00 -0.05 3.39 2.27 3.02Hungary 4705.65 0.15 0.04 0.29 2.61 1.30 1.94Indonesia 1045.04 0.20 -0.02 -0.06 2.82 2.26 2.67Italy 19645.96 0.02 0.01 0.16 1.98 2.27 1.90Kazakhstan 1315.10 0.16 0.02 0.08 3.28 2.13 2.74Kyrgizstan 800.34 0.22 0.04 -0.02 3.48 2.20 3.23Lithuania 1907.93 0.09 0.03 0.08 3.00 2.24 2.44Moldova 667.74 0.18 -0.03 -0.14 3.39 2.47 2.90Mexico 3394.75 0.20 0.04 0.26 3.51 2.94 3.57Malaysia 4536.23 0.03 0.01 0.01 2.67 1.66 2.09Nicaragua 434.69 0.11 0.03 0.19 3.22 2.46 2.88Pakistan 505.59 0.08 0.00 0.08 3.31 2.55 3.53Panama 3123.95 0.01 0.02 0.07 2.13 2.36 2.74Peru 2334.94 0.07 0.01 -0.01 3.10 2.55 2.85Philippines 1125.81 0.08 0.01 0.07 2.69 2.24 3.13Poland 3216.04 0.13 0.05 0.34 2.48 2.32 2.28Portugal 11582.33 0.03 0.03 0.12 1.82 1.86 1.77Romania 1372.02 0.53 -0.02 0.07 3.28 2.60 2.88Russia 2223.57 0.35 0.00 0.28 3.21 2.18 2.62Singapore 24948.09 0.01 0.02 0.11 1.96 1.33 1.29El Salvador 1705.79 0.04 0.01 -0.01 2.98 2.37 2.80Slovakia 3805.41 0.07 0.04 0.11 3.38 2.08 2.44Slovenia 10232.73 0.08 0.04 0.29 2.30 2.29 1.64Sweden 28258.28 0.00 0.02 0.23 1.85 1.49 1.19Trinidad & Tobago 4526.28 0.04 0.04 0.20 2.93 1.44 1.66Turkey 2993.89 0.58 0.01 0.10 3.11 2.28 2.86Ukraine 866.52 0.26 -0.03 0.03 3.46 2.18 2.54Uruguay 6113.60 0.15 0.02 0.03 2.70 1.87 1.84United States 29250.32 0.02 0.03 0.14 2.39 1.79 1.86Venezuela 3482.51 0.40 -0.02 -0.02 2.57 2.65 2.98

38
Table IISummary Statistics and Correlations
Summary statistics are presented in Panel A and correlations are presented in Panel B. N refers to firm level observations for 54countries. Firm Growth is given by the percentage change in firm sales. Government and Foreign are dummy variables that take thevalue 1 if the firm has government or foreign ownership and zero if not. Exporter is a dummy variable that indicates if the firm is anexporting firm. Subsidized is also a dummy variable that indicates if the firm receives subsidies from the national or local authorities.No. of Competitors is the logarithm of the number of competitors the firm has. Manufacturing and Services are industry dummies.Inflation is the log difference of the consumer price index. GDP/capita is real GDP per capita in US$. GDP is the logarithm of GDP inmillions of U.S. dollars. Growth is the growth rate of GDP. All country variables are 1995-1999 averages. The different financing,legal, and corruption issues are survey responses as specified in the firm questionnaire. Higher numbers indicate greater obstacles,with the exception of “Firms have to make ‘additional payments’ to get things done” and “Firms know the amount of ‘additionalpayments’ in advance”. Detailed variable definitions and sources are given in the appendix.Panel A: Summary Statistics:
N Mean Std. Dev. Min Max
Firm Growth 4,255 0.13 0.59 -1 2Government 4,255 0.13 0.34 0 1Foreign 4,255 0.17 0.37 0 1Exporter 4,255 0.35 0.48 0 1Subsidized 4,255 0.10 0.35 0 1Manufacturing 4,255 0.37 0.48 0 1Services 4,255 0.47 0.50 0 1No. of Competitors 4,255 0.80 0.33 0 1.39Size 4,254 1.78 0.72 1 3
Inflation 54 17.41 19.30 0.11 86.05GDP per capita 54 560 772 369 30,794GDP (million $) 54 24.72 1.96 20.30 29.74Growth 54 0.02 0.03 -0.03 0.07
Financing 4,213 2.87 1.13 1 4Legal 3,976 2.17 1.05 1 4Corruption 4,000 2.43 1.17 1 4
Collateral requirements 3,954 2.54 1.17 1 4Bank paperwork/bureaucracy 4,078 2.54 1.10 1 4High interest rates 4,112 3.24 1.03 1 4Need special connections with banks 3,958 2.19 1.09 1 4Banks lack money to lend 3,861 2.10 1.22 1 4Access to foreign banks 3,489 1.99 1.17 1 4Access to non-bank equity 3,470 2.06 1.16 1 4Access to export finance 3,017 1.99 1.19 1 4Access to financing for leasing equipment 3,532 2.02 1.14 1 4Inadequate credit/financial information on customers 3,712 2.21 1.13 1 4Access to long term loans 3,937 2.63 1.27 1 4
Availability of information on laws and regulations 4,211 2.92 1.42 1 6Interpretation of laws and regulations are consistent 4,225 3.42 1.37 1 6Overall quality and efficiency of courts 3,521 3.73 1.31 1 6Courts are fair and impartial 3,933 3.75 1.39 1 6Courts are quick 3,991 4.77 1.22 1 6Courts are affordable 3,910 3.92 1.45 1 6Courts are consistent 3,918 4.04 1.36 1 6Court decisions are enforced 3,905 3.67 1.48 1 6Confidence in legal system to enforce contract & prop. rights 4,206 3.35 1.38 1 6Confidence in legal system – 3 years ago 3,935 3.46 1.40 1 6
Corruption of bank officials 3,574 1.72 1.05 1 4Firms have to make “additional payments” to get things done 3,924 4.36 1.62 1 6Firms know the amount of “additional payments” in advance 2,310 3.38 1.59 1 6If “additional payments” are made, services are delivered 2,269 3.01 1.53 1 6It is possible to find honest agents to replace corrupt ones 3,602 3.58 1.75 1 6Proportion of revenues paid as bribes 2,831 2.35 1.47 1 7Prop. of contract value that must be paid for govt. contracts 1,733 2.51 1.73 1 6Mgmt’s time (%) spent with officials to understand laws & regs 3,990 2.24 1.39 1 6

39
Panel B:Correlation Matrix of Variables
Firm Growth Govt Foreign Exporter Subsidized Manuf. Services No. of comp. Size Inflation GDP/capita GDP($) Growth Financing Legal
Govt. -0.0245*
Foreign 0.0390** -0.0258*
Exporter 0.0844*** 0.1001*** 0.2368***
Subsidized -0.0049 0.1472*** 0.0006 0.081***
Manuf. -0.0180 0.0855*** 0.1165*** 0.3448*** 0.0219
Services 0.0210 -0.0846*** -0.0312** -0.2465*** -0.0759*** -0.7302***
No. of co. 0.0148 -0.0057 -0.1788*** -0.1211*** -0.0285* -0.117*** 0.0334**
Size 0.0224 -0.0245* 0.0390*** 0.0844*** 0.0049 -0.0180 0.0210 0.0148
Inflation 0.0010 0.1335*** -0.1231*** -0.1024*** 0.0049 0.0280* -0.1262*** 0.2640*** 0.0010
GDP/cap 0.0489*** -0.0808*** 0.1262*** 0.1223*** 0.0675*** -0.0460*** 0.0739*** -0.2228*** 0.0489*** -0.3655***
GDP($) 0.0551*** -0.0960*** 0.0799*** 0.0058 0.0625*** -0.0391*** 0.0559*** -0.1178*** 0.0551*** -0.0789*** 0.5666***
Growth 0.0751*** 0.0673*** 0.0237 0.1275*** 0.0404*** 0.0000 0.021 0.0281* 0.0751*** -0.3608*** 0.1308*** -0.1007***
Fin. const. -0.0821*** 0.0723*** -0.1732*** -0.052*** 0.0231 0.0426*** -0.1317*** 0.1039*** -0.0821*** 0.1784*** -0.2518*** -0.1114*** -0.1226***
Leg. const. -0.0676*** -0.0084 -0.0158 -0.0095 -0.0303** 0.0198 -0.0378** 0.0167 -0.0676*** 0.0531*** -0.1737*** -0.0682*** -0.1411*** 0.1901***
Corruption -0.0695*** -0.0713*** -0.0733*** -0.1025*** -0.0759*** -0.001 -0.0338** 0.0479*** -0.0695*** 0.1314*** -0.3322*** -0.1635*** -0.1815*** 0.2809*** 0.5754***
*, **, *** indicate significance levels of 10, 5, and 1 percent respectively.
40
Table IIIFirm Level Obstacles and Institutional Development
The regression estimated is: Firm Level Obstacle = α + β1 Priv*Small + β2 Priv*Medium + β3 Priv*Large + β4 Laworder*Small + β5
Laworder*Medium + β6 Laworder*Large + β7 Corrupt*Small + β8 Corrupt*Medium + β9 Corrupt*Large + β10 Small+ β11 Medium + εFirm Level Obstacles --Financing, Legal, or Corruption --are summary obstacles as indicated in the firm questionnaire. They takevalues of 1 to 4, where 1 indicates no obstacle and 4 indicates major obstacle. Priv is domestic bank credit to the private sector dividedby GDP. Laworder is a national indicator (1-6) that takes higher values for legal systems that are more developed. Corrupt is acorruption indicator (1-6) at the national level which takes higher values in countries where corruption is lower. Size is a vector ofsize dummy variables, small, medium and large. They take the value 1 if a firm is small (or medium or large) and 0 otherwise. Smallfirms employ 5 to 50 employees (average sales=127 million US$), medium size firms employ 51 to 500 employees (averagesales=136 million US$) and large firms employ more than 500 employees (average sales 237 million US$). These size dummies areinteracted with Priv, Laworder and Corrupt. All regressions are estimated using country random effects. Firm level variables areobtained from the WBES. Detailed variable definitions and sources are given in the appendix.
FinancingObstacle
LegalObstacle
CorruptionObstacle
Priv -0.510***(0.156)
-0.259(0.184)
-0.232(0.225)
Priv*Small -0.267*(0.163)
-0.199(0.186)
-0.324(0.210)
Priv*Medium -0.683***(0.164)
-0.357*(0.186)
-0.200(0.210)
Priv*Large -0.712***(0.184)
-0.216(0.206)
-0.126(0.225)
Laworder -0.007(0.156)
-0.138***(0.052)
-0.252***(0.062)
Laworder*Small -0.029(0.047)
-0.136***(0.054)
-0.239***(0.059)
Laworder*Medium -0.008(0.045)
-0.138***(0.052)
-0.270***(0.058)
Laworder*Large 0.026(0.050)
-0.137***(0.029)
-0.233***(0.060)
Corrupt -0.171***(0.042)
-0.069(0.051)
-0.186***(0.060)
Corrupt*Small -0.139***(0.044)
-0.073(0.052)
-0.150***(0.056)
Corrupt*Medium -0.167***(0.044)
-0.051(0.051)
-0.199***(0.056)
Corrupt*Large -0.226***(0.048)
-0.090*(0.056)
-0.224***(0.059)
Small 0.305***(0.037)
0.084(0.147)
-0.027(0.037)
-0.093(0.148)
0.223***(0.036)
0.064(0.141)
Medium 0.218***(0.035)
0.145(0.137)
-0.014(0.036)
-0.095(0.137)
0.126***(0.034)
0.216*(0.131)
R2- within 0.01 0.01 0.00 0.00 0.01 0.01R2- between 0.46 0.47 0.36 0.36 0.52 0.51R2 - overall 0.08 0.08 0.06 0.06 0.14 0.14No of firms 6680 6680 5487 5487 6335 6335No of countries 59 59 51 51 59 59*, **, *** indicate significance levels of 10, 5, and 1 percent respectively.

41
Table IVFirm Growth: the Impact of Obstacles
The regression estimated is: Firm Growth = α + β1 Government + β2 Foreign + β3 Exporter + β4Subsidized + β5 No. of Competitors +β6 Manufacturing + β7 Services + β8 Inflation + β9 GDP per capita + β10 GDP+ β11 Growth + β12 Financing + β13 Legal + β14
Corruption+ ε. Firm Growth is the percentage change in firm sales over the past three years. Government and Foreign are dummyvariables that take the value 1 if the firm has government or foreign ownership and zero if not. Exporter is a dummy variable thatindicates if the firm is an exporting firm. Subsidized is also a dummy variable that indicates if the firm receives subsidies from thenational or local authorities. No. of Competitors is the logarithm of the number of competitors the firm has. Manufacturing andServices are industry dummies. Inflation is the log difference of the consumer price index. GPP per capita is real GDP per capita inUS$. GDP is the logarithm of GDP in millions of U.S. dollars. Growth is the growth rate of GDP. Financing, Legal, and Corruptionare summary obstacles as indicated in the firm questionnaire. They take values of 1 to 4, where 1 indicates no obstacle and 4 indicatesmajor obstacle. All regressions are estimated using country random effects. Firm level variables are obtained from the WBES.Detailed variable definitions and sources are given in the appendix.
(1) (2) (3) (4)Government -0.070***
(0.028)-0.083***
(0.029)-0.074***
(0.029)-0.070**(0.030)
Foreign 0.034(0.025)
0.045*(0.025)
0.045*(0.026)
0.037(0.026)
Exporter 0.103***(0.021)
0.104***(0.022)
0.107***(0.022)
0.105***(0.022)
Subsidized 0.001(0.026)
0.002(0.027)
0.007(0.027)
0.007(0.027)
No. of Competitors -0.011(0.031)
-0.016(0.032)
-0.001(0.032)
-0.005(0.033)
Manufacturing -0.032(0.028)
-0.023(0.029)
-0.032(0.030)
-0.035(0.030)
Services 0.027(0.027)
0.052*(0.028)
0.037(0.028)
0.036(0.028)
Inflation 0.002**(0.001)
0.002*(0.001)
0.002(0.001)
0.002(0.001)
GDP per capita 0.002(0.003)
0.001(0.003)
0.001(0.003)
0.000(0.003)
GDP ($) 0.007(0.011)
0.012(0.011)
0.010(0.011)
0.013(0.012)
Growth 0.021***(0.007)
0.021***(0.007)
0.020***(0.008)
0.019***(0.008)
Obstacles:
Financing -0.031***(0.009)
-0.023***(0.009)
Legal -0.029***(0.009)
-0.023**(0.011)
Corruption -0.021***(0.009)
-0.007(0.011)
R2- within 0.01 0.01 0.01 0.02R2- between 0.28 0.27 0.25 0.26R2 - overall 0.02 0.03 0.02 0.03No of firms 4204 3968 3991 3800No of countries 54 54 54 54*, **, *** indicate significance levels of 10, 5, and 1 percent respectively.

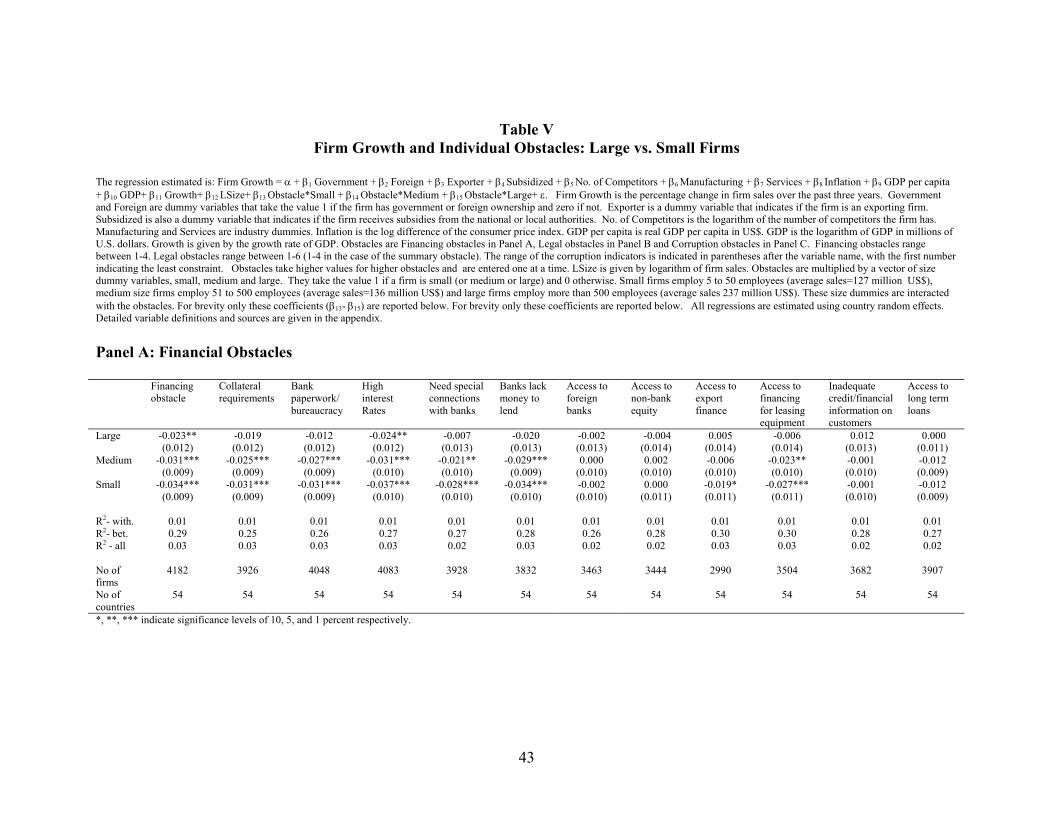
43
Table VFirm Growth and Individual Obstacles: Large vs. Small Firms
The regression estimated is: Firm Growth = α + β1 Government + β2 Foreign + β3 Exporter + β4 Subsidized + β5 No. of Competitors + β6 Manufacturing + β7 Services + β8 Inflation + β9 GDP per capita+ β10 GDP+ β11 Growth+ β12 LSize+ β13 Obstacle*Small + β14 Obstacle*Medium + β15 Obstacle*Large+ ε. Firm Growth is the percentage change in firm sales over the past three years. Governmentand Foreign are dummy variables that take the value 1 if the firm has government or foreign ownership and zero if not. Exporter is a dummy variable that indicates if the firm is an exporting firm.Subsidized is also a dummy variable that indicates if the firm receives subsidies from the national or local authorities. No. of Competitors is the logarithm of the number of competitors the firm has.Manufacturing and Services are industry dummies. Inflation is the log difference of the consumer price index. GDP per capita is real GDP per capita in US$. GDP is the logarithm of GDP in millions ofU.S. dollars. Growth is given by the growth rate of GDP. Obstacles are Financing obstacles in Panel A, Legal obstacles in Panel B and Corruption obstacles in Panel C. Financing obstacles rangebetween 1-4. Legal obstacles range between 1-6 (1-4 in the case of the summary obstacle). The range of the corruption indicators is indicated in parentheses after the variable name, with the first numberindicating the least constraint. Obstacles take higher values for higher obstacles and are entered one at a time. LSize is given by logarithm of firm sales. Obstacles are multiplied by a vector of sizedummy variables, small, medium and large. They take the value 1 if a firm is small (or medium or large) and 0 otherwise. Small firms employ 5 to 50 employees (average sales=127 million US$),medium size firms employ 51 to 500 employees (average sales=136 million US$) and large firms employ more than 500 employees (average sales 237 million US$). These size dummies are interactedwith the obstacles. For brevity only these coefficients (β13- β15) are reported below. For brevity only these coefficients are reported below. All regressions are estimated using country random effects.Detailed variable definitions and sources are given in the appendix.
Panel A: Financial Obstacles
Financingobstacle
Collateralrequirements
Bankpaperwork/bureaucracy
HighinterestRates
Need specialconnectionswith banks
Banks lackmoney tolend
Access toforeignbanks
Access tonon-bankequity
Access toexportfinance
Access tofinancingfor leasingequipment
Inadequatecredit/financialinformation oncustomers
Access tolong termloans
Large -0.023**(0.012)
-0.019(0.012)
-0.012(0.012)
-0.024**(0.012)
-0.007(0.013)
-0.020(0.013)
-0.002(0.013)
-0.004(0.014)
0.005(0.014)
-0.006(0.014)
0.012(0.013)
0.000(0.011)
Medium -0.031***(0.009)
-0.025***(0.009)
-0.027***(0.009)
-0.031***(0.010)
-0.021**(0.010)
-0.029***(0.009)
0.000(0.010)
0.002(0.010)
-0.006(0.010)
-0.023**(0.010)
-0.001(0.010)
-0.012(0.009)
Small -0.034***(0.009)
-0.031***(0.009)
-0.031***(0.009)
-0.037***(0.010)
-0.028***(0.010)
-0.034***(0.010)
-0.002(0.010)
0.000(0.011)
-0.019*(0.011)
-0.027***(0.011)
-0.001(0.010)
-0.012(0.009)
R2- with. 0.01 0.01 0.01 0.01 0.01 0.01 0.01 0.01 0.01 0.01 0.01 0.01R2- bet. 0.29 0.25 0.26 0.27 0.27 0.28 0.26 0.28 0.30 0.30 0.28 0.27R2 - all 0.03 0.03 0.03 0.03 0.02 0.03 0.02 0.02 0.03 0.03 0.02 0.02
No offirms
4182 3926 4048 4083 3928 3832 3463 3444 2990 3504 3682 3907
No ofcountries
54 54 54 54 54 54 54 54 54 54 54 54
*, **, *** indicate significance levels of 10, 5, and 1 percent respectively.
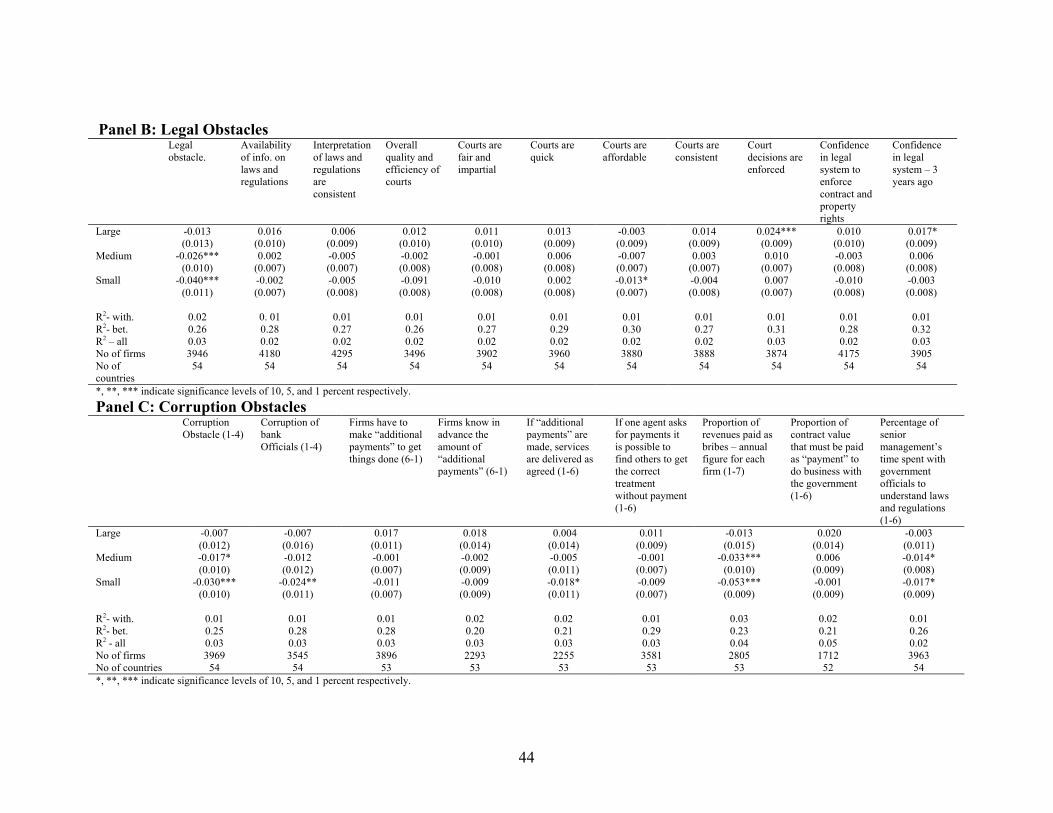
44
Panel B: Legal ObstaclesLegalobstacle.
Availabilityof info. onlaws andregulations
Interpretationof laws andregulationsareconsistent
Overallquality andefficiency ofcourts
Courts arefair andimpartial
Courts arequick
Courts areaffordable
Courts areconsistent
Courtdecisions areenforced
Confidencein legalsystem toenforcecontract andpropertyrights
Confidencein legalsystem – 3years ago
Large -0.013(0.013)
0.016(0.010)
0.006(0.009)
0.012(0.010)
0.011(0.010)
0.013(0.009)
-0.003(0.009)
0.014(0.009)
0.024***(0.009)
0.010(0.010)
0.017*(0.009)
Medium -0.026***(0.010)
0.002(0.007)
-0.005(0.007)
-0.002(0.008)
-0.001(0.008)
0.006(0.008)
-0.007(0.007)
0.003(0.007)
0.010(0.007)
-0.003(0.008)
0.006(0.008)
Small -0.040***(0.011)
-0.002(0.007)
-0.005(0.008)
-0.091(0.008)
-0.010(0.008)
0.002(0.008)
-0.013*(0.007)
-0.004(0.008)
0.007(0.007)
-0.010(0.008)
-0.003(0.008)
R2- with. 0.02 0. 01 0.01 0.01 0.01 0.01 0.01 0.01 0.01 0.01 0.01R2- bet. 0.26 0.28 0.27 0.26 0.27 0.29 0.30 0.27 0.31 0.28 0.32R2 – all 0.03 0.02 0.02 0.02 0.02 0.02 0.02 0.02 0.03 0.02 0.03No of firms 3946 4180 4295 3496 3902 3960 3880 3888 3874 4175 3905No ofcountries
54 54 54 54 54 54 54 54 54 54 54
*, **, *** indicate significance levels of 10, 5, and 1 percent respectively.Panel C: Corruption Obstacles
CorruptionObstacle (1-4)
Corruption ofbankOfficials (1-4)
Firms have tomake “additionalpayments” to getthings done (6-1)
Firms know inadvance theamount of“additionalpayments” (6-1)
If “additionalpayments” aremade, servicesare delivered asagreed (1-6)
If one agent asksfor payments itis possible tofind others to getthe correcttreatmentwithout payment(1-6)
Proportion ofrevenues paid asbribes – annualfigure for eachfirm (1-7)
Proportion ofcontract valuethat must be paidas “payment” todo business withthe government(1-6)
Percentage ofseniormanagement’stime spent withgovernmentofficials tounderstand lawsand regulations(1-6)
Large -0.007(0.012)
-0.007(0.016)
0.017(0.011)
0.018(0.014)
0.004(0.014)
0.011(0.009)
-0.013(0.015)
0.020(0.014)
-0.003(0.011)
Medium -0.017*(0.010)
-0.012(0.012)
-0.001(0.007)
-0.002(0.009)
-0.005(0.011)
-0.001(0.007)
-0.033***(0.010)
0.006(0.009)
-0.014*(0.008)
Small -0.030***(0.010)
-0.024**(0.011)
-0.011(0.007)
-0.009(0.009)
-0.018*(0.011)
-0.009(0.007)
-0.053***(0.009)
-0.001(0.009)
-0.017*(0.009)
R2- with. 0.01 0.01 0.01 0.02 0.02 0.01 0.03 0.02 0.01R2- bet. 0.25 0.28 0.28 0.20 0.21 0.29 0.23 0.21 0.26R2 - all 0.03 0.03 0.03 0.03 0.03 0.03 0.04 0.05 0.02No of firms 3969 3545 3896 2293 2255 3581 2805 1712 3963No of countries 54 54 53 53 53 53 53 52 54*, **, *** indicate significance levels of 10, 5, and 1 percent respectively.

45
Table VIFirm Growth and Obstacles: Impact of Institutional Development
The regression estimated is: Firm Growth = α + β1 Government + β2 Foreign + β3 Exporter + β4 Subsidized + β5 No. of Competitors+β6 Manufacturing + β7 Services + β8 Inflation + β9 GDP per capita + β10 GDP+ β11 Growth+ β12Institution+ β13Obstacle + β14
Obstacle*Institution+ ε. Firm Growth is the percentage change in firm sales over the past three years. Government and Foreign aredummy variables that take the value 1 if the firm has government or foreign ownership and zero if not. Exporter is a dummy variablethat indicates if the firm is an exporting firm. Subsidized is also a dummy variable that indicates if the firm receives subsidies fromthe national or local authorities. No. of Competitors is the logarithm of the number of competitors the firm has. Manufacturing andServices are industry dummies. Inflation is the log difference of the consumer price index. GDP per capita is real GDP per capita inUS$. GDP is the logarithm of GDP in millions of U.S. dollars. Growth is given by the growth rate of GDP. Obstacle is eitherFinancing Legal or Corruption obstacle. The institutional variable is Priv when Financial constraint is entered, Laworder when Legalobstacle is entered and Corrupt when corruption obstacle is entered. Priv is domestic bank credit to the private sector divided by GDP.Laworder is a national indicator (1-6) that takes higher values for legal systems that are more developed. Corrupt is a corruptionindicator at the national level which takes higher values in countries where corruption is lower. Obstacles range between 1-4 and takehigher values for greater obstacles. They are also interacted with the respective institutional variables. For brevity only thesecoefficients are reported below. All regressions are estimated using country random effects. Detailed variable definitions andsources are given in the appendix.
Financingobstacle
Legalobstacle
Corruptionobstacle
FinObstacle
-0.043***(0.013)
Fin. Obs. xPriv
0.045*(0.029)
Legal Obstacle -0.085**(0.027)
Legal Obs. xLaworder
0.014*(0.009)
Corruption Obstacle -0.084***(0.026)
Corruption Obs. xCorrupt
0.020***(0.008)
R2- with. 0.01 0.01 0.01R2- bet. 0.17 0.26 0.36R2 - all 0.02 0.02 0.03No of firms 3596 3923 3939No of countries 50 53 53
*, **, *** indicate significance levels of 10, 5, and 1 percent respectively.
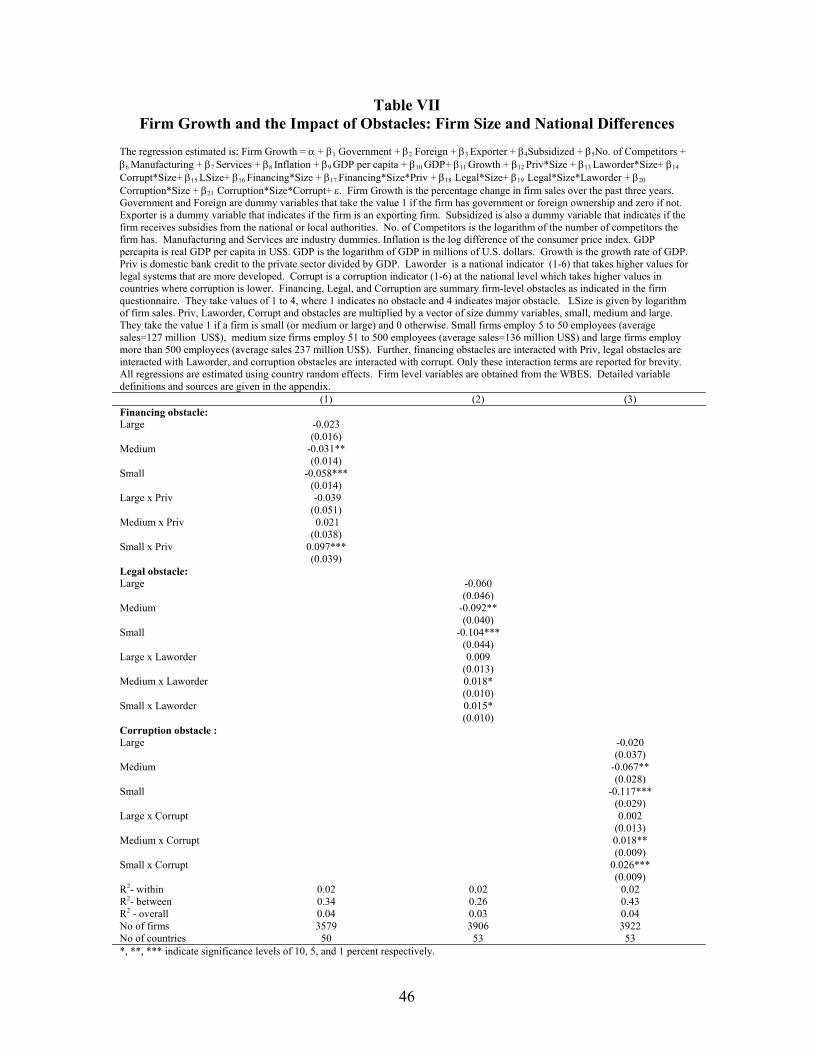
46
Table VIIFirm Growth and the Impact of Obstacles: Firm Size and National Differences
The regression estimated is: Firm Growth = α + β1 Government + β2 Foreign + β3 Exporter + β4Subsidized + β5No. of Competitors +β6 Manufacturing + β7 Services + β8 Inflation + β9 GDP per capita + β10 GDP+ β11 Growth + β12 Priv*Size + β13 Laworder*Size+ β14
Corrupt*Size+ β15 LSize+ β16 Financing*Size + β17 Financing*Size*Priv + β18 Legal*Size+ β19 Legal*Size*Laworder + β20
Corruption*Size + β21 Corruption*Size*Corrupt+ ε. Firm Growth is the percentage change in firm sales over the past three years.Government and Foreign are dummy variables that take the value 1 if the firm has government or foreign ownership and zero if not.Exporter is a dummy variable that indicates if the firm is an exporting firm. Subsidized is also a dummy variable that indicates if thefirm receives subsidies from the national or local authorities. No. of Competitors is the logarithm of the number of competitors thefirm has. Manufacturing and Services are industry dummies. Inflation is the log difference of the consumer price index. GDPpercapita is real GDP per capita in US$. GDP is the logarithm of GDP in millions of U.S. dollars. Growth is the growth rate of GDP.Priv is domestic bank credit to the private sector divided by GDP. Laworder is a national indicator (1-6) that takes higher values forlegal systems that are more developed. Corrupt is a corruption indicator (1-6) at the national level which takes higher values incountries where corruption is lower. Financing, Legal, and Corruption are summary firm-level obstacles as indicated in the firmquestionnaire. They take values of 1 to 4, where 1 indicates no obstacle and 4 indicates major obstacle. LSize is given by logarithmof firm sales. Priv, Laworder, Corrupt and obstacles are multiplied by a vector of size dummy variables, small, medium and large.They take the value 1 if a firm is small (or medium or large) and 0 otherwise. Small firms employ 5 to 50 employees (averagesales=127 million US$), medium size firms employ 51 to 500 employees (average sales=136 million US$) and large firms employmore than 500 employees (average sales 237 million US$). Further, financing obstacles are interacted with Priv, legal obstacles areinteracted with Laworder, and corruption obstacles are interacted with corrupt. Only these interaction terms are reported for brevity.All regressions are estimated using country random effects. Firm level variables are obtained from the WBES. Detailed variabledefinitions and sources are given in the appendix.
(1) (2) (3)Financing obstacle:Large -0.023
(0.016)Medium -0.031**
(0.014)Small -0.058***
(0.014)Large x Priv -0.039
(0.051)Medium x Priv 0.021
(0.038)Small x Priv 0.097***
(0.039)Legal obstacle:Large -0.060
(0.046)Medium -0.092**
(0.040)Small -0.104***
(0.044)Large x Laworder 0.009
(0.013)Medium x Laworder 0.018*
(0.010)Small x Laworder 0.015*
(0.010)Corruption obstacle :Large -0.020
(0.037)Medium -0.067**
(0.028)Small -0.117***
(0.029)Large x Corrupt 0.002
(0.013)Medium x Corrupt 0.018**
(0.009)Small x Corrupt 0.026***
(0.009)R2- within 0.02 0.02 0.02R2- between 0.34 0.26 0.43R2 - overall 0.04 0.03 0.04No of firms 3579 3906 3922No of countries 50 53 53*, **, *** indicate significance levels of 10, 5, and 1 percent respectively.

47
Table VIIISensitivity Test : IV Estimation and Using Real Firm Growth
The regression estimated is: Firm Growth = α + β1 Government + β2 Foreign + β3 Exporter + β4Subsidized + β5 No. of Competitors +β6 Manufacturing + β7 Services + β8 Inflation + β9 GDP per capita + β10 GDP+ β11 Growth + β12 Financing + β13 Legal + β14
Corruption. Firm Growth is the percentage change in firm sales over the past three years. Government and Foreign are dummyvariables that take the value 1 if the firm has government or foreign ownership and zero if not. Exporter is a dummy variable thatindicates if the firm is an exporting firm. Subsidized is also a dummy variable that indicates if the firm receives subsidies from thenational or local authorities. No. of Competitors is the logarithm of the number of competitors the firm has. Manufacturing andServices are industry dummies. Inflation is the log difference of the consumer price index. GPP per capita is real GDP per capita inUS$. GDP is the logarithm of GDP in millions of U.S. dollars. Growth is the growth rate of GDP. Financing, Legal, and Corruptionare summary obstacles as indicated in the firm questionnaire. They take values of 1 to 4, where 1 indicates no obstacle and 4 indicatesmajor obstacle. In panel A, all regressions are estimated using instrumental variables, where the firm level obstacles are instrumentedby country level institutional variables (Priv, Laworder and Corrupt). Robust standard errors are reported in parentheses. In Panel B,the dependent variable, Firm Growth is replaced by real firm growth constructed using GDP deflator. Inflation is dropped from thespecification. For brevity only the coefficients of the obstacles are reported. Firm level variables are obtained from the WBES.Detailed variable definitions and sources are given in the appendix.
Panel A (1) (2) (3)
Financing -0.575***(0.125)
Legal -0.029***(0.009)
Corruption -0.021***(0.009)
No of firms 3539 3390 3396
Panel BFinancing -0.030***
(0.009)Legal -0.030***
(0.009)Corruption -0.021***
(0.009)
R2- within 0.01 0.01 0.01R2- between 0.28 0.28 0.27R2 – overall 0.15 0.16 0.14No of firms 4204 3968 3991No of countries 54 54 54*, **, *** indicate significance levels of 10, 5, and 1 percent respectively.

48
Appendix Table AINumber of Firms in Each Country
The data source is WBES.Number of Firms
Albania 85Argentina 76Armenia 90Azerbaijan 66Bulgaria 100Belarus 95Belize 14Bolivia 61Brazil 132Canada 73Chile 67China 69Colombia 77Costa Rica 49Czech Republic 78Germany 59Dominican Republic 73Ecuador 46Spain 64Estonia 103France 55United Kingdom 53Guatemala 52Honduras 46Croatia 91Haiti 42Hungary 91Indonesia 67Italy 54Kazakhstan 85Kyrgizstan 62Lithuania 66Moldova 78Mexico 35Malaysia 33Nicaragua 51Pakistan 55Panama 47Peru 65Philippines 84Poland 169Portugal 49Romania 95Russia 372Singapore 72El Salvador 48Slovakia 86Slovenia 101Sweden 68Trinidad & Tobago 59Turkey 112Ukraine 165Uruguay 55United States 61Venezuela 54
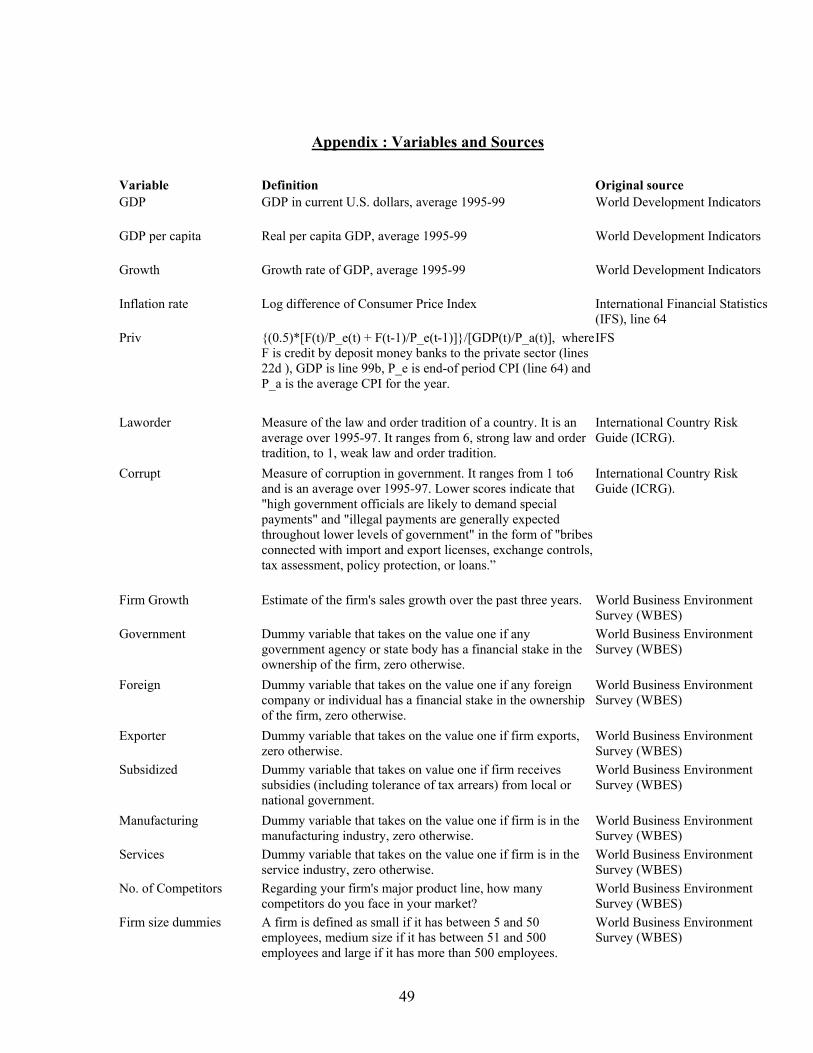
49
Appendix : Variables and Sources
Variable Definition Original sourceGDP GDP in current U.S. dollars, average 1995-99 World Development Indicators
GDP per capita Real per capita GDP, average 1995-99 World Development Indicators
Growth Growth rate of GDP, average 1995-99 World Development Indicators
Inflation rate Log difference of Consumer Price Index International Financial Statistics(IFS), line 64
Priv {(0.5)*[F(t)/P_e(t) + F(t-1)/P_e(t-1)]}/[GDP(t)/P_a(t)], whereF is credit by deposit money banks to the private sector (lines22d ), GDP is line 99b, P_e is end-of period CPI (line 64) andP_a is the average CPI for the year.
IFS
Laworder Measure of the law and order tradition of a country. It is anaverage over 1995-97. It ranges from 6, strong law and ordertradition, to 1, weak law and order tradition.
International Country RiskGuide (ICRG).
Corrupt Measure of corruption in government. It ranges from 1 to6and is an average over 1995-97. Lower scores indicate that"high government officials are likely to demand specialpayments" and "illegal payments are generally expectedthroughout lower levels of government" in the form of "bribesconnected with import and export licenses, exchange controls,tax assessment, policy protection, or loans.”
International Country RiskGuide (ICRG).
Firm Growth Estimate of the firm's sales growth over the past three years. World Business EnvironmentSurvey (WBES)
Government Dummy variable that takes on the value one if anygovernment agency or state body has a financial stake in theownership of the firm, zero otherwise.
World Business EnvironmentSurvey (WBES)
Foreign Dummy variable that takes on the value one if any foreigncompany or individual has a financial stake in the ownershipof the firm, zero otherwise.
World Business EnvironmentSurvey (WBES)
Exporter Dummy variable that takes on the value one if firm exports,zero otherwise.
World Business EnvironmentSurvey (WBES)
Subsidized Dummy variable that takes on value one if firm receivessubsidies (including tolerance of tax arrears) from local ornational government.
World Business EnvironmentSurvey (WBES)
Manufacturing Dummy variable that takes on the value one if firm is in themanufacturing industry, zero otherwise.
World Business EnvironmentSurvey (WBES)
Services Dummy variable that takes on the value one if firm is in theservice industry, zero otherwise.
World Business EnvironmentSurvey (WBES)
No. of Competitors Regarding your firm's major product line, how manycompetitors do you face in your market?
World Business EnvironmentSurvey (WBES)
Firm size dummies A firm is defined as small if it has between 5 and 50employees, medium size if it has between 51 and 500employees and large if it has more than 500 employees.
World Business EnvironmentSurvey (WBES)

50
Size Logarithm of firm sales World Business EnvironmentSurvey (WBES)
Financing Obstacle How problematic is financing for the operation and growth ofyour business: no obstacle (1), a minor obstacle (2), amoderate obstacle (3) or a major obstacle (4)?
World Business EnvironmentSurvey (WBES)
Legal Obstacle How problematic is functioning of the judiciary for theoperation and growth of your business: no obstacle (1), aminor obstacle (2), a moderate obstacle (3) or a majorobstacle (4)?
World Business EnvironmentSurvey (WBES)
Corruption Obstacle How problematic is corruption for the operation and growthof your business: no obstacle (1), a minor obstacle (2), amoderate obstacle (3) or a major obstacle (4)?
World Business EnvironmentSurvey (WBES)
Collateral requirements Are collateral requirements of banks/financial institutions noobstacle (1), a minor obstacle (2), a moderate obstacle (3) or amajor obstacle (4)?
World Business EnvironmentSurvey (WBES)
Bank paperwork/bureaucracy
Is bank paperwork/bureaucracy no obstacle (1), a minorobstacle (2), a moderate obstacle (3) or a major obstacle (4)?
World Business EnvironmentSurvey (WBES)
High interest rates Are high interest rates no obstacle (1), a minor obstacle (2), amoderate obstacle (3) or a major obstacle (4)?
World Business EnvironmentSurvey (WBES)
Need specialconnections withbanks
Is the need of of special connections with banks/financialinstitutions no obstacle (1), a minor obstacle (2), a moderateobstacle (3) or a major obstacle (4)?
World Business EnvironmentSurvey (WBES)
Banks lack moneyto lend
Is banks' lack of money to lend no obstacle (1), a minorobstacle (2), a moderate obstacle (3) or a major obstacle (4)?
World Business EnvironmentSurvey (WBES)
Access to foreignbanks
Is the access to foreign banks no obstacle (1), a minorobstacle (2), a moderate obstacle (3) or a major obstacle (4)?
World Business EnvironmentSurvey (WBES)
Access to non-bankequity
Is the access to non-bank equity/investors/partners no obstacle(1), a minor obstacle (2), a moderate obstacle (3) or a majorobstacle (4)?
World Business EnvironmentSurvey (WBES)
Access to exportfinance
Is the access to specialized export finance no obstacle (1), aminor obstacle (2), a moderate obstacle (3) or a majorobstacle (4)?
World Business EnvironmentSurvey (WBES)
Access to financing forleasing equipment
Is the access to lease finance for equipment no obstacle (1), aminor obstacle (2), a moderate obstacle (3) or a majorobstacle (4)?
World Business EnvironmentSurvey (WBES)
Inadequatecredit/financialinformation oncostumers
Is inadequate credit/financial information on costumers noobstacle (1), a minor obstacle (2), a moderate obstacle (3) or amajor obstacle (4)?
World Business EnvironmentSurvey (WBES)
Access to long-termloans
Is the access to long-term finance no obstacle (1), a minorobstacle (2), a moderate obstacle (3) or a major obstacle (4)?
World Business EnvironmentSurvey (WBES)

51
Availability ofinformation on lawsand regulations
In general, information on the laws and regulations affectingmy firm is easy to obtain: (1) fully agree, (2) agree in mostcases, (3) tend to agree, (4) tend to disagree, (5) disagree inmost cases, (6) fully disagree.
World Business EnvironmentSurvey (WBES)
Interpretation of laws and regulationsare consistent
In general, interpretation of regulations affecting my firm areconsistent and predictable: (1) fully agree, (2) agree in mostcases, (3) tend to agree, (4) tend to disagree, (5) disagree inmost cases, (6) fully disagree.
World Business EnvironmentSurvey (WBES)
Overall quality andefficiency of courts
Overall quality and efficiency of the judiciary/courts: (1) verygood, (2) good, (3) slightly good, (4) slightly bad, (5) bad, (6)very bad.
World Business EnvironmentSurvey (WBES)
Courts are fair andimpartial
In resolving business disputes, do you believe your country'scourts to be fair and impartial: (1) always, (2) usually, (3)frequently, (4) sometimes, (5) seldom, (6) never.
World Business EnvironmentSurvey (WBES)
Courts are quick In resolving business disputes, do you believe your country'scourts to be quick: (1) always, (2) usually, (3) frequently, (4)sometimes, (5) seldom, (6) never.
World Business EnvironmentSurvey (WBES)
Courts are affordable In resolving business disputes, do you believe your country'scourts to be affordable: (1) always, (2) usually, (3) frequently,(4) sometimes, (5) seldom, (6) never.
World Business EnvironmentSurvey (WBES)
Courts are consistent In resolving business disputes, do you believe your country'scourts to be consistent: (1) always, (2) usually, (3) frequently,(4) sometimes, (5) seldom, (6) never.
World Business EnvironmentSurvey (WBES)
Court decisions areenforced
In resolving business disputes, do you believe your country'scourts to enforce decisions: (1) always, (2) usually, (3)frequently, (4) sometimes, (5) seldom, (6) never.
World Business EnvironmentSurvey (WBES)
Confidence in legalsystem to enforcecontract and propertyrights
I am confident that the legal system will uphold my contractand property rights in business disputes: (1) fully agree, (2)agree in most cases, (3) tend to agree, (4) tend to disagree, (5)disagree in most cases, (6) fully disagree.
World Business EnvironmentSurvey (WBES)
Confidence in legalsystem - 3 years ago
I am confident that the legal system will uphold my contractand property rights in business disputes: three years ago - (1)fully agree, (2) agree in most cases, (3) tend to agree, (4) tendto disagree, (5) disagree in most cases, (6) fully disagree.
World Business EnvironmentSurvey (WBES)
Corruption of bankofficials
Is the corruption of bank officials no obstacle (1), a minorobstacle (2), a moderate obstacle (3) or a major obstacle (4)?
World Business EnvironmentSurvey (WBES)
Firms have to make"additional payments"in advance
It is common for firms in my line of business to have to paysome irregular "additional payments" to get things done: (1)always, (2) mostly, (3) frequently, (4) sometimes, (5) seldom,(6) never.
World Business EnvironmentSurvey (WBES)
Firms know theamount of "additionalpayments" in advance
Firms in my line of business usually know in advance abouthow much this "additional payment" is: (1) always, (2)mostly, (3) frequently, (4) sometimes, (5) seldom, (6) never.
World Business EnvironmentSurvey (WBES)

52
If "additionalpayments" are made,services are delivered
If a firm pay the required "additional payments", the service isusually also delivered as agreed: (1) always, (2) mostly, (3)frequently, (4) sometimes, (5) seldom, (6) never.
World Business EnvironmentSurvey (WBES)
It is possible to findhonest agents to replace corrupt ones
If a government agent acts against the rules, I can usually goto another official or to his superior and get the correcttreatment without recourse to unofficial payments: (1) always,(2) mostly, (3) frequently, (4) sometimes, (5) seldom, (6)never.
World Business EnvironmentSurvey (WBES)
Proportion ofrevenues paid as bribes
On average, what percentage of revenues do firms like yourtypically pay per year in unofficial payments to publicofficials: (1) 0%, (1) less than 1%, (3) 1% to 1.99%, (4) 2% to9.99%, (5) 10% to 12%, (6) 13% to 25%, (7) over 25%.
World Business EnvironmentSurvey (WBES)
Proportion of contractvalue that must bepaid for governmentcontracts
When firms in your industry do business with thegovernment, how much of the contract value must they offerin additional or unofficial payments to secure the contract: (1)0 %, (1) up to 5%, (3) 6% to 10%, (4) 11% to 15%, (5) 16%to 20%, (6) over 20 %.
World Business EnvironmentSurvey (WBES)
Management's time (%)spent with officials tounderstand laws andregulations
What percentage of senior management's time per year isspent in dealing with government officials about theapplication and interpretation of laws and regulations?
World Business EnvironmentSurvey (WBES)
Sources of investment -retained earnings
Share (percentage) of firm's financing over the last yearcoming from internal funds or retained earnings.
World Business EnvironmentSurvey (WBES)
Sources of investment -equity
Share (percentage) of firm's financing over the last yearcoming from equity, sale of stocks
World Business EnvironmentSurvey (WBES)
Sources of investment -domestic banks
Share (percentage) of firm's financing over the last yearcoming from local commercial banks.
World Business EnvironmentSurvey (WBES)
Sources of investment -foreign banks
Share (percentage) of firm's financing over the last yearcoming from foreign banks
World Business EnvironmentSurvey (WBES)
Sources of investment -family/friends
Share (percentage) of firm's financing over the last yearcoming from family and friends
World Business EnvironmentSurvey (WBES)
Sources of investment -other sources
Share (percentage) of firm's financing over the last yearcoming from other sources than banks, equity, retainedearnings and family and friends.
World Business EnvironmentSurvey (WBES)


![[MS-WSSEC]: Web Services: Security Policy Assertions Format...services to express their constraints and requirements. Such constraints and requirements are expressed as policy assertions](https://img.pdfslide.us/doc/110x75/5f278564695c3169e015b850/ms-wssec-web-services-security-policy-assertions-format-services-to-express.jpg)