Embed Size (px)
Citation preview
Issuer
Gap Group p.l.c. (C 75875)
Guarantors
Gap Mellieħa (I) Limited (C 72013)
Gap Għargħur Limited (C 72015)
Gap Properties Limited (C 47928)
Geom Developments Limited (C 50805)
Financial
Analysis
Summary
31 May 2018
The Directors
Gap Group p.l.c.
Gap Group Head Office
Ċensu Scerri Street
Tigné, Sliema, SLM 3060
Malta
31 May 2018
Dear Sirs
Financial Analysis Summary
In accordance with your instructions, and in line with the requirements of the Listing Authority
Policies, we have compiled the Financial Analysis Summary (the “Analysis”) set out on the following
pages and which is being forwarded to you together with this letter.
The purpose of the financial analysis is that of summarising key financial data appertaining to Gap
Group p.l.c. (the “Issuer”), and Gap Mellieħa (I) Limited, Gap Għargħur Limited, Gap Properties Limited
and Geom Developments Limited (the “Guarantors”). The data is derived from various sources or is
based on our own computations as follows:
(a) Historical financial data for the period 1 June 2016 to 31 December 2016 and the year to 31
December 2017 has been extracted from the audited consolidated financial statements of Gap
Group p.l.c.
(b) Historical financial data has been extracted from the audited financial statements of Gap
Mellieħa (I) Limited (FP2016 and FY2017), Gap Għargħur Limited (FP2016 and FY2017), Gap
Properties Limited (FY2015 to FY2017) and Geom Developments Limited (FY2015 to FY2017).
(c) The forecast data for the year ending 31 December 2018 has been provided by management.
(d) Our commentary on the results of the Gap Group and on its financial position is based on the
explanations provided by management.
(e) The ratios quoted in the Analysis have been computed by us applying the definitions set out in
Part 4 of the Analysis.
(f) Relevant financial data in respect of the companies included in Part 3 has been extracted from
public sources such as websites of the companies concerned, financial statements filed with the
Registrar of Companies or websites providing financial data.
The Analysis is meant to assist investors in the Issuer’s securities and potential investors by
summarising the more important financial data of the Gap Group. The Analysis does not contain all
data that is relevant to investors or potential investors. The Analysis does not constitute an
endorsement by our firm of any securities of the Issuer and should not be interpreted as a
recommendation to invest in any of the Issuer’s securities. We shall not accept any liability for any loss
or damage arising out of the use of the Analysis. As with all investments, potential investors are
encouraged to seek independent professional financial advice before investing in the Issuer’s
securities.
Yours faithfully,
Evan Mohnani
Head – Corporate Finance
GAP GROUP FINANCIAL ANALYSIS SUMMARY 1
TABLE OF CONTENTS
DEFINITIONS ................................................................................................................................. 3
PART 1 – INFORMATION ABOUT THE GAP GROUP ......................................................................... 5
1. Key Activities of the Issuer ....................................................................................... 5
2. Directors and Senior Management ........................................................................... 6
2.1 Directors of the Issuer ...................................................................................................... 6
2.2 Directors of the Guarantors ............................................................................................. 6
2.3 Senior Management ......................................................................................................... 6
3. Organisational Structure .......................................................................................... 7
3.1 The Guarantors ................................................................................................................ 8
3.1.1 Gap Mellieħa (I) Limited .............................................................................................. 8
3.1.2 Gap Għargħur Limited ................................................................................................. 8
3.1.3 Gap Properties Limited ................................................................................................ 8
3.1.4 Geom Developments Limited ...................................................................................... 8
4. The Projects ............................................................................................................ 9
4.1 The Żebbuġ Development - History and Overview .......................................................... 9
4.2 The Qawra Development - History and Overview ........................................................... 9
4.2.1 Development ............................................................................................................... 9
4.2.2 Sale of Units ................................................................................................................. 9
4.3 The Mellieħa Development - History and Overview ...................................................... 10
4.3.1 Development ............................................................................................................. 10
4.3.2 Estimated Costs of the Project .................................................................................. 11
4.3.3 Pricing and Sales Approach ....................................................................................... 11
4.4 The Għargħur Development - History and Overview..................................................... 12
4.4.1 Development ............................................................................................................. 12
4.4.2 Estimated Costs of the Project .................................................................................. 13
4.4.3 Pricing and Sales Approach ....................................................................................... 13
GAP GROUP FINANCIAL ANALYSIS SUMMARY 2
4.5 Luqa Development – Overview of New Investment ...................................................... 14
4.5.1 Development ............................................................................................................. 14
4.5.2 Estimated Costs of the Project .................................................................................. 15
4.5.3 Pricing and Sales Approach ....................................................................................... 15
4.6 Cash Inflows on Property Sales ...................................................................................... 16
4.7 Project Funding .............................................................................................................. 16
4.7 The Reserve Account ...................................................................................................... 17
4.8 Balances on The Reserve Account ................................................................................. 19
5. Overview of the Property Market in Malta ............................................................. 20
6. Trend Information & Business Strategy .................................................................. 22
PART 2 – GAP GROUP PERFORMANCE REVIEW ............................................................................ 23
7. Financial Information relating to the Guarantors .................................................... 23
7.1 Gap Properties Limited .................................................................................................. 23
7.2 Geom Developments Limited ........................................................................................ 25
7.3 Gap Mellieħa (I) Limited ................................................................................................. 28
7.4 Gap GħarGħur Limited ................................................................................................... 30
8. Financial Information relating to the Issuer ............................................................ 32
PART 3 - COMPARABLES ............................................................................................................. 38
PART 4 - EXPLANATORY DEFINITIONS .......................................................................................... 40
GAP GROUP FINANCIAL ANALYSIS SUMMARY 3
DEFINITIONS
Issuer Gap Group p.l.c., a public limited liability company duly registered and validly
existing under the laws of Malta with company registration number C 75875 and
having its registered office at Gap Group Head Office, Ċensu Scerri Street, Sliema
SLM 3060, Malta;
Bond Issue the issue of Secured Bonds;
Bondholder a holder of Secured Bonds;
Gap Group or Group the Issuer, its parent, GDL, GHL, GGF, GGL, GGCL, GML, GPL and MHL;
GDL Geom Developments Limited (C 50805);
GHL Geom Holdings Limited (C 64409);
GGF Gap Group Finance Limited (C 54352);
GGL Gap Għargħur Limited (C 72015);
GGCL Gap Group Contracting Limited (C 75879);
Għargħur Development the construction, development and finishing over the site in Triq Caravaggio,
Għargħur, Malta measuring approximately 2,585m2, of a total 34 luxury
apartments (6 of which at Penthouse level) and 41 garages/car spaces, spread
over 4 blocks with a variety of one, two and three bedroom units;
GML Gap Mellieħa (I) Limited (C 72013);
GPL Gap Properties Limited (C 47928);
Guarantor each of GDL, GGL, GML and GPL, and the term “Guarantors” shall collectively refer
to the said companies;
Hypothecated Property the immovable property described hereunder, namely:
(i) the plot of land known as ta’ Masrija having a superficial area of
approximately 5,220m2, in Mellieħa, together with the improvements
made and to be made thereon, over which there shall be developed the
Mellieħa Development, property of GML; the site is more fully described
in the deed of acquisition published by Notary Dr Sam Abela and dated
21 October 2016;
(ii) the plot of land in Triq il-Porzjunkola, Qawra Malta having a superficial
area of approximately 1,228m2, together with any improvements to be
made thereon and earmarked for the development of Blocks A, B, and C
forming part of the Qawra Development, property of GDL; the site is
more fully described in the deed of acquisition published by Notary John
Spiteri and dated 26 March 2015;
(iii) the 15 apartments in a completely finished state, including all common
areas and internal streets; 1 commercial outlet and the 64 garages and
garage spaces forming part of the development on the site in Żebbuġ
GAP GROUP FINANCIAL ANALYSIS SUMMARY 4
having a superficial area of approximately 6,878m2 constituting the
Żebbuġ Development, property of GPL;
Luqa Development the construction, development and finishing over a number of sites in an area
known as ‘Ta Blejkiet’ in Luqa, Malta measuring approximately 15,023m2. The
Group will initially develop Blocks A & B comprising 16 maisonettes, 72
apartments and 18 penthouses spread over 5 floors, together with 73 lock-up
garages;
Mellieħa Development the construction, development and finishing, over the site known as ta’ Masrija in
Mellieħa measuring approximately 5,220m2, of a total of 152 residential units and
174 garages/car spaces, spread over 10 blocks with a variety of one, two and
three bedroom units;
MHL Manikata Holdings Limited (C 53818);
New Developments the construction and development of each of the Għargħur Development, the
Qawra Development, the Mellieħa Development and the Luqa Development;
Projects the construction and development of the New Developments and the sale of the
remaining unsold units comprised in the Żebbuġ Development (each a “Project”);
Qawra Development the construction, development and finishing over the site in Triq il-Porzjunkola,
Qawra, Malta measuring approximately 3,508m2 of a total of 145 residential units
and 180 garages/car spaces, spread over 7 blocks, identified as Blocks A to G (both
included) with a variety of one, two and three bedroom units;
QIL Qawra Investments Limited (C 32225);
Secured Bond(s) or
Bond(s)
the €40,000,000 4.25% Secured Bonds of a nominal value of €100 and redeemable
at the nominal value in 2023;
Trustee or Security
Trustee
Equinox International Limited, a private limited liability company duly registered
and validly existing under the laws of Malta, with company registration number C
29674 and having its registered office at 9, Level 2, Valletta Buildings, South Street,
Valletta VLT 1103, Malta, duly authorised to act as a trustee or co-trustee in terms
of Article 43(3) of the Trusts and Trustees Act (Cap. 331 of the Laws of Malta);
Żebbuġ Development the 193 apartments, 2 retail outlets and 144 underlying garage spaces all in a
completely finished state, including all common areas and internal streets,
forming part of the development on the site in Żebbuġ measuring approximately
6,878m2.
GAP GROUP FINANCIAL ANALYSIS SUMMARY 5
PART 1 – INFORMATION ABOUT THE GAP GROUP
1. KEY ACTIVITIES OF THE ISSUER
The Issuer was incorporated in June 2016 as a public limited liability company under the Companies
Act with an authorised and issued share capital of €2.5 million, fully paid up.
The Issuer’s principal object is that of a holding company and to promote, including through
subsidiaries, the acquisition and development of real estate properties. As such, the Issuer is mainly
dependent on the business prospects of its operating subsidiaries. At present, the Issuer, through the
Guarantors and other subsidiaries, is involved in the construction and development of the New
Developments. Each project undertaken by the Group is typically undertaken through a special
purpose vehicle established for that project, and each special purpose vehicle is managed through its
board of directors, which has common members with the directors of the Issuer. The Issuer is not
dependent on other entities within the Group or outside the Group with respect to the management
of the Projects.
On 6 September 2016, the Issuer acquired from Gap Group Investments p.l.c. (C 72012) the entire
issued share capital of two companies, namely GML and GGL. GML acquired the site known as ta’
Masrija, by virtue of a deed published by Notary Dr Sam Abela on 21 October 2016, over which the
Mellieħa Development is being constructed. GGL acquired the site over which the Għargħur
Development is being constructed by virtue of a deed published by Notary Dr Andre Farrugia on 4
February 2016.
In addition, by virtue of another share purchase agreement dated 6 September 2016, entered into
with Gap Group Investments (III) Limited (C 76675), the Issuer acquired the entire issued share capital
of GDL and all the issued ordinary ‘A’ shares of GHL. GDL holds a one hundred per cent interest in GGF
which in turn has the controlling interest in each of GPL and MHL. GPL is the group company that owns
the Żebbuġ Development, which has now been completed, but that still retains unsold stock as
specified in section 4.1 of this report.
By virtue of these acquisitions, the Issuer has indirectly acquired all of the sites over which the Group
is constructing the New Developments.
In March 2012, GGF had issued €15,500,000 7% Secured Notes of a nominal value of €1,000 each,
redeemable at par between 2014 and 2016 to finance two residential projects. Both of the projects
have been completed, one of which is the Żebbuġ Development and another project consisting of a
number of luxury villas in Manikata. The Notes then issued were fully redeemed on their redemption
date, 30 March 2016.
GAP GROUP FINANCIAL ANALYSIS SUMMARY 6
2. DIRECTORS AND SENIOR MANAGEMENT
2.1 DIRECTORS OF THE ISSUER
The Issuer is managed by a Board comprising six directors who are entrusted with its overall direction
and management. The Board members of the Issuer as at the date of this report are included
hereunder:
George Muscat Chairman
Paul Attard Executive Director
Adrian Muscat Executive Director
Francis X. Gouder Independent Non-Executive Director
Mark Castillo Independent Non-Executive Director
Chris Cilia Independent Non-Executive Director
2.2 DIRECTORS OF THE GUARANTORS
The following are the directors of each of:
GML, GPL and GGL: GDL:
George Muscat Executive Director George Muscat Executive Director
Paul Attard Executive Director Francis X. Gouder Non-Executive Director
Adrian Muscat Executive Director
2.3 SENIOR MANAGEMENT
The Issuer itself has no employees and is managed directly by its board of directors. Each project
company employs a number of management personnel and other employees devoted to managing
each Project. The Group adopts a centralised management structure whereby it can deploy senior
management personnel to perform duties in different parts of the Group depending on the
requirements of each Group company; those services are then re-charged to the Group company
where they are from time to time deployed.
Senior management of the Group is engaged by GGCL, the members of which are the following:
George Muscat Chairman
Paul Attard Director of Sales and Marketing
Chris Gauci Sales and Marketing Manager
Elton Deguara Sales and Marketing Manager
Adrian Muscat Director of Sites
Raymond Grixti Project Manager
Joseph J. Formosa Finance Manager
GAP GROUP FINANCIAL ANALYSIS SUMMARY 7
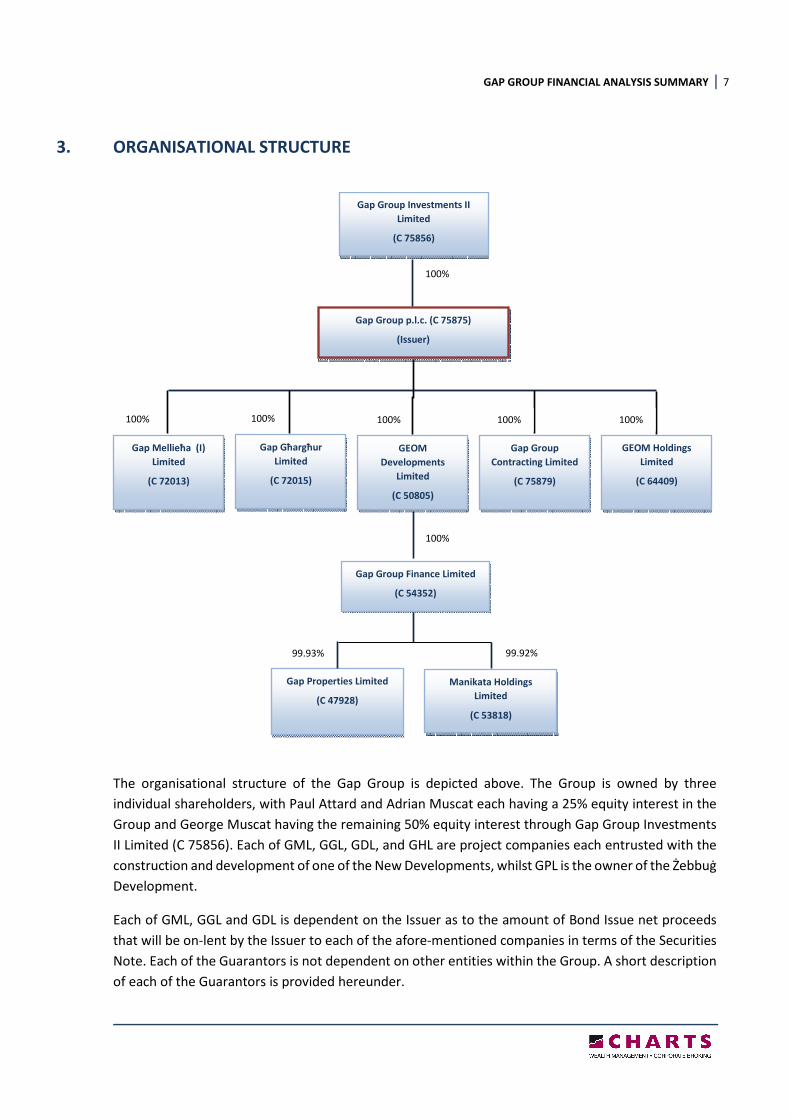
3. ORGANISATIONAL STRUCTURE
The organisational structure of the Gap Group is depicted above. The Group is owned by three
individual shareholders, with Paul Attard and Adrian Muscat each having a 25% equity interest in the
Group and George Muscat having the remaining 50% equity interest through Gap Group Investments
II Limited (C 75856). Each of GML, GGL, GDL, and GHL are project companies each entrusted with the
construction and development of one of the New Developments, whilst GPL is the owner of the Żebbuġ
Development.
Each of GML, GGL and GDL is dependent on the Issuer as to the amount of Bond Issue net proceeds
that will be on-lent by the Issuer to each of the afore-mentioned companies in terms of the Securities
Note. Each of the Guarantors is not dependent on other entities within the Group. A short description
of each of the Guarantors is provided hereunder.
100%
100%
Gap Group Investments II
Limited
(C 75856)
Gap Mellieħa (I)
Limited
(C 72013)
Gap Group p.l.c. (C 75875)
(Issuer)
Manikata Holdings
Limited
(C 53818)
Gap Group Finance Limited
(C 54352)
100% 100%
GEOM Holdings
Limited
(C 64409)
Gap Group
Contracting Limited
(C 75879)
GEOM
Developments
Limited
(C 50805)
Gap Għargħur
Limited
(C 72015)
100% 100% 100%
Gap Properties Limited
(C 47928)
99.92% 99.93%
GAP GROUP FINANCIAL ANALYSIS SUMMARY 8
3.1 THE GUARANTORS
3.1.1 Gap Mellieħa (I) Limited
GML is a private limited liability company, registered and operating in Malta in terms of the Act with
company registration number C 72013, having its registered office at GAP Holdings Head Office, Ċensu
Scerri Street, Tigné, Sliema, SLM 3060, Malta. GML has an authorised share capital of €1,200 (one
thousand two hundred Euro) and an issued share capital of €1,200 (one thousand two hundred Euro)
divided into ordinary shares of €1 (one Euro) each, fully paid up. GML was set up on 26 August 2015
as a property development company, initially to acquire the Mellieħa site and develop the Mellieħa
Development.
3.1.2 Gap Għargħur Limited
GGL is a private limited liability company, registered and operating in Malta in terms of the Act with
company registration number C 72015, having its registered office at GAP Holdings Head Office, Ċensu
Scerri Street, Tigné, Sliema, SLM 3060, Malta. GGL has an authorised share capital of €3,458 (three
thousand four hundred and fifty eight Euro) and an issued share capital of €3,458 (three thousand four
hundred and fifty eight Euro) divided into ordinary shares of €1 (one Euro) each, fully paid up. GGL was
set up on 26 August 2015 to acquire the Għargħur site and develop the Għargħur Development.
3.1.3 Gap Properties Limited
GPL is a private limited liability company, registered in Malta in terms of the Act with company
registration number C 47928, having its registered office at GAP Holdings Head Office, Ċensu Scerri
Street, Tigné, Sliema, SLM 3060, Malta. GPL has an authorised share capital of €2,800 (two thousand
eight hundred Euro) and an issued share capital of €2,800 (two thousand eight hundred Euro) divided
into ordinary shares of €1 (one Euro) each, fully paid up. GPL was established to act as a property
development company on 14 October 2009, initially for the Żebbuġ project.
3.1.4 Geom Developments Limited
GDL is a private limited liability company, registered in Malta in terms of the Act with company
registration number C 50805, having its registered office at GAP Holdings Head Office, Ċensu Scerri
Street, Tigné, Sliema, SLM 3060, Malta. GDL has an authorised share capital of €2,000 (two thousand
Euro) and an issued share capital of €2,000 (two thousand Euro) divided into ordinary shares of €1
(one Euro) each, fully paid up. GDL was established on 7 October 2010, and owns an undivided portion
of the site situated in Triq il-Porzjunkola corner with Triq it-Tamar in Qawra, over which Blocks A, B
and C of the Qawra Development are being developed. The other undivided portion of land is owned
by its affiliate Geom Holdings Limited.
GAP GROUP FINANCIAL ANALYSIS SUMMARY 9
4. THE PROJECTS
4.1 THE ŻEBBUĠ DEVELOPMENT - HISTORY AND OVERVIEW
GPL embarked on the Żebbuġ Development in June 2012 when it acquired the land measuring circa
6,878m2, situated at ‘Ta’ Robba’ in the district of ‘Ħal-Mula’ in Żebbuġ, which area is located just off
the village centre. Development was completed in Q1 2017 at an aggregate cost of circa €10.5 million,
and comprises 193 apartments, 2 retail outlets, and 225 garages/car spaces.
During FY2017, the last remaining 3 apartments were sold, together with 19 garages/car spaces. The
remaining stock as at 31 December 2017 included 31 garages and 1 retail shop, of which, 9 garages
and the retail shop are subject to promise of sale agreements.
4.2 THE QAWRA DEVELOPMENT - HISTORY AND OVERVIEW
The Qawra Development is a joint venture between GDL and GHL, both subsidiaries of the Issuer. The
Project is constructed over a site consisting of two divided portions of land, one measuring
approximately 2,280m2 (inclusive of the road formation) belonging to GHL and another portion of land
measuring approximately 1,228m2 belonging to GDL, and both situated in Triq il-Porzjunkola corner
with Triq it-Tamar which is situated just off the Qawra seafront. Both portions of land were purchased
by GDL and GHL by two separate contracts dated 26 March 2015 published by Notary Dr John Spiteri.
4.2.1 Development
The Project is fully developed and includes a total of 145 residential units and 180 garages/car spaces.
The units occupy a total built up saleable area of circa 24,879m2 spread over seven blocks with a variety
of one, two, and three bedroom units. Three of the said blocks are constructed over the property
owned by GDL, whilst the remaining four blocks are constructed over the property owned by GHL. The
blocks identified as A, B and C (property of GDL and forming part of the Hypothecated Property) consist
of 62 residential units and 58 underlying garage spaces, whilst Blocks D, E, F and G (property of GHL)
will consist of 83 residential units and 122 underlying garage spaces.
The aggregate cost for developing the Project amounted to circa €8.1 million (Blocks A, B and C: €2.9
million; Blocks D, E, F and G: €5.2 million) and was near completion in January 2018.
4.2.2 Sale of Units
The apartments which form part of the Qawra Development have been targeted principally towards
first-time buyers, rental investors, and foreigners wishing to relocate to Malta.
In 2017, GDL (Blocks A, B and C) contracted 51 apartments and 29 garages. The remaining 11
apartments are subject to preliminary agreements, whilst 16 of the remaining 29 garages are
committed. With respect to GHL (Blocks D, E, F and G), the company entered into sale contracts for 57
units and 54 garages during 2017, and as at year end, outstanding stock comprised 26 apartments and
68 garages, of which 22 apartments and 20 garages are committed.
GAP GROUP FINANCIAL ANALYSIS SUMMARY 10
4.3 THE MELLIEĦA DEVELOPMENT - HISTORY AND OVERVIEW
In October 2015, GML entered into a preliminary agreement for the purchase and acquisition of a plot
of land measuring circa 5,220m2 with access from the three streets surrounding the property situated
in the Ta’ Masrija area in Mellieħa over which the Mellieħa Development shall be constructed and
developed. The property was acquired pursuant to a deed of acquisition dated 21 October 2016.
The site is located in the village of Mellieħa in the northern region of Malta. It enjoys unobstructed
country views of the imposing area known as Miżieb and distant sea views of the island’s north western
coastline. Moreover, the site is a short drive away from Malta’s largest sandy beaches, Għadira Bay
and Golden Bay and a short walk to the village centre of Mellieħa.
Given the location of the site and the proposed level of finishes which the Mellieħa Development will
embrace, the Directors believe that the Project offers a unique opportunity for owning residential
property in this part of the island.
4.3.1 Development
The Mellieħa Development is planned to comprise 152 luxury apartments which will be sold finished
in a complete state, including all common areas and the formation of the road. The development is
covered by a full development permit and is projected to encompass 10 blocks of apartments, each
with separate entrances and served with passenger lifts accessing both the apartments and underlying
garage levels. The apartments at the top level will also have access to roof level and will enjoy full
ownership thereof.
The progress of the apartments will be spread over 5 phases with each phase comprising 2 blocks of
apartments. Out of the 10 blocks, 7 will contain 16 apartments each, 2 will contain 14 apartments each
and 1 block will include 12 apartments. The apartments shall be spread over 8 levels in each block. The
development shall also include 174 lock-up underground garages spread over 3 underground levels.
Both apartments and garages combined shall occupy a total built up saleable area of circa 44,325m2.
The development of the Project is planned to span over 32 months from commencement of works,
and should be completed by Q2 2019. As at 31 December 2017, the first two blocks (Block I & J) of the
site were fully constructed, whilst the second two blocks (Blocks G & H) were circa 60% complete in
terms of construction. In terms of finishes, approximately 70% of the electrical and water works, 80%
of tiling and 80% of plastering works of Blocks I & J were complete. On the other hand, circa 20% of
electrical and water works and 15% of both tiling and plastering works had been completed on Blocks
G & H. The estimated value of works in progress amounted to €3.6 million (FY2016: €1.0 million).
Completion to a finished state of Blocks G & H is envisaged by Q2 and Q3 2018, respectively.
GAP GROUP FINANCIAL ANALYSIS SUMMARY 11
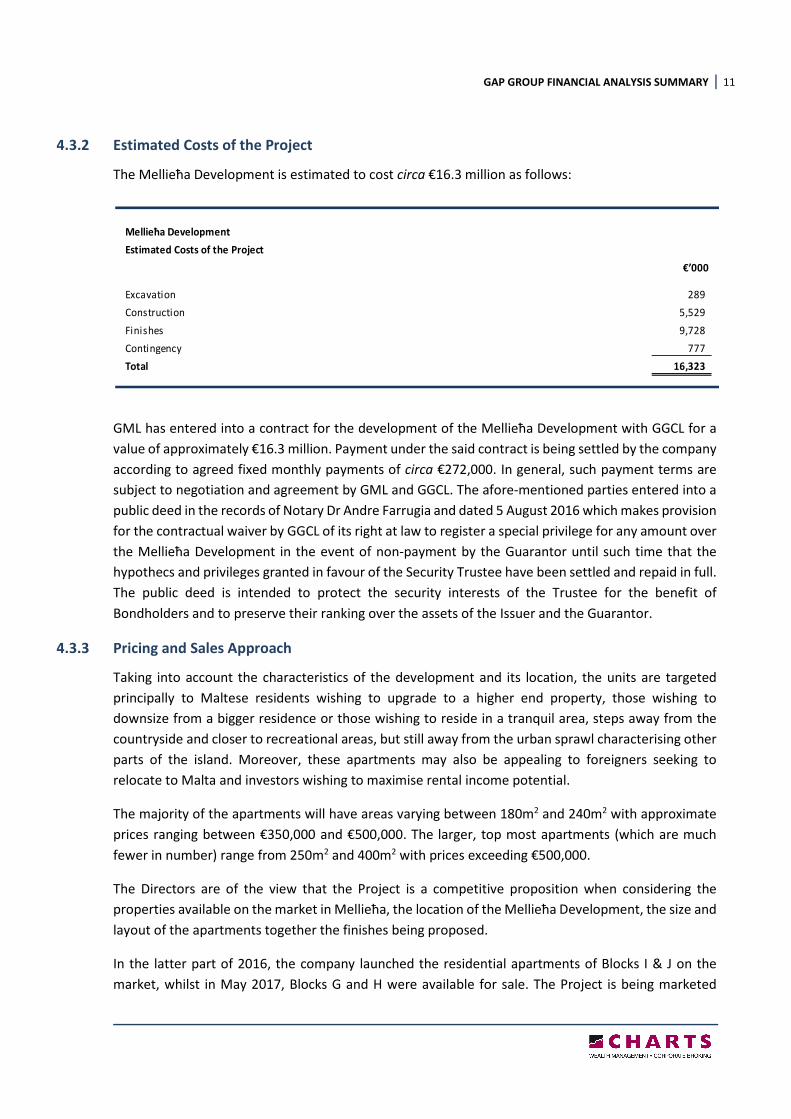
4.3.2 Estimated Costs of the Project
The Mellieħa Development is estimated to cost circa €16.3 million as follows:
GML has entered into a contract for the development of the Mellieħa Development with GGCL for a
value of approximately €16.3 million. Payment under the said contract is being settled by the company
according to agreed fixed monthly payments of circa €272,000. In general, such payment terms are
subject to negotiation and agreement by GML and GGCL. The afore-mentioned parties entered into a
public deed in the records of Notary Dr Andre Farrugia and dated 5 August 2016 which makes provision
for the contractual waiver by GGCL of its right at law to register a special privilege for any amount over
the Mellieħa Development in the event of non-payment by the Guarantor until such time that the
hypothecs and privileges granted in favour of the Security Trustee have been settled and repaid in full.
The public deed is intended to protect the security interests of the Trustee for the benefit of
Bondholders and to preserve their ranking over the assets of the Issuer and the Guarantor.
4.3.3 Pricing and Sales Approach
Taking into account the characteristics of the development and its location, the units are targeted
principally to Maltese residents wishing to upgrade to a higher end property, those wishing to
downsize from a bigger residence or those wishing to reside in a tranquil area, steps away from the
countryside and closer to recreational areas, but still away from the urban sprawl characterising other
parts of the island. Moreover, these apartments may also be appealing to foreigners seeking to
relocate to Malta and investors wishing to maximise rental income potential.
The majority of the apartments will have areas varying between 180m2 and 240m2 with approximate
prices ranging between €350,000 and €500,000. The larger, top most apartments (which are much
fewer in number) range from 250m2 and 400m2 with prices exceeding €500,000.
The Directors are of the view that the Project is a competitive proposition when considering the
properties available on the market in Mellieħa, the location of the Mellieħa Development, the size and
layout of the apartments together the finishes being proposed.
In the latter part of 2016, the company launched the residential apartments of Blocks I & J on the
market, whilst in May 2017, Blocks G and H were available for sale. The Project is being marketed
Mellieħa Development
Estimated Costs of the Project
€’000
Excavation 289
Construction 5,529
Finishes 9,728
Contingency 777
Total 16,323
GAP GROUP FINANCIAL ANALYSIS SUMMARY 12
through a number of agents in Malta as well as through the Group’s internet website and various forms
of social media. By the end of 2017, the Company managed to conclude preliminary sale agreements
for 27 apartments in the first two blocks (I & J), 7 preliminary sale agreements for units in the second
two blocks (G & H) and preliminary sale agreements for 40 garages, valued at €12.7 million. The
committed apartments equate to 53% of the available residential units on the market (Blocks G, H, I,
and J) and 22% of the total residential units of the Project. By March 2018, 12 additional apartments
were subject to promise of sale agreements.
Blocks I and J are expected to be fully completed during FY2018, which will enable the Company to
enter into sale contracts relating to units in the aforesaid blocks.
4.4 THE GĦARGĦUR DEVELOPMENT - HISTORY AND OVERVIEW
In February 2016, GGL acquired the legal title of a portion of land in Għargħur, which includes its sub-
terrain and airspace and measures circa 2,585m2, accessible from an entrance bearing the official
number 39 (previously numbered 20) in Triq il-Kbira and from another entrance in Triq Caravaggio.
The site is located in the small village of Għargħur in the north eastern region of Malta. Over the years,
the locality has gained its popularity with regards to the property market due to the small size,
exclusivity and tranquility of the village, together with its accessible location. The site is situated in a
residential area, close to the village centre and just a short walk to one of the island’s most picturesque
valleys, Wied id-Dies/Wied Santa Marija taż-Żellieqa, which connects Għargħur with Madliena.
4.4.1 Development
The Għargħur Development is covered by a full development permit and includes the development of
28 residential units and 6 penthouses, 38 (1-car) lock-up garages and 3 (2-car) lock-up garages. The
total area of the development will add up to circa 10,680m2 (built up area) with a further 330m2 of
internal street area. The apartments shall be spread over 5 levels, whilst garages shall be over 1
underground level.
The apartments will be sold finished in a complete state, including all common areas and the formation
of the internal street. The development will be spread over 4 blocks of apartments, each with separate
entrances and served with passenger lifts accessing both the apartments and underlying garage levels.
Works on the Project have commenced and as at 31 December 2017, the site was fully excavated and
construction up to garage levels was progressing well. Total value of works in progress as at the afore-
mentioned date amounted to €2.39 million (FY2016: €390,149). Construction of the residential floors
is due to commence at the beginning of 2018 and full completion of this development is expected to
be accomplished by the end 2018.
GAP GROUP FINANCIAL ANALYSIS SUMMARY 13
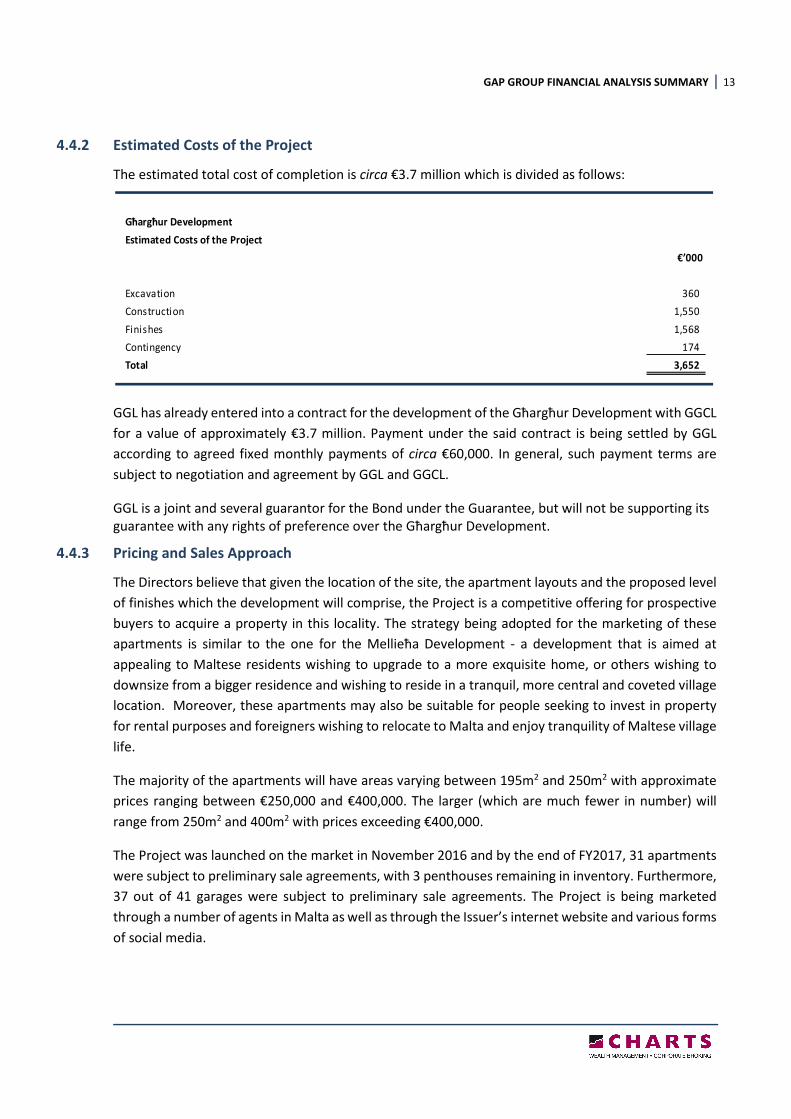
4.4.2 Estimated Costs of the Project
The estimated total cost of completion is circa €3.7 million which is divided as follows:
GGL has already entered into a contract for the development of the Għargħur Development with GGCL
for a value of approximately €3.7 million. Payment under the said contract is being settled by GGL
according to agreed fixed monthly payments of circa €60,000. In general, such payment terms are
subject to negotiation and agreement by GGL and GGCL.
GGL is a joint and several guarantor for the Bond under the Guarantee, but will not be supporting its
guarantee with any rights of preference over the Għargħur Development.
4.4.3 Pricing and Sales Approach
The Directors believe that given the location of the site, the apartment layouts and the proposed level
of finishes which the development will comprise, the Project is a competitive offering for prospective
buyers to acquire a property in this locality. The strategy being adopted for the marketing of these
apartments is similar to the one for the Mellieħa Development - a development that is aimed at
appealing to Maltese residents wishing to upgrade to a more exquisite home, or others wishing to
downsize from a bigger residence and wishing to reside in a tranquil, more central and coveted village
location. Moreover, these apartments may also be suitable for people seeking to invest in property
for rental purposes and foreigners wishing to relocate to Malta and enjoy tranquility of Maltese village
life.
The majority of the apartments will have areas varying between 195m2 and 250m2 with approximate
prices ranging between €250,000 and €400,000. The larger (which are much fewer in number) will
range from 250m2 and 400m2 with prices exceeding €400,000.
The Project was launched on the market in November 2016 and by the end of FY2017, 31 apartments
were subject to preliminary sale agreements, with 3 penthouses remaining in inventory. Furthermore,
37 out of 41 garages were subject to preliminary sale agreements. The Project is being marketed
through a number of agents in Malta as well as through the Issuer’s internet website and various forms
of social media.
Għargħur Development
Estimated Costs of the Project
€’000
Excavation 360
Construction 1,550
Finishes 1,568
Contingency 174
Total 3,652
GAP GROUP FINANCIAL ANALYSIS SUMMARY 14
4.5 LUQA DEVELOPMENT – OVERVIEW OF NEW INVESTMENT
In December 2016, the Group (through GML) made an investment of €2.3 million in a related party –
QIL - to enable the latter company to enter into a preliminary agreement and settle other ancillary
costs relating to the acquisition of a site in Luqa, which is divided into seven parcels of land.
The proposed Luqa Development will comprise units of circa 110m2 to 135m2, and are expected to be
priced within a range to target primarily first-time buyers. The Gap Group sought this investment
following the success achieved with the Żebbuġ and Qawra Developments, whereby to date practically
all units have been sold. This position has left the Gap Group with no available stock to satisfy demand
from the lower-priced end of the property market. As such, the Directors believe that the above-stated
investment is required to sustain the Group’s business activities.
The deed of purchase was executed on 26 April 2017 and the outstanding balance of consideration
was financed mainly through a bank loan facility. It is the intention of the Directors to integrate QIL as
a fully owned subsidiary company of the Gap Group by not later than the end of FY2018.
The properties, which include the sub-terrain and airspace, are accessible from eight streets, namely
Triq Ġorġ Zahra, Triq Tumas Galea, Triq l-Iskola, Triq Ġeraldu Spiteri, Triq W. Briffa, Triq Indri Micallef,
Triq l-Aħwa Vassallo and Triq Ġuzeppi Callus, in an area known as ‘Ta Blejkiet’ in Luqa, and measure in
aggregate circa 15,023m2 (developable area is circa 10,454m2).
The afore-mentioned properties are situated in the heart of the residential area of Luqa. Triq l-Aħwa
Vassallo will provide a direct access to the town’s village core, a distance of around 200 metres from
the main square and parish church. The public school of the village and one of the largest supermarkets
in the south of Malta are also close by and directly accessible from the proposed development.
Furthermore, the properties are located within a few metres from the arterial road which links the
Malta International Airport to the rest of the island.
4.5.1 Development
All parcels of land are situated within the approved building scheme and, subject to issuance of
planning permits, will be developed in a number of phases. A full development permit for Zones A & B
was issued in April 2017. The Group intends to gradually apply for planning permits for the remaining
sites.
Zone A consists of 69 units, being 13 maisonettes, 43 apartments and 13 penthouses which are
currently on the market. Zone B consists of 37 units, being 3 maisonettes, 29 apartments and 5
penthouses. Both Zones are spread over 5 floors, together with 73 lock-up garages, all to be sold
finished in a complete state including all common areas. The units in Zone A and Zone B will have an
average total floor area of circa 135m2 and 110m2 respectively. The total area of the development,
excluding garage levels, will add up to circa 13,500m2 (Zone A - 9,340m2, Zone B - 4,140m2).
The development of Zones A & B is planned to span over 28 months from commencement of works.
Excavation works commenced mid-2017 and took 2 months from commencement date to complete,
whilst the project will be fully constructed by Q4 2019. Zone A and Zone B construction works are
GAP GROUP FINANCIAL ANALYSIS SUMMARY 15
expected to be finalised by Q1 2019 and Q2 2019 respectively, whilst both zones should be fully
completed by Q4 2019.
4.5.2 Estimated Costs of the Project
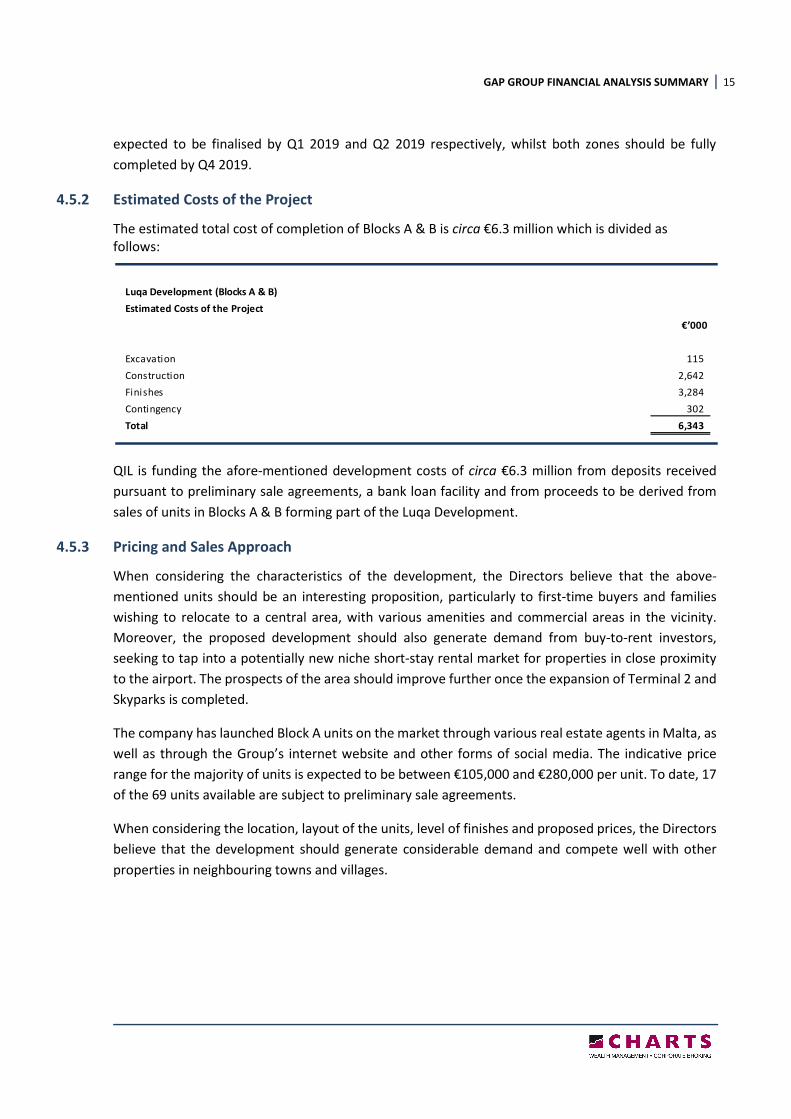
The estimated total cost of completion of Blocks A & B is circa €6.3 million which is divided as
follows:
QIL is funding the afore-mentioned development costs of circa €6.3 million from deposits received
pursuant to preliminary sale agreements, a bank loan facility and from proceeds to be derived from
sales of units in Blocks A & B forming part of the Luqa Development.
4.5.3 Pricing and Sales Approach
When considering the characteristics of the development, the Directors believe that the above-
mentioned units should be an interesting proposition, particularly to first-time buyers and families
wishing to relocate to a central area, with various amenities and commercial areas in the vicinity.
Moreover, the proposed development should also generate demand from buy-to-rent investors,
seeking to tap into a potentially new niche short-stay rental market for properties in close proximity
to the airport. The prospects of the area should improve further once the expansion of Terminal 2 and
Skyparks is completed.
The company has launched Block A units on the market through various real estate agents in Malta, as
well as through the Group’s internet website and other forms of social media. The indicative price
range for the majority of units is expected to be between €105,000 and €280,000 per unit. To date, 17
of the 69 units available are subject to preliminary sale agreements.
When considering the location, layout of the units, level of finishes and proposed prices, the Directors
believe that the development should generate considerable demand and compete well with other
properties in neighbouring towns and villages.
Luqa Development (Blocks A & B)
Estimated Costs of the Project
€’000
Excavation 115
Construction 2,642
Finishes 3,284
Contingency 302
Total 6,343
GAP GROUP FINANCIAL ANALYSIS SUMMARY 16
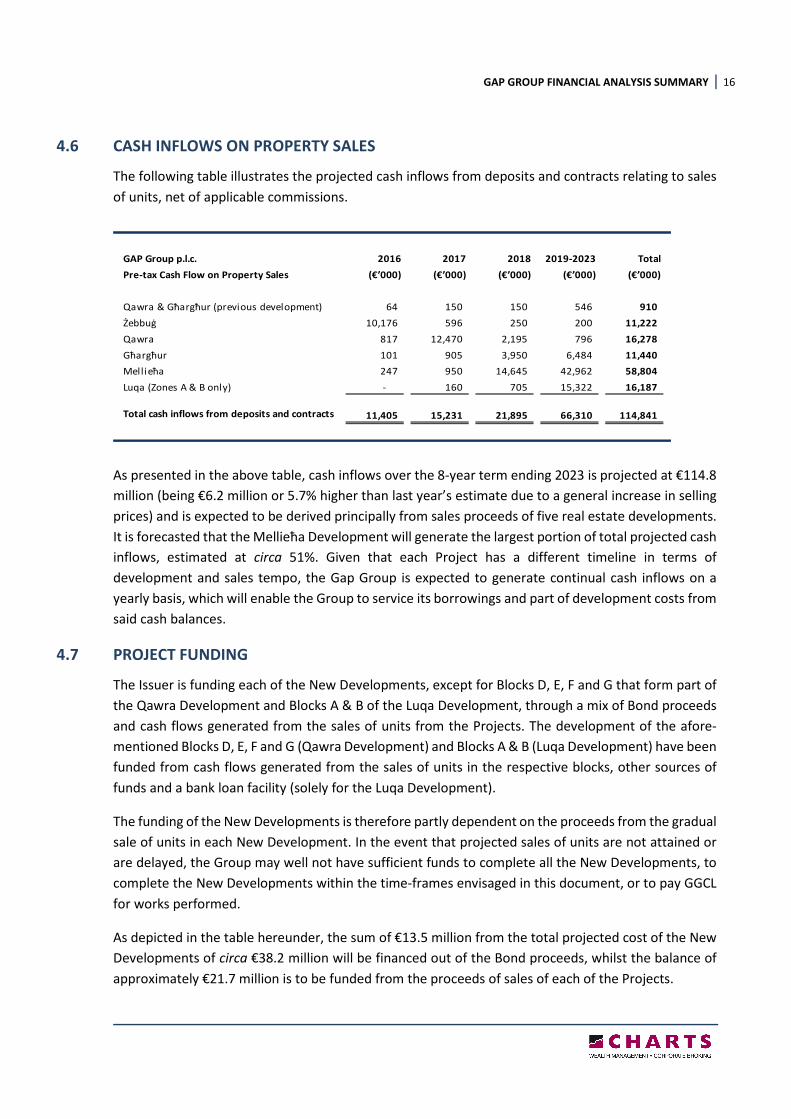
4.6 CASH INFLOWS ON PROPERTY SALES
The following table illustrates the projected cash inflows from deposits and contracts relating to sales
of units, net of applicable commissions.
As presented in the above table, cash inflows over the 8-year term ending 2023 is projected at €114.8
million (being €6.2 million or 5.7% higher than last year’s estimate due to a general increase in selling
prices) and is expected to be derived principally from sales proceeds of five real estate developments.
It is forecasted that the Mellieħa Development will generate the largest portion of total projected cash
inflows, estimated at circa 51%. Given that each Project has a different timeline in terms of
development and sales tempo, the Gap Group is expected to generate continual cash inflows on a
yearly basis, which will enable the Group to service its borrowings and part of development costs from
said cash balances.
4.7 PROJECT FUNDING
The Issuer is funding each of the New Developments, except for Blocks D, E, F and G that form part of
the Qawra Development and Blocks A & B of the Luqa Development, through a mix of Bond proceeds
and cash flows generated from the sales of units from the Projects. The development of the afore-
mentioned Blocks D, E, F and G (Qawra Development) and Blocks A & B (Luqa Development) have been
funded from cash flows generated from the sales of units in the respective blocks, other sources of
funds and a bank loan facility (solely for the Luqa Development).
The funding of the New Developments is therefore partly dependent on the proceeds from the gradual
sale of units in each New Development. In the event that projected sales of units are not attained or
are delayed, the Group may well not have sufficient funds to complete all the New Developments, to
complete the New Developments within the time-frames envisaged in this document, or to pay GGCL
for works performed.
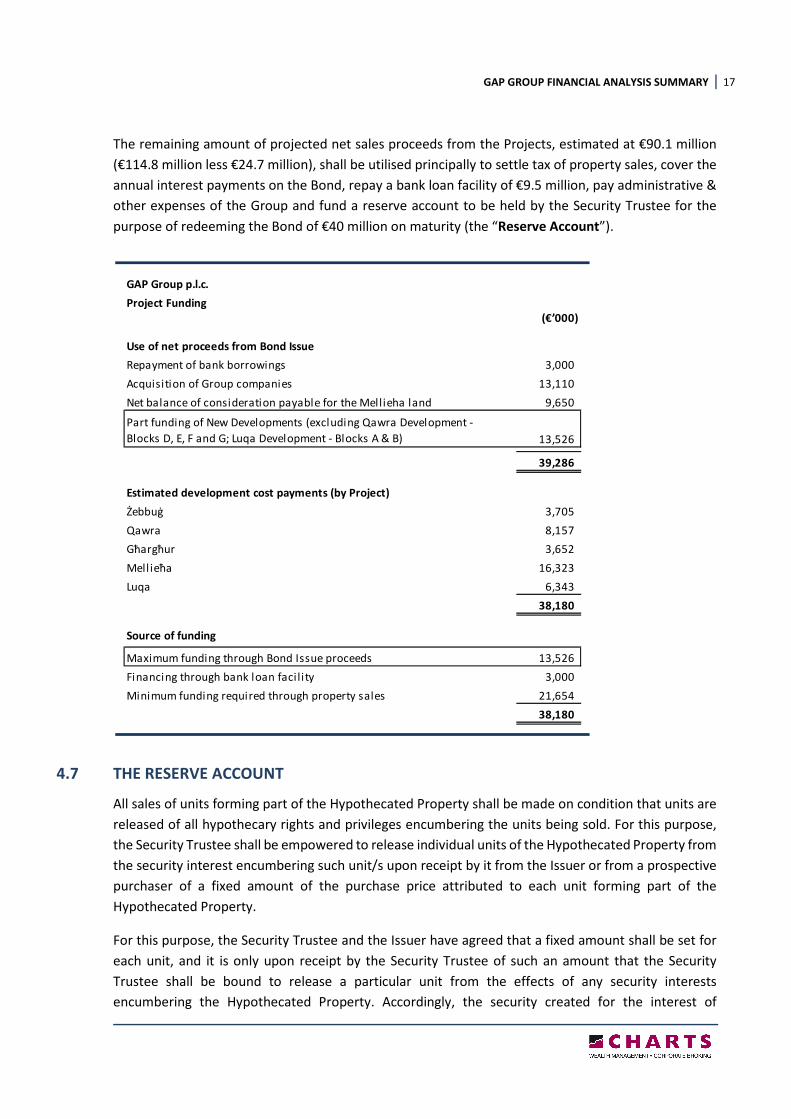
As depicted in the table hereunder, the sum of €13.5 million from the total projected cost of the New
Developments of circa €38.2 million will be financed out of the Bond proceeds, whilst the balance of
approximately €21.7 million is to be funded from the proceeds of sales of each of the Projects.
GAP Group p.l.c. 2016 2017 2018 2019-2023 Total
Pre-tax Cash Flow on Property Sales (€’000) (€’000) (€’000) (€’000) (€’000)
Qawra & Għargħur (previous development) 64 150 150 546 910
Żebbuġ 10,176 596 250 200 11,222
Qawra 817 12,470 2,195 796 16,278
Għargħur 101 905 3,950 6,484 11,440
Mellieħa 247 950 14,645 42,962 58,804
Luqa (Zones A & B only) - 160 705 15,322 16,187
Total cash inflows from deposits and contracts 11,405 15,231 21,895 66,310 114,841
GAP GROUP FINANCIAL ANALYSIS SUMMARY 17
The remaining amount of projected net sales proceeds from the Projects, estimated at €90.1 million
(€114.8 million less €24.7 million), shall be utilised principally to settle tax of property sales, cover the
annual interest payments on the Bond, repay a bank loan facility of €9.5 million, pay administrative &
other expenses of the Group and fund a reserve account to be held by the Security Trustee for the
purpose of redeeming the Bond of €40 million on maturity (the “Reserve Account”).
4.7 THE RESERVE ACCOUNT
All sales of units forming part of the Hypothecated Property shall be made on condition that units are
released of all hypothecary rights and privileges encumbering the units being sold. For this purpose,
the Security Trustee shall be empowered to release individual units of the Hypothecated Property from
the security interest encumbering such unit/s upon receipt by it from the Issuer or from a prospective
purchaser of a fixed amount of the purchase price attributed to each unit forming part of the
Hypothecated Property.
For this purpose, the Security Trustee and the Issuer have agreed that a fixed amount shall be set for
each unit, and it is only upon receipt by the Security Trustee of such an amount that the Security
Trustee shall be bound to release a particular unit from the effects of any security interests
encumbering the Hypothecated Property. Accordingly, the security created for the interest of
GAP Group p.l.c.
Project Funding(€’000)
Use of net proceeds from Bond Issue
Repayment of bank borrowings 3,000
Acquisition of Group companies 13,110
Net balance of consideration payable for the Mellieha land 9,650
Part funding of New Developments (excluding Qawra Development -
Blocks D, E, F and G; Luqa Development - Blocks A & B) 13,526
39,286
Estimated development cost payments (by Project)
Żebbuġ 3,705
Qawra 8,157
Għargħur 3,652
Mell ieħa 16,323
Luqa 6,343
38,180
Source of funding
Maximum funding through Bond Issue proceeds 13,526
Financing through bank loan faci lity 3,000
Minimum funding required through property sales 21,654
38,180
GAP GROUP FINANCIAL ANALYSIS SUMMARY 18
Bondholders shall only be reduced against a cash payment made by the Issuer in the Reserve Account
to be held by the Trustee for the benefit of Bondholders. The Security Trustee shall hold the funds
received in a segregated bank account with a credit institution in Malta and shall hold such funds for
the benefit of Bondholders with a view to meeting the redemption of the Bonds on maturity.
Any shortfall in the amount receivable by the Security Trustee pursuant to the foregoing shall be
required to be made up, in whole or in part, out of the available sale proceeds from any subsequent
sale or sales until such shortfall shall have been made up in its entirety.
In accordance with the Trust Deed, the Security Trustee is authorised to release to the Issuer any funds
held in and to the credit of the Reserve Account which are in excess of the aggregate value of Bonds
outstanding, provided that there remain sufficient units, covered by the security interests, to be sold
to cover the interest still to become payable on the Bonds until the redemption date.
The Trustee shall hold such monies standing to the credit of the Reserve Account to ensure their
preservation and the Security Trustee may from time to time, but shall not be obliged to, through the
engagement of a licensed investment advisor, invest such monies in such a manner and in such
instruments as are herein provided, namely:
(i) investment or re-investment in any EU Government debt securities or other debt securities
issued or guaranteed by an OECD sovereign state and without any currency exchange risk,
in either case for a term not exceeding the redemption date of the Bonds; or
(ii) Re-purchase of the Bonds for cancellation; or
(iii) not more than 20 per cent of any amounts held in the Reserve Account may be invested in
debt securities listed on the Malta Stock Exchange or in other rated (not less than AA or its
equivalent) debt securities denominated in Euro and traded on a regulated market in the
European Union.
All amounts received by the Trustee from the sales proceeds of units in any one of the Projects shall
be credited to the Reserve Account and shall, subject to the immediately preceding paragraph, be
retained for the purpose of redeeming the Bonds on maturity. The Group intends to utilise all sales
proceeds arising from the Għargħur Development to meet development and construction costs of the
New Developments and as such, none of those proceeds are earmarked to be allocated to the Reserve
Account. In the absence of unforeseen circumstances and subject to there being no material adverse
changes in circumstances, the Directors are of the view that the percentages available for cash flows
that will be credited to the Reserve Account will be sufficient to cover the redemption of the Bonds on
maturity.
GAP GROUP FINANCIAL ANALYSIS SUMMARY 19
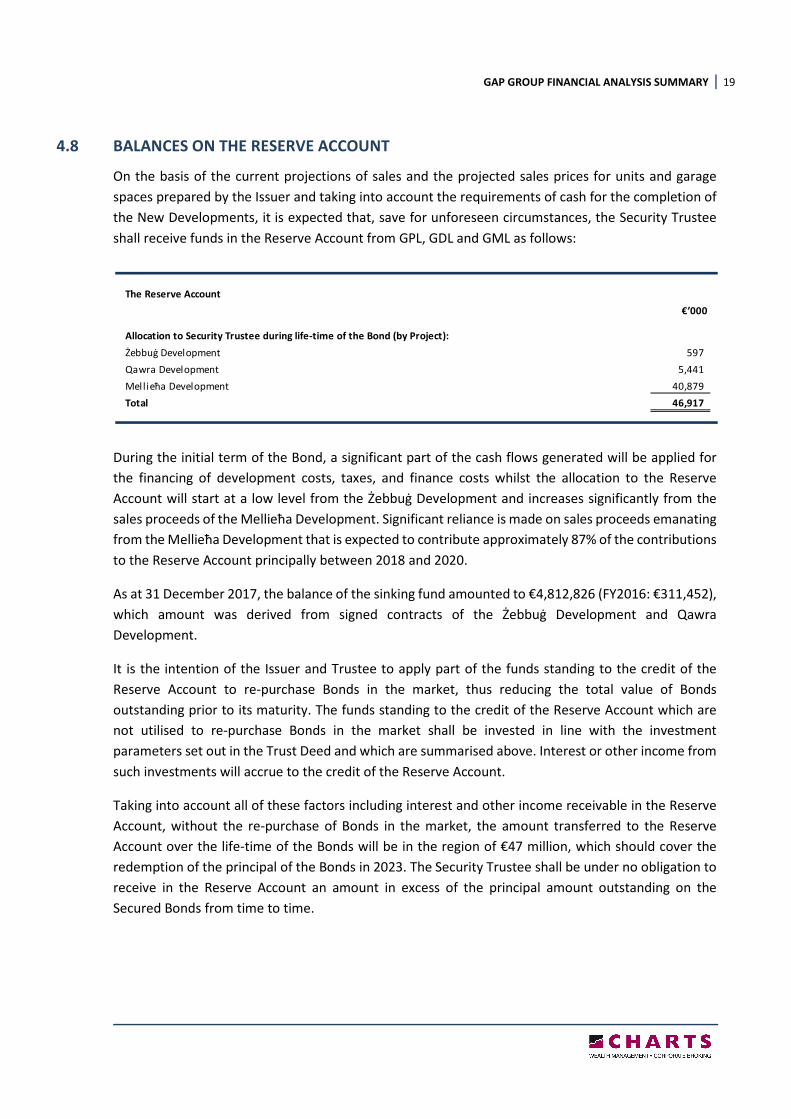
4.8 BALANCES ON THE RESERVE ACCOUNT
On the basis of the current projections of sales and the projected sales prices for units and garage
spaces prepared by the Issuer and taking into account the requirements of cash for the completion of
the New Developments, it is expected that, save for unforeseen circumstances, the Security Trustee
shall receive funds in the Reserve Account from GPL, GDL and GML as follows:
During the initial term of the Bond, a significant part of the cash flows generated will be applied for
the financing of development costs, taxes, and finance costs whilst the allocation to the Reserve
Account will start at a low level from the Żebbuġ Development and increases significantly from the
sales proceeds of the Mellieħa Development. Significant reliance is made on sales proceeds emanating
from the Mellieħa Development that is expected to contribute approximately 87% of the contributions
to the Reserve Account principally between 2018 and 2020.
As at 31 December 2017, the balance of the sinking fund amounted to €4,812,826 (FY2016: €311,452),
which amount was derived from signed contracts of the Żebbuġ Development and Qawra
Development.
It is the intention of the Issuer and Trustee to apply part of the funds standing to the credit of the
Reserve Account to re-purchase Bonds in the market, thus reducing the total value of Bonds
outstanding prior to its maturity. The funds standing to the credit of the Reserve Account which are
not utilised to re-purchase Bonds in the market shall be invested in line with the investment
parameters set out in the Trust Deed and which are summarised above. Interest or other income from
such investments will accrue to the credit of the Reserve Account.
Taking into account all of these factors including interest and other income receivable in the Reserve
Account, without the re-purchase of Bonds in the market, the amount transferred to the Reserve
Account over the life-time of the Bonds will be in the region of €47 million, which should cover the
redemption of the principal of the Bonds in 2023. The Security Trustee shall be under no obligation to
receive in the Reserve Account an amount in excess of the principal amount outstanding on the
Secured Bonds from time to time.
The Reserve Account
€’000
Allocation to Security Trustee during life-time of the Bond (by Project):
Żebbuġ Development 597
Qawra Development 5,441
Mel lieħa Development 40,879
Total 46,917
GAP GROUP FINANCIAL ANALYSIS SUMMARY 20
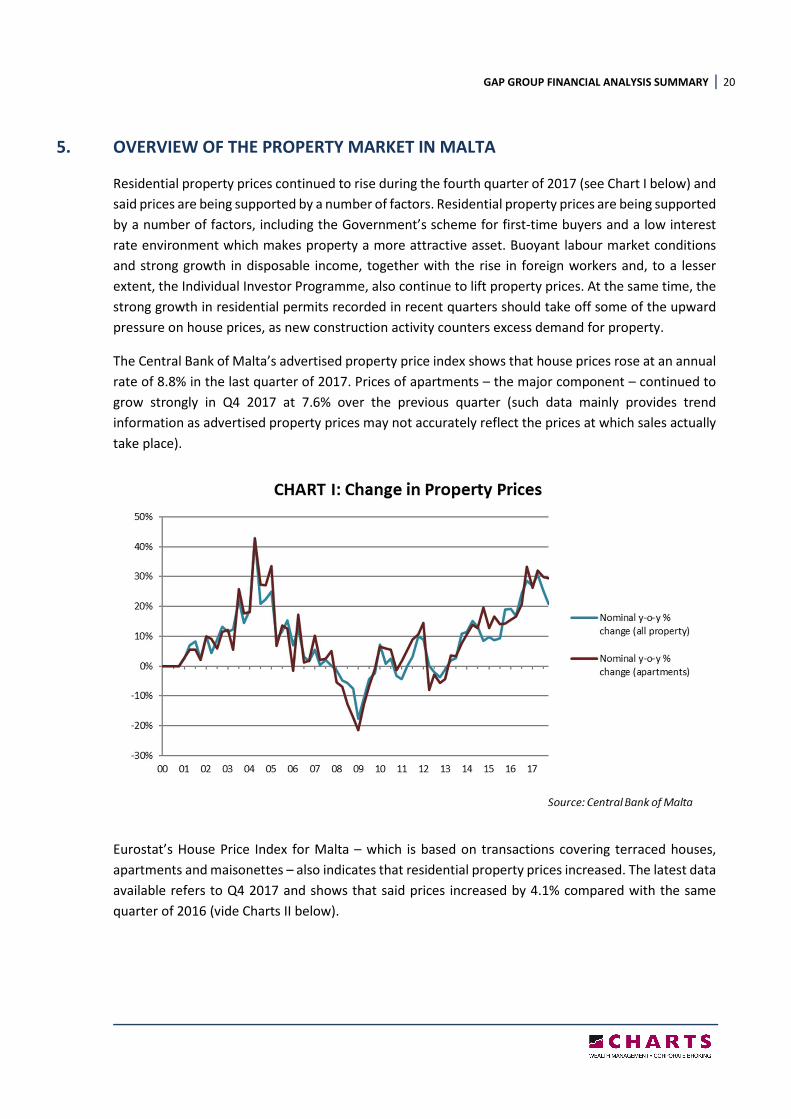
5. OVERVIEW OF THE PROPERTY MARKET IN MALTA
Residential property prices continued to rise during the fourth quarter of 2017 (see Chart I below) and
said prices are being supported by a number of factors. Residential property prices are being supported
by a number of factors, including the Government’s scheme for first-time buyers and a low interest
rate environment which makes property a more attractive asset. Buoyant labour market conditions
and strong growth in disposable income, together with the rise in foreign workers and, to a lesser
extent, the Individual Investor Programme, also continue to lift property prices. At the same time, the
strong growth in residential permits recorded in recent quarters should take off some of the upward
pressure on house prices, as new construction activity counters excess demand for property.
The Central Bank of Malta’s advertised property price index shows that house prices rose at an annual
rate of 8.8% in the last quarter of 2017. Prices of apartments – the major component – continued to
grow strongly in Q4 2017 at 7.6% over the previous quarter (such data mainly provides trend
information as advertised property prices may not accurately reflect the prices at which sales actually
take place).
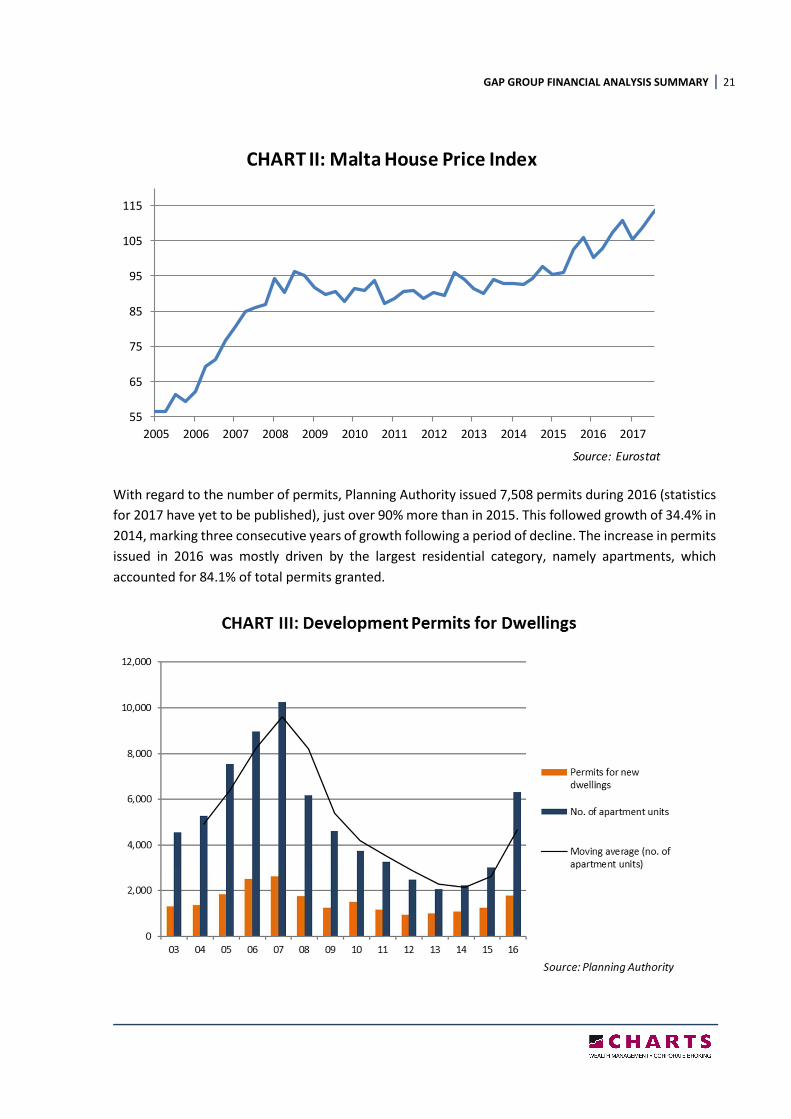
Eurostat’s House Price Index for Malta – which is based on transactions covering terraced houses,
apartments and maisonettes – also indicates that residential property prices increased. The latest data
available refers to Q4 2017 and shows that said prices increased by 4.1% compared with the same
quarter of 2016 (vide Charts II below).
GAP GROUP FINANCIAL ANALYSIS SUMMARY 21
With regard to the number of permits, Planning Authority issued 7,508 permits during 2016 (statistics
for 2017 have yet to be published), just over 90% more than in 2015. This followed growth of 34.4% in
2014, marking three consecutive years of growth following a period of decline. The increase in permits
issued in 2016 was mostly driven by the largest residential category, namely apartments, which
accounted for 84.1% of total permits granted.
55
65
75
85
95
105
115
2005 2006 2007 2008 2009 2010 2011 2012 2013 2014 2015 2016 2017
CHART II: Malta House Price Index
Source: Eurostat
GAP GROUP FINANCIAL ANALYSIS SUMMARY 22
The gross value added from the construction industry rose by 8.3% in 2017 (in nominal terms), from
€328.9 million in 2016 to €356.4 million), following a marginal decrease of 0.4% in 2016. During 2015,
a y-o-y increase of 8.8% or €26.7 million increase was registered.
6. TREND INFORMATION & BUSINESS STRATEGY
The real estate market in Malta remains a competitive one, in the context of existing and projected
developments, particularly in the Sliema and St Julians area. The New Developments are intended to
cater for a market which is not directly in competition, in terms of location, with the market for real
estate in the Sliema and St Julians area. The strategy is to address the demand for a niche market of
luxury apartments in other locations principally the north part of the island with views of both rural
landscapes and seascapes.
The target buyers, in the case of the Mellieħa and Għargħur Developments are the medium to high
end customers, both locals and foreigners, who are more interested in residential units away from the
urban sprawl of the Sliema – St Julians area. As far as the Issuer is aware, there are currently no
comparable projects in Mellieħa and Għargħur, and thus direct competition from new residential
developments in the subject areas is limited. The Group may however face new competition from
developers who may enter this property market segment in the coming years.
The successful launch on the market of units forming part of the Mellieħa and Għargħur Developments
has shown that there is a strong and active demand for real estate in Malta, particularly in two
segments, namely first-time buyers and high-end residential property. This view is also supported by
statistical data provided in the prior section, which demonstrates that the property market in Malta
has been gaining momentum in the last few years. Accordingly, the Directors have devised a pricing
strategy that should allow them to better target these market segments with the diverse offerings
through the Luqa Development for the first segment (as the units within the Żebbuġ and Qawra
Developments are practically all sold), and the Mellieħa Development (since only a few units are left
at the Għargħur Development) for the latter market segment. The Directors are satisfied with the sales
performance of the Żebbuġ and Qawra Developments, and current demand for the Mellieħa
Development and Għargħur Development have exceeded internal targets. As such, the Directors are
confident that actual outcome for the New Developments will at least be in line with expectations.
Management has acquired considerable knowledge from similar projects, not only from the
construction and development perspective, but also from a prospective buyer’s point of view.
Consequently, the Group’s offerings are based on this experience, and the units will therefore be
finished to a high quality standard and will also incorporate new features.
GAP GROUP FINANCIAL ANALYSIS SUMMARY 23
PART 2 – GAP GROUP PERFORMANCE REVIEW
7. FINANCIAL INFORMATION RELATING TO THE GUARANTORS
7.1 GAP PROPERTIES LIMITED
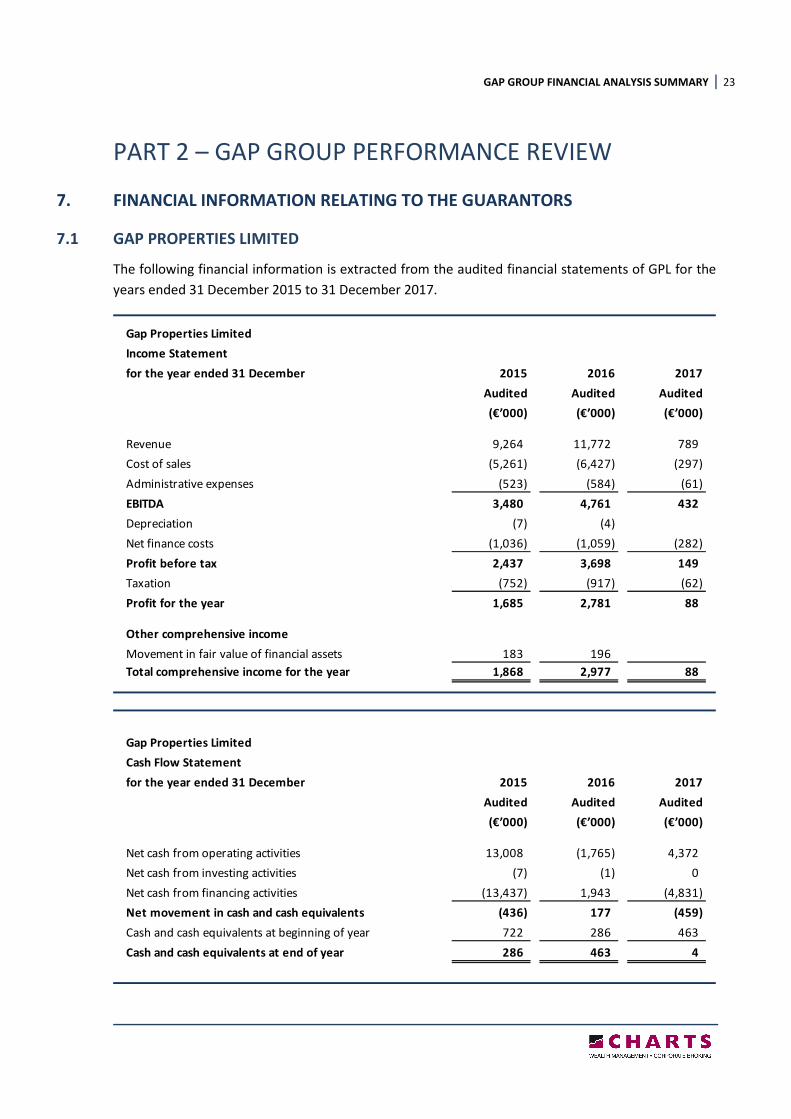
The following financial information is extracted from the audited financial statements of GPL for the
years ended 31 December 2015 to 31 December 2017.
Gap Properties Limited
Income Statement
for the year ended 31 December 2015 2016 2017
Audited Audited Audited
(€’000) (€’000) (€’000)
Revenue 9,264 11,772 789
Cost of sales (5,261) (6,427) (297)
Administrative expenses (523) (584) (61)
EBITDA 3,480 4,761 432
Depreciation (7) (4)
Net finance costs (1,036) (1,059) (282)
Profit before tax 2,437 3,698 149
Taxation (752) (917) (62)
Profit for the year 1,685 2,781 88
Other comprehensive income
Movement in fair value of financial assets 183 196
Total comprehensive income for the year 1,868 2,977 88
Gap Properties Limited
Cash Flow Statement
for the year ended 31 December 2015 2016 2017
Audited Audited Audited
(€’000) (€’000) (€’000)
Net cash from operating activities 13,008 (1,765) 4,372
Net cash from investing activities (7) (1) 0
Net cash from financing activities (13,437) 1,943 (4,831)
Net movement in cash and cash equivalents (436) 177 (459)
Cash and cash equivalents at beginning of year 722 286 463
Cash and cash equivalents at end of year 286 463 4
GAP GROUP FINANCIAL ANALYSIS SUMMARY 24
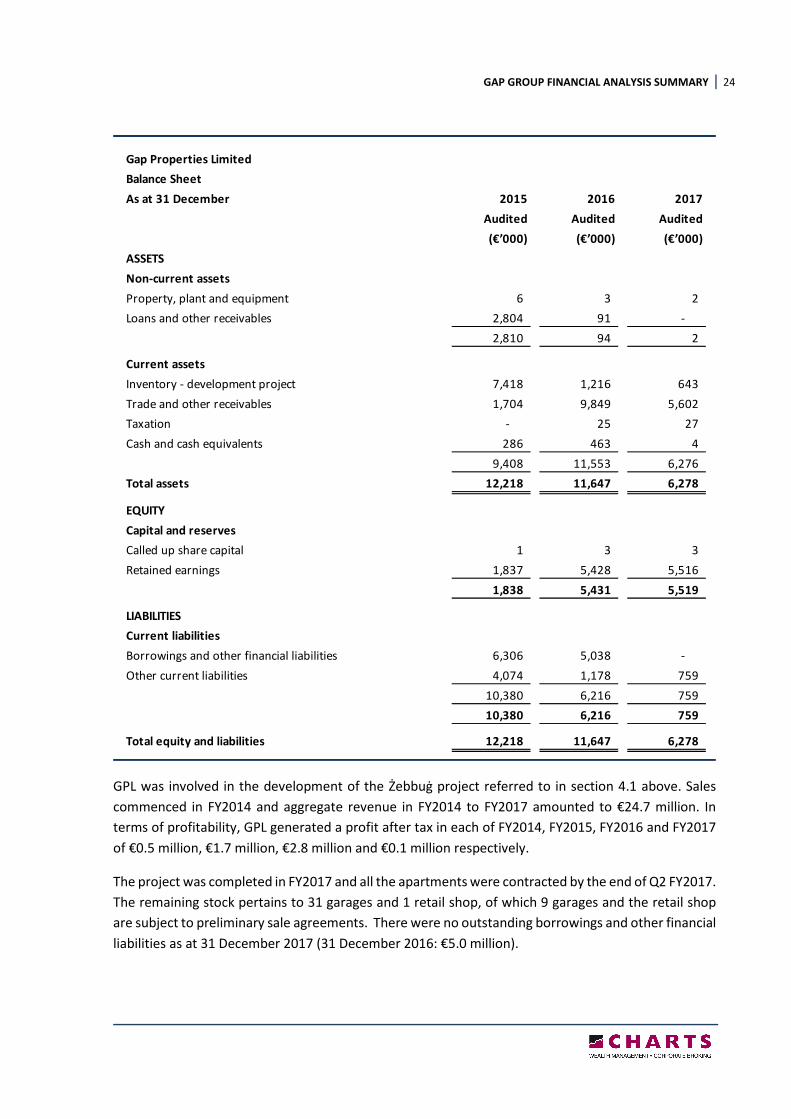
GPL was involved in the development of the Żebbuġ project referred to in section 4.1 above. Sales
commenced in FY2014 and aggregate revenue in FY2014 to FY2017 amounted to €24.7 million. In
terms of profitability, GPL generated a profit after tax in each of FY2014, FY2015, FY2016 and FY2017
of €0.5 million, €1.7 million, €2.8 million and €0.1 million respectively.
The project was completed in FY2017 and all the apartments were contracted by the end of Q2 FY2017.
The remaining stock pertains to 31 garages and 1 retail shop, of which 9 garages and the retail shop
are subject to preliminary sale agreements. There were no outstanding borrowings and other financial
liabilities as at 31 December 2017 (31 December 2016: €5.0 million).
Gap Properties Limited
Balance Sheet
As at 31 December 2015 2016 2017
Audited Audited Audited
(€’000) (€’000) (€’000)
ASSETS
Non-current assets
Property, plant and equipment 6 3 2
Loans and other receivables 2,804 91 -
2,810 94 2
Current assets
Inventory - development project 7,418 1,216 643
Trade and other receivables 1,704 9,849 5,602
Taxation - 25 27
Cash and cash equivalents 286 463 4
9,408 11,553 6,276
Total assets 12,218 11,647 6,278
EQUITY
Capital and reserves
Called up share capital 1 3 3
Retained earnings 1,837 5,428 5,516
1,838 5,431 5,519
LIABILITIES
Current liabilities
Borrowings and other financial liabilities 6,306 5,038 -
Other current liabilities 4,074 1,178 759
10,380 6,216 759
10,380 6,216 759
Total equity and liabilities 12,218 11,647 6,278
GAP GROUP FINANCIAL ANALYSIS SUMMARY 25
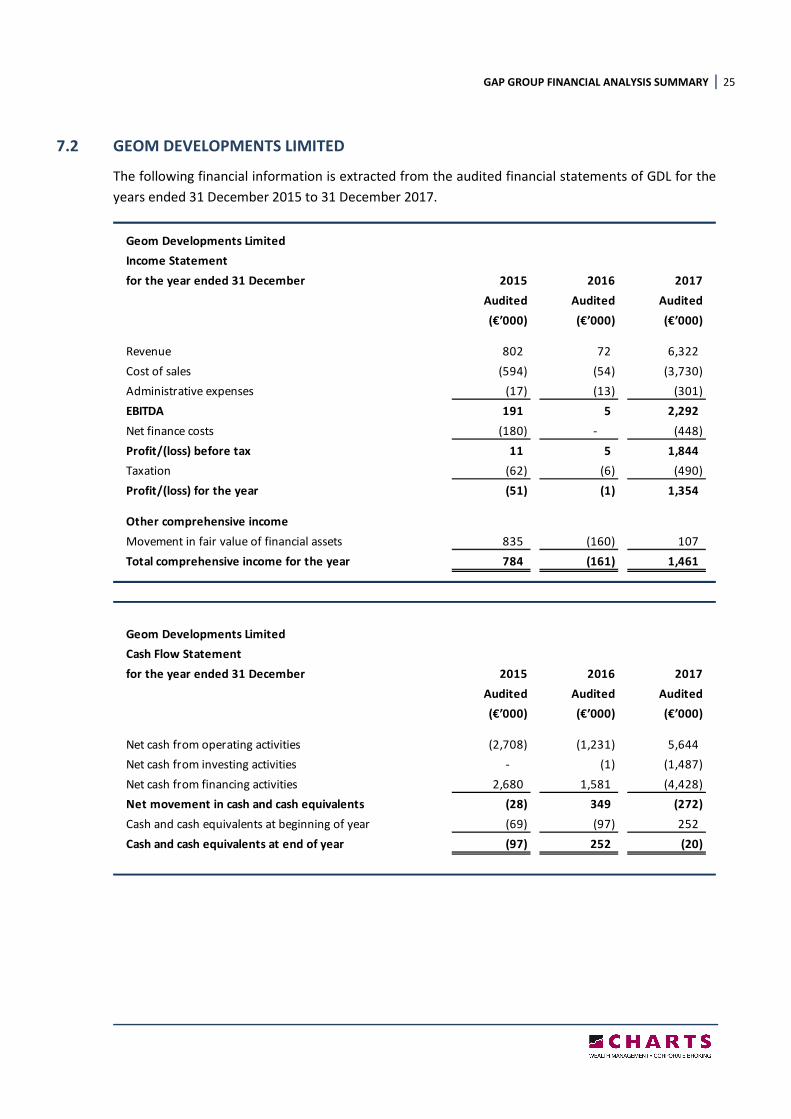
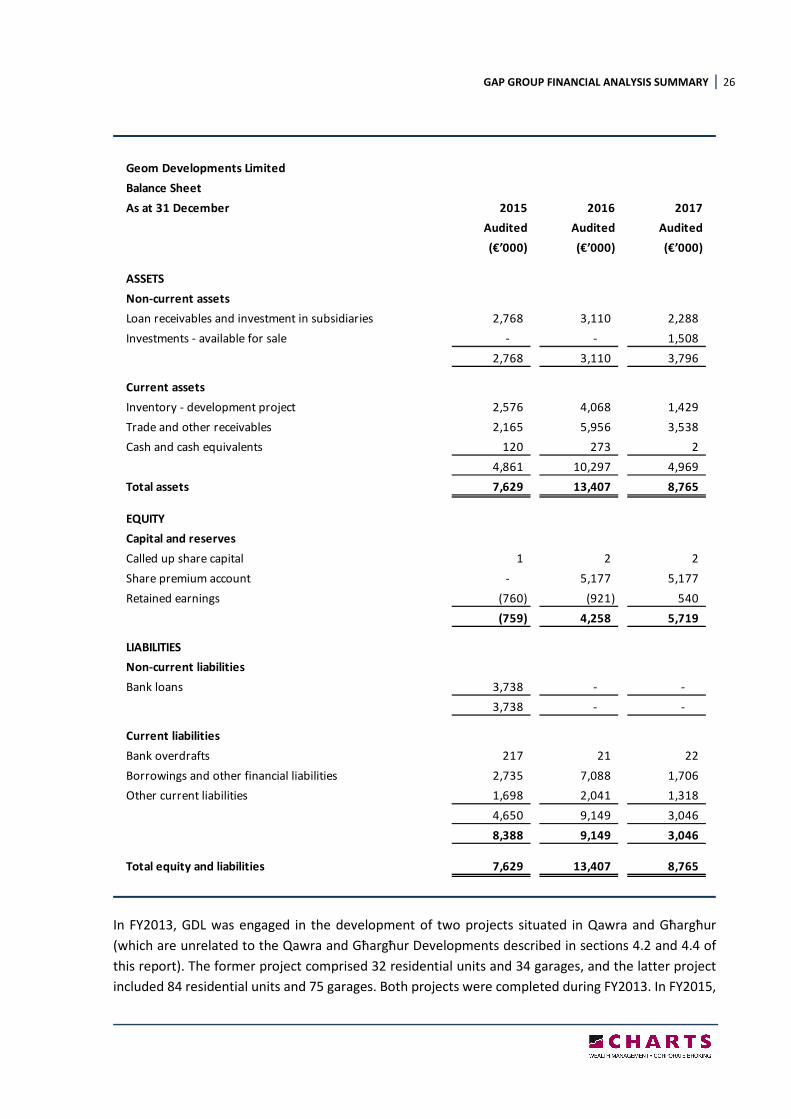
7.2 GEOM DEVELOPMENTS LIMITED
The following financial information is extracted from the audited financial statements of GDL for the
years ended 31 December 2015 to 31 December 2017.
Geom Developments Limited
Income Statement
for the year ended 31 December 2015 2016 2017
Audited Audited Audited
(€’000) (€’000) (€’000)
Revenue 802 72 6,322
Cost of sales (594) (54) (3,730)
Administrative expenses (17) (13) (301)
EBITDA 191 5 2,292
Net finance costs (180) - (448)
Profit/(loss) before tax 11 5 1,844
Taxation (62) (6) (490)
Profit/(loss) for the year (51) (1) 1,354
Other comprehensive income
Movement in fair value of financial assets 835 (160) 107
Total comprehensive income for the year 784 (161) 1,461
Geom Developments Limited
Cash Flow Statement
for the year ended 31 December 2015 2016 2017
Audited Audited Audited
(€’000) (€’000) (€’000)
Net cash from operating activities (2,708) (1,231) 5,644
Net cash from investing activities - (1) (1,487)
Net cash from financing activities 2,680 1,581 (4,428)
Net movement in cash and cash equivalents (28) 349 (272)
Cash and cash equivalents at beginning of year (69) (97) 252
Cash and cash equivalents at end of year (97) 252 (20)
GAP GROUP FINANCIAL ANALYSIS SUMMARY 26
In FY2013, GDL was engaged in the development of two projects situated in Qawra and Għargħur
(which are unrelated to the Qawra and Għargħur Developments described in sections 4.2 and 4.4 of
this report). The former project comprised 32 residential units and 34 garages, and the latter project
included 84 residential units and 75 garages. Both projects were completed during FY2013. In FY2015,
Geom Developments Limited
Balance Sheet
As at 31 December 2015 2016 2017
Audited Audited Audited
(€’000) (€’000) (€’000)
ASSETS
Non-current assets
Loan receivables and investment in subsidiaries 2,768 3,110 2,288
Investments - available for sale - - 1,508
2,768 3,110 3,796
Current assets
Inventory - development project 2,576 4,068 1,429
Trade and other receivables 2,165 5,956 3,538
Cash and cash equivalents 120 273 2
4,861 10,297 4,969
Total assets 7,629 13,407 8,765
EQUITY
Capital and reserves
Called up share capital 1 2 2
Share premium account - 5,177 5,177
Retained earnings (760) (921) 540
(759) 4,258 5,719
LIABILITIES
Non-current liabilities
Bank loans 3,738 - -
3,738 - -
Current liabilities
Bank overdrafts 217 21 22
Borrowings and other financial liabilities 2,735 7,088 1,706
Other current liabilities 1,698 2,041 1,318
4,650 9,149 3,046
8,388 9,149 3,046
Total equity and liabilities 7,629 13,407 8,765
GAP GROUP FINANCIAL ANALYSIS SUMMARY 27
development on the Qawra Development (which is co-owned by GDL and GHL) was initiated. This
Project is described in section 4.2 above.
Total revenue generated by GDL in FY2014 and FY2015 amounted to €5.1 million (in aggregate), and
principally related to the disposal of residential units and garages in the above-mentioned Qawra and
Għargħur projects. By the end of 2015, practically all units of these two projects were sold.
GDL generated a profit after tax in FY2014 of €0.6 million, but incurred a loss of €51,000 in FY2015 and
€1,000 in FY2016.
By the end of FY2017, the Qawra Development was almost fully completed, and a number of units
were subject to the final deeds of sale. 51 apartments and 29 garages were contracted during 2017
which amounts to 82% and 50% of the total available units, respectively. All waiver funds were
deposited with the Security Trustee in line with the terms of the Prospectus. The remaining apartments
are all subject to preliminary agreements, whilst 55% of the remaining garages are committed. During
FY2017, GDL generated a profit after tax of €1.4 million on revenues of €6.3 million.
As at 31 December 2017, stock amounted to €1.4 million (31 December 2016: €4.1 million), primarily
consisting of the land cost and construction works relating to Blocks A, B and C of the Qawra
Development. Outstanding borrowings and other financial liabilities as at 31 December 2017
amounted to €1.7 million (31 December 2016: €7.1 million).
GAP GROUP FINANCIAL ANALYSIS SUMMARY 28
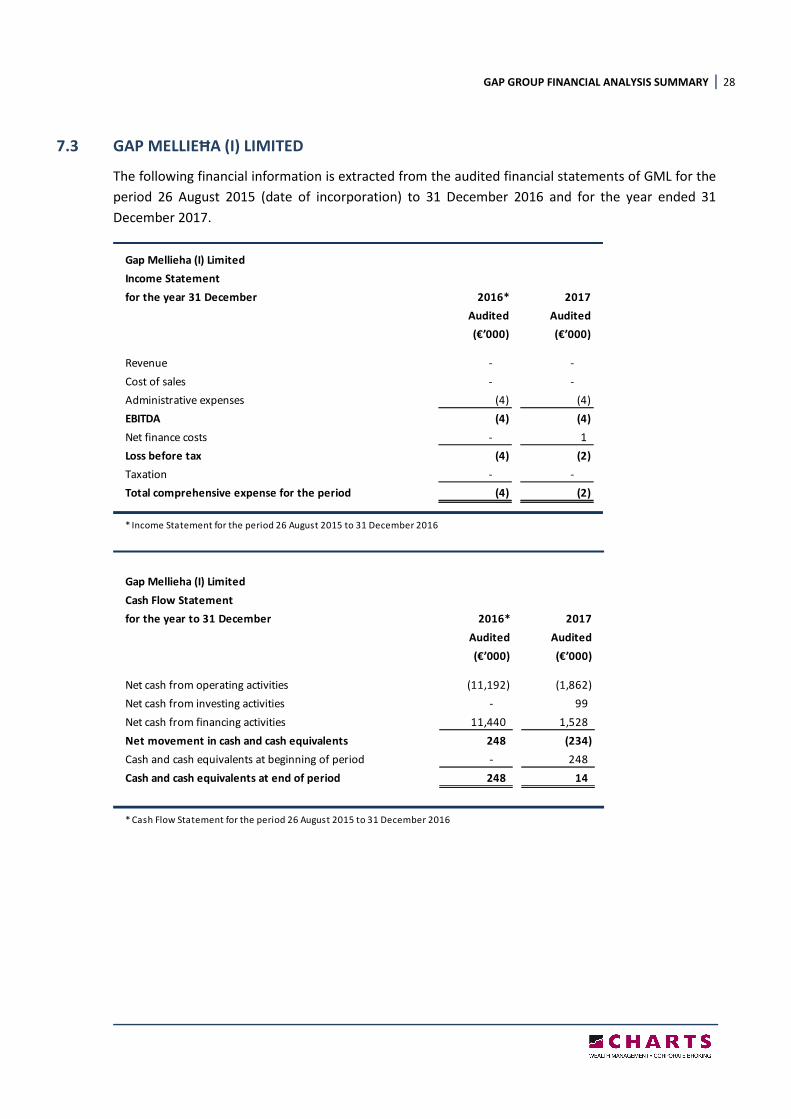
7.3 GAP MELLIEĦA (I) LIMITED
The following financial information is extracted from the audited financial statements of GML for the
period 26 August 2015 (date of incorporation) to 31 December 2016 and for the year ended 31
December 2017.
Gap Mellieha (I) Limited
Income Statement
for the year 31 December 2016* 2017
Audited Audited
(€’000) (€’000)
Revenue - -
Cost of sales - -
Administrative expenses (4) (4)
EBITDA (4) (4)
Net finance costs - 1
Loss before tax (4) (2)
Taxation - -
Total comprehensive expense for the period (4) (2)
* Income Statement for the period 26 August 2015 to 31 December 2016
Gap Mellieha (I) Limited
Cash Flow Statement
for the year to 31 December 2016* 2017
Audited Audited
(€’000) (€’000)
Net cash from operating activities (11,192) (1,862)
Net cash from investing activities - 99
Net cash from financing activities 11,440 1,528
Net movement in cash and cash equivalents 248 (234)
Cash and cash equivalents at beginning of period - 248
Cash and cash equivalents at end of period 248 14
* Cash Flow Statement for the period 26 August 2015 to 31 December 2016
GAP GROUP FINANCIAL ANALYSIS SUMMARY 29
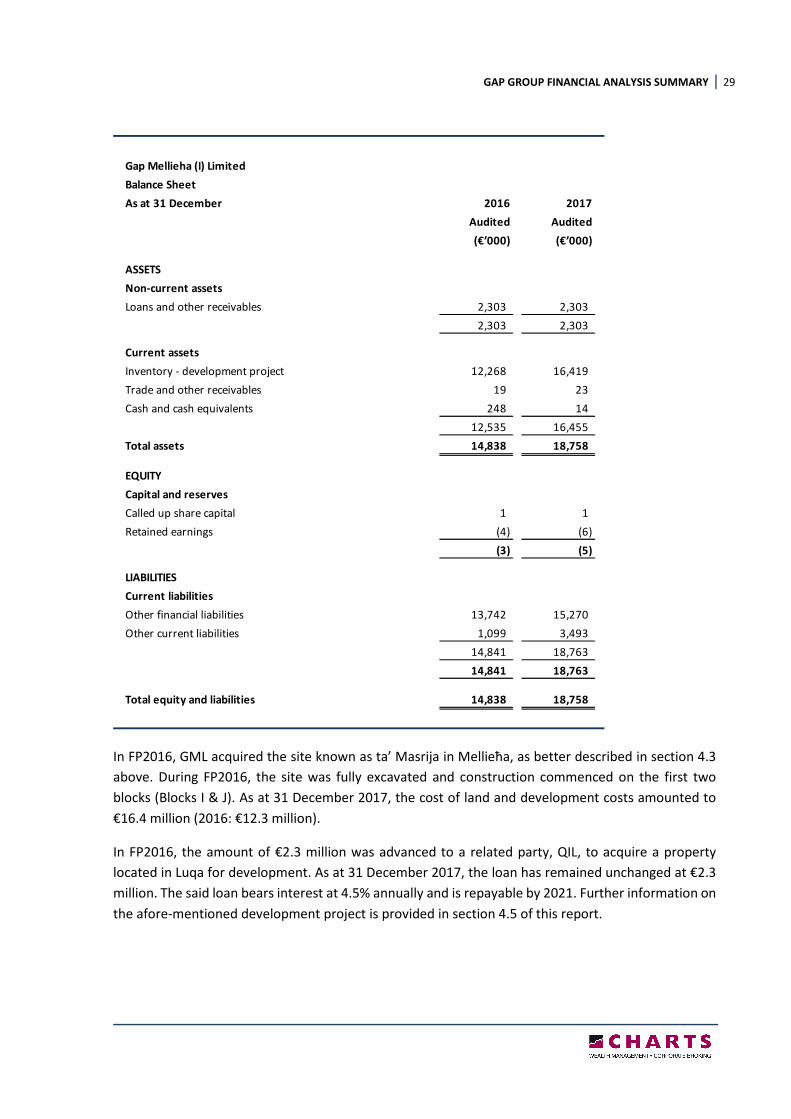
In FP2016, GML acquired the site known as ta’ Masrija in Mellieħa, as better described in section 4.3
above. During FP2016, the site was fully excavated and construction commenced on the first two
blocks (Blocks I & J). As at 31 December 2017, the cost of land and development costs amounted to
€16.4 million (2016: €12.3 million).
In FP2016, the amount of €2.3 million was advanced to a related party, QIL, to acquire a property
located in Luqa for development. As at 31 December 2017, the loan has remained unchanged at €2.3
million. The said loan bears interest at 4.5% annually and is repayable by 2021. Further information on
the afore-mentioned development project is provided in section 4.5 of this report.
Gap Mellieha (I) Limited
Balance Sheet
As at 31 December 2016 2017
Audited Audited
(€’000) (€’000)
ASSETS
Non-current assets
Loans and other receivables 2,303 2,303
2,303 2,303
Current assets
Inventory - development project 12,268 16,419
Trade and other receivables 19 23
Cash and cash equivalents 248 14
12,535 16,455
Total assets 14,838 18,758
EQUITY
Capital and reserves
Called up share capital 1 1
Retained earnings (4) (6)
(3) (5)
LIABILITIES
Current liabilities
Other financial liabilities 13,742 15,270
Other current liabilities 1,099 3,493
14,841 18,763
14,841 18,763
Total equity and liabilities 14,838 18,758

GAP GROUP FINANCIAL ANALYSIS SUMMARY 30
7.4 GAP GĦARGĦUR LIMITED
The following financial information is extracted from the audited financial statements of GGL for the
period 26 August 2015 (date of incorporation) to 31 December 2016 and for the year ended 31
December 2017.
Gap Gharghur Limited
Income Statement
for the year 31 December 2016* 2017
Audited Audited
(€’000) (€’000)
Revenue - -
Cost of sales - -
Administrative expenses (2) (3)
EBITDA (2) (3)
Net finance costs - -
Loss before tax (2) (3)
Taxation - -
Total comprehensive expense for the period (2) (3)
* Income Statement for the period 26 August 2015 to 31 December 2016
Gap Gharghur Limited
Cash Flow Statement
for the year to 31 December 2016* 2017
Audited Audited
(€’000) (€’000)
Net cash from operating activities (2,177) (135)
Net cash from investing activities - -
Net cash from financing activities 2,279 52
Net movement in cash and cash equivalents 102 (83)
Cash and cash equivalents at beginning of period - 102
Cash and cash equivalents at end of period 102 19
* Cash Flow Statement for the period 26 August 2015 to 31 December 2016
GAP GROUP FINANCIAL ANALYSIS SUMMARY 31
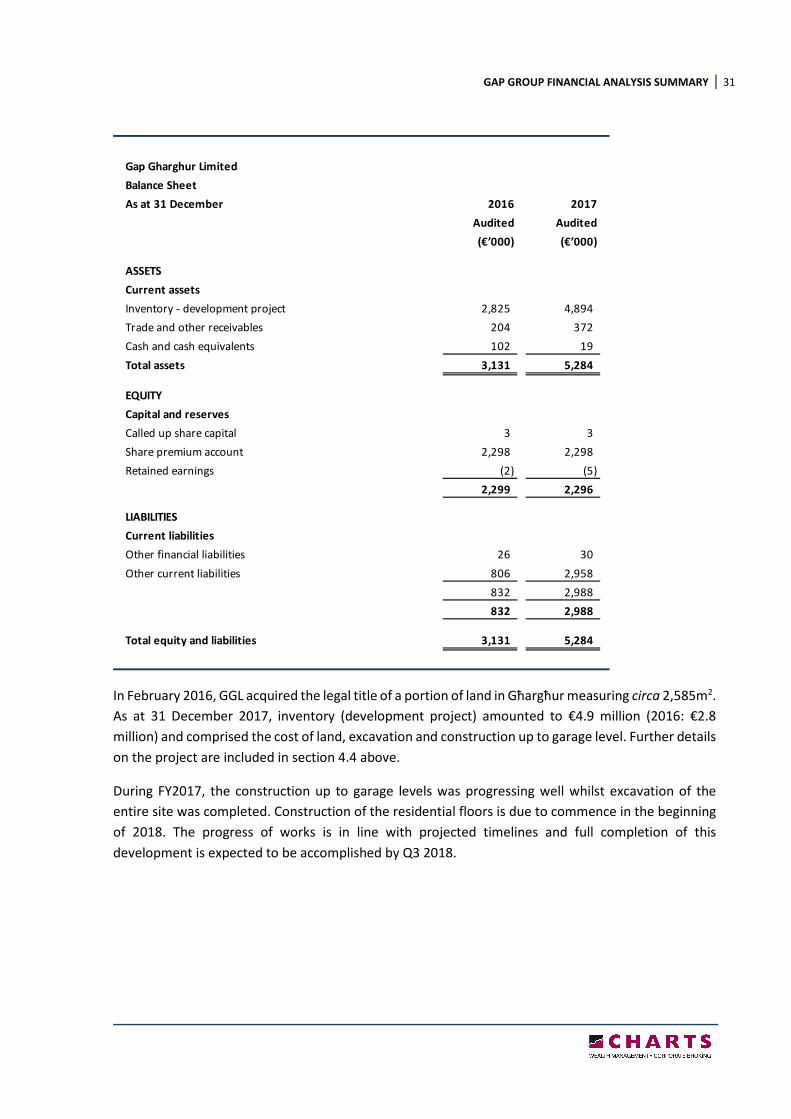
In February 2016, GGL acquired the legal title of a portion of land in Għargħur measuring circa 2,585m2.
As at 31 December 2017, inventory (development project) amounted to €4.9 million (2016: €2.8
million) and comprised the cost of land, excavation and construction up to garage level. Further details
on the project are included in section 4.4 above.
During FY2017, the construction up to garage levels was progressing well whilst excavation of the
entire site was completed. Construction of the residential floors is due to commence in the beginning
of 2018. The progress of works is in line with projected timelines and full completion of this
development is expected to be accomplished by Q3 2018.
Gap Gharghur Limited
Balance Sheet
As at 31 December 2016 2017
Audited Audited
(€’000) (€’000)
ASSETS
Current assets
Inventory - development project 2,825 4,894
Trade and other receivables 204 372
Cash and cash equivalents 102 19
Total assets 3,131 5,284
EQUITY
Capital and reserves
Called up share capital 3 3
Share premium account 2,298 2,298
Retained earnings (2) (5)
2,299 2,296
LIABILITIES
Current liabilities
Other financial liabilities 26 30
Other current liabilities 806 2,958
832 2,988
832 2,988
Total equity and liabilities 3,131 5,284
GAP GROUP FINANCIAL ANALYSIS SUMMARY 32
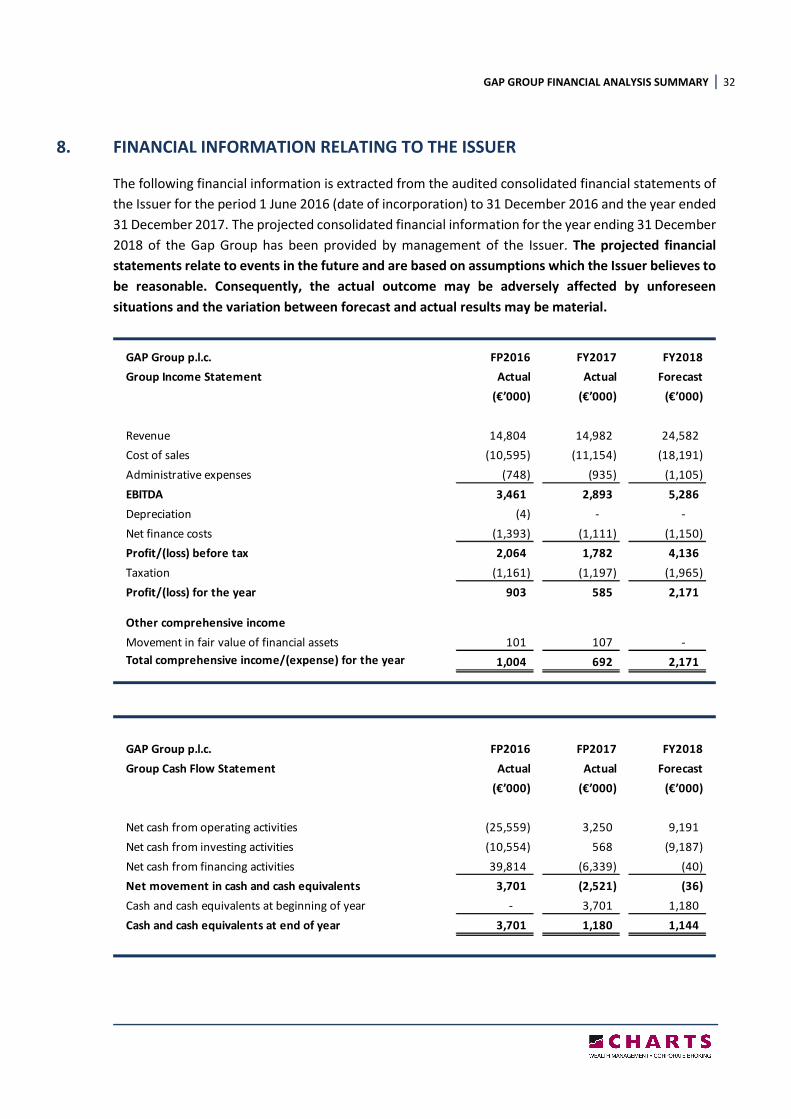
8. FINANCIAL INFORMATION RELATING TO THE ISSUER
The following financial information is extracted from the audited consolidated financial statements of
the Issuer for the period 1 June 2016 (date of incorporation) to 31 December 2016 and the year ended
31 December 2017. The projected consolidated financial information for the year ending 31 December
2018 of the Gap Group has been provided by management of the Issuer. The projected financial
statements relate to events in the future and are based on assumptions which the Issuer believes to
be reasonable. Consequently, the actual outcome may be adversely affected by unforeseen
situations and the variation between forecast and actual results may be material.
GAP Group p.l.c. FP2016 FY2017 FY2018
Group Income Statement Actual Actual Forecast
(€’000) (€’000) (€’000)
Revenue 14,804 14,982 24,582
Cost of sales (10,595) (11,154) (18,191)
Administrative expenses (748) (935) (1,105)
EBITDA 3,461 2,893 5,286
Depreciation (4) - -
Net finance costs (1,393) (1,111) (1,150)
Profit/(loss) before tax 2,064 1,782 4,136
Taxation (1,161) (1,197) (1,965)
Profit/(loss) for the year 903 585 2,171
Other comprehensive income
Movement in fair value of financial assets 101 107 -
Total comprehensive income/(expense) for the year 1,004 692 2,171
GAP Group p.l.c. FP2016 FP2017 FY2018
Group Cash Flow Statement Actual Actual Forecast
(€’000) (€’000) (€’000)
Net cash from operating activities (25,559) 3,250 9,191
Net cash from investing activities (10,554) 568 (9,187)
Net cash from financing activities 39,814 (6,339) (40)
Net movement in cash and cash equivalents 3,701 (2,521) (36)
Cash and cash equivalents at beginning of year - 3,701 1,180
Cash and cash equivalents at end of year 3,701 1,180 1,144
GAP GROUP FINANCIAL ANALYSIS SUMMARY 33
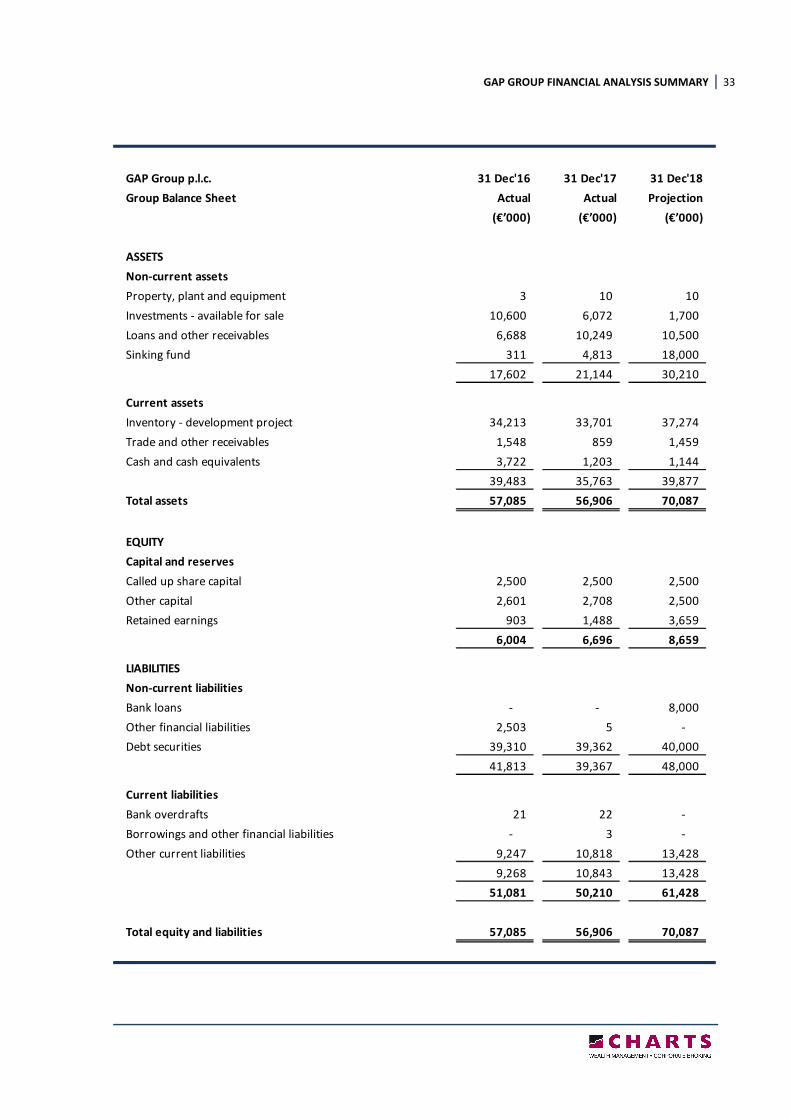
GAP Group p.l.c. 31 Dec'16 31 Dec'17 31 Dec'18
Group Balance Sheet Actual Actual Projection
(€’000) (€’000) (€’000)
ASSETS
Non-current assets
Property, plant and equipment 3 10 10
Investments - available for sale 10,600 6,072 1,700
Loans and other receivables 6,688 10,249 10,500
Sinking fund 311 4,813 18,000
17,602 21,144 30,210
Current assets
Inventory - development project 34,213 33,701 37,274
Trade and other receivables 1,548 859 1,459
Cash and cash equivalents 3,722 1,203 1,144
39,483 35,763 39,877
Total assets 57,085 56,906 70,087
EQUITY
Capital and reserves
Called up share capital 2,500 2,500 2,500
Other capital 2,601 2,708 2,500
Retained earnings 903 1,488 3,659
6,004 6,696 8,659
LIABILITIES
Non-current liabilities
Bank loans - - 8,000
Other financial liabilities 2,503 5 -
Debt securities 39,310 39,362 40,000
41,813 39,367 48,000
Current liabilities
Bank overdrafts 21 22 -
Borrowings and other financial liabilities - 3 -
Other current liabilities 9,247 10,818 13,428
9,268 10,843 13,428
51,081 50,210 61,428
Total equity and liabilities 57,085 56,906 70,087
GAP GROUP FINANCIAL ANALYSIS SUMMARY 34
During the financial period 1 June 2016 to 31 December 2016, the Gap Group generated revenue
amounting to €14.8 million, primarily from sales of the remaining units at Żebbuġ and Manikata.
EBITDA for the period amounted to €3.5 million and after accounting for net finance costs of €1.4
million and taxation of €1.2 million, the Group reported a profit after tax of €0.9 million. In the period
under review, the Gap Group registered total comprehensive income of €1.0 million after accounting
for a gain of €0.1 million in fair value of financial assets.
In October 2016, the Issuer raised €40 million through the issuance of secured bonds to the public. The
amount of €25,759,748 out of net bond issue proceeds were utilised in terms of the prospectus dated
16 September 2016 as follows:
• The amount of €9,649,563 was used to finance the acquisition of the site in Mellieħa and
related contract expenses;
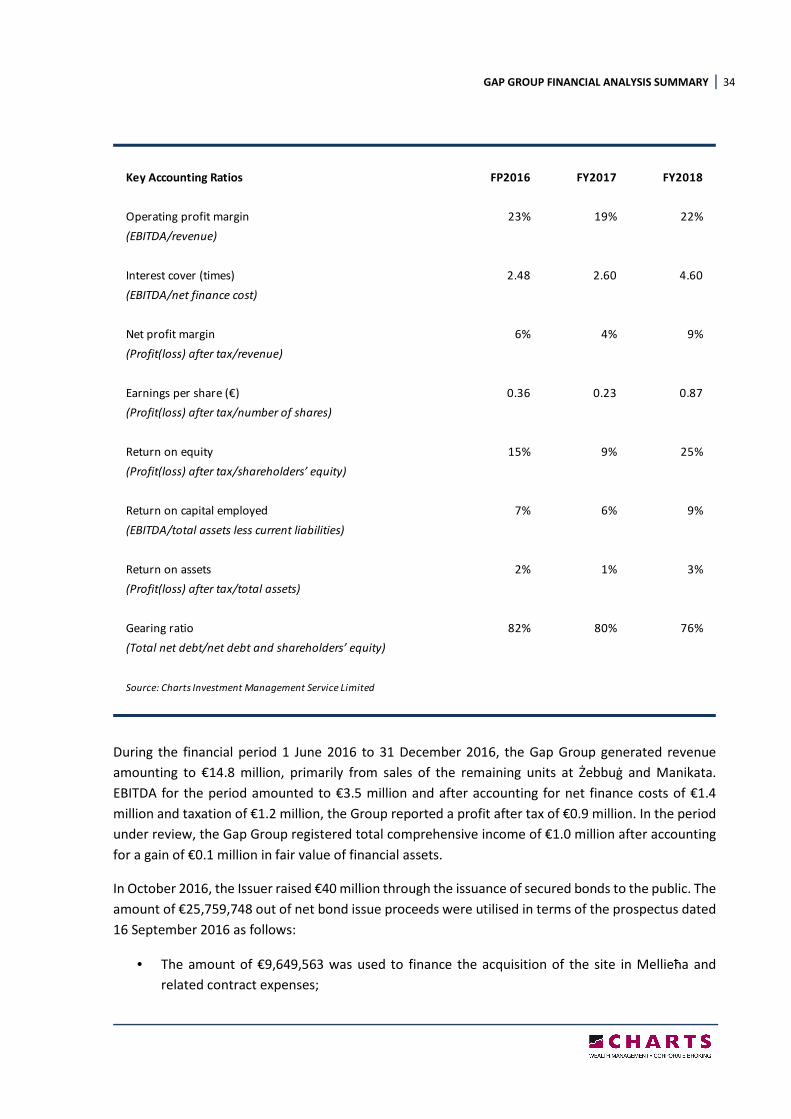
Key Accounting Ratios FP2016 FY2017 FY2018
Operating profit margin 23% 19% 22%
(EBITDA/revenue)
Interest cover (times) 2.48 2.60 4.60
(EBITDA/net finance cost)
Net profit margin 6% 4% 9%
(Profit(loss) after tax/revenue)
Earnings per share (€) 0.36 0.23 0.87
(Profit(loss) after tax/number of shares)
Return on equity 15% 9% 25%
(Profit(loss) after tax/shareholders’ equity)
Return on capital employed 7% 6% 9%
(EBITDA/total assets less current liabilities)
Return on assets 2% 1% 3%
(Profit(loss) after tax/total assets)
Gearing ratio 82% 80% 76%
(Total net debt/net debt and shareholders’ equity)
Source: Charts Investment Management Service Limited
GAP GROUP FINANCIAL ANALYSIS SUMMARY 35
• The aggregate amount of €13,110,185 was applied in part settlement and discharge of the
acquisition consideration from Gap Group Investments (III) Limited of the entire share capital
of GDL and all the ordinary ‘A’ shares of GHL; and
• The amount of €3,000,000 was used to refinance a bank loan which was made available by
Mediterranean Corporate Bank Limited to GGF.
The remaining balance of net bond issue proceeds amounting to €13,525,119 is being applied towards
the costs of construction and development of the New Developments (other than in respect of Blocks
D, E, F and G that form part of the Qawra Development).
The balance sheet as at 31 December 2016 reflects the re-organisation of the Gap Group undertaken
during the year, whereby the Issuer acquired the issued share capital of GML, GGL, GDL, GHL. As a
result of such acquisitions, the Issuer indirectly obtained ownership of the New Developments.
Total assets of the Gap Group as at 31 December 2016 amounted to €57.1 million and primarily
included stock representing real estate property held for resale (€34.2 million), and cash and liquid
assets amounting to €14.3 million. Furthermore, loans and other receivables totalling €6.7 million
includes an amount of €2.3 million which was advanced to a related party (QIL) for the purpose to
acquire a property in Luqa for development.
Other than equity (€6.0 million), the Gap Group is financed through debt securities (€39.3 million) and
cumulative preference shares held by a third party in GHL amounting to €2.5 million. Other current
liabilities comprise an amount of €2.8 million being deposits received from customers pursuant to
promise of sale agreements.
During FY2017, the Gap Group generated revenue amounting to €15.0 million, an increase of €0.2
million (+1.2%) compared to FP2016, primarily from sales of the remaining units at Żebbuġ and the
Qawra Developments. EBITDA for the period amounted to €2.9 million, a decrease of €0.6 million (-
16.4%) compared to FP2016. After accounting for net finance costs of €1.1 million and taxation of €1.2
million, the Group reported a profit after tax of €0.6 million. In FY2017, the Gap Group registered total
comprehensive income of €0.7 million after accounting for a gain of €0.1 million in fair value of
financial assets.
Total assets of the Gap Group as at 31 December 2017 amounted to €56.9 million and primarily
included stock representing real estate property held for resale (€33.7 million), and cash and liquid
assets amounting to €7.3 million. Furthermore, loans and other receivables totalling €10.2 million
includes an amount of €2.3 million which was advanced to a related party (QIL) for the purpose to
acquire a property in Luqa for development.
Other than equity (€6.7 million), the Gap Group is financed through debt securities (€39.4 million) with
the cumulative preference shares held GHL amounting to €2.5 million being paid during FY2017.
During the projected financial year (FY2018), the Gap Group will be principally involved in the
construction and development of the following Projects:
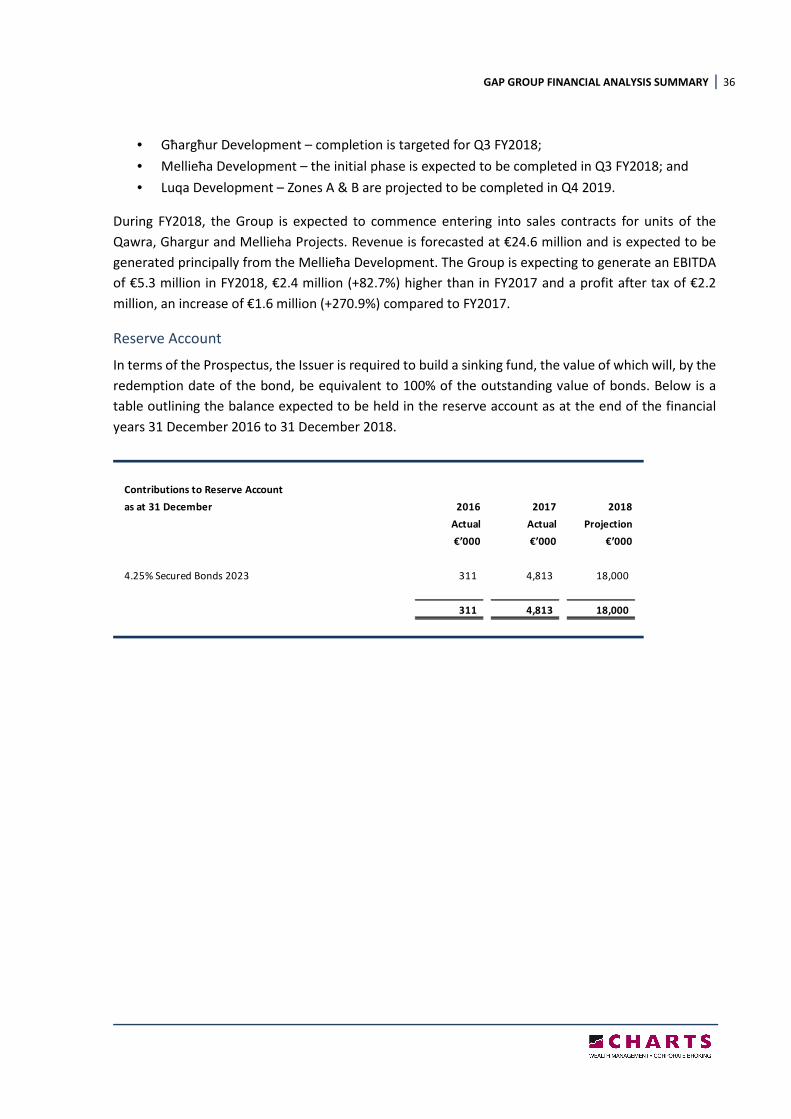
GAP GROUP FINANCIAL ANALYSIS SUMMARY 36
• Għargħur Development – completion is targeted for Q3 FY2018;
• Mellieħa Development – the initial phase is expected to be completed in Q3 FY2018; and
• Luqa Development – Zones A & B are projected to be completed in Q4 2019.
During FY2018, the Group is expected to commence entering into sales contracts for units of the
Qawra, Ghargur and Mellieha Projects. Revenue is forecasted at €24.6 million and is expected to be
generated principally from the Mellieħa Development. The Group is expecting to generate an EBITDA
of €5.3 million in FY2018, €2.4 million (+82.7%) higher than in FY2017 and a profit after tax of €2.2
million, an increase of €1.6 million (+270.9%) compared to FY2017.
Reserve Account
In terms of the Prospectus, the Issuer is required to build a sinking fund, the value of which will, by the
redemption date of the bond, be equivalent to 100% of the outstanding value of bonds. Below is a
table outlining the balance expected to be held in the reserve account as at the end of the financial
years 31 December 2016 to 31 December 2018.
Contributions to Reserve Account
as at 31 December 2016 2017 2018
Actual Actual Projection
€’000 €’000 €’000
4.25% Secured Bonds 2023 311 4,813 18,000
311 4,813 18,000
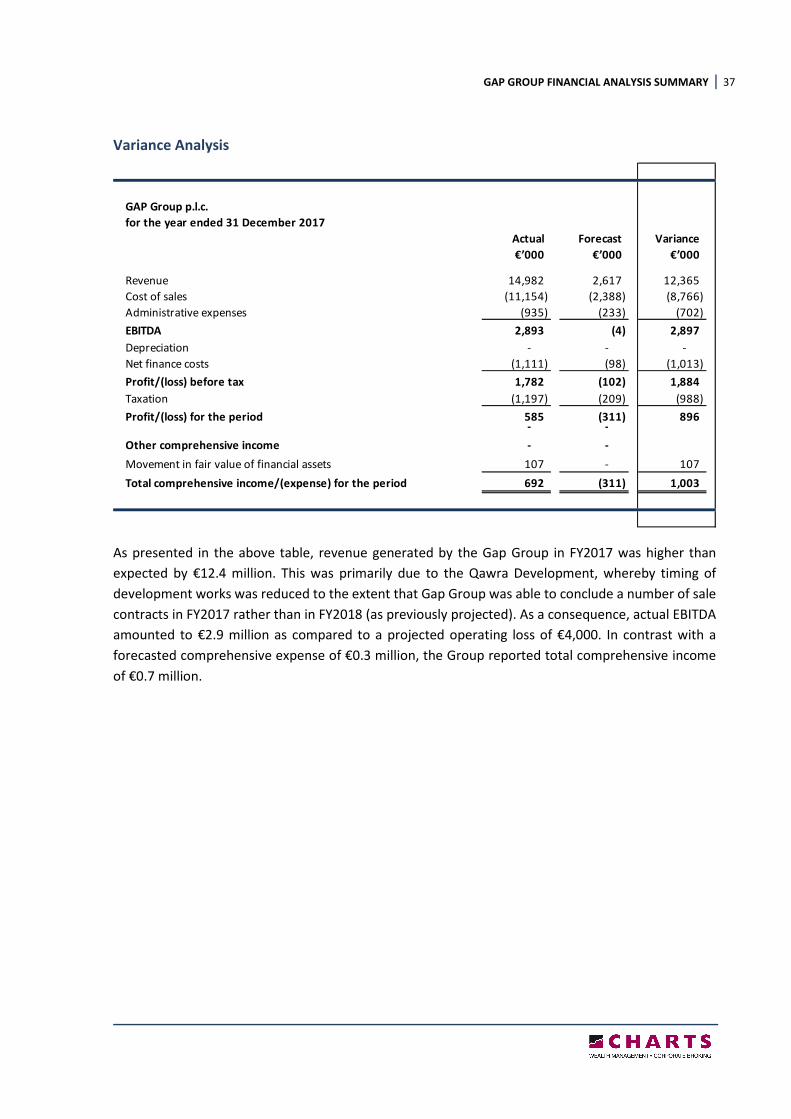
GAP GROUP FINANCIAL ANALYSIS SUMMARY 37
Variance Analysis
As presented in the above table, revenue generated by the Gap Group in FY2017 was higher than
expected by €12.4 million. This was primarily due to the Qawra Development, whereby timing of
development works was reduced to the extent that Gap Group was able to conclude a number of sale
contracts in FY2017 rather than in FY2018 (as previously projected). As a consequence, actual EBITDA
amounted to €2.9 million as compared to a projected operating loss of €4,000. In contrast with a
forecasted comprehensive expense of €0.3 million, the Group reported total comprehensive income
of €0.7 million.
GAP Group p.l.c.
for the year ended 31 December 2017
Actual Forecast Variance
€’000 €’000 €’000
Revenue 14,982 2,617 12,365
Cost of sales (11,154) (2,388) (8,766)
Administrative expenses (935) (233) (702)
EBITDA 2,893 (4) 2,897
Depreciation - - -
Net finance costs (1,111) (98) (1,013)
Profit/(loss) before tax 1,782 (102) 1,884
Taxation (1,197) (209) (988)
Profit/(loss) for the period 585 (311) 896 - -
Other comprehensive income - -
Movement in fair value of financial assets 107 - 107
Total comprehensive income/(expense) for the period 692 (311) 1,003
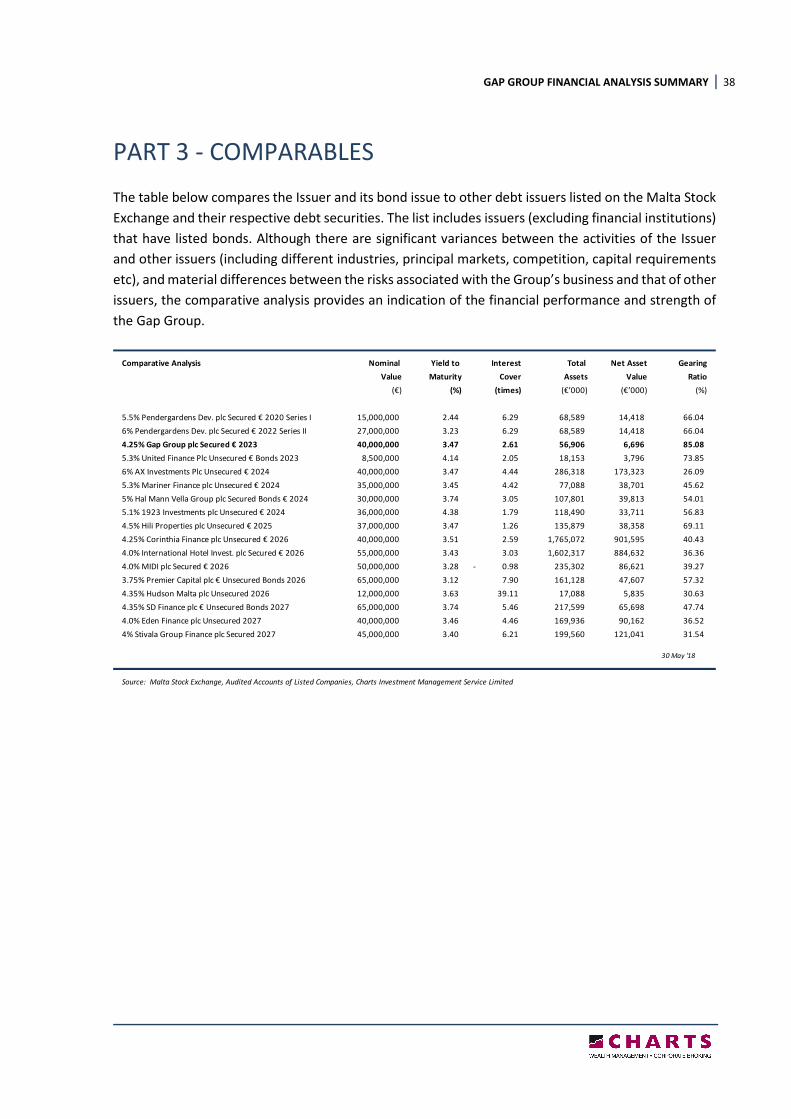
GAP GROUP FINANCIAL ANALYSIS SUMMARY 38
PART 3 - COMPARABLES
The table below compares the Issuer and its bond issue to other debt issuers listed on the Malta Stock
Exchange and their respective debt securities. The list includes issuers (excluding financial institutions)
that have listed bonds. Although there are significant variances between the activities of the Issuer
and other issuers (including different industries, principal markets, competition, capital requirements
etc), and material differences between the risks associated with the Group’s business and that of other
issuers, the comparative analysis provides an indication of the financial performance and strength of
the Gap Group.
Comparative Analysis Nominal Yield to Interest Total Net Asset Gearing
Value Maturity Cover Assets Value Ratio
(€) (%) (times) (€’000) (€’000) (%)
5.5% Pendergardens Dev. plc Secured € 2020 Series I 15,000,000 2.44 6.29 68,589 14,418 66.04
6% Pendergardens Dev. plc Secured € 2022 Series II 27,000,000 3.23 6.29 68,589 14,418 66.04
4.25% Gap Group plc Secured € 2023 40,000,000 3.47 2.61 56,906 6,696 85.08
5.3% United Finance Plc Unsecured € Bonds 2023 8,500,000 4.14 2.05 18,153 3,796 73.85
6% AX Investments Plc Unsecured € 2024 40,000,000 3.47 4.44 286,318 173,323 26.09
5.3% Mariner Finance plc Unsecured € 2024 35,000,000 3.45 4.42 77,088 38,701 45.62
5% Hal Mann Vella Group plc Secured Bonds € 2024 30,000,000 3.74 3.05 107,801 39,813 54.01
5.1% 1923 Investments plc Unsecured € 2024 36,000,000 4.38 1.79 118,490 33,711 56.83
4.5% Hili Properties plc Unsecured € 2025 37,000,000 3.47 1.26 135,879 38,358 69.11
4.25% Corinthia Finance plc Unsecured € 2026 40,000,000 3.51 2.59 1,765,072 901,595 40.43
4.0% International Hotel Invest. plc Secured € 2026 55,000,000 3.43 3.03 1,602,317 884,632 36.36
4.0% MIDI plc Secured € 2026 50,000,000 3.28 0.98- 235,302 86,621 39.27
3.75% Premier Capital plc € Unsecured Bonds 2026 65,000,000 3.12 7.90 161,128 47,607 57.32
4.35% Hudson Malta plc Unsecured 2026 12,000,000 3.63 39.11 17,088 5,835 30.63
4.35% SD Finance plc € Unsecured Bonds 2027 65,000,000 3.74 5.46 217,599 65,698 47.74
4.0% Eden Finance plc Unsecured 2027 40,000,000 3.46 4.46 169,936 90,162 36.52
4% Stivala Group Finance plc Secured 2027 45,000,000 3.40 6.21 199,560 121,041 31.54
Source: Malta Stock Exchange, Audited Accounts of Listed Companies, Charts Investment Management Service Limited
30 May '18
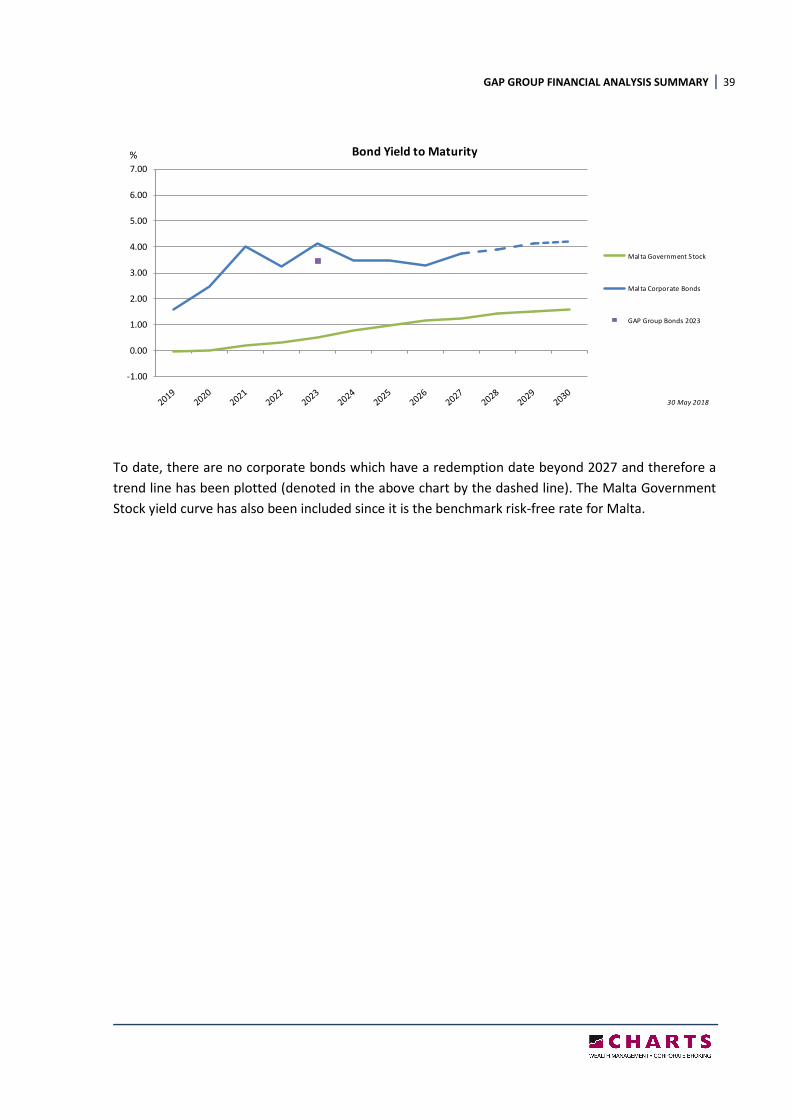
GAP GROUP FINANCIAL ANALYSIS SUMMARY 39
To date, there are no corporate bonds which have a redemption date beyond 2027 and therefore a
trend line has been plotted (denoted in the above chart by the dashed line). The Malta Government
Stock yield curve has also been included since it is the benchmark risk-free rate for Malta.
-1.00
0.00
1.00
2.00
3.00
4.00
5.00
6.00
7.00
Bond Yield to Maturity
Mal ta Government Stock
Mal ta Corporate Bonds
GAP Group Bonds 2023
%
30 May 2018
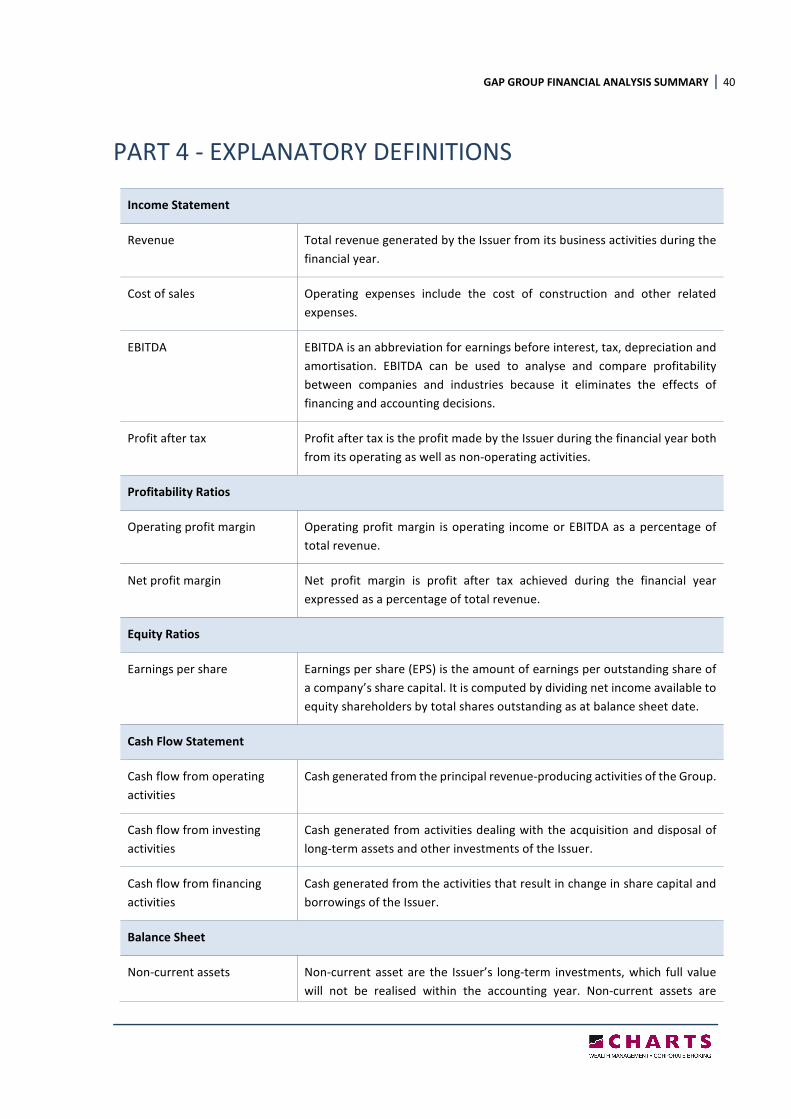
GAP GROUP FINANCIAL ANALYSIS SUMMARY 40
PART 4 - EXPLANATORY DEFINITIONS
Income Statement
Revenue Total revenue generated by the Issuer from its business activities during the
financial year.
Cost of sales Operating expenses include the cost of construction and other related
expenses.
EBITDA EBITDA is an abbreviation for earnings before interest, tax, depreciation and
amortisation. EBITDA can be used to analyse and compare profitability
between companies and industries because it eliminates the effects of
financing and accounting decisions.
Profit after tax Profit after tax is the profit made by the Issuer during the financial year both
from its operating as well as non-operating activities.
Profitability Ratios
Operating profit margin Operating profit margin is operating income or EBITDA as a percentage of
total revenue.
Net profit margin Net profit margin is profit after tax achieved during the financial year
expressed as a percentage of total revenue.
Equity Ratios
Earnings per share Earnings per share (EPS) is the amount of earnings per outstanding share of
a company’s share capital. It is computed by dividing net income available to
equity shareholders by total shares outstanding as at balance sheet date.
Cash Flow Statement
Cash flow from operating
activities
Cash generated from the principal revenue-producing activities of the Group.
Cash flow from investing
activities
Cash generated from activities dealing with the acquisition and disposal of
long-term assets and other investments of the Issuer.
Cash flow from financing
activities
Cash generated from the activities that result in change in share capital and
borrowings of the Issuer.
Balance Sheet
Non-current assets Non-current asset are the Issuer’s long-term investments, which full value
will not be realised within the accounting year. Non-current assets are
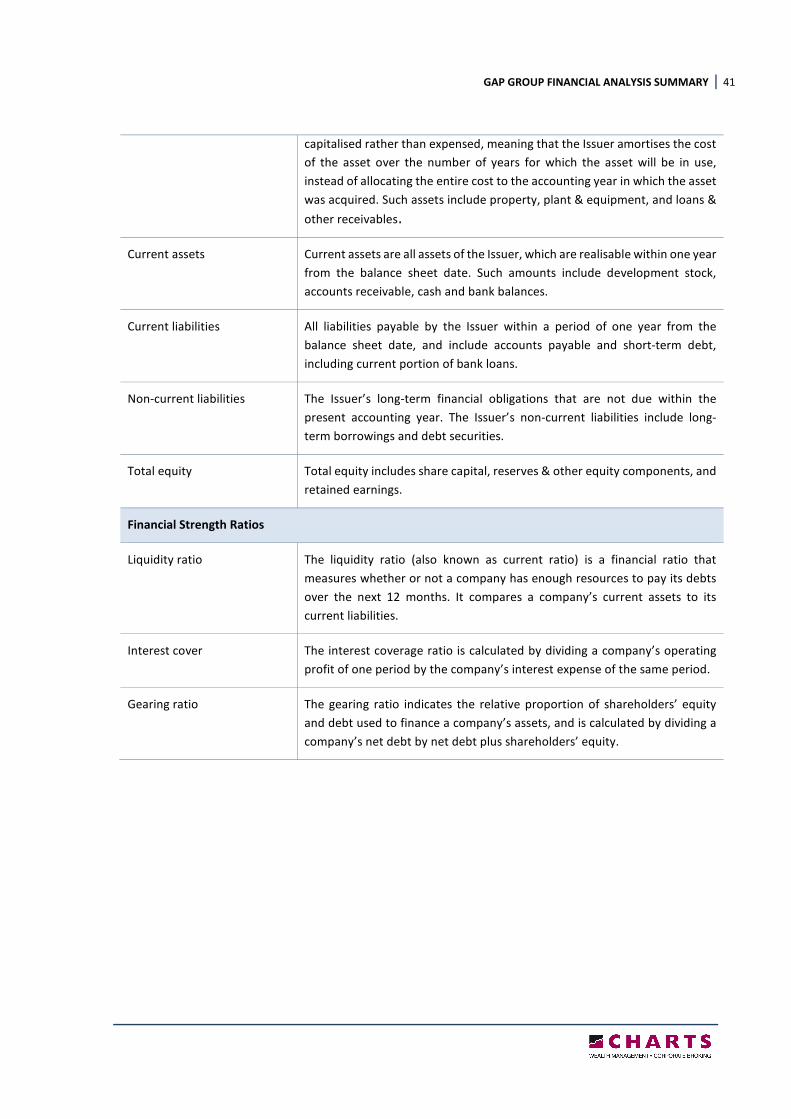
GAP GROUP FINANCIAL ANALYSIS SUMMARY 41
capitalised rather than expensed, meaning that the Issuer amortises the cost
of the asset over the number of years for which the asset will be in use,
instead of allocating the entire cost to the accounting year in which the asset
was acquired. Such assets include property, plant & equipment, and loans &
other receivables.
Current assets Current assets are all assets of the Issuer, which are realisable within one year
from the balance sheet date. Such amounts include development stock,
accounts receivable, cash and bank balances.
Current liabilities All liabilities payable by the Issuer within a period of one year from the
balance sheet date, and include accounts payable and short-term debt,
including current portion of bank loans.
Non-current liabilities The Issuer’s long-term financial obligations that are not due within the
present accounting year. The Issuer’s non-current liabilities include long-
term borrowings and debt securities.
Total equity Total equity includes share capital, reserves & other equity components, and
retained earnings.
Financial Strength Ratios
Liquidity ratio The liquidity ratio (also known as current ratio) is a financial ratio that
measures whether or not a company has enough resources to pay its debts
over the next 12 months. It compares a company’s current assets to its
current liabilities.
Interest cover The interest coverage ratio is calculated by dividing a company’s operating
profit of one period by the company’s interest expense of the same period.
Gearing ratio The gearing ratio indicates the relative proportion of shareholders’ equity
and debt used to finance a company’s assets, and is calculated by dividing a
company’s net debt by net debt plus shareholders’ equity.