Embed Size (px)
Citation preview
FINANCIAL ANALYSISChapter 4
1
Principals Used in this Chapter• Principle 3: Cash Flows Are the Source of Value.• Principle 4: Market Prices Reflect Information.• Principle 5: Individuals Respond to Incentives.
2
Learning Objectives1. Explain what we can learn by analyzing a firm’s
financial statements.2. Use common size financial statements as a tool of
financial analysis.3. Calculate and use a comprehensive set of financial
ratios to evaluate a company’s performance.4. Select an appropriate benchmark for use in performing
a financial ratio analysis.5. Describe the limitations of financial ratio analysis
3
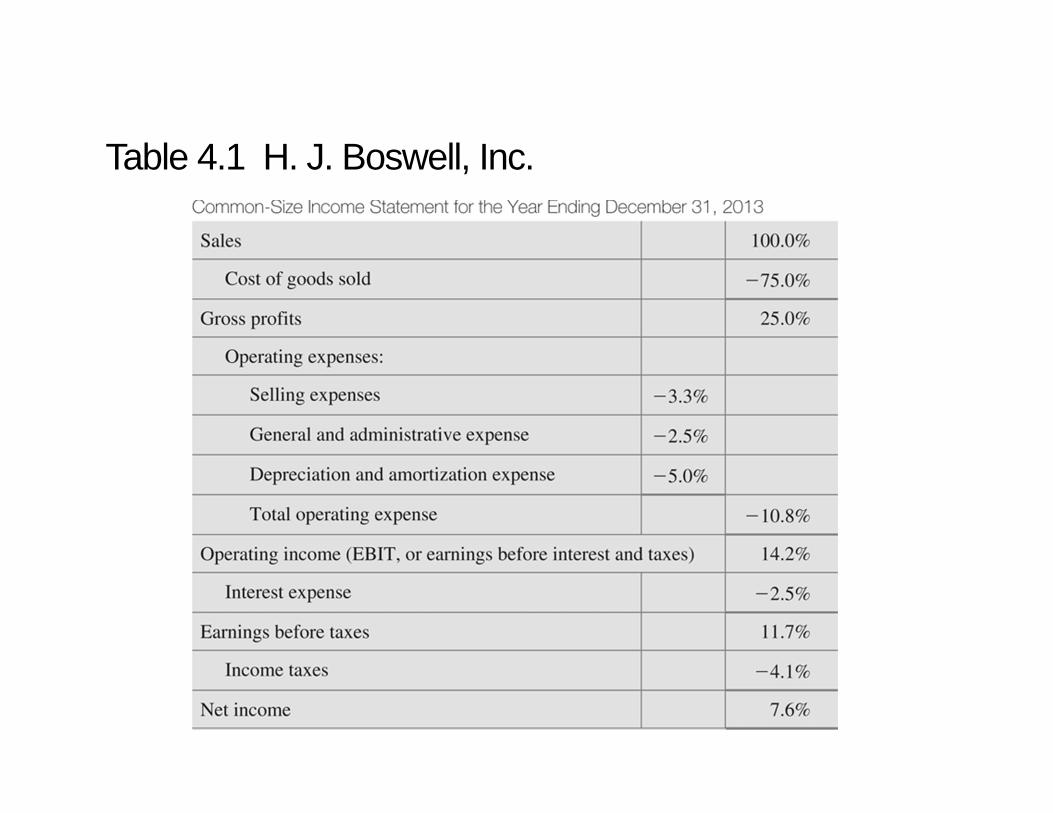
Table 4.1 H. J. Boswell, Inc.
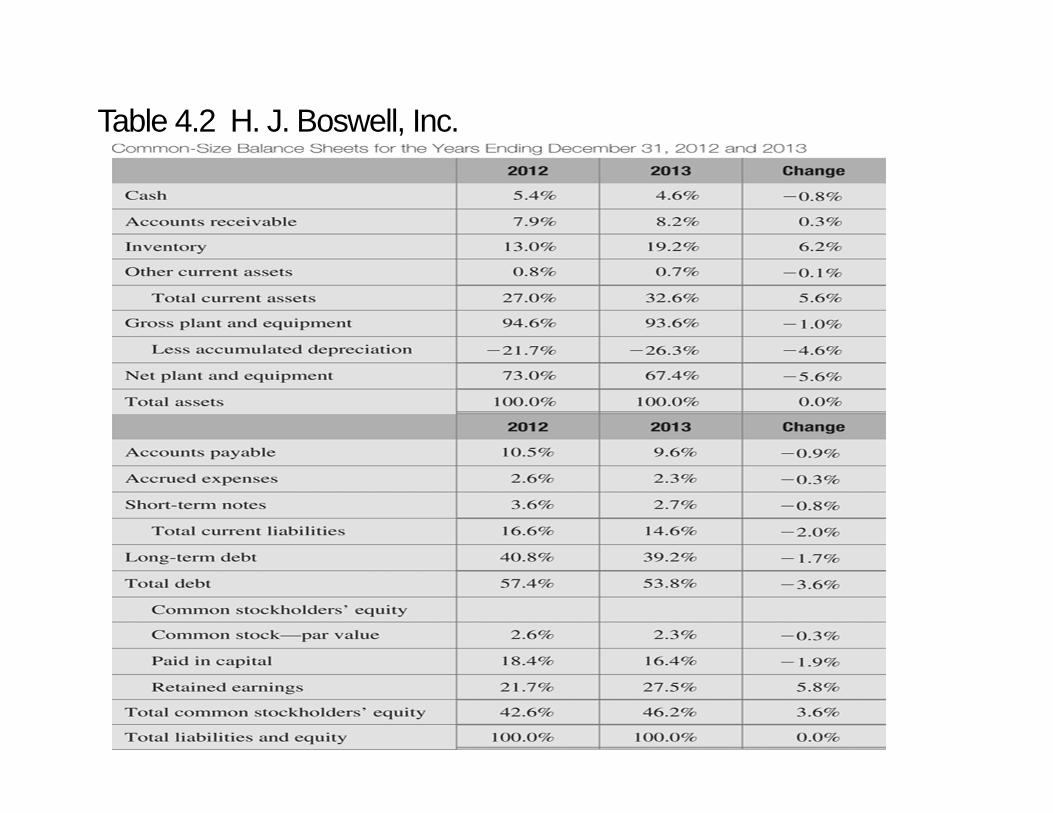
Table 4.2 H. J. Boswell, Inc.
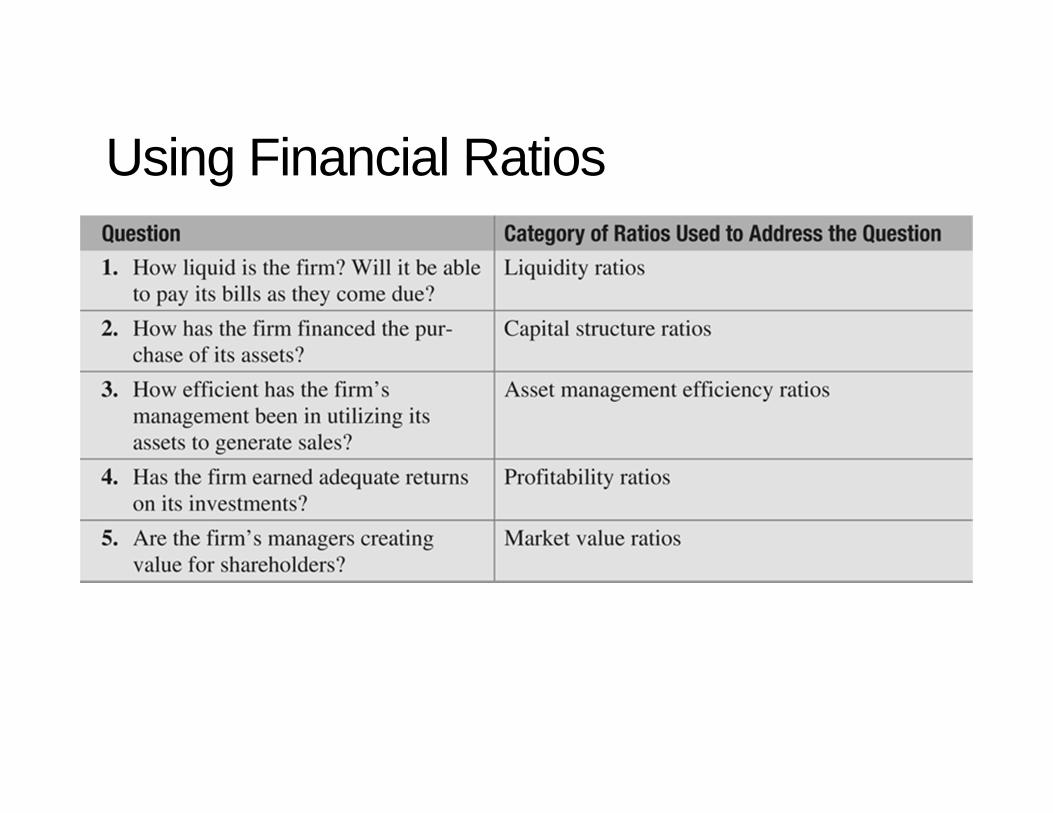
Using Financial Ratios
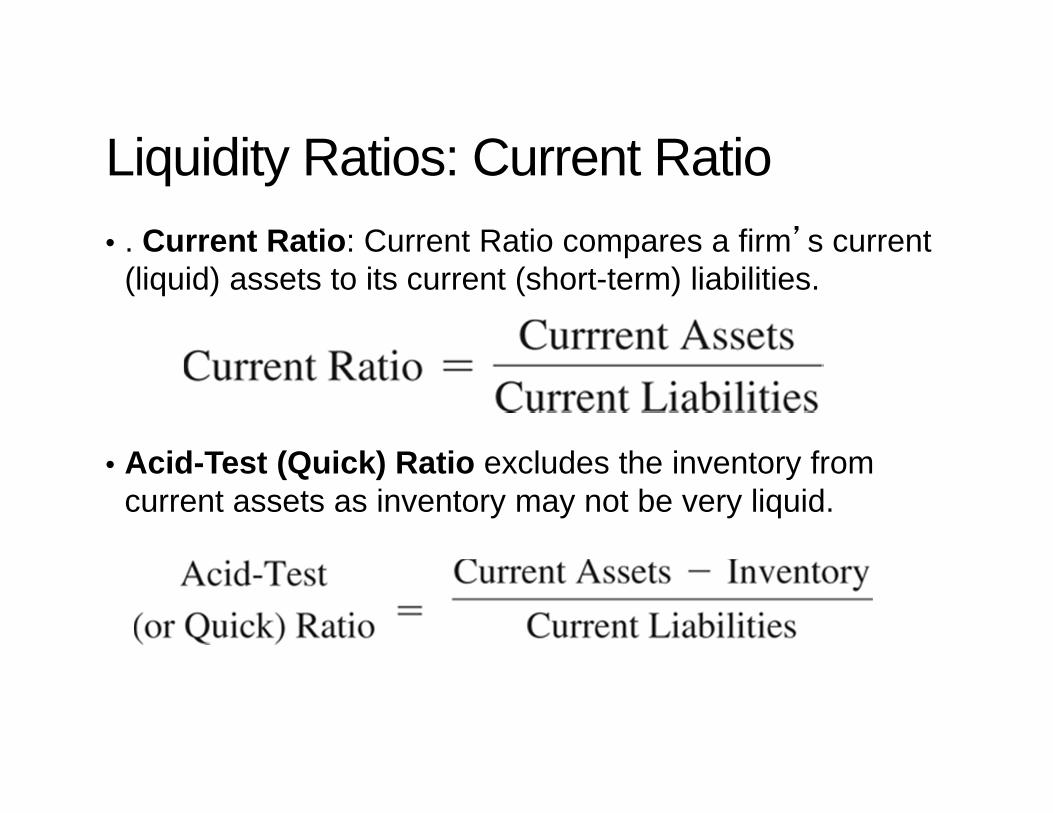
Liquidity Ratios: Current Ratio• . Current Ratio: Current Ratio compares a firm’s current
(liquid) assets to its current (short-term) liabilities.
• Acid-Test (Quick) Ratio excludes the inventory from current assets as inventory may not be very liquid.
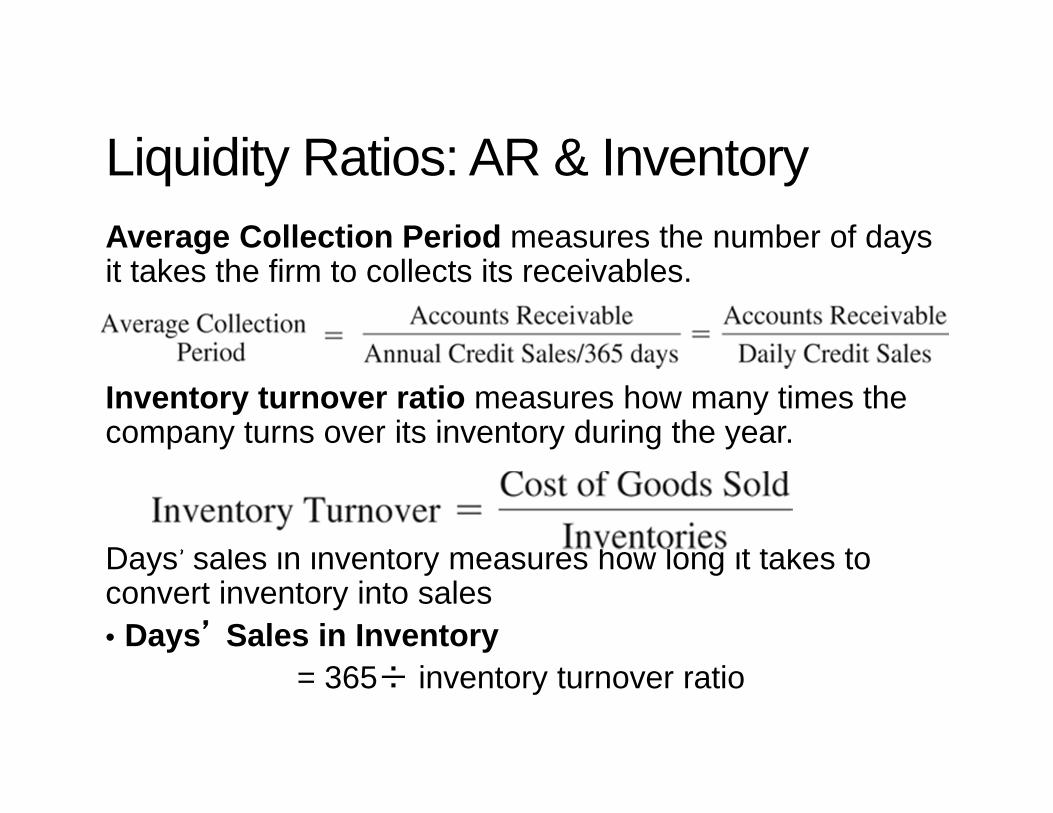
Liquidity Ratios: AR & Inventory Average Collection Period measures the number of days it takes the firm to collects its receivables.
Inventory turnover ratio measures how many times the company turns over its inventory during the year.
Days’ sales in inventory measures how long it takes to convert inventory into sales • Days’ Sales in Inventory
= 365÷ inventory turnover ratio
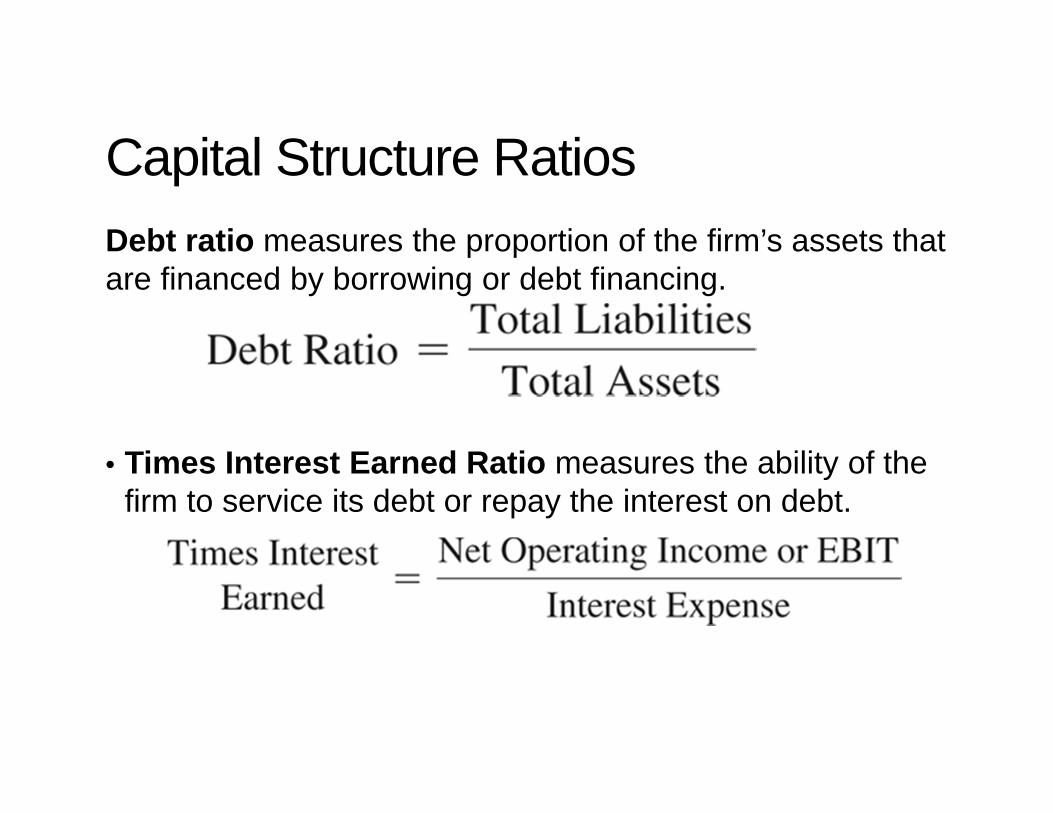
Capital Structure RatiosDebt ratio measures the proportion of the firm’s assets that are financed by borrowing or debt financing.
• Times Interest Earned Ratio measures the ability of the firm to service its debt or repay the interest on debt.
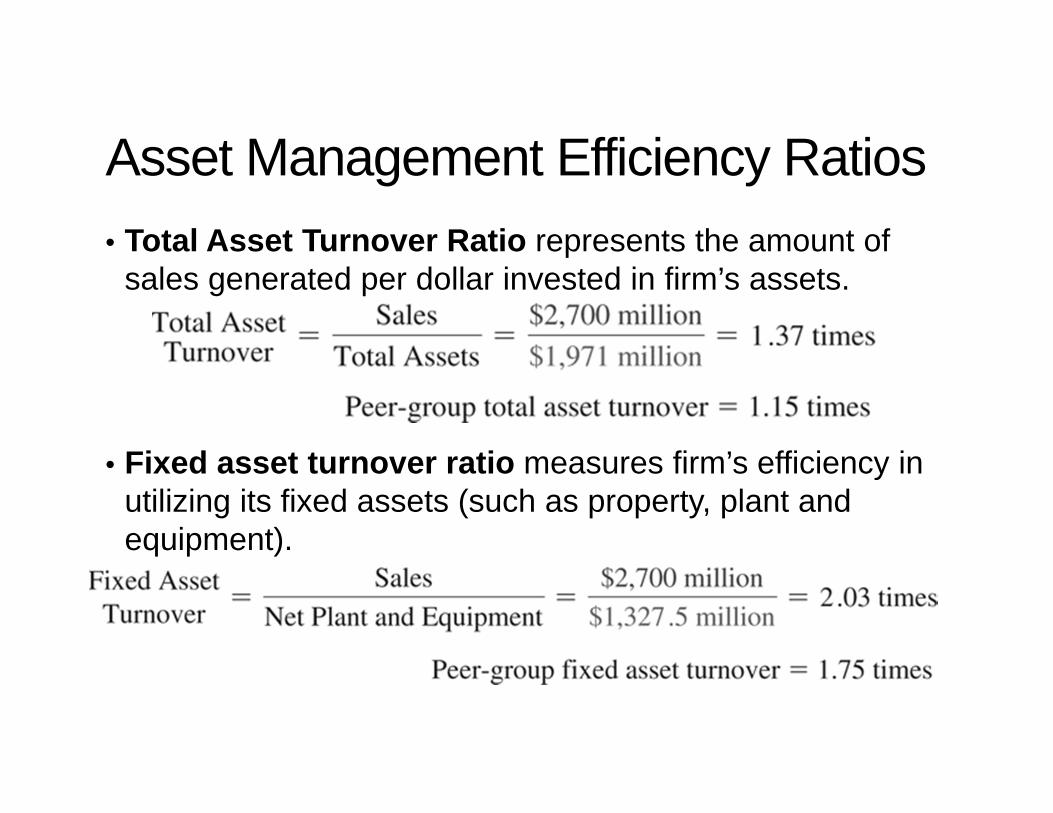
Asset Management Efficiency Ratios • Total Asset Turnover Ratio represents the amount of
sales generated per dollar invested in firm’s assets.
• Fixed asset turnover ratio measures firm’s efficiency in utilizing its fixed assets (such as property, plant and equipment).
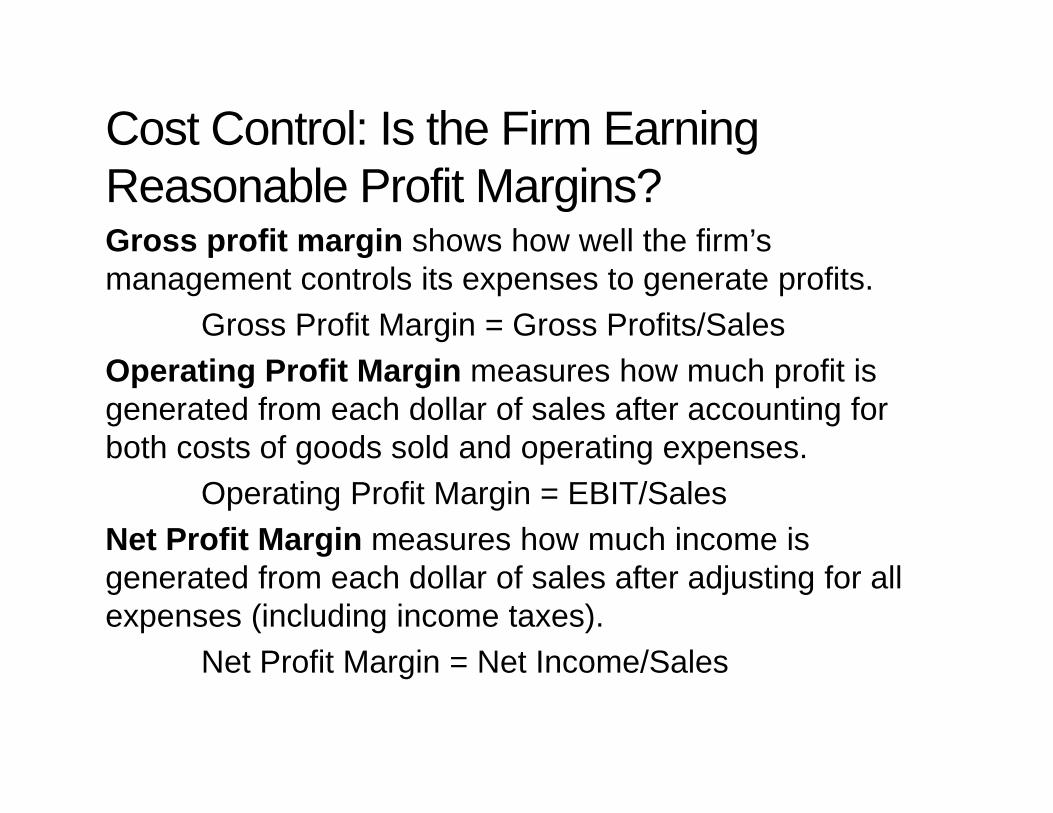
Cost Control: Is the Firm Earning Reasonable Profit Margins?Gross profit margin shows how well the firm’s management controls its expenses to generate profits.
Gross Profit Margin = Gross Profits/SalesOperating Profit Margin measures how much profit is generated from each dollar of sales after accounting for both costs of goods sold and operating expenses.
Operating Profit Margin = EBIT/SalesNet Profit Margin measures how much income is generated from each dollar of sales after adjusting for all expenses (including income taxes).
Net Profit Margin = Net Income/Sales
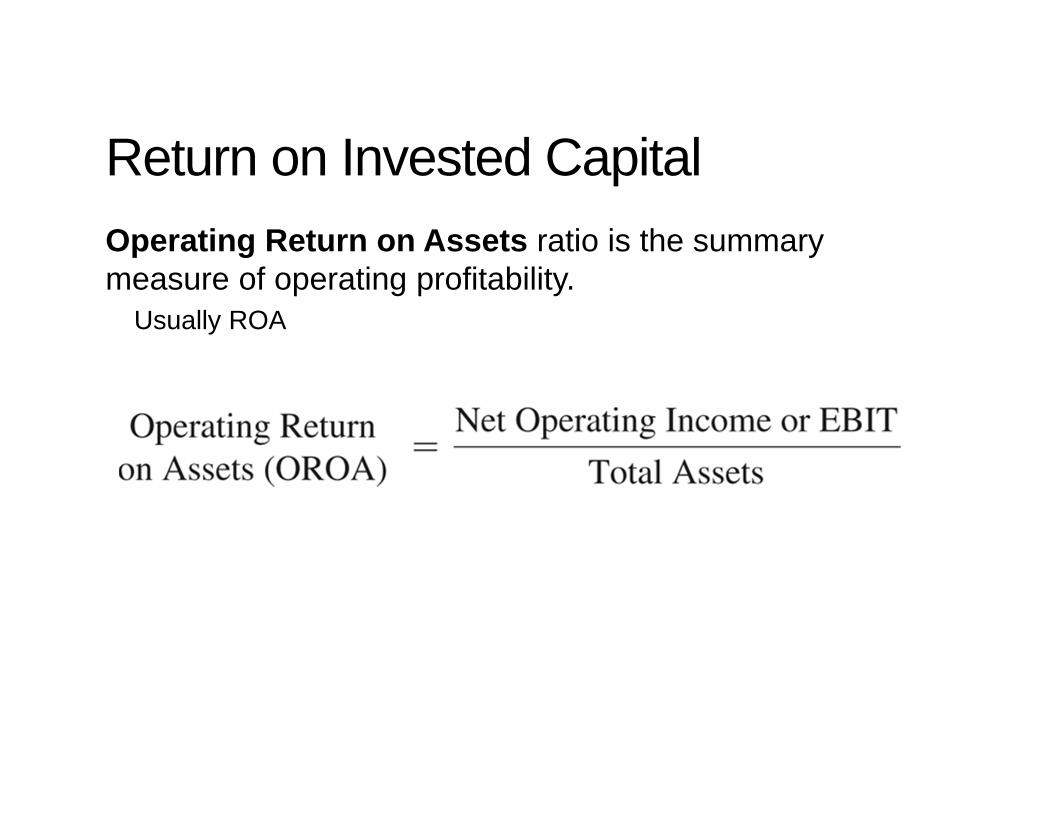
Return on Invested CapitalOperating Return on Assets ratio is the summary measure of operating profitability.
Usually ROA
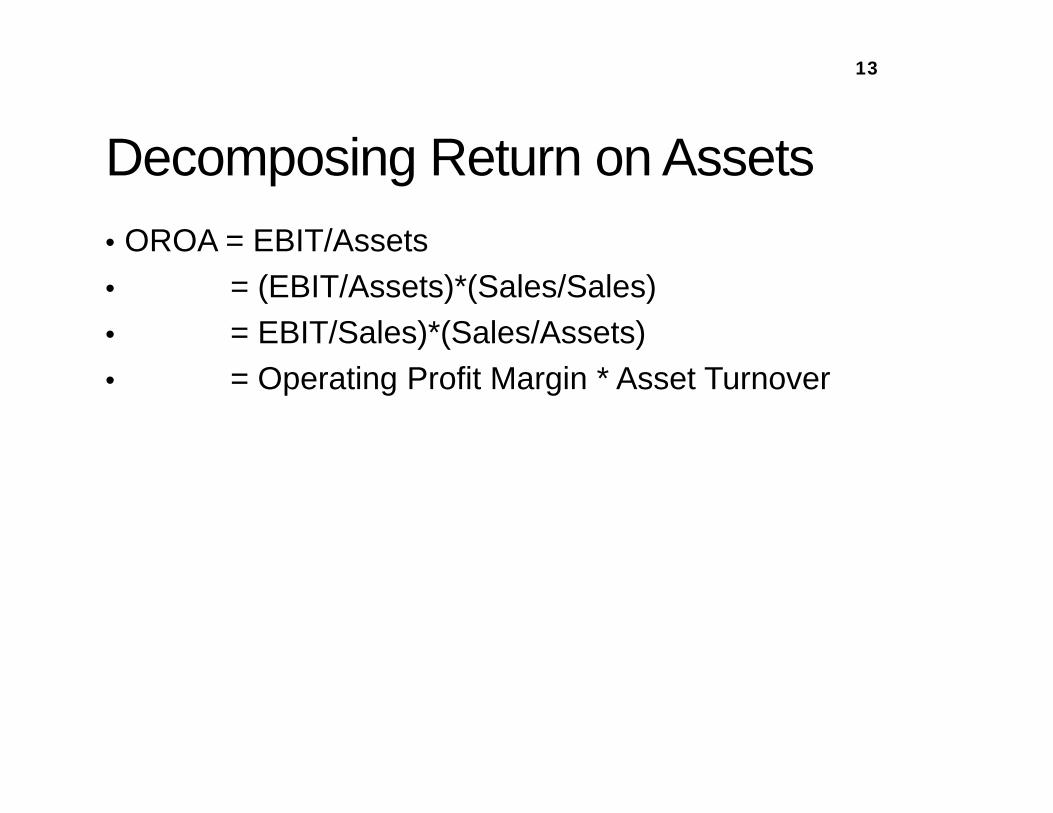
Decomposing Return on Assets • OROA = EBIT/Assets• = (EBIT/Assets)*(Sales/Sales)• = EBIT/Sales)*(Sales/Assets)• = Operating Profit Margin * Asset Turnover
13
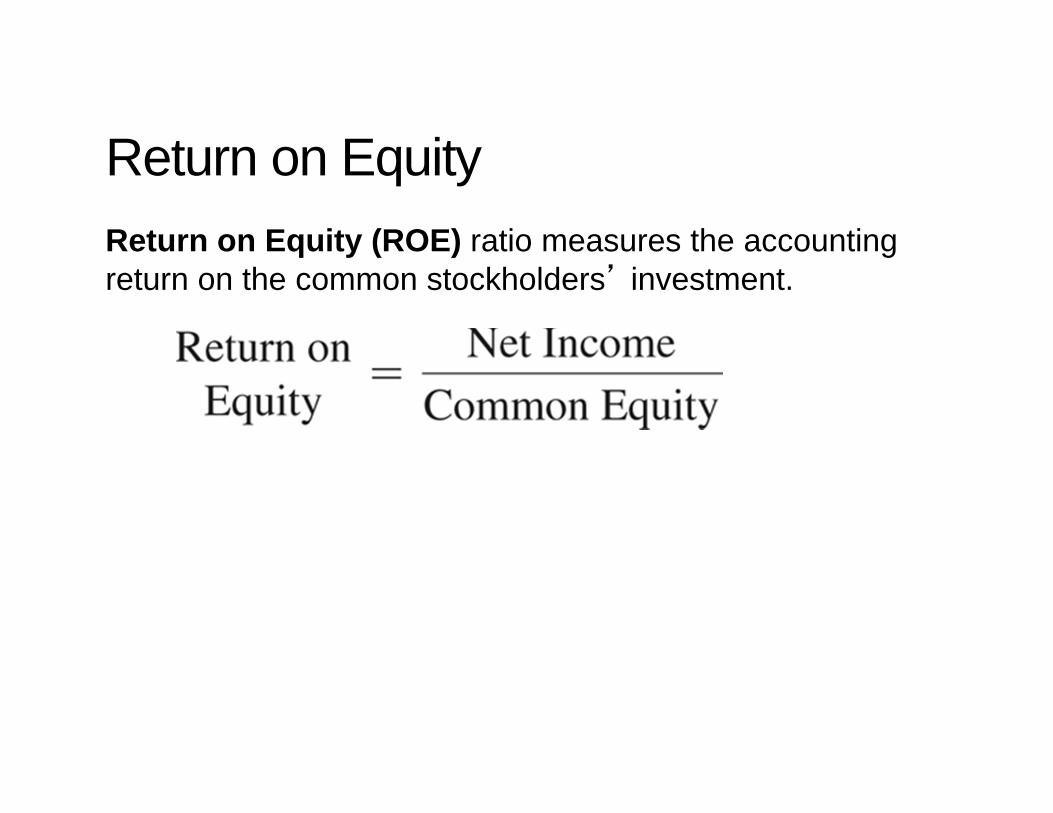
Return on EquityReturn on Equity (ROE) ratio measures the accounting return on the common stockholders’ investment.
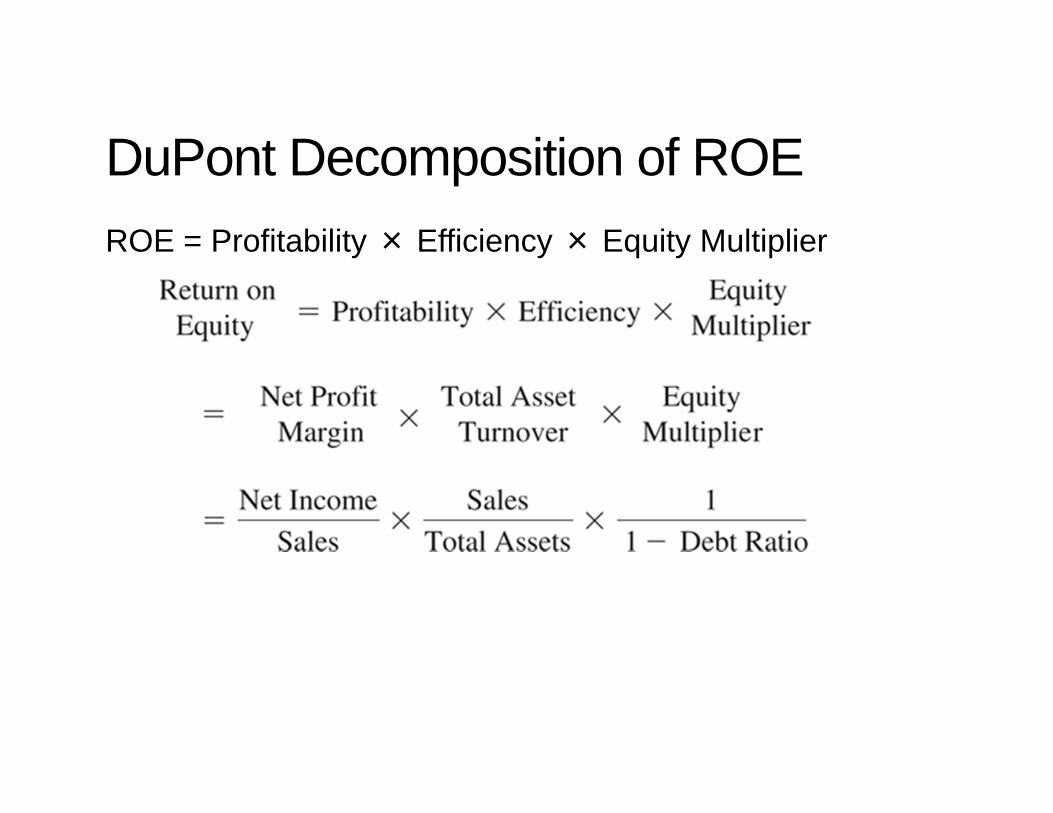
DuPont Decomposition of ROEROE = Profitability × Efficiency × Equity Multiplier
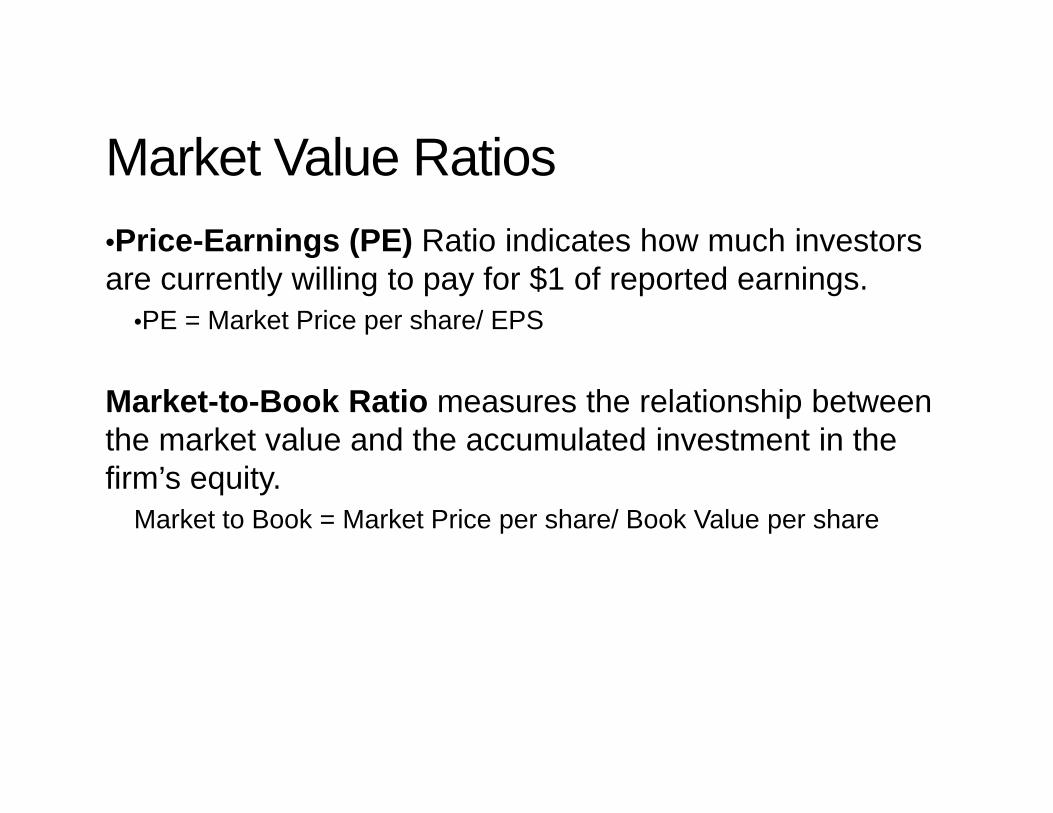
Market Value Ratios•Price-Earnings (PE) Ratio indicates how much investors are currently willing to pay for $1 of reported earnings.
•PE = Market Price per share/ EPS
Market-to-Book Ratio measures the relationship between the market value and the accumulated investment in the firm’s equity.
Market to Book = Market Price per share/ Book Value per share
Using Financial Ratios• Financial ratios in isolation are not very useful
• Trend Analysis – compares a firm’s financial statements over time (time-series comparisons).
• Peer Group Comparisons – compares the subject firm’s financial statements with “peer” firms. • Usually same industry