Embed Size (px)
Citation preview
1
Financial advisors, financial crisis, and shareholder
wealth in bank mergers
K. S. Chuang,*a
, J. Danboltband K. Opong
b
aDepartment of Finance, Tunghai University, 118, Sec.3, Taichung-Kan Rd., Taichuang,
Taiwan
bThe Business School, University of Glasgow, Main Building, Glasgow, G12 8QQ,
Scotland, United Kingdom
*Corresponding author. E-mail: [email protected]
Abstract
This study investigates whether the quality of investment banks impacts shareholder
wealth in bank mergers. Focusing on a US sample of 415 targets and 1,066 bidders from
1995 to 2010, we find that the quality of financial advisors appears to have a significant
impact on shareholder wealth for bidding firms, but not for target firms. Our results find
that bidders experience higher losses when hiring tier-1 advisors. Interestingly, further
analysis shows that this finding holds during ‘normal’ periods, but not during the crisis
(1997-1999 and 2007-2009) periods. With a significant negative relationship between
tier-1 advisors and bidder announcement returns in the regression analysis, our results
suggest that more prestigious financial advisors lead to larger losses for bidders in bank
mergers. The results suggest overpayment by bidders when hiring more prestigious
financial advisors in bank mergers. Our results also indicate the importance of financial
advisors to bidder shareholder wealth.
EFM classification: G160
Keywords: Investment banks, bank mergers, shareholder wealth, financial crisis
2
I. Introduction
Merger and acquisition activities have significantly increased over the last decade.
Andrade et al. (2001) argue that several factors, such as economic, regulatory and
industrial shocks, may result in merger waves. Merger waves take place not only for
industrial firms but also for financial firms. Banks may engage in mergers and
acquisitions triggered by deregulation and globalization. On the other hand, banks may
intend to combine with other financial firms in order to respond to economic shocks,
such as financial crises. In this stream, banks may attempt to look for potentially suitable
firms and enlarge their market shares through mergers and acquisitions. Some banks
may hire investment banks to facilitate the transactions.1
Due to information asymmetry, the target or bidder may not have sufficient information
to evaluate its merger partners. The merger participants may require an intermediary to
gather information relevant to the firm and negotiate the transaction. Hence, investment
banks play an important role for their clients in the process of mergers and acquisitions
(McLaughlin, 1990; Kale et al., 2003; Schiereck et al., 2009). Schiereck et al. (2009)
argue that investment banks assist their clients to identify potential bidders and targets.
The use of investment banks can also facilitate deal completion where financial advisors
1 We use investment banks and financial advisors interchangeably in this study.
3
provide their knowledge and expertise in evaluating the deals (Servaes and Zenner, 1996;
Schiereck et al., 2009; Wang and Whyte, 2010). In more complex transactions,
investment banks offer valuable functions in reducing asymmetric information (Hunter
and Jagtiani, 2003).
Additionally, investment banks also provide M&A advice in bidding strategy (Kale et al.,
2003; Schiereck et al., 2009). The use of investment banks in mergers and acquisitions
may enable bidding firms to uncover the true value of targets. In contrast, target firms
may have more bargaining power when investment banks are hired. Accordingly, the
reputation of financial advisors can be expected to influence the gains created by the
transactions. Hence, the level of synergies from mergers and acquisitions may depend on
the quality of financial advisors. To measure the quality of financial advisors, Rau (2000)
classifies investment banks into three tiers of banks.2 The author argues that this
measure yields a stable ranking during the sampling period.
A growing body of literature has examined the effects of financial advisors in mergers
and acquisitions (e.g., Servaes and Zenner, 1996; Hunter and Jagtiani, 2003; Ismail,
2009; Schiereck et al., 2009; Wang and Whyte, 2010; Golubov et al., 2011). For
2 Rau (2000) classifies the top five banks in any signal year as first-tier banks. The next 15 banks
are grouped as second-tier banks. The remaining banks are categorized as third-tier banks.

4
example, Wang and Whyte (2010) report that bidders that use investment banks in
mergers and acquisitions on average obtain lower gains than those that do not use
investment banks. However, Golubov et al. (2011) report that bidders obtain higher
gains in public acquisitions when hiring top-tier advisors, and Ismail (2009) reports the
same findings when analyzing the internet bubble period. On the other hand, Ismail
(2009) reports that targets earn higher gains when targets are advised by tier-1
investment banks.
However, prior empirical studies mainly focus on industrial firms. As financial firms,
such as banks, operate in a highly regulated industry, the deals would draw much
attention from the public and the government. On the other hand, given the complexity
of financial firms and the need to comply with regulations, financial advisors can be
expected to play a larger role in bank mergers than in mergers between non-financial
firms. While prior empirical studies report mixed results on the influence of advisors on
shareholder wealth in mergers and acquisitions, prior empirical evidence may not be
applicable to financial firms. Thus, whether the quality of financial advisors impacts
shareholder wealth in bank mergers remains an open question, which we address in this
study.

5
This study addresses the following research questions: (1) Whether the use of financial
advisors by target (bidding) firms has an effect on shareholder wealth; (2) Whether
target (bidding) firms advised by investment banks with higher reputation obtain higher
gains than those advised by investment banks with lower reputation; and (3) Whether
target (bidding) firms that hire more reputable investment banks perform better during
the crisis (1997-1999/2007-2009) periods relative to the normal period.3 If investment
banks play an important role in advising their clients, they can be expected to offer
superior ability in advising their clients during a crisis period.
Using a sample of 415 US targets and 1,066 US bidders during the period of 1995-2010,
we find that there is no significant difference in target announcement returns between
those using and those not using financial advisors. The evidence further shows that
targets advised by tier-3 advisors on average earn significantly higher announcement
returns than those using tier-1 and tier-2 advisors. Splitting the sample into normal and
crisis periods, the results show that targets obtain higher announcement returns during
the normal period. The results suggest that targets in the presence of target financial
advisors have higher bargaining power during the normal period. The results also
3 Cornett et al. (2011, p. 299) argue that “the financial crisis of 2007-2009 is the biggest shock to
the US”. Similarly, the financial crisis in 1997 also impacted the global financial market. To be
consistent, we define the years of the financial crisis (crisis) as the period of 1997-1999 and
2007-2009. The rest of the years are classified as “normal” for the periods of 1995-1996,
2000-2006 and 2010.
6
indicate that targets advised by tier-3 advisors obtain significantly higher announcement
returns both in the normal and crisis periods.
In addition, the evidence reveals that targets gain more when M&As take place during
the 2007-2009 financial crisis period relative to the 1997-1999 financial crisis period.
Our results indicate that more reputable financial advisors cannot create higher gains for
target firms. However, financial advisors appears to have played an important role and
created higher value for US targets during the 2007-2009 financial crisis period. When
controlling for deal- and firm-specific characteristics in the regression analysis, we do
not find any significant relationship between the quality of financial advisors and target
announcement returns.
With regard to the empirical evidence for bidders, the results show that bidders obtain
lower announcement returns when hiring financial advisors. Given the existence of
financial advisors, we find that bidders advised by tier-1 advisors experience higher
losses relative to those with tier-2 and tier-3 advisors. Partitioning the sample into
normal and crisis periods, the results show that bidders generally experience higher
losses during the crisis period. Interestingly, our results reveal that bidders advised by
highly reputable financial advisors tend to have poor performance during the normal
7
period, but not in the crisis period. This suggests that financial advisors may have more
ability to offer superior advisory service to their clients when M&As take place in the
crisis period.
We also find that bidders obtain lower announcement returns during the 1997-1999
financial crisis period compared to the 2007-2009 financial crisis period. Controlling for
deal- and firm-specific characteristics in the regression analysis, the results also indicate
that more prestigious financial advisors are associated with lower bidder announcement
returns. This finding is consistent with our previous results.
Overall, our results reveal the importance of the quality of financial advisors on the
impact of shareholder wealth in bank mergers. The empirical evidence suggests that the
quality of financial advisors plays an important role for bidding firms, but not
necessarily for target firms. Bidder managers with the assistance of high-quality
financial advisors may suffer from overconfidence when evaluating synergies for the
deals.
This study makes several important contributions. First, we provide new evidence
regarding the importance of the quality of financial advisors on the impact of

8
shareholder wealth in bank mergers. Our findings indicate that the quality of financial
advisors can be an important determinant affecting shareholder wealth not only for
industrial firms, but also for financial firms. More importantly, our study also makes a
comparison to address shareholder wealth of the firm during the two financial crisis
periods, taking into account the presence of financial advisors. While we find that the
use of prestigious advisors generally to have a negative impact on bidding company
performance, our findings indicate that financial advisors can provide superior advisory
service when the market experiences a significant shock of financial crisis.
This paper is organized as follows. Related literature is reviewed in Section Two, while
the hypotheses are developed in Section Three. The sample and methodology are
presented in Section Four, followed by the empirical results in Section Five. The
conclusions are provided in Section Six.
II. Review of related literature
The effects of financial advisors on shareholder wealth have been examined in prior
empirical studies. However, prior empirical studies on mergers and acquisitions mainly
look at industrial firms and pay less attention to financial firms. In addition, these studies
report mixed results.

9
Looking at the evidence of acquiring firms, Bowers and Miller (1990) find that higher
total wealth gains are created when either bidders or targets choose first-tier investment
bankers. Servaes and Zenner (1996) examine bidder returns and find that the use of
investment banks has no impact on the shareholder wealth of bidders, while Wang and
Whyte (2010) report that bidders using investment banks experience wealth losses when
bidding firms have strong management. However, wealth losses can be alleviated when
more reputable financial advisors are hired.
Several prior studies extend to examine the impact of the quality of investment banks on
abnormal returns. Bowers and Miller (1990) report that bidder returns are lower when
first-tier investment banks are used. Similar findings have also been documented in the
studies of McLaughlin (1992), Servaes and Zenner (1996), Rau (2000), Rau and
Rodgers (2002), Hunter and Jagtiani (2003) and Allen et al. (2004). McLaughlin (1992)
argues that financial advisors with high reputation tend to be involved in difficult
transactions and thus require higher premia. This can reduce the benefits to bidding
firms. Walter et al. (2008) also report similar results. However, Rau (2000) reports
conflicting results, with bidders obtaining higher gains when employing first-tier
investment banks in tender offers. Golubov et al. (2011) similarly find that bidders gain
10
more in public acquisitions when hiring top-tier advisors.
In addition, Ismail (2009) analyzes the performance of financial advisors in relation to
the market condition. The author reports that financial advisors with high reputation
create more gains to bidders during the bubble period between 1995 and 2000 than those
with low reputation. However, bidders obtain lower gains outside the bubble period
when hiring more reputable financial advisors. Moreover, bidders experience higher
losses during the bear market period between 2000 and 2002 when tier-one advisors are
hired.
Turning to the evidence for targets, McLaughlin (1992) finds no significant relationship
between the quality of investment banks and target premia. Chahine and Ismail (2009)
lend support to this point in their study. In addition, several studies explore the link
between abnormal returns and the reputation of investment banks. Water et al. (2008)
report that targets earn lower abnormal returns when more reputable advisors are
selected. Schiereck et al. (2009) find similar results and document that their findings do
not support higher target gains in association with the choice of first-tier banks relative
to other banks.

11
However, such findings are not supported by all studies. For example, Bowers and
Miller (1990) report that targets gain more if either the target or bidder is advised by a
first-tier advisor, and Allen et al. (2004) find that targets obtain higher gains when
targets employ its own banks as financial advisors.
In sum, several studies have examined the role of investment banks on the influence of
shareholder wealth. However, the prior studies report mixed results, and the studies do
not provide a clear picture of the effects of financial advisors in M&As. Furthermore,
prior studies mainly focus on industrial firms, not financial firms. As banks are highly
regulated, results from prior studies may not hold for financial firms. This suggests a
need for further research. As a result, this study extends prior empirical studies to
explore whether the quality of financial advisors impacts shareholder wealth in bank
mergers.
III. Hypotheses development
To examine the importance of the role of investment banks on the influence of wealth
gains in mergers and acquisitions, the hypotheses are developed as follows. According to
the superior deal hypothesis, investment banks with higher reputation can offer their
experience and expertise in evaluating transactions. These investment banks have more
12
ability to identify good candidates and get better merger proposals (Kale et al., 2003;
Ismail, 2009; Schiereck et al., 2009). Wang and Whyte (2010) argue that investment
banks tend to be employed when deals are more complex. Rau (2000) and Schiereck et
al. (2009) also argue that the existence of investment banks is an important determinant
of the bank’s market share that can affect the performance of the bidding firm. Thus, the
choice of more reputable investment banks can be expected to offer higher bargaining
power to the firm and deals can be negotiated on more favorable terms to them. From
this, it can be expected that the use of investment banks or more reputable investment
banks will lead to higher gains to the firm in bank mergers. While the financial crisis had
a significant impact on the banking industry, and possibly made acquisitions more risky
and complex, more reputable financial advisors may have a greater ability to look for
firms valuable to their clients. Thus, it can be further predicted that investment banks can
create higher synergies to the firm during the period of the financial crisis.
In addition, the deal completion hypothesis argues that investment banks have strong
incentives to complete transactions due to their contingent fees (Rau, 2000; Walter et al.,
2008; Ismail, 2009; Chahine and Ismail, 2009). While investment banks are concerned
about their fee income, they do not intend to increase acquisition prices to a level that
may damage their reputation capital (McLaughlin, 1990; Golubov et al., 2011). Walter et

13
al. (2008) similarly argue that advisors are only interested in completing transactions
faster. They argue that the reputation of investment banks only relates to the completion
of deals. If this is the case, the gains earned by their clients can be expected to have no
relationship to the quality of their advisor. Thus, this hypothesis predicts that there is no
relationship between gains to the firm and the use of investment banks or more reputable
investment banks. Furthermore, it can be predicted that investment banks have no
impact on the gains for the firm during the period of the financial crisis. We test these
alternative hypotheses in Section Five.
IV. Sample and methodology
Sample selection
The sample of mergers and acquisitions in the US is obtained from Thomson Financial
SDC One Banker database. The investigation period covers the years from 1995 to 2010.
To be included in the sample, each transaction is required to meet the following criteria.
We require the bidding firm to be a bank and the target firm to be a financial firm. This
criterion enables the current study to further control for the factor of diversifying or
focusing deals.4 This criterion leads to an initial sample of 19,024 transactions in the
4 We use SIC code to classify a bank or a financial firm, where the firm with a 2-digit SIC code
60XX is classified as a bank and the firm with a 1-digit SIC code 6XXX is categorized as a
financial firm. Similarly, SIC code is also used to determine whether the transaction is a
diversifying or focusing deal. The deal is classified as focusing if the target and bidder share the
same 2-digit (60XX) SIC code; otherwise, diversifying if the target and bidder share the same
1-digit (6XXX) SIC code.

14
US.
Requiring either the target or bidding firm to be listed reduces the sample to 13,169
transactions. The sample is further restricted to deals classified as acquisition of majority
interest, merger or exchange offer. The transaction must be complete and the transaction
value is restricted to be at least 10 million US dollars so as to reduce any bias induced by
small deals. This reduces the sample to 2,581 deals. We further require that the bidding
firm owns more than 50% of the target shares after the transaction in order to focus on
the change of control. Accordingly, a further 30 transactions are eliminated from the
sample, leaving 2,551 deals. As hostile takeovers are rare among banking firms, we
further remove three hostile deals.
Share prices and financial data were collected from Datastream. If share price is missing,
the transaction is removed from the sample. Financial characteristics are gathered from
the calendar year end prior to the announcement date. To avoid any bias resulting from
confounding events, we also control for a 3-day (-1,+1) event window without any
announcement of other corporate events. The SEC filings database is employed to
control for this issue. The final sample contains 415 targets and 1,066 bidders.
15
The measurement of the reputation of the financial advisor
Investment banks usually offer their expertise and experience in the process of mergers
and acquisitions. An investment bank’s reputation largely depends on its past
performance (Chemmanur and Fulghieri, 1994; Walter et al., 2008). Prior studies usually
use a static ranking system to measure the quality of financial advisors (McLaughlin,
1992; Rau, 2000). Rau (2000) argues that this measurement can obtain a stable ranking
to measure the quality of financial advisors. However, Da Silva Rosa et al. (2004) and
Walter et al. (2008) argue that this ranking procedure does not take into account the
dynamics of the M&A advisor market that may alter the level of financial advisor quality.
Therefore, Walter et al. (2008) use a three-year rolling window to measure the rank of
financial advisors.
However, the dynamic measurement may be biased when the M&A advisor market
experiences a major shock in relation to the market condition. For example, when the
financial crisis took place in 1997, a three-year rolling window would also cover the
years 1995 and 1996 in determining the quality of financial advisors. It can be argued
that Walter et al.’s (2008) dynamic measurement of financial advisor quality cannot truly
reflect the quality of financial advisors in a year of financial crisis. Thus, Walter et al.’s
(2008) dynamic measurement may potentially overestimate the quality of financial
16
advisors in a year of financial crisis when analyzing financial advisors on the impact of
the firm in mergers and acquisitions. Thus, we measure the rank of financial advisors in
the previous year during the sampling period from the league table in the SDC database.
For bank mergers taking place in 1995, the quality of investment banks is measured
from the year of 1994, etc. This allows the measure of financial advisor quality to better
match the market condition in this study.
In addition, prior studies usually classify financial advisors into two or three tiers on the
basis of their market share in the takeover market (McLaughlin, 1992; Rau, 2000;
Saunders and Srinivasan, 2001; Chahine and Ismail, 2009; Ismail, 2009). Chahine and
Ismail (2009) argue that the reputation of financial advisors is built on the basis of their
permanent success in providing quality service to their clients. Walter et al. (2008) argue
that league table rankings are commonly used to measure the quality of financial
advisors. Following Rau’s (2000) study, the quality of financial advisors is measured by
the market share as a fraction of the total value of transactions advised by investment
banks in the previous year. Similarly, we classify the top five banks in the previous year
as first-tier investment banks. The next 15 banks, ranked 6-20, are grouped as
second-tier investment banks, with the remaining banks categorized as third-tier
17
investment banks.5
Control variables
Several prior studies have demonstrated the importance of deal and firm characteristics
on abnormal returns in M&As. Controlling for these characteristics enables the current
study to more precisely examine the relationship between the quality of financial
advisors and the abnormal returns of the firm. Thus, this study controls for the effects of
relatedness, the payment method, performance, growth potential, capital ratio and firm
size.
DeLong (2001) argues that focusing deals may create value to the firm. Managers may
have more ability to manage similar risks. However, diversifying transactions may result
in risk reduction (Beitel et al., 2004). Several studies report that focused activities create
more value than diversifying transactions (Cybo-Ottone and Murgia, 2000; DeLong,
2001, 2003; Beiel et al., 2004). Following Campa and Hernando (2004) and Hagendorff
et al. (2008), we control for the variable of relatedness for focusing and diversifying
deals. The deals are classified as focusing if the target and bidder share the same 2-digit
(60XX) SIC code; diversifying with the same 1-digit (6XXX) SIC code. Relatedness is a
5 If targets or bidders are advised by more than one financial advisor, we use the highest ranking
financial advisor to measure the quality of their advisors.
18
dummy variable taking the value 1 if the deals are diversifying transactions and 0 if
focused.
According to the tax implication hypothesis (Hansen, 1987), target shareholders may be
liable to pay tax immediately when payment is cash. Furthermore, according to the
information asymmetry hypothesis, bidders may have superior information about their
firms. Managers may offer stock payment when their stock is overvalued (Myers and
Majluf, 1984; Houston and Ryngaert, 1994). DeLong (2003) and Ismail and Davidson
(2005) find that targets receiving cash payment earn higher announcement returns.
Hagendorff et al. (2008) find that bidder announcement returns are positively associated
with cash payment. Following Hagendorff et al. (2008), method of payment is controlled
for by a dummy variable taking the value 1 where there is full cash payment and 0 where
there is stock or mixed payment.
With regard to firm characteristics, Akhigbe et al. (2004) find that target announcement
returns are positively related to return on assets measured as net income to total assets,
while Ismail and Davidson (2007) find that target announcement returns are positively
associated with target profitability measured as return on average assets. However,
Beitel et al. (2004) report inconsistent results. In addition, Hagendorff et al. (2008) find
19
that bidders obtain higher returns when bids are made by profitable banks. Following
Akhigbe et al. (2004), profitability (ROA) is measured as net income to total assets.
A higher level of capital ratio can serve as a cushion against unexpected losses for the
bank (Akhigbeet al., 2004; Valkanov and Kleimeier, 2007). Akhigbe et al. (2004) find
that target announcement returns are positively associated with the capital ratio.
Baradwaj et al. (1991) and Grullon et al. (1997) similarly find that bidder cumulative
abnormal returns are positively related to the capital ratio. However, Cornett et al. (2003)
report a negative relationship between bidder cumulative abnormal returns and the
capital ratio. Following Cornett et al. (2003), the capital ratio is measured as total capital
to total assets.
A firm with high growth potential is arguably more attractive. Such a firm may also
appear to be more expensive. Akhigbe et al. (2004) and Goergen and Renneboog (2004)
find that target announcement returns are positively related to the market to book ratio.
Moeller and Schlingemann (2005) report that bidder announcement returns are
positively correlated to their market to book ratio. Growth potential is proxied by the
market to book ratio, where the ratio is defined as the market value of equity to the book
value of equity.

20
Taking into account firm size, Valkanov and Kleimeier (2007) find that target
announcement returns are negatively related to target size. Subrahmanyam et al. (1997)
and Fields et al. (2007) also find that bidder cumulative abnormal returns are negatively
associated with bidder size. Thus, we control for firm size, measured as ln(total assets).
Methodology
To examine the quality of financial advisors on the effects of bank merger and
acquisition announcements for the firms, we follow Brown and Warner’s (1985) study
and use the standard event study methodology. The market model is applied to calculate
the abnormal returns. The market model parameters are estimated from day -286 to day
-31, where day 0 is the announcement date. The Datastream market index for the US
market is selected as the benchmark for the market (TOTMKUS). The abnormal returns
are calculated by subtracting expected returns from actual returns.6
)(ARit mtit RR
Where:
6 As a robustness test, the mean-adjusted returns model is also applied in this study to calculate
the abnormal returns. The results are qualitatively the same. Thus, for brevity, we only report the
results based on the market model in this study.

21
itAR = the abnormal return for stock i on day t ,
itR = the return on stock i on day t ,
mtR = the return for the market on day t ,
, = the market model parameters
The cumulative abnormal returns are calculated by aggregating the abnormal returns
over a certain period of the event window. While the price tends to have a significant
impact in the time surrounding the announcement date, focusing on short term event
windows, such as (-1,+1) and (-2,+2), can be expected to better capture the effects of
financial advisors on shareholder wealth.7 In addition, cross-sectional t -statistic is used
to test the significance level for the hypothesis, 0H : mean abnormal returns are equal to
0.
To better understand the impact of the quality of investment banks on shareholder wealth
in bank mergers, we apply cross-sectional regression analysis, controlling for relatedness,
cash payment, performance, growth potential, capital ratio, and firm size. This also
enables the current study to explore the determinants that can affect the announcement
returns in bank mergers. The regression model is specified as follows:
7 To capture the effects from the pre/post-announcement period, we also use an 11-day (-5,+5)
event window in this study. As the results are qualitatively the same, we only report our findings
based on 3-day (-1,+1) and 5-day (-2,+2) event windows.
22
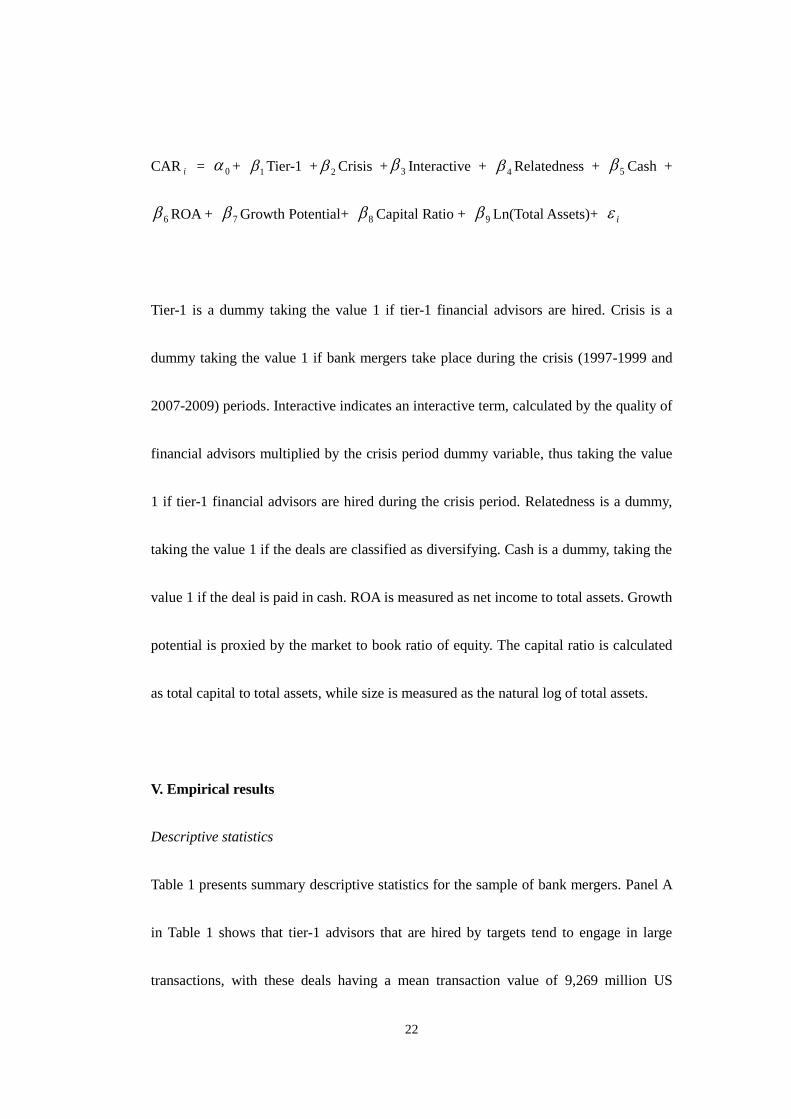
CAR i = 0 + 1 Tier-1 + 2 Crisis + 3 Interactive + 4 Relatedness + 5 Cash +
6 ROA + 7 Growth Potential+ 8 Capital Ratio + 9 Ln(Total Assets)+ i
Tier-1 is a dummy taking the value 1 if tier-1 financial advisors are hired. Crisis is a
dummy taking the value 1 if bank mergers take place during the crisis (1997-1999 and
2007-2009) periods. Interactive indicates an interactive term, calculated by the quality of
financial advisors multiplied by the crisis period dummy variable, thus taking the value
1 if tier-1 financial advisors are hired during the crisis period. Relatedness is a dummy,
taking the value 1 if the deals are classified as diversifying. Cash is a dummy, taking the
value 1 if the deal is paid in cash. ROA is measured as net income to total assets. Growth
potential is proxied by the market to book ratio of equity. The capital ratio is calculated
as total capital to total assets, while size is measured as the natural log of total assets.
V. Empirical results
Descriptive statistics
Table 1 presents summary descriptive statistics for the sample of bank mergers. Panel A
in Table 1 shows that tier-1 advisors that are hired by targets tend to engage in large
transactions, with these deals having a mean transaction value of 9,269 million US
23
dollars. The same finding can be observed for bidding firms. Bidders advised by tier-1
advisors undertake transactions with a mean value of 3,576 million US dollars.
[Insert Table 1 here]
In panel B, we present the summary of the firm-specific characteristics of the sample.
The figure shows that bidders tend to have higher growth potential, with the mean value
of the market to book ratio at 2.08 relative to that of targets at 1.65. In addition, targets
on average appear to hold higher capital ratio than bidders, with the capital ratio at 0.20
and 0.15 for targets and bidders, respectively. This suggests that target managers may
manage their capital inefficiently. Although bidders tend to be larger than targets, the
performance of targets and bidders appears to be the same.
Empirical findings for targets
Target abnormal returns based on the quality of financial advisors
This section presents empirical findings for targets with/without financial advisors and
also with different quality of financial advisors. The results in Table 2 show that targets
earn positive announcement returns regardless of whether they use financial advisors.
The results are all statistically significant. However, the results show that targets that do

24
not hire financial advisors on average obtain slightly higher gains relative to those hiring
financial advisors. These findings suggest that the use of financial advisors can reduce
gains for targets. A possible explanation is that targets with financial advisors need to
pay advisory fees, thus reducing the gains to target firms. However, the difference in
abnormal returns between target banks with investment bank advisors and those without
is small and not statistically significant.
[Insert Table 2 here]
While taking into account the quality of financial advisors, the results reveal that targets
advised by tier-3 advisors on average earn higher announcement returns than those
advised by tier-1 and tier-2 advisors. For example, targets advised by tier-3 advisors on
average earn 19% cumulative abnormal returns, substantially higher than the
approximately 12% cumulative abnormal returns for those with tier-1 and tier-2 advisors
over a 3-day (-1,+1) event window. The results are all statistically significant.8 While
more reputable financial advisors may require higher advisory fees in accordance with
their advisory service, our findings suggest that the use of more prestigious advisors
reduce the gains to targets as a result of lower announcement returns. Thus, our findings
8 We also use the nonparametric statistics in terms of Kruskal-Wallis test to examine whether
target gains are different on the basis of the three tiers of financial advisors. The results are
statistically significant.
25
do not support the superior deal hypothesis. Our results are consistent with the studies of
Walter et al. (2008) and Schiereck et al. (2009), but contradict Ismail’s (2009) findings,
where Ismail (2009) reports that targets advised by tier-1 investment banks on average
gain more relative to those advised by tier-2 advisors.
Target announcement returns during crisis and normal periods
This section presents the empirical evidence for target firms, taking into account the
periods of normal and crisis years and the quality of financial advisors.9 If high quality
of financial advisors plays an important role in mergers and acquisitions, they can be
expected to better negotiate deals with favorable terms for target firms in a crisis periods.
As Table 3 shows, targets on average obtain marginally higher announcement returns
during normal years, averaging 17.58% over a 3-day (-1,+1) event window, compared to
16.14% in the crisis period. While the levels of abnormal returns are statistically
significant, the differences in abnormal returns between the normal and crisis periods are
not.
[Insert Table 3 here]
9 Cornett et al. (2011, p. 299) argue that “the financial crisis of 2007-2009 is the biggest shock to
the US.”. Similarly, the financial crisis in 1997 also impacted the global financial market. To be
consistent, we define the years of the financial crisis (crisis) as the periods of 1997-1999 and
2007-2009. The rest of the years are classified as “normal”, comprising the periods of 1995-1996,
2000-2006, and 2010.
26
We further partition the sample based on the quality of financial advisors during the
periods of the normal and crisis years.10
Consistent with our previous findings in Table
2, we find that targets advised by tier-3 advisors obtain higher gains than those advised
by tier-1/2 advisors regardless of the time period. The difference is statistically
significant at the 0.01 level in the normal period only.
Taking into account the period of the crisis years, we also split the sample on the basis of
the different periods of 1997-1999 and 2007-2009. This allows the current study to
compare the effect of the quality of financial advisors on shareholder wealth during
these two financial crisis periods. The results show that financial advisors tend to create
higher gains to targets in the period of 2007-2009 than in the period of 1997-1999. Our
findings show that targets obtain cumulative abnormal returns at around 21% during the
2007-2009 crisis period relative to some 14% during the 1997-1999 crisis period.
However, while the levels of cumulative abnormal returns are significant, the differences
are not statistically significant.
Cross-sectional regression analysis for targets
10
Due to a small sample, and due to the similarity of results for the two groups, as displayed in
Table 2, we aggregate tier-1 and tier-2 advisors in one group and compare these to tier-3 advisors.
27
This section provides cross-sectional regression analysis for targets in order to examine
the level of investment banks on the influence of shareholder wealth. The regression
analysis also controls for the deal and firm characteristics.11
To investigate the impact of the quality of financial advisors on target shareholder
wealth, we use the dummy variable for target advisors. The dummy equals to 1 if target
advisors are classified as tier-1 advisors; 0 otherwise. We also control for the crisis
period dummy in order to examine how financial advisors perform towards target firms
in the crisis period compared to the normal period. The dummy equals to 1 if M&As
take place during the 1997-1999 and 2007-2009 crisis periods. In addition, we also
control for the interactive term between the dummy of tier-1 advisors and the crisis
period in the regression analysis to better understand whether more reputable financial
advisors create higher gains to target shareholders during the crisis period. For the deal
characteristics, we control for a relatedness dummy and a cash dummy. With regard to
firm characteristics, the regression analysis further controls for profitability (ROA),
growth potential (market to book ratio), capital ratio, and firm size (ln(total assets)).
The results in Table 4 show that there is an insignificant negative relationship between
11
We delete the top and bottom 1% target 3-day (-1,+1) cumulative abnormal returns in order to
control for outliers in the regression analysis.
28
tier-1 advisors and target announcement returns. With regard to control variables, the
results indicate that higher gains to targets are associated with lower growth potential
and smaller targets. As can be seen in Table 4, there is a significant increase in
explanatory power in terms of adjusted R squared, from around 0 to 4% when
additionally controlling for firm characteristics. This suggests the importance of
controlling for firm characteristics in the regression analysis.
[Insert Table 4 here]
Empirical findings for bidders
Bidder abnormal returns based on the quality of financial advisors
This section reports the empirical results for bidders with/without financial advisors, and
the quality of financial advisors. As shows in Table 5, the results reveal that bidders
obtain negative announcement returns regardless of the presence of financial advisors.
The empirical evidence shows that bidders who use financial advisors experience higher
losses than those who do not hire financial advisors. For example, bidders that hired
financial advisors obtain -1.61% cumulative abnormal returns over a 3-day (-1,+1) event
window relative to -0.26% for those who did not hire financial advisors. The difference
is statistically significant at the 0.01 level. The results suggest that financial advisors

29
may concentrate on completing deals than on getting the best deal for their clients.
[Insert Table 5 here]
Given the use of financial advisors, we further analyze bidder announcement returns
based on the quality of financial advisors in order to examine whether high-quality
financial advisors outperform those of low quality. As can be seen in Table 5, bidders
advised by tier-1 advisors on average experience higher losses than those advised by
tier-2 and tier-3 advisors. These findings are consistent with prior studies, e.g.,
McLaughlin (1992), Servaes and Zenner (1996), Rau (2000), Rau and Rodgers (2002),
Hunter and Jagtiani (2003), and Allen et al. (2004). However, the differences in returns
between banks with different tiers of advisors are not statistically significant.
Bidder announcement returns in different periods
To better understand whether reputable financial advisors outperform those with poor
reputation during the financial crisis periods, we further partition the sample based on
normal and financial crisis periods. Given the presence of financial advisors, Table 6
shows that bidders on average experience slightly higher losses during the financial
crisis period than those in the normal period, of -1.70% versus -1.55%. Both are

30
statistically significant at the 0.01 level, but not significantly different from each other.
[Insert Table 6 here]
However, the results show that bidders advised by tier-1/2 advisors on average
experience higher losses during the normal period than those advised by tier-3 advisors,
suggesting that the use of higher quality of financial advisors generally result in worse
performance to bidding firms during the normal period.
Interestingly, however, we find conflicting results during the crisis period. The results
show that more prestigious investment banks appear to have better performance in the
crisis period than less reputable financial advisors. This finding indicates that more
reputable financial advisors seem to offer their expertise in negotiating transactions
during crisis periods. Our findings also illustrate the importance of financial advisors to
bidders when M&As take place during crisis periods.
Additionally, we also examine the impact of bidder shareholder wealth during different
crisis periods. This sheds light on whether there is any difference in bidder
announcement returns during these two financial crisis periods. The evidence shows that

31
bidders on average experience higher losses during the 1997-1999 crisis period than the
2007-2009 crisis period. The difference between these two financial crisis periods is
statistically significant.
Cross-sectional regression analysis for bidders
To determine the impact of the quality of financial advisors on bidder shareholder wealth,
we also control for deal- and firm-specific characteristics. With regard to control
variables, the results show that bidders obtain higher gains when the payment method is
cash and when bidders have a higher capital ratio. However, more importantly, the
results show that announcement returns are lower for bidders using tier-1 advisors.
These results hold when we control for the crisis versus normal periods, with bidders
that use first-tier financial advisors obtaining lower announcement returns in bank
mergers.12
The findings lend support to our previous results. The results are also
consistent with prior studies (e.g., Servaes and Zenner, 1996, Rau, 2000, Hunter and
Jagtiani, 2003, Allen et al., 2004, Walter et al., 2008).
[Insert Table 7 here]
12
We also use a 5-day (-2,+2) event window as the dependent variable. The results qualitatively
remain the same.

32
VI. Conclusion
This study investigates whether firms advised by investment banks with higher
reputation obtain higher gains, and whether firms that hire financial advisors with high
reputation have better performance during the period of financial crisis. Focusing on
financial firms and using a sample of 415 US targets and 1,066 US bidders from 1995 to
2010, the results show that targets advised by tier-3 advisors on average earn higher
announcement returns relative to those by tier-1 and tier-2 advisors, and tier-3 advisors
on average create higher returns to targets during both normal and crisis period.
However, the regression analysis cannot find any significant relationship between tier-1
advisors and target announcement returns.
In addition, the evidence reveals that bidders advised by tier-1 advisors generally obtain
lower announcement returns than those advised by less prestigious advisors although
bidders on average experience negative announcement returns. Interestingly, our results
show that bidders advised by tier-1 advisors on average experience larger losses during
the normal period, but not to the crisis period. The regression analysis lends support to
the point that bidders advised by tier-1 advisors are associated with lower bidder
announcement returns.

33
Overall, our findings suggest that financial advisors appear to play a good role for
bidding firms, but not to target firms. Specifically, we find that tier-1 financial advisors
tend to outperform during the crisis period, suggesting that tier-1 financial advisors can
be expected to carefully evaluate the transactions during the crisis period for bidding
firms. As bidders advised by more prestigious financial advisors experience larger losses
in bank mergers, the results suggest that bidder managers advised by more prestigious
financial advisors may be overconfident when evaluating synergies. However, more
reputable financial advisors may be more valuable in acquisitions during crisis periods.
34
References
Akhigbe A. and Madura J. (2004) Bank acquisitions of security firms: the early evidence,
Applied Financial Economics, 14, 485-496.
Akhigbe A., Madura J. and Whyte A. M. (2004) Partial Anticipation and the Gains to
Bank Merger Targets, Journal of Financial Services Research, 26, 55-71.
Allen L., Jagtiani J., Peristiani S. and Saunders A. (2004) The Role of Bank Advisors in
Mergers and Acquisitions, Journal of Money, Credit, and Banking, 36, 197-224.
Andrade G., Mitchell M. and Stafford E. (2001) New evidence and Perspectives on
Mergers, Journal of Economic Perspectives, 15, 103-120.
Baradwaj B. G., Dubofsky D. A. and Fraser D. R. (1991) Bidder Returns in Interstate
and Intrastate Bank Acquisitions, Journal of Financial Services Research, 5,
261-273.
Beitel P., Schiereck D. and Wahrenburg M. (2004) Explaining M&A Success in
European Banks, European Financial Management, 10, 109-139.
Benou G. and Madura J. (2005) High-tech acquisitions, firm specific characteristics and
the role of investment bank advisors, Journal of High Technology Management
Research, 16, 101-120.
Bowers H. M. and Miller R. (1990) Choice of investment banker and shareholder wealth
of firms involved in acquisitions, Financial management, 19, 34-44.
35
Brown S. J. and Warner J. B. (1985) Using daily stock returns: The case of event studies,
Journal of Financial Economics, 14, 3-31.
Campa J. M. and Hernando I. (2006) M&As performance in the European financial
industry, Journal of Banking & Finance, 30, 3367-3392.
Chahine S. and Ismail A. (2009) Premium, merger fees and the choice of investment
banks: A simultaneous analysis, The Quarterly Review of Economics and Finance,
49, 159-177.
Chemmanur J. T. and Fulghieri P. (1994) Investment Bank Reputation, Information
Production, and Financial Intermediation, Journal of Finance, 49, 57-79.
Cornett M. M., Hovakimian G., Palia D. and Tehranian H. (2003) The impact of the
manager–shareholder conflict on acquiring bank returns, Journal of Banking
&Finance, 27, 103-131.
Cornett M. M., McNutt J. J., Strahan P. E. and Tehranian H. (2011) Liquidity risk
management and credit supply in the financial crisis, Journal of Financial
Economics, 101, 297-312.
Cybo-Ottone A. and Murgia M. (2000) Mergers and Shareholder Wealth in European
Banking, Journal of Banking & Finance, 24, 831-859.
Da Silva Rosa R., Lee P., Skott M., and Walter T. (2004) Competition in the market for
takeover advisors, Australian Journal of Management, 29, 61-92.

36
DeLong G. (2003) The Announcement Effects of U.S. versus Non-U.S. Bank Mergers:
Do They Differ?,The Journal of Financial Research, 26, 487-500.
DeLong G. L. (2001) Stockholder gains from focusing versus diversifying bank mergers,
Journal of Financial Economics, 59, 221-252.
DeLong G. L. (2003) The announcement effects of US versus non-US bank mergers: Do
they differ?, Journal of Financial Research, 26, 487-500.
Fields L. P., Fraser D. R. and Kolari J. W. (2007) Bidder returns in bancassurance
mergers: Is there evidence of synergy?, Journal of Banking & Finance, 31,
3646-3662.
Goergen M. and Renneboog L. (2004) Shareholder wealth effects of European domestic
and cross-border takeover bids, European Financial Management, 10, 9-45.
Golubov A., Petmezas D. and Travlos N. G. (2011) "When it pays to pay your
investment banker: New evidence on the role of financial advsiors in M&As,
Journal of Finance, forthcoming.
Grullon G., Michaely R. and Swary I. (1997) Capital Adequacy, Bank mergers, and The
Medium of Payment, Journal of Business Finance & Accounting, 24, 97-124.
Haendorff J., Colins M. and Keasey K. (2008) Investor protection and the value effects
of bank merger announcements in Europe and the US, Journal of Banking &
Finance, 32, 1333-1348.
37
Hansen R. G. (1987) A Theory For The Choice of Exchange Medium in Mergers and
Acquisitions, Journal of Business, 60, 75-96.
Houston J. F. and Ryngaert M. D. (1994) The overall gains from large bank mergers,
Journal of Banking & Finance, 18, 1155-1176.
Hunter W. C. and Jagtiani J. (2003) An analysis of adviser choice, fees, and effort in
mergers and acquisitions, Review of Financial Economics, 12, 65-81.
Ismail A. (2009) Are good financial advisors really good? The performance of
investment banks in the M&A market, Review of Quantitative Finance and
Accounting, 35, 411-429.
Ismail, A. K. and Davidson, I. R. (2005) Further analysis of mergers and shareholder
wealth effects in European banking, Applied Financial Economics, 15, 13–30.
Kale J., Kini O. and Ryan H. (2003) Financial Advisors and Shareholder Wealth Gains in
Corporate Takeovers, Journal of Financial and Quantitative Analysis, 38, 475-501.
Kiymaz H. (2004) Cross-border acquisitions of US financial institutions: Impact of
macroeconomic factors, Journal of Banking & Finance, 28, 1413-1439.
McLaughlin R. M. (1990) Investment banking contracts in tender offers: An empirical
analysis, Journal of Financial Economics, 28, 209-232.
Moeller S., Schlingemann F. and Stulz R. (2005) Wealth destruction on a massive scale?
A study of acquiring firm returns in the recent merger wave, Journal of Finance,
38
60, 757-782.
Myers S. and Majluf N. (1984) Corporate financing and investment decisions when
firms have information that investors do not have Journal of Financial Economics,
13, 187-221.
Rau P. R. (2000) Investment bank market share, contingent fee payments, and the
performance of acquiring firms Journal of Financial Economics, 56, 293-324.
Rau P. R. and Rodgers K. J. (2002) Do bidders hire top-tier investment banks to certify
value?, Working Paper. Purdue University and Penn State University.
Saunders A. and Srinivasan A. (2001) Investment Banking Relationships and Merger
Fees, Working paper. University of Georgia.
Schiereck D., Sigl-Grüb C. and Unverhau J. (2009) Investment bank reputation and
shareholder wealth effects in mergers and acquisitions, Research in International
Business and Finance, 23, 257-273.
Servaes H. and Zenner M. (1996) The Role of Investment Banks in Acquisitions, The
Review of Financial Studies, 9, 787-815.
Subrahmanyam V., Rangan N. and Rosenstein S. (1997) The Role of Outside Directors
in Bank Acquisitions, Financial Management, 26, 23-36.
Valkanov E. and Kleimeier S. (2007) The role of regulatory capital in international bank
mergers and acquisitions, Research in International Business and Finance, 21,

39
50-68.
Walter T. S., Yawaon A. and Yeung C. (2008) The role of investment banks in M&A
transactions: Fees and services, Pacific-Basin Finance Journal, 16, 341-369.
Wang W. and Whyte A. M. (2010) Managerial rights, use of investment banks, and the
wealth effects for acquiring firms' shareholders, Journal of Banking & Finance, 34,
44-54.
40
Table 1. Summary descriptive statistics
Panel A
Target Bidder
Mean deal
value
Total deal
value
N Mean deal
value
Total deal
value
N
Tier-1 9,269 583,972 63 3,576 300,368 84
Tier-2 1,110 42,194 38 1,069 40,628 38
Tier-3 390 108,528 278 475 175,865 270
Panel B
Target Bidder
Mean SD Max Min Mean SD Max Min
ROA 0.01 0.02 0.21 -0.06 0.01 0.00 0.03 -0.04
Growth 1.65 0.68 4.67 0.15 2.08 0.91 5.99 0.04
Capital 0.20 0.12 1.05 0.05 0.15 0.06 0.54 0.06
Ln(Total
assets)
14.09 1.82 20.74 10.76 15.25 1.72 21.26 11.14
Table 1 presents the summary of descriptive statistics for targets and bidders. The sample includes 415
targets and 1,066 bidders from 1995 to 2010. Panel A presents mean deal value and total deal value for
targets and bidders based on the quality of financial advisors. The top five investment banks in any
previous year are classified as tier-1 investment banks; the top 6-20 investment banks as tier-2
investment banks; below 20 as tier-3 investment banks. The value is measured as millions of dollars.
Panel B presents summary descriptive statistics for firm characteristics. ROA is measured as net
income to total assets. Growth (market to book ratio) is measured as market value of the equity to book
value of the equity. Capital is measured as total capital to total assets. Ln(Total assets) is measured as
the log of total assets. The financial characteristics are collected from the year end prior to the
announcement in the Datastream database.
41
Table 2. Target abnormal returns by quality of investment bank advisor
With IB
Without IB Difference
tier-1 tier-2 tier-3 Kruskal-Wallis
(-1,+1) 0.1718 0.1230 0.1197 0.1900 4.8100 0.1744 -0.0026
p-value 0.0000 0.0000 0.0900 0.0000 0.0900 0.0000 0.9420
(-2,+2) 0.1750 0.1217 0.1198 0.1947 7.5500 0.1866 -0.0116
p-value 0.0000 0.0000 0.1070 0.0000 0.0230 0.0000 0.7370
N 379 63 38 278
36
Table 2 presents empirical results for targets with/without the use of financial advisors and the quality
of financial advisors. If the firm does not hire investment banks or no investment banks are retained,
the sample is categorized as “without IB”. “Difference” captures the difference in abnormal returns
between banks with and banks without investment bank advisors. The event study methodology with
the market model is used to calculate the abnormal returns. The model parameters are estimated from
day -286 to day -31, where day 0 is the announcement date. Student t-statistic is used to test the
significance level, assuming cross-sectional independence of the sample. 2-sample t-statistic is used to
test the difference in announcement returns. The Kruskal-Wallis H test is employed to test the
difference in abnormal returns for the three tiers of financial advisors.
42
Table 3. Target abnormal returns, quality of investment bank advisor and the effect of financial crises
Normal
Crisis
Difference(1)
tier-1/2 tier-3 Difference(2)
tier-1/2 tier-3 Difference(3) 1997-1999 2007-2009 Difference(4)
(-1,+1) 0.1758 0.1176 0.1933 0.0757 0.1614 0.1273 0.1827 0.0625 0.1371 0.2121 -0.0749 0.0117
p-value 0.0000 0.0000 0.0000 0.0020 0.0000 0.0480 0.0000 0.3620 0.0000 0.0010 0.2410 0.6590
(-2,+2) 0.1812 0.1217 0.1990 0.0773 0.1631 0.1201 0.1848 0.0646 0.1402 0.2037 -0.0635 0.0181
p-value 0.0000 0.0000 0.0000 0.0020 0.0000 0.0750 0.0000 0.3450 0.0000 0.0030 0.3410 0.5080
N 251 58 193
128 43 85
82 46
Table 3 presents empirical evidence for targets regarding the normal and crisis periods. The normal period includes the years1995-1996, 2000-2006, and 2010. The crisis
period includes the years1997-1999 and 2007-2009. Student t-statistic is used to test the significance level, assuming cross-sectional independence of the sample. 2-sample
t-statistic is used to test the difference in announcement returns. “Difference (1)” captures the difference in abnormal returns between the normal and crisis periods.
“Difference (2)” captures the difference in abnormal returns between banks with tier-1/2 advisors and banks with tier-3 financial advisors during the normal period.
“Difference (3)” captures the difference in abnormal returns between banks with tier-1/2 advisors and banks with tier-3 financial advisors during the crisis period.
“Difference (4)” captures the difference in abnormal returns between bank M&As in the 1997-1999 crisis period and bank M&As in the 2007-2009 crisis period. The sample
only includes targets that hire investment banks.
43
Table 4. Cross-sectional regression analysis of target cumulative abnormal returns
(1) (2) (3) (4) (5)
(Constant) 0.172*** 0.391*** 0.401*** 0.400*** 0.396***
Relatedness 0.024 0.034 0.030 0.031
Cash 0.013 -0.002 0.001 0
ROA 0.075 -0.127 -0.211 -0.143
Growth -0.041*** -0.041*** -0.042*** -0.043***
Capital -0.102 -0.123 -0.115 -0.122
ln(total assets) -0.009* -0.010* -0.010* -0.010*
Tier-1 -0.018 -0.013 -0.013 -0.013 0.000
Crisis 0.019 0.021
Interactive -0.029
Adjusted R2
-0.002 0.044 0.045 0.046 0.044
F-value
(p-value)
0.683
(0.563)
4.587
(0.000)
3.598
(0.001)
3.315
(0.001)
2.996
(0.002)
N 405 387 387 387 387
Table 4 presents cross-sectional regression analysis for targets. The sample of the top and bottom 1%
target 3-day (-1,+1) cumulative abnormal returns is deleted in order to control for outliers. The
dependent variable is target 3-day (-1,+1) cumulative abnormal returns. The independent variable
includes the dummy of relatedness, cash, ROA, growth, capital ratio, ln(total assets), tier-1, crisis and
interactive. Interactive is calculated as the dummy of tier-1 financial advisors multiplied by the dummy
of the crisis period. The dummy equals to1 if the deal is classified as diversification, payment is cash,
target advisors are classified as tier-1 investment banks, and bank mergers take place in the crisis
period. ROA is measured as net income to total assets. Growth (market to book ratio) is measured as
the market value of the equity to the book value of the equity. Capital is measured as total capital to
total assets. Ln(total assets) is calculated as the log of total assets. The financial data is collected from
the year end prior to the transaction in the Datastream database. White’s (1980) heteroskedasticity is
used to compute p-value. *** indicates significance at 0.01 level; ** indicates significance at 0.05 level;
* indicates significance at 0.1 level.
44
Table 5. Bidder abnormal returns by quality of investment bank advisor
With IB
Without IB Difference
tier-1 tier-2 tier-3 Kruskal-Wallis
(-1,+1) -0.0161 -0.0219 -0.0107 -0.0153 1.8800 -0.0026 -0.0135
p-value 0.0000 0.0010 0.2390 0.0000 0.3900 0.2370 0.0000
(-2,+2) -0.0149 -0.0216 -0.0126 -0.0136 2.1300 -0.0019 -0.0130
p-value 0.0000 0.0010 0.1560 0.0000 0.3440 0.4630 0.0000
N 492 84 38 370
574
Table 5 presents empirical results for bidders with/without the use of financial advisors, and the quality
of financial advisors. If the firm does not hire investment banks or no investment banks are retained,
the sample is categorized as “without IB”. “Difference” captures the difference in abnormal returns
between banks with and banks without investment bank advisors. The event study methodology with
the market model is used to calculate the abnormal returns. The model parameters are estimated from
day -286 to day -31, where day 0 is the announcement date. Student t-statistic is used to test the
significance level, assuming cross-sectional independence of the sample. 2-sample t-statistic is used to
test the difference in announcement returns. The Kruskal-Wallis H test is employed to test the
difference in the abnormal returns for the three tiers of financial advisors.
45
Table 6. Bidder abnormal returns, quality of investment bank advisor, and the effect of financial crises
Normal
Crisis
Difference(1)
tier-1/2 tier-3 Difference(2)
tier-1/2 tier-3 Difference(3) 1997-1999 2007-2009 Difference(4)
(-1,+1) -0.0155 -0.0215 -0.0128 -0.0087 -0.0170 -0.0152 -0.0197 0.0045 -0.0230 -0.0002 -0.0228 0.0015
p-value 0.0000 0.0020 0.0000 0.2340 0.0000 0.0460 0.0000 0.6240 0.0000 0.9880 0.0690 0.7690
(-2,+2) -0.0156 -0.0243 -0.0120 -0.0123 -0.0139 -0.0131 -0.0164 0.0033 -0.0195 0.0018 -0.0213 -0.0017
p-value 0.0000 0.0000 0.0000 0.0900 0.0050 0.0820 0.0080 0.7350 0.0000 0.8790 0.1010 0.7580
N 298 62 236
194 60 134
140 50
Table 6 presents empirical evidence for bidders in normal and crisis year periods. The classification of the period depends on the occurrence of financial crisis. The normal
period includes the years 1995-1996, 2000-2006, and 2010. The crisis period includes the years 1997-1999 and 2007-2009. Student t-statistic is used to test the significance
level, assuming cross-sectional independence of the sample. 2-sample t-statistic is used to test the difference in announcement returns. “Difference (1)” captures the
difference in abnormal returns between the normal and crisis periods. “Difference (2)” captures the difference in abnormal returns between banks with tier-1/2 and banks
with tier-3 financial advisors during the normal period. “Difference (3)” captures the difference in abnormal returns between banks with tier-1/2 and banks with tier-3
financial advisors during the crisis period. “Difference (4)” captures the difference in abnormal returns to bank M&As in the 1997-1999 crisis period vs. bank M&As in the
2007-2009 crisis period. The sample only includes targets that hire investment banks.
46
Table 7. Cross-sectional regression analysis of bidder cumulative abnormal returns
(1) (2) (3) (4) (5)
(Constant) -0.010*** 0.000 -0.001 0.000 0.000
Relatedness 0.003 0.003 0.003 0.002
Cash 0.008** 0.008** 0.008** 0.008**
ROA 0.251 0.214 0.206 0.203
Growth -0.001 -0.001 0.000 0.000
Capital 0.047*** 0.045*** 0.044** 0.043**
ln(total assets) -0.001 -0.001 -0.001 -0.001
Tier-1 -0.010** -0.009** -0.009** -0.008** -0.014**
Crisis -0.001 -0.002
Interactive 0.010
Adjusted R2
0.010 0.013 0.017 0.016 0.017
F-value
(p-value)
4.342
(0.005)
3.683
(0.003)
3.445
(0.001)
3.037
(0.002)
2.862
(0.002)
N 1,044 997 997 997 997
Table 7 presents cross-sectional regression analysis for bidders. The sample of top and bottom 1%
3-day (-1,+1) bidder cumulative abnormal returns is deleted in order to control for outliers. The
dependent variable is bidder 3-day (-1,+1) cumulative abnormal returns. The independent variable
includes the dummy of relatedness, cash, ROA, growth, capital ratio, ln(total assets), tier-1, crisis, and
interactive. Interactive is calculated as the dummy of tier-1 financial advisors multiplied by the dummy
of the crisis period. The dummy equals to 1 if the deal is classified as diversification, payment is cash,
target advisors are classified as tier-1 investment banks, and bank mergers take place in the crisis
period. ROA is measured as net income to total assets. Growth (market to book ratio) is measured as
the market value of the equity to the book value of the equity. Capital is measured as total capital to
total assets. Ln(total assets) is calculated as the log of total assets. The financial data is collected from
the year end prior to the transaction in the Datastream database. White’s (1980) heteroskedasticity is
used to compute p-value. *** indicates significance at 0.01 level; ** indicates significance at 0.05 level;
* indicates significance at 0.1 level.