Embed Size (px)
Citation preview
Finance Imperialism in British IndiaProfits from Indian equity on the London Stock Exchange 1900-1930
Jens Boberg
Economic History
Masters Thesis (15 Higher Education Credits)
Supervisor: Klas Rönnbäck
Department of Economy and Society
University of Gothenburg
AbstractThe theory of finance imperialism, according to common interpretations of Hobson and
Lenin, posits that investments in formal empires should yield higher returns than
investments in the imperial metropolis and foreign countries. The aim of this study is to
test this theory on British India in the era of modern imperialism, by comparing British
Indian profits to estimates of returns in the U.K. and other parts of the world. A total
returns index is constructed, based on data from Global Financial Data and the
Investor's Monthly Manual. A guide for interpreting and using these resources is
outlined. Findings indicate that a strict interpretation of finance imperialism does not
explain British presence in India well, unless bias against industrial investments on
behalf of British finance is taken into account.

Thank you to Klas and Oskar for inviting me to participate in their research project and very patiently supporting me, giving me indispensable encouragement,tools, resources and direction.
Also, thank you Sarah for your unconditional support.
Table of ContentsI. Introduction....................................................................................................................1
I.1. Research Aims and Research Questions.................................................................2I.2. Outline....................................................................................................................2
II. Background and Theory................................................................................................3II.1. What is Imperialism?............................................................................................3II.2. Economic Theories of Imperialism.......................................................................4
The Challenge to Economic Imperialism.................................................................6A Critique of The Challenge....................................................................................8Gentlemanly Capitalism: The Economic Empire Strikes Back.............................10
II.3. British India as a Case of Imperialism................................................................11Explaining British Presence in India......................................................................11
II.4. Testing a Theory of Finance Imperialism on British India..................................14III. Previous Research......................................................................................................15
III.1. Investment in British India.................................................................................18III.2. Summary............................................................................................................19
IV. Measuring Profits.......................................................................................................20IV.1. Handling Nominal Values vs. Paid Amount.......................................................22
V. Method........................................................................................................................24V.1. Index Formula.....................................................................................................24V.2. Main Source and Sample.....................................................................................25V.3. Errors and Missing Data in the Database............................................................26
Obviously Missing Dividends................................................................................26Less Obviously Missing Dividends.......................................................................26Missing or Erroneous Number of Shares...............................................................27Missing Splits or Wrong Split Dates......................................................................27Summary of Errors in GFD and Excluded Data....................................................28
V.4. Supplemental Sources.........................................................................................29V.5. Interpreting the Underlying Sources...................................................................30
Outline of Relevant Headings and Their Meaning.................................................30Calculating Number of Shares...............................................................................33Calculating Dividends and Determining Dividend Dates......................................34Identifying GFD Series in the Underlying Sources...............................................35
VI. Results.......................................................................................................................35VI.1. Overview of the Data.........................................................................................35VI.2. Total Returns Index 1900-1930.........................................................................37
Compared to The U.K. and The World..................................................................40Compared to Earlier Studies of India.....................................................................41
VII. Discussion................................................................................................................42VII.1. Alternatives to the 'Hobson-Lenin hypothesis'.................................................45
The Interactions and Contradictions of Economic Interests..................................47VII.2. Future Research................................................................................................49
VIII. Conclusions.............................................................................................................50
I. IntroductionOn a map of the modern world, there are few borders that have not been shaped by the
struggle of empires. The expansion of European power, from the 15th to the 20th century,
left almost no place untouched. In the 19th century, the growth of industry created new
centres of power and tensions intensified. Two world wars were the culmination of a
long struggle between European states, their offshoots and rivals. The social, economic
and human consequences of this process, good and bad, have left a deep impact. To
understand modern history and the world today, we must understand imperialism.
In the study of modern empires, two questions constantly appear: what were the forces
behind imperialism and who, if anyone, benefited? In the general public today, the idea
that colonialism and imperialism were profitable to the West is often taken for granted.
A common “folk” theory, especially on the political left, assumes that colonies were
vital in establishing the prosperity of Europe and kick-started the industrial revolution.
Yet, in academia, the jury is still out. Especially concerning the imperialism of the late
19th and early 20th century, sometimes called the neo-imperialist era, finding evidence
for net benefits of imperialism has been surprisingly difficult.
Studies of this issue have generally dealt with a particular theory of finance imperialism,
based on the works of J. A. Hobson and V. I. Lenin. The 'Hobson-Lenin argument', as
commonly interpreted, holds that the 19th and 20th century push for expansion was
caused by oversaving of capital. This in turn prompted a need for new investment
opportunities. Conquering and exploiting foreign territories were means to this end.
The external validity of this theory depends on whether or not the expansion of empire
actually provided profitable investment opportunities, compared to what was available
anyway. Little research has been done on the subject, but results so far have indicated
that the empire was not very important to investors. This puts the concept of a rational
economic empire into question.
The purpose of this thesis is to expand the study of profits further into the 20th century,
to see if 19th century empire benefited investors in the long term. British India is taken
as a case of imperialism, comparing the total returns to those in the U.K. and non-
British countries in the same period. This is based on a comprehensive sample of Indian
equity, using a database of securities on the London Stock Exchange supplemented with
data taken directly from the contemporary financial press. Furthermore, the method of
1
calculating profits is aligned with modern best practices, weighted by market
capitalisation and taking both dividends and capital gains into account.
I.1. Research Aims and Research Questions
The aim of this study is to test if the theory of finance imperialism, as commonly
interpreted, is a good explanation for continued British presence in India in the 19th and
20th centuries. In pursuit of this aim, investors' profits from equity in Indian companies
traded on the London Stock Exchange are calculated in the form of a total returns index.
Due to limits and errors in the underlying data (see chapters IV-V), the time period of
the index is limited to 1900-1930. The research questions are:
• How did the rate of return from investments in India compare to investments in
the U.K. and the world during the same period? In this sense, did empire pay?
• How do the results compare to previous estimates of the relative profits from
investment in the U.K., the British Empire and the non-British world?
• To what extent is the theory of finance imperialism, as commonly interpreted, a
good explanation for continued British presence in India in the 19th and 20th
centuries?
I.2. Outline
Chapter II examines the background and theoretical underpinnings of economic theories
of imperialism, and of finance imperialism in particular. Then, the relevance of British
India to a study of finance imperialism is discussed. Finally, the theory used in this
study is defined, in the context of British India.
Chapter III looks at what previous research has to say about profits in the British
Empire, and what this implies for the theory of finance imperialism. Gaps in current
knowledge are identified.
Chapter IV contains a methodological discussion on the measure of profits in relation to
finance imperialism. Particular difficulties are detailed concerning handling equity that
is not fully paid.
Chapter V details the sources and methods used to construct a total returns index of
Indian equity. Problems with the underlying data are reported. To ensure replicability
and help future researchers, parts of this chapter can be used as a guide to reading the
old British financial press.
2
Chapter VI presents a total returns index of Indian equity on the London Stock
Exchange and sub-indices of particular economic sectors. The index is then compared to
measures of profits in other countries and previous decades.
Chapter VII discusses the meaning of these results in relation to finance imperialism,
and contrasts a few alternative theoretical interpretations. Suggestions for future
research are presented.
Chapter VIII summarises the main conclusions of the preceding discussion.
II. Background and TheoryTheories of imperialism explain the origin of empires or examine their consequences.
The theory of finance imperialism is primarily concerned with the causes of imperial
expansion, but it is quite inseparable from a particular question of effects: Did empire
pay? In other words, did the economic benefits of empires outweigh the costs, and if so,
for whom? Other than this, the consequences of empires must be left aside here. Not
because they are unimportant but because it is a subject too massive and complex to
touch upon lightly, and a thorough examination is beyond the scope of this study.
This chapter introduces the concepts of imperialism, economic imperialism and finance
imperialism. It gives a background to the present day controversy of finance
imperialism and the British presence in India. Finally, it combines these strands into a
specification of the particular theory to be tested and its applicability to British India.
II.1. What is Imperialism?
There is no uncontroversial definition of imperialism, because each theory of
imperialism has a slightly different take on what the object of inquiry is. Convention has
it that the expansionist behaviour of the great powers from the late 19th century and
early 20th century can be described as imperialist. This is sometimes called the modern
imperialist or neo-imperialist era, to separate it from European colonisation of the
Americas in the 15th century and onwards or from the growth of empires in general (e.g.
Deutsch 1974, 15).
What makes the neo-imperialist period unique? This is not easy to answer without
taking an ideological stance. One could define neo-imperialism as the era of capitalist
imperialism, which must be understood through the internal workings of states with a
developed industrial capitalist economy. However, this definition would not be
3
acceptable among the great number of theorists who believe that imperialism and
capitalism are wholly independent. One could attempt to avoid such controversy by
describing the phenomenon in very general terms, like when J. R. Kurth called
imperialism a matter of “... a great power's foreign policies toward other countries ...”
(Kurth 1974, 4–5). Such an attempt would lose sight of the historical specifics, but it
would also fail at avoiding controversy. In Lenin's famous treatise on imperialism, he
spent half a chapter deriding his rival Kautsky for calling imperialism policy (Lenin
2005, chap. 7). There is no neutral ground.
Arguably, any scientific endeavour requires a clear operationalisation of terms.
However, the larger part of the literature consulted in this study declines to do so, and
perhaps for good reason. In following this convention, the rest of this thesis will use the
term imperialism as if it refers to an imprecisely defined but objectively existing
phenomenon. This should be satisfactory, because it would be foolish to claim that the
British Empire did not exist, even if we might disagree on its meaning or nature.
However, the precise meaning of the word must be allowed to change depending on
which theory is being discussed. A meaningful understanding of the concept can only be
developed in the context of the specific theories.
II.2. Economic Theories of Imperialism
A major controversy in the study of imperialism is the question of whether or not the
expansion of empires was economic in nature. There is a wide range of non-economic
theories which explain the phenomenon on sociological or psychological grounds
instead. For example, they can see this expansion as rooted in a universal will to
dominate others when possible, or as a humanitarian project intended to spread
civilisation (Davis and Huttenback 1986, 4).
Economic theories explain imperialism in terms of the economic interests of societies or
classes, or as a consequence of particular economic systems. These theories may also
contain non-economic components, and the two sets need not contradict each other.
Still, a major current of academics have put the entire idea of economic imperialism
under attack (Stokes 1969). To understand this controversy, we must first look at the
historic roots of modern theories of economic imperialism.
Social and political scientist K. W. Deutsch divided the explanatory economic theories
into three classical schools (Deutsch 1974, 15–21). Conservative theories, primarily
endorsed by European statesmen of the 19th century, viewed imperialism as a necessity
4
to preserve the social and economic order of developed countries. In these theories, the
survival of capitalism depends on securing new markets, maintaining employment and
the export of capital. Furthermore, unrest due to unemployment at home could be
channelled towards aggression against 'lesser breeds' abroad.
Liberal theories, such as that of J. A. Hobson, also viewed the contemporary
imperialism as an issue of economic interests. However, in his theory these were
primarily the interests of certain powerful classes within the imperialist nations. The rest
of society was only burdened by the costs in lives and money caused by expansion and
war. Imperialism did not serve capitalism as a whole, only special interest groups.
Marxist theories built upon both of these schools. Like the conservatives, they viewed
imperialism as integral to capitalism, for much the same reasons. However, like the
liberals, they condemned it. The internal contradictions of capitalism placed the
developed nations in a state of decline, which had to be offset by expansion and
domination of others. In V. I. Lenin's formulation of such a theory, this too was
unsustainable, and the imperialist order would eventually undo itself, reversing the
power relations between empire and colony.
In addition to the classical schools, Deutsch mentions the various dependency schools.
While they offered little explanation for the initial causes of imperialism, they attempted
to explain the structural reasons for its continuation. According to these theories, the
existing global patterns of production and trade serve the developed countries, creating
a growing disparity in power and wealth. Unlike Lenin, dependency theorists viewed
imperialism as self-reinforcing and tended to believe that global inequality would
continue to grow stronger if no conscious action was taken against it.
Political developments of the 20th century changed the ideological connotations of the
various theoretical stances outlined by Deutsch. Anti-colonial movements were
ideologically strengthened by theories that emphasised economic benefits to the
imperialist metropoles through exploitation of the colonies. For the poor nations of the
world, blaming imperialism for their relative underdevelopment, and using it to explain
the wealth of the global North, is still an important part of arguments for reparations, aid
and debt relief. With an international community numerically dominated by former
colonies, conservative apologists for empire could hardly continue to argue for the
economic benefits of subjugating others. Instead, a defence of empire required the
reverse position, that imperialism was costly to the developed nations, while
maintaining the old idea that colonies benefited from being 'civilised'. In this way, the
5
entire imperial project could be seen as a charitable gift to the underdeveloped
countries1.
In a similar vein, the Marxist connection between imperialism and capitalism posed a
threat to the latter. This was especially true in a world were imperialism was largely
condemned, following the two world wars. In light of this, proponents of capitalism
gained a stronger interest in the aspects of the liberal position that separated capitalism
from imperialism. However, it would be even safer to cut the cord between imperialism
and economic explanations altogether. In this context, it is easy to see the political
sensitivity of economic imperialism, and why challenges to the concept would be met
with suspicion and hostility by some, and welcomed by others.
The Challenge to Economic Imperialism
According to Stokes (1969), the modern criticism of economic imperialism began to
take form in the 1940s. It was directed against what was commonly called the 'Hobson-
Lenin hypothesis', which implied that the need to export capital gave imperialist states
their impetus to expand. For example, statistical approaches to the question found no
clear connection between the volume of capital exported and late 19th century colonial
expansion. A refined form of the challenge began with the contributions of Gallagher
and Robinson (1953), who popularised the concepts of formal and informal empire.
While these authors accepted the idea that economic motives were a driving force
behind imperialism, they argued that such motives could not explain the expansion of
formal territorial control over colonies. Formal control was costly, and there were
cheaper means to increase economic power. An informal empire of debt, trade and
investment relations served economic needs just as well, and this mode of control was
preferred by the British. Formal territorial claims were a last resort, used only when
trade could not be secured by informal means.
As Stokes (1969) noted, the concept of informal empire was not a direct challenge to
Hobson or Lenin. In fact, the idea that formal and informal imperialism were two sides
of the same coin was central to Lenin's argument, if not expressed in those terms. But
Gallagher and Robinson's formulation had two important implications.
1 As an example of modern arguments along these lines, Ferguson and Schularick argue that
membership in the empire was beneficial to colonies, due to cheaper access to capital and that the
answer to poverty may be the “... importation (or imposition) of less dysfunctional economic, legal,
and political institutions.” (Ferguson and Schularick 2006, 308).
6
First, it posed a challenge to the view that the expansion of formal empire had its direct
cause in the internal politics or economy of developed capitalist countries. Instead, the
transition from informal to formal empire had to be explained by looking at the political
and social situation on the periphery. This put their theory seemingly at odds with the
Marxist view, where capitalism was an engine for imperialist conquest.
Second, the idea of formal empire as a last resort stood in sharp contrast to a view where
political control was used to greatly increase profits. For example, the latter view held
that political power could be a means to force down prices of inputs or restrict capital
investments in the colony to extract exploitative monopoly rents (Svedberg 1981, 1–10).
Others developed this line of argumentation further (e.g. Fieldhouse 1961; Davis and
Huttenback 1986; O’Brien 1988). In their understanding of the 'Hobson-Lenin
hypothesis' or 'finance imperialism', a surplus of capital in the domestic economy meant
that profitable investment became harder over time, resulting in a tendency for the rate
of profit to fall. This meant that investors had to find business opportunities abroad, to
vent the economy of its surplus capital and maintain the rate of profit. The idea behind
economic imperialism, in this sense, was to ensure higher rates of profit abroad by
opening and exploiting new areas of investment.
However, such imperialism would only make sense if profits in the formal empire were
actually higher than in independent foreign countries. Otherwise, the rate of profit could
be restored simply by investing in the other developed countries or their colonies. If
formal empire did not yield higher returns, and imposed higher costs on the imperial
metropolis, it would be economically irrational. Formal empire would not even make
sense as a last resort: as long as there were profitable investment opportunities in the
US, Europe or Latin America, there would be no need to control Africa, formal or not.
This led to a research project which, focusing on the British Empire, set out to compare
investment returns in the domestic U.K. economy, the dependent empire and the non-
British world (e.g. Davis and Huttenback 1986). If the dependent empire did not yield
the highest returns of these three, finance imperialism would be largely disproven. This
has been considered a challenge to the broader concept of economic imperialism, as
Hobson and Lenin were considered its essential representatives (see e.g. A. J. P. Taylor
1952).
A weaker form of finance imperialism was considered, where only a minority of
investors made large profits from the formal empire, while the rest of society bore the
7
costs (e.g. Davis and Huttenback 1986, 78). In this case, average profits could be lower
in the empire, but certain investors could still benefit. However, if imperial policy was
driven by these special interests, one would have to establish a clear link between these
business interests and political power. The critics of the 'Hobson-Lenin hypothesis' had
trouble establishing such a link. The actual imperial policy of Britain was contradictory,
and not apparently driven by any one particular self-interest (Davis and Huttenback
1986, 301–18). Capitalist impulses may have influenced imperialist expansion at times,
but did not seem to be the driving force.
A Critique of The Challenge
There are several problems with the challenge outlined above. According to Stokes
(1969), it relies on a caricatured version of both Hobson and Lenin, where the
importance of capital exports is overstated, especially concerning Lenin's thesis. The
'attack on economic imperialism' is only an attack on a particular interpretation of a
certain aspect of imperialist theory, perhaps even a straw man. Calling this interpretation
of economic imperialism the 'Hobson-Lenin hypothesis' or 'finance imperialism' is
misleading, because the finance imperialisms of Hobson and Lenin suggest alternative
mechanisms for expansion than a need to export capital. While a test of capital exports
patterns is a test of an important part of their theories, it is not necessarily the critical
component.
The idea of connecting a falling rate of profit to the need to export capital, and a
potential link to imperialism, can be traced back to Marx's Capital volume III (Germain
1955) and further back, to J. S. Mill (Davis and Huttenback 1986, 30–31). However,
Marx did not have a full theory of imperialism, and the various Marxist theories that
came after him rarely put this aspect front and centre (Germain 1955).
Both Hobson and Lenin suggest underconsumption as a factor in imperial expansion
(Hobson 1902, 79–91; Lenin 2005). The structure of the metropolitan economy
generates a surplus of capital, but also a surplus of commodities which cannot easily be
sold to an exploited working class. This leads to a need to export capital, but also to
open new markets for the sale of commodities. Imperialist conquests are a way to
connect new areas of the world to the capitalist economy in order to realise sales and
thereby profits.
Furthermore, Lenin (2005) defines imperialism as monopoly capitalism. The actors are
not states, but international finance, trusts and cartels, forerunners of the modern multi-
8
national corporations. Their primary means to profit is not productive investment, but
power. The main purpose of imperialism is not to directly create opportunities for
investment, but to crush rival business and maintain monopolistic profits in the
developed economies. For example, gaining monopoly control over raw materials
ensures that prices of inputs can be kept down. Access to cheap imported food means
that the working class can accept lower wages. The alternative to monopolistic control
is not free trade, but the monopolistic control by someone else.
The challenge to the 'Hobson-Lenin' thesis implicitly or explicitly assumes that finance
imperialism must be rational – not only in the sense that actors behave according to
reasonable expectations, but that those expectations must reflect real ex post profits (e.g.
see Davis and Huttenback 1986, 75–76). Investments must be profitable in the long
term, or they could not have motivated expansion.
This is not necessarily true, however, as expectations could drive expansion without
being realised. In Lenin's work, wild speculation is important. Opening new areas to
investment generates a stream of new financial assets, and financiers make profit on the
speculation on these assets. The eventual actual profitability of investments is of less
interest to them. Similarly, grabbing land in the hope of finding natural resources,
perhaps some fuel that has not yet been invented, is a motive for indiscriminate
expansion. Any land left alone is a potential foothold for rivals (Lenin 2005).
This implies that imperialist endeavours can be unprofitable, even cause losses, and yet
be rational in another sense. An important dividing issue is the specification of the
counterfactuals of not taking a territory. For Davis and Huttenback, the only loss would
be the profits potentially generated in that specific territory, which could be recovered
by investing somewhere else instead (Davis and Huttenback 1986, 77–78). For Lenin
the potential loss is monopoly power, which would hurt profits in existing industries.
It should also be noted that there are mechanisms of economic and financial imperialism
suggested by other theorists than Hobson and Lenin. For example, R. Luxemburg
proposed that capital exports to colonies was a means to generate demand for capital
goods produced in the metropolis (Lee 1971, 862).
These examples show that neither economic imperialism in a broader sense, nor the
finance imperialism of Hobson and Lenin specifically, hinge on returns from capital
exports. Nevertheless, the idea of a purely capital exports-oriented finance imperialism
remains prevalent in the minds of academics and the public. Adding to this that the
9
empirical evidence for or against narrowly defined finance imperialism is still lacking,
there is good reason to continue the research. Furthermore, while capital exports and
returns on investment may not be the definitive tests of economic imperialism, they still
play a significant part in the question Did empire pay?. This has relevance beyond
explanatory theories. Determining the benefits, or lack of benefits, from empire is
significant in its own right.
Gentlemanly Capitalism: The Economic Empire Strikes Back
The work of Cain and Hopkins (2001) provided a new economic theory of British
imperialism. It identified a class of 'gentlemanly capitalists' as the principal agents of
imperial policy. They were neither entrepreneurial industrial capitalists nor purely
aristocratic, but represented a set of financial and service interests (e.g. shipping)
centreed in the City of London. While previous researchers had found British imperial
policy contradictory and hard to identify with any particular self-interest, Cain and
Hopkins showed that it was possible to explain most of it from the perspective of this
class. Manufacturing interests sometimes got their way, and sometimes not, depending
on whether or not their interests aligned with those of finance and services at the time.
In a way, this view could be considered an updated version of Hobson's theory of
'parasitic' financiers, which he believed were pulling the strings of European politics
(Hobson 1902, 51–78). However, Cain and Hopkins held that the financial and service
sectors were vital parts of the British economy. Far more than the industrial revolution,
it was the 'gentlemanly capitalists' who had made Britain into the world centre of
investment and commerce. Instead of being a conspiracy of parasites, the well-being of
finance was deeply interconnected with British trade and represented the economic
well-being of Britain, and thus in a way the national interest. In particular, maintaining
the global dominance of sterling, and settling multi-lateral trade surpluses and deficits
was an important part of the financial use of empire (Cain and Hopkins 2001).
If the connection of imperialist policy to capitalist interests has been resurrected, this
increases the relevance of determining the motives for imperialism on the part of this
financial class. To what extent was their interest in empire driven by a will to create
profitable investment opportunities, or in other words driven by finance imperialism in
its capital exports interpretation?
10
II.3. British India as a Case of Imperialism
A large body of literature on imperialism has concerned itself with the British Empire.
This is not strange, given that it was the dominant imperial power in the 19th century2.
Yet the British Empire was not typical of the neo-imperialist era. An interpretation of
Lenin's theory places the age of imperialism in the period after 1880 (Stokes 1969),
while the British Empire had a continuity from earlier centuries. Furthermore, his theory
focused on the role of monopoly and cartels, prevalent in continental Europe and the
US, while the U.K. had a strong commitment to free trade. This makes Britain fit
uncomfortably in this model of imperialism (Cain and Hopkins 2001, 31).
Still, a theory of 19th and 20th century empire that cannot explain the British Empire
would be very weak. The exceptional structure and history of Britain does not mean that
we can ignore it in a general history of imperialism. In the same way, a history of
British imperialism cannot ignore India, just because it does not fit into any typical
pattern of colonialism (Cain and Hopkins 2001, 275). India was the archetypal symbol
of the Empire, and the experiences gained there had a strong influence on British
thought (Barber 1975).
Furthermore, if British presence in Africa was largely motivated by an interest in
controlling the routes to the East (Gallagher and Robinson 1953, 3), it is evident that
understanding India is vital to understand the Empire. In Gallagher and Robinson (1953,
15), the “deepest meaning” of British expansion in the late 19th century was to be found
in the development and exploitation of existing parts of the empire, pointing out India as
a successful example.
Explaining British Presence in India
The history of British India begins with the East India Company in the early 17th
century. Initially facing fierce competition from the already established Dutch and
Portuguese, the English soon gained military supremacy. Small territorial claims on the
Indian coast served as trading posts in a wider network of trade on the Indian Ocean. In
the 18th century, Indian opium became vital in settling the trade deficit with China. In
time, the territorial claims expanded and British India grew from a set of trading posts
to an empire spanning most of the sub-continent, still controlled by the East India
Company. In the mid 19th century, this arrangement became unmanageable and the
British Crown took formal control (Bayly 1988). Over a million square miles of land
2 Not to mention the dominance of British culture and language today, which no doubt has an impact on
researchers' areas of interest.
11
was directly controlled by Britain, with another 700 000 in the hands of the nominally
independent Princely States (Davis and Huttenback 1986, 27).
What prompted this immense territorial expansion? The Indian case is usually taken as a
typical example of the turbulent frontier hypothesis (Galbraith 1960). As the Mughal
rule of India fell apart, anarchy threatened the borders of British trading posts. To ensure
safety and order, the East India Company had to secure the borders by expanding their
territory. This created a new turbulent frontier and expansion had to continue until they
reached sea, mountains or the border of another stable state. This line of thinking goes
well with the theory of formal empire as a last resort. However, as Cain and Hopkins
(2001, 279) point out: expansion at the periphery cannot explain why there is a presence
in the first place. What made India worth the effort?
Barber (1975) shows how the 'official' explanation for British presence in India changed
over time. Representatives of the East India Company seemed to change their
arguments depending on the economic issues that were in vogue at home. He concluded
that practical realities seemed to shape economic thought just as much as economic
thought changed real policy. The interests of gentlemen in the Company significantly
impacted on the economic discourse of Britain. This demonstrates how explicit or
official reasons for imperialism cannot be taken at face value, and underwrites the
importance of exploring underlying economic (or other) interests that can influence
policy.
The turnover of power to the crown was brought on by the Indian Mutiny of 1857.
According to Cain and Hopkins (2001, 284–86), the new gentlemanly order
strengthened its influence and made India one of their important outposts. From this
point, it becomes even more urgent to ask what purpose India served for these elites,
and also for Britain.
There appears to have been several mechanisms at play. India was an important market
for both imports and exports. It also played a part in a system of complex multilateral
settlements, where Britain's trade deficit with most of the world was balanced out with a
trade surplus towards India. Shipping fees from Indian trade were likely a great
incentive for the Indian connection as well. The Indian government debt also
represented important income streams for British finance (Cain and Hopkins 2001, 275–
302). However, a critic of economic imperialism could argue that any of these functions
would be possible to maintain without incorporating India into the formal empire. Or, if
12
it could not be done with India, by trade and investment in some other part of the
world3.
On the other hand, one aspect of the British-Indian relation was clearly not possible
without control of the Indian government. The 'home charges', large transfers of money
from India to Britain, connected to administrative and military expenses, represented a
significant international money flow and were a constant drain on the Indian budget.
This constant shortage of money had put constant pressure towards expanding the
revenue from Indian agriculture, and sometimes prompted conquest of land, at least
during Company rule. In this earlier era, India was perhaps more an outpost of
feudalism than capitalism4. However, after the end of the Company, strategies to fund
the home charges were directed towards developing mining, manufacturing and public
utilities instead (Cain and Hopkins 2001, 275–302).
Capital exports from Britain were obviously vital to this development project. It is
possible that the constant lack of money in the periphery acted as a pull on capital from
the metropolis, instead of a capital surplus in the metropolis pushing for expansion. The
Indian railway stocks on the London Stock Exchange were guaranteed by the
government to yield at least 4 to 5 percent dividends5 to attract investors, which would
support this perspective. These guarantees must have been financed to a great extent by
the Indian land revenue, which was the major source of income for the Indian
government (Roy 2006, 317–18), so even the railroads could be considered an extension
of an old feudal imperialism rather than a modern capitalistic one.
However, a pull on capital initiated by the frontier does not exclude the possibility of a
push from Britain. If Cain and Hopkins are right in that finance and service interests
were increasingly dominant in directing imperial policy, it is of interest to determine the
degree by which these interests were driven by a need to find profitable investment
abroad. Testing the capital exports interpretation of finance imperialism on India is to do
precisely this.
3 O’Brien (1988) discards the relevance of the multi-lateral settlement and commodity trade arguments
for this reason. This is expanded upon in chapter VII.
4 Lenin's theory of imperialism made room for a pre-capitalist 'military and feudal imperialism' before
the era of high imperialism which he was concerned with (Stokes 1969, 298).
5 Roy (2006, 288–99) claims that the guarantee was 5%, but the sample of railway stock in this study
revealed lower guarantees, even for some non-preference shares.
13
II.4. Testing a Theory of Finance Imperialism on British India
To summarise, the narrowly defined theory of finance imperialism relies on some
flawed assumptions but remains an interesting area of inquiry due to its persistence in
the literature, a lack of empirical research and a renewed interest in the relation between
the financier class and imperialist policy. This theory, as used by Davis and Huttenback
(1986) and others, i.e. the 'common interpretation' referred to in the research aims,
forms the basis of this thesis. Following Davis and Huttenback's analytical concepts,
British investment is divided into three categories depending on its destination:
domestic (the U.K.), empire (within the formal empire) and foreign (the non-British
world, including informal empire).
The formal empire of Britain can be further subdivided into the dependent empire and
the states with 'responsible government', effectively the white settlements. The latter had
a large and growing degree of political independence, which makes them a poor test of
whether direct political control by the imperial metropolis meant higher returns6.
In this study, India is the representative of the dependent empire. To test the prevalence
of 'financial imperialism', profits from British investment in India need to be compared
to profits from the domestic U.K. and the average and/or most profitable parts of the
foreign sector. The theory holds that investors seeking high profits pushed for
imperialism, and that their expectations were rational. Ex post profits are used as an
estimate of long-term rational expectations, for two reasons. Experience from previous
investments in the empire affects future expectations and, assuming that investors are
well-informed, there should be some correspondence between expectation and reality.
Under these assumptions, marginal profits should be higher in India than in the
domestic and foreign sector, or investors could just as well invest elsewhere. Marginal
profits are hard to determine, so average profits are taken as an indirect measure (see
Davis and Huttenback 1986, 77–78).
We are only interested in the period from about 1860 and beyond. Expansion under the
East India Company must be explained by different principles, and the theories of
imperialism under discussion concern a period starting in the second half of the 19th
century, when the U.K. starts to become a significant exporter of capital (see Edelstein
1982, 17, Fig. 2.1). This is also the time when Indian stock starts to appear in the
financial press of London. For this particular study, only data from 1900 to 1930 is used
6 In any case, the political and economic role of these dominions was different enough to warrant
separate theoretical treatment, which is beyond the scope of this study.
14
(see section IV.1 and V.4). Still, this can help explain imperialism in the late 19th century
as well. Profits realised in the 20th century could be used as an estimate of the rational
expectations of profits from investments in the earlier century.
Measuring profits beyond Indian independence would also be of interest. This could
show long-term benefits of formal empire extending beyond the end of formal rule. It
could also be a test of the profitability of direct political control, seeing if profits change
after independence (Svedberg 1981). However, as India gained its independence in
1947, this is a task for future researchers.
III. Previous ResearchContemporary discussion on the comparative profits of domestic British investments
and investments in the empire is mostly based on two sources, Edelstein (1982) and
Davis and Huttenback (1986).
Edelstein is primarily concerned with comparing domestic and overseas profits between
1870 and 1913, making no demarcation of empire, formal or otherwise. He uses price,
dividend and interest data on stocks and debentures, primarily gathered from the
Investor's Monthly Manual, to produce an unweighted index of returns from both
dividends and capital gains (Edelstein 1982, 116–20). His main finding is that overseas
returns exceed domestic U.K. returns in the period (Edelstein 1982, 130). The overseas
advantage increases from 1870 to around 1900, when they begin to converge (Edelstein
1982, 145, Fig. 6.2). He also finds that overseas investment had slightly lower risk than
domestic stock and therefore that risk-adjusted profits were still higher overseas.
Suggested explanations for this difference are that overseas regions have a higher
degree of new possibilities and innovation, or greater opportunity for monopoly rents.
He also entertains the possibility that a less crude risk-adjustment would yield different
results (Edelstein 1982, 137–38).
Davis and Huttenback build upon Edelstein's work, attempting to determine the extent
to which formal political control allowed British investors to gain monopoly profits.
First, they attempt to divide Edelstein's results into domestic, empire and foreign
sectors. This shows that, while the empire was more profitable than the domestic sector,
foreign investments were the most profitable (Davis and Huttenback 1986, 80–81). This
finding indicates that exploitative political monopoly is not the explanation for higher
overseas returns. On the contrary, political control of overseas countries was associated
with lower returns, even before accounting for the costs of the empire. Exploring this
15
further, they construct three other measures of profit, using a sample of British-
controlled companies, again divided into domestic, empire and foreign. Each measure is
based on the internal accounting of the firms, using three definitions of profit: return on
all capital claims, return on adjusted book value of equity and return on price-adjusted
physical assets (Davis and Huttenback 1986, 106). None of these correspond directly to
the measure of shareholders' profit used by Edelstein.
The different methods produce different results, both in absolute levels and relative
performance of the sectors. However, there are some general trends. The empire was the
most profitable sector before 1880, but quickly fell to last place thereafter. These
initially high returns may be due to a small sample size biased towards pioneer firms in
newly opened regions (Davis and Huttenback 1986, 106–7).
After that, each sector shows a general tendency of slowly declining profits. The
domestic sector held a steady first place in profits from around 1880 to 1905. In the
1900s, empire and domestic returns converge. In the same period, empire begins to
catch up with foreign returns in two of the measures. Real returns on assets in the
empire become higher than in foreign firms after 1908. However, in each measure,
foreign returns increase sharply in the four years leading up to 1910, overtaking the
other sectors in returns on all capital claims and adjusted equity. Their conclusion is that
the formal empire was probably a “snare and a delusion” for investors after 1880 (Davis
and Huttenback 1986, 106–10). Also, pointing out that the dependent empire absorbed
less than 10% of British investment, it was unlikely to have greatly increased domestic
profit rates, unless the empire rates were very high (Davis and Huttenback 1986, 308).
Since they weren't, the empire likely didn't contribute to maintaining high profit rates at
home.
These two works have been highly influential, but the conclusions about an unprofitable
empire are exclusively based on a study of 1865-1914. In Davis and Huttenback (1986,
81–82), the sample of firms for each region and sector is quite small, as 438 firms are
taken to represent the whole world. Furthermore, firms are not sampled based on size
(ibid.), which means that a few small and insignificant firms may have been taken as
representative for large parts of the dependent empire. Using an unweighted index adds
to this problem. In any case, the conclusion is only clearly supported for the twenty
years between 1880 and 1900. What happened to returns after this?
Svedberg (1981) takes an interest in what he calls the modern colonial epoch, 'peaking'
in 1938 and ending in 1967. His study aims at testing the presence of monopoly profits
16
from investments in the British Empire, excluding the self-governing dominions of
Canada, Australia, New Zealand and South Africa. Since several colonies gained
independence in this period, he defines the region under study as Sterling LDCs (Less
Developed Countries). Unlike Davis and Huttenback, Svedberg argues that
monopolistic advantages through political control are best found by comparing the
colonies with non-British countries of similar economic development, i.e. other LDCs.
Noting that discriminatory practices in favour of national business increased gradually
after the First World War, monopolistic advantages should increase in this period
(Svedberg 1981, 7). The results support this hypothesis, showing “... much higher
returns in the colonies than in non-British countries during the colonial era proper ...”
and that “... the difference disappeared after the majority of the colonies had gained
political independence” (Svedberg 1981, 28). Furthermore, British metropolitan
investment was highly overrepresented among investors in the colonies, indicating that
political practices favouring British investment were the mechanism behind these
differences.
The profit measures have some significant methodological problems concerning the
value of capital assets, but Svedberg asserts that any systematic bias this introduces
would likely underestimate the difference between the sterling and non-sterling areas
(Svedberg 1981, 19–21). Thus, the study seems to have shown that there were
significant advantages to formal empire, at least after 1938. However, he only shows
this advantage in comparison to investing in other countries of low development. If
investors could gain higher profits from investments in the US or Europe, profits from
investments alone cannot explain imperialism. Svedberg's conclusions do not contradict
the earlier studies, except concerning Latin America, where Svedberg shows lower
returns than in the sterling area (Svedberg 1981, 29). In Edelstein's calculations, Latin
American yields were among the highest (Edelstein 1982, 123–25, Tables 5.3 & 5.4),
seemingly giving a strong advantage to informal empire over formal. Here, the relation
is inverted.
How did returns from the empire compare to investments in the rest of the world after
1913, including developed countries? This author has found no study that answers that
question directly. However, there are comparisons of investment in the U.K. with the
rest of the world in general.
Dimson, Marsh, and Staunton (2002) compile total returns indices for equity in the U.K.
and fifteen other countries between the years 1900 and 2000. However, the only British
17
dominion included is South Africa. The other indices are for the US, Canada, Japan and
a host of western European countries. Svedberg's rates of return are not comparable,
because they do not include capital gains and include returns on loan capital as well.
Grossman (2015) provides an alternative total returns index for the U.K., spanning 1869
to 1929, and compares returns to those on other continents. There is no separation
between empire and non-empire, but comparing the regions gives us some hints.
Grossman notes that dividend yields were similar across all regions, and that differences
showed themselves primarily through capital gains (Grossman 2015, 489). African
capital gains surge after 1892, remaining at the top of the weighted index thereafter.
Asian shares had the second best performance, with the majority of gains happening
after 1914. Latin America comes in third place and the more developed regions
thereafter, with the U.K. and Europe at the bottom (Grossman 2015, 481–84).
Interesting to note is that this general ranking holds true for the un-weighted indices as
well, even if all yields are significantly lower there. This suggests that differences
compared to Davis and Huttenback cannot easily be explained by their index being un-
weighted. Different samples and a later period are more likely explanations.
If Grossman is right in that less developed regions had higher returns than the
developed, and Svedberg is right in that formal empire is more profitable within the
subset of less developed countries, then formal empire would be more profitable than
informal, at least in the 20th century. Perhaps the much discussed 1870-1890 period of
low returns was a historical exception.
III.1. Investment in British India
Before the First World War, India had the largest amount of foreign investment in the
Third World. However, the investment per capita was still low. Furthermore, foreign
direct investment was a small part of India's capital. The modern sector was a small part
of the economy, and foreign investors had other means of control than direct investment
in joint stock companies. One of the dominant modes of business in India was agency
houses, which could exercise control over the economy without formal ownership,
making trade deals with independent cultivators. There were also a significant amount
of locally registered “rupee companies” controlled by non-Indians. These types of
investment and control were unlikely to show up in data on overseas investment. For
this reason, foreign investment in official numbers was easily underestimated. These
peculiarities in the Indian case meant that a large part of the modern economy could be
18
controlled by the British even though foreign control would seem relatively small by
standard measures (Twomey 2000, 117–20).
For the same reasons, a study of profits from joint stock companies in India would
capture only part of British business. A large part of investment in the empire did not
pass through the London Stock Exchange, although this share increased over time after
1860. It is difficult to say if profits from shares on the exchange are representative of
overall profits in India, but there is no obvious a priori reason for why they would not
be (O’Brien 1988, 171–72).
From the perspective of British capital exports, India played a significant but
subordinate role. Estimates of capital called up in London to India between 1865 and
1914 add up to 239 million pounds. This was 20% of capital called up from within the
empire, but only 5% of all London capital called up in the U.K., the empire and the rest
of the world. Just over half of this capital went to the Indian government, the rest to
private firms (Davis and Huttenback 1986, 40–41).
Cain and Hopkins (2001, 299–300) hold that the role of India within the imperial
system grew between 1858 and 1914, as financial and service interests increasingly
spread their influence abroad. Political control was used to safeguard remittances, and
when this was visibly accomplished, it encouraged new investment into the region.
However, it is still unclear whether or not this investment was more profitable than
investment into other regions, especially after 1914, as evidenced by the review of
research above. In other words, it is not clear whether or not investment in India was
driven by the push of finance imperialism, or by some other mechanism.
III.2. Summary
Previous research on the profitability of the British Empire relative to domestic and
foreign investment has produced inconclusive results. The seminal study by Davis and
Huttenback (1986) indicated low relative profits, but this is seemingly contradicted by
other studies. The reasons behind these differences are not entirely clear. Furthermore,
the various studies have significant gaps in terms of geography and periodicity.
Constructing a more comprehensive profit measure for India can be a step in the
direction of filling these gaps.
19
IV. Measuring ProfitsBefore specifying the methods and sources used in this study, the methodological issue
of how to measure profits must be discussed. The choice of sources is informed by the
choice of profit measure, which must be put in context before introducing the data in
more detail in the next chapter.
There are many valid ways to calculate profits, each with its own theoretical
underpinnings. Ultimately, the choice of method depends on what questions you seek to
answer, and whose perspective you take. For the purposes of this study, the focus is on
the investors' perspective, because it is supposedly their hunt for profits which drives
finance imperialism. Furthermore, it is the relative rates of return that are interesting, as
an indirect measure of marginal rates of return, and thus the allure of formal empire.
This means looking at how much money investors earned per pound invested on the
stock exchange.
Taking this perspective has its limitations, and there are many things that these returns
cannot tell us. For example, it is not a measure of productivity, nor of monopoly or
exploitation of India. High profits may come from any or all of these sources, but this is
arguably irrelevant to the investor, and therefore to the questions posed in this study. For
the question of the political economy of imperialism, it is primarily the size of financial
returns that matters (Davis and Huttenback 1986, 33–34).
Determining the full benefit to the investor requires looking at both dividends and
changes in price. Furthermore, the component equities in an index must be
arithmetically weighted according to their market value. Total profits should be
reinvested in the index, giving dividends the same function as profits retained in the
company. Furthermore, the selection of securities must be representative of the stock
market at the start of each period. Otherwise, it will be biased towards shares that
'survived'. In following all of these principles, the index will represent an investment
strategy that was possible at the time, and its value will represent the actual profits made
by an investor following this strategy (Dimson, Marsh, and Staunton 2002, 34–36). To
make the index values meaningful, they are converted to real terms using an index of
price inflation.
This gives a financial total returns index. There are many potential issues with taking
such an approach to compare imperial states with their subjects, as outlined by Davis
and Huttenback (1986, 79–80). First of all, in a functioning equity market, securities of
20
equal risk should theoretically equalise their financial rate of return over time. As
demand is higher for securities with more dividends, their prices rise until dividend per
price is equal to that of other shares.
By including capital gains in the index used, this problem could be avoided, because
any increase in price that would equalise dividend returns would simultaneously
increase total returns. For this to work, though, it is important that the initial price in the
index is the emission price, so that the whole history of price changes is captured.
Otherwise, an initial 'equalisation' might be lost, and total returns underestimated.
The extent of this problem in relation to the data at hand can be estimated by comparing
the first price observation of each security used in this study with the nominal (or, when
applicable, 'paid') value of that security. A sample of 30 equities, weighted by market
capitalisation, show an initial price-to-nominal ratio of 3.18 in the first observation.
However, for many shares this includes gains from before 1900, which would be
captured by indices of earlier decades. Excluding a significant outlier where this is the
case, the ratio is reduced to 1.25 instead. This may be a problem, and future researchers
should perhaps add an initial price observation equal to the emission price before the
first documented market price. However, this would be an unconventional measure and
decrease comparability with other total returns indices that have not performed this
correction. Furthermore, it would require knowing the emission date to avoid including
capital gains from earlier periods. Such a data collection effort, with potentially little to
no impact, is beyond the means of this project.
Another potential problem is that the measure of profits applied here does not take
manager remuneration into account. Majority stock-holders may have earned benefits
beyond dividends and capital gains if they took management positions, which could
have motivated investment. If direct British ownership was easier to secure in the
dependent empire than in foreign countries, manager remuneration could have been
higher in India than elsewhere. However, Davis and Huttenback (1986, 82–83) found no
apparent difference between locations of investment when using alternative measures of
profits. This indicates that management remuneration was as high outside the empire.
The difference between direct and portfolio investment can be important in other ways,
but seems irrelevant for this study.
A further issue is that using total returns introduces the problem of fictitious capital.
Share prices do not only reflect profits made from the activity of the enterprise, but also
speculation on future changes in share prices themselves. From the perspective of
21
investors, 'fictitious capital' has very real value while it lasts, but it makes returns highly
volatile. Over a long enough time span, the booms and busts should cancel each other
out, and the underlying 'real' profits can be compared. The 31-year perspective used in
this study may not be enough to avoid this problem, and the end-year of 1930 is
especially problematic; 1931 had the largest negative returns in the world stock market
of the 20th century (Dimson, Marsh, and Staunton 2002, 314). If profits were higher in
one equity market than in another during the period studied here, the roles may have
been reversed in the crash. Results for the period 1900-1928 and year-by-year data for
the entire period will also be presented and discussed for this reason.
IV.1. Handling Nominal Values vs. Paid Amount
In the 19th century, the institutions surrounding joint stock companies were young,
controversial and quickly evolving. A peculiarity of British shares from this period and
the early 20th century is that many were partly paid7. When initially sold, investors paid
one amount (the paid value) but had an obligation to pay more if the company called for
it, up to the nominal (or par) value. This obligation was transferred with the ownership
of shares. If extra capital was called for, the registered paid value increased, and the
shareholders' obligations decreased. But as long as the paid value was lower than the
nominal value, shareholders were effectively in debt to the company. As the nominal
value was sometimes very high, investors could be considered to have de facto
unlimited liability (J. Taylor 2006).
The widespread prevalence of partly paid shares produces a number of theoretical and
practical problems. First of all, this practice makes these shares qualitatively different
from modern common equity. It is not given that they can be expected to function
according to current theories of equity markets, or that direct comparisons to modern
equity shares are meaningful. If ownership of a share comes with an obligation of future
payment, but at an unknown time, how does this affect perceived risks and pricing for
the investor?
Even if this problem is overlooked, the impact of changing amounts of paid capital on
the price of shares cannot be ignored. As the amount paid increases, the amount of
capital in the company increases and investors' obligations for future payments
decrease. Furthermore, dividend payments are often percentage values on the amount
paid, so expected dividends increase. A glance at the relation between price and amount
7 Grossman (2015, 488) shows that a large amount of equity was still partly paid well into the 20th
century. However, this was rare after 1900 in the sample used in this study.
22
paid in the contemporary London financial press (Course of the Exchange and
Investor's Monthly Manual, see below) indicates that a change in amount paid tends to
cause an equal absolute change in price. Given that amount paid can increase tenfold or
more, causing a corresponding change in price, constructing a total returns index
without correcting for changing amounts paid would overstate returns immensely. The
investors would seem to have increased the value of their investment ten times, while
their net wealth has actually not changed at all.
Previous researchers have handled this issue in different ways. Edelstein excludes all
“discounted shares”, either entirely or from years where they would affect yields
(Edelstein 1982, 116). This may introduce bias unless the composition of partly paid
shares is very similar to the set of fully paid. Dimson, Marsh, and Staunton (2002, 299–
300) corrected their data for “capital changes”, which likely includes changing paid
values.
Unfortunately, the main source used for share prices (Global Financial Data, see below)
does not contain useful information on paid values. Some shares have the amount paid
in the name, but there is no regular data on changes in amount paid over time, which is
all that matters for an index of this type. To fully correct for amount paid, one would
need to know the amount at every price observation. At each such observation, one
would have to subtract the change in paid from the change in price since the last
observation. Given that investors seem to have treated amount paid as having a direct
impact on the value of shares, this would correct the issue.
Course of The Exchange and Investor's Monthly Manual contain the necessary data, on
a daily or monthly basis. However, due to time constraints at the archive, data on
amount paid could not be systematically collected for all securities in this study. Instead,
only shares that were fully paid or were observed to have unchanging paid values at all
observations were included. Unfortunately, this meant that all data from the 19th century
had to be excluded, because unchanging paid values could not be confirmed. This, in
turn, excluded all extra data collected from the Course of The Exchange and The Stock
Exchange Yearbook from the index. For the period of 1900 and beyond, only the first
three years of a single security had to be excluded.
23
V. MethodThis chapter presents the sources and methods applied in the construction of a total
returns index for Indian equity, along with potential sources of error and bias.
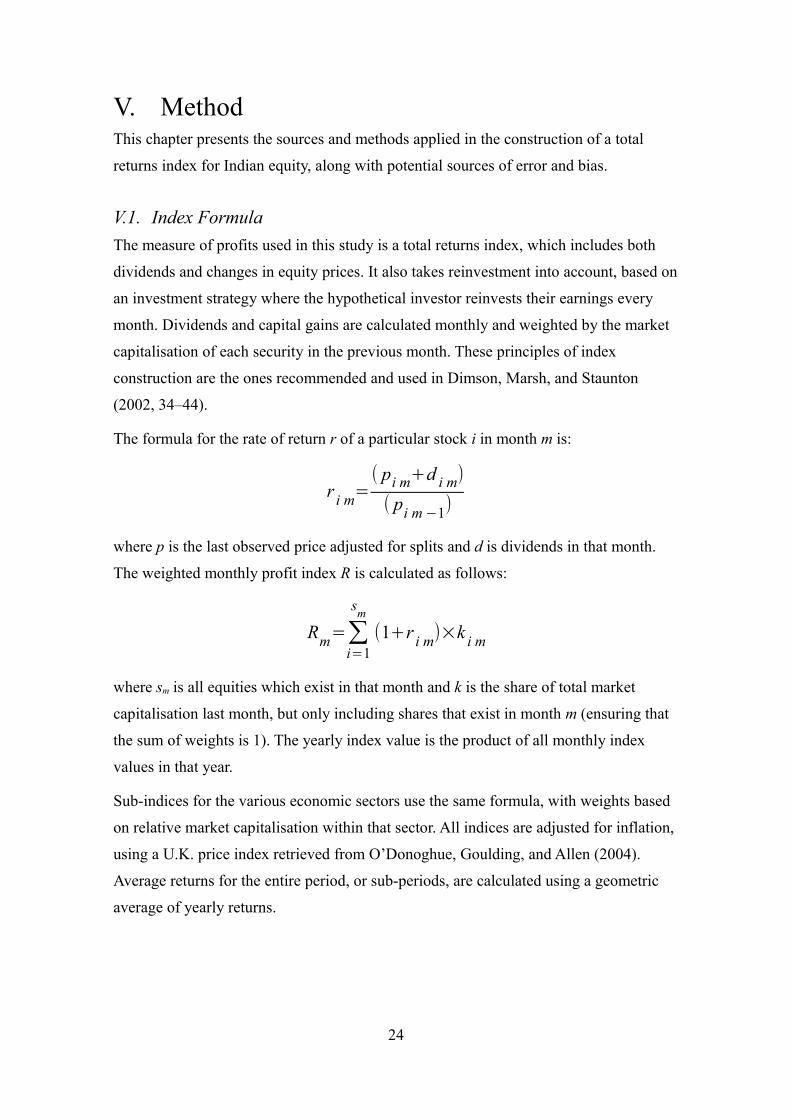
V.1. Index Formula
The measure of profits used in this study is a total returns index, which includes both
dividends and changes in equity prices. It also takes reinvestment into account, based on
an investment strategy where the hypothetical investor reinvests their earnings every
month. Dividends and capital gains are calculated monthly and weighted by the market
capitalisation of each security in the previous month. These principles of index
construction are the ones recommended and used in Dimson, Marsh, and Staunton
(2002, 34–44).
The formula for the rate of return r of a particular stock i in month m is:
r i m=( pi m+d i m)
( pi m −1)
where p is the last observed price adjusted for splits and d is dividends in that month.
The weighted monthly profit index R is calculated as follows:
Rm=∑i=1
sm
(1+r i m)×k i m
where sm is all equities which exist in that month and k is the share of total market
capitalisation last month, but only including shares that exist in month m (ensuring that
the sum of weights is 1). The yearly index value is the product of all monthly index
values in that year.
Sub-indices for the various economic sectors use the same formula, with weights based
on relative market capitalisation within that sector. All indices are adjusted for inflation,
using a U.K. price index retrieved from O’Donoghue, Goulding, and Allen (2004).
Average returns for the entire period, or sub-periods, are calculated using a geometric
average of yearly returns.
24
V.2. Main Source and Sample
The main source of equity data is the Global Financial Data (GFD) database of shares
from the London Stock Exchange, which (in theory) contains data on prices, amount of
shares, dividends and splits for all listed shares since 1693 that have appeared in any of
a range of contemporary financial publications. The main advantage of this data is that
it includes a large number of price observations for a large number of securities, at least
from the mid 19th century and onwards. Data on a similar scale would have been
impossible to collect manually within the framework of this study.
The sample of equities includes all items in the database categorised under 'India' and
'equities'. This includes not only common stock, but also preference shares, a small
number of convertible debentures and other varieties. This is because it was hard to
reliably make a more detailed division. The sub-categorisation of Indian stock in the
GFD database appears dubious, since the assigned categories are sometimes
contradicted by the names of the series or information in the primary sources. This
means that the index is composed of shares that are, on average, less risky than ordinary
stock. The dominance of railway shares with government guarantees reduces risk
further.
The inclusion of all 'India' stock causes some problems. The division of British
companies in India into the 'United Kingdom' or 'India' categories in the database seems
quite arbitrary, sometimes including different share series of the same company in
different categories. Nevertheless, no practical way to reliably recategorise U.K.
companies operating in India as Indian was found. Even when obvious cases of Indian
companies categorised as U.K. companies were found by chance, they were excluded,
in order to retain a systematic foundation for the sample. This has likely biased the
sample against companies where national boundaries were not clear. For example,
shipping companies are almost completely absent.
Including all 'India' stock available produces a sample that is not random, but that
should still be representative of Indian shares on the London Stock Exchange, apart
from the problems already stated. One other possible issue is that the selection might be
biased against small and less successful companies that were not reported on much in
the financial press. These may be less prevalent in the GFD database, and the exclusion
of companies where problematic data could not be verified might increase this problem.
However, small companies would not have a significant impact on an index weighted
25
by market capitalisation anyway and availability of data in the financial press might be
an indication of importance and size.
Finally, the sample includes shares of companies operating in the Princely States, as
made apparent by share names referencing Travancore, Mysore and so on. On the other
hand, many companies categorised as operating in modern day Pakistan or Bangladesh
were excluded by only using the India category, even if they were part of British India
in the time period under study. The latter issue could have been avoided by including
shares from those countries, but this was not done, as a convenient way to limit the
scope of the study to a manageable sample size.
V.3. Errors and Missing Data in the Database
Apart from the issues with categorisation outlined above, several issues with the GFD
data were found during the process of data-checking. To construct a capital weighted
total returns index, one needs (at a minimum) data on prices, dividends, number of
shares and splits. For all of these types of data, there were significant issues in the GFD
database. Below is an outline of these issues and how they were handled.
Obviously Missing Dividends
For a large number of shares in the database the data on dividends only specified dates,
but no money amount. The reasons for this are unknown, but an educated guess (based
on a study of the primary sources) is that many equities had dividend specifications
which were hard to interpret, because of archaic methods of presenting them in the
primary sources. To correct this, the primary sources of the database were used to fill in
the gaps. This is explained further in section V.5. Practically all of these gaps were
filled, so this issue should have no effect on the results.
Less Obviously Missing Dividends
For other equities, there was no dividend data at all. An initial sampling of such equities
showed that this did not necessarily indicate that there were no dividends. More often
than not, the primary sources revealed dividend data.
There were also equities with sparse or abruptly halting dividends, but relatively stable
prices, which caused suspicion. In this case, the primary sources often revealed
dividends that had not been included in the database.
26
This prompted a full check of dividends on all included equities in the primary sources,
revealing further missing dividends in the database. As supplemental dividend data has
been collected, this issue should be completely resolved. However, this serves as a
warning to future users of the database. The extent of missing data is hard to determine
using the GFD database alone.
Missing or Erroneous Number of Shares
For some equities, the number of shares were missing for some or all years. Again, this
information was available in the primary sources8.
A more devious issue was that, for many equities, the number of shares recorded by
GFD was off by up to a factor of 100. Without correcting for this, the companies with
these errors would have completely dominated the index. The errors were due to an
oversight, where number of shares was mixed up with nominal capital issued, since the
same column in the Investor's Monthly Manual could interchangeably use one or the
other.
Missing Splits or Wrong Split Dates
Perhaps the most problematic potential source of errors in the GFD data was missing
splits. If price changes are taken at face value, without correcting for these splits, returns
may be severely over- or understated. In other cases, the split date was recorded by
GFD without a split ratio and/or the date was set to the 15th of the month regardless of
the actual date.
Correcting for this required some educated guesswork, since collecting corrected split
data from the primary sources was not possible within the framework of this study9.
However, splits can be imputed using apparent changes in number of shares and
nominal value of shares combined with sudden changes in price.
Completely missing splits being an 'unknown unknown' in this case, it is hard to be sure
that the problems have been completely fixed. But using the hints described above, it is
unlikely that any significant reverse splits occurred outside of the ones noted, as these
would have caused an obvious and suspicious spike in returns. However, a forward split
combined with new emissions, causing nominal capital per share and number of shares
8 Edelstein (1982, 120–21) points to errors in the financial press data for market capitalisation and
number of shares. He avoids using this data to make a weighted index, arguing it would be too risky
due to his small sample. The sample is larger here, and the impact of a single error smaller.
9 Such information should be available in the Stock Exchange Yearbook.
27
to change at different ratios, would be hard to detect or correct for using the data
available in this project. Missing or infrequent data on number of shares can also make
splits hard to spot. Using too much guesswork would risk 'correcting' a price change
that was an actual sudden change in price not caused by an underlying split. Some
equities, where a split of some sort had obviously occurred but its ratio could not be
decided had to be excluded from the index. Any remaining problems of this kind could
produce a downward bias in the index.
Summary of Errors in GFD and Excluded Data
Table 1 gives an overview of missing data in the GFD material, and the number of
series excluded because of missing or problematic data. Categories A and B include
only errors that could be corrected using the Investor's Monthly Manual10. A large part
of category A consists of shares where only dates for dividends were available, and no
amounts. There were also many shares where GFD had no dividend data at all, yet
existing dividends could be confirmed. The most common error in category B was that
the number of shares had been confused with nominal amount of capital.
Shares excluded from the index had an estimated market capitalisation of 1-11% of all
shares, with an average of below 6%. This was calculated using available GFD data on
price and number of shares, with corrections for the latter imputed based on the
consistent mistake of overvaluing number of railroad shares by 100, as described above.
This indicates that the exclusion of these problematic shares, even if biased in some
direction, likely has a very small impact on the results.
10 The full extent of errors found 1860-1930 can be found in Appendix 2, using data from Course of the
Exchange and the Stock Exchange Yearbook as well. Only errors from 1900-1930 are reported here.
28
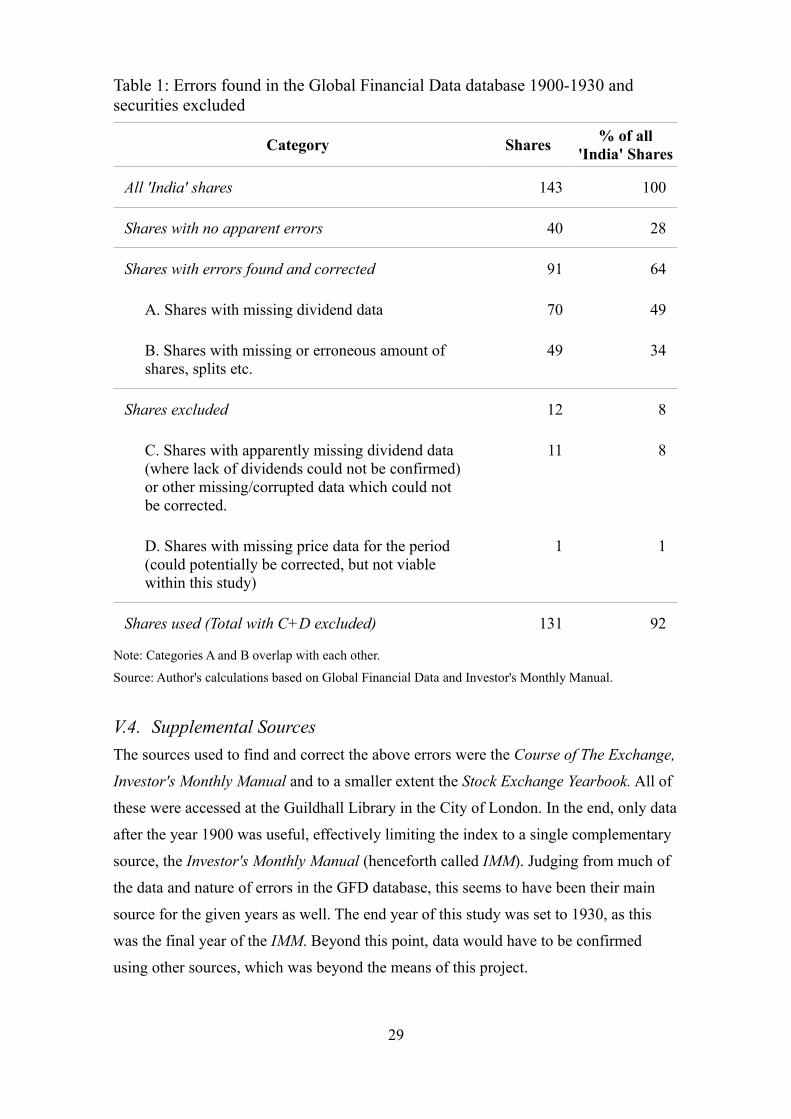
Table 1: Errors found in the Global Financial Data database 1900-1930 and securities excluded
Category Shares% of all
'India' Shares
All 'India' shares 143 100
Shares with no apparent errors 40 28
Shares with errors found and corrected 91 64
A. Shares with missing dividend data 70 49
B. Shares with missing or erroneous amount of shares, splits etc.
49 34
Shares excluded 12 8
C. Shares with apparently missing dividend data (where lack of dividends could not be confirmed) or other missing/corrupted data which could not be corrected.
11 8
D. Shares with missing price data for the period (could potentially be corrected, but not viable within this study)
1 1
Shares used (Total with C+D excluded) 131 92
Note: Categories A and B overlap with each other.
Source: Author's calculations based on Global Financial Data and Investor's Monthly Manual.
V.4. Supplemental Sources
The sources used to find and correct the above errors were the Course of The Exchange,
Investor's Monthly Manual and to a smaller extent the Stock Exchange Yearbook. All of
these were accessed at the Guildhall Library in the City of London. In the end, only data
after the year 1900 was useful, effectively limiting the index to a single complementary
source, the Investor's Monthly Manual (henceforth called IMM). Judging from much of
the data and nature of errors in the GFD database, this seems to have been their main
source for the given years as well. The end year of this study was set to 1930, as this
was the final year of the IMM. Beyond this point, data would have to be confirmed
using other sources, which was beyond the means of this project.
29
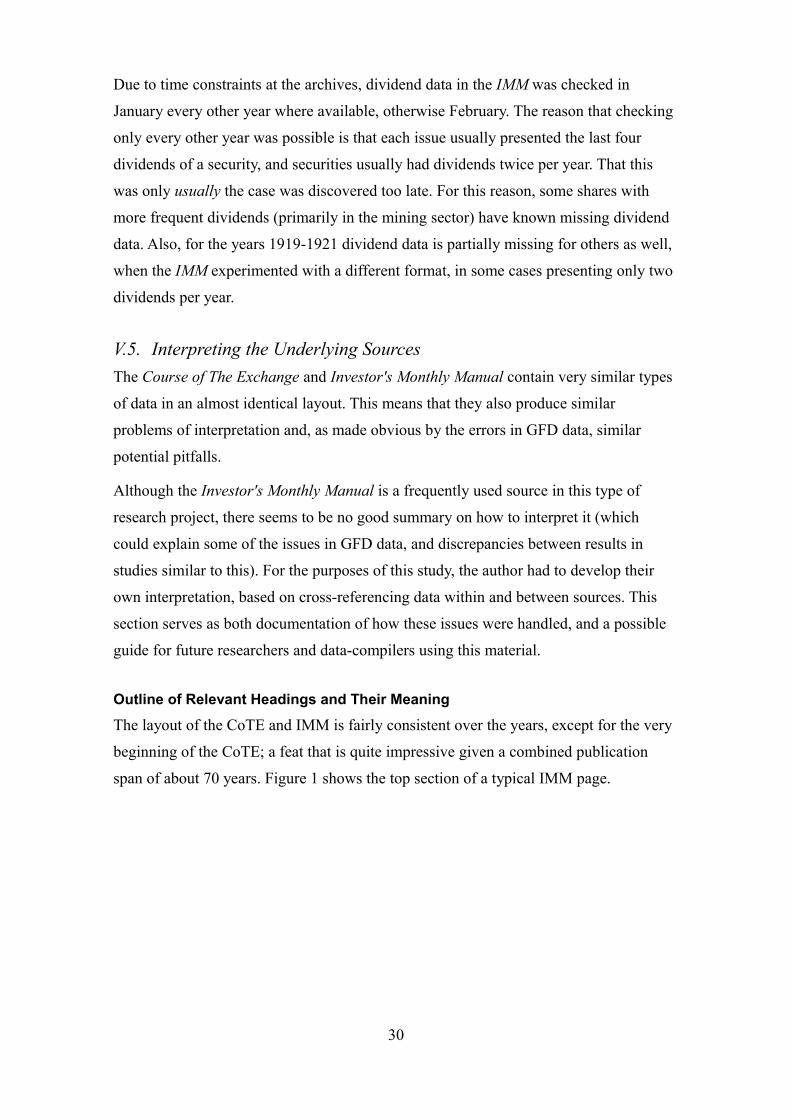
Due to time constraints at the archives, dividend data in the IMM was checked in
January every other year where available, otherwise February. The reason that checking
only every other year was possible is that each issue usually presented the last four
dividends of a security, and securities usually had dividends twice per year. That this
was only usually the case was discovered too late. For this reason, some shares with
more frequent dividends (primarily in the mining sector) have known missing dividend
data. Also, for the years 1919-1921 dividend data is partially missing for others as well,
when the IMM experimented with a different format, in some cases presenting only two
dividends per year.
V.5. Interpreting the Underlying Sources
The Course of The Exchange and Investor's Monthly Manual contain very similar types
of data in an almost identical layout. This means that they also produce similar
problems of interpretation and, as made obvious by the errors in GFD data, similar
potential pitfalls.
Although the Investor's Monthly Manual is a frequently used source in this type of
research project, there seems to be no good summary on how to interpret it (which
could explain some of the issues in GFD data, and discrepancies between results in
studies similar to this). For the purposes of this study, the author had to develop their
own interpretation, based on cross-referencing data within and between sources. This
section serves as both documentation of how these issues were handled, and a possible
guide for future researchers and data-compilers using this material.
Outline of Relevant Headings and Their Meaning
The layout of the CoTE and IMM is fairly consistent over the years, except for the very
beginning of the CoTE; a feat that is quite impressive given a combined publication
span of about 70 years. Figure 1 shows the top section of a typical IMM page.
30
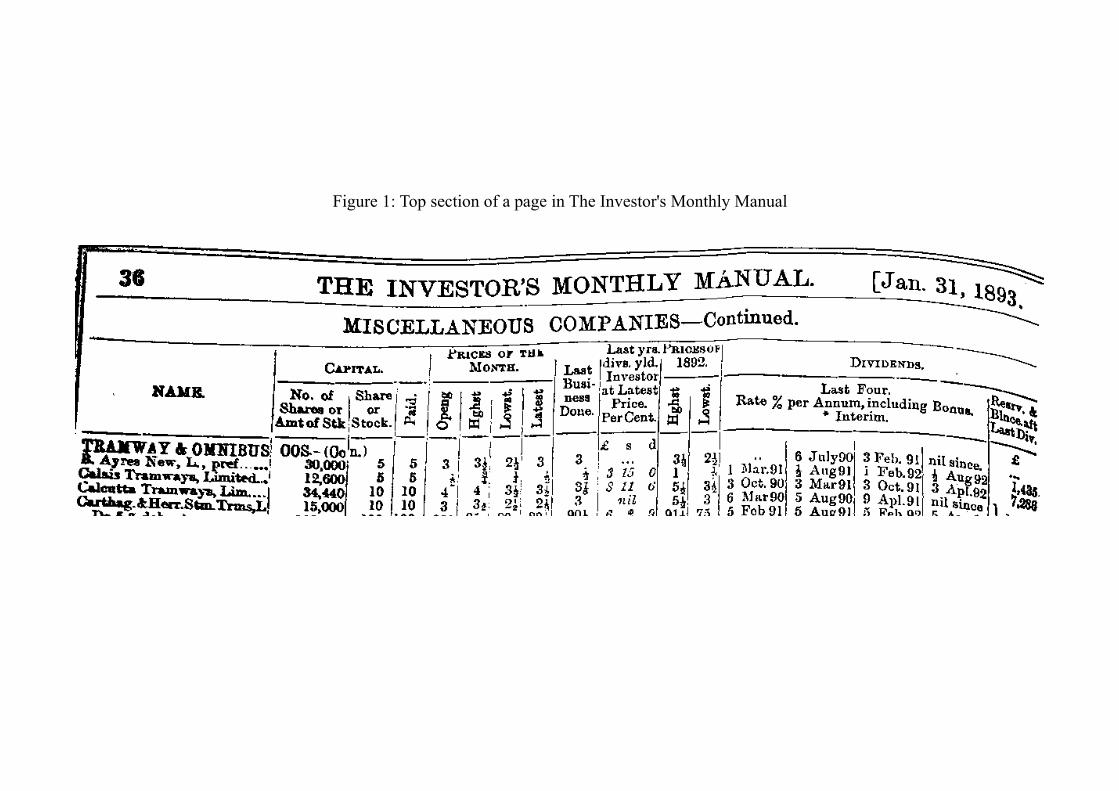
Figure 1: Top section of a page in The Investor's Monthly Manual
It is important to note that the headings change between sections even within a
particular issue of the publication, so one must carefully read the headings on each page
and section from which data is retrieved. Each row represents a security, and the
relevant headings should be interpreted as follows11:
1. Name. Note that this is not a unique identifier for a security, and that old and
new issues may have the same name.
2. Capital.
a) Number of Shares or Amount of Stock. If a cell in this row contains only a
number, it is the number of shares. If, however, the cell obviously contains a
monetary amount (e.g. contains a £ or l. sign) the cell describes the total
nominal value of all shares. Note that in some sections, this sub-heading is
Subscribed instead. In those cases, the cells always contain the nominal
value, not the number of shares, even if there is no pound sign. Also, this
column contains the nominal value if the content of the next column is the
word 'Stock' instead of a number.
b) Share or Stock. This is the nominal value of each share. In some cases, there
is no number, only the word 'Stock'. In these cases, the nominal value is
determined by the Paid column, which is always 100 for these shares.
c) Paid. This column describes the amount that investors have actually paid per
share to the company so far. It tends to increase over time, eventually
reaching fully paid shares (where paid equals nominal value), but can also
decrease, implying capital being paid back to investors.
3. Prices of the month. These are the opening, highest, lowest and latest prices per
share of the month.
4. Last year's dividend yield. Investor at Latest Price. Per cent. This is the total
dividends of last year divided by current latest price, but expressed in £sd
(pound, shilling, pence) percent. Note that 'last year' does not mean dividends
paid out in that year, but dividends paid out from business in that year. Typically,
dividend payments lag half a year behind the end of the period they are 'for'. For
example, half-year dividends paid out in December 1900 or January 1901
typically belong to the first half of 1900.
11 Much of this may seem obvious to researchers experienced in the field, but this large amount of
implicit knowledge can apparently cause problems.
32
The first sub-column are the full percentage points, the second are shilling
percentage points (1/20% or 0.05%) and the third are pence percentage points
(1/240%). For this study, these numbers were used to double-check data, and
were not used directly.
5. Dividends. Last four. Rate per Cent per annum. These are the latest dividends of
the security, and can be expressed in a variety of ways. Normally, the first
number is the amount paid as dividends, which is followed by the abbreviation
for the month and year of payment. When the heading says “per annum”, the
dividend amount is expressed as an annual percentage value on the Paid amount
by default. 'Annual' means that, if the share has more than one dividend per year,
the actual value of each dividend must be divided by the number of dividends
that year (usually 2). Some headings say “per annum, except where marked %”
or “per annum, including bonus, except where marked %”. The exception refers
to the per annum part, not the bonus. When a dividend is not per annum, the
percentage value times the Paid amount is the actual dividend.
In other cases, the dividends are not expressed as percentage values at all. This is
made evident by them being displayed in £sd (pound-shilling-pence) format.12
Unlike the Last year's dividend heading, this is not pound-shilling-pence-
percent, but absolute values.
For some shares, especially in later years, individual dividends are not reported.
Instead, a percentage value and year is specified, e.g. “30% for 18”. The year is
not when dividends were actually paid out, as discussed above. Dividends 'for
18' are typically paid out at the end of 1918 and mid-way through 1919, for
example. 30% would mean that the two dividends add up to 30% of the Paid
amount. Knowledge of this helps in avoiding duplicate dividends.
Calculating Number of Shares
The sub-headings Number of Shares or Amount of Stock and Subscribed apparently
caused confusion for GFD data collectors. The numbers in the primary sources are quite
consistently interpreted as number of shares, even when the number is a sterling
amount, at least for Indian railway shares. This is partially explained by these shares
having the non-standard sub-heading Subscribed in Investor's Monthly Manual, which
12 You identify the £sd format by the presence of one of the following symbols: l, d, s or /. For example,
4/3 is not four thirds of a percent, but 4 shillings and 3 pence. Fractions are always represented by
horisontal fraction lines in these sources.
33
indicates that the column contains sterling amounts even if the numbers have no pound
sign. However, the issue also exists for GFD data apparently compiled from Course of
The Exchange.
When there is only an amount of stock available, the correct way to calculate the
number of shares is to divide the amount of stock by the nominal value (or paid value, if
the column for nominal value only says 'Stock'). Given that many railway shares have a
paid value of £100, not following this procedure overstates the number of shares, and
thus the market value and index weight, of these companies by a factor of 100.
Calculating Dividends and Determining Dividend Dates
The first step to correctly calculating dividends is to correctly interpret the source
numbers as either an absolute £sd amount, a regular percentage or an annual percentage,
as explained in the outline of headings. Absolute £sd amounts can be directly converted
to decimal pounds. Percentages are calculated using Paid values, not nominal values.
Annual percentage dividends need to be divided by the number of dividends that the
company has or will have that year.
Sometimes, Investor's Monthly Manual aggregates dividends on an annual basis, even
when there are several smaller dividends in a year.13 These were made into half-yearly
or more frequent dividends using dividend dates gathered from GFD, or imputed dates
following an earlier and/or subsequent pattern for that company. Where the value of one
half-yearly dividend was known, the remainder of the full yearly dividend was placed in
the other. In years where the value of no individual dividend was known, the fractions
for the half-year and end-of-year dividend were taken from previous years, if a pattern
had been established. If there was no clear pattern, dividends were split equally over the
known dividend dates of that year. Where no date could be found or imputed, the
payment was placed on December 31st of that year.
The validity of these calculations and imputations was established by double-checking
the data with the Last years dividend yield field. Based on non-imputed absolute
dividend data, this field was confirmed to be calculated based on dividends from the last
calendar year and the Last price. The data can be checked by simply adding up all
dividends in the last calendar year and divide by the value of the Last price field. This
13 It might be wiser to use another source, such as The Stock Exchange Yearbook for dividends, as it
tends to clearly state each individual previous dividend in absolute terms for a number of years back.
However, as information is spread out over a much larger number of pages, this would take
significantly more time to compile.
34
should match the Last years dividend yield, converted into a decimal percentage. For all
cases checked in this study, these numbers matched.
Identifying GFD Series in the Underlying Sources
Combining GFD data with the supplemental sources requires identification of each
GFD security with one in the financial press. This is sometimes difficult, as names may
not match precisely. Companies with many similarly named series of shares are
especially hard to match, for this reason. When a company changes its name, GFD tends
to name the entire series after the new name. Furthermore, some names are switched
around in the database, or different series that don't belong together are combined into
one. For this reason, prices and dividends were also used to identify GFD shares in the
IMM. This is not foolproof, and a potential source of error.
VI. ResultsThis chapter begins with an overview of the data collected and used. Then, the total
returns index for India and sub-indices for economic sectors are presented and
compared to data from the U.K. and other countries, and to previous research on empire
profits.
VI.1. Overview of the Data
The final sample includes 27 266 observations of either monthly prices, dividends or
splits. This is spread over 131 securities, some of which are share variants from the
same company. Companies are divided into 7 sectors, as categorised in GFD data, plus a
group of companies which where not categorised. The distribution of securities over
sectors and periods is given by Table 2. There is a wide range of companies present for
the entire period, except for August and beyond in 1914 when GFD data was
particularly scarce and only 11 shares were observed. There is no such problem for the
first half of 1914, so data from that year is still useful.
35
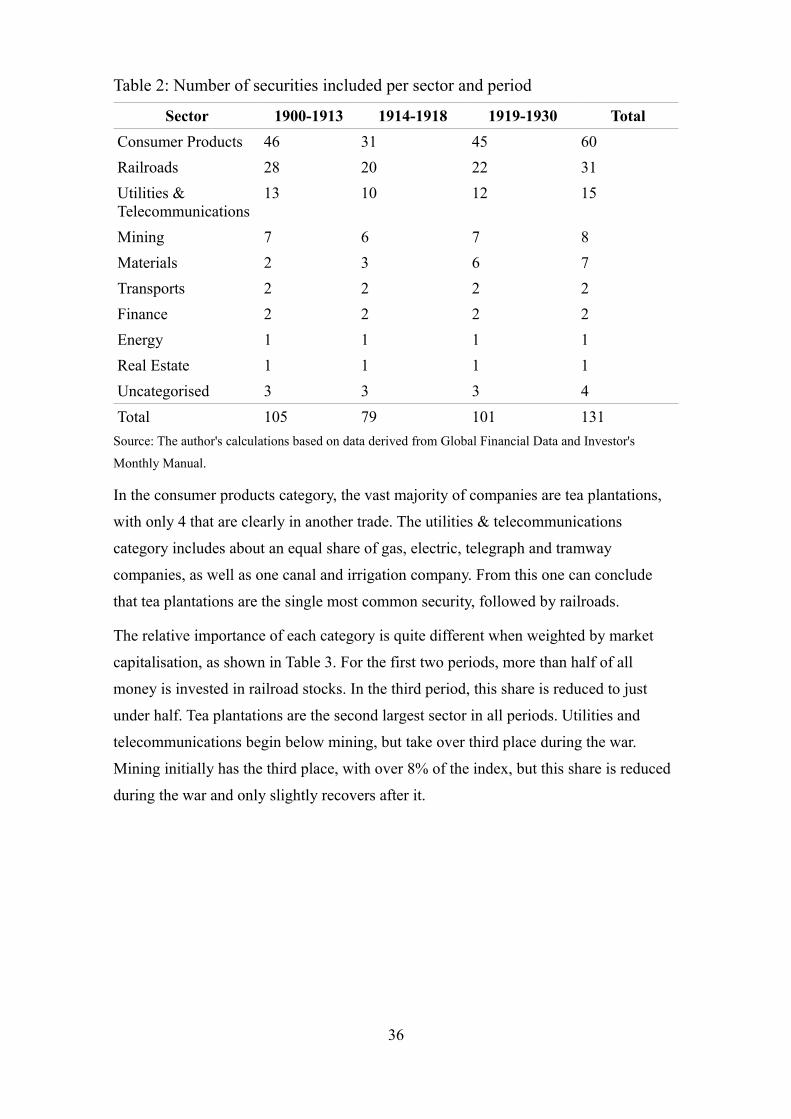
Table 2: Number of securities included per sector and period
Sector 1900-1913 1914-1918 1919-1930 Total
Consumer Products 46 31 45 60
Railroads 28 20 22 31
Utilities & Telecommunications
13 10 12 15
Mining 7 6 7 8
Materials 2 3 6 7
Transports 2 2 2 2
Finance 2 2 2 2
Energy 1 1 1 1
Real Estate 1 1 1 1
Uncategorised 3 3 3 4
Total 105 79 101 131
Source: The author's calculations based on data derived from Global Financial Data and Investor's
Monthly Manual.
In the consumer products category, the vast majority of companies are tea plantations,
with only 4 that are clearly in another trade. The utilities & telecommunications
category includes about an equal share of gas, electric, telegraph and tramway
companies, as well as one canal and irrigation company. From this one can conclude
that tea plantations are the single most common security, followed by railroads.
The relative importance of each category is quite different when weighted by market
capitalisation, as shown in Table 3. For the first two periods, more than half of all
money is invested in railroad stocks. In the third period, this share is reduced to just
under half. Tea plantations are the second largest sector in all periods. Utilities and
telecommunications begin below mining, but take over third place during the war.
Mining initially has the third place, with over 8% of the index, but this share is reduced
during the war and only slightly recovers after it.
36
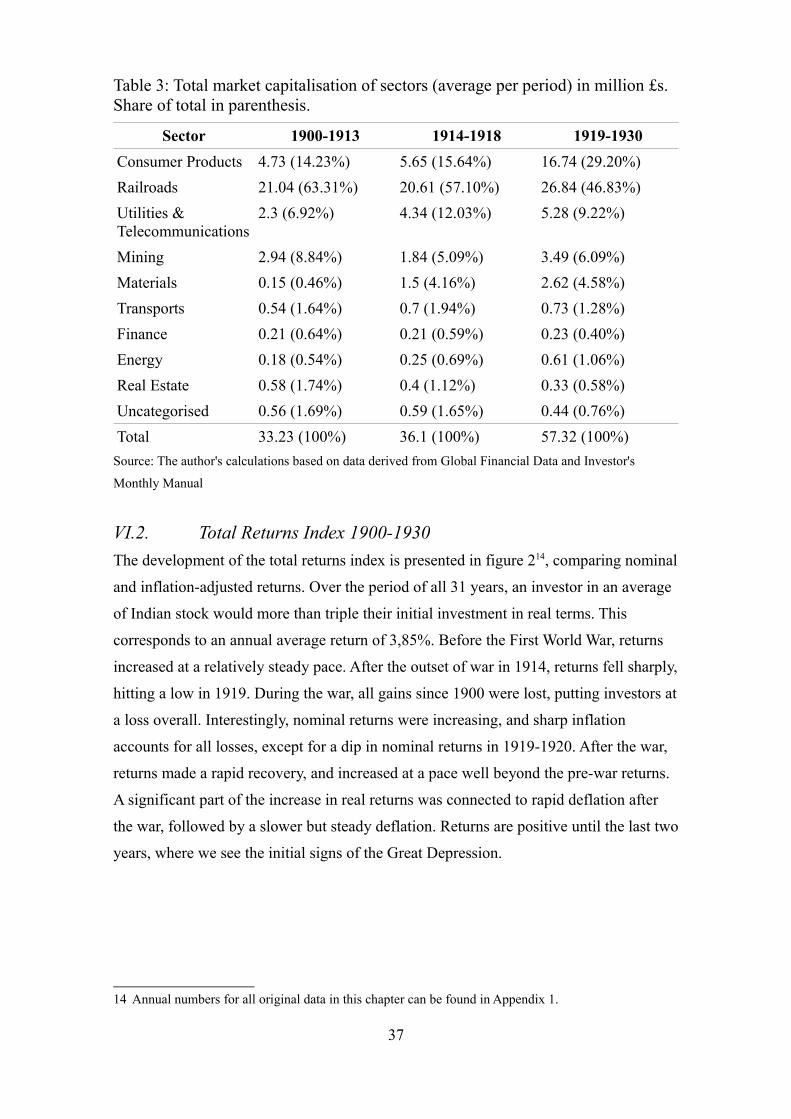
Table 3: Total market capitalisation of sectors (average per period) in million £s. Share of total in parenthesis.
Sector 1900-1913 1914-1918 1919-1930
Consumer Products 4.73 (14.23%) 5.65 (15.64%) 16.74 (29.20%)
Railroads 21.04 (63.31%) 20.61 (57.10%) 26.84 (46.83%)
Utilities & Telecommunications
2.3 (6.92%) 4.34 (12.03%) 5.28 (9.22%)
Mining 2.94 (8.84%) 1.84 (5.09%) 3.49 (6.09%)
Materials 0.15 (0.46%) 1.5 (4.16%) 2.62 (4.58%)
Transports 0.54 (1.64%) 0.7 (1.94%) 0.73 (1.28%)
Finance 0.21 (0.64%) 0.21 (0.59%) 0.23 (0.40%)
Energy 0.18 (0.54%) 0.25 (0.69%) 0.61 (1.06%)
Real Estate 0.58 (1.74%) 0.4 (1.12%) 0.33 (0.58%)
Uncategorised 0.56 (1.69%) 0.59 (1.65%) 0.44 (0.76%)
Total 33.23 (100%) 36.1 (100%) 57.32 (100%)
Source: The author's calculations based on data derived from Global Financial Data and Investor's
Monthly Manual
VI.2. Total Returns Index 1900-1930
The development of the total returns index is presented in figure 214, comparing nominal
and inflation-adjusted returns. Over the period of all 31 years, an investor in an average
of Indian stock would more than triple their initial investment in real terms. This
corresponds to an annual average return of 3,85%. Before the First World War, returns
increased at a relatively steady pace. After the outset of war in 1914, returns fell sharply,
hitting a low in 1919. During the war, all gains since 1900 were lost, putting investors at
a loss overall. Interestingly, nominal returns were increasing, and sharp inflation
accounts for all losses, except for a dip in nominal returns in 1919-1920. After the war,
returns made a rapid recovery, and increased at a pace well beyond the pre-war returns.
A significant part of the increase in real returns was connected to rapid deflation after
the war, followed by a slower but steady deflation. Returns are positive until the last two
years, where we see the initial signs of the Great Depression.
14 Annual numbers for all original data in this chapter can be found in Appendix 1.
37
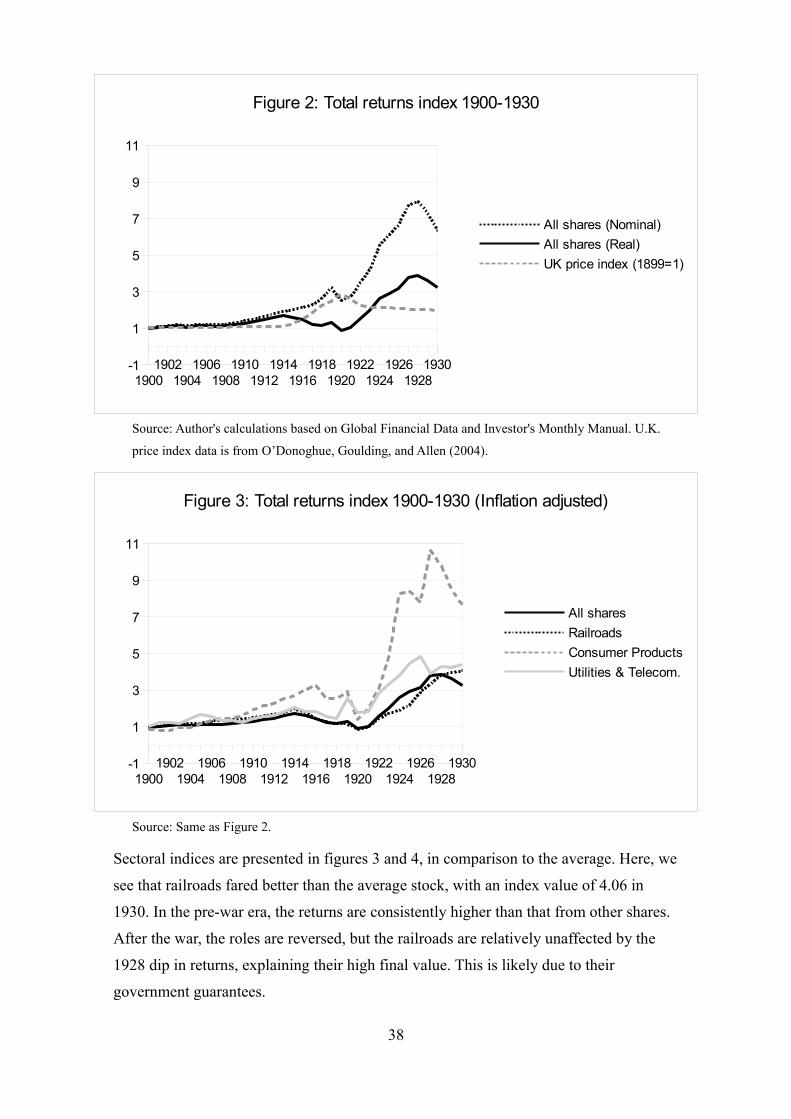
Source: Author's calculations based on Global Financial Data and Investor's Monthly Manual. U.K.
price index data is from O’Donoghue, Goulding, and Allen (2004).
Source: Same as Figure 2.
Sectoral indices are presented in figures 3 and 4, in comparison to the average. Here, we
see that railroads fared better than the average stock, with an index value of 4.06 in
1930. In the pre-war era, the returns are consistently higher than that from other shares.
After the war, the roles are reversed, but the railroads are relatively unaffected by the
1928 dip in returns, explaining their high final value. This is likely due to their
government guarantees.
38
19001902
19041906
19081910
19121914
19161918
19201922
19241926
19281930-1
1
3
5
7
9
11
Figure 3: Total returns index 1900-1930 (Inflation adjusted)
All shares
Railroads
Consumer Products
Utilities & Telecom.
19001902
19041906
19081910
19121914
19161918
19201922
19241926
19281930-1
1
3
5
7
9
11
Figure 2: Total returns index 1900-1930
All shares (Nominal)
All shares (Real)
UK price index (1899=1)
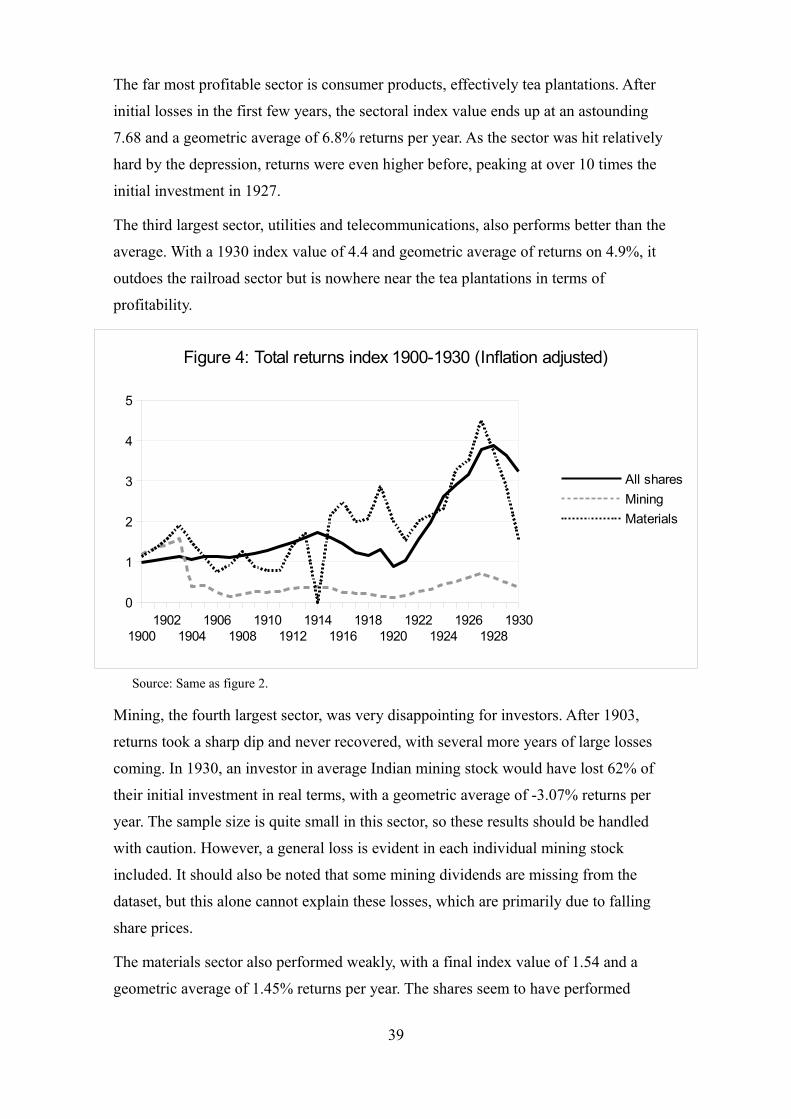
The far most profitable sector is consumer products, effectively tea plantations. After
initial losses in the first few years, the sectoral index value ends up at an astounding
7.68 and a geometric average of 6.8% returns per year. As the sector was hit relatively
hard by the depression, returns were even higher before, peaking at over 10 times the
initial investment in 1927.
The third largest sector, utilities and telecommunications, also performs better than the
average. With a 1930 index value of 4.4 and geometric average of returns on 4.9%, it
outdoes the railroad sector but is nowhere near the tea plantations in terms of
profitability.
Source: Same as figure 2.
Mining, the fourth largest sector, was very disappointing for investors. After 1903,
returns took a sharp dip and never recovered, with several more years of large losses
coming. In 1930, an investor in average Indian mining stock would have lost 62% of
their initial investment in real terms, with a geometric average of -3.07% returns per
year. The sample size is quite small in this sector, so these results should be handled
with caution. However, a general loss is evident in each individual mining stock
included. It should also be noted that some mining dividends are missing from the
dataset, but this alone cannot explain these losses, which are primarily due to falling
share prices.
The materials sector also performed weakly, with a final index value of 1.54 and a
geometric average of 1.45% returns per year. The shares seem to have performed
39
19001902
19041906
19081910
19121914
19161918
19201922
19241926
19281930
0
1
2
3
4
5
Figure 4: Total returns index 1900-1930 (Inflation adjusted)
All shares
Mining
Materials
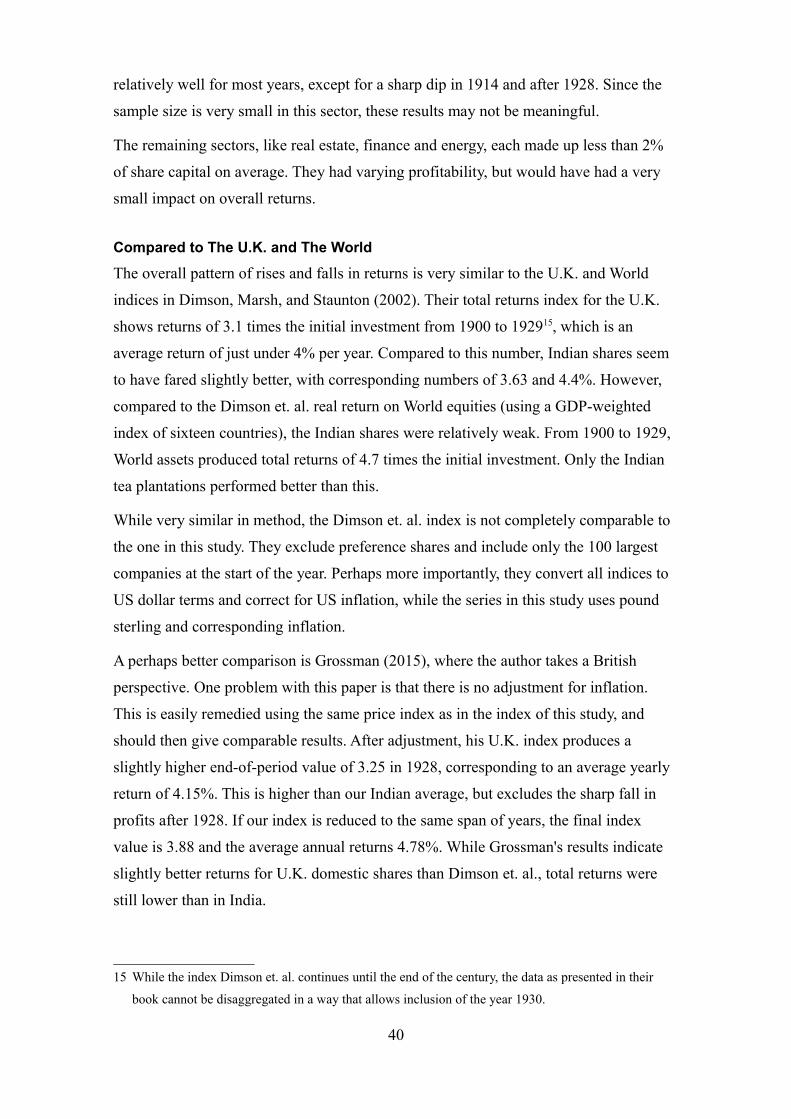
relatively well for most years, except for a sharp dip in 1914 and after 1928. Since the
sample size is very small in this sector, these results may not be meaningful.
The remaining sectors, like real estate, finance and energy, each made up less than 2%
of share capital on average. They had varying profitability, but would have had a very
small impact on overall returns.
Compared to The U.K. and The World
The overall pattern of rises and falls in returns is very similar to the U.K. and World
indices in Dimson, Marsh, and Staunton (2002). Their total returns index for the U.K.
shows returns of 3.1 times the initial investment from 1900 to 192915, which is an
average return of just under 4% per year. Compared to this number, Indian shares seem
to have fared slightly better, with corresponding numbers of 3.63 and 4.4%. However,
compared to the Dimson et. al. real return on World equities (using a GDP-weighted
index of sixteen countries), the Indian shares were relatively weak. From 1900 to 1929,
World assets produced total returns of 4.7 times the initial investment. Only the Indian
tea plantations performed better than this.
While very similar in method, the Dimson et. al. index is not completely comparable to
the one in this study. They exclude preference shares and include only the 100 largest
companies at the start of the year. Perhaps more importantly, they convert all indices to
US dollar terms and correct for US inflation, while the series in this study uses pound
sterling and corresponding inflation.
A perhaps better comparison is Grossman (2015), where the author takes a British
perspective. One problem with this paper is that there is no adjustment for inflation.
This is easily remedied using the same price index as in the index of this study, and
should then give comparable results. After adjustment, his U.K. index produces a
slightly higher end-of-period value of 3.25 in 1928, corresponding to an average yearly
return of 4.15%. This is higher than our Indian average, but excludes the sharp fall in
profits after 1928. If our index is reduced to the same span of years, the final index
value is 3.88 and the average annual returns 4.78%. While Grossman's results indicate
slightly better returns for U.K. domestic shares than Dimson et. al., total returns were
still lower than in India.
15 While the index Dimson et. al. continues until the end of the century, the data as presented in their
book cannot be disaggregated in a way that allows inclusion of the year 1930.
40
Compared to Earlier Studies of India
For Asia, Grossman (2015, 484, Table 2) shows total returns of 5.98% for 1899-1908,
10.36% for 1909-1918 and 16.81% for 1919-1928. This is substantially higher than the
numbers produced in this study, but the numbers presented do not allow for a
comparison of India specifically.
The most similar study which includes Indian shares and allows for a disaggregated
comparison of sectors is that of Edelstein (1982), which uses largely the same sources
but for an earlier period. It covers a set of “first- and second-class” investments between
1870 and 1913, using the Investor's Monthly Manual as its main source (ibid., 115-116).
It is an early total returns index, but with equal weights. Unlike this study, Edelstein
individually calculates returns for common, preference and debenture shares. Series of
relevance are Indian railway equities and debentures, social overhead of India and
China, and the general tea and coffee index, and their relation to the domestic British
returns. Edelstein's coverage of India is smaller in sample size, covering an average of
about 10 companies in each of the above categories.
Unfortunately, yearly data is not available from Edelstein's work. This would have
allowed a direct comparison of the period 1900-1913. Instead, only geometric means
over the entire period are available.
In Edelstein's study of railway equity, Indian shares performed slightly better than the
domestic British, with average yearly returns of 4.97% compared to 4.33%. However,
they performed much worse than Latin American and US railways, which both had
returns around 8.4% (Edelstein 1982, 123). Comparing this to Edelstein's numbers on
average domestic U.K. returns in general (Edelstein 1982, 126), Indian railway equity
had about .3% higher yearly returns than the average, whereas domestic railways had
returns about as far below average. For railway debenture shares, however, Indian
performance was slightly lower than the domestic railways, with yearly returns of
3.65% compared to domestic railway debentures at 3.74%. This goes against the general
trend of empire shares being more profitable than domestic, and is an outlier that
Edelstein has no real explanation for (Edelstein 1982, 123–25 and 135).
It is possible that the small advantage of Indian railway equity, and the weak
performance of railway debenture, was only because these businesses had not yet
reached a stage of profitable maturity. Davis and Huttenback (1986, 97) note that
empire railroads were not more profitable than their domestic counterparts, except for
“the last three years before 1912”. Looking at the US experience, they note that railways
41
took a relatively long time to become profitable, and they ask if this could also apply to
empire railways (Davis and Huttenback 1986, 311). Did Indian railways become more
profitable later, then?
The average returns from railways are indeed higher than in Edelstein's results.
However, this is largely explained by their excellent performance in the post-war period,
where yearly returns reached 9.43%. This was at a time when the world economy and
stock markets were booming in general, and other shares in the index had similarly
increasing returns. According to Dimson, Marsh, and Staunton (2002, 303) the real rate
of return on U.K. domestic shares between 1920 and 1929 were at 9.3% per year. In
other words, although their returns did increase, Indian railway equities were still barely
outdoing the average domestic share.
Concerning social overhead, Indian returns are apparently lower in our index than for
Edelstein's period, where the average yearly return is 7.48%, although his index also
includes an unknown portion of Chinese shares. Neither telecommunications and
utilities, nor tramways, reach anywhere near these numbers, indicating a falling rate of
return.
For tea, there appears to be a similar fall in profits relative to Edelstein's results. His
general tea and coffee index had yearly returns of 9.34% (Edelstein 1982, 123). This is
significantly more than the 6.8% found in this study. Therefore, profits appear to have
been falling over time. Davis and Huttenback (1986, 103) note that Indian and Ceylon
tea and coffee were among the most profitable in the extractive and agriculture sector,
looking at the same period as Edelstein. They also note that early entries into Indian tea
were profitable, but that later entries fared less well during that era. Part of the
discrepancy in profits could be explained by selection bias on Edelstein's part, where
“first- and second class” securities may have included only the more established and
profitable plantations. Nevertheless, the results of this study show that, while probably
declining relatively and absolutely, profits from Indian tea remained higher than the
average until at least 1928.
VII. DiscussionThe aim of this study was to test the theory of finance imperialism on British India, by
testing whether or not investment in British India was more profitable than investment
in the U.K. and foreign countries, and if new empirical study of Indian profits would
change the picture given by previous studies.
42
Previous research indicated that investments outside the empire were more profitable
than within, at least between 1880 and 1900. After that, profits seemed to converge,
giving hope to the idea that returns in the formal empire would overtake the rest of the
world. This study shows that this was not the case, at least not in India before 1930.
Although Indian returns were slightly higher than domestic U.K. returns, investors
would have been better off placing their money in the US or Europe. Indian tea
companies did have exceptionally high returns, but there were probably similarly
exceptional industries in the more developed countries, invisible in a comparison of
averages.
Svedberg's (1981) study indicates that investments in the dependent empire could have
become relatively profitable after 1938. However, he also showed that these benefits
were largely lost at independence. For India, this would mean that there are 17 years of
yet unknown profits waiting to be researched between 1931 and 1947. It is highly
unlikely that profits in this period were so high as to counteract the sub-par profits
earned in India before 1931.
These results do not speak in favour of the common interpretation of finance
imperialism, as defined in this thesis. Nevertheless, capital exports imperialism has a
few possible 'outs' which need to be discussed. For one, this study has not dealt
thoroughly with the aspect of risk. The inclusion of relatively safe assets, such as
preference shares, in the index has likely reduced average returns. Given that a majority
of the index is made up of railway stock with government guarantees, this effect could
be substantial. Furthermore, if Indian and empire equity was perceived as relatively safe
in general, investors may have preferred it to investment outside the empire even if
average returns were lower. If non-Indian and/or non-empire stocks were more risky
and had higher returns, this could explain why Grossman (2015) shows much higher
returns for Asia in general than the results from India produced in this study. However,
the concept of empire as a destination for safe but low-yield investments would
contradict the higher returns from formal empire in (Svedberg 1981). India could be an
exception to this case, or the difference may be due to Svedberg studying a later period
of higher monopolistic exploitation.
The search for safe investment opportunities, rather than highly profitable, could have
motivated expansion. However, using risk-aversion as the principal explanation would
move the concept of finance imperialism more into the realm of psychology than that of
43
political economy. A theory of finance imperialism based on this idea would need to be
backed up by qualitative data supporting a strong interest in safe investments.
Another possibility is that the interest in empire was driven by irrational expectations of
financial profit. The failure of Indian gold mines indicates the existence of delusional
expectations. However, if such expectations pushed for expansion, why did not Britain
get rid of the empire when it proved to be unprofitable? Gallagher and Robinson (1953)
argued that the political reforms that eventually led to colonial independence were not a
process of actively letting go of empire. Instead, they were part of a strategy to stay in
control by other means. If the empire had only been a disappointment, this urgent need
to maintain power would make little sense.
There is one form of capital exports imperialism that the results support. Davis and
Huttenback (1986) showed that different sections of the British capitalist classes had
different patterns of investment. Cain and Hopkins (2001, 167–83) built upon this
research, arguing that 'gentlemanly capitalists' had a preference to invest in the empire
because of their social connections with people in the top ranks of colonial
administration. In effect, these two classes were largely the same. Furthermore,
gentlemanly capitalists dealt in other types of business than the industrial businessmen.
Agriculture, mining, railways and finance was their game, not manufactures. When they
looked for investment abroad, this led them to the dependent empire rather than
developed industrial countries. Furthermore, these elites paid a smaller share of the
taxes needed to maintain the empire, so the costs were not an issue to them. As Davis
and Huttenback (1986, 211) put it: “Britain was not one capital market but two.”
Following this line of reasoning, higher profits in the US or Europe is not evidence that
a push for capital exports would have resulted in investment there instead. If
gentlemanly capitalists had influence over imperial policy, they would direct it towards
investments that fitted them, not the industrial capitalists. In this conception of finance
imperialism, it was not capitalism per se that caused the expansion of formal empire.
Yes, the falling rate of profit in Britain caused a push for capital exports but the
direction of these exports was determined by closed-minded elites with a lack of
appreciation for industry. In a sense, it was the underdevelopment of the British
capitalist class that was to blame for imperial ambitions, not the advance of capitalism.
The results of this study indicate higher returns in India than in the U.K., which speaks
in favour of this theory. The problem with this view is that it would only apply to British
conditions. It can hardly explain the imperial ambitions of the US, Germany or France,
44
where we can assume that aristocratic bias had little role in the economy. While Lenin
seemed to have forgotten Britain, this theory would forget Britain's rivals.
Another aspect of finance imperialism, which this author has not seen discussed, is the
analytical separation of expansion and maintenance of empire. Interests behind one may
be different from interests behind the other. There is evidence that newly opened areas
yielded very high profits, which were later driven down by competition (Davis and
Huttenback 1986, 110). This makes theoretical sense from a perspective of falling
marginal returns. Over time, the potential profits from old imperial territories may have
fallen, but the pioneer investors would have already made their gains. When this
potential had been spent, investors would have an increased interest in expanding to
new territories where profits would be higher. Some evidence indicates that the elites
who invested in the empire early divested from it once profits proved low, and passed
on the ownership of these substandard shares to “women, children and retirees” among
others (Davis and Huttenback 1986, 314).
Thus, it is somewhat strange to try to explain the expansion of empire by looking at
profits from the existing empire. This only makes sense if investors' expectations of
profit in, say, a newly opened Africa were based on their experiences of mature markets
in India. Surely, capitalists at the time knew the difference between young and old
markets.
Once the initial boom of investment had taken place, a new territory would be deeply
intertwined with the British economy. Even if profits fell, the area could not be
abandoned without causing an immediate crisis for the involved business interests. For
example, it was acknowledged that if India defaulted on its loans, this would cause a
financial crisis in Britain (Cain and Hopkins 2001, 295). Maintaining British control
was a necessary component in preventing defaults. High rates of return may prompt
expansion, but low rates of return don't necessarily prompt abandonment. A test of
financial imperialism along these lines would require a very different method.
VII.1. Alternatives to the 'Hobson-Lenin hypothesis'
Because of its political significance, on both national and international levels, some will
find it tempting to hold fast to the 'Hobson-Lenin' theory of financial imperialism. For
many, it would be hard to accept a lack of clear financial benefits to the imperial
metropoles. However, those who want to rescue the idea of economic imperialism might
want to expand their horizon, because the field covers much more than the interpretation
45
of financial imperialism that is often discussed. It is possible that this interpretation is
representative of what many neo-Marxist theorists believe today, but it is not a fair
representation of Hobson or Lenin. There is still much to explore in these classics. The
viability of a more nuanced take on financial imperialism is evidenced by the recent
work of Cain and Hopkins (2001), which shows that economic and class-based
explanations for imperialism have a basis in empirical evidence, if one does not fixate
solely on relative levels of profits. British trade, investment and service interests were
closely interlinked through the importance of British currency globally.
Other arguments are applicable outside Britain as well. For example, the importance of
opening new markets is all too often cast aside. Finding buyers for an increasing mass
production of goods is central to maintaining profits, and lies not only in the interest of
industry, but also traders and finance. O’Brien (1988) does give this matter serious
thought, along with the idea that the empire was necessary for settling trade deficits. He
concludes that the empire was not necessary, using the standard laissez-faire argument:
if the British didn't trade with India or the empire, they could trade with someone else.
Or, if there was no formal control over the empire, free trade with these countries would
still have been possible.
It is interesting to note that Hobson (1902) makes a similar argument. He did not
consider the empire necessary for Britain. The particular trade arrangements were only
in place because special interest groups had captured economic and foreign policy.
Under truly free trade, any function that India or the empire played could be performed
by some other country, or within the domestic economy. However, unlike O’Brien
(1988), Hobson held that Britain could only be freed from the grip of big finance and
industry by a radical re-distribution of land and wealth. The imperial pattern of trade
and investment could only be changed if big business was replaced by small scale
manufactures (Hobson 1902, 79–99).
Thus, Hobson recognises that the imperial trade patterns are deeply tied to the internal
industrial structure of Britain. An abandonment of the imperial connection would mean
a significant crisis for British business. For O'Brien, this is not a huge problem, because
business would eventually adapt to new conditions under free trade.
For Lenin, crises increase concentration of capital among those that are less affected
(Lenin 2005, chap. I). Extrapolating from this idea, abandonment of the empire would
have significant drawbacks. If Britain's economy had to go through a crisis of re-
adaptation to a non-empire economy, it would fall behind in the global competition for
46
monopolistic power and control. O'Brien does not engage with this concept of power in
determining costs and benefits for Britain.
Furthermore, the alternative to direct control was not likely to be free trade. A late 19th
century politician expressed his belief that the alternative to British presence in India
would be anarchy, which would prevent trade (Cain and Hopkins 2001, 289). In other
cases, the alternative seemed to be control by rivals. Expansion in Africa had explicit
motives in the concern that rival powers would gain a foothold otherwise (Gallagher
and Robinson 1953). British interests in Siam were heightened by fears of France taking
over the territory if Britain did not control it. This would destroy British trade if France
took protectionist action (Davis and Huttenback 1986, 265).
Thus, the importance of empire for commodity trade hinges on different understandings
of the relevant counterfactuals, which in turn hinge on different understandings of the
free market, monopoly power and crises. This ideological rift can explain why
meaningful debate on the subject is rare, and why capital exports have generated more
fruitful research.
The Interactions and Contradictions of Economic Interests
The presence of multiple economic logics does not invalidate economic explanations,
unlike what Davis and Huttenback (1986, 279) seem to conclude. Cain and Hopkins
(2001) paint a riveting picture of the many economic interests of Britain and their
interactions. The current economic situation, ideology and political power relations
determined which interests directed policy in a given moment. Even if, like Cain and
Hopkins propose, there was a class of gentlemanly capitalists who almost always got
their way, their interests in the empire were internally conflicting and evolving as well.
Therefore, measures of economic performance in the empire along a single parameter
are likely to produce irregular results.
The case of Indian development serves as a good example of this. Economic
development, through railroads and other public utilities, could serve to increase profits
of existing and future Indian business. Furthermore, if expansion of trade was an
important part of imperialism, development served to expand the size of colonial
markets. Not only would these markets be able to absorb more consumer goods, but the
investments themselves generated demand for capital goods16.
16 Edelstein found a regular covariance between returns on overseas railways and social-overhead
sectors and the U.K. suppliers of their capital goods (Edelstein 1982, 158). This gives some credibility
to this aspect of Luxemburg's theory.
47
However, if this was the case, and economic interests did drive imperial policy, why
was India not developed further? The success of the project was quite limited, and the
exploitation of economic potential through development seems not to have been the first
priority (Davis and Huttenback 1986, 118–42). The absence of massive profits
evidenced by this study is in line with such an interpretation.
Part of the explanation can be found in competing interests, even within the gentlemanly
capitalist class. The government of India was heavily burdened by debt, limiting
development. British finance, as creditors of this debt, had an interest in maintaining
interest payments in spite of these difficulties (Cain and Hopkins 2001, 295).
Furthermore, previous experience from the white settlements showed that excessive
development could empower the inhabitants of the colony to the point of rebellion,
which in turn could lead to the growth of a new economic rival. Fears of increased
autonomy were ever present (Barber 1975, 105–6). Tariffs in support of Indian industry
would be problematic for several reasons. The diverse economic interests of Britain
were held together by an ideology of free trade. Breaking with this could threaten the
legitimacy of the system on which 'gentlemanly capitalism' rested (Cain and Hopkins
2001). Cheap imports were vital to India, because of its poor and heavily taxed
population. Tariffs would also threaten the existing trade patterns with Britain (ibid.,
296). A similar logic could explain why monopolistic exploitation was not pursued
harder. Britain had a large trade surplus towards India and other underdeveloped
countries (ibid., 201). If economic exploitation was intensified, the Indian capacity to
buy British goods would fall.
It is possible that the empire allowed Britain to pursue development abroad under
controlled conditions, carefully weighing different economic and political factors
against each other. This would have been difficult in relation to independent states.
On the other hand, there are cases where the British commitment to any sort of imperial
logic seems lacking, or ambivalent. For example, the Indian government refused entry
to American Standard Oil, in an effort to support British interests (Davis and
Huttenback 1986, 262). However, Treasury expressed opposition to assisting British
enterprise “in its struggle with foreign rivals”, at least with taxpayer money (ibid., 263).
Perhaps, the twin issues of diverse economic interests and a commitment to free trade
made Britain a poor subject for an unambiguous imperialism. This is not necessarily
evidence for a lack of an economic logic to imperialism. On the contrary, the difficulties
to pursue unapologetic imperialism may contribute to an explanation of the relative
48
decline of the U.K. as a world power. In younger capitalist economies, like the U.S. or
Germany, higher degrees of monopoly may have made it easier to align state and
business interests in a quest for global power.
In any case, the actual economic interests at stake in 19th and 20th century Britain made
up a complex, contradictory and evolving web. The problem with complexity is that it
does not easily lend itself to the production of mathematically testable hypotheses, or
generalised theories applicable to many countries. One of the attractions of the
caricatured 'Hobson-Lenin hypothesis' is that it allows for quantitative tests on any
imperial nation. Perhaps this is the future task of proponents of economic explanations
of empire: to take initiative in formulating new tests of economic imperialism. Empire
may not have been a “snare and a delusion” as Davis and Huttenback (1986, 110) stated,
but the capital exports interpretation of finance imperialism, perhaps, is.
VII.2. Future Research
The study of financial imperialism is far from finished, even in the narrow interpretation
focusing on capital exports. For India, a total returns index such as the one presented
here could be extended further ahead and backwards in time. Using the same sources,
corresponding indices could be constructed for other parts of the empire, and the world.
This is useful even for the previously researched period 1860-1912, because of
potentially flawed sampling and weights in previous studies. A comparison with other
less developed countries in the same period would also be of interest, to test if formal
control in India meant higher profits relative to non-empire regions of similar
development.
Unfortunately, the Global Financial Data database contains severe problems, at least in
its India data. Using it requires a large amount of data checking and correction. Its
advantage is its comprehensiveness, especially in price data, while other databases are
usually digitised versions of a single financial paper (i.e. the Investor's Monthly
Manual). A disadvantage is that it is hard to know the original source for any specific
data point, which makes verification very difficult. Furthermore, researchers would
have to find a better way to categorise companies by country and type of asset. The
methods applied by the GFD data collectors is unclear, and sometimes seem arbitrary.
Finally, changes in 'paid' values need to be collected separately and corrected for, at
least for the period before 1900.
49
Using the same methods on sources from other countries, allowing for a comparison of
the British experience with other empires, would allow for a better test of a 'general'
finance imperialism. In theory, there is also room for a wide range of research projects
using alternative interpretations of finance imperialism. However, it remains to be seen
what materials and methods could be used to construct quantitative tests of these
interpretations.
VIII. ConclusionsThe rate of return on Indian equity on the London Stock Exchange 1900-1930 was
slightly higher than for domestic U.K. equity during the same period. However, it was
not higher than in countries outside the British Empire. Previous research indicated that
empire returns were lower than domestic from 1880, but were catching up after 1900.
The results of this study are in line with this, and indicate that empire returns eventually
became higher than domestic.
If India is representative of the dependent empire, finance imperialism – understood as a
growing surplus of capital pushing developed states to take formal control over foreign
territory – only works as an explanation for British imperialism in this period under
certain conditions. Previous research suggests that a class of 'gentlemanly capitalists'
were influential in imperial policy and were biased against investment in manufacturing.
This would have made them less prone to invest in the profitable equity markets of the
US or Europe. If this is true, their search for investment opportunities in finance,
infrastructure and extractive industries could have pushed Britain to expand and
maintain its formal influence overseas. However, such a theory of imperialism would
not be generalisable to other imperialist states, as the gentlemanly capitalists were a
British phenomenon. Another possibility is that the desire to export capital motivated
expansion of empire into new and highly profitable areas, but that the desire to maintain
control after profits fell had different sources.
In any case, Britain as a whole would seemingly have been better off placing its money
in developed countries in the early 20th century. For this reason, previous researchers
have concluded that formal empire only benefited certain investors who lacked
knowledge or experience in industrial investments. However, the presence and
importance of these investors to the British economy has to be taken into account. They
did control a significant share of capital, and therefore their limited investment horizon
helped define the de facto limits to British capital exports. Given these limits, formal
50
empire may have been the only realistic means to raise profits. Furthermore, given the
key role that these gentlemanly capitalists played in making Britain the global centre of
finance and commerce, separating their interests from a 'British' interest is not so easy.
If control made India more profitable than similar non-controlled countries in this
period remains to be seen. However, theorists and researchers suggest many other
economic benefits of formal control, and it would be unwise to base a judgement of
economic imperialism in its entirety on this single parameter. Theory, both classical and
new, offers a more complex picture which deserves to be researched in earnest.
Still, research along the lines of this study has not been exhausted. Using the same or
similar sources and methods, indices can be constructed for more countries and longer
periods. A continuous index from 1860 to 1970 should be possible for India and other
countries.
51
BibliographyBarber, William J. 1975. British Economic Thought and India, 1600-1858: A Study in
the History of Development Economics. Oxford: Clarendon.Bayly, C. A. 1988. Indian Society and the Making of the British Empire. Volume 0. The
New Cambridge History of India. Cambridge: Cambridge University Press.Cain, P. J., and A. G. Hopkins. 2001. British Imperialism: 1688-2000. 2 edition. New
York: Routledge.Davis, Lance Edwin, and Robert A. Huttenback. 1986. Mammon and the Pursuit of
Empire: The Political Economy of British Imperialism, 1860-1912. Cambridge: Cambridge University Press.
Deutsch, Karl W. 1974. ‘Theories of Imperialism and Neocolonialism’. In Testing Theories of Economic Imperialism, edited by Steven J. Rosen and James R. Kurth, 15–34. Lexington, Mass: Lexington Books.
Dimson, Elroy, Paul Marsh, and Mike Staunton. 2002. Triumph of the Optimists: 101 Years of Global Investment Returns. Princeton, N.J: Princeton University Press.
Edelstein, Michael. 1982. Overseas Investment in the Age of High Imperialism: The United Kingdom, 1850-1914. London: Methuen.
Ferguson, Niall, and Moritz Schularick. 2006. ‘The Empire Effect: The Determinants ofCountry Risk in the First Age of Globalization, 1880-1913’. The Journal of Economic History 66 (2): 283–312.
Fieldhouse, D. K. 1961. ‘“Imperialism”: An Historiographical Revision’. The EconomicHistory Review 14 (2): 187–209.
Galbraith, John S. 1960. ‘The “Turbulent Frontier” as a Factor in British Expansion’. Comparative Studies in Society and History 2 (2): 150–68.
Gallagher, John, and Ronald Robinson. 1953. ‘The Imperialism of Free Trade’. The Economic History Review 6 (1): 1–15.
Germain, E. 1955. ‘E. Germain: The Marxist Theory of Imperialism and Its Critics (1955)’. Accessed January 10 2017. https://www.marxists.org/archive/mandel/1955/08/imp-crit.html.
Grossman, Richard S. 2015. ‘Bloody Foreigners! Overseas Equity on the London Stock Exchange, 1869-1929’. Economic History Review 68 (2): 471–521.
Hobson, John Atkinson. 1902. Imperialism: A Study. New York, NY: J. Pott.Kurth, James R. 1974. ‘Testing Theories of Economic Imperialism’. In Testing Theories
of Economic Imperialism, edited by Steven J. Rosen and James R. Kurth, 3–14. Lexington, Mass: Lexington Books.
Lee, George. 1971. ‘Rosa Luxemburg and the Impact of Imperialism’. The Economic Journal 81 (324): 847–62.
Lenin, Vladimir Ilyich. 2005. ‘Lenin: Imperialism, the Highest Stage of Capitalism’. Marxists Internet Archive. Accessed January 10 2017. https://www.marxists.org/archive/lenin/works/1916/imp-hsc/.
O’Brien, Patrick K. 1988. ‘The Costs and Benefits of British Imperialism 1846-1914’. Past & Present, no. 120: 163–200.
O’Donoghue, Jim, Louise Goulding, and Grahame Allen. 2004. ‘Consumer Price Inflation since 1750’. Office for National Statistics. March 10. Accessed May 7 2017. http://webarchive.nationalarchives.gov.uk/20160105160709/http://ons.gov.uk/ons/rel/cpi/consumer-price-indices/1750---2003/composite-consumer-price-index-with-description-and-assessment-of-source-data.pdf.
Roy, Tirthankar. 2006. The Economic History of India, 1857-1947. 2. ed. New Delhi: Oxford University Press.
Stokes, Eric. 1969. ‘Late Nineteenth-Century Colonial Expansion and the Attack on the Theory of Economic Imperialism: A Case of Mistaken Identity?’ The Historical Journal 12 (2): 285–301.
Svedberg, Peter. 1981. Colonialism and Foreign Direct Investment Profitability. Seminar Paper / Institute for International Economic Studies, University of Stockholm 177. Stockholm: Univ., Institute for International Economic Studies.
Taylor, A. J. P. 1952. ‘A. J. P. Taylor, Economic Imperialism’. Accessed January 15 2017. http://panarchy.org/taylor/imperialism.1952.html.
Taylor, James. 2006. Creating Capitalism: Joint-Stock Enterprise in British Politics and Culture 1800-1870. Royal Historical Society Studies in History, v. 53. London: Royal Historical Society.
Twomey, Michael J. 2000. A Century of Foreign Investment in the Third World. Routledge Studies in International Business and the World Economy 20. London: Routledge.
Sources‘Global Financial Data’. 2015. Accessed May 26. https://www.globalfinancialdata.com/.
‘Investor's Monthly Manual’. 1900-1930. Accessed at the Guildhall Library, City of London.
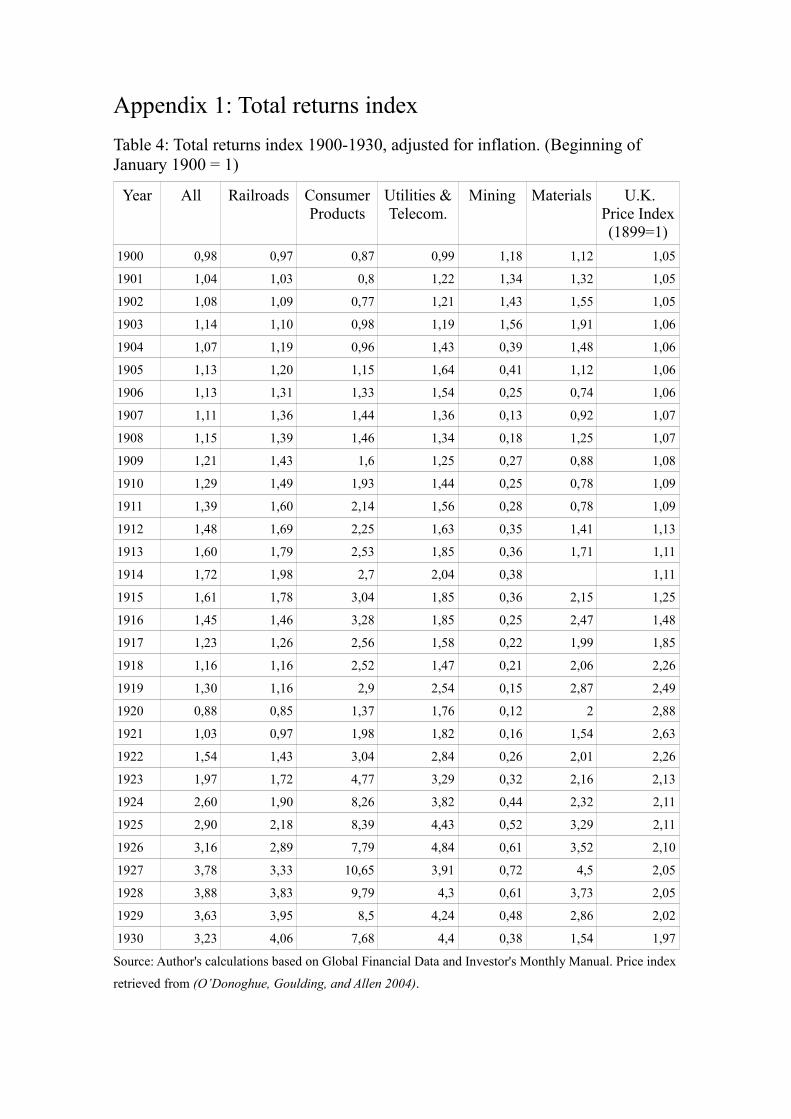
Appendix 1: Total returns index
Table 4: Total returns index 1900-1930, adjusted for inflation. (Beginning of January 1900 = 1)
Year All Railroads ConsumerProducts
Utilities &Telecom.
Mining Materials U.K.Price Index(1899=1)
1900 0,98 0,97 0,87 0,99 1,18 1,12 1,05
1901 1,04 1,03 0,8 1,22 1,34 1,32 1,05
1902 1,08 1,09 0,77 1,21 1,43 1,55 1,05
1903 1,14 1,10 0,98 1,19 1,56 1,91 1,06
1904 1,07 1,19 0,96 1,43 0,39 1,48 1,06
1905 1,13 1,20 1,15 1,64 0,41 1,12 1,06
1906 1,13 1,31 1,33 1,54 0,25 0,74 1,06
1907 1,11 1,36 1,44 1,36 0,13 0,92 1,07
1908 1,15 1,39 1,46 1,34 0,18 1,25 1,07
1909 1,21 1,43 1,6 1,25 0,27 0,88 1,08
1910 1,29 1,49 1,93 1,44 0,25 0,78 1,09
1911 1,39 1,60 2,14 1,56 0,28 0,78 1,09
1912 1,48 1,69 2,25 1,63 0,35 1,41 1,13
1913 1,60 1,79 2,53 1,85 0,36 1,71 1,11
1914 1,72 1,98 2,7 2,04 0,38 1,11
1915 1,61 1,78 3,04 1,85 0,36 2,15 1,25
1916 1,45 1,46 3,28 1,85 0,25 2,47 1,48
1917 1,23 1,26 2,56 1,58 0,22 1,99 1,85
1918 1,16 1,16 2,52 1,47 0,21 2,06 2,26
1919 1,30 1,16 2,9 2,54 0,15 2,87 2,49
1920 0,88 0,85 1,37 1,76 0,12 2 2,88
1921 1,03 0,97 1,98 1,82 0,16 1,54 2,63
1922 1,54 1,43 3,04 2,84 0,26 2,01 2,26
1923 1,97 1,72 4,77 3,29 0,32 2,16 2,13
1924 2,60 1,90 8,26 3,82 0,44 2,32 2,11
1925 2,90 2,18 8,39 4,43 0,52 3,29 2,11
1926 3,16 2,89 7,79 4,84 0,61 3,52 2,10
1927 3,78 3,33 10,65 3,91 0,72 4,5 2,05
1928 3,88 3,83 9,79 4,3 0,61 3,73 2,05
1929 3,63 3,95 8,5 4,24 0,48 2,86 2,02
1930 3,23 4,06 7,68 4,4 0,38 1,54 1,97
Source: Author's calculations based on Global Financial Data and Investor's Monthly Manual. Price index
retrieved from (O’Donoghue, Goulding, and Allen 2004).
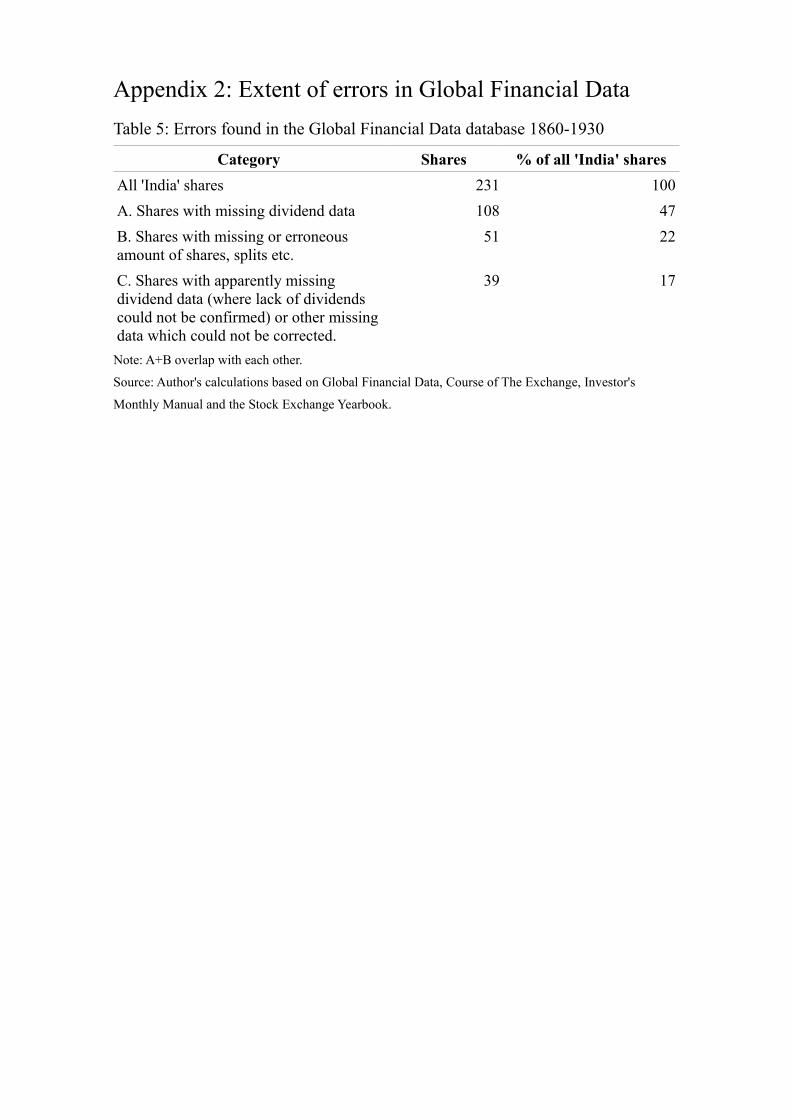
Appendix 2: Extent of errors in Global Financial Data
Table 5: Errors found in the Global Financial Data database 1860-1930
Category Shares % of all 'India' shares
All 'India' shares 231 100
A. Shares with missing dividend data 108 47
B. Shares with missing or erroneous amount of shares, splits etc.
51 22
C. Shares with apparently missing dividend data (where lack of dividends could not be confirmed) or other missingdata which could not be corrected.
39 17
Note: A+B overlap with each other.
Source: Author's calculations based on Global Financial Data, Course of The Exchange, Investor's
Monthly Manual and the Stock Exchange Yearbook.