Embed Size (px)
Citation preview

Finance Constraints and Firm Transition in the Informal Sector: Evidence from
Indian Manufacturing
Rajesh Raj S.N. CMDR, Dharwad, India
Kunal Sen
IDPM, University of Manchester, UK e-mail: [email protected]

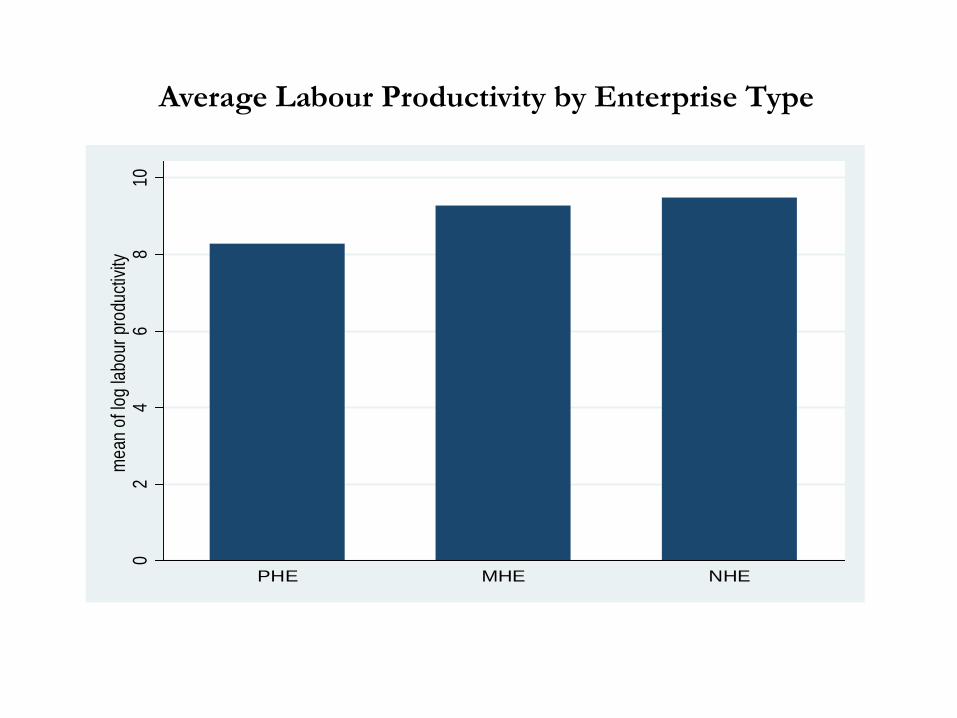
The majority of firms in developing countries are informal household enterprises, where are very small firms which exclusively employ workers from within the household itself.
These firms tend to be the least productive among all firms in the manufacturing sector and the individuals that own, manage and work in these enterprises comprise a large proportion of the urban working poor in developing countries.
For many informal household enterprises, the transition to larger enterprises in the informal sector could be a route out of poverty, as well as providing employment for a large proportion of unskilled workers in urban and semi-urban areas. Yet few family firms make this transition to larger enterprises in the informal sector.
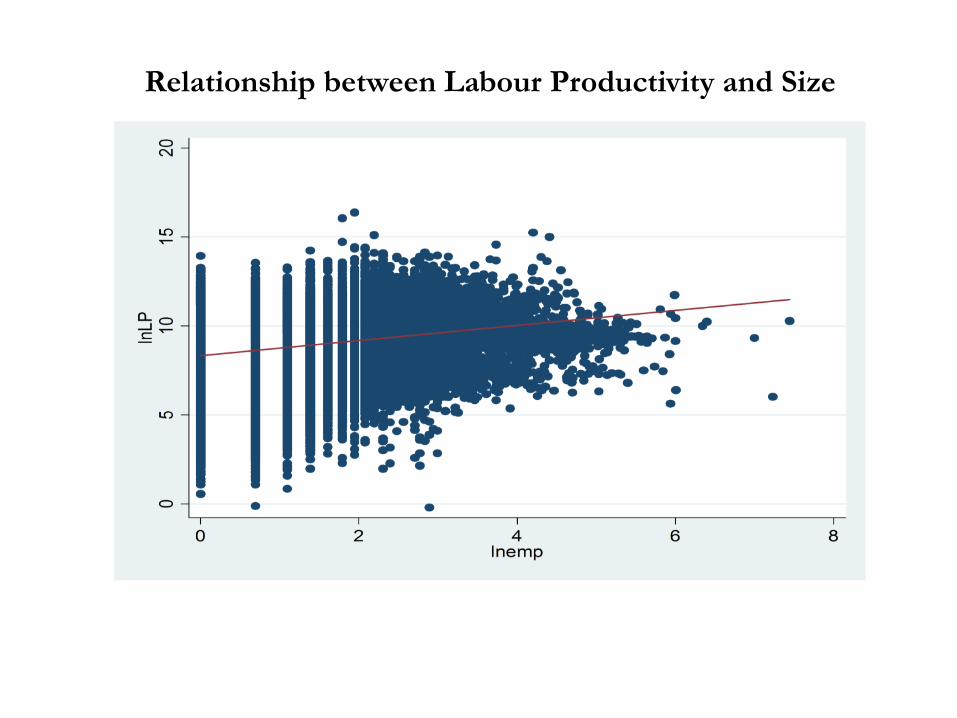
Relationship between Labour Productivity and Size
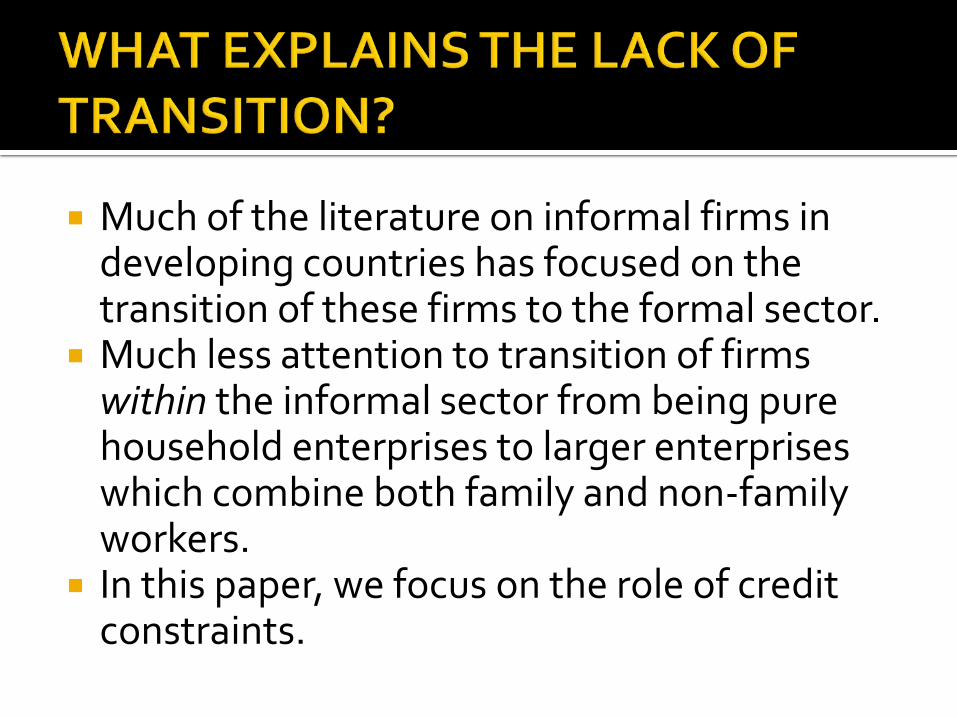
Much of the literature on informal firms in developing countries has focused on the transition of these firms to the formal sector.
Much less attention to transition of firms within the informal sector from being pure household enterprises to larger enterprises which combine both family and non-family workers.
In this paper, we focus on the role of credit constraints.
While finance constraints on investment and firm growth have been found to be present for small firms, both in developed and developing countries, we would expect that finance constraints would be particularly important for firms in the informal sector.
Information problems are more likely to be present for informal firms which do not have credit histories and adequate collateral to offer to lenders, especially banks and co-operative societies.

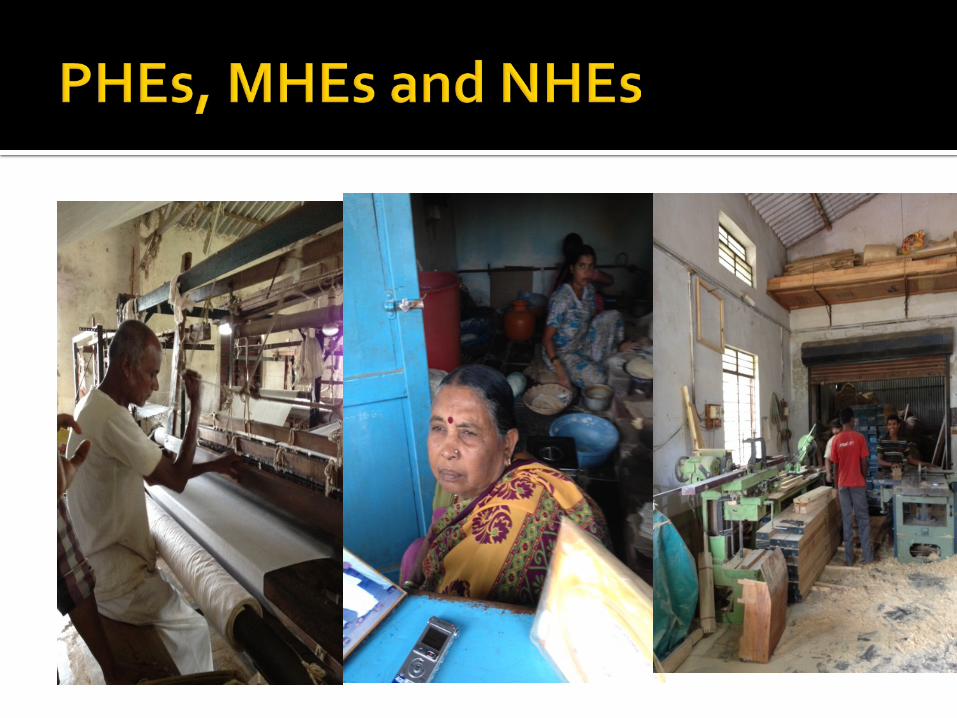
We focus on three types of firms in the informal sector: pure household enterprises (PHE), to slightly larger enterprises which use both family and non-family labour, which we call mixed household enterprises (MHE), to larger enterprises which employ mostly non-family labour, which we call non-household enterprises (NHE).
HOW IMPORTANT ARE CREDIT CONSTRAINTS IN THE LIKELIHOOD THAT PHES CAN BECOME MHES AND MHES BECOME NHES?
We use a firm-level data-set drawn from the nationally representative surveys of the informal manufacturing sector for the years 2000-01, 2005-06 and 2010-11 that includes information on the presence of finance constraints self-reported by firms. We supplement our analysis with panel data of 364 districts from 1995-2010.
02
46
810
mea
n of
log
labou
r pro
ducti
vity
PHE MHE NHE
Average Labour Productivity by Enterprise Type

Strong empirical evidence that shows a positive relationship between increased access to finance and firm growth (Rajan and Zingales, 1998; Demirgüç-Kunt and Maksimovic, 1998), with small firms are financially more constrained than large firms.
Beck et al. (2005) show that financing constraints reduce firm growth by 6 percentage points, on average, for large firms but by 10 percentage points in the case of small firms.
Banerjee and Duflo (2004) analyze detailed loan information on 253 Indian SMEs’ before and after they became eligible for a directed subsidized lending program and find that the additional credit resulted in a proportional increase in sales reflecting its impact on growth.
However, all these papers study the role of finance constraints on small firm growth in the formal sector.
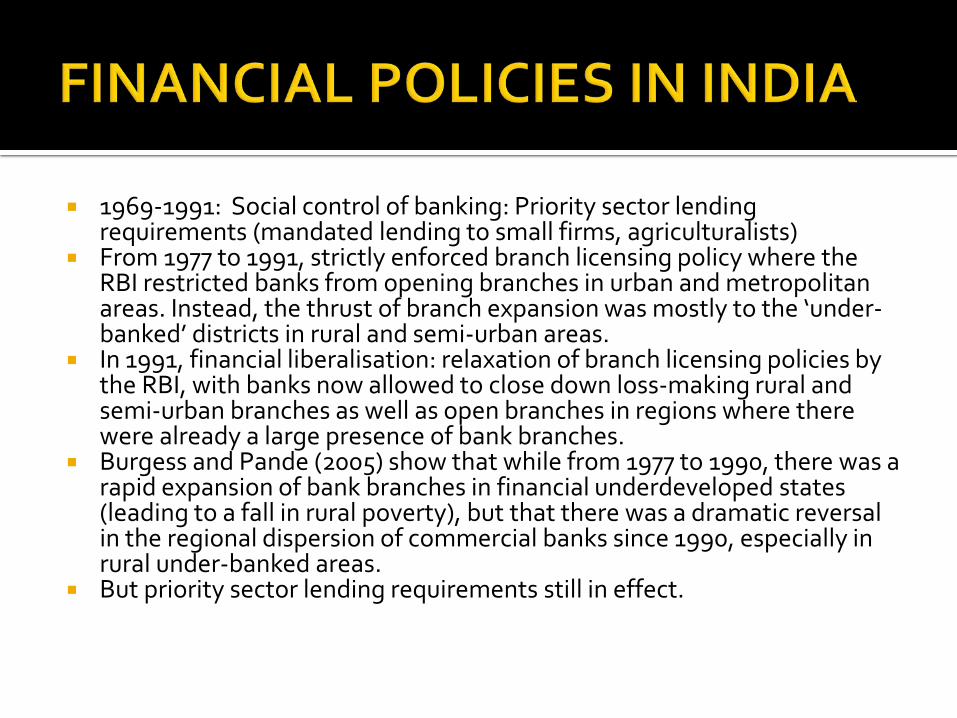
1969-1991: Social control of banking: Priority sector lending requirements (mandated lending to small firms, agriculturalists)
From 1977 to 1991, strictly enforced branch licensing policy where the RBI restricted banks from opening branches in urban and metropolitan areas. Instead, the thrust of branch expansion was mostly to the ‘under-banked’ districts in rural and semi-urban areas.
In 1991, financial liberalisation: relaxation of branch licensing policies by the RBI, with banks now allowed to close down loss-making rural and semi-urban branches as well as open branches in regions where there were already a large presence of bank branches.
Burgess and Pande (2005) show that while from 1977 to 1990, there was a rapid expansion of bank branches in financial underdeveloped states (leading to a fall in rural poverty), but that there was a dramatic reversal in the regional dispersion of commercial banks since 1990, especially in rural under-banked areas.
But priority sector lending requirements still in effect.
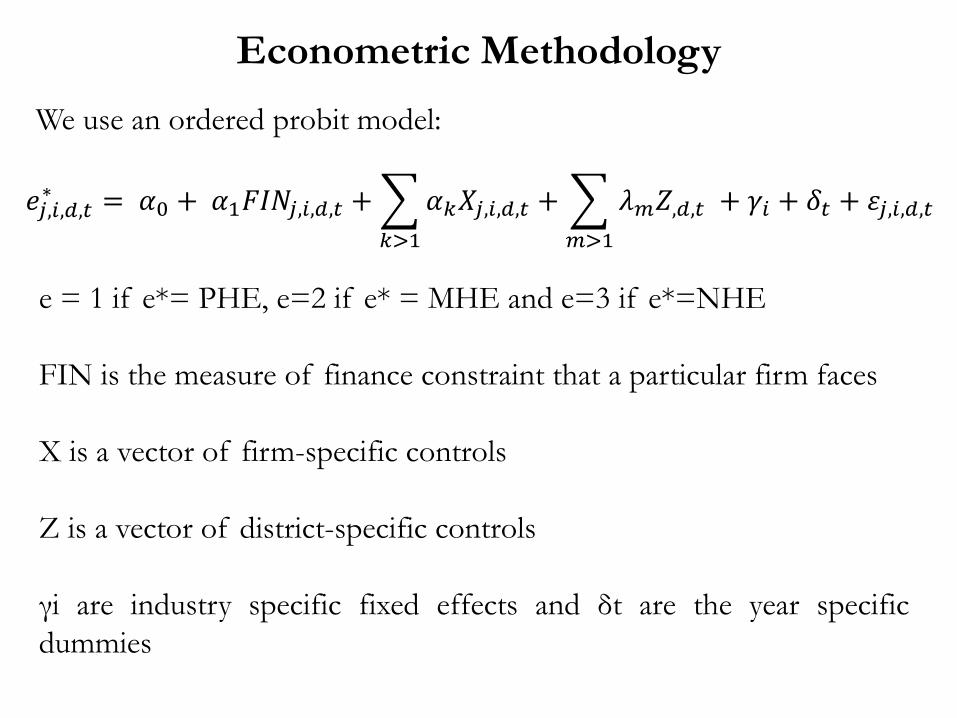
Econometric Methodology We use an ordered probit model:
𝑒𝑗,𝑖,𝑑,𝑡∗ = 𝛼0 + 𝛼1𝐹𝐹𝐹𝑗,𝑖,𝑑,𝑡 + �𝛼𝑘𝑋𝑗,𝑖,𝑑,𝑡
𝑘>1
+ � 𝜆𝑚𝑍,𝑑,𝑡𝑚>1
+ 𝛾𝑖 + 𝛿𝑡 + 𝜀𝑗,𝑖,𝑑,𝑡
e = 1 if e*= PHE, e=2 if e* = MHE and e=3 if e*=NHE FIN is the measure of finance constraint that a particular firm faces X is a vector of firm-specific controls Z is a vector of district-specific controls γi are industry specific fixed effects and δt are the year specific dummies

Access to Finance
We use a direct measure to capture the firm’s finance constraint Whether the firm faced any constraint on its borrowing in the last year (CAPSHOR); self-reported. CAPSHOR takes the value 1 if the firm faces a constraint and 0 if it does not face a constraint

Firm Specific Controls
LOCATION - whether the firm is located in rural or urban areas REGIS – whether the firm has registered under any act/authority(e.g. Shops and Establishments, Municipal Corporation/Panchayat, VAT/Sales Tax, Provident Fund, Employees State Insurance Corporation Acts) LINKAGE - whether the firm is working under contract for another firm. ASSISTANCE – whether the firm received any assistance from the government towards training and marketing STATUS – whether the firm is expanding in the past three years (self-reported) ELEC - whether the firm has access to electricity ACMAINT – whether the firm maintains any account (book-keeping)
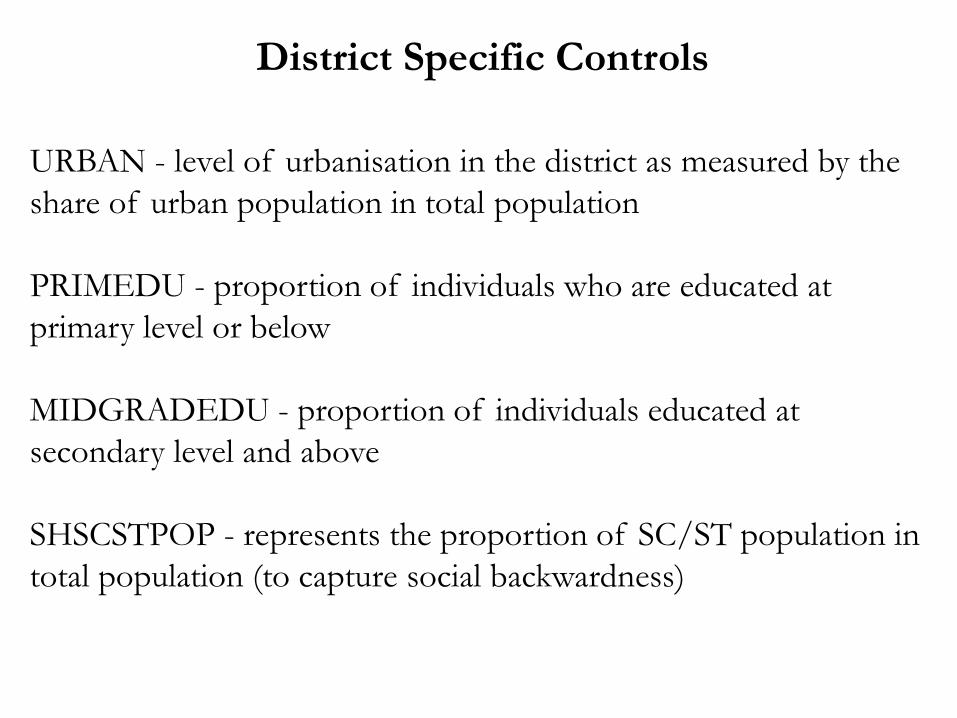
District Specific Controls
URBAN - level of urbanisation in the district as measured by the share of urban population in total population PRIMEDU - proportion of individuals who are educated at primary level or below MIDGRADEDU - proportion of individuals educated at secondary level and above SHSCSTPOP - represents the proportion of SC/ST population in total population (to capture social backwardness)
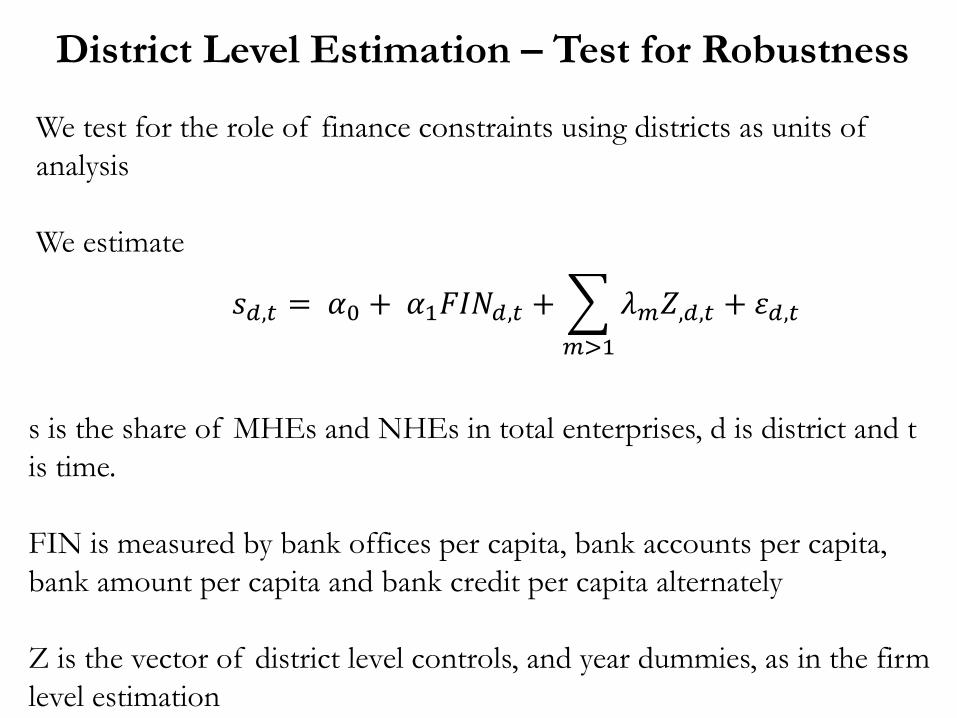
District Level Estimation – Test for Robustness
We test for the role of finance constraints using districts as units of analysis We estimate
𝑠𝑑,𝑡 = 𝛼0 + 𝛼1𝐹𝐹𝐹𝑑,𝑡 + � 𝜆𝑚𝑍,𝑑,𝑡𝑚>1
+ 𝜀𝑑,𝑡
s is the share of MHEs and NHEs in total enterprises, d is district and t is time. FIN is measured by bank offices per capita, bank accounts per capita, bank amount per capita and bank credit per capita alternately Z is the vector of district level controls, and year dummies, as in the firm level estimation

IV ESTIMATION
Endogeneity of Firm Specific and District Specific Finance Constraints Reverse Causality can work both ways – NHEs need external finance to purchase machines and hire workers; larger firms more likely to receive loans. As instruments, we choose variables that capture the Supply Side of Financial Intermediation.
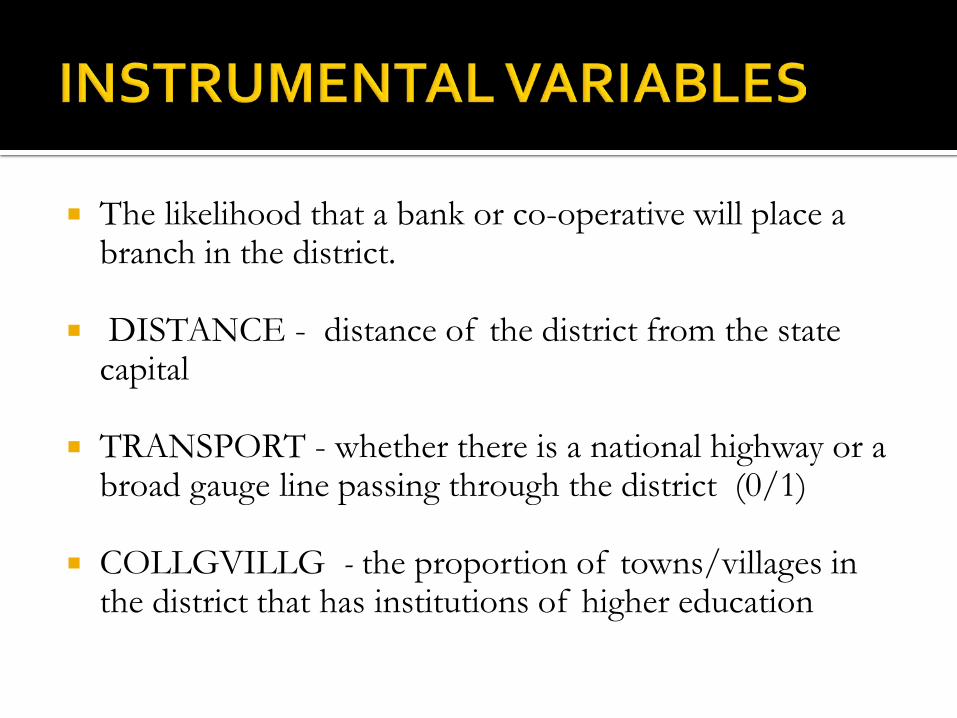
The likelihood that a bank or co-operative will place a branch in the district.
DISTANCE - distance of the district from the state capital
TRANSPORT - whether there is a national highway or a broad gauge line passing through the district (0/1)
COLLGVILLG - the proportion of towns/villages in the district that has institutions of higher education
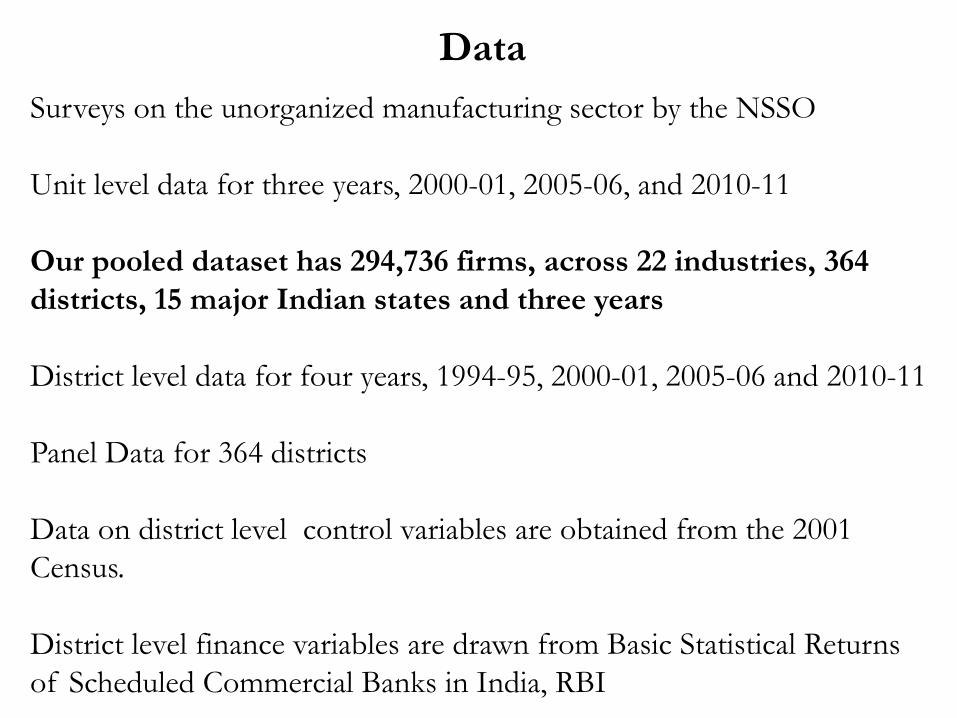
Surveys on the unorganized manufacturing sector by the NSSO Unit level data for three years, 2000-01, 2005-06, and 2010-11 Our pooled dataset has 294,736 firms, across 22 industries, 364 districts, 15 major Indian states and three years District level data for four years, 1994-95, 2000-01, 2005-06 and 2010-11 Panel Data for 364 districts Data on district level control variables are obtained from the 2001 Census. District level finance variables are drawn from Basic Statistical Returns of Scheduled Commercial Banks in India, RBI
Data
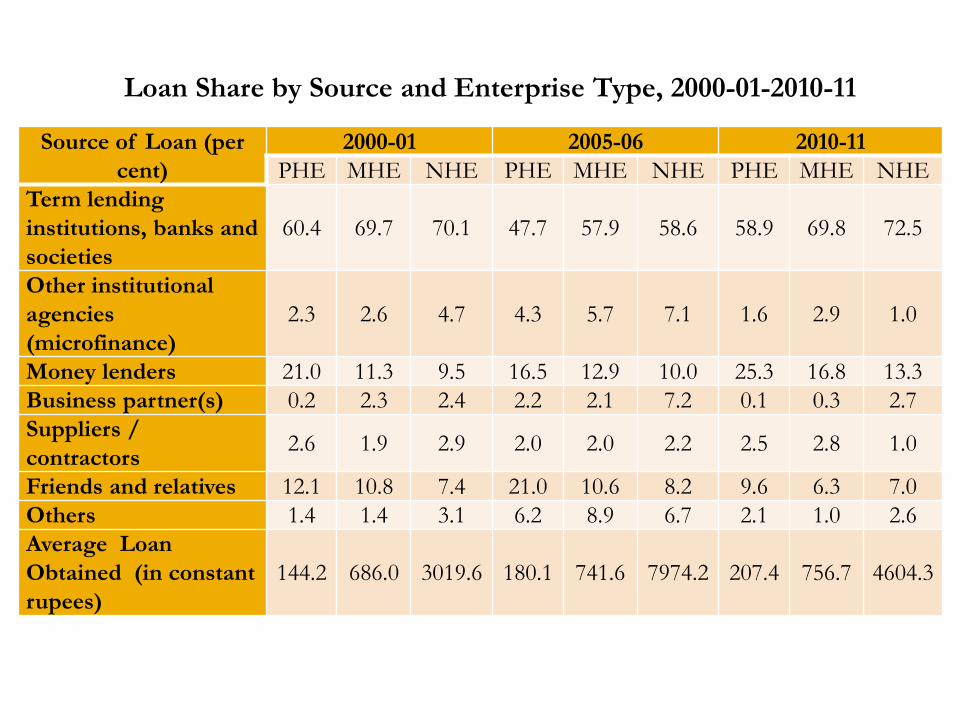
Source of Loan (per cent)
2000-01 2005-06 2010-11 PHE MHE NHE PHE MHE NHE PHE MHE NHE
Term lending institutions, banks and societies
60.4 69.7 70.1 47.7 57.9 58.6 58.9 69.8 72.5
Other institutional agencies (microfinance)
2.3 2.6 4.7 4.3 5.7 7.1 1.6 2.9 1.0
Money lenders 21.0 11.3 9.5 16.5 12.9 10.0 25.3 16.8 13.3 Business partner(s) 0.2 2.3 2.4 2.2 2.1 7.2 0.1 0.3 2.7 Suppliers / contractors 2.6 1.9 2.9 2.0 2.0 2.2 2.5 2.8 1.0
Friends and relatives 12.1 10.8 7.4 21.0 10.6 8.2 9.6 6.3 7.0 Others 1.4 1.4 3.1 6.2 8.9 6.7 2.1 1.0 2.6 Average Loan Obtained (in constant rupees)
144.2 686.0 3019.6 180.1 741.6 7974.2 207.4 756.7 4604.3
Loan Share by Source and Enterprise Type, 2000-01-2010-11
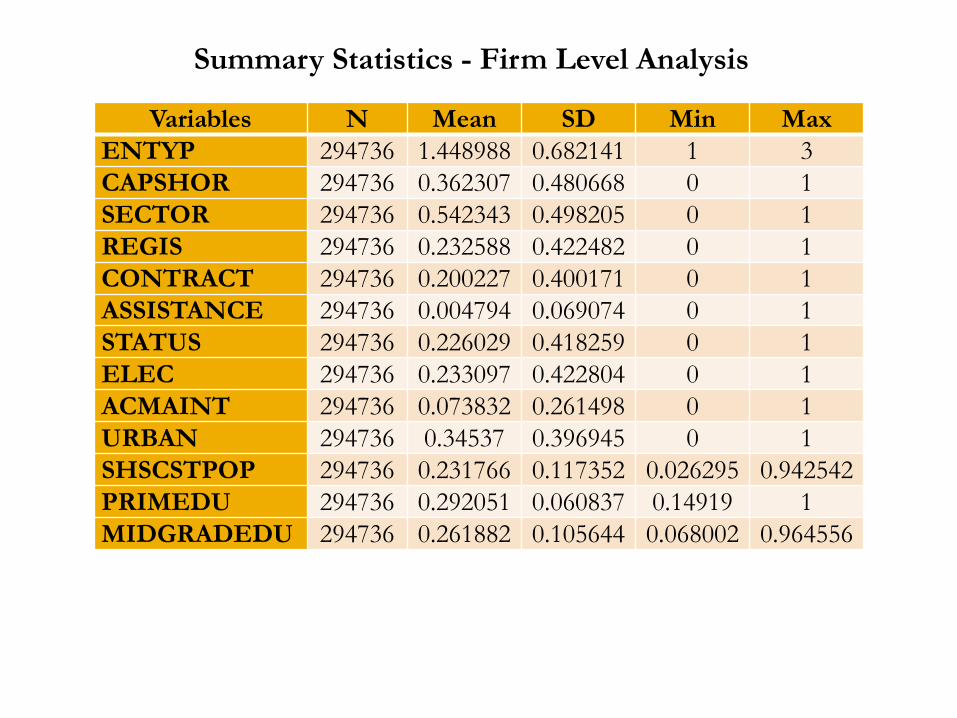
Variables N Mean SD Min Max ENTYP 294736 1.448988 0.682141 1 3 CAPSHOR 294736 0.362307 0.480668 0 1 SECTOR 294736 0.542343 0.498205 0 1 REGIS 294736 0.232588 0.422482 0 1 CONTRACT 294736 0.200227 0.400171 0 1 ASSISTANCE 294736 0.004794 0.069074 0 1 STATUS 294736 0.226029 0.418259 0 1 ELEC 294736 0.233097 0.422804 0 1 ACMAINT 294736 0.073832 0.261498 0 1 URBAN 294736 0.34537 0.396945 0 1 SHSCSTPOP 294736 0.231766 0.117352 0.026295 0.942542 PRIMEDU 294736 0.292051 0.060837 0.14919 1 MIDGRADEDU 294736 0.261882 0.105644 0.068002 0.964556
Summary Statistics - Firm Level Analysis
0.1
.2.3
.4 m
ean
PHE MHE NHE
CAPSHOR
0.2
.4.6
.8 m
ean
PHE MHE NHE
LOCATION
0.2
.4.6
.8 m
ean
PHE MHE NHE
REGIS
0.0
5.1
.15
.2.2
5 m
ean
PHE MHE NHE
LINKAGE
0.0
02.0
04.0
06.0
08 m
ean
PHE MHE NHE
ASSISTANCE0
.1.2
.3 m
ean
PHE MHE NHE
STATUS
0.1
.2.3
.4 m
ean
PHE MHE NHE
ELEC
0.1
.2.3
.4.5
mea
n
PHE MHE NHE
URBAN
0.0
5.1
.15
.2.2
5 m
ean
PHE MHE NHE
SHSCSTPOP
0.1
.2.3
mea
n
PHE MHE NHE
PRIMEDU
0.1
.2.3
mea
n
PHE MHE NHE
MIDGRADEDU
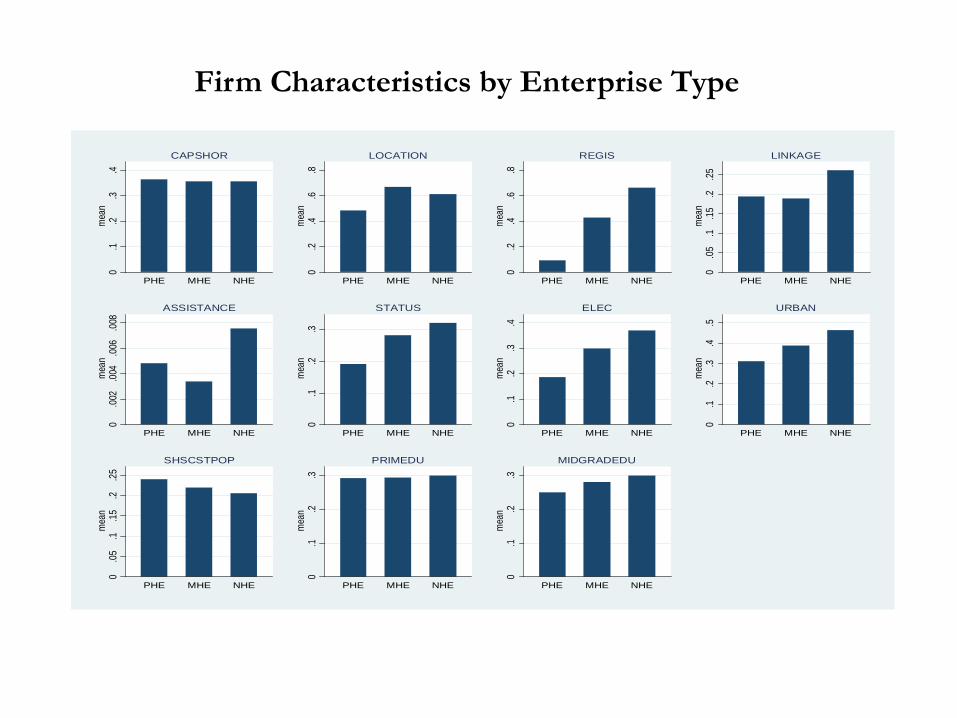
Firm Characteristics by Enterprise Type
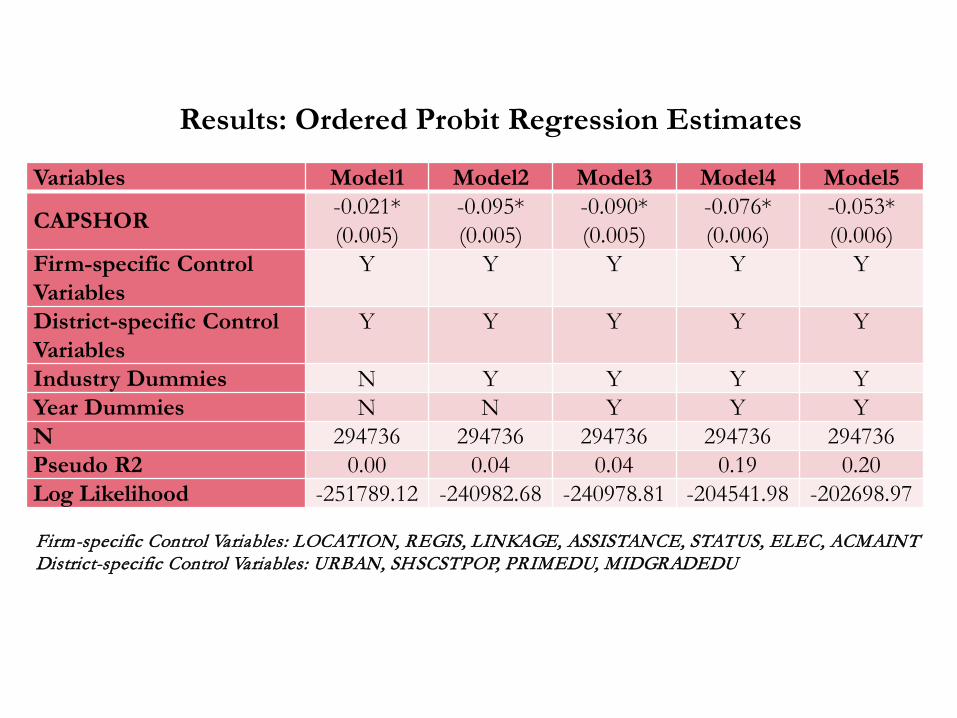
Variables Model1 Model2 Model3 Model4 Model5
CAPSHOR -0.021* (0.005)
-0.095* (0.005)
-0.090* (0.005)
-0.076* (0.006)
-0.053* (0.006)
Firm-specific Control Variables
Y Y Y Y Y
District-specific Control Variables
Y Y Y Y Y
Industry Dummies N Y Y Y Y Year Dummies N N Y Y Y N 294736 294736 294736 294736 294736 Pseudo R2 0.00 0.04 0.04 0.19 0.20 Log Likelihood -251789.12 -240982.68 -240978.81 -204541.98 -202698.97
Results: Ordered Probit Regression Estimates
Firm-specific Control Variables: LOCATION, REGIS, LINKAGE, ASSISTANCE, STATUS, ELEC, ACMAINT District-specific Control Variables: URBAN, SHSCSTPOP, PRIMEDU, MIDGRADEDU
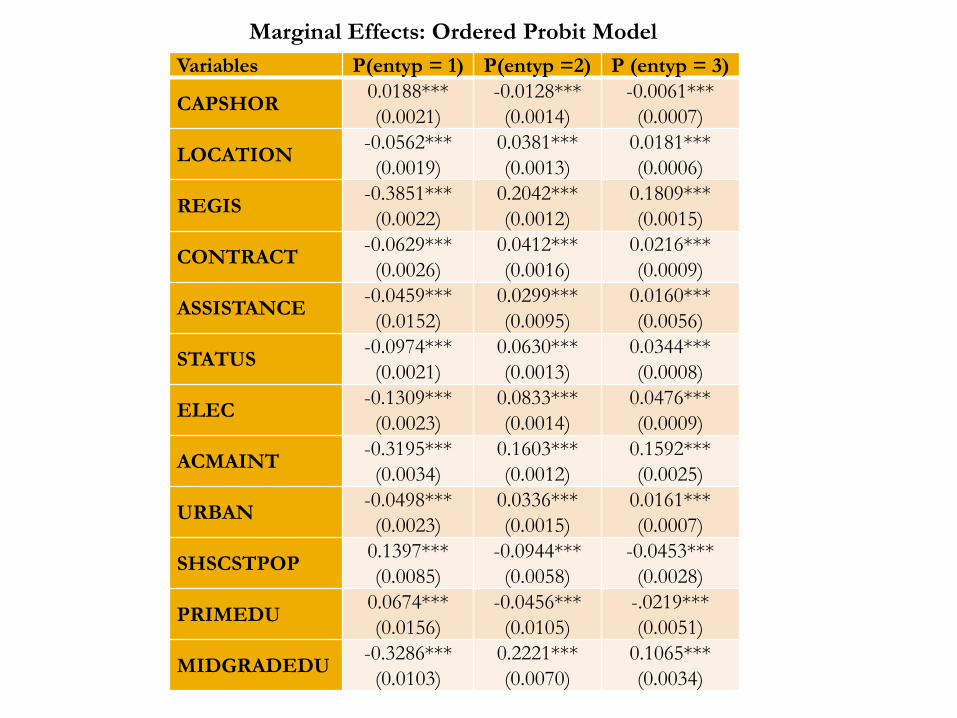
Variables P(entyp = 1) P(entyp =2) P (entyp = 3)
CAPSHOR 0.0188*** (0.0021)
-0.0128*** (0.0014)
-0.0061*** (0.0007)
LOCATION -0.0562*** (0.0019)
0.0381*** (0.0013)
0.0181*** (0.0006)
REGIS -0.3851*** (0.0022)
0.2042*** (0.0012)
0.1809*** (0.0015)
CONTRACT -0.0629*** (0.0026)
0.0412*** (0.0016)
0.0216*** (0.0009)
ASSISTANCE -0.0459*** (0.0152)
0.0299*** (0.0095)
0.0160*** (0.0056)
STATUS -0.0974*** (0.0021)
0.0630*** (0.0013)
0.0344*** (0.0008)
ELEC -0.1309*** (0.0023)
0.0833*** (0.0014)
0.0476*** (0.0009)
ACMAINT -0.3195*** (0.0034)
0.1603*** (0.0012)
0.1592*** (0.0025)
URBAN -0.0498*** (0.0023)
0.0336*** (0.0015)
0.0161*** (0.0007)
SHSCSTPOP 0.1397*** (0.0085)
-0.0944*** (0.0058)
-0.0453*** (0.0028)
PRIMEDU 0.0674*** (0.0156)
-0.0456*** (0.0105)
-.0219*** (0.0051)
MIDGRADEDU -0.3286*** (0.0103)
0.2221*** (0.0070)
0.1065*** (0.0034)
Marginal Effects: Ordered Probit Model
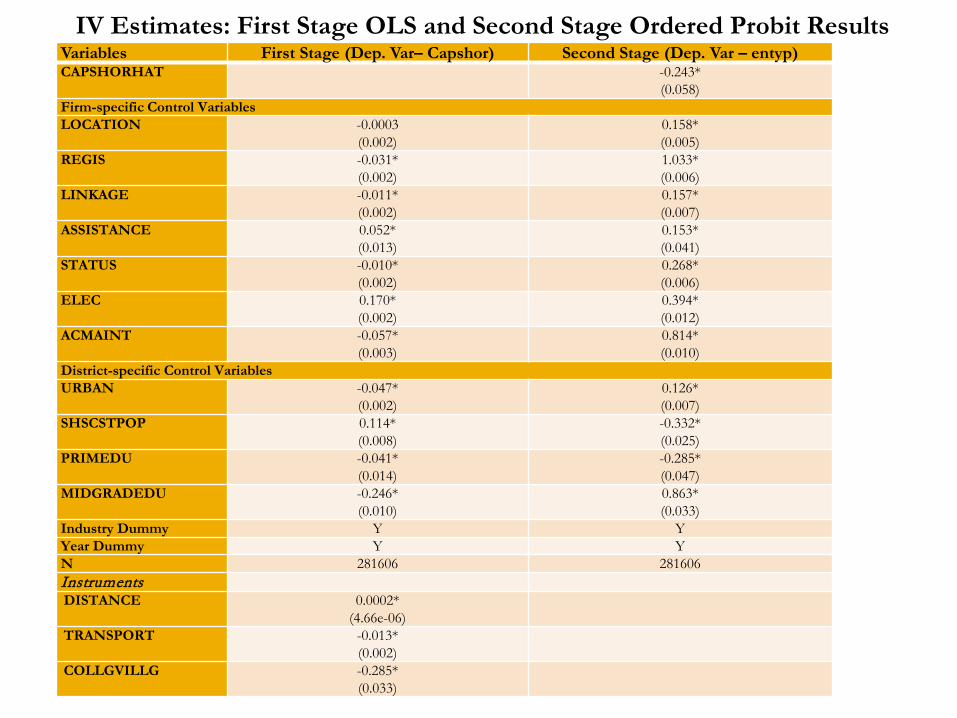
Variables First Stage (Dep. Var– Capshor) Second Stage (Dep. Var – entyp) CAPSHORHAT -0.243*
(0.058) Firm-specific Control Variables LOCATION -0.0003
(0.002) 0.158* (0.005)
REGIS -0.031* (0.002)
1.033* (0.006)
LINKAGE -0.011* (0.002)
0.157* (0.007)
ASSISTANCE 0.052* (0.013)
0.153* (0.041)
STATUS -0.010* (0.002)
0.268* (0.006)
ELEC 0.170* (0.002)
0.394* (0.012)
ACMAINT -0.057* (0.003)
0.814* (0.010)
District-specific Control Variables URBAN -0.047*
(0.002) 0.126* (0.007)
SHSCSTPOP 0.114* (0.008)
-0.332* (0.025)
PRIMEDU -0.041* (0.014)
-0.285* (0.047)
MIDGRADEDU -0.246* (0.010)
0.863* (0.033)
Industry Dummy Y Y Year Dummy Y Y N 281606 281606 Instruments DISTANCE 0.0002*
(4.66e-06) TRANSPORT -0.013*
(0.002) COLLGVILLG -0.285*
(0.033)
IV Estimates: First Stage OLS and Second Stage Ordered Probit Results
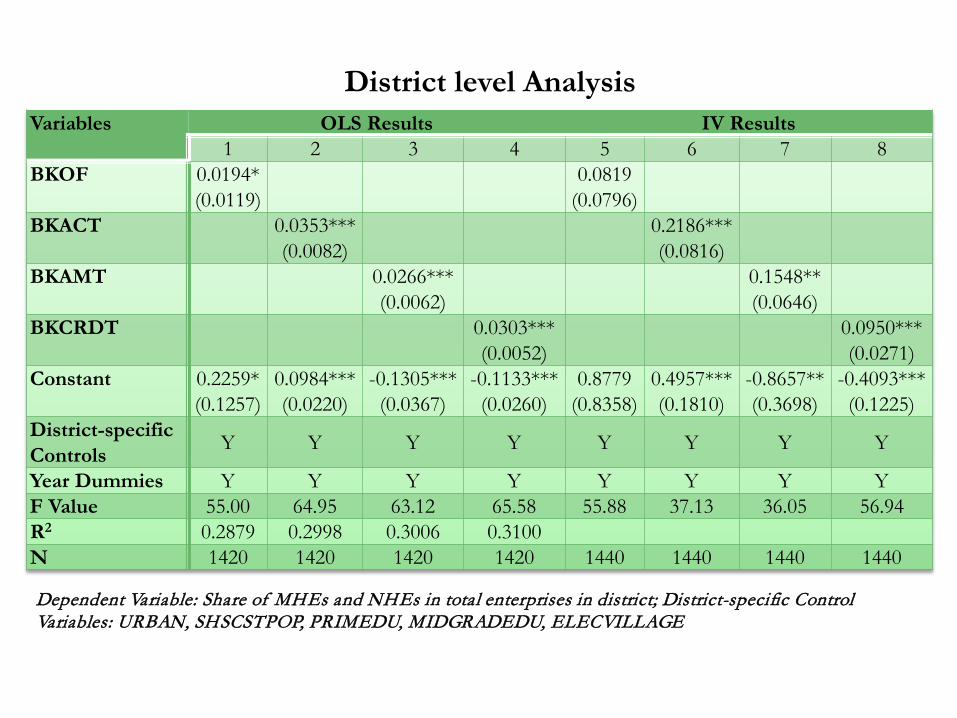
Variables OLS Results IV Results 1 2 3 4 5 6 7 8
BKOF 0.0194* (0.0119) 0.0819
(0.0796)
BKACT 0.0353*** (0.0082) 0.2186***
(0.0816)
BKAMT 0.0266*** (0.0062) 0.1548**
(0.0646)
BKCRDT 0.0303*** (0.0052) 0.0950***
(0.0271) Constant 0.2259*
(0.1257) 0.0984*** (0.0220)
-0.1305*** (0.0367)
-0.1133*** (0.0260)
0.8779 (0.8358)
0.4957*** (0.1810)
-0.8657** (0.3698)
-0.4093*** (0.1225)
District-specific Controls Y Y Y Y Y Y Y Y
Year Dummies Y Y Y Y Y Y Y Y F Value 55.00 64.95 63.12 65.58 55.88 37.13 36.05 56.94 R2 0.2879 0.2998 0.3006 0.3100 N 1420 1420 1420 1420 1440 1440 1440 1440
District level Analysis
Dependent Variable: Share of MHEs and NHEs in total enterprises in district; District-specific Control Variables: URBAN, SHSCSTPOP, PRIMEDU, MIDGRADEDU, ELECVILLAGE
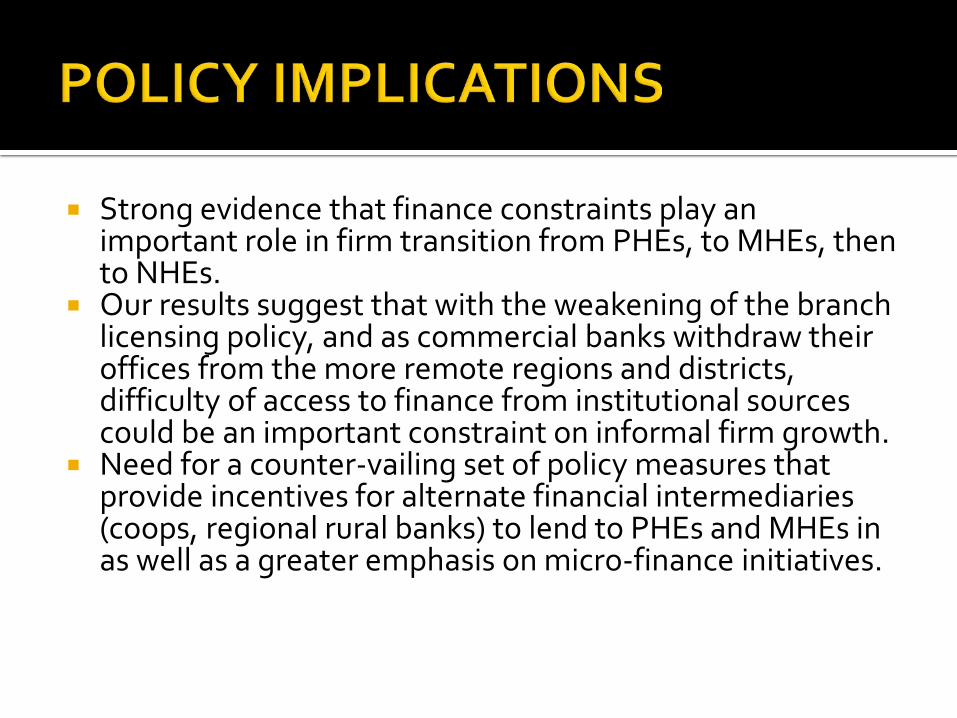
Strong evidence that finance constraints play an important role in firm transition from PHEs, to MHEs, then to NHEs.
Our results suggest that with the weakening of the branch licensing policy, and as commercial banks withdraw their offices from the more remote regions and districts, difficulty of access to finance from institutional sources could be an important constraint on informal firm growth.
Need for a counter-vailing set of policy measures that provide incentives for alternate financial intermediaries (coops, regional rural banks) to lend to PHEs and MHEs in as well as a greater emphasis on micro-finance initiatives.
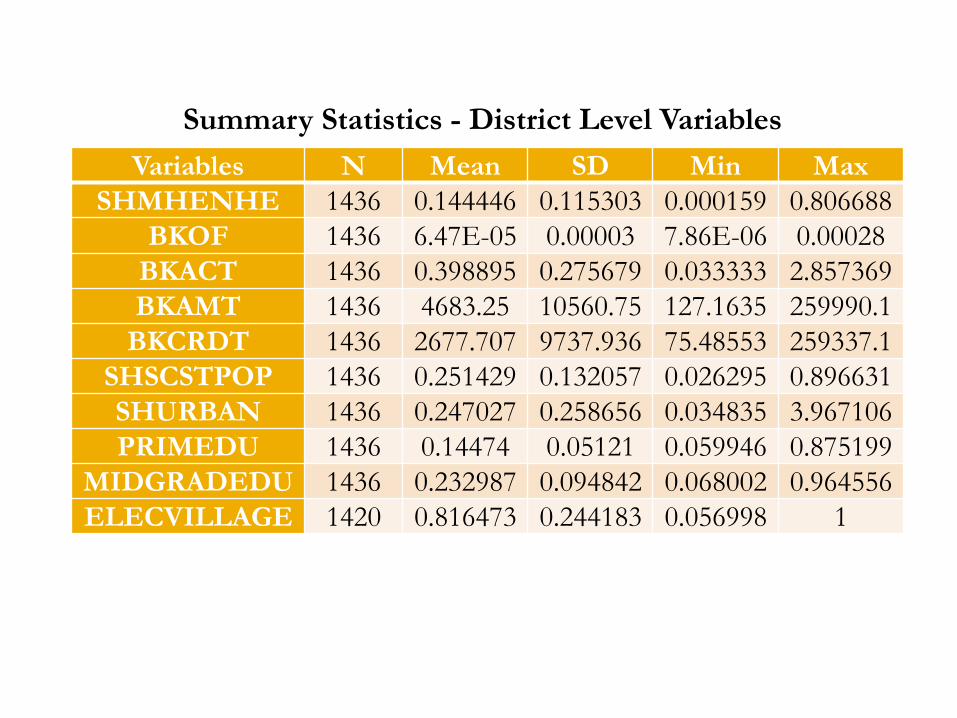
Variables N Mean SD Min Max SHMHENHE 1436 0.144446 0.115303 0.000159 0.806688
BKOF 1436 6.47E-05 0.00003 7.86E-06 0.00028 BKACT 1436 0.398895 0.275679 0.033333 2.857369 BKAMT 1436 4683.25 10560.75 127.1635 259990.1
BKCRDT 1436 2677.707 9737.936 75.48553 259337.1 SHSCSTPOP 1436 0.251429 0.132057 0.026295 0.896631 SHURBAN 1436 0.247027 0.258656 0.034835 3.967106 PRIMEDU 1436 0.14474 0.05121 0.059946 0.875199
MIDGRADEDU 1436 0.232987 0.094842 0.068002 0.964556 ELECVILLAGE 1420 0.816473 0.244183 0.056998 1
Summary Statistics - District Level Variables