Embed Size (px)
Citation preview
EAST TENNESSEE STATE UNIVERSITY BOARD OF TRUSTEES
FINANCE AND ADMINISTRATION COMMITTEE MARCH 2018 SPECIAL CALLED MEETING
3:00-4:00pm EDT Thursday March 29, 2018
President’s Conference Room Burgin Dossett Hall Room 206
1276 Gilbreath Drive Johnson City, TN
AGENDA
I. Call to Order
II. Roll Call – special instructions for telephonic meetings
III. Approval of Salary Increase for 2018-19
IV. Approval of Mandatory and Non-Mandatory Fees for 2018-19
V. 2018-19 Budget Proposals
VI. Other Business
VII. Adjournment
Finance and Administration Committee [Special Called Meeting] - 3/29/2018 1
EAST TENNESSEE STATE UNIVERSITY BOARD OF TRUSTEES
ACTION ITEM
DATE: March 29, 2018
ITEM: Salary Increase Proposal for 2018-19
COMMITTEE: Finance and Administration Committee
RECOMMENDED ACTION: Approve (Roll Call Vote)
PRESENTED BY: B.J. King Acting Chief Financial Officer
The Governor’s Budget was released in conjunction with the State of the State address on January 29, 2018. The budget related to higher education can be found at https://www.tn.gov/content/dam/tn/governorsoffice-documents/governorsoffice-documents/sots-2018/2019BudgetDocumentVol1.pdf.
The Governor has recommended a 2.5% salary pool for higher education. The dollar appropriation for the 2.5% salary pool is 60% of the funding required to implement the pool. The remaining 40% will be funded through student fee increases.
$ Needed for Governor’s Proposed Funded through 2.5% Pool 2.5% Pool Student Fees or
Other Sources
Main Campus $3,000,000 $1,842,30000 $1,157,700
The university is currently engaging the services of a consultant to review all functions in Human Resources, including compensation. Management is recommending an across the board 2.5% salary increase for fiscal year 2018-19. We anticipate discussing the consultant recommendations on compensation with the committee when a report is prepared.
The table below shows the salary increase implementation for the past ten years.
Finance and Administration Committee [Special Called Meeting] - 3/29/2018 2

Across the Equity Increase Service
Year Board Increase To Market Bonus 2018-19 (1) 2.5% $500 min (2) 2017-18 2.0% $500 min (2) 1% pool $3,000 ceiling 2016-17 2.0% $500 min (2) 2015-16 2.0% $500 min (2) Pharmacy faculty only 2014-15 0.0% 2013-14 1.5% $250 min (2) 4.25% 2012-13 2.5% $750 min (2) 8.50% $5,000 ceiling 2011-12 3.0% $750 min (2) $1,000.00 2 years + (3) 2010-11 0.0% Pharmacy faculty only 2009-10 0.0% 2008-09 0.0% $400.00 3 years + (3) (1) Proposed 2.5% across-the-board increase with a $500 minimum. (2) Employees with annual performance evaluations which are either unsatisfactory or performance far below expectations do not participate in salary increases. (3) Service bonus is prorated based on percentage of contract.
MOTION: I move that the Finance and Administration Committee recommend adoption of the following Resolution by the Board of Trustees:
RESOLVED: The proposed salary increase for 2018-19 is approved as presented in the meeting materials contingent on the approval of the Governor’s budget and the approval of the THEC binding fee limit in May.
Finance and Administration Committee [Special Called Meeting] - 3/29/2018 3

EAST TENNESSEE STATE UNIVERSITY
BOARD OF TRUSTEES
ACTION ITEM DATE:
March 29, 2018
ITEM:
Mandatory and Non-Mandatory Fee Proposals for 2018-19
COMMITTEE:
Finance and Administration Committee
RECOMMNEDED ACTION: Approve (Roll Call Vote)
PRESENTED BY:
B.J. King Acting Chief Financial Officer
The history of student fees for the last five years is presented below with a comparison to the other Tennessee Locally Governed Institutions (LGIs) and the University of Tennessee system schools.
Maintenance Fees
% % % % %
2013-14 Incr 2014-15 Incr 2015-16 Incr 2016-17 Incr 2017-18 Incr
Austin Peay $5,874 3.2% $6,198 5.5% $6,348 2.4% $6,522 2.7% $6,696 2.67%
East Tennessee 6,198 4.7% 6,630 7.0% 6,828 3.0% 7,002 2.5% 7,224 3.17%
Middle Tennessee 6,222 5.5% 6,552 5.3% 6,756 3.1% 6,930 2.6% 7,176 3.93%
Tennessee State 5,844 1.2% 6,198 6.1% 6,378 2.9% 6,528 2.4% 6,726 2.76%
Tennessee Tech 6,096 6.1% 6,474 6.2% 7,182 10.9% 7,380 2.8% 7,656 3.77%
University of Memphis 7,410 6.2% 7,410 0.0% 7,686 3.7% 7,860 2.3% 8,064 2.15%
UT Chattanooga 6,065 6.0% 6,430 6.0% 6,624 3.0% 6,768 2.2% 6,888 1.77%
UT Knoxville1 8,648 10.8% 9,493 9.8% 10,190 7.3% 10,858 6.5% 11,110 1.93%
UT Martin2 6,336 6.0% 6,716 6.0% 6,918 3.0% 7,375 6.6% 7,818 1.8%
University Average $6,521 5.5% $6,900 5.8% $7,212 4.4% $7,469 3.4% $7,706 2.66%
Finance and Administration Committee [Special Called Meeting] - 3/29/2018 4

Mandatory Fees
% % % % %
2013-14 Incr 2014-15 Incr 2015-16 Incr 2016-17 Incr 2017-18 Incr
Austin Peay $1,284 4.9% $1,264 -1.6% $1,453 15.0% $1,473 1.4% $1,529 3.8%
East Tennessee 1,345 25.1% 1,355 .7% 1,649 21.7% 1,669 1.2% 1,791 7.31%
Middle Tennessee 1,618 1.5% 1,636 1.1% 1,648 0.7% 1,660 .7% 1,772 5.48%
Tennessee State 930 0.0% 1,026 10.3% 1,039 1.3% 1,039 0.0% 1,050 1.06%
Tennessee Tech 1,287 7.3% 1,511 17.4% 1,171 -
22.5% 1,171 0.0% 1,217 3.93%
University of Memphis 1,256 0.0% 1,563 24.4% 1,583 1.3% 1,637 3.4% 1,637 0.0%
UT Chattanooga 1,490 0.0% 1,708 14.6% 1,732 1.4% 1,776 2.5% 1,776 0.0%
UT Knoxville 1,414 9.6% 1,510 6.8% 1,758 16.4% 1,810 3.0% 1,860 2.76%
UT Martin 1,178 6.8% 1,308 11.0% 1,408 7.6% 1,408 0.0% 1,418 0.71%
University Average $1,311 6.1% $1,431 9.4% $1,477 4.7% $1,508 1.4% $1,508 2.8%
Total Maintenance and Mandatory Fees
% % % % %
2013-14 Incr 2014-15 Incr 2015-16 Incr 2016-17 Incr 2017-18 Incr
Austin Peay $7,158 3.5% $7,462 4.2% $7,801 4.5% $7,995 2.5% $8,225 2.88%
East Tennessee 7,543 7.8% 7,985 5.9% 8,477 6.2% 8,671 2.3% 9,015 3.97%
Middle Tennessee 7,840 4.6% 8,188 4.4% 8,404 2.6% 8,590 2.2% 8,948 3.93%
Tennessee State 6,774 1.1% 7,224 6.6% 7,417 2.7% 7,567 2.0% 7,776 2.76%
Tennessee Tech 7,383 6.3% 7,985 8.2% 8,353 4.6% 8,551 2.4% 8,873 3.77%
University of Memphis 8,666 5.2% 8,973 3.5% 9,269 3.3% 9,497 2.5% 9,701 2.15%
UT Chattanooga 7,555 4.8% 8,138 7.7% 8,356 2.7% 8,544 2.2% 8,664 1.4%
UT Knoxville1 10,062 10.7% 11,003 9.4% 11,948 8.6% 12,668 6.0% 12,970 1.93%
UT Martin2 7,514 6.5% 8,024 6.8% 8,326 3.8% 8,783 5.5% 9,236 1.65%
University Average $7,833 5.6% $8,331 6.3% $8,706 4.3% $8,985 3.1% $9,268 2.72%
1 - The 2013-14 to 2016-17 maintenance rates for students admitted in the Fall 2013 or later at UT Knoxville are flat rates for 15 semester credit hours, regardless of the number of credit hours taken by the student. This policy was approved in 2012 by the UT Board for introduction in Fall 2013. Eventually, each class will be charged for 15 credit hours and tuition increases will be applied to cohorts. The rates represented here are weighted averages. 2 - The 2016-17 tuition rate for full-time students who have completed fewer than 60 credit hours is a flat rate for 15 hours a semester regardless of how many hours the student is enrolled in. Part-time students and full-time students who have completed more than 60 credit hours are charged a flat rate for 12 hours regardless of how many hours the student is enrolled in. The rates represented here are weighted averages.
Finance and Administration Committee [Special Called Meeting] - 3/29/2018 5

The Tennessee Higher Education Commission has proposed a binding limit on maintenance and mandatory fees of 3%. The binding limit will be finalized at the May 17th THEC meeting. The limit last year was 4% and the university increased these fees 3.97%. This year the university is proposing a 2.91% increase, which would be 2.74% in maintenance fee increase and the remainder in mandatory fees.
Any committee approved or Board approved fees are contingent on the approval of the Governor’s budget and the approval of the THEC binding fee limit in May. Should the Governor’s budget or the THEC binding limit be lowered after Board approval of fees, the Board and the university will lower fees accordingly and adjust the budget for fiscal year 2019.
MOTION: I move that the Finance and Administration Committee recommend adoption of the following Resolution by the Board of Trustees:
RESOLVED: The proposed mandatory and non-mandatory fees for 2018-19 is approved as presented in the meeting materials contingent on the approval of the Governor’s budget and the approval of the THEC binding fee limit in May.
Finance and Administration Committee [Special Called Meeting] - 3/29/2018 6

Maintenance Fee Request - Per Semester
2017-18
2018-19 Prior Revenue
Actual Proposed $ Increase
% Increase
Increase Generated Justification
Undergraduate @ 15 hrs
$3,612
$3,711 $99 2.74% 3.17% Unfunded salary pool $1.2M, scholarship increases with tuition $1.2M, budgeted enrollment decline 100 students $760k, inflation
UG Out of State
9,339 9,591 252 2.70% 3.22%
$3,330,000 Graduate @ 9 hrs
4,122 4,230 108 2.62% 3.15%
Grad Out of State
7,353 7,560 207 2.82% 3.16%
College of Medicine M1, M1, M4
15,779
16,095 316 2% 2% $130,000 Cost study conducted
College of Medicine M3
20,986
21,406 420 2% 2% $59,000 Cost study conducted
College of Pharmacy
18,045
18,586 541 3% 3% 329,000 Cost study conducted
Finance and Administration Committee [Special Called Meeting] - 3/29/2018 7

Mandatory Fee Request – Per Semester
Fee Capped at 8 credit hours Request Prior Revenue Description Current Proposed Increase Increase Generated Justification
Facilities Fee $40/$5 per hr $60.00 $20/$2.5
per hr Established
2017-18 $493,000
Increase funds for the designated pool for specific campus renovation or constructions projects including classroom enhancements and campus improvements.
Technology Access Fee Year 2 of a 5 year request
$120.50/$15 per hr $132.50 $12/$2
per hr
2017-18 $8/$1 per
hr $296,000
Increased bandwidth costs, Storage Area Network (SAN) for backup and student network storage, Network Access Control (NAC) technology improvements.
Finance and Administration Committee [Special Called Meeting] - 3/29/2018 8

Mandatory Fee Request – Per Semester Fee Capped at 8 credit hours
Per Request Hour Prior Revenue Description Current Proposed Increase Increase Generated Justification
Bluegrass Band Fee $100 flat $100 per hr
From flat to cr
hr charge
2015-16 $50
increase to $100 flat
$7,000
Advanced bands are 2 credit courses, others are 1 hour. Account for additional instruction and supervision costs.
Studio Art Fee $30 per hr $50 per hr $20 2015-16
$10 increase
$50,000
Cover rising costs of materials, equipment, technology, and related repairs and replacements. Make fee consistent with fee for Graphic Design courses. Comparable South Alabama at $45/hr. Eastern KY ranging from $30-75 hr.
Art Appreciation Fee NA $15 flat $15 flat NA $3,600
Apply similar fee to this new course consistent with previously approved Art History courses.
Social Work Field Practicum Fee $50 flat $75 flat $25 flat Established
2013-14 $7,000
Used to support field education activities including liaison to sites. Expansions to Asheville and Abingdon have increased overall support costs.
Specialized Business Fee $30 $35 $5 2016-17 $5
increase $162,051
Address increase costs in providing educational support. To continue to support faculty salaries in business disciplines, support for student services, instructional resources
Finance and Administration Committee [Special Called Meeting] - 3/29/2018 9

provided to the students, and facilities improvements. Increase in fees would allow the college to support the university enrollment growth goal.
Per Request Hour Prior Revenue
Description Current Proposed Increase Increase Generated Justification
Accelerated Masters in Business Administration
$25,000 $30,000 $5,000 2014-15 $5,000
increase $150,000
Approx. 30 students per year. To address increase in costs associated with the program: faculty/staff salaries, text books, premium facilities, and other state of the art resources.
CBAT Course Fee for 1 hour credit courses designed for international students
NA $150 $150 NA $87,000
Assessed to one-hour credit course for approx. 290 students per semester. To support current international students in the college, as well as pursue growth in the college.
Extended hours course section fee for ENGL 1020
NA $100 $100 NA $2,000
Create an extended-hours course section fee of $100 that will allow departments to offer sections of courses that meet up to 5 hours a week but award the same credit as sections that meet the customary 3 hours a week. ADDITIONAL BENEFITS: Charging a $100 fee for an extended-hours course section would lower costs for our international students, who currently pay nearly $300 –if they get
Finance and Administration Committee [Special Called Meeting] - 3/29/2018 10

the in-state rate—for ENGL 1009, a 1-credit lab.
Health Science Course Fee $40 $50 $10 Established
2013-14 $671,670
Support a strategic growth agenda that maximizes the student experience both inside and outside the classroom; Expand the foundation for excellence and innovation in all disciplines; Support community engagement and service.
Per Request Hour Prior Revenue Description Current Proposed Increase Increase Generated Justification
Silver 7 day Meal Plan $1,718 $1,758 $40/term $43/term
Revenue pass
through to Sodexo
Food Services is a 100% auxiliary enterprise operation in contract with Sodexo. The increase is 2.33% and is based on the consumer price index for Meals Away From Home. This increase is part of the contract with Sodexo to provide food service for the campus, including residential students.
Global Sports Leadership cohort fee - approved in June 2017
$575/cr hr in-state $630/cr
hr out-of -state
$615/cr hr in-state $670/cr
hr out-of -state
$40.00
Established in FY2015-
16
$16,320
To cover the increased costs of the required student travel, increases in instructional costs, recruitment expense and increase in faculty salary and benefits.
Finance and Administration Committee [Special Called Meeting] - 3/29/2018 11

Summary of Maintenance and Mandatory Fees Current Current Requested Total Before % increase Projected Projected % Increase
Appropriation Maintenance Other Total Other Maintenance Before Maintenance Total Total for Total Unit Fee Per Year Mandatory Mandatory Mandatory Increase Maint Inc Increase Increases Mandatory Mandatory
ETSU Undergrad @15 $ 7,224 $1,791 $ 9,015 $64 $ 9,079 0.71% $ 198 $ 262 $ 9,277 2.91% COM M1, M2, M4 31,558 2,131 33,689 64 33,761 0.19% 632 696 34,385 2.07% COM M3 41,972 2,834 44,806 86 44,902 0.19% 840 926 45,732 2.07% COP 36,090 1,556 37,646 64 37,718 0.17% 1,082 1,146 38,792 3.04%
Finance and Administration Committee [Special Called Meeting] - 3/29/2018 12

EAST TENNESSEE STATE UNIVERSITY BOARD OF TRUSTEES
DISCUSSION ITEM
DATE:
March 29, 2018
ITEM:
2018-19 Budget Proposals
COMMITTEE:
Finance and Administration Committee
PRESENTED BY:
B.J. King, Acting Chief Financial Officer
Main Campus Summary Budget Request
Estimated 2017-18 Proposed 2018-19 Increase (Decrease)
Revenue $ 251,328,810 $ 260,016,840 $ 8,688,030
Expenditures and Transfers
Instruction $ 106,490,300 $ 105,195,100 $ (1,295,200)
Research 3,157,300 1,149,700 (2,007,600)
Public Service 2,563,900 2,476,400 (87,500)
Academic Support 24,664,100 23,560,500 (1,103,600)
Student Services 25,475,100 25,819,400 344,300
Institutional Support 16,929,400 17,118,000 188,600
Facilities 17,469,700 17,301,300 (168,400)
Scholarships 30,109,300 32,483,200 2,373,900
Total before transfers 226,859,100 225,103,600 (1,755,500)
Debt Service 3,400,260 3,754,590 354,330
Non-Mandatory Transfers 5,808,710 5,328,810 (479,900)
Auxiliaries Exp & Tnfrs 26,116,260 25,646,730 (469,530)
Total $ 262,184,330 $ 259,833,730 $ (2,350,600)
Finance and Administration Committee [Special Called Meeting] - 3/29/2018 13
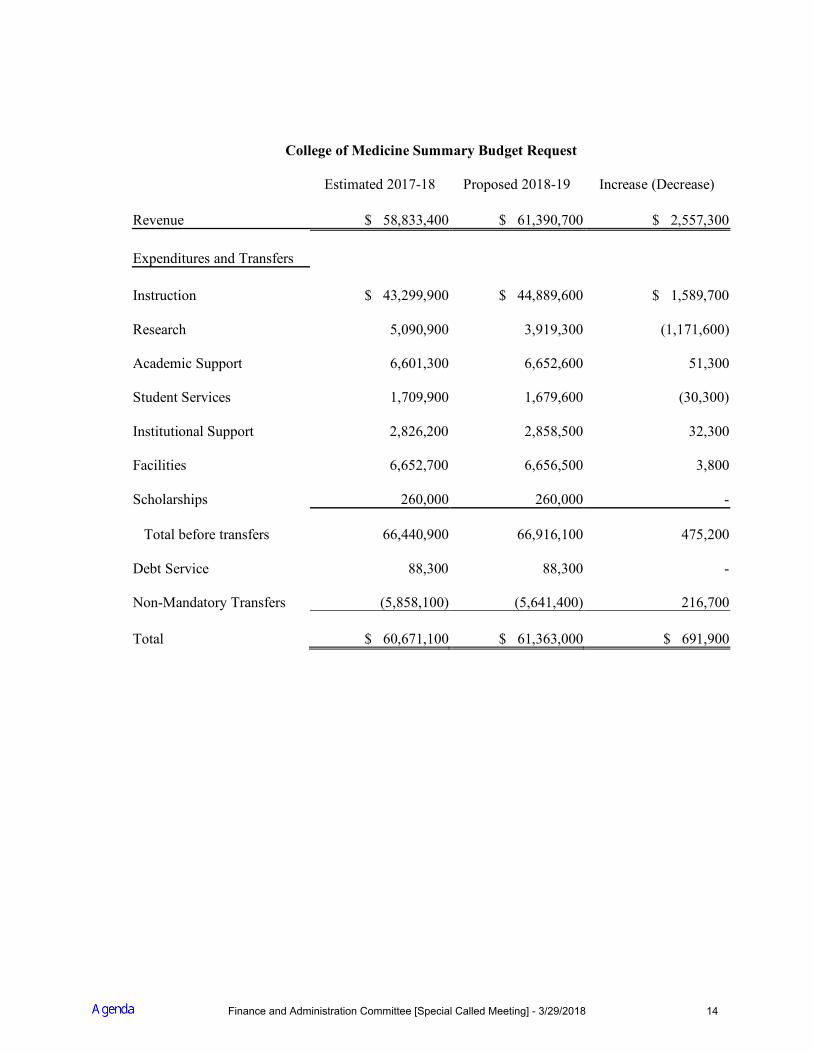
College of Medicine Summary Budget Request
Estimated 2017-18 Proposed 2018-19 Increase (Decrease)
Revenue $ 58,833,400 $ 61,390,700 $ 2,557,300
Expenditures and Transfers
Instruction $ 43,299,900 $ 44,889,600 $ 1,589,700
Research 5,090,900 3,919,300 (1,171,600)
Academic Support 6,601,300 6,652,600 51,300
Student Services 1,709,900 1,679,600 (30,300)
Institutional Support 2,826,200 2,858,500 32,300
Facilities 6,652,700 6,656,500 3,800
Scholarships 260,000 260,000 -
Total before transfers 66,440,900 66,916,100 475,200
Debt Service 88,300 88,300 -
Non-Mandatory Transfers (5,858,100) (5,641,400) 216,700
Total $ 60,671,100 $ 61,363,000 $ 691,900
Finance and Administration Committee [Special Called Meeting] - 3/29/2018 14
Family Medicine Summary Budget Request
Estimated 2017-18 Proposed 2018-19 Increase (Decrease)
Revenue $ 16,726,800 $ 17,151,000 $ 424,200
Expenditures and Transfers
Instruction $ 11,128,700 $ 11,482,800 $ 354,100
Research 352,000 334,800 (17,200)
Academic Support 3,395,500 3,601,600 206,100
Institutional Support 1,573,600 1,626,800 65,100
Facilities 394,000 377,000 (23,000)
Debt Service 262,900 262,900 -
Transfer from R&R (200,000) (545,000) (345,000)
Transfer from COM (100,000) - 100,000
Total $ 16,806,700 $ 17,140,900 $ 334,200
Finance and Administration Committee [Special Called Meeting] - 3/29/2018 15

College of Pharmacy Summary Budget Request
Estimated 2017-18 Proposed 2018-19 Increase (Decrease)
Revenue $ 11,168,300 $ 11,489,200 $ 320,900
Expenditures and Transfers
Instruction $ 6,850,000 $ 6,899,300 $ 49,300
Research 472,800 296,700 (176,100)
Academic Support 1,530,400 1,665,300 134,900
Student Services 677,900 661,400 (16,500)
Institutional Support 792,400 632,800 (159,600)
Facilities 527,400 521,100 (6,300)
Scholarships 410,000 215,000 (195,000)
Total before transfers 11,260,900 10,891,600 (369,300)
Debt Service 661,000 661,000 -
Nonmandatory Trfs 246,400 (63,500) (309,900)
Total $ 12,168,300 $ 11,489,100 $ (679,200)
Finance and Administration Committee [Special Called Meeting] - 3/29/2018 16

ETSU 2018-19 Budget Proposal
ETSUBT Finance CommitteeMarch 2018
Finance and Administration Committee [Special Called Meeting] - 3/29/2018 17

Governor’s Budget Recommendations
Main Campus COM FM Total
Operating Increase $ 1,708,000 $ - $ - $ 1,708,000
Salary 2.5% Pool 1,842,300 1,186,800 337,800 3,366,900
Insurance IncreaseIncreased revenue and expense 396,300 82,500 15,000 493,800
Total Increase $ 3,946,600 $ 1,269,300 $ 352,800 $ 5,568,700
Source: Governor’s 2018-19 Budget
Finance and Administration Committee [Special Called Meeting] - 3/29/2018 18

Governor’s Budget - Capital
State Funds Capital Maintenance
Campus HVAC Upgrades $ 2,740,000
CEB HVAC Repairs 1,800,000
Campus Water Lines Ph 1 1,500,000 Roof Replacements 1,000,000
Code Deficiencies Mem Ctr 1,600,000
$ 8,640,000
Capital Outlay
None Included
Source: Governor’s 2018-19 Budget
Finance and Administration Committee [Special Called Meeting] - 3/29/2018 19
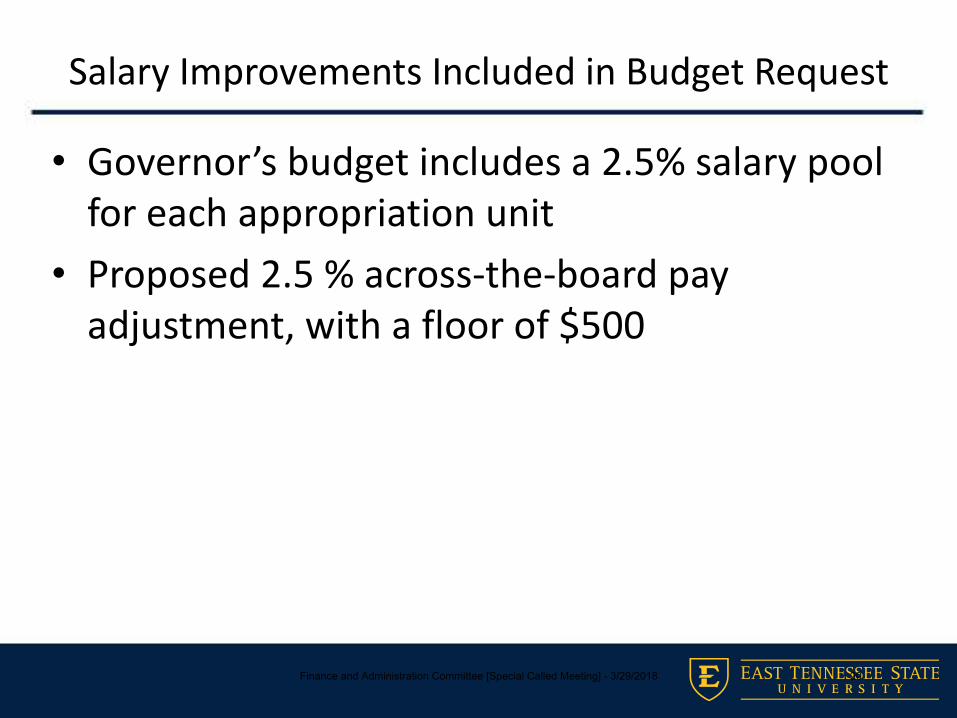
Salary Improvements Included in Budget Request
• Governor’s budget includes a 2.5% salary pool for each appropriation unit
• Proposed 2.5 % across-the-board pay adjustment, with a floor of $500
Finance and Administration Committee [Special Called Meeting] - 3/29/2018 20
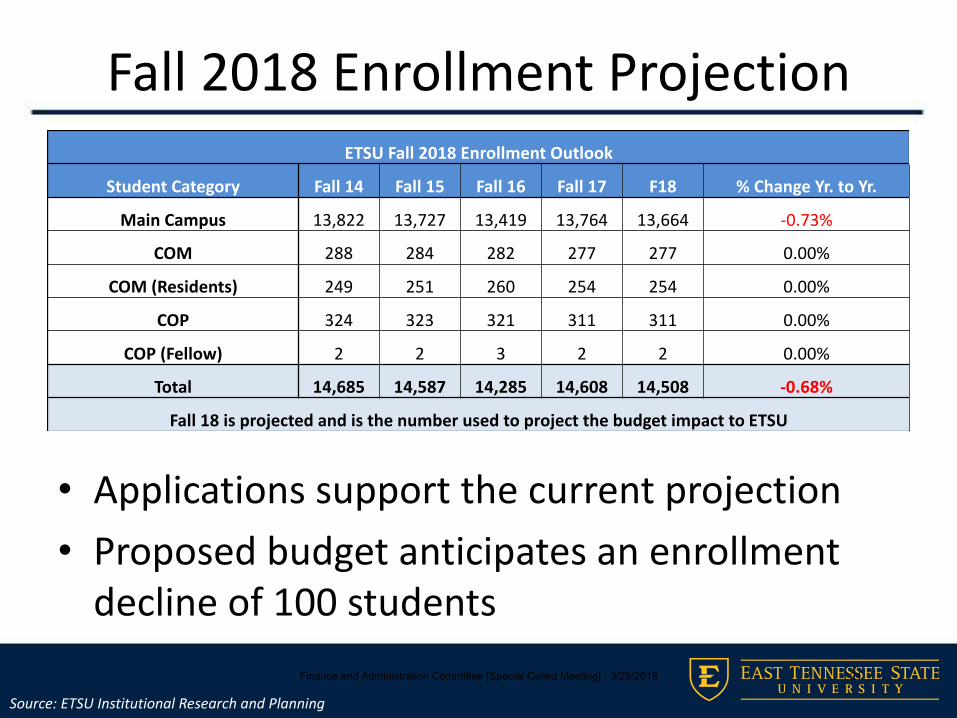
Fall 2018 Enrollment Projection
• Applications support the current projection• Proposed budget anticipates an enrollment
decline of 100 students
ETSU Fall 2018 Enrollment Outlook
Student Category Fall 14 Fall 15 Fall 16 Fall 17 F18 % Change Yr. to Yr.
Main Campus 13,822 13,727 13,419 13,764 13,664 -0.73%
COM 288 284 282 277 277 0.00%
COM (Residents) 249 251 260 254 254 0.00%
COP 324 323 321 311 311 0.00%
COP (Fellow) 2 2 3 2 2 0.00%
Total 14,685 14,587 14,285 14,608 14,508 -0.68%
Fall 18 is projected and is the number used to project the budget impact to ETSU
Source: ETSU Institutional Research and Planning
Finance and Administration Committee [Special Called Meeting] - 3/29/2018 21
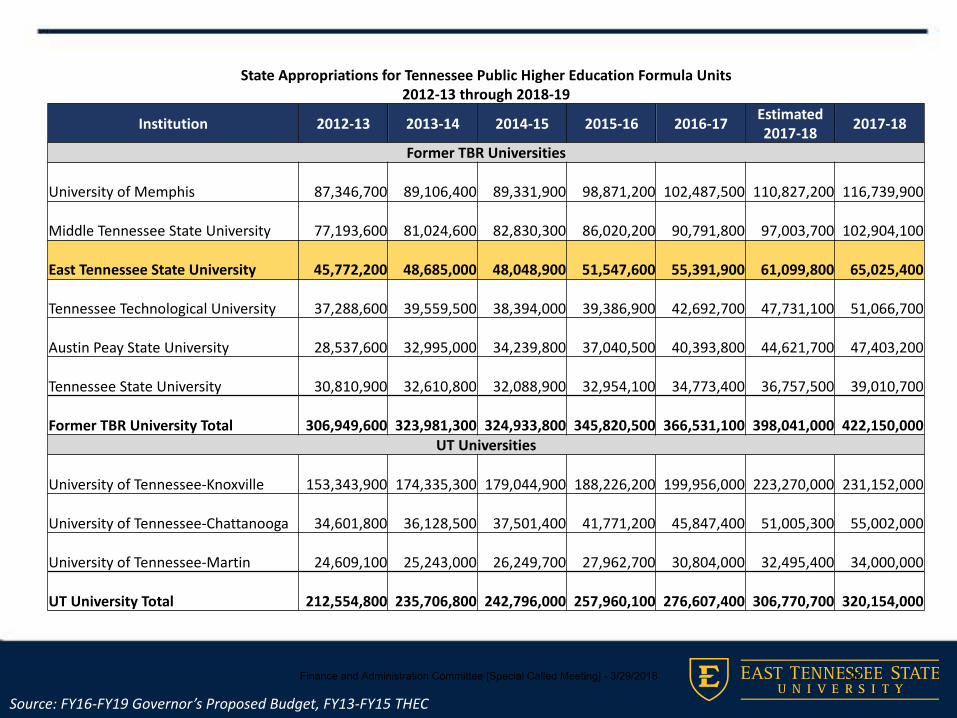
Source: FY16-FY19 Governor’s Proposed Budget, FY13-FY15 THEC
State Appropriations for Tennessee Public Higher Education Formula Units2012-13 through 2018-19
Institution 2012-13 2013-14 2014-15 2015-16 2016-17 Estimated 2017-18 2017-18
Former TBR Universities
University of Memphis 87,346,700 89,106,400 89,331,900 98,871,200 102,487,500 110,827,200 116,739,900
Middle Tennessee State University 77,193,600 81,024,600 82,830,300 86,020,200 90,791,800 97,003,700 102,904,100
East Tennessee State University 45,772,200 48,685,000 48,048,900 51,547,600 55,391,900 61,099,800 65,025,400
Tennessee Technological University 37,288,600 39,559,500 38,394,000 39,386,900 42,692,700 47,731,100 51,066,700
Austin Peay State University 28,537,600 32,995,000 34,239,800 37,040,500 40,393,800 44,621,700 47,403,200
Tennessee State University 30,810,900 32,610,800 32,088,900 32,954,100 34,773,400 36,757,500 39,010,700
Former TBR University Total 306,949,600 323,981,300 324,933,800 345,820,500 366,531,100 398,041,000 422,150,000 UT Universities
University of Tennessee-Knoxville 153,343,900 174,335,300 179,044,900 188,226,200 199,956,000 223,270,000 231,152,000
University of Tennessee-Chattanooga 34,601,800 36,128,500 37,501,400 41,771,200 45,847,400 51,005,300 55,002,000
University of Tennessee-Martin 24,609,100 25,243,000 26,249,700 27,962,700 30,804,000 32,495,400 34,000,000
UT University Total 212,554,800 235,706,800 242,796,000 257,960,100 276,607,400 306,770,700 320,154,000
Finance and Administration Committee [Special Called Meeting] - 3/29/2018 22

Maintenance/Tuition Proposal
Campus Per Term 17-18 Request Increase % PriorUndergraduate @15 $ 3,612 $ 3,711 $ 99 2.74% 3.17%
UG Out of State 9,339 9,591 252 2.70% 3.22%
Graduate @9 4,122 4,230 108 2.62% 3.15%
Grad Out of State 7,353 7,560 207 2.82% 3.16%
To fund $1.2M unfunded salary pool, increases in scholarships, and adjust for inflation and budgeted enrollment decline
COM M1, M2, M4 * 15,779 16,095 316 2.00% 2.00%
COM M3 * 20,986 21,406 420 2.00% 2.00%
Pharmacy * 18,045 18,586 541 3.00% 3.00%
* Adjustments based on cost study of peer institutions
Source: ETSU Business and Finance
Finance and Administration Committee [Special Called Meeting] - 3/29/2018 23

Source: THEC
Annual Undergraduate Tuition and Mandatory FeesBased on 15 Hour Enrollment for Fall and Spring Semesters
InstitutionLast Year Current Year
2016-17 2017-18 $ Increase % IncreaseLocally Governed Institutions
Austin Peay State University $7,995 $8,225 $230 2.88%East Tennessee State University 8,671 9,015 344 3.97%Middle Tennessee State University 8,610 8,948 388 3.93%Tennessee State University 7,567 7,776 209 2.76%Tennessee Technological University 8,551 8,873 322 3.77%University of Memphis 9,497 9,701 204 2.15%
UT UniversitiesUniversity of Tennessee-Chattanooga $8,544 $8,664 $120 1.40%University of Tennessee-Martin 8,783 8,927 144 1.64%University of Tennessee-Knoxville (15/4) 12,668 12,970 302 2.38%
ETSU Proposed Annual Undergraduate Tuition and Mandatory FeesBased on 15 Hour Enrollment for Fall and Spring Semesters
Institution2017-18 2018-19 $ Increase % Increase
East Tennessee State University 2018-19 $9,015 $9,277 $262 2.91%
Finance and Administration Committee [Special Called Meeting] - 3/29/2018 24

Tuition and Mandatory Fees
$7,375$7,739
$8,058 $8,226$8,561
$8,876$9,140
$6,529
$6,997
$7,543
$7,985
$8,477$8,671
$9,015
$5,000
$5,500
$6,000
$6,500
$7,000
$7,500
$8,000
$8,500
$9,000
$9,500
2011-12 2012-13 2013-14 2014-15 2015-16 2016-17 2017-18
Average Peer Tuition & Mandatory Fees
Peer Average East Tennessee State University
Source: ETSU Institutional Research and Planning
Finance and Administration Committee [Special Called Meeting] - 3/29/2018 25

ETSU Budget
• The FY2019 Proposed Budget is balanced & within available resources
• Undergraduate tuition increases continue trending lowest in 20 years and in line with our peer institutions
• Funding for faculty & staff salary increases
• Unrestricted state funding up $5,074,900 for four combined ETSU budget units
Finance and Administration Committee [Special Called Meeting] - 3/29/2018 26

Main CampusProposed Budget
2018-19
Finance and Administration Committee [Special Called Meeting] - 3/29/2018 27

Main Campus Appropriation and Maintenance Fee Revenue from Budget Call
Revenue and Adjustments: OriginalAppropriation increase $ 3,550,300 Maintenance fee increase 2.74% 3,329,670 Required Scholarship Increase (1,290,300)Projected enrollment decline - 100 (759,300)Campus Investments
Salary Pools @ 2.5% (3,000,000)GA Base Increase – 2 years (220,000)Faculty promotion and tenure pool (250,000)Non-instructional job audit pool (250,000)
Allocated to new positions (733,450)Allocated to travel and operations (366,550)Unallocated $ 10,370
Source: Budget Advisory and Strategic Planning Committee
Finance and Administration Committee [Special Called Meeting] - 3/29/2018 28
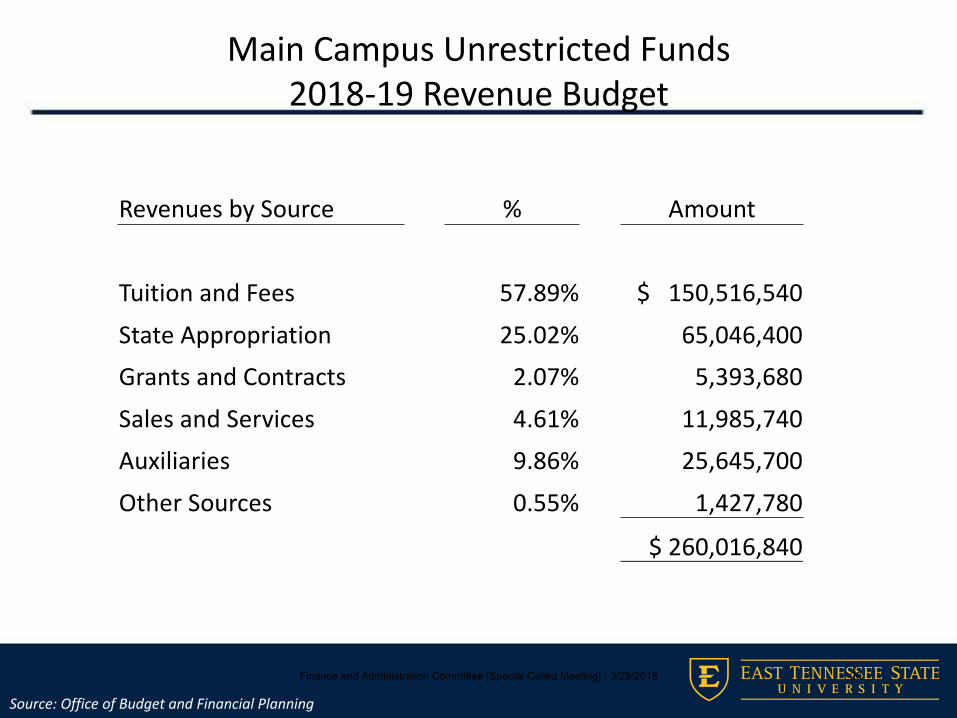
Main Campus Unrestricted Funds2018-19 Revenue Budget
Revenues by Source % Amount
Tuition and Fees 57.89% $ 150,516,540 State Appropriation 25.02% 65,046,400 Grants and Contracts 2.07% 5,393,680Sales and Services 4.61% 11,985,740Auxiliaries 9.86% 25,645,700Other Sources 0.55% 1,427,780
$ 260,016,840
Source: Office of Budget and Financial Planning
Finance and Administration Committee [Special Called Meeting] - 3/29/2018 29

Main Campus Proposed BudgetEstimated 17-18 Proposed 2018-19 Increase (Decrease)
Revenue $ 251,328,810 $ 260,016,840 $ 8,688,030
Expenditures and Transfers
Instruction $ 106,490,300 $ 105,195,100 $ (1,295,200)
Research 3,157,300 1,149,700 (2,007,600)
Public Service 2,563,900 2,476,400 (87,500)
Academic Support 24,664,100 23,560,500 (1,103,600)
Student Services 25,475,100 25,819,400 344,300
Institutional Support 16,929,400 17,118,000 188,600
Facilities 17,469,700 17,301,300 (168,400)
Scholarships 30,109,300 32,483,200 2,373,900
Total before transfers 226,859,100 225,103,600 (1,755,500)
Debt Service 3,400,260 3,754,590 354,330
Non-Mandatory Transfers 5,808,710 5,328,810 (479,900)
Auxiliaries Exp & Tnfrs 26,116,260 25,646,730 (469,530)
Total $ 262,184,330 $ 259,833,730 $ (2,350,600)
Source: Office of Budget and Financial Planning
Finance and Administration Committee [Special Called Meeting] - 3/29/2018 30

FY 18-19 Revenue Budget
53%
25%
5%
4%2%
1% 10%
Revenue by Source
Maint & Req. Fee
State Appropriations
Sales and Services
Non Mandatory Fee
Grants and Contracts
Other Sources
Auxiliary
Total Revenue - $260,016,840
Source: Office of Budget and Financial Planning
Finance and Administration Committee [Special Called Meeting] - 3/29/2018 31

FY 18-19 Revenue Budget
74%
15%
4% 3% 2% 1% 1%
Maintenance and Required Fees (53%)
Regular Maintenance
Out -of-State
Debt Service Fees
Tech Access Fee
Student Activity Fee
Facilities Fee
Other Required Non-AuxTotal M & RF - $138,873,890
Source: Office of Budget and Financial Planning
Finance and Administration Committee [Special Called Meeting] - 3/29/2018 32

FY 18-19 Revenue Budget
43%
33%
2%
11%
11%
Non Mandatory Fees (4%)
Specialized Course FeesMaterials FeeRODP FeeProf. DevelopmentOther Non Mand
Total NMF - $11,642,650
Source: Office of Budget and Financial Planning
Finance and Administration Committee [Special Called Meeting] - 3/29/2018 33

FY 18-19 Revenue Budget
84%
8%5% 2% 1%
Sales and Services (4%)
Athletics (all sources)Child Care CentersOther Sales and ServicesRental of PropertyHealth Services
Total Sales and Services - $11,985,740
Source: Office of Budget and Financial Planning
Finance and Administration Committee [Special Called Meeting] - 3/29/2018 34
FY 18-19 Revenue Budget
28%
5%
62%
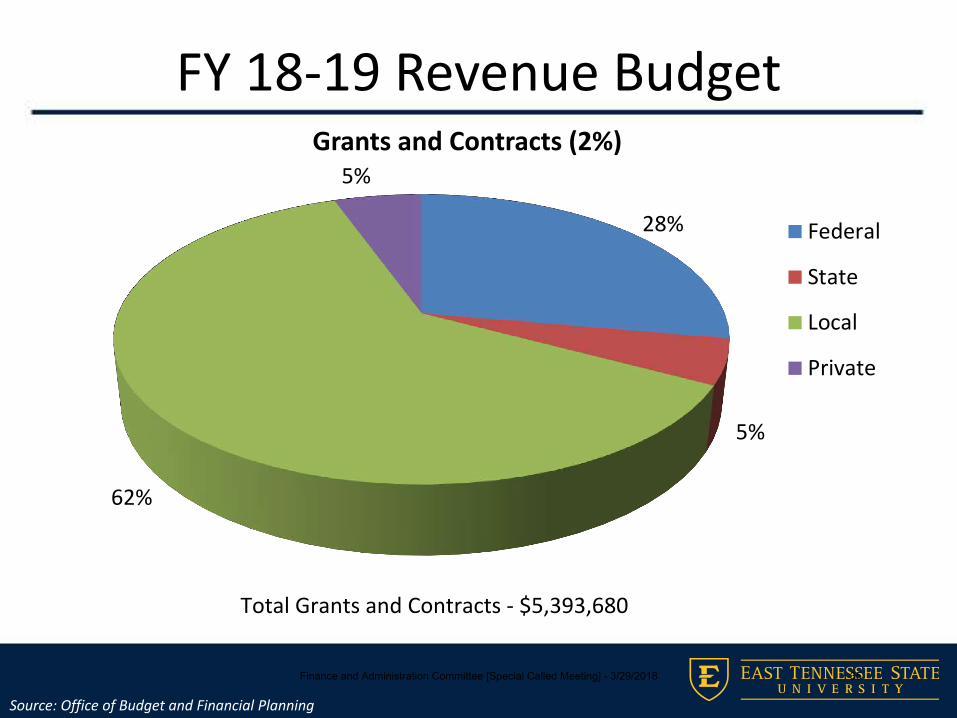
5%Grants and Contracts (2%)
Federal
State
Local
Private
Total Grants and Contracts - $5,393,680
Source: Office of Budget and Financial Planning
Finance and Administration Committee [Special Called Meeting] - 3/29/2018 35

FY 18-19 Revenue Budget
57%27%
8%
6% 2%
Auxiliaries (10%)Housing
Food Service
Parking
CPA
Other
Total Auxiliaries- $25,646,700
Source: Office of Budget and Financial Planning
Finance and Administration Committee [Special Called Meeting] - 3/29/2018 36

Allocation of Net New Funding – Main Campus
Salaries and Benefits
Function 2.5% Pool New Positions Travel Operating Total
Instruction $1,623,830 $165,970 $12,000 $59,210 $1,861,010
Research 20,580 20,580
Public Service 32,450 32,450
Academic Support 362,080 - 362,080
Student Support 352,000 62,220 15,000 66,000 495,220
Institutional Support 385,210 289,880 195,300 870,390
Operation and Maintenance 223,850 215,380 19,040 458,270
Total Expenditures $3,000,000 $733,450 $27,000 $339,550 $4,100,000
Source: Budget Advisory and Strategic Planning Committee
Finance and Administration Committee [Special Called Meeting] - 3/29/2018 37

FY 18-19 Expenditure Budget
40%
0%1%9%10%
7%
7%
13%
10% 1% 2%
By Function
InstructionResearchPublic ServiceAcademic SupportStudent ServicesInstitutional SupportO & M of PlantScholarshipsAuxiliariesMandatory TfrNon Mandatory TfrTotal Expenditures & Transfers by Function - $259,833,730
Source: Office of Budget and Financial Planning
Finance and Administration Committee [Special Called Meeting] - 3/29/2018 38

FY 18-19 Expenditure Budget
39%
7%21%
1%
13%
15%0%2% 2%
By Natural Classification
Professional SalariesOther SalariesEmployee BenefitsTravelScholarshipsOperatingCapital OutlayMandatory TransfersNonmandatory Transfers
Total Natural Classification - $259,833,730
Source: Office of Budget and Financial Planning
Finance and Administration Committee [Special Called Meeting] - 3/29/2018 39
Quillen College of MedicineProposed Budget
2018-19
Finance and Administration Committee [Special Called Meeting] - 3/29/2018 40
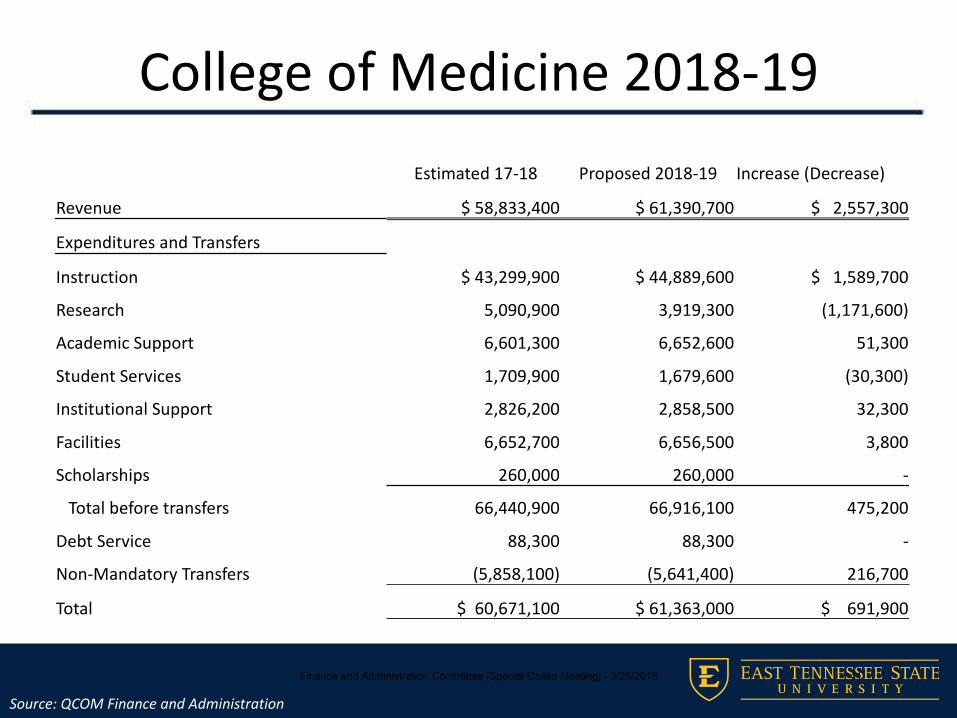
College of Medicine 2018-19Estimated 17-18 Proposed 2018-19 Increase (Decrease)
Revenue $ 58,833,400 $ 61,390,700 $ 2,557,300
Expenditures and Transfers
Instruction $ 43,299,900 $ 44,889,600 $ 1,589,700
Research 5,090,900 3,919,300 (1,171,600)
Academic Support 6,601,300 6,652,600 51,300
Student Services 1,709,900 1,679,600 (30,300)
Institutional Support 2,826,200 2,858,500 32,300
Facilities 6,652,700 6,656,500 3,800
Scholarships 260,000 260,000 -
Total before transfers 66,440,900 66,916,100 475,200
Debt Service 88,300 88,300 -
Non-Mandatory Transfers (5,858,100) (5,641,400) 216,700
Total $ 60,671,100 $ 61,363,000 $ 691,900
Source: QCOM Finance and Administration
Finance and Administration Committee [Special Called Meeting] - 3/29/2018 41

COM and MEAC Revenue Budget
Revenues by Source % Amount
State Appropriations 34.35% $ 34,535,500
Tuition and Fees 9.92% 9,971,100 Grants and Contracts 1.40% 1,405,000
Residents Participation 15.15% 15,228,100Other Sources .25% 251,000
$ 61,390,700 Medical Education Assistance Corp 38.93% 39,137,200
Total $100,527,900
Source: QCOM Finance and Administration
Finance and Administration Committee [Special Called Meeting] - 3/29/2018 42

67%
6%
10%
3%4%
10% 0%0%
By Function (Excluding Non-mandatory Transfers)
Instruction
Research
Academic Support
Student Services
Institutional Support
O & M of Plant
Scholarships
Mand Trsfr Debt
Total Expenditures by Function - $67,004,400
COM FY 18-19 Expenditure Budget
Source: QCOM Finance and Administration
Finance and Administration Committee [Special Called Meeting] - 3/29/2018 43

38%
23%
19%
0%
20%0%
By Natural Classification (Excluding Non-mandatory Transfers)
Professional Salaries
Other Salaries
Employee Benefits
Travel
Operating Expenses
Mand Trnfr Debt
Total by Natural Classification - $67,004,400
COM FY 18-19 Expenditure Budget
Source: QCOM Finance and Administration
Finance and Administration Committee [Special Called Meeting] - 3/29/2018 44

ETSU Family MedicineProposed Budget
2018-19
Finance and Administration Committee [Special Called Meeting] - 3/29/2018 45

Family Medicine 2018-19
Estimated 2017-18 Proposed 2018-19 Increase (Decrease)
Revenue $ 16,726,800 $ 17,151,000 $ 424,200
Expenditures and Transfers
Instruction $ 11,128,700 $ 11,482,800 $ 354,100
Research 352,000 334,800 (17,200)
Academic Support 3,395,500 3,601,600 206,100
Institutional Support 1,573,600 1,626,800 53,200
Facilities 394,000 377,000 (17,000)
Debt Service 262,900 262,900 -
Transfer from R&R (200,000) (545,000) (345,000)
Transfer from COM (100,000) - 100,000
Total $ 16,806,700 $ 17,140,900 $ 334,200
Source: Family Practice Finance Office
Finance and Administration Committee [Special Called Meeting] - 3/29/2018 46

FM Revenue Budget
Revenues by Source % Amount
State Appropriations 44.08% $ 7,560,000
Clinical Revenue 30.84% 5,290,000 Resident Participation 21.84% 3,745,000
Other Sources 3.24% 556,000
$ 17,151,000
Source: Family Practice Finance Office
Finance and Administration Committee [Special Called Meeting] - 3/29/2018 47

65%
2%
20%
9% 2% 2%
By Function (Excluding Non-Mandatory Transfers)
Instruction
Research
Academic Support
Institutional Support
O & M of Plant
Mand Tfr Debt
Total Expenditures & Mandatory Transfers by Function - $17,685,900
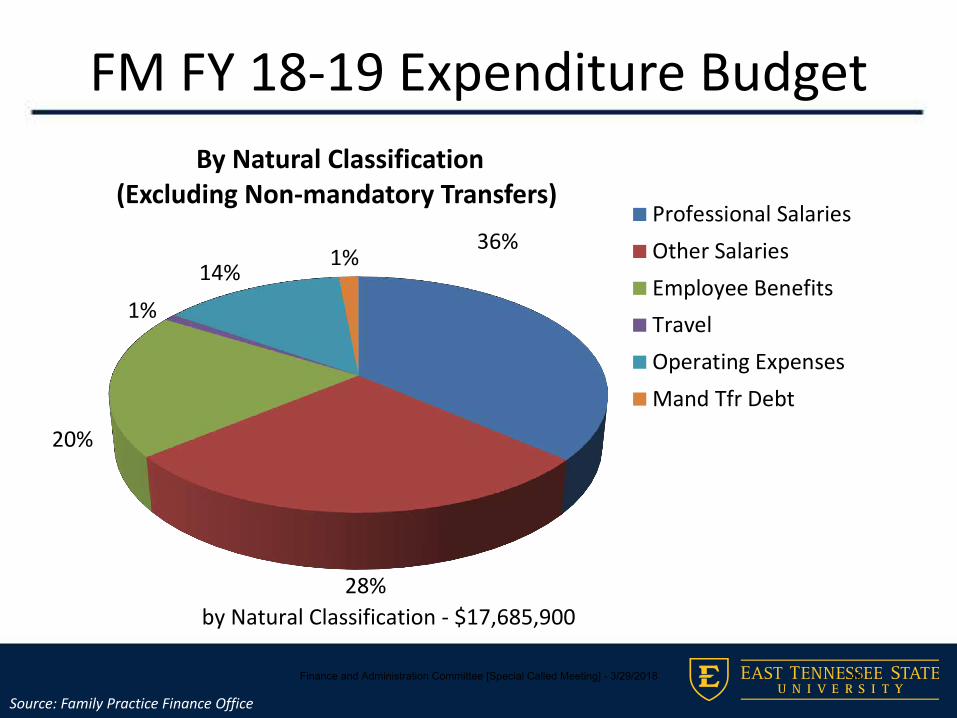
FM FY 18-19 Expenditure Budget
Source: Family Practice Finance Office
Finance and Administration Committee [Special Called Meeting] - 3/29/2018 48
36%
28%
20%
1%
14%1%
By Natural Classification (Excluding Non-mandatory Transfers)
Professional Salaries
Other Salaries
Employee Benefits
Travel
Operating Expenses
Mand Tfr Debt
Total by Natural Classification - $17,685,900
FM FY 18-19 Expenditure Budget
Source: Family Practice Finance Office
Finance and Administration Committee [Special Called Meeting] - 3/29/2018 49

Bill Gatton College of PharmacyProposed Budget
2018-19
Finance and Administration Committee [Special Called Meeting] - 3/29/2018 50
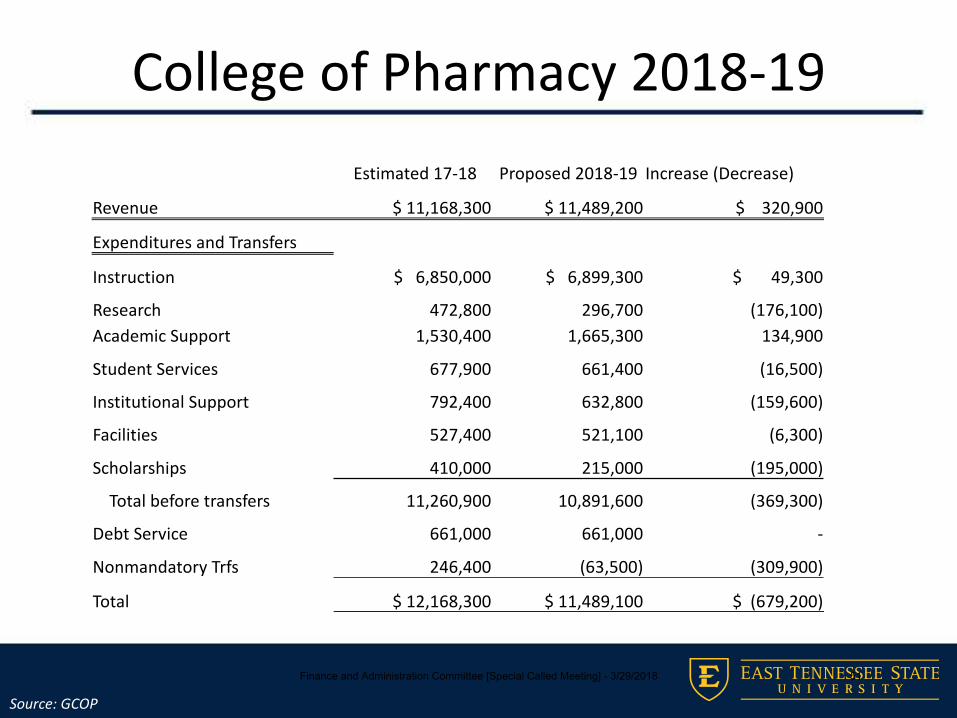
College of Pharmacy 2018-19Estimated 17-18 Proposed 2018-19 Increase (Decrease)
Revenue $ 11,168,300 $ 11,489,200 $ 320,900
Expenditures and Transfers
Instruction $ 6,850,000 $ 6,899,300 $ 49,300
Research 472,800 296,700 (176,100)Academic Support 1,530,400 1,665,300 134,900
Student Services 677,900 661,400 (16,500)
Institutional Support 792,400 632,800 (159,600)
Facilities 527,400 521,100 (6,300)
Scholarships 410,000 215,000 (195,000)
Total before transfers 11,260,900 10,891,600 (369,300)
Debt Service 661,000 661,000 -
Nonmandatory Trfs 246,400 (63,500) (309,900)
Total $ 12,168,300 $ 11,489,100 $ (679,200)
Source: GCOP
Finance and Administration Committee [Special Called Meeting] - 3/29/2018 51

COP Revenue Budget
Revenues by Source % Amount
State Appropriations 0% $ 0
Tuition and Fees 99.69% 11,474,200Other Sources 0.31% 15,000
$ 11,489,200
Source: GCOP
Finance and Administration Committee [Special Called Meeting] - 3/29/2018 52

60%
3%
14%
6%
5%4%
2% 6%
By Function (Excluding Non-mandatory Transfers)
Instruction
Research
Academic Support
Student Services
Institutional Support
O & M of Plant
Scholarships
Debt ServiceTotal Expenditures by Function - $11,552,600
COP FY 18-19 Expenditure Budget
Source: GCOP
Finance and Administration Committee [Special Called Meeting] - 3/29/2018 53

50%
7%
18%
2%
23%
By Natural Classification (Excluding Non-Mandatory Transfers)
Professional SalariesOther SalariesEmployee BenefitsTravelOperating ExpensesDebt Service
Total by Natural Classification - $11,552,600
COP FY 18-19 Expenditure Budget
Source: GCOP
Finance and Administration Committee [Special Called Meeting] - 3/29/2018 54

Summary
Finance and Administration Committee [Special Called Meeting] - 3/29/2018 55

Summary• Thorough budget hearing process• Recommending low tuition increases with
stable state appropriation revenue• Investments of significant institutional
resources in ETSU employees with 2.5% salary pool
• State continued investment in campus infrastructure for several maintenance projects
Finance and Administration Committee [Special Called Meeting] - 3/29/2018 56