Embed Size (px)
Citation preview

This document was developed and written by Ian Lee. All information is meant for public use and purposed for the free transfer of knowledge to interested parties. Send questions and comments to [email protected]
Finance and Accounting for InterviewsMay 31, 2004

Table of Contents
I. Basic Accounting
II. Basic Finance
III. Valuation Method 1: Comparable Company Analyses
IV. Valuation Method 2: Discounted Cash Flow Analysis
V. Additional Resources
2

I. Basic Accounting
3
The Income StatementI/S
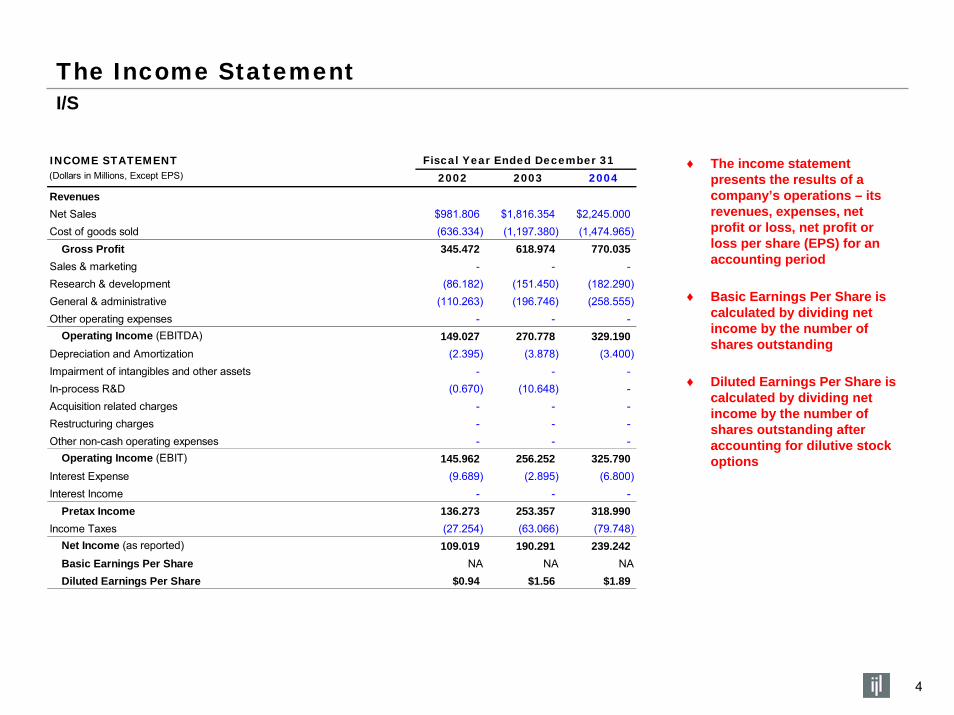
INCOME STATEMENT Fiscal Year Ended December 31(Dollars in Millions, Except EPS) 2002 2003 2004RevenuesNet Sales $981.806 $1,816.354 $2,245.000 Cost of goods sold (636.334) (1,197.380) (1,474.965) Gross Profit 345.472 618.974 770.035 Sales & marketing - - - Research & development (86.182) (151.450) (182.290) General & administrative (110.263) (196.746) (258.555) Other operating expenses - - - Operating Income (EBITDA) 149.027 270.778 329.190 Depreciation and Amortization (2.395) (3.878) (3.400) Impairment of intangibles and other assets - - - In-process R&D (0.670) (10.648) - Acquisition related charges - - - Restructuring charges - - - Other non-cash operating expenses - - - Operating Income (EBIT) 145.962 256.252 325.790 Interest Expense (9.689) (2.895) (6.800) Interest Income - - - Pretax Income 136.273 253.357 318.990 Income Taxes (27.254) (63.066) (79.748) Net Income (as reported) 109.019 190.291 239.242 Basic Earnings Per Share NA NA NA Diluted Earnings Per Share $0.94 $1.56 $1.89
♦ The income statement presents the results of a company’s operations – its revenues, expenses, net profit or loss, net profit or loss per share (EPS) for an accounting period
♦ Basic Earnings Per Share is calculated by dividing net income by the number of shares outstanding
♦ Diluted Earnings Per Share is calculated by dividing net income by the number of shares outstanding after accounting for dilutive stock options
4

The Balance SheetB/S
Fiscal Year Ended December 31BALANCE SHEET 2003 2004Cash & Marketable Securities $9.333 $10.386 Accounts Receivable 8.960 8.350 Inventories 47.041 36.769 Other Current Assets 0.512 0.759 Total Current Assets 65.846 56.264 Property, Plant & Equipment (PPE, net) 29.079 18.977 Other Long-Term Assets 0.373 0.668 Total Assets $95.298 $75.909 Accounts Payable 14.294 7.591 Accrued Liabilities 5.669 5.313 Deferred revenues - - Short-Term Debt 7.498 7.528 Other Current Liabilities - - Total Current Liabilities 27.461 20.432 Long-Term Debt 21.059 16.975 Other Long-Term Liabilities 0.843 0.635 Total Liabilities 49.363 38.042 Shareholders' Equity 45.935 37.867 Total Liabilities & Equity $95.298 $75.909
♦ The balance sheet is a snapshot of a company’s financial position in a specific point in time, showing its assets, liabilities, and shareholder’s equity
5

The Cash Flow StatementCFS
Fiscal Year Ended December 31CASH FLOW STATEMENT 2003 2004Net Income - - Adjustments - - Cash flows from Operating Activities - - * (Free Cash Flow = Cash flows from Operations - CAPEX)Adjustments - - Cash flows from Investing Activities - - Adjustments - - Cash flows from Financing Activities - - Change in cash - - Cash at beginning of period - - Cash at end of period - -
♦ The statement of cash flows provides information about the cash inflows and outflows from operating, financing, and investing activities during the accounting period
6

Pro Forma Earnings AnalysisCash Net Income and Cash EPS
CASH NET INCOME SCHEDULE Fiscal Year Ended December 31(Dollars in Millions, Except Per Share) 2002 2003 2004Net Income (as reported) - - - Non-deductible adjustments In-process R&D - - - Amort. of stock-based compensation - - - Other non-cash operating expenses (non-deductible) - - - Additional Other non-deductible adjustments (d) 0.000 0.000 0.000 Deductible adjustments Acquisition related charges - - - Restructuring charges - - - Other non-cash operating expenses (deductible) - - - Additional Other deductible adjustments (e) 0.000 0.000 0.000 Amort. of goodwill and impairment of intangibles - - - Cash Net Income - - - Cash EPS NA NA NA
♦ To derive the Cash Net Income and EPS figure, you must add back one-time and non-cash charges to the net income amount reported on the income statement (GAAP)
♦ Whether or not you must tax-effect these one-time, non-cash add-backs depends on whether or not it can be considered a non-deductible or deductible adjustment
♦ Non-deductible adjustments are NOT TAXED. These include in-process R&D expense, option and warrant expense, amortization, change in accounting principles, and impairment charges related to goodwill
♦ Deductible adjustments are TAX-EFFECTED. These include impairment charges unrelated to goodwill, transaction costs, a loss or gain on disposal of PP&E, and realized loss or gain on investment
7

Key Accounting RatiosCommon Measurements of Company Performance
Ratio Formula Meaning
Gross Profit Margin = Gross Profit The margin available to cover a company's operating expenses and yield a profitRevenue
Operating Margin = EBITDA Measures the company's profitability after deducting operating expensesRevenue
Inventory Turnover = Cost of Goods SoldAverage Inventory
Return on Assets (ROA) = Profit Before Interest After Tax Measures the return on assets of a businessAverage Total Assets
Return on Equity (ROE) = Net Income Measures the return on investment for stockholdersAverage Total Equity
Current Ratio = Current AssetsCurrent Liabilities
Working Capital = Current Assets - Current Liabilities Measures the excess of current assets over the current liabilities
Quick Ratio = Current Assets - InventoryCurrent Liabilities
Debt to Equity = Total Liabilities Measures the company's level of total debt relative to its equity/capital baseTotal Equity
Measures the extent to which the claims of short-term creditors are covered by short-term assets excluding inventory. Assumes that inventories would not be sold off to cover these claims
A current ratio of more than 1.0 means the claims of the short-term creditors are covered by the company's current assets
Measures the number of times a company turns over all its inventory a year. The higher the turnover, the more efficient the company manages its inventory
8

II. Basic Finance
9
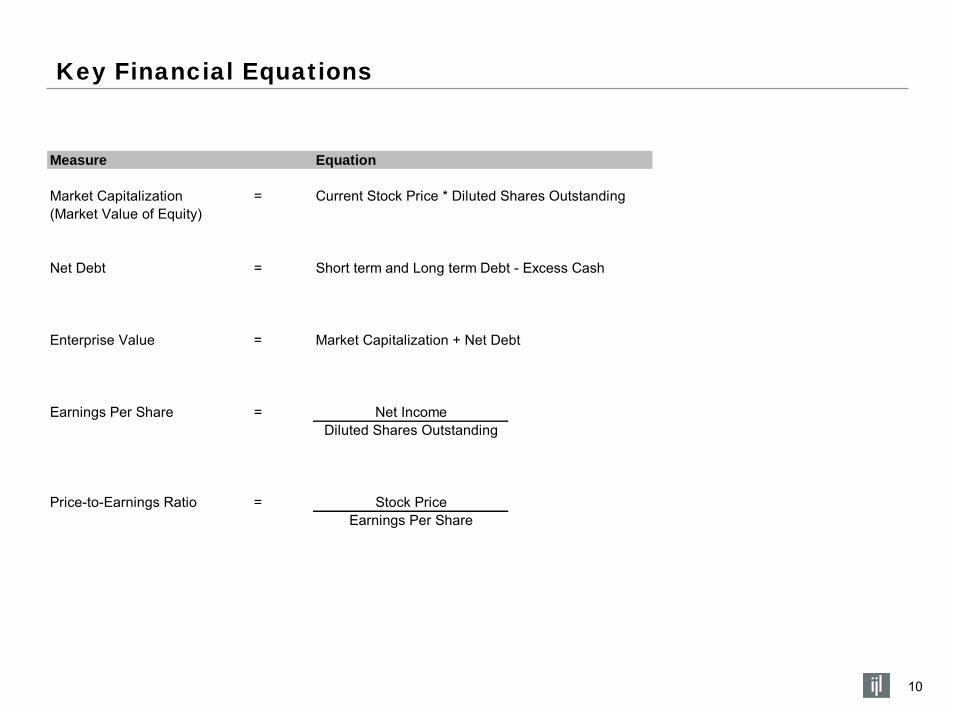
Key Financial Equations
Measure Equation
Market Capitalization = Current Stock Price * Diluted Shares Outstanding(Market Value of Equity)
Net Debt = Short term and Long term Debt - Excess Cash
Enterprise Value = Market Capitalization + Net Debt
Earnings Per Share = Net IncomeDiluted Shares Outstanding
Price-to-Earnings Ratio = Stock PriceEarnings Per Share
10

Key Financial Multiples
Multiple Formula
Revenue Multiple = Enterprise ValueRevenue
EBITDA Multiple = Enterprise ValueEBITDA
EBIT Multiple = Enterprise ValueEBIT
Earnings Multiple = Enterprise ValueNet Income
Cash Multiple = Enterprise ValueCash Net Income
11

III. Valuation Method 1: Comparable Company Analyses
12

Simplified ModelComparable Companies Analysis
($ in millions, except EPS)
Company Revenue EBITDA Net Income Shares Outstanding EPS (GAAP) Cash Net Income Cash EPS (Pro Forma)
Abercrombie $1,710 $398 $205 94 $2.18 $220 $2.34American Eagle Outfitters 1,580 192 78 71 1.10 85 1.20GAP, Inc. 16,170 2,730 1,140 900 1.27 1,350 1.50Guess, Inc. 650 66 14 44 0.32 18 0.41Your Clothing Company 300 46 16 0 - 17 -
Company Current Stock Price Shares Outstanding Market Cap Total Debt Excess Cash Enterprise Value
Abercrombie $36.43 94 $3,424 $0 $521 $2,903American Eagle Outfitters 28.96 71 2,056 17 326 1,748GAP, Inc. 24.15 900 21,735 2,590 3,280 21,045Guess, Inc. 15.4 44 678 65 45 698
Company Multiples EV / Revenue EV / EBITDA EV / NI Price / EPS EV / Cash NI Price / Cash EPS
Abercrombie 1.7x 7.3x 14.2x 16.7x 13.2x 15.6xAmerican Eagle Outfitters 1.1x 9.1x 22.4x 26.4x 20.6x 24.2xGAP, Inc. 1.3x 7.7x 18.5x 19.1x 15.6x 16.1xGuess, Inc. 1.1x 10.6x 49.8x 48.4x 38.8x 37.6x
Industry Average Multiples 1.3x 8.7x 26.2x 27.6x 22.0x 23.4x
Multiple Used EV / Revenue EV / EBITDA EV / NI Price / EPS EV / Cash NI Price / Cash EPS
Your Clothing Company's EV $388 $399 $419 - $374 -
13

IV. Valuation Method 2: Discounted Cash Flow Analysis
14

DCF ModelThe General DCF Model
N
i = 0
15
(1 + d)i
FCFi TVEV = + (1 + d)N[ ]
EV: Enterprise Value (value of the company in question)
FCF: Free Cash Flow in year i
d: Discount Rate
i: Year
N: Last projected year
TV: Terminal Value
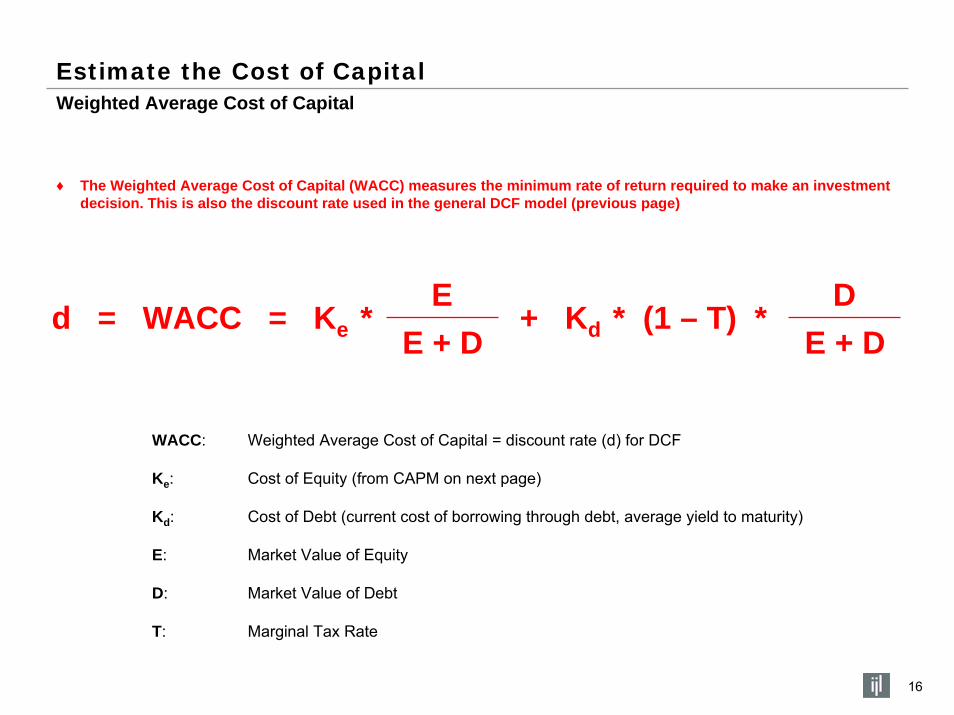
Weighted Average Cost of CapitalEstimate the Cost of Capital
♦ The Weighted Average Cost of Capital (WACC) measures the minimum rate of return required to make an investment decision. This is also the discount rate used in the general DCF model (previous page)
E Dd = WACC = Ke * + Kd * (1 – T) *
E + DE + D
WACC: Weighted Average Cost of Capital = discount rate (d) for DCF
Ke: Cost of Equity (from CAPM on next page)
Kd: Cost of Debt (current cost of borrowing through debt, average yield to maturity)
E: Market Value of Equity
D: Market Value of Debt
T: Marginal Tax Rate
16

Cost of Equity – The Capital Asset Pricing Model (CAPM)Estimate the Cost of Capital
♦ The Capital Asset Pricing Model (CAPM) calculates the company’s cost of equity – the total return expected by equity investors including dividends and capital appreciation.
Ke = rf + B * (rm – rf)
Ke: Cost of Equity (into WACC on previous page)
B: Company Beta, its volatility relative to the rest of the marketIf B = 1, it is as risky as the overall market.If B < 1, it is less risky than the market.If B > 1, it is more risky than the market.
rf: Risk Free Rate
rm: Equity Market Average Return
rm - rf: Excess Market Return
17

Cost of DebtEstimate the Cost of Capital
♦ The cost of debt is the marginal cost of debt after giving effect to the tax shield provided by debt financing
Kd = Outstanding Debt + Marginal Interest Rate
Note: In cases where there is no publicly traded debt, the cost of debt can either be obtained from comparables, or approximated to the Risk-Free-Rate (rf)
18

Unlevered Free Cash FlowProject the Free Cash Flows (step two of four)
♦ Leverage in financial terms refers to the tax savings (and therefore cash flow increase) provided by interest payments from Company debt items reported on the income statement
♦ Unlevered Free Cash Flow, therefore, refers to the cash flow of a company adjusting out the leverage provided by debt items (interest payments reported on the income statement)
EBITDA- Depreciation and Amortization
= EBIT- Taxes (at the marginal tax rate)
= TAX-EFFECTED EBIT+ Depreciation and Amortization+/- Change in Deferred Taxes- Capital Expeditures+/- Change in Net Working Capital+/- Change in other Long-term Assets and Liabilities
= UNLEVERED FREE CASH FLOW19

Two Methods of CalculationEstimate the Terminal Value
♦ The Terminal Value is the value of the business beyond the specified forecast period (e.g. the projected value of the company for 30 years into the future)
1) Exit Multiple Method
2) Perpetuity Growth Method
Terminal Value = what the business would be worth or sold for at the end of the last projected year
Example: Terminal Value = 8.0x EBITDA at the end of year N
Terminal Value = Free Cash Flows that grow at a constant rate in perpetuity
(r + g)Terminal Value =
FCFN x (1+g) g = nominal perpetual growth rate
r = discount rate
20

Derive the Enterprise Valuation and EPSThe General DCF Model
i = 0
i > N
21
(1 + d)i
FCFi TVEV = + (1 + d)N[ ]
EV - Debt + Cash = EQUITY VALUE
EQUITY VALUE= EPS
Diluted Shares
Note: EPS for an already publicly traded company means “Earnings Per Share,”but in this case, where the company has no market valuation, EPS means “Equity Value Per Share”
V. Additional Resources
22

DCF and Related MaterialAdditional Resources
♦ Accounting
• Understanding Financial Statements (Seventh Edition), Lyn M. Fraser and Aileen Ormiston
♦ Financial Markets
• The Wall Street Journal Guide to Understanding Money & Investing, Kenneth Morris and Virginia Morris
♦ Valuation and Analysis
• Step by Step Business Analysis & Valuation, Krishna Palepu
• Financial Modeling, Simon Benninga
• Valuation: Measuring and Managing the Value of Companies, McKinsey & Company
♦ Career Guides
• Vault Career Guide to Investment Banking (www.vault.com)
• Vault Career Guide to Finance Interviews (www.vault.com)
• The Fast Track: The Insider’s Guide to Winning Jobs in Management Consulting and Investment Banking, Mariam Naficy
23