Embed Size (px)
Citation preview
8/7/2019 final(sat)
http://slidepdf.com/reader/full/finalsat 1/47
1.1 INTRODUCTION OF THE STUDY
Running a successful small business requires adept navigation of the many choices created
by an ever changing market place. Cost Volume Profit Analysis (CVPA) is an effective
tool that can help its user answer important questions you may have about pricing your
products and services, whether or not to invest in additional capital items, and which
products and services to emphasize.
Fixed Semi-Variable and Variable Costs:
Before the CVPA can be used, fixed, semi-variable and variable costs must be determined.
Determining these costs is a very useful tool in itself, but that's another white paper.
Fixed costs are those costs that your business incurs regardless of sales volume. These are
costs such as rent, insurance, and annual business licensing fees. Sales volume, not
exceeding your current capacity, has no effect.
Variable costs are those costs that are directly affected by sales volume. These include
items such as cost-of-goods sold, sales commissions, and travel expenses, if you are a
service provider that travels as a result of service provision.
Semi-variable costs, as you have determined by now, are those costs that increase with
sales volume but not directly as with variable costs. An example of a semi-variable cost for
an auto body shop might be equipment maintenance expense. At some point, equipment
begins to break down if not maintained at a level consistent with increased use. Therefore,
in order to avoid equipment breakdown due to hyper-use, the business owner must spend
additional funds on maintaining equipment.
Break-Even:
There are several benefits to using CVPA. First, it shows what the break-even point, in
units or dollars, for a given product or service is, given a specified sales price. Break-even
is the point at which sales revenue covers all fixed costs for the year plus all variable costs
up to that sales point. .
CVP analysis can be used for analyzing price sensitivity.
1
8/7/2019 final(sat)
http://slidepdf.com/reader/full/finalsat 2/47
Contribution Margin
Determining the contribution margin for your business is an additional benefit of CVPA.
Contribution margin is simply the amount of each sales dollar left after all variable costs
have been covered. It is that portion of the sales dollar that can be devoted to covering
fixed costs.
Knowing your overall contribution margin is beneficial because it can be compared to
prior periods to determine if it is trending positively or negatively. Additionally,
contribution margin analysis can be applied to individual products, product lines, services,
or service lines. Knowing the contribution margin of a particular product or service can
help determine if carrying that product or performing that service over another is the best
decision. Moreover, understanding contribution margin is very helpful in developing the
best pricing strategy for your business.
One final benefit to knowing how to determine contribution margin is that it can point out
your most profitable products or services, even though sales may indicate something
different.
Operating Leverage
Operating leverage is the degree to which a business uses fixed costs to generate profit.
The greater the degree of fixed cost reliance, the greater the increase in profits during a
sales up-trend and the greater the loss in a sales down-trend.
As fixed assets usually carry fixed costs, financed payments for the equipment, additional
insurance, etc., investing in additional equipment is something our auto body shop owner
will want to seriously consider if the up-ward sales trend she is experiencing is something
she believes to a be long-term phenomenon. If she believes the sales up-trend to indeed be
long-term, then investing in additional fixed assets may be just the thing for her to do.
CVPA is one tool our auto body shop owner can use to help her determine what to do in
this situation. By using her break-even model and considering contribution margins, she
2
8/7/2019 final(sat)
http://slidepdf.com/reader/full/finalsat 3/47
can perform sensitivity analyses to help her determine whether or not to increase her
operating leverage in an effort to take advantage of a sales up-trend.
Summary:
CVPA is a tool that can be used to help answer questions you may have about pricing your
products and services, whether or not to invest in additional capital items, and which
products and services to emphasize. While there is no one magic bullet, CVPA is a nice
tool to have in your business analysis bag to help you make good decisions when
answering these types of questions.
3
8/7/2019 final(sat)
http://slidepdf.com/reader/full/finalsat 4/47
1.2 NEED OF THE STUDY
The study is carried out mainly to make profit planning by forecasting activity level
in order to gain or maintain specified amount of profit. It also present cost data for control
purposes. It also facilitates the company to take make or buy decision. It also helps to
analyze the profitability of a multiple-product firm with a constant sales mix. This analysis
is important to select the best alternative method yielding highest contribution.
This study helps the company to determine changes in profit due to changes in
sales volume. Sales required to meet proposed expenditure also determined in this study.
CVP analysis is often used to develop an understanding of the
overall operations of an organization.
4
8/7/2019 final(sat)
http://slidepdf.com/reader/full/finalsat 5/47
1.3 OBJECTIVES OF THE STUDY
Primary objective
To study the Cost-Volume-Profit analysis of WABCO-TVS (INDIA)
LIMITED.
Secondary objectives
1. To analyze how the change in selling price and change in cost affect
the profit position of the company.
2. To find out the breakeven point of sales and margin of safety that helps
in taking policy decision like reduction in price to face the competitors.
3. To predict profit over a wide range of volume.
4. To determine the optimum mix of the company.
5. To estimate the volume to be produced for obtaining a desired profit
5
8/7/2019 final(sat)
http://slidepdf.com/reader/full/finalsat 6/47
1.4 SCOPE OF THE STUDY
This study is performed by using the annuity report of WABCO-TVS(INDIA)
LTD. The analysis done are Breakeven analysis, profit volume, etc., these calculation
cover the major areas like contribution margin, profit, margin of safety. This would be
useful for company to make new strategy to compete in the market by adopting various
controlling techniques in the process of manufacturing.
This study was conducted on cost volume profit analysis and on each and every
variables. This study to help to forecast profit fairly and accurately as it is essential to
know the relationship between profits and costs.
This study assists in evaluation of performance for the purpose of control and also
assists in formulating policies by showing the effect of different price structure on costs
and profits.
6
8/7/2019 final(sat)
http://slidepdf.com/reader/full/finalsat 7/47
2.1 INDUSTRY PROFILE
The global auto component industry could be the next big success story after software,
pharmaceuticals, BPO and textiles. The size of the global auto component industry is
approximately $1 trillion. The leading auto component manufacturers (OEM) in the world
are Ford Motors ,General Motors (GM), Delphi Corporation, Caterpillar, International
Truck and Engine Corporation and Cummins. The US is the world’s biggest auto
component market. In 2002 it imported auto component worth $69 bn.
Currently, the automotive component industry is an important sector of the Indian
economy and a major foreign exchange earner for the country. There are around 400 major
players in the auto component sector. The automotive component industry manufactures a
wide range of parts including casting, forging, finished, semi-finished components,
assemblies, and subassemblies for all types of vehicle products in India.
Evolution of Indian auto component industry
The Indian auto component Industry has always been rising over the Indian Automobile
industry. The component industry started out small in the 1940’s supplying components to
Hindustan Motors and premier automobiles. In the 1950’s the arrival of Telco, Bajaj, and
Mahindra & Mahindra led to steadily increasing production.
In the 1980’s with Maruti, the growth suddenly accelerated. Boom time for auto
components industry started with the arrival of India’s “people’s car” - the Maruthi. As
Maruthi became India’s best selling car, the path of India auto component industry took anupswing. Export figures also climbed. Low costs of labor and raw materials resulted in
exports taking a quantum jump.
The new car required components that would adhere to its stringent quality standards. It
virtually gave birth to a variety of new age auto component manufacturers who
manufactured components that combined the best to technology with quality.
7
8/7/2019 final(sat)
http://slidepdf.com/reader/full/finalsat 8/47
The influx of foreign auto majors ranging from Mercedes Benz, Ford, and General Motors
to Daewoo few years ago presented a world of opportunity for the industry. The auto
components industry responded with huge capacity expansion and modernization
programs. Growth in the commercial vehicle and the passenger car segments has been 20
percent year on year and 40 percent year on year from year 2000 onwards
.
India’s automotive component industry manufactures the entire range of parts required by
the domestic automobile industry and currently employs about 250000 persons. Auto
component manufacturers supply to two kinds of buyers-original equipment manufacturers
(OEM) and the replacement market is characterized by the presence of several small-scalesuppliers who score over the organized players in terms of excise duty exemptions and
lower overheads.
Global trends and challenges
The World trade and investment in automotive and parts has become liberalized with
tariffs going down internationally. MNC assembler source parts from cheapest quality
source in any part of the world. Local suppliers are being linked into the global supply
chain and they have to compete with regional players. Rapid changes in information and
communication technology are reshaping the way auto industry is doing business
The globalization offers a great opportunity for the Indian auto component manufacturers.
There are certain strengths of the industry that attracts the global buyers and there are
certain weaknesses, which can eliminate the local auto parts manufacturers, and the
advantage shall go to global manufacturers who shall have local capabilities in India.
Indian auto component industry strengths
The component industry in India has significant cost advantages primarily due to lower
labor cost in India. This labor cost advantage translates to overall cost advantages of 20-
8
8/7/2019 final(sat)
http://slidepdf.com/reader/full/finalsat 9/47
30% over the counter parts from other developed despite lower labor productivity. Since
tier I suppliers control the global component industry the cost advantages should be
leveraged into attracting these global players to set up manufacturing base in India. This
low cost labor is not a factor for long-term competitiveness, and improvement in scale,
quality, technology and investment in critical process, are necessary to sustain the cost
competitiveness.
In spite of several handicaps there are a number of favorable factors, which are
1. Trained and killed human resources2. Wide industry base manufacturing 97% of component required
3. Growing entrepreneurship
4. Growing domestic market
5. Expanding global markets
6. Transnationalisation of world economy
7. Investment by non-resident Indians
8. Economic liberalization
Evolving industry structure
The Indian automotive vehicle market has recovered from the downturn and is expected to
witness a healthy growth at least for the next 3 years. This is a high degree of correlation
between the automotive vehicle and the automotive component industry sales. The growth
in the component market is likely to be driven by an important in the demand for
automotive vehicles.
In 1999, the component business in India was estimated at $2.81 bn. Of this, original
equipment(OE) had a share of 60 percent. The replacement market accounted for the
remaining 40 percent. In the next few years, the aftermarket is expected to growth faster
than OE component market. This is primarily because the old vehicle population is
registering a significant rise. The effect is likely to be nullified as the average life span of
9
8/7/2019 final(sat)
http://slidepdf.com/reader/full/finalsat 10/47
auto parts is expected to go up due to improved quality of components. Subsequently, the
ratio is likely to stabilize as in the case of developed markets.
Production
While analyzing 54 automotive country markets, it is found that 96% of global vehicle
sales and 99% of global vehicles production have been made. Indian auto component
industry is wide(over 420 firms in the organized sector producing practically all
components and more than 10000 firms in small unorganized sector, in tierized format)
and has been one of the fastest growing segments of automotive industry, growing by over 28% in nominal terms, between 1995-98. During the year 2003-2004, the sector has
recorded a growth of 25.06% by recording a production of the order of Rs.30,640 crores.
During the year 2004-05, the output of the auto component industry is expected to be
around Rs. 36300 crores.
Growth of automobile component industries
The growth of automobile components industries is closely linked to the growth of
automotive industry as substantial quantity produced is supplied by auto components
industry to original equipment manufactures (OEMs), keeping in line with the decline in
the growth rate in the automotive as a whole, auto components industry has also registered
slow growth during last 2-3 years. The production during 2000-2001 was of the order
Rs.17174 crores compared to Rs.1999-2000 registering growth of 5%.
10
8/7/2019 final(sat)
http://slidepdf.com/reader/full/finalsat 11/47
2.2 COMPANY PROFILE
WABCO-TVS (INDIA) Limited was a joint venture between TVS Group and WABCO Vehicle
Control System. But it has acquired all the shares from TVS and now it has 75% shares and
remaining to the public. It was formerly known as Sundaram Clayton Limited, Brakes Division.
It began its operations in Chennai in 1962, in collaboration with Clayton Dewandre Holdings plc,
UK.
WABCO-TVS (INDIA) Limited has pioneered the manufacture of air-assisted and air brake
systems for commercial vehicles in INDIA. With a commitment of total satisfaction tocustomers, the company has achieved a share of business in the OE (Original Equipment)
segment greater than 85% and a market share in the after-market greater than 75%.
WTIL have plants at Ambattur-Chennai, Jamshedpur and mahindra world city-Chennai adopting
rigorous TQM processes and standards, WTIL’s brakes division registered a turnover of $135
million in 2007-2008.
The Research and Development center is full-fledged and state-of-the-art to facilitate design,
development, simulation and testing. A team of professional engineers powered with the best
production facilities gear up to translate design competence into excellence in manufacturing
through concepts such as cellular manufacturing and operation standards
TQM
WABCO-TVS have a solid foundation in its domestic market leadership and pioneering R&D
efforts. Comprehensive TQM (Total Quality Management) practices enable WABCO-TVS in
being a competitive world-class manufacturer in terms of quality, cost and timely delivery of
products.
11
8/7/2019 final(sat)
http://slidepdf.com/reader/full/finalsat 12/47
Process Management
WABCO-TVS, have committed to total customer satisfaction. Cellular manufacturing gives
them the flexibility to respond in tune to customer needs. Comprehensive integration of the
supply chain through implementation of ERP (Enterprise-Wide Resource Planning) programme
has further enhanced WABCO-TVS (INDIA) Limited's responsiveness.
Employees
TEI (Total Employee Involvement) forms the base of WABCO-TVS quest for excellencethrough TQM. WABCO-TVS is poised to achieve breakthroughs by realizing the importance of
the need to continuously honing the expertise of our human resources and learning from the best
practices across the world. Training is imparted not only to employees but also to suppliers.
WABCO-TVS (INDIA) Limited supplies original equipment fitments for vehicles manufactured
by Ashok Leyland, TATA Motors, Vehicle Factory (Jabalpur), and Bharat Earthmovers, TAFE,
Volvo, SUTLEJ, CATERPILLAR, Eicher Motors, Swaraj Mazda, Force Motors, Mahindra &
Mahindra, Tata Cummins (Engines) and a host of other trailer manufacturers.
A complete product range
WTIL manufacturers an entire range of air brake actuation components comprising several
varieties of compressors, re services, air dryers, controlling and regulating valves, brake
chambers, spring brake actuators and a host of auxiliaries such as hoses, couplings and
switches. WTIL manufacturers a growing range of vacuum brake equipment for light
commercial vehicles. WTIL also offers a range of repair kits to service its products in the
after market.
WTIL is the first Indian company to manufacturer the next generation braking system:
Anti – Lock brake System (ABS) and Anti-Spin Regulation (ASR) developed with total in-
house design technology. ABS is a result of years of extensive research and it dramatically
12
8/7/2019 final(sat)
http://slidepdf.com/reader/full/finalsat 13/47
improves vehicle stability under adverse road conditions, thus enhancing safely and steer
ability.
Milestones on the road to excellence
A commitment to enhancing customer satisfaction through continuous improvement and
total employee involvement has led WTIL to one of its most significant milestones so far –
The Deming Award. WTIL’s brakes division was awarded the prestigious Deming Prize
by the union of Japanese and engineers (JUSE) for having “achieved distinctive
performance improvements through the applications of company-wide quality control”.The examination procedures and selection process being exacting and elaborate; WTIL
considers it a matter of pride that it is only the fourth organization in the world outside
Japan to win this prize and the very first in India.
In 2002, WTIL’s brakes division was awarded the Japan quality medal for “continual
application of TQM for priority issue to achieve business results”. It is the second
company outside Japan outside Japan and the very first in India to win this prestigious
award. WTIL has a solid foundation in its domestic market leadership and pioneering
R&D efforts. With this, WTIL aims to be a competitive world class manufacturer in terms
of quality, cost and timely delivery through comprehensive world –class practices.
Not with standing, WTIL believes that winning the demand award and Japan quality medal
is still only the beginning of a conscious and continuous search for new level of excellence.
13
8/7/2019 final(sat)
http://slidepdf.com/reader/full/finalsat 14/47
3 REVIEW OF LITERATURE
A literature review is a “critical analysis of a segment of a published body of knowledge
through summery, classification and comparison of prior research studies, reviews of
literature and theoretical articles”.
Literature review is the process of developing an insight into both conceptual and research
based studies available in the area and the topic chosen. The objectives of such review are
to understand the importance of the topic and find out the research gaps if any in the
chosen area.
Michael J. McCarthy(1994)
The present study reveals that variable cost is always vary with the variables.The cost of
the cabin flight crew is a step-variable cost--the number of flight attendants assigned to a
flight will vary with the number of passengers on the flight. The only true variable costs
are the costs of meals and an almost inconsequential increase in fuel consumption.
Therefore, adding one passenger to a flight brings in additional revenue but has very little
effect on total cost. Consequently, airlines have been stuffing more and more seats into
their aircraft.
GM corp (1992)
In the early 1990s, General Motors Corp. laid off tens of thousands of its hourly workers
who would nevertheless continue to receive full pay under union contracts. GM entered
into an agreement with one of its suppliers, Android Industries, Inc., to use laid-off GMworkers. GM agreed to pay the wages of the workers who would be supervised by Android
Industries. In return, Android subtracted the wages from the bills it submitted to GM under
their current contract. This reduction in contract price is pure profit to GM, since GM
would have had to pay the laid-off workers in any case.
14
8/7/2019 final(sat)
http://slidepdf.com/reader/full/finalsat 15/47
Dorina BUDUGAN, (1989)
The study reveals that alternative method of full costing method.This is the direct costing
method employed to calculate costs, which is based on those costs that are closely and
directly connected to the operation volume. This method is actually more than a cost
calculation method; it is a short-term earnings calculation method, which makes these costs
a useful company management tool. This paper is designed to explain, by means of
concrete examples, the way in which operation conditions changes influence the earnings
estimated by means of the cost-volume-profit analysis, as well as the implications of these
changes on the decisions to make.
Kee, Robert (2007)
Cost-volume-profit (CVP) analysis is a mathematical representation of the economics of
producing a product. The relationships between a product's revenue and cost functions
expressed within the CVP model are used to evaluate the financial implications of a wide
range of strategic and operational decisions. CVP analysis may be used to determine the
trade-offs in profitability and risk from alternative product design and production
possibilities. In effect, CVP is a quantitative model for developing much of the financial
information relevant for evaluating resource allocation decisions.
Horngren(1994)
Cost Volume Profit analysis (CVP) is one of the most hallowed, and yet one of the
simplest, analytical tools in management accounting. In a general sense, it provides a
sweeping financial overview of the planning process . That overview allows managers to
examine the possible impacts of a wide range of strategic decisions. Those decisions can
include such crucial areas as pricing policies, product mixes, market expansions or
contractions, outsourcing contracts.
Steven, Grahame (2005)
Cost/volume/profit (CVP) analysis can be used to determine how many products must be
sold in order to break even or reach a target profit and also to calculate the margin of safety
15
8/7/2019 final(sat)
http://slidepdf.com/reader/full/finalsat 16/47
for a business proposal Panel 1 contains the formulas for these calculations. Although the
information it provides is extremely useful, CVP analysis can also offer a valuable insight
into the business issues that underpin a venture.
Metzger, Lawrence M. (1993)
An important result of this search for better data is more accurate and relevant costing
information that is useful for decision making. This article will describe the use of data
developed in an ABC system as it applies to the multiproduct cost-volume-profit (CVP)
analysis model. Data derived under ABC can be integrated into traditional decision-making
techniques.
16
8/7/2019 final(sat)
http://slidepdf.com/reader/full/finalsat 17/47
4 RESEARCH METHODOLOGY
4.1 DEFINITION
According to Clifford woody research comprises defining and redefining problems,
formulating hypothesis or suggested solutions correcting, organizing and evaluating data
making deductions and reaching conclusions and at last testing the conclusions to
determine whether they fit the formulated hypothesis.
It can be defined as an organized, systematic, scientific inquiry or investigation in to a
specific problem undertaken with the purpose of finding answers or solutions to it.
It is the process of finding solution to a problem after the thorough study and analysis of
situational factors.
Research can be a means to an end or and it end itself.
Research design is needed in the following cases.
• Identify the difficult issues
• Gather relevant information
• Analyzing the data in the case that would help decision making
• Implementing the right course of action, decision making is the process
of choosing and want the alternative solution to resolve their problem.
• Research helps to generate better alternative for effective decision
making.
4.2 RESEARCH DESIGN:
A research design is the arrangement of conditions for collection and analysis of data in a
manner that aims to combine relevance to the research purpose with economy in
procedure.
17
8/7/2019 final(sat)
http://slidepdf.com/reader/full/finalsat 18/47
4.3 NATURE OF RESEARCH:
Analytical research:
This type of research is used where the researcher has to use facts or information that is
already available and analyze these to make a critical evaluation.
4.4 SOURCES OF DATA:
Secondary data:
It refers to the information or facts actually collected. Such data are collected with the
objective of understanding the past status of any variable or the data collected and reported
by some source is assessed and used for the objective of the study.
Since this study requires use of secondary data only, this data has been collected from the
Annual report.
18
8/7/2019 final(sat)
http://slidepdf.com/reader/full/finalsat 19/47
4.5 TOOLS AND TECHNIQUES USED
• contribution
• P/V Ratio
• Breakeven point
• Margin of safety
• Operating leverage
Marginal cost:
CIMA define marginal cost as “The cost of one unit of product or service which would be
avoided if that unit were not produced or provided”.
Marginal costing:
CIMA define marginal costing as “The accounting system in which variable costs are
charged to the cost units and fixed costs of the period are written –off in full against the
aggregate contribution. Its special value is in decision-making”.
We all know that profit is balancing figure of sales over costs, i.e., Sales-cost=Profit. This
knowledge is not sufficient for management for discharging the functions of planning and
control, etc. The cost is further divided according to its behaviour, i.e., fixed cost and
variable cost. The age old equation can be written as
Sales – (Fixed cost + Variable cost) = profit.
Marginal costing is a management technique of dealing with cost of data. It is based
primarily on the behavioural study of cost.
19
8/7/2019 final(sat)
http://slidepdf.com/reader/full/finalsat 20/47
Absorption costing, i.e., the costing technique, which does not recognize the difference
between fixed costs and variable costs does not adequately cater to the needs of
management. The statements prepared under absorption costing do elaborately explain
past profit, past losses and the costs incurred in past, but these statements do not help when
it comes to predict about tomorrow’s result. A conventional income statement cannot tell
what the profit or loss will be if the volume is increased or decreased. These days, there is
a cut-throat competition in market and management has got to know its cost structure
thoroughly. Marginal costing provides this vital information to management and it helps in
the discharge of its functions like cost control, profit planning performance evaluation and
decision-making.
I) Contribution
Contribution is the difference between the sales and the marginal cost of sales and the
marginal cost of sales and it contribute towards fixed expenses and profit.
Contribution can be represented as :
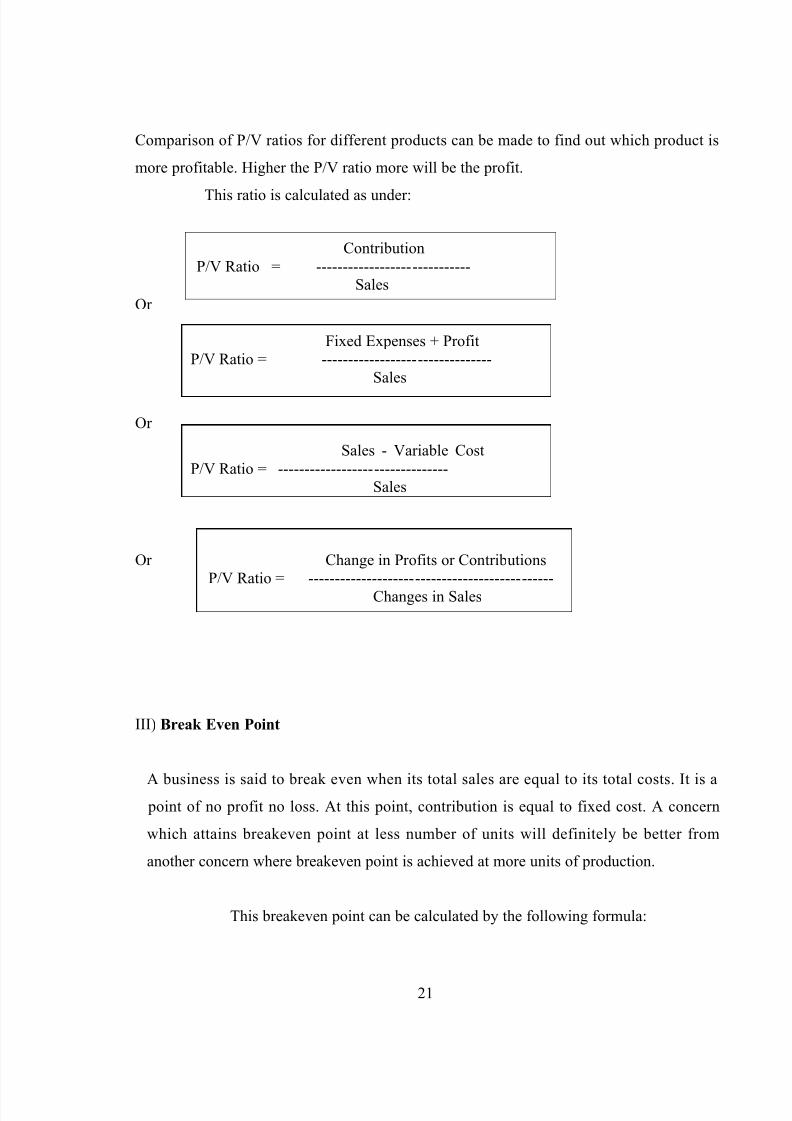
II) Profit Volume (P/V) Ratio
The profit volume ratio is one of the most important ratios for studying the profitability of
operations of a business and establishes the relationship between contribution and sales.
20
Contribution = Selling Price – Marginal Cost
Contribution = Fixed Expenses + Profit
Contribution – Fixed Expenses = Profit
8/7/2019 final(sat)
http://slidepdf.com/reader/full/finalsat 21/47
8/7/2019 final(sat)
http://slidepdf.com/reader/full/finalsat 22/47
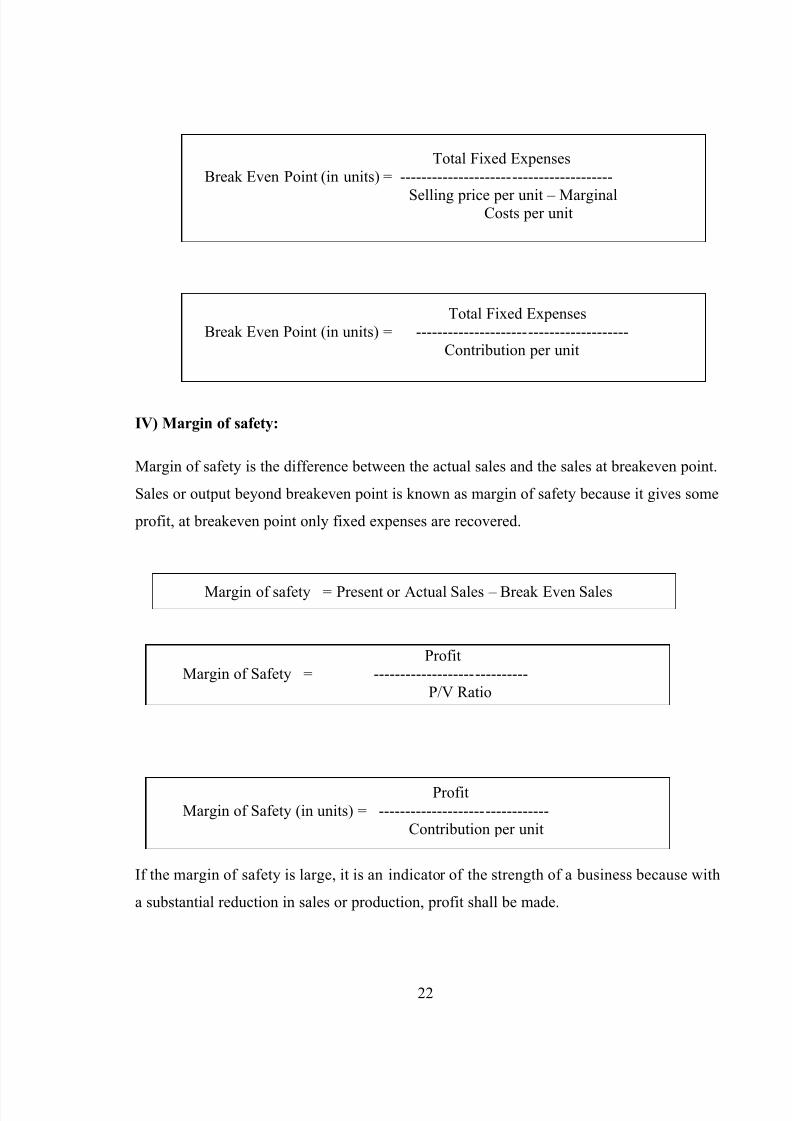
Total Fixed ExpensesBreak Even Point (in units) = ----------------------------------------
Selling price per unit – MarginalCosts per unit
Total Fixed ExpensesBreak Even Point (in units) = ----------------------------------------
Contribution per unit
IV) Margin of safety:
Margin of safety is the difference between the actual sales and the sales at breakeven point.
Sales or output beyond breakeven point is known as margin of safety because it gives some
profit, at breakeven point only fixed expenses are recovered.
Margin of safety = Present or Actual Sales – Break Even Sales
ProfitMargin of Safety = -----------------------------
P/V Ratio
ProfitMargin of Safety (in units) = --------------------------------
Contribution per unit
If the margin of safety is large, it is an indicator of the strength of a business because with
a substantial reduction in sales or production, profit shall be made.
22
8/7/2019 final(sat)
http://slidepdf.com/reader/full/finalsat 23/47
4.6 LIMITATION OF THE STUDY
1. Fixed costs do not always remain constant.
2. Variable costs do not always vary proportionately
3. Breakeven analysis of doubtful validity when the business is selling many
products with profit margin.
4. Only a limited amount of information can be presented in a single breakeven chart.
If we have to study the changes of fixed costs, variable costs and selling prices, a
number of charts will have to be drawn up.
5. The chart becomes very complicated and difficult to understand for a layman, if the
number of lines or curves depicted on the graph is large.
23
8/7/2019 final(sat)
http://slidepdf.com/reader/full/finalsat 24/47
5 DATA ANALYSIS AND INTERPRETATION
5.1 COST VOLUME PROFIT ANALYSIS
TABLE 5.1.1
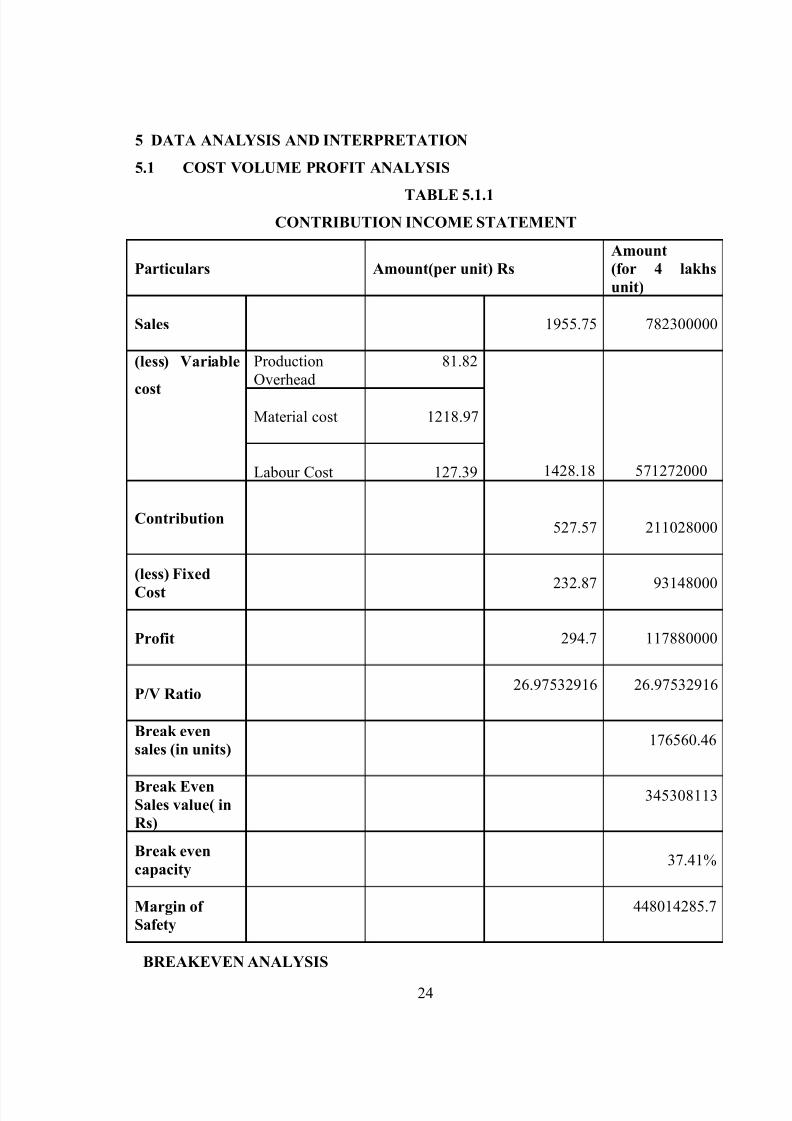
CONTRIBUTION INCOME STATEMENT
BREAKEVEN ANALYSIS
24
Particulars Amount(per unit) Rs
Amount
(for 4 lakhs
unit)
Sales 1955.75 782300000
(less) Variable
cost
ProductionOverhead
81.82
1428.18 571272000
Material cost 1218.97
Labour Cost
127.39
Contribution527.57 211028000
(less) Fixed
Cost 232.87 93148000
Profit 294.7 117880000
P/V Ratio26.97532916 26.97532916
Break even
sales (in units)176560.46
Break EvenSales value( in
Rs)
345308113
Break even
capacity37.41%
Margin of
Safety
448014285.7
8/7/2019 final(sat)
http://slidepdf.com/reader/full/finalsat 25/47
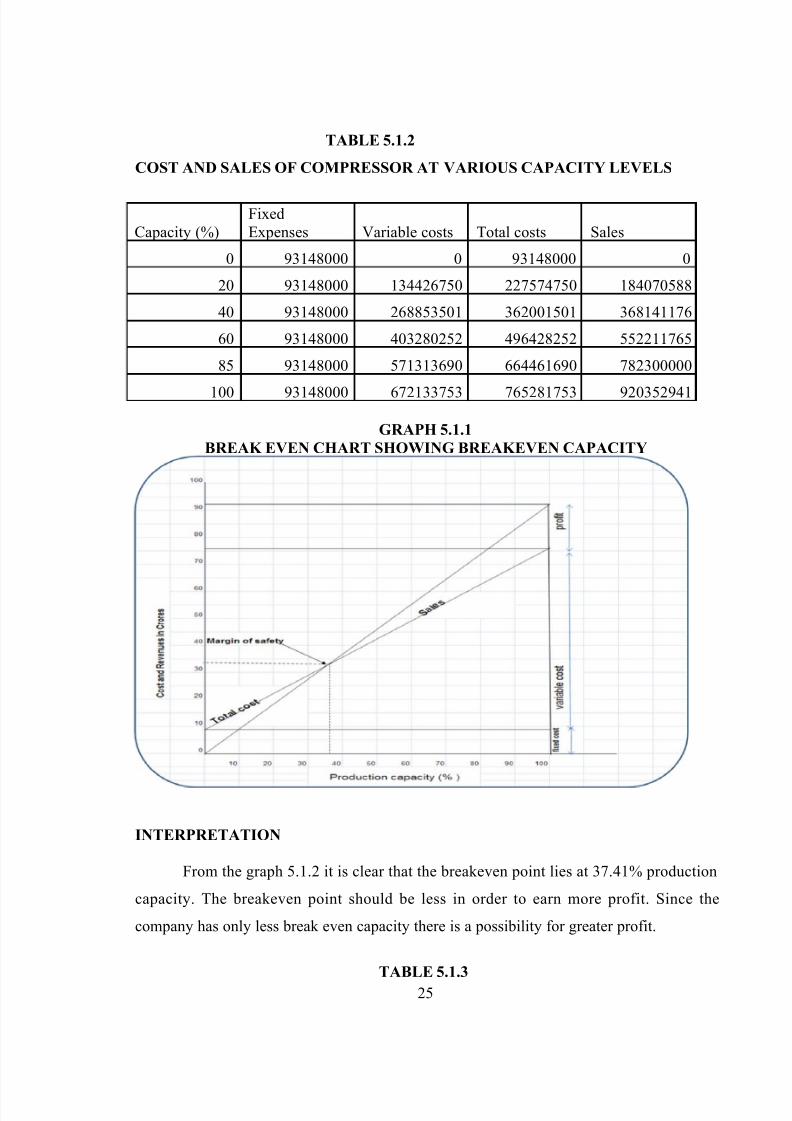
TABLE 5.1.2
COST AND SALES OF COMPRESSOR AT VARIOUS CAPACITY LEVELS
Capacity (%)FixedExpenses Variable costs Total costs Sales
0 93148000 0 93148000 0
20 93148000 134426750 227574750 184070588
40 93148000 268853501 362001501 368141176
60 93148000 403280252 496428252 552211765
85 93148000 571313690 664461690 782300000
100 93148000 672133753 765281753 920352941
GRAPH 5.1.1
BREAK EVEN CHART SHOWING BREAKEVEN CAPACITY
INTERPRETATION
From the graph 5.1.2 it is clear that the breakeven point lies at 37.41% production
capacity. The breakeven point should be less in order to earn more profit. Since the
company has only less break even capacity there is a possibility for greater profit.
TABLE 5.1.3
25
8/7/2019 final(sat)
http://slidepdf.com/reader/full/finalsat 26/47
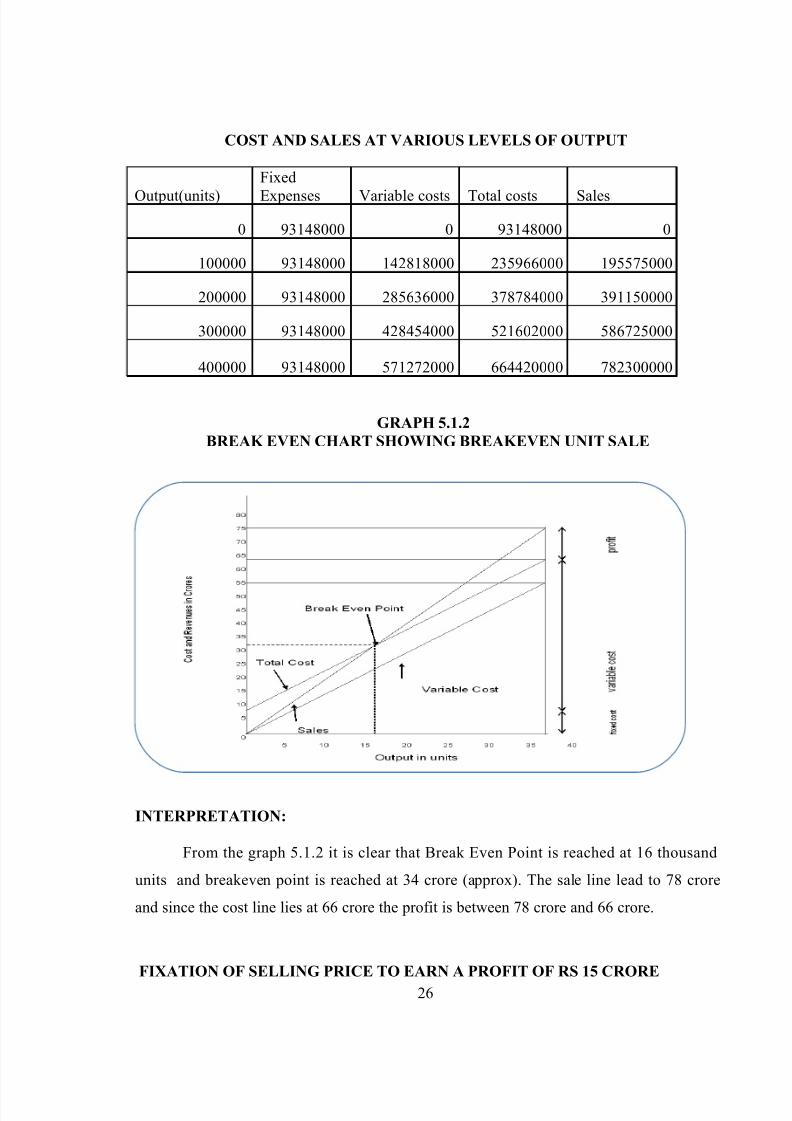
COST AND SALES AT VARIOUS LEVELS OF OUTPUT
Output(units)
Fixed
Expenses Variable costs Total costs Sales
0 93148000 0 93148000 0
100000 93148000 142818000 235966000 195575000
200000 93148000 285636000 378784000 391150000
300000 93148000 428454000 521602000 586725000
400000 93148000 571272000 664420000 782300000
GRAPH 5.1.2
BREAK EVEN CHART SHOWING BREAKEVEN UNIT SALE
INTERPRETATION:
From the graph 5.1.2 it is clear that Break Even Point is reached at 16 thousand
units and breakeven point is reached at 34 crore (approx). The sale line lead to 78 crore
and since the cost line lies at 66 crore the profit is between 78 crore and 66 crore.
FIXATION OF SELLING PRICE TO EARN A PROFIT OF RS 15 CRORE
26
8/7/2019 final(sat)
http://slidepdf.com/reader/full/finalsat 27/47
Contribution = Fixed cost + desired profit
= 93148000 + 150000000
= 243148000
P/V Ratio = 26.98%
ContributionSales = --------------------------------
p/v ratio
= 243148000/ 26.98%
= 815932885.9Selling pricePer unit = 2039.832215
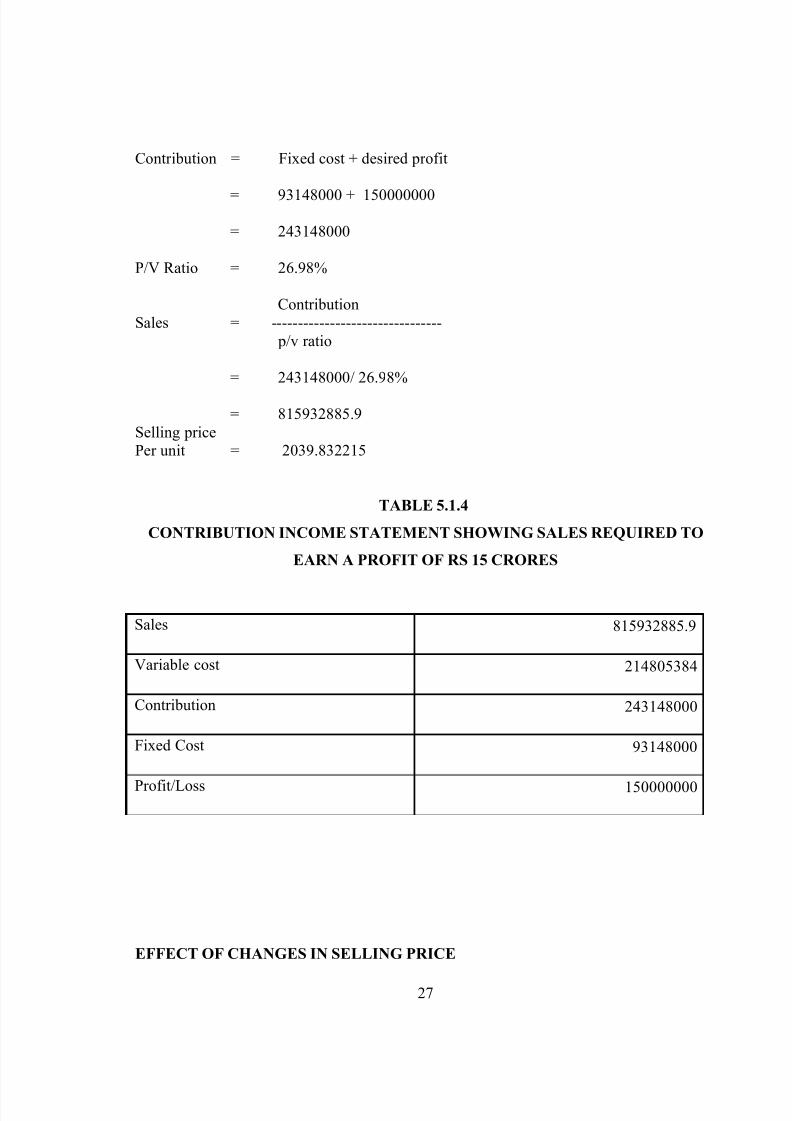
TABLE 5.1.4
CONTRIBUTION INCOME STATEMENT SHOWING SALES REQUIRED TO
EARN A PROFIT OF RS 15 CRORES
Sales 815932885.9
Variable cost 214805384
Contribution 243148000
Fixed Cost 93148000
Profit/Loss 150000000
EFFECT OF CHANGES IN SELLING PRICE
27
8/7/2019 final(sat)
http://slidepdf.com/reader/full/finalsat 28/47
Changing the selling price will have both positive and negative impact. Since the
competitor’s price is more than our price it is desirable to increase the selling price.
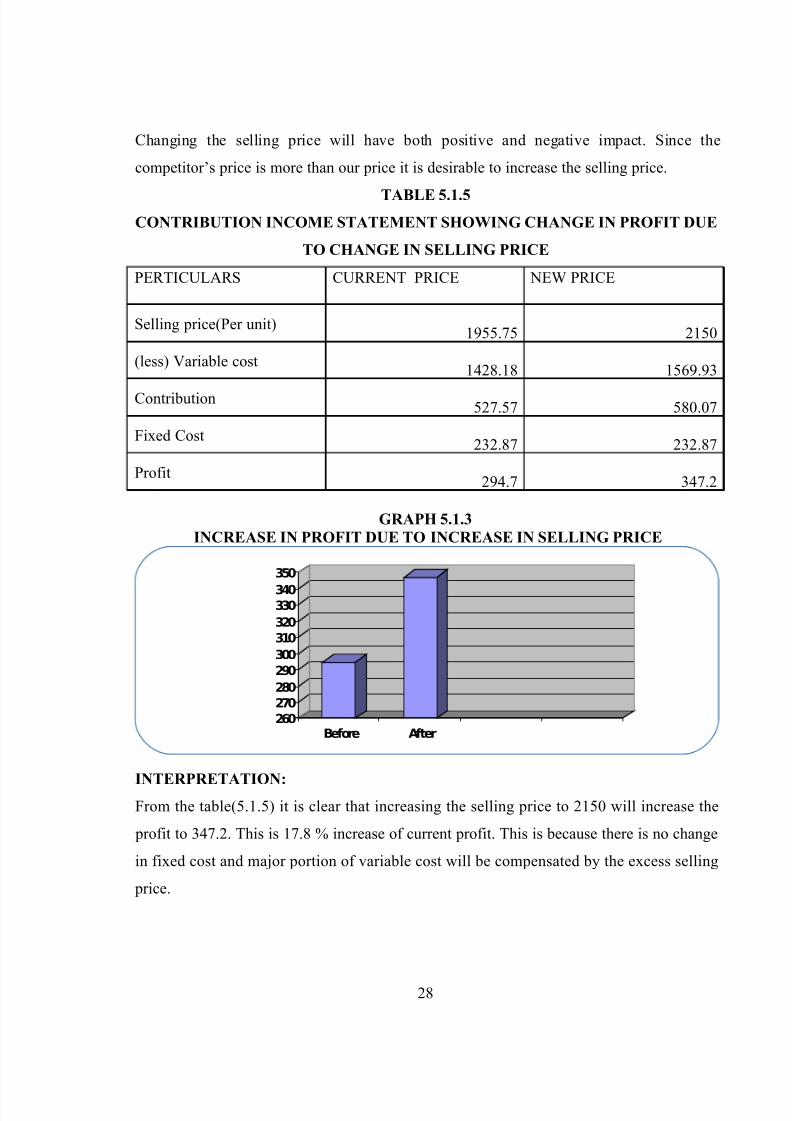
TABLE 5.1.5
CONTRIBUTION INCOME STATEMENT SHOWING CHANGE IN PROFIT DUE
TO CHANGE IN SELLING PRICE
PERTICULARS CURRENT PRICE NEW PRICE
Selling price(Per unit)1955.75 2150
(less) Variable cost
1428.18 1569.93
Contribution527.57 580.07
Fixed Cost232.87 232.87
Profit294.7 347.2
GRAPH 5.1.3
INCREASE IN PROFIT DUE TO INCREASE IN SELLING PRICE
260
270
280
290
300
310
320
330340
350
Before After
INTERPRETATION:From the table(5.1.5) it is clear that increasing the selling price to 2150 will increase the
profit to 347.2. This is 17.8 % increase of current profit. This is because there is no change
in fixed cost and major portion of variable cost will be compensated by the excess selling
price.
28
8/7/2019 final(sat)
http://slidepdf.com/reader/full/finalsat 29/47
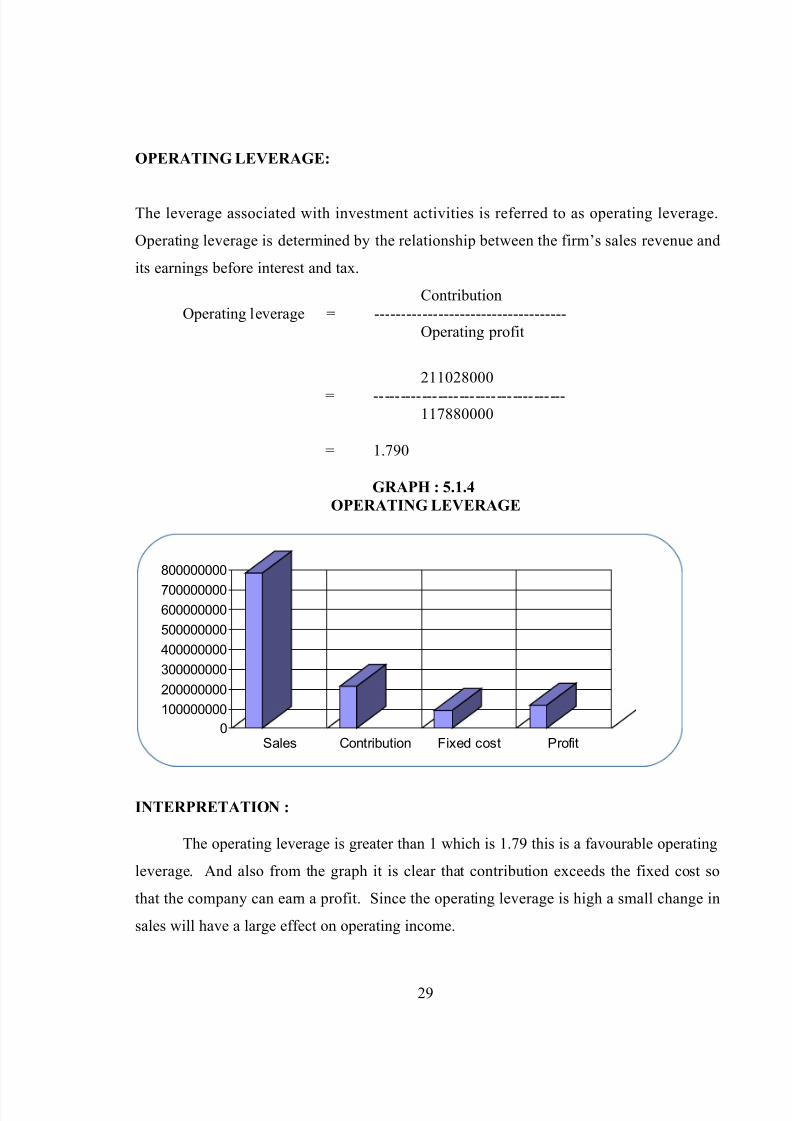
OPERATING LEVERAGE:
The leverage associated with investment activities is referred to as operating leverage.
Operating leverage is determined by the relationship between the firm’s sales revenue and
its earnings before interest and tax.
ContributionOperating leverage = ------------------------------------
Operating profit
211028000
= ------------------------------------117880000
= 1.790
GRAPH : 5.1.4
OPERATING LEVERAGE
0
100000000
200000000
300000000
400000000
500000000
600000000
700000000
800000000
Sales Contribution Fixed cost Profit
INTERPRETATION :
The operating leverage is greater than 1 which is 1.79 this is a favourable operating
leverage. And also from the graph it is clear that contribution exceeds the fixed cost so
that the company can earn a profit. Since the operating leverage is high a small change in
sales will have a large effect on operating income.
29
8/7/2019 final(sat)
http://slidepdf.com/reader/full/finalsat 30/47
COST VOLUME PROFIT ANALYSIS BY CONSIDERING OVERALL
PRODUCTION
TABLE 5.2.1SALES AND PROFIT OF THE YEAR 2009 AND 2010
Period sales (in lakhs) Profit (in lakhs)
2009 42,594.58 6,067.31
201059,125.80 13,015.07
Difference
16,531.22 6,947.76
(Cost structure and selling price remains the same in 2008 & 2009)
P/V RATIO
Change in profit
P/V Ratio = ------------------------- X 100Change in sales
6947.76 X 100= -------------
16531.22
= .42028 X 100
P/V Ratio = 42.028%
FIXED COST:
Fixed cost = (Sales X P/V Ratio) - Profit
= (59125.802010X .42028) - 13015.07
= 11834.321 lakhs
(or)
= (42594.582009X .42028) - 6067.31
= 11834.35 lakhs
30
8/7/2019 final(sat)
http://slidepdf.com/reader/full/finalsat 31/47
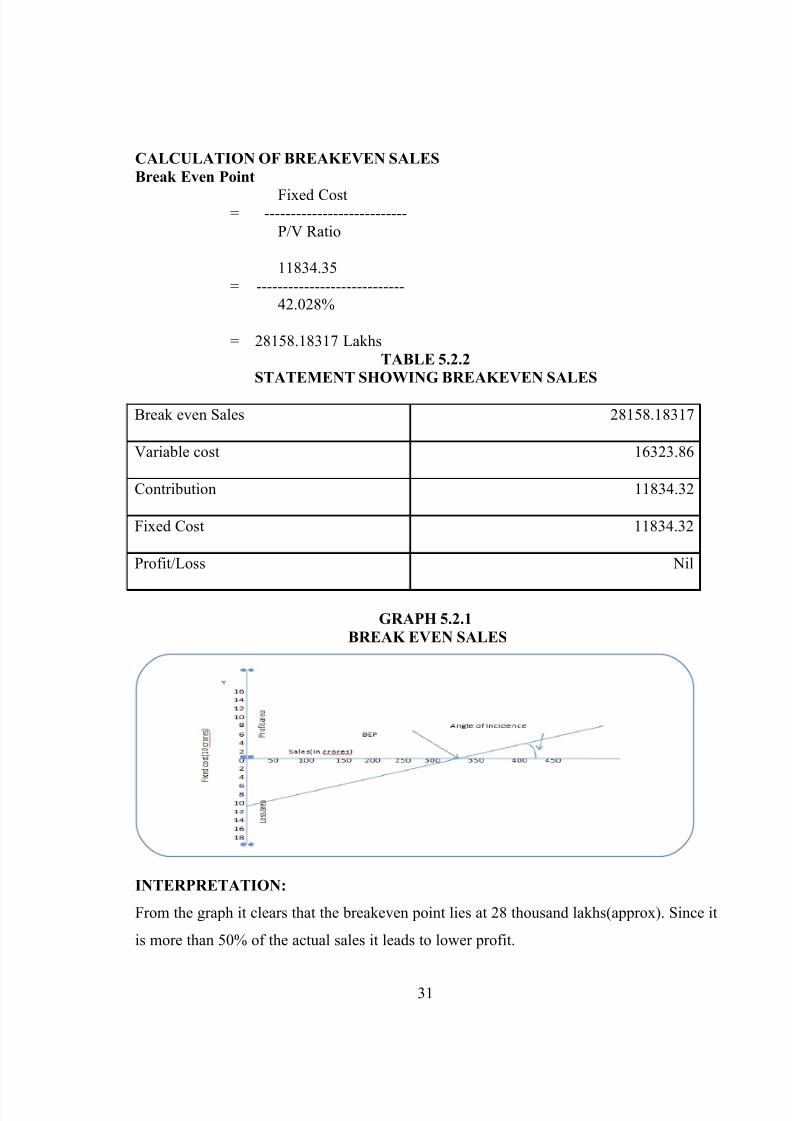
CALCULATION OF BREAKEVEN SALES
Break Even Point
Fixed Cost= ---------------------------
P/V Ratio
11834.35= ----------------------------
42.028%
= 28158.18317 LakhsTABLE 5.2.2
STATEMENT SHOWING BREAKEVEN SALES
Break even Sales 28158.18317
Variable cost 16323.86
Contribution 11834.32
Fixed Cost 11834.32
Profit/Loss Nil
GRAPH 5.2.1
BREAK EVEN SALES
INTERPRETATION:
From the graph it clears that the breakeven point lies at 28 thousand lakhs(approx). Since it
is more than 50% of the actual sales it leads to lower profit.
31
8/7/2019 final(sat)
http://slidepdf.com/reader/full/finalsat 32/47
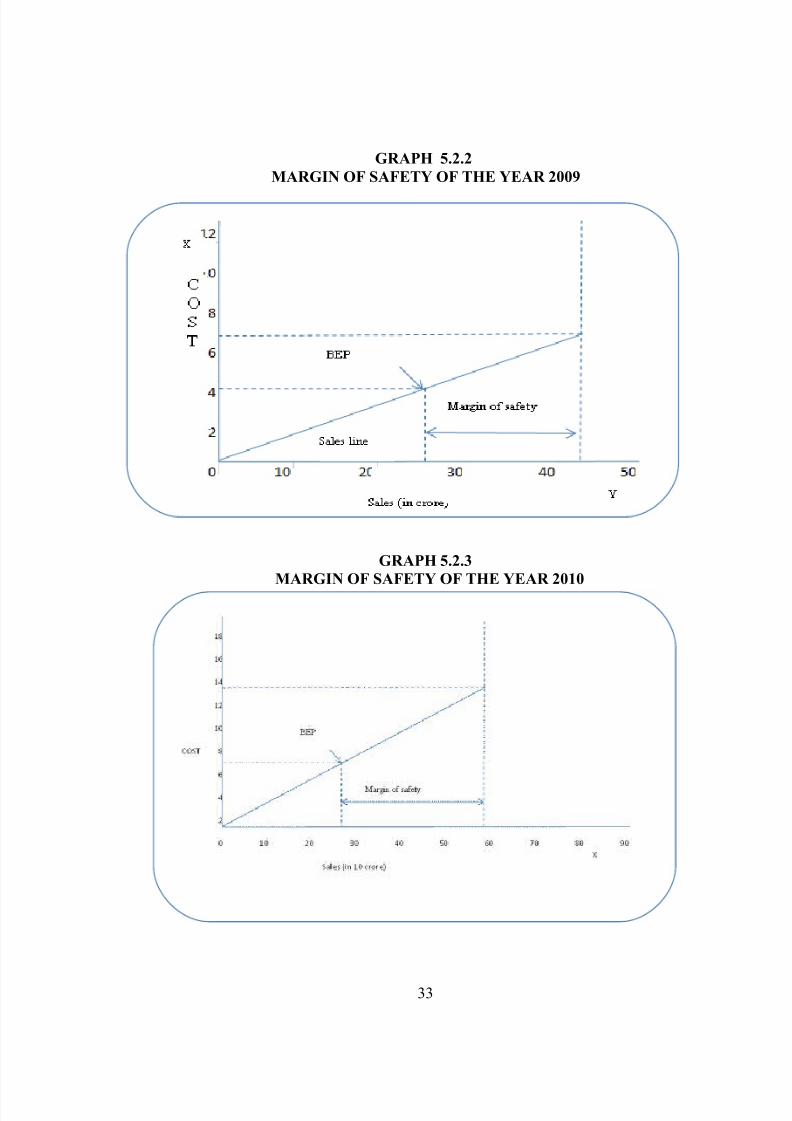
CALCULATION OF MARGIN OF SAFETY
Margin of safety for the year 2009:
Profit= -------------------------
P/V Ratio
6067.31= ----------------------------
42.028%
= 14436.352 Lakhs
(Or)
= sales – sales at Break even
= 42594.58 - 28158.18317
= 14436.3968 Lakhs
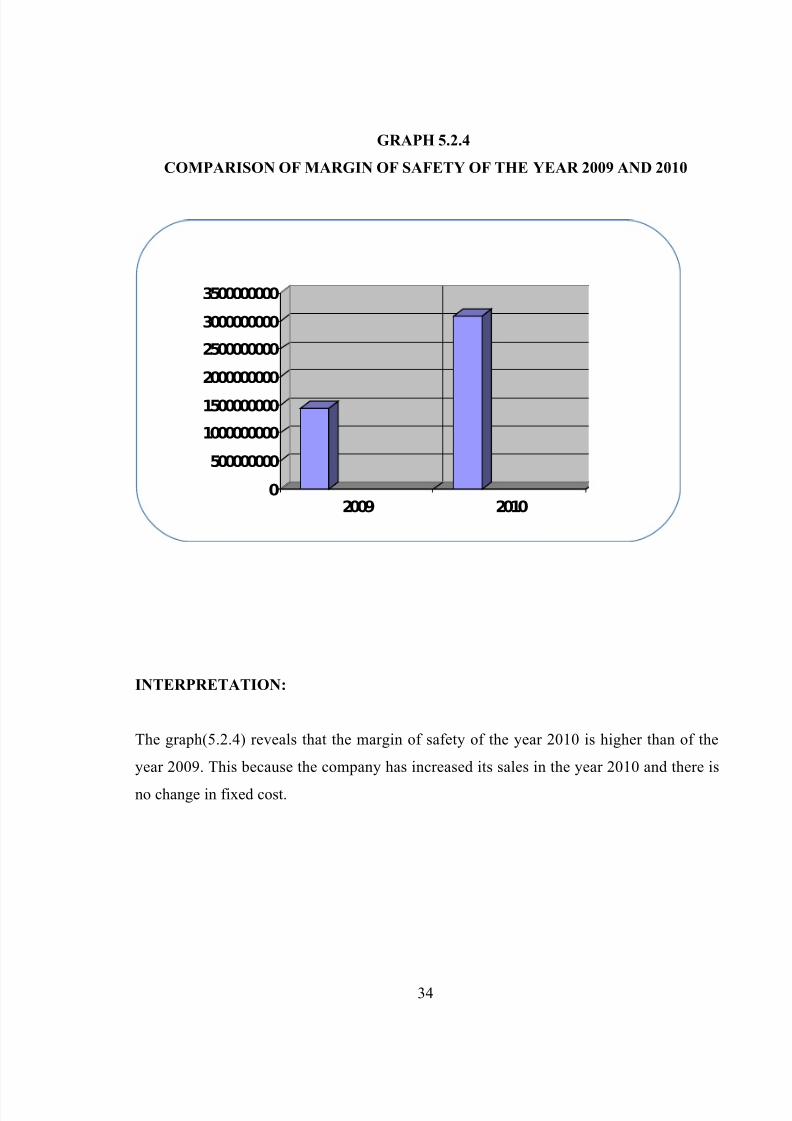
Margin of safety for the year 2010:
Profit= -------------------------
P/V Ratio
13015.07= ------------------------------
42.028%
= 30967.6168 Lakhs
(Or)
= sales – sales at Break even
= 59125.80- 28158.18317
= 30967.6168 Lakhs
32
8/7/2019 final(sat)
http://slidepdf.com/reader/full/finalsat 33/47
GRAPH 5.2.2
MARGIN OF SAFETY OF THE YEAR 2009
GRAPH 5.2.3
MARGIN OF SAFETY OF THE YEAR 2010
33
8/7/2019 final(sat)
http://slidepdf.com/reader/full/finalsat 34/47
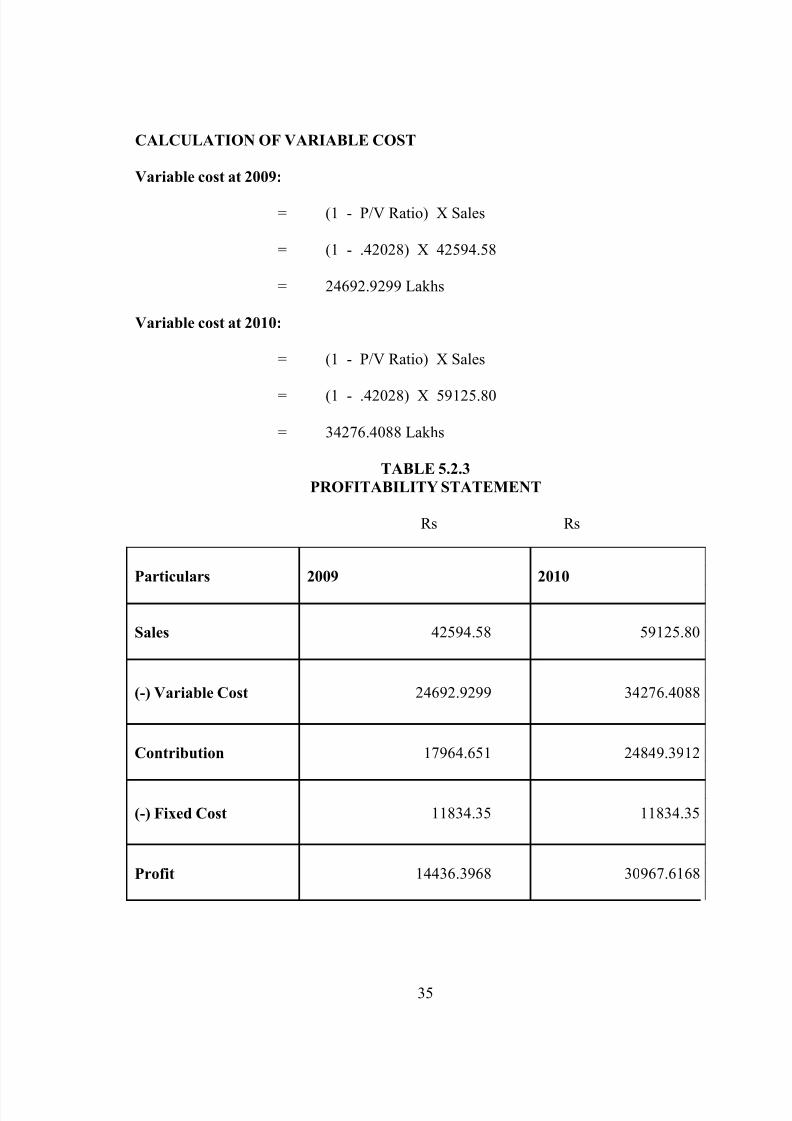
GRAPH 5.2.4
COMPARISON OF MARGIN OF SAFETY OF THE YEAR 2009 AND 2010
0
500000000
1000000000
1500000000
2000000000
2500000000
3000000000
3500000000
2009 2010
INTERPRETATION:
The graph(5.2.4) reveals that the margin of safety of the year 2010 is higher than of the
year 2009. This because the company has increased its sales in the year 2010 and there is
no change in fixed cost.
34
8/7/2019 final(sat)
http://slidepdf.com/reader/full/finalsat 35/47
8/7/2019 final(sat)
http://slidepdf.com/reader/full/finalsat 36/47
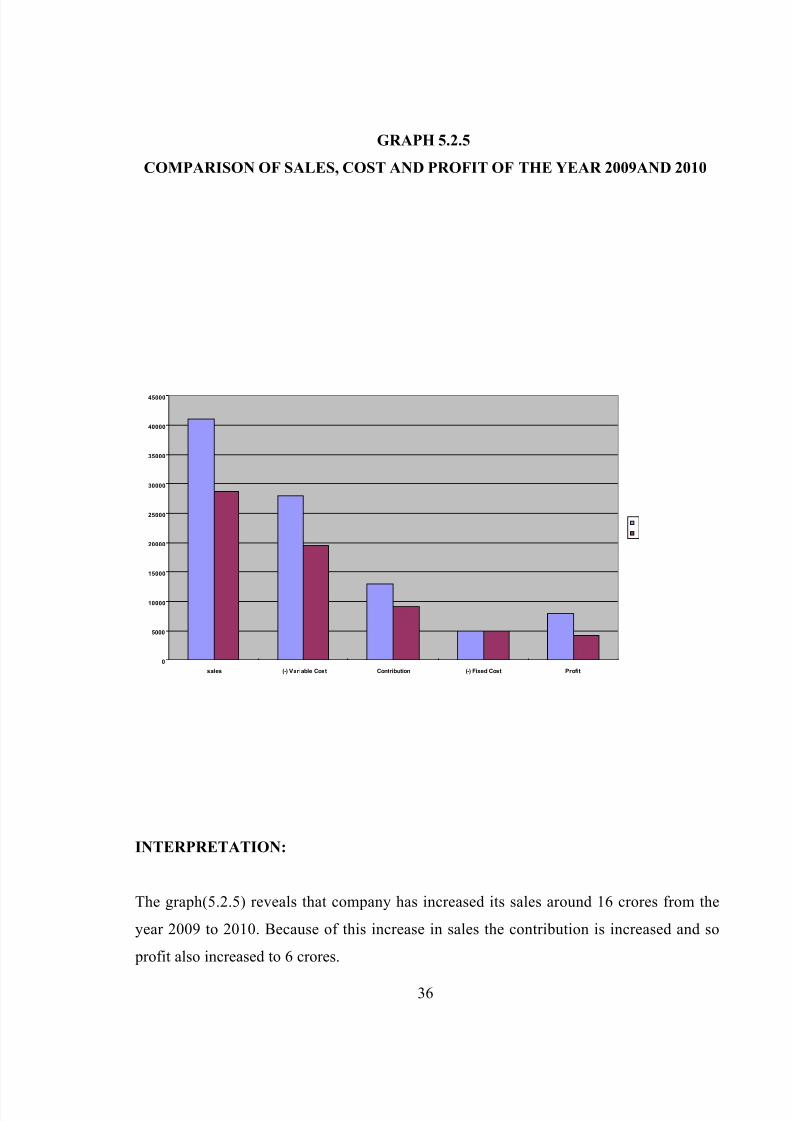
GRAPH 5.2.5
COMPARISON OF SALES, COST AND PROFIT OF THE YEAR 2009AND 2010
0
5000
10000
15000
20000
25000
30000
35000
40000
45000
sales (-) Variable Cost Contribution (-) Fixed Cost Profit
INTERPRETATION:
The graph(5.2.5) reveals that company has increased its sales around 16 crores from the
year 2009 to 2010. Because of this increase in sales the contribution is increased and so
profit also increased to 6 crores.
36
8/7/2019 final(sat)
http://slidepdf.com/reader/full/finalsat 37/47
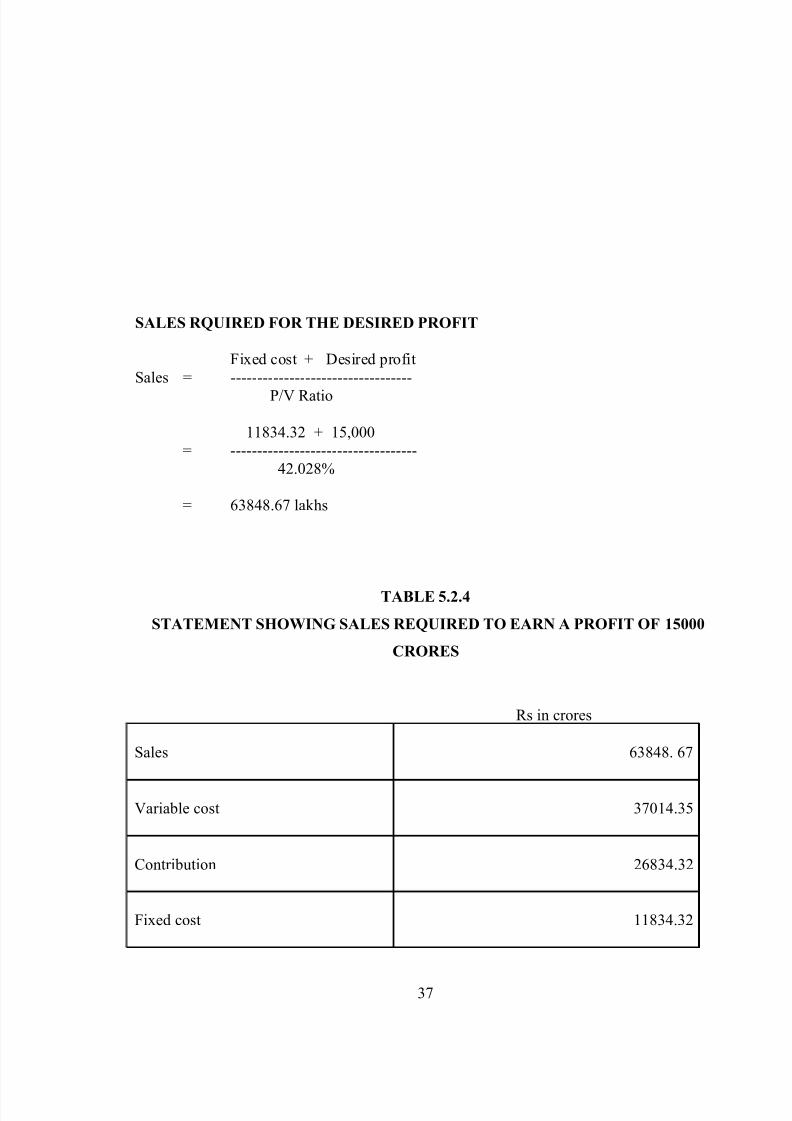
SALES RQUIRED FOR THE DESIRED PROFIT
Fixed cost + Desired profitSales = ----------------------------------
P/V Ratio
11834.32 + 15,000= -----------------------------------
42.028%
= 63848.67 lakhs
TABLE 5.2.4
STATEMENT SHOWING SALES REQUIRED TO EARN A PROFIT OF 15000
CRORES
Rs in crores
Sales 63848. 67
Variable cost 37014.35
Contribution 26834.32
Fixed cost 11834.32
37
8/7/2019 final(sat)
http://slidepdf.com/reader/full/finalsat 38/47
Profit 15000.00
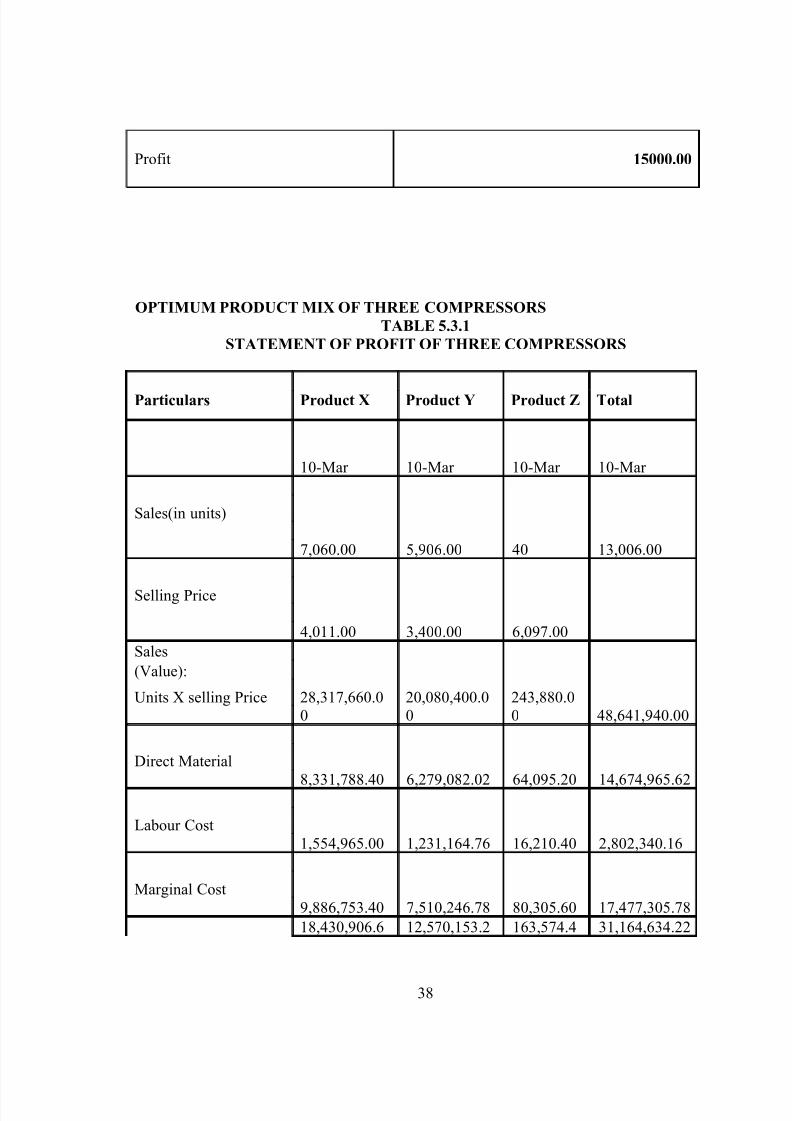
OPTIMUM PRODUCT MIX OF THREE COMPRESSORS
TABLE 5.3.1
STATEMENT OF PROFIT OF THREE COMPRESSORS
Particulars Product X Product Y Product Z Total
10-Mar 10-Mar 10-Mar 10-Mar
7,060.00 5,906.00 40 13,006.00
Sales(in units)
4,011.00 3,400.00 6,097.00
Selling Price
Sales
28,317,660.00
20,080,400.00
243,880.00 48,641,940.00
(Value):
Units X selling Price
8,331,788.40 6,279,082.02 64,095.20 14,674,965.62
Direct Material
1,554,965.00 1,231,164.76 16,210.40 2,802,340.16Labour Cost
9,886,753.40 7,510,246.78 80,305.60 17,477,305.78Marginal Cost
18,430,906.6 12,570,153.2 163,574.4 31,164,634.22
38
8/7/2019 final(sat)
http://slidepdf.com/reader/full/finalsat 39/47
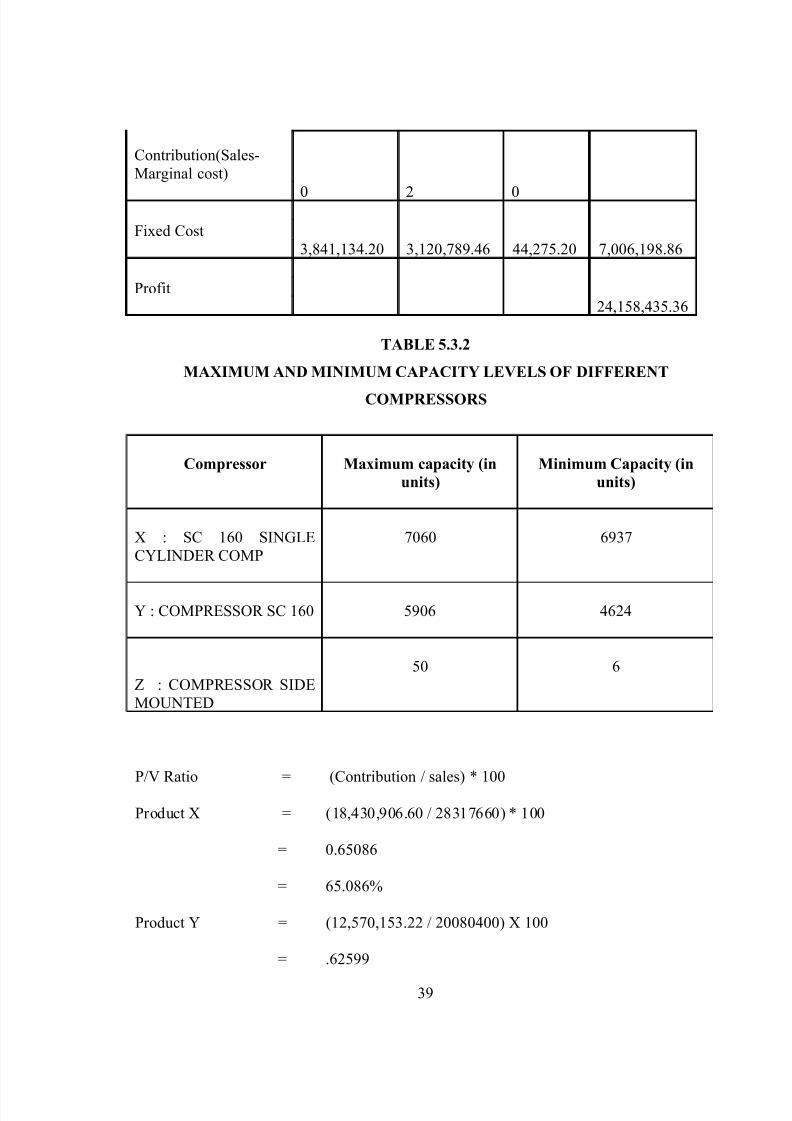
0 2 0
Contribution(Sales-Marginal cost)
3,841,134.20 3,120,789.46 44,275.20 7,006,198.86Fixed Cost
24,158,435.36Profit
TABLE 5.3.2
MAXIMUM AND MINIMUM CAPACITY LEVELS OF DIFFERENT
COMPRESSORS
Compressor Maximum capacity (in
units)
Minimum Capacity (in
units)
X : SC 160 SINGLECYLINDER COMP
7060 6937
Y : COMPRESSOR SC 160 5906 4624
Z : COMPRESSOR SIDEMOUNTED
50 6
P/V Ratio = (Contribution / sales) * 100
Product X = (18,430,906.60 / 28317660) * 100
= 0.65086
= 65.086%
Product Y = (12,570,153.22 / 20080400) X 100
= .62599
39
8/7/2019 final(sat)
http://slidepdf.com/reader/full/finalsat 40/47
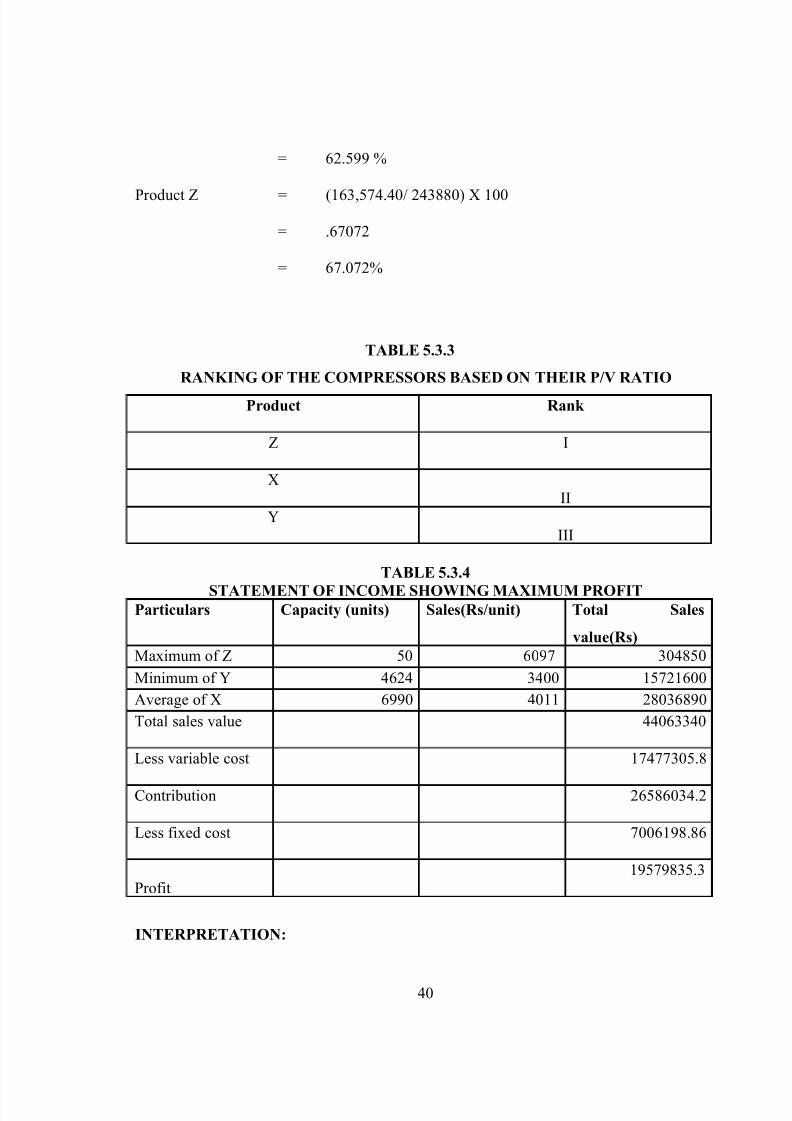
= 62.599 %
Product Z = (163,574.40/ 243880) X 100
= .67072
= 67.072%
TABLE 5.3.3
RANKING OF THE COMPRESSORS BASED ON THEIR P/V RATIO
Product Rank
Z I
XII
YIII
TABLE 5.3.4
STATEMENT OF INCOME SHOWING MAXIMUM PROFITParticulars Capacity (units) Sales(Rs/unit) Total Sales
value(Rs)
Maximum of Z 50 6097 304850
Minimum of Y 4624 3400 15721600
Average of X 6990 4011 28036890
Total sales value 44063340
Less variable cost 17477305.8
Contribution 26586034.2
Less fixed cost 7006198.86
Profit19579835.3
INTERPRETATION:
40
8/7/2019 final(sat)
http://slidepdf.com/reader/full/finalsat 41/47
From the above table(5.3.4) it is clear that product Z has highest contribution. And then X
followed by Y. In order to earn more profit te company should boost up te sale of product
Z. Since the maximum production capacity of Z is only 50 units the company should
produce all the 50 units. And since the contribution of product Y is comparatively less than
other products it should produced at its minimum level. And te product X can be produced
at the normal level. By doing so the company can earn a profit of Rs 19579835.3.
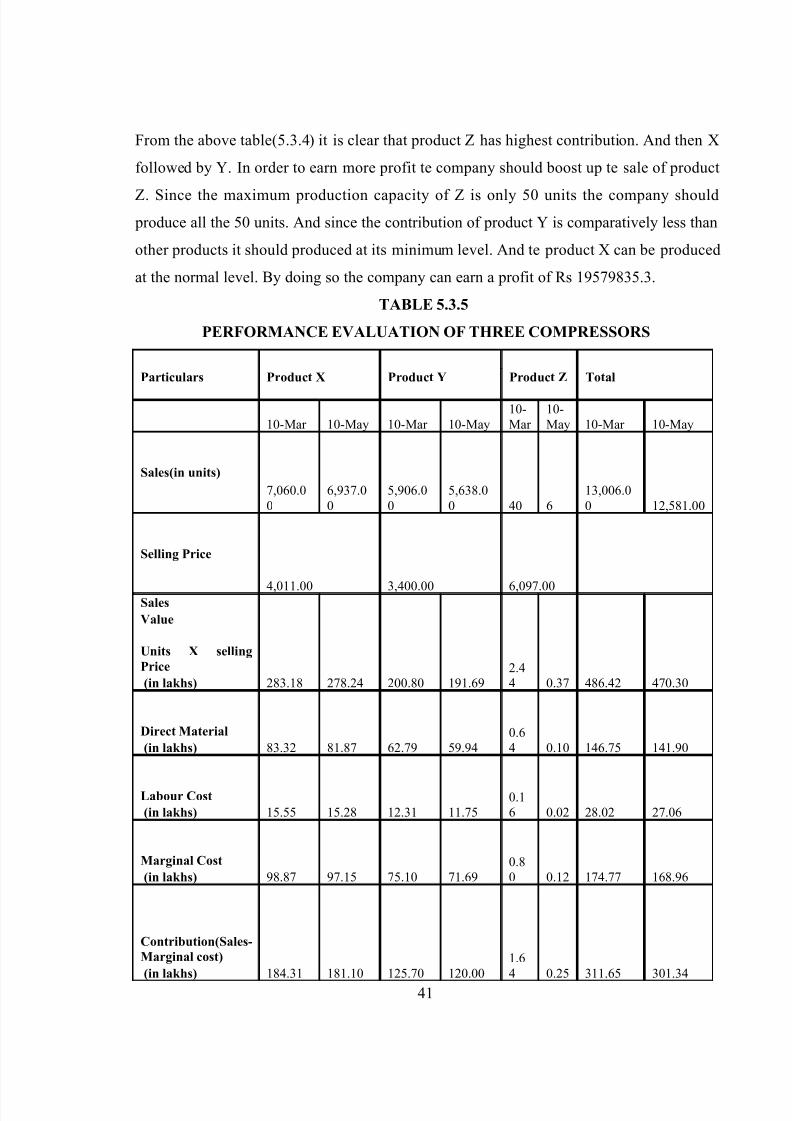
TABLE 5.3.5
PERFORMANCE EVALUATION OF THREE COMPRESSORS
Particulars Product X Product Y Product Z Total
10-Mar 10-May 10-Mar 10-May10-Mar
10-May 10-Mar 10-May
7,060.00
6,937.00
5,906.00
5,638.00 40 6
13,006.00 12,581.00
Sales(in units)
4,011.00 3,400.00 6,097.00
Selling Price
Sales
283.18 278.24 200.80 191.692.44 0.37 486.42 470.30
Value
Units X selling
Price
(in lakhs)
83.32 81.87 62.79 59.940.64 0.10 146.75 141.90
Direct Material
(in lakhs)
15.55 15.28 12.31 11.750.16 0.02 28.02 27.06
Labour Cost
(in lakhs)
98.87 97.15 75.10 71.690.80 0.12 174.77 168.96
Marginal Cost
(in lakhs)
184.31 181.10 125.70 120.001.64 0.25 311.65 301.34
Contribution(Sales-
Marginal cost)
(in lakhs)
41
8/7/2019 final(sat)
http://slidepdf.com/reader/full/finalsat 42/47
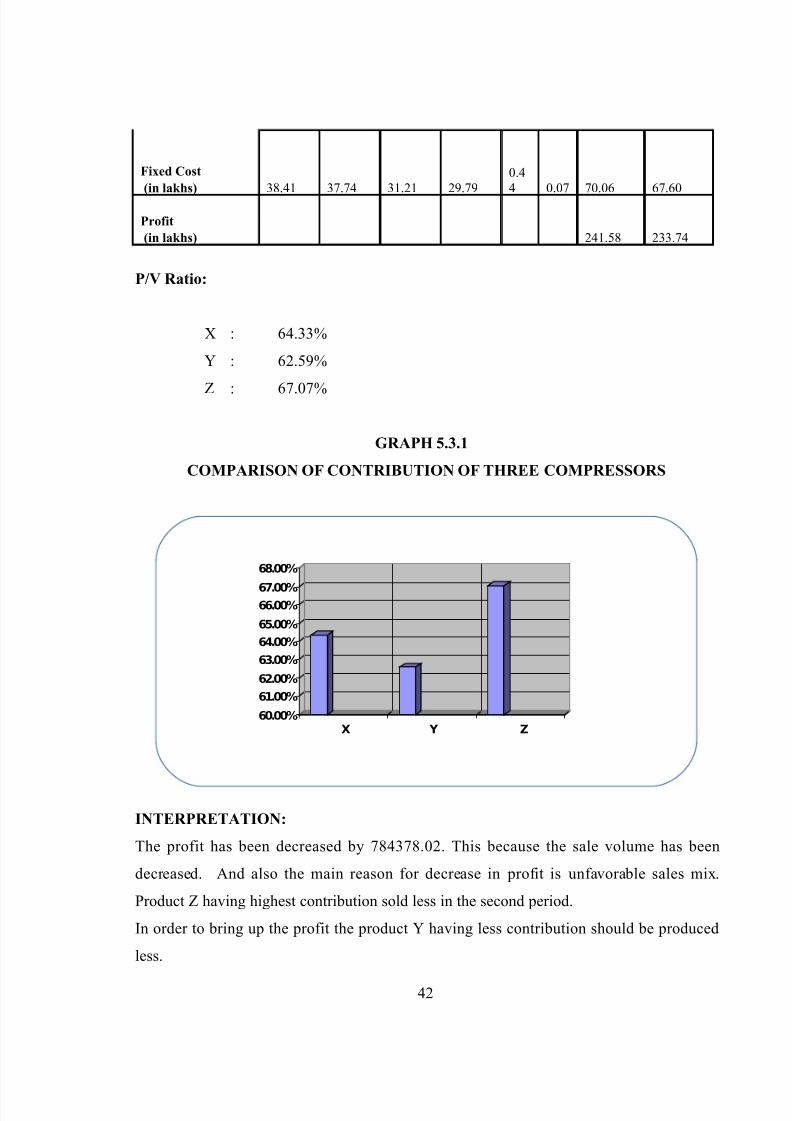
38.41 37.74 31.21 29.790.44 0.07 70.06 67.60
Fixed Cost
(in lakhs)
241.58 233.74
Profit
(in lakhs)
P/V Ratio:
X : 64.33%
Y : 62.59%
Z : 67.07%
GRAPH 5.3.1
COMPARISON OF CONTRIBUTION OF THREE COMPRESSORS
60.00%
61.00%
62.00%
63.00%
64.00%
65.00%
66.00%67.00%
68.00%
X Y Z
INTERPRETATION:
The profit has been decreased by 784378.02. This because the sale volume has been
decreased. And also the main reason for decrease in profit is unfavorable sales mix.
Product Z having highest contribution sold less in the second period.
In order to bring up the profit the product Y having less contribution should be produced
less.
42
8/7/2019 final(sat)
http://slidepdf.com/reader/full/finalsat 43/47
6. FINDINGS, SUGGESTIONS AND CONCLUSION
6.1 FINDINGS
1. It was found that breakeven capacity of the production of capacitor lies at 37.41%
of overall production capacity.
2. The breakeven sale volume of capacitor lies at 16 thousand units.
3. Increasing the selling price to 2150 will increase the profit to 347.2. This is 17.8 %
increase of current profit. This is because there is no change in fixed cost and major
portion of variable cost will be compensated by the excess selling price.
4. The operating leverage of the company regarding production of capacitor is 1.790.
It shows positive sign of the company.
5. It was found that breakeven sale of overall production is Rs 28 thousand lakhs.
6. Margin of safety of the year 2010 is higher than the year 2009
7. The company has earned a profit of additional 6 crores in the year 2010 than in the
year 2009
8. The item Z (COMPRESSOR SIDE MOUNTED) has higher contribution than other
items X ( SC 160 SINGLE CYLINDER COMPRESSOR) and Y (COMPRESSOR
SC 160)
9. Because of unfavourable sales mix the profit has been reduced to 1.96 crore.
43
8/7/2019 final(sat)
http://slidepdf.com/reader/full/finalsat 44/47
6.2 SUGGESTIONS
From the findings it was found that the breakeven capacity of capacitors is 37.41%. Since
it is less than 50% the company can continue the production of capacitors and it has to
take measures to control the variable cost by concentrating on single product..
Since the company is following JIT( Just In Time) principle for manufacturing(i.e.,
production based on demand) it is highly risk for the company to increase the profit by
increasing the sales. So in order to increase the profit the company can increase the selling
price maximum to the competitor’s price.
Because of unfavourable sales mix of the compressors the profit of the company has been
reduced to 1.96 crores. So in order to overcome the loss the product COMPRESSOR SIDE
MOUNTED should be given importance, followed by the item SC 160 SINGLE
CYLINDER COMPRESSOR and then the item COMPRESSOR SC 160.
44
8/7/2019 final(sat)
http://slidepdf.com/reader/full/finalsat 45/47
6.3 CONCLUSION
The cost volume profit analysis is very much important for the company to know about
the relationship between the cost volume and profit. In the competitive world it is verymuch important for the company to know about its profit position.
It is a powerful tool to analyze how the change in selling price and change in cost
affect the profit position of the company, not only that it also helps to determine the
optimum mix of the company.
Cost volume profit analysis helps the management in profit planning. profit of the firm
wabco-tvs can be increased by increase the output , selling price or reducing the cost ,
since the company can produce products on demand basis it’s concluded that by
increasing the selling price company can earn more profit.
45
8/7/2019 final(sat)
http://slidepdf.com/reader/full/finalsat 46/47
TEXTBOOKS REFERRED:
1. Brealey, Richard A., and Stewart C. Myers. 1991. Principles of Corporate Finance.
4th ed. New York: McGraw-Hill.2. Brigham, Eugene F. 1995. Fundamentals of Financial Management. 7th ed.
Orlando, FL: Dryden Press.
3. Chan, Y.L., and Y. Yuan. 1990. "Dealing With Fuzziness in Cost-Volume-Profit
Analysis." Accounting and Business Research 20 (78): 83-95.
4. Cheung, J.K., and J. Heaney. 1990. "A Contingent-Claim Integration of Cost-
Volume-Profit Analysis with Capital Budgeting." Contemporary Accounting
Research 6 (Spring): 738-760.
5. Drucker, Peter F. 1995. "The Information Executives Truly Need." Harvard
Business Review 73 (January-February): 54-62.
6. Michael J. McCarthy, “Airline Squeeze Play: More Seats, Less Legroom,” The
Wall Street Journal, April 18, 1994,pp. B1 and B6.
WEBSITES REFERRED:
1. www.wabco-tvs.com
2. www.wikipedia.com
3. www.moneycontrol.com
4. www.wabco-auto.com
5. www.financialexpress.com
46

8/7/2019 final(sat)
http://slidepdf.com/reader/full/finalsat 47/47


![GB - Triax fibre optic [SAT] 2015 -final](https://img.pdfslide.us/doc/110x75/55c5d673bb61ebfb5d8b4568/gb-triax-fibre-optic-sat-2015-final.jpg)