Embed Size (px)
Citation preview
FUNDAMENTAL MOTOR SKILL PROFICIENCY IN NORMAL WEIGHT
AND OVERWEIGHT CHILDREN
by
JAMES ALLAN ZAGRODNIK
(Under the Direction of Phillip D. Tomporowski)
ABSTRACT
This investigation was conducted for two reasons: First, to observe the
relationship between normal weight and overweight children on fundamental motor skill
performance. Second, to determine the effect a physical activity intervention program
has on fundamental motor skill performance in overweight children. In the first study,
113 overweight children (BMI > 85th percentile, mean age 9.25 SD 1.14) were compared
to 41 normal weight children (15th < BMI < 75th percentile, mean age 9.79 SD 1.06) on
performance of the Bruininks-Oseretsky Test of Motor Proficiency – Short Form
(BOTMP – Short Form). In the second study, 104 overweight children were divided into
a Control group (n = 40), a 20 minute exercise group (n = 31), and a 40 minute exercise
group (n = 33) and completed a 14 week physical activity program, performed with the
goal of maintaining a heart rate of at least 150 bmp. Participants’ fundamental motor
skill proficiency was measured pre and post exercise intervention using the BOTMP –
Short Form. Normal weight children were superior in performance than their overweight
peers on the Bruininks-Oseretsky Test of Motor Proficiency as a whole (t152 = 7.78, p <
0.001, d = 2.08) and on 9 of the 14 items. Normal weight boys and girls differed on only
one item, Copying a Circle with Preferred Hand (t33.29 = 2.42, p = 0.021, d = 0.84), as
girls were superior in performance than boys. Overweight boys were superior to
overweight girls on Total Score (t96.93 = 3.51, p = 0.001, d = 0.67), and four items.
Overweight girls performed better than overweight boys on Tapping Feet Alternately
While Making Circles with Fingers (t100.74 = 2.37, p = 0.020, d = 0.46). No significant
differences occurred between the three exercise groups for Total Score or on any of the
14 items of the BOTMP – Short Form following the 14 week exercise intervention. In
conclusion, a large gap between non-overweight and overweight children on fundamental
motor skill performance exists with many gender differences between overweight
children. An exercise intervention, alone, does not appear to improve the fundamental
motor skill performance in overweight children. This study supports the need for the
instruction of fundamental motor skills to be a part of the physical education curriculum.
INDEX WORDS: FUNDAMENTAL MOTOR SKILLS, OVERWEIGHT, NORMAL WEIGHT, BRUININKS-OSERETSKY TEST OF MOTOR PROFICIENCY
FUNDAMENTAL MOTOR SKILL PROFICIENCY IN NORMAL WEIGHT
AND OVERWEIGHT CHILDREN
by
JAMES ALLAN ZAGRODNIK
B.S., University of Georgia, 2002
B.S., Augusta State University. 2005
A Thesis Submitted to the Graduate Faulty of The University Georgia in Partial
Fulfillment of the Requirements for the Degree
MASTER OF ARTS
ATHENS, GEORGIA
2007

© 2007
James Allan Zagrodnik
All Rights Reserved
FUNDAMENTAL MOTOR SKILL PROFICIENCY IN NORMAL WEIGHT
AND OVERWEIGHT CHILDREN
by
JAMES ALLAN ZAGRODNIK
Major Professor: Phillip D. Tomporowski
Committee: Michael Horvat Bryan McCullick Electronic Version NOT Approved: Maureen Grasso Dean of the Graduate School The University of Georgia May 2007
iv
ACKNOWLEDGEMENTS
I would like to acknowledge the members of my committee: Dr. Michael Horvat,
Dr. Bryan McCullick, and Dr. Katherine Davis for all their advice, input, and guidance. I
would like to acknowledge my major advisor, Dr. Phillip Tomporowski, for opening
doors and encouraging me to walk through them. I would also like to Charlotte Chatto
and Janet B. Tankersley of the Medical College of Georgia School of Allied Health, who
helped Dr. Davis select the BOTMP measure back in 2004. Also, Dr. William Strong
who was a founder of the Georgia Prevention Institute, where part of the study occurred.
I would also like to thank the Clarke-County School System for allowing this research to
occur in the school setting. In addition, I would like to thank Joe Tkcaz and Eric Guyotte
for their assistance in data collection; and Mat Gregoski for data analysis advice. Finally,
I would like to thank my wife for her support and encouragement during this process.
v
TABLE OF CONTENTS
Page ACKNOWLEDGEMENTS………………………………………………………………iv LIST OF TABLES…………………………………………………………………….....vii LIST OF FIGURES…………………………………………………………………......viii CHAPTER I INTRODUCTION……………………………………………………………..1 Specific Aims……………………………………………………………..4 Hypotheses………………………………………………………………..4 Significance…………………………………………………………….....4 II REVIEW OF THE RELATED LITERATURE…………………………...…..6 Fundamental Motor Skill Development…………………………………..6
Physical Activity and Fundamental Motor Skill Performance in Non-Overweight Children………………………………………………….....10
Fundamental Motor Skill Performance in Overweight Children………..12
Relation among Physical Activity/Fitness, Fundamental Motor Skills, and Body Fat…………………………………………………………………15 Balance and Movement Characteristics in Overweight Children……….19 Balance and Movement Characteristics of Obese Individuals Following and Exercise Intervention………………………………………………..21 Summary…………………………………………………………………23
III METHODS…………………………………………………………………...25
vi
Participants………………………………………………………………25
Research Design…………………………………………………………26 Protocol and Procedures………………………………………………....26 Statistical Analysis……………………………………………………....28 IV RESULTS…………………………………………………………………....30
Hypothesis I: Overweight Children, Compared to Normal Weight
Children, will be Less Proficient in Fundamental Motor Skills…….…...30
Hypothesis II: Boys will be More Proficient in Gross Motor Skills and
Less Proficient in Fine Motor Skills than Girls Regardless of
Weight……………………………………………………………………32
Hypothesis III: Exercise Training of Overweight Children will Improve
Fundamental Movement Skills………………………………………......33
V CONCLUSION AND DISCUSSION..……………………………………….35
LITERATURE CITED…………………………………………………………....53
vii
LIST OF TABLES
Page
Table 1: Control Group Overweight and Normal Weight Participant Characteristics and Demographics...…………………………………………………………..40 Table 2: Point Scores of Normal Weight and Control Group Overweight Children on the
BOTMP– Short Form…………………………………………………………41 Table 3: All Overweight and Normal Weight Participant Characteristics and Demographics…………………………………………………………………42 Table 4: Point Scores of Normal Weight and Overweight Children on the BOTMP – Short Form....……………………………………………………...43 Table 5: Relationship between BMI and Point Scores of the BOTMP – Short Form………………………………………………….…...……………45 Table 6: Inter-rater Reliability of Total Score and Item scores of the BOTMP – Short Form………………………………………………..……….46 Table 7: Point Score Means and Standard Deviations for Significant Gender Differences……………………………………………………………………48 Table 8: Overweight Participant Characteristics and Demographics………………….49 Table 9: Results of a 14 Week Exercise Intervention on Fundamental Motor Skill Proficiency……………………………………………………………………51
viii
LIST OF FIGURES
Page
Figure 1: Item Point Scores of Normal Weight and Overweight Children on the
BOTMP……………...………………………………………………………44 Figure 2: Relationship between BMI and Total Score on the BOTMP – Short
Form………………………………………………………..……………….47 Figure 3: Total Point Scores on the BOTMP – Short Form Following an Exercise
Intervention………………………………………………………………...50
1
CHAPTER I
INTRODUCION
A fundamental movement pattern is an observable performance of basic
locomotor, manipulative, or stability movements that involves combining movement
patterns of two or more body segments and the integration of developmentally
appropriate arm, trunk, and leg actions (Gallahue & Ozmun, 2002). Fundamental
movements occur when solid foundations in reflexive and rudimentary movements have
been established and allow the child to further explore and manipulate his or her
environment. Fundamental motor skills typically learned include running, jumping,
hopping, galloping and skipping, throwing, catching, and kicking (Horvat, et al., 2003).
Development of fundamental motor skills are essential for interacting and responding to
environmental challenges in both recreational and non-recreational activities and are
considered basic to the motor development of children (Gallahue & Ozmun, 2002).
Fundamental motor skill development is predicated on the growth and
enhancement of a child’s postural control. Postural control is defined as the ability to
control the body’s position in space to accomplish both stability and body orientation.
(Shumway-Cook & Woollacott, 2001, p. 164) Postural control emerges from the
interactions among the individual, the environmental constraints, and the task at hand.
The necessary processes needed for adequate postural control include sensory processes,
motor processes, and high-level integration processes. Postural control is essential for
appropriate growth and development of an individual as it enables an individual to
develop and refine skills throughout life. A component of postural control, and often
synonymous to postural control, is postural stability, or balance. Balance is the ability of
2
an individual to maintain his or her projected center of mass within the limits of a base of
support (Shumway-Cook & Woollacott, 2001, p. 165). The sensory processes necessary
for balance involve visual, somatosensory, and vestibular inputs while the motor
processes of balance include muscle and postural tone and muscle synergies.
Establishing proper postural control and balance aids in the development of motor skills
by providing a sound base for movement.
Developing a solid foundation in fundamental motor skills may foster the
participation in physical activity which is an integral part in obesity prevention (Goran,
Reynolds, & Lindquist, 1999). The rate of obesity in America has grown at an alarming
rate. In 1991, the Centers for Disease Control and Prevention reported only four states
with an obesity prevalence between 15 -19 percent, while no state reported more than a
20 percent prevalence. In 2004 an alarming number of states (33) reported obesity
prevalence at 20 -24 percent and nine other states had more than a prevalence of 25
percent. In addition, over 17% of children were considered overweight. (CDC, 2005)
Potential consequences of obesity include a decrease in physical activity, and an increase
in Type II diabetes, psychological problems, cardiovascular disease, and earlier death
(Reilly, et al., 2006).
Many studies have examined the link between obesity and fundamental motor
skills. These studies have shown an association between obesity and decreased
performances in fundamental motor skill proficiency of children. (Jaffe & Kosakov,
1982; Du Toit & Pienaar, 2003; McKenzie et al., 2002; Biskanaki et al., 2004; Reeves,
Broeder, Kennendy-Honeycutt & East, 1999; Graf, Koch, Kretshman-Kandel, et al.,
3
2004; Okely, Anthony, Booth, & Chey, 2004) However, many of these studies focused
on product based observations of a select few gross fundamental motor skills.
Additionally, few studies have examined the effects of obesity on balance,
especially in child populations. Obese individuals require more effort and modifications
of the mechanisms necessary for postural control (Corbeil, Simoneau, Rancourt,
Tremblay, & Teasdale, 2001), have difficulty in sit-to-stand movements (Galli, et al.,
2000), and demonstrate a different walking pattern than non-obese individuals (Hills &
Parker, 1991; McGraw, McClenaghan, Williams, Dickerson, & Ward, 2000). Finally,
studies have shown that weight reduction of obese individuals improved postural control
(i.e. improved stability) in static stance in middle-aged males (Paquette, Teasdale,
Prud’homme, & Tremblay, 2000) and in the gait of teenagers (Colne, et al., 2004).
Collectively, these studies suggest that impairment in the development and proficiency of
fundamental motor skills and balance may lead to difficulty in future skill performance.
Only one study has examined the impact of an exercise intervention program
intended to increase energy expenditure and improve fundamental motor skills in
children (Graf, Koch, Falkowski, et. al., 2005). The exercise intervention was only a 5
minute period prior to the beginning of classes. Consequently, no effect of the exercise
intervention on fundamental motor skills was found.
There is a need for a study to determine: 1) the fundamental motor skill
proficiency of overweight and normal weight children using a test battery which has been
developed and used extensively to test fundamental motor skill proficiency; and 2) to
assess the impact that an intervention program designed to decrease fat mass through
4
extended periods of physical activity at a moderate-to-vigorous intensity, has on
fundamental motor skills in overweight children.
Specific Aims
The specific aims of this study are to: 1) compare the fundamental motor skill
proficiency of overweight and normal weight children; and 2) to determine the effect of
an intervention program, designed to decrease fat mass of overweight children, on
fundamental motor skill performance.
Hypotheses
The research hypotheses for the study are:
1. Overweight children, compared to normal weight children, will be less
proficient in fundamental motor skill proficiency
2. Boys will be more proficient in gross motor skills and less proficient in fine
motor skills than girls regardless of weight.
3. Exercise training of overweight children will improve fundamental motor
proficiency.
Significance
Identifying the associations among fundamental motor skills, obesity, and
physical activity has implications for developing interventions to address childhood
obesity. Although a negative correlation between several fundamental motor skills and
obesity has been established, the impact of an exercise intervention in overweight
children on the performance of fundamental motor skills is unknown. Overweight
5
children who participate in physical activity may improve their fundamental motor skills,
and in turn may be more willing to participate in more physical activity. The increase in
physical activity may lead to reduced accretion of fat or even a decrease in fat mass and
an increase in muscle mass. Physical education teachers and parents may become aware
of the need to stress the importance of proper fundamental motor skill execution at an
early age to foster the competence and willingness of children to engage in complex
physical activities. School boards concerned about the significance of recess may
become aware of the importance of physical activity providing a means for practicing and
refining fundamental motor skills. Knowledge of the relationships between fundamental
motor skills, obesity, and exercise is particularly important because fundamental motor
skills are the framework for confident movements in physical activity and daily
movements. Proper execution of fundamental motor skills may lead to increased
physical activity, and increased physical activity may lead to a prevention of obesity in
normal weight children, and/or a decrease in fat mass in overweight children, thus
optimizing children’s health.
6
CHAPTER II
REVIEW OF THE RELATED LITERATURE
Fundamental Motor Skill Development
Motor development can be organized into four layers of movement: random and
reflexive; rudimentary; fundamental; and functional (Horvat, Eichstaedt, Kalakian, &
Croce, 2003). Fundamental movements occur when solid foundations in reflexive and
rudimentary movements have been established and allow the child to further explore and
manipulate their environment. A fundamental movement pattern is an observable
performance of basic locomotor, manipulative, or stability movements that involves
combining movement patterns of two or more body segments and the integration of
developmentally appropriate arm, trunk, and leg actions (Gallahue & Ozmun, 2002, p.
471). Three categories of fundamental motor skills are recognized: 1) locomotor skills
such as walking, running, jumping, and hopping; 2)non-manipulating skills such as
turning and balancing; and 3) manipulative skills such as kicking, throwing, catching,
striking, bouncing, pulling and pushing (Jürimäe & Jürimäe, 2000, p. 118). Development
of these fundamental motor skills are essential for interacting and responding to
environmental stimuli in both recreational and non-recreational activities and are
considered basic to the motor development of children (Gallahue & Ozmun, 2002, p.
181).
Fundamental motor skill development is predicated on the development and
enhancement of a child’s postural control. Postural control is the ability to control the
body’s position in space to accomplish stability and orientation (Shumway-Cook &
Woollacott, 2001, p. 164). Postural control emerges from the interactions among the
7
individual, the environmental constraints, and the task at hand. The necessary processes
needed for adequate postural control include sensory processes, motor processes, and
high-level integration processes. Postural control is essential for appropriate growth and
development of an individual as it enables him or her to develop and refine skills
throughout life. A component of postural control, and often synonymous to postural
control, is postural stability, or balance. Balance has been defined as the ability to
maintain the projected center of mass of an individual within the limits of a base of
support (Shumway-Cook & Woollacott, 2001, p. 165). The sensory processes necessary
for balance involve visual, somatosensory, and vestibular inputs while the motor
processes of balance include muscle and postural tone and muscle synergies.
Establishing proper static and dynamic postural control and balance aids in the
development of motor skills by providing a sound base for movement.
Jürimäe & Jürimäe (2000) identified and summarized several gender differences
in fundamental motor skill acquisition. Boys perform in a superior fashion to girls in
manipulative skills such as throwing, kicking, and catching. Girls perform better than
boys on non-manipulative skills, such as balancing, hopping, and skipping. Girls often
perform better at fine motor tasks while boys typically outperform girls in gross motor
skills. Seefeldt and Haubenstricker (1982) identified the order and ages at which 60% of
children were able to perform a series of fundamental movement skills. Boys first
achieved running (4 years old) followed by throwing (5 years old), skipping (6.5 years
old), catching (7 years old), kicking (7 years old), striking (7 years old), hopping (7.5
years old), and jumping (9.5 years old). Girls first achieved running at age 5 then
skipping (6 years old), catching (6.5 years old), hopping (7 years old), kicking (8.5 years
8
old), striking (8.5 years old) , throwing (8.5 years old), and jumping (10 years old). In
general, girls lag boys in motor skill development by about one year (Jürimäe & Jürimäe,
2000).
A meta-analysis on the gender differences of motor skill performance found that
the differences in the fundamental motor skills performances of running, jumping,
throwing, and catching were low to moderate prior to puberty, however after puberty the
differences became large and in favor of males (Thomas & French, 1985). Boys typically
demonstrate a higher quality of overall motor skill performance and are more proficient
in manipulative and gross motor skills then girls with improved performance being
maintained in childhood and increasing in adolescence.
While many clear trends between boys and girls have been established,
summarizing the research on fundamental motor skills is complicated by three factors.
First, studies often focus on either process (the necessary movements taken to perform a
skill, such as standing sideways to the target, bringing the ball by the ear, stepping with
the opposite foot, shifting of weight and rotation of the trunk, and follow through to
describe an overhand throw) or product (the end result of a movement, such as measuring
the distance the ball was thrown) observations rather than combining the two
measurements to estimate a true level of fundamental motor skill development.
Typically, boys perform better on tests of product measurement while girls perform better
on tests focusing on process development. Second, two approaches to describe
movement patterns have emerged as the way to measure fundamental motor skill
development. The total body configuration is based on the assumption that fundamental
motor skills develop as the whole body becomes cohesive enough to perform a particular
9
skill. Researchers who favor the total body configuration approach to fundamental motor
skill development often focus on product performance measurements. (For example, the
over-hand throw will progress in performance as the body matures and grows to allow for
proper stepping, hip and trunk rotation, follow through, etc.) The body component
approach prescribes that fundamental motor skills develop via intra-task components in
which different parts of the body develop at different rates to perform a skill.
Researchers who support the body component approach favor process performance
observations. (For example, the over-hand throw develops as the child learns each part of
the throw, such as stride length and proper hip rotation, separately as his/her body
grows.) Third, many researchers focus on only one skill (often throwing), or a
combination of skills to determine the fundamental motor skill level of children. Few
researchers have utilized measurement batteries, such as the Bruininks-Oseretsky Test of
Motor Proficiency or the Movement Assessment Battery, which have been developed to
identify the fundamental motor skill proficiency of multiple skills in children. The
inconsistent use of the batteries allows researchers to pick skills which may favor one
gender over another or develop their own assessment rubrics which may yield different
results from batteries which have been shown to be reliable and valid. Thus, researchers
are neglecting the suggestions of Campbell and Stanley made over 40 years ago to avoid
an interaction of selection bias and the independent variable. Therefore, the
generalizability of the existing research to other fundamental motor skills and the overall
fundamental motor skill proficiency of children is limited.
In summation, fundamental motor skills provide the basis for more complex
movements and the expression of these complex movements are influenced by the
10
development of the postural control system. Boys typically outperform girls on gross and
manipulative fundamental motor skills and demonstrate proficiency of most fundamental
motor skills at an earlier age. Girls are typically more proficient at fine motor and non-
manipulative fundamental motor skills. Research in fundamental motor skills has been
plagued by the inconsistent use of both process and product measurements and the
multiple approaches to identify fundamental motor skills. In addition, the lack of well-
established batteries in the literature hinders the generalizability of most findings.
Physical Activity and Fundamental Motor Skill Performance in Non-overweight
Children
One of the first studies to examine the relation between physical activity and
fundamental motor skill performance in a non-overweight population was published by
Ulrich in 1987. A total of 250 children in kindergarten through 4th grade (25 boys and 25
girls from each grade) were examined while performing a battery of motor skills. The
battery consisted of nine items: 1) broad jump; 2) flexed arm hang; 3) sit-up test; 4) side-
step test; 5) sixty-yard shuttle run; 6) playground ball dribble; 7) soccer ball dribble; 8)
softball repeated throw; and 9) soccer ball throw. The battery was also broken into two
categories; items 1- 5 were considered motor ability items, and items 6 – 9 were
considered sport specific-skill items. Each child completed a questionnaire concerning
his or her participation in organized sport programs. Of the 250 children, 128 were
classified as sport participants (K: 8 boys, 6 girls; Grade 1: 18 boys, 6 girls; Grade 2: 14
boys, 12 girls; Grade 3: 16 boys, 9 girls; Grade 4: 20 boys 13 girls) and 122 were
classified as non-participants. Upon completion of the motor test, results indicated that
children who participated in organized sport programs performed better then non-
11
participating children on each motor skill item, with the largest differences occurring
among the sport specific skill items. Identifying if motor skill competence and
proficiency was established prior to sport participation or after sport participation was not
able to be determined from this study.
Okely, Booth, and Patterson (2001) found similar results while investigating the
relationship between fundamental motor skills and physical activity in adolescents.
Adolescents from the 8th and 10th grades (N =1844, 8th grade: males = 517, females =
465, 10th grade: males = 470, females = 392) were examined on six fundamental motor
skills: 1) run; 2) vertical jump; 3) catch; 4) overhand throw; 5) forehand strike; and 6)
kick. Each skill was examined and scored based on the number of components of the
skill performed correctly (process-based examinations). Each participant completed a
self-report of physical activity which was broken into two parts, participation in
organized and non-organized physical activity. Performances of fundamental motor
skills was significantly related to participation in organized sport and accounted for 3%
of the total variation. In addition, adolescents who spent a large amount of time in
organized physical activity performed significantly better then those who spent a large
portion of time in non-organized physical activity.
Fisher et al. (2004) objectively measured the relation between physical activity
and fundamental motor skills in children. Three-hundred ninety-four children (age range
3.6 – 5.0 years) performed 15 tasks of the Movement Assessment Battery: vertical
jumping, standing jump, standing on 1 foot for 1 second, standing on 1 foot for 6
seconds, 4 types of skipping, kicking catching and throwing a ball. BMI was calculated
for each child, with a mean of 16.37. Physical activity was measured by having each
12
child wear an accelerometer on his or her right hip for 6 days. Results indicated a
statistically significant positive, but weak (r = .10), correlation between total fundamental
motor score and concurrent physical activity, regardless of the intensity. Further
inspection revealed that total fundamental motor score was not significantly correlated
with light-intensity activity but was significant and positively correlated with moderate
and vigorous activity (r = .18). The evidence, from this study, indicates that participating
in physical activity only minimally contributes to fundamental motor skill performance.
A positive, but weak, relationship between physical activity and fundamental
motor skill performance has been found in each of the studies described above,
suggesting that the amount and type of physical activity contributed only a small portion
to fundamental motor skill development in non-overweight children. Despite this weak
relationship, it is important to note that the relationship becomes stronger as the type of
physical activity increases from light to moderate and vigorous as shown by Fisher et al.
(2004). These studies focused on similar gross fundamental motor skills (running,
jumping, throwing) so their agreement is not surprising. The relationship between
performance on fine fundamental motor skills and physical activity has not been
established.
Fundamental Motor Skill Performance in Overweight Children
Peatman and Higgons (1942) were the first to study the effects of being
overweight on the motor development of infants. The authors examined the age, weight,
and height at which 349 full-term infants performed independent sitting, standing, and
walking. There were no significant correlations between age and weight for the three
tasks, revealing that having a larger body mass does not influence the age at which an
13
infant can perform sitting, standing and walking. In conclusion, this early study indicates
the heavier infants performed the tasks of sitting, standing, and walking at similar ages as
normal weight infants.
More recent research does not support the findings of Peatman and Higgons;
however. Jaffe and Kosakov (1982) examined gross and fine motor functioning of 135
infants (79 normal body weight, 45 overweight and 11 obese). The authors did not
discuss their methods of testing gross and fine motor functioning; however, they report
that extra body weight increased the incidence of motor delay. Upon a one-year follow
up, 10 out of 14 overweight and obese infants who demonstrated delays in motor
development had become normal in weight and motor development. One infant
remained overweight but demonstrated normal motor development. Three infants who
remained overweight or obese remained motor delayed. It should be pointed out that the
majority of overweight or obese infants (39 out of 56) displayed normal motor
development at the original testing. Therefore, it appears excess body fat only delays the
motor development in a minority of overweight and obese babies, and many of the motor
delayed overweight and obese babies catch up to their peers within a year.
Du Toit and Pienaar (2003) explored the relationship between overweight or
obese 3 and 4 year olds and their fundamental motor skill proficiency. Three
fundamental motor skills, hopping, one-legged balance, and catching, were performed by
130 young children (19 overweight and obese, 111 normal weight). BMI and triceps and
subscapular skinfold measurements were taken for each child. There was no significant
relationship between weight and fundamental motor skills among 3 year olds. However,
there was statistical significance among the 4 year olds (10 overweight and obese: 56
14
non-overweight) in that overweight and obese 4 year olds performed worse on balancing
and catching skills which require good balancing and perceptual/spatial abilities in order
to perform successfully.
McKenzie et al. (2002) examined the fundamental motor skill performance of 207
four-, five- and six-year old children in relation to the sum of skinfold measurements
taken at the triceps and subscapular regions. The three fundamental motor skills
examined were catching a ball, balancing on one foot, and lateral jumping. A statistically
significant negative relationship was obtained between skin folds and jumping (r = -0. 23
for boys), balancing (r = -0. 29 for boys, -0.21 for girls), and total skill index (r = -0.22
for boys), indicating that greater adiposity is associated with lower fundamental motor
skill performance. (Negative non-significant relationships were obtained for boys
catching (r = -0.02), girls jumping (r = -0.05), and girls skill index (r = -0.04). A positive
non-significant relationship was obtained for girls and catching (r = 0.11).)
Obesity has also been shown to have a negative relationship with fundamental
motor skill proficiency in a sample of 8 year olds. Biskanaki et al. (2004) examined 411
8 year olds (195 boys and 216 girls) on four fundamental motor skills: 1) 30 meter run, 2)
20 meter shuttle run, 3) standing jump and reach, and 4) 1 kg medicine ball throw. Each
child was classified as obese (>20.1 for boys and > 21.7 for girls) or non-obese. Boys
demonstrated statistically significant increases in performance in each of the fundamental
motor skills when compared to girls across both weight groups. Obesity was negatively
related with the fundamental movement skills requiring movement through space (the 30
meter run and 20 meter shuttle run) and positively related for object control skills such as
throwing. There was no relationship found for the standing jump and reach.
15
Similar results have been observed by Okely, Booth and Chey (2004). Their
study focused on the relation between body composition and fundamental motor skills
among 4th, 6th, 8th, and 10th graders. Six fundamental motor skills were examined: 1) run,
2) vertical jump, 3) catch, 4) overhand throw, 5) forehand strike, and 6) kick. Body
composition was determined by both BMI and waist circumference measurements. A
strong negative relationship was observed between excess weight and fundamental motor
skill proficiency for the locomotor tasks (run and vertical jump) and a weak negative
relationship with the object control tasks (catch, overhand throw, forehand strike, and
kick).
In summary, the evidence concerning the fundamental motor skill performance of
overweight children is consistent; fundamental motor skill performance decreases as
adiposity increases. This trend occurs across an age span of 4 – 16 year olds (Du Toit
and Pienaar, 2003; McKenzie et al., 2002; Biskanaki et al., 2004; and Okely, Booth &
Chey, 2004). Children under the age of four may not be affected by excess body fat
(Jaffe & Kosakov, 1982 and Du Toit & Pienaar, 2003). However, there are some
fundamental motor skills performed by overweight children, mainly object manipulation
skills such as throwing, which are superior to non-overweight children. Yet, this increase
in performance was typically examined with product-based observations rather than
process-based observations. For example, hypothetically, overweight children may use
their weight to throw an object over a greater distance, but their throwing motion may be
different and less efficient than non-overweight children.
Relation among Physical Activity/Fitness, Fundamental Motor Skills, and Body Fat
16
Malina et al. (1994) examined the relationships between fat mass and fundamental
motor skills in 6, 700 girls between the ages 7 and 17. The sum of five skinfolds (triceps,
biceps, suprailiac, subscapular, and medial calf) was taken to estimate fatness. Each girl
also underwent a fitness battery comprised of 12 tests: 1) flamingo stand; 2) plate
tapping; 3) sit and reach; 4) vertical jump; 5) explosive strength; 6) arm pull; 7) bent arm
hang; 8) leg lifts; 9) sit-ups; 10) shuttle run; 11) pulse recovery after a one minute step
test; and 12) submaximal power output. Significant and negative correlations for nearly
all tests at each age group (r = -0.12 to -0.37) were found among weight correlated with
performance (four correlations between the flamingo stand and the sum of skinfolds were
negative but not significant). The only positive correlation is for 9 year olds on plate
tapping, however it is not significant. The leanest girls perform consistently and
significantly better than the fattest girls with the largest differences in body projection
(i.e. vertical jumps), rapid movement, and support off the ground body movements (i.e.
bent arm hang). In conclusion, excess fat has a negative influence on health and
performance related physical fitness of girls especially at the extremes of body weight.
Reeves, Broeder, Kennendy-Honeycutt and East (1999) compared the
performances of 5 and 6 year old children (n = 51) on a battery of fitness tests and on a
battery of motor skills. The fitness battery consisted of six tests: 1) the half mile
run/walk; 2) the Progressive Aerobic Cardiovascular Endurance Run (PACER); 3) curl-
ups; 4) trunk lift; 5) flexed arm hang; and 6) the back saver sit-and-reach. Body
composition was calculated by the sum of right–side triceps and calf skinfolds. Four
subsets of the Bruininks-Oseretsky Test of Motor Proficiency Short form were used to
examine fundamental motor skill performance: 1) running speed and agility; 2) balance;
17
3) bilateral coordination; and 4) strength. In this particular study, greater levels of body
fat were significantly and positively related to balance, bilateral coordination, and
strength, but negatively related to run time.
Graf, Koch, Kretshman-Kandel, et al. (2004) identified the relationship between
physical activity, fundamental motor skills, and BMI in a population of 5 – 8 year olds (n
= 668). Physical activity was identified by interviews of the parents and children.
Fundamental motor skill proficiency was determined by the Körperkoordinationstest für
Kinder (KTK), (Body Coordination Test for Children). The KTK measures four gross
motor skills: 1) balancing backwards; 2) one-legged obstacle jumping; 3) jumping from
side to side; and 4) sideways movements. Endurance was determined by performance of
the 6–minute run. BMI was calculated for each child. A weak negative relationship (r =
- 0.16) was found between BMI and gross motor skill performance and a negative
relationship (r = - 0.20) between BMI and endurance. Furthermore, the authors reported
that the obese children performed gross motor skills at a level which would classify them
as having a moderate motor disorder and overweight children performed at a level
slightly worse than normal weight children. The evidence suggests that a higher BMI
correlates with lower gross motor and endurance performance.
Based on the findings of Graf, Koch, Kretshman-Kandel, et al. (2004) an
intervention program was implemented by the same authors that investigated the effects
of an intervention on BMI and fundamental motor skills. This study is the only study
which has incorporated an intervention of any kind while examining fundamental motor
skill performance. Six-hundred fifty-one children (age range 5.7 – 9.0 years) participated
in a project whose aims were to increase total energy expenditure from physical activity,
18
to optimize physical education lessons and to enhance pupils’ health knowledge.
Children participated in at least five minutes of morning exercises aimed at increasing
total energy expenditure and to improve fundamental motor skills, the remainder of the
intervention was weekly health education lessons (classroom instruction) totaling 20 – 30
minutes per week. The intervention duration was 20 months. Similar to the previous
study, BMI was obtained and the children performed the six-minute run to test endurance
performance, however only one subset (lateral jumping) of the KTK was used to measure
motor skill performance. The overweight and obese children showed the poorest
improvement in motor ability across time and there were no significant differences
between the intervention group and the control group. Non-overweight children did
show an improvement in fundamental motor skill performance following the
intervention, however. Thus, no effect of this exercise intervention was detected for
overweight children but did improved non-overweight children’s’ fundamental motor
skill performance.
Raudsepp and Jürimäe (1997) examined the relation of physical activity, fat mass,
fundamental motor skill, and physical fitness in 255 7 to 10 year old girls. Physical
activity was measured with a seven-day physical activity recall. BMI, skinfolds (triceps,
biceps, subscapular, abdominal, and medial calf), girths (arm, chest, thigh, calf) and
widths (humerus and femur) were measured for each child. Fundamental motor skill
performance was determined by quantitative and qualitative assessments of the overhand
throw. In addition, each child completed the EUROFIT battery to determine fitness. The
EUROFIT is a 9 test item battery comprised of 9 skills: 1) standing long jump; 2) 10 X 5
meter shuttle run; 3) bent arm hang; 4) sit-and-reach; 5) plate tapping; 6) flamingo
19
balance; 7) handgrip strength; 8) sit-ups; and 9) 20 m endurance shuttle run. Many of
these items also test fundamental motor skills. Significant negative correlations (r = -
0.27 to -0.39) between fatness and the motor skill fitness items (shuttle run, standing long
jump, bent arm hang, and the 20 meter shuttle run) and a positive (non-significant)
correlation between fatness and throwing (r = .05 to .16) across 7, 9, and 10 year olds
support previous observations that an increase in fat mass relates to poor fundamental
motor skill performance except for throwing skills.
In conclusion, several cross sectional studies have shown that an increase in body
fat negatively correlates with fundamental motor skill performance. Only one study
attempted an intervention program (Graf, Koch, Falkowski, et al., 2005). The
intervention did not alter children’s fundamental motor skills. However, it should be
emphasized that the intervention was limited to only 5 minutes of additional physical
activity each morning for 20 months.
Balance and Movement Characteristics in Overweight Children
Studies examining the relation between obesity and postural control in children
are limited and with inconsistent results. Hills and Parker (1991a) were the first to
objectively examine the walking patterns of obese children. Ten obese and ten normal
weight children (age range 8.5 – 10.9 years) were filmed walking ten meters at a normal,
slow (10% slower than normal), and fast speed (30% faster than normal). Obese children
were significantly slower across all speeds in the cadence and relative velocity of
walking, had longer cycle durations (toe off, swing phase, heel strike), and spent more
time in double support (when both feet are in contact with the floor). In conclusion, the
walking gait of obese children is slower and more tentative than normal weight children.
20
McGraw, McClenaghan, Williams, Dickerson, and Ward (2000) found similar
results while examining the gait and stability of obese boys. Ten obese and ten non-
obese boys (8 to 10 years old) were examined while walking at a normal, slow (10%
slower than normal), and fast speed (30% faster than normal). Each child also was
examined while performing two standing (normal and heel-to-toe stance) positions while
having full vision, no vision, or conflicted vision. The obese boys spent statistically
significant longer periods in double support for all walking activities and in stance
activities. While in quiet stance, the obese boys demonstrated statistically significant
increases in: 1) maximum displacement in the medial–lateral direction while in normal
and heel-to-toe stance with no vision; 2) total energy of displacement in the medial–
lateral direction while in normal and heel-to-toe stance with no vision and in distorted
vision; 3) greater variability in the medial–lateral direction while in normal and heel-to-
toe stance with no vision and in distorted vision; 4) total energy of displacement in the
anterior-posterior direction while in heel-to-toe stance with normal and no vision; and 5)
greater variability in the anterior-posterior direction while in normal and heel-to-toe
stance with full vision and no vision. In conclusion, obese boys have a more difficult
time in dynamic and static stability, particularly in areas where the postural system is
challenged.
Bernard et al. (2003) examined the balance and postural performance of obese
adolescent females. Nine obese females (14 – 16 years old) were compared to 7 normal
weight females. Each individual stood on a force plate (a platform which can detect
ground reaction forces and sway movements) with eyes open and eyes closed, with and
without a foam cushion while recovering from perturbations. There were no statistically
21
significant differences between the obese and non-obese females in any of the conditions,
except the obese females demonstrated significantly longer delays returning to center of
pressure while standing on the foam cushion. In conclusion, obesity does not affect the
stability or postural control of female adolescents except the obese individual requires a
longer time to regain her center of pressure after a perturbation.
The limited evidence on the relation between obesity in children and balance
suggests obesity may negatively impact balance and gait characteristics in children.
However, these studies are limited in their generalizability with small sample sizes,
especially Bernard et al. (2003) who concedes the lack of a relationship found was likely
due to their small sample sizes. Nonetheless, the evidence suggests that excess body
weight hinders balance and alters the movement patterns for walking.
Balance and Movement Characteristics of Obese Individuals Following an Exercise
Intervention
Few studies, with mixed results, have investigated the effects of an intervention
program on the balance and movement characteristics of obese children. Hills and Parker
(1991b) examined the effects of an intervention program on the gait characteristics in
obese children. Twelve obese children were randomly assigned to two groups. Seven
obese children were provided a 16 week diet and exercise intervention aimed at reducing
body fat and improving motor skill levels. Control groups of five obese children and four
normal weight children were also examined. Each child was filmed while walking at a
normal, slow (10% slower than normal), and fast speed (30% faster than normal).
Significant improvements in each symmetry indicator and significant improvements in
body composition, as measured by the sum of four skinfold measurements, occurred for
22
the intervention group as compared to controls. In conclusion, the diet and exercise
intervention lowered fat mass, which contributed to the improvement in stability and a
symmetrical gait in obese children.
Colne et al. (2004) examined the gait initiation of obese teenagers who took part
in a seven month weight loss intervention. Gait initiation is the transition phase between
the steady state of an upright standing position to the dynamic state of a steady state
movement through space, such as walking. Obese individuals were not statistically
different in their velocities of walking after the weight loss intervention. However, a
statistically significant increase in anticipatory postural adjustments was observed
following the intervention program. Anticipatory postural adjustments are needed to
create the propulsion forces of gait and to control the equilibrium of posture. In
conclusion, the intervention, which decreased fat mass, did not improve gait initiation
and the lengthening of the anticipatory postural adjustments suggests the motor pattern
for walking had been maintained despite the loss of fat mass.
Pacquette, Teasdale, Prud’Homme & Tremblay (2000) observed a significant
decrease in the velocity of movement and sway path in six obese men who took part in a
12 week aerobic training-based weight-loss intervention program. The authors reported a
reduction in weight improved the balance performance of obese men.
The evidence that an exercise intervention program may improve the balance and
movement characteristics of obese children is limited but promising. Only one study has
examined the influence of an intervention on obese children and the performance of
balance and movement tasks (Hills & Parker, 1991b). Additional studies in adolescents
(Colne, et al., 2004) and adults (Pacquette, Teasdale, Prud’Homme & Tremblay, 2000)
23
have shown similar findings in improving balance and movement characteristics after an
exercise intervention.
Summary
Fundamental motor skills are observable movement performances of basic
locomotor, manipulative, or stability movements and form the basis for future skilled
movements. Before fundamental motor skills can mature, development of the postural
system must occur to provide the body with the stable support necessary for dynamic and
stable body movements. Boys typically develop gross and manipulative fundamental
motor skills earlier than girls and are more proficient in these motor skills through growth
and adulthood. However, girls tend to develop and are more proficient at non-
manipulative motor skills at an earlier age.
Many gaps exist in the current literature investigating fundamental motor skills
and obesity. A majority of studies lack the use of a full test battery developed to identify
fundamental motor proficiency. There are, however, a few studies which have taken
subtests of a developed battery, but the full battery has not been used. Many studies
examine one (often the overhand throw), or only a few fundamental motor skills which
favor one gender over another. In addition, few studies examine both process and
product measurements of fundamental motor skills. Non-overweight children who
participate in physical activity perform slightly better in fundamental motor skills than
non-overweight children who do not participate in physical activity, suggesting that the
type and amount of physical activity a child participates in contributes minimally to
fundamental motor skill performance. These studies focused on gross fundamental motor
skills; the relationship between obesity and fine motor skills has not been established. In
24
overweight children, fundamental motor skill performance is consistently lower than non-
overweight children across a wide age range, 4 – 16 years old. Participation in an
intervention study did not improve fundamental motor skills in overweight and obese
children (Graf, Koch, Kretshman-Kandel, et al., 2004); however the study contained a
very low period (5 minutes) of exercise. The only fundamental motor skill on which
obese children was superior to that of than non-overweight children was the overhand
throw. However, studies examining this relationship were primarily product based (i.e.
focused on the distance the ball was thrown) and not the process of the throw which may
differ between these groups. Overweight and obese children also demonstrate worse
balance and gait characteristics than non-overweight children, and intervention programs
have shown to be useful in reducing fat mass and improving balance and gait
characteristics in overweight and obese children and adults. Therefore, there is a need for
a study to determine the fundamental motor skill proficiency of non-overweight and
overweight children using a battery which has been developed and used extensively to
test fundamental motor skill proficiency, and to identify the impact an intervention
program, designed to decrease fat mass through extended periods of regular, vigorous
physical activity, has on fundamental motor skills in overweight children.
25
CHAPTER III
METHODS
Participants.
Two hundred forty children ages 7 – 11 were contacted through an elementary
school in the Athens-Clarke County area. A packet containing an introductory letter
stating the purpose of the study, parental consent forms, child assent forms, and a
demographic questionnaire were provided to each child. Eighty packets (33.33%) were
returned; three respondents desired not to participate in the study. Of the seventy-seven
remaining participants, forty-one (41) were eligible for the study based on body mass
index (BMI) inclusion criteria of being within the 15th and 75th percentile for their age.
Subject physical characteristics (mean ± standard deviation) were: age = 9.79±1.06 yr.,
mass = 34.93±5.57 kg, height = 142.97±8.30 cm, and BMI = 16.97±1.11. A $5 gift card
was presented to each child upon completion of the study and parents were provided an
information sheet describing their child’s fundamental motor skill performance.
In addition, 113 overweight children were recruited from elementary schools in
the Augusta-Richmond County area. The overweight children were randomly assigned to
three groups: a Control group; a 20 minute exercise group; and a 40 minute exercise
group (n = 43, n = 34, and n = 36 respectively). The participants were elementary school
children ages 7 – 11 with a Body Mass Index (BMI) above the 85th percentile. Subject
physical characteristics (mean ± standard deviation) were: age = 9.25±1.14 yr., mass =
51.87±15.27 kg, height = 140.36±9.66 cm, and BMI = 25.90±4.93. Each study was
approved by the University’s Institutional Review Board, the Clarke County School
26
District, and Medical College of Georgia Institutional Review Board. Written informed
consent was obtained from participating children and parents/guardians prior to testing.
Research Design
A two group comparison design was used to examine the hypothesis that non-
overweight and overweight children differ in their performance of fundamental motor
skills as measured by the Bruininks-Oseretsky Test of Motor Proficiency – Short Form.
The fundamental motor skill performances of a sample of 40 non-overweight children, as
classified by BMI, were compared to the performances of fundamental motor skills of the
Control group (n = 43) and all 113 overweight children.
A three group pretest-posttest design was used to examine the hypothesis that
exercise training of overweight children will improve fundamental movement skills.
One hundred thirteen (113) children were randomly assigned to three conditions: 1) 20
minute exercise intervention; 2) 40 minute exercise intervention; and 3) a control group
who attend a healthy lifestyle class once a month. The 113 overweight children are part
of a larger study (Policy Leadership for Active Youth (PLAY) Project) conducted at the
Georgia Prevention Institute at the Medical College of Georgia.
Protocol and Procedures
BMI Measurement. Height and weight were measured for each child and BMI
was calculated as kg/m2. Age adjusted BMI inclusion criteria were set between the 15th
and 75th percentile for non-overweight children and above the 85th percentile for
overweight children according to the recommendations of Rosner, Prineas, Loggie, and
27
Daniels, (1997) and Cole, Bellizzi, Flegal, and Dietz (2000). The use of BMI as a
measure of adiposity among children has been widely validated (see Pietrobelli, et al.,
1998).
Fundamental Motor Skill Measurement. Fundamental motor skills were
measured using the Bruininks-Oseretsky Test of Motor Proficiency – Short Form. The
Bruininks-Oseretsky Test of Motor Proficiency (BOTMP) is a test designed to measure
the fundamental motor skill functioning of children who are 4½ to 14½ years old. The
short form consists of 14 items among 8 subtests and takes approximately 20 minutes to
complete (Bruininks, 1978). The use of the short form in children 9 – 11 years old has
been shown to have acceptable test-retest reliabilities (r = 0.76 – 0.86) (Bruininks, 1978;
Hassan, 2001; and Moore, Reeve, & Boan, 1986), inter-rater reliability (r = 0.63 – 0.97)
(Bruininks, 1978), and validity (Bruininks, 1978 and Hassan, 2001). The Bruininks-
Oseretsky Test of Motor Proficiency – Short Form has been used in special populations
and has shown to be an accurate measure of identifying fundamental motor skill
proficiency. (Connolly & Michael, 1986; Miles, Nierengarten, & Nearing, 1988) Each
child was examined individually, in seclusion from other participants, and was provided
instruction on how to complete the test according to guidelines provided by Bruininks
(1978). The fundamental motor skills evaluation of the non-overweight sample occurred
during one examination for each child during the child’s regularly scheduled P.E. class.
While seclusion was attempted, 15 children were tested in the presence of others due to
rainy days. Overweight children were examined prior to, and following, the
interventions. The same individual scored the overweight children pre and post
intervention and was blinded to which exercise condition each child participated in.
28
Exercise Interventions. During the exercise interventions, overweight children
took part in aerobic games and activities designed to maintain a minimum heart rate of
150 beats per minute for 20 or 40 minutes per day. The exercise intervention included a
5 minute warm-up period of stretching and moderate activity followed by either 20
minutes or 40 minutes of moderate to vigorous activity, and finished with a cool down
phase of stretching and light activity. Heart rate monitors (S610i: Polar Electro, Oy,
Finland) with a 30 second epoch recording, were worn by each participant. Average
heart rates for each child were recorded following the exercise session. The activities
(i.e. tag games, modified soccer) were selected based on their safety, level of participant
interest and enjoyment. The selected activities were not intended to promote skill
development or competition. The exercise conditions took place Monday through Friday
for 14 weeks and each child was expected and encouraged by small prizes to attend at
least 4 days a week.
Statistical Analysis
Statistical analyses were performed using SPSS v. 11.0 for Windows (SPSS, Inc.,
Chicago, IL). Independent sample t-tests were performed to measure the mean
differences in fundamental motor skill performance between non-overweight and
overweight children, and between boys and girls, with α set at .05. Degrees of freedom
reported are predicated on the Levene’s test for equal variances. Pre-test scores for the
overweight children were compared to the scores of the normal weight children. Pearson
correlations were used to describe the relationship between BMI and performance of
fundamental motor skills, with α set at .05. Analysis of Covariance (ANCOVA) was
29
used to examine differences at posttest scores among children assigned to the three
experimental conditions (control, 20 min, 40 min). Type one error (α) was set at 0.05.
Means, standard deviations, and point scores are reported unless specified otherwise.
Cohen’s d is reported as an estimate of effect size. Inter-rater reliability between the rater
at the Medical College of Georgia and the researcher who scored the normal weight
children in Athens, GA on the BOTMP was determined by comparing the scores of 5
overweight children. Inter-rater reliability of the researcher in Athens, GA was also
measured by comparing the scores of 10 children to another rater who was trained in
administering the BOTMP-Short Form. The sample size for comparing the mean
differences in fundamental motor skill performance between non-overweight and
overweight children is sufficient to detect an effect size of d = 0.65 using a two-tailed t-
test for independent samples at α = 0.05 and statistical power of 0.80. The sample size
for comparing the mean differences in fundamental motor skill performances among
overweight participants is sufficient to detect an effect size of d = 0.25 using an
ANCOVA at α = 0.05 and statistical power of 0.80.
30
CHAPTER IV
RESULTS
Hypothesis I: Overweight children, compared to non-overweight children, will be
less proficient in fundamental motor skills.
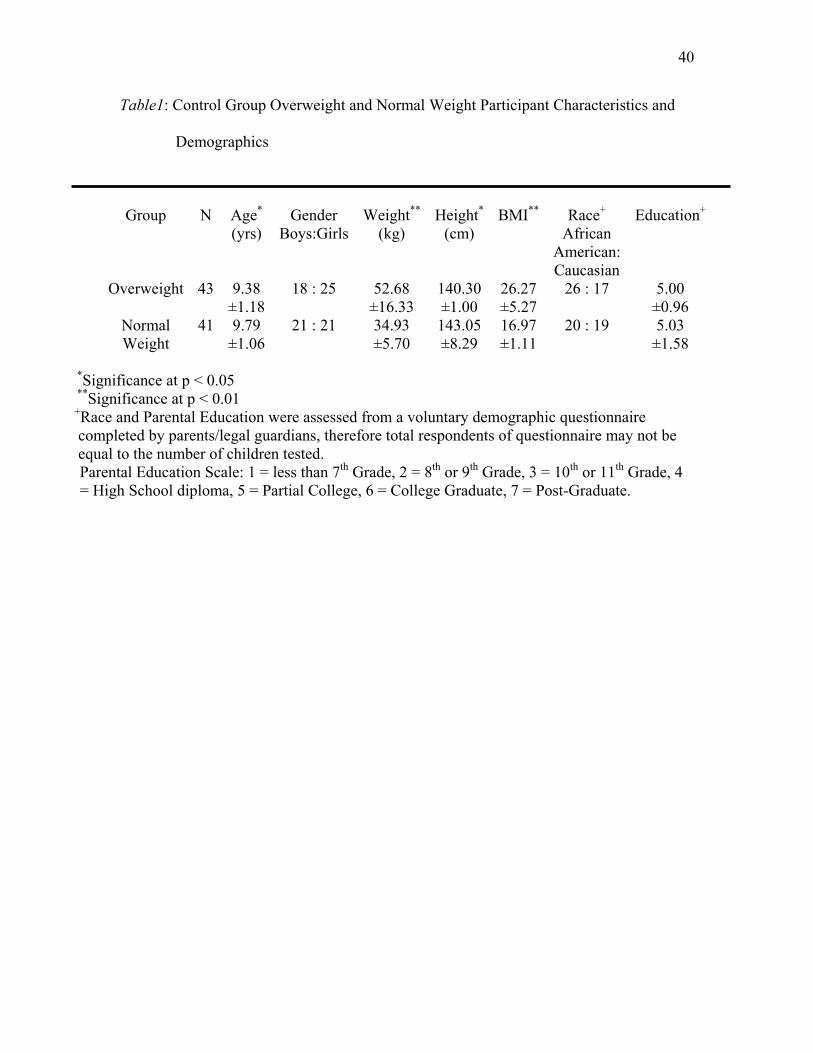
Descriptive information concerning the sex, age, height, weight, BMI, race, and
parental education of the Control group overweight (n = 43) and 41 normal weight
children are contained in Table 1. Weight, height, and BMI were all significantly
different between the two groups (t52.060 = 6.73, p < 0.001, t40 = 2.12, p = 0.040, and t45.901
= 11.305, p < 0.001 respectively). Overweight children were approximately 18 kg
heavier, 3 cm shorter, and were nearly 9 points higher on the BMI scale than their normal
weight peers. No significant differences occurred between the two groups on any of the
remaining variables.
The results comparing normal weight children to the Control Group (n = 43)
overweight children are presented for the Total Score and all 14 items of the BOTMP –
Short From in Table 2. Normal weight children were superior in performance than their
overweight peers on the Bruininks-Oseretsky Test of Motor Proficiency – Short Form as
a whole (t82 = 6.67, p < 0.001, d = 1.47) and specifically on 8 of the 14 items: Running
Speed and Agility (t82 = 4.04, p < 0.001, d = 0.89); Standing on Preferred Leg on Balance
Beam (t62.486 = 5.40, p < 0.001, d = 1.37); Tapping Feet Alternately While Making
Circles with Fingers (t78.099= 2.80, p = 0.007, d = 0.63); Jumping Up and Clapping Hands
(t82 = 6.73, p < 0.001, d = 1.49); Standing Broad Jump (t82 = 6.93, p < 0.001, d = 1.53);
Catching a Tossed Ball with Both Hands (t78.392 = 2.29, p = 0.025, d = 0.52); Response
31
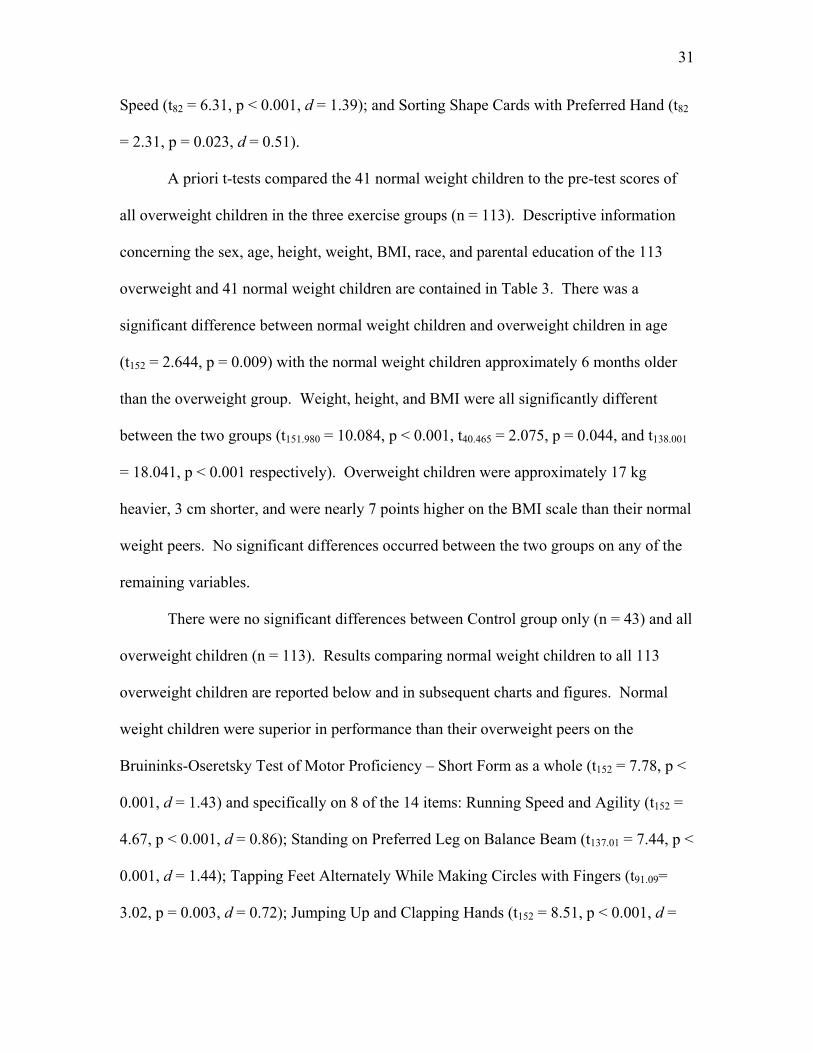
Speed (t82 = 6.31, p < 0.001, d = 1.39); and Sorting Shape Cards with Preferred Hand (t82
= 2.31, p = 0.023, d = 0.51).
A priori t-tests compared the 41 normal weight children to the pre-test scores of
all overweight children in the three exercise groups (n = 113). Descriptive information
concerning the sex, age, height, weight, BMI, race, and parental education of the 113
overweight and 41 normal weight children are contained in Table 3. There was a
significant difference between normal weight children and overweight children in age
(t152 = 2.644, p = 0.009) with the normal weight children approximately 6 months older
than the overweight group. Weight, height, and BMI were all significantly different
between the two groups (t151.980 = 10.084, p < 0.001, t40.465 = 2.075, p = 0.044, and t138.001
= 18.041, p < 0.001 respectively). Overweight children were approximately 17 kg
heavier, 3 cm shorter, and were nearly 7 points higher on the BMI scale than their normal
weight peers. No significant differences occurred between the two groups on any of the
remaining variables.
There were no significant differences between Control group only (n = 43) and all
overweight children (n = 113). Results comparing normal weight children to all 113
overweight children are reported below and in subsequent charts and figures. Normal
weight children were superior in performance than their overweight peers on the
Bruininks-Oseretsky Test of Motor Proficiency – Short Form as a whole (t152 = 7.78, p <
0.001, d = 1.43) and specifically on 8 of the 14 items: Running Speed and Agility (t152 =
4.67, p < 0.001, d = 0.86); Standing on Preferred Leg on Balance Beam (t137.01 = 7.44, p <
0.001, d = 1.44); Tapping Feet Alternately While Making Circles with Fingers (t91.09=
3.02, p = 0.003, d = 0.72); Jumping Up and Clapping Hands (t152 = 8.51, p < 0.001, d =
32
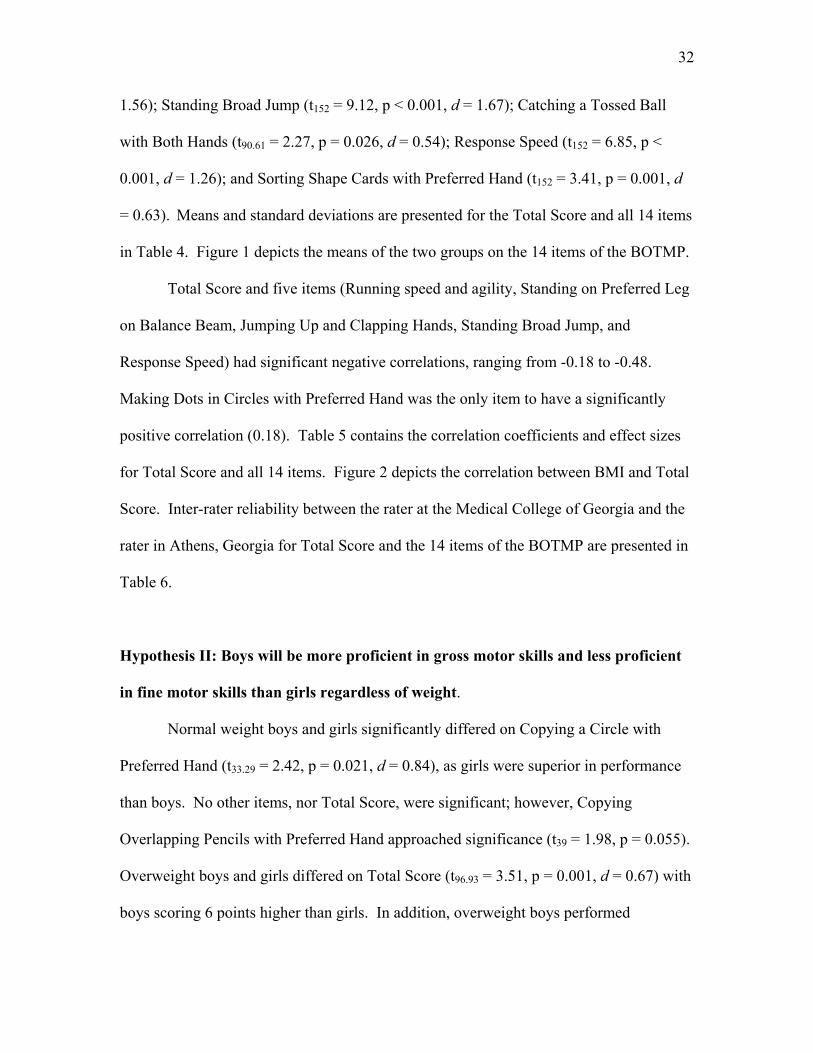
1.56); Standing Broad Jump (t152 = 9.12, p < 0.001, d = 1.67); Catching a Tossed Ball
with Both Hands (t90.61 = 2.27, p = 0.026, d = 0.54); Response Speed (t152 = 6.85, p <
0.001, d = 1.26); and Sorting Shape Cards with Preferred Hand (t152 = 3.41, p = 0.001, d
= 0.63). Means and standard deviations are presented for the Total Score and all 14 items
in Table 4. Figure 1 depicts the means of the two groups on the 14 items of the BOTMP.
Total Score and five items (Running speed and agility, Standing on Preferred Leg
on Balance Beam, Jumping Up and Clapping Hands, Standing Broad Jump, and
Response Speed) had significant negative correlations, ranging from -0.18 to -0.48.
Making Dots in Circles with Preferred Hand was the only item to have a significantly
positive correlation (0.18). Table 5 contains the correlation coefficients and effect sizes
for Total Score and all 14 items. Figure 2 depicts the correlation between BMI and Total
Score. Inter-rater reliability between the rater at the Medical College of Georgia and the
rater in Athens, Georgia for Total Score and the 14 items of the BOTMP are presented in
Table 6.
Hypothesis II: Boys will be more proficient in gross motor skills and less proficient
in fine motor skills than girls regardless of weight.
Normal weight boys and girls significantly differed on Copying a Circle with
Preferred Hand (t33.29 = 2.42, p = 0.021, d = 0.84), as girls were superior in performance
than boys. No other items, nor Total Score, were significant; however, Copying
Overlapping Pencils with Preferred Hand approached significance (t39 = 1.98, p = 0.055).
Overweight boys and girls differed on Total Score (t96.93 = 3.51, p = 0.001, d = 0.67) with
boys scoring 6 points higher than girls. In addition, overweight boys performed
33
significantly better on 4 individual items; Running Speed and Agility (t111 = 3.97, p <
0.001, d = 0.76); Jumping Up and Clapping Hands (t111 = 3.16, p = 0.002, d = 0.60);
Standing Broad Jump (t111 = 3.65, p < 0.001, d = 0.70); and Response Speed (t111 = 3.15,
p = 0.002, d = 0.60). Overweight girls significantly performed better on Tapping Feet
Alternately While Making Circles with Fingers (t100.74 = 2.37, p = 0.020, d = 0.48).
Means, standard deviations, and effect sizes for the statistically different scores are
presented in Table 7.
Hypothesis III: Exercise training of overweight children will improve fundamental
movement skills.
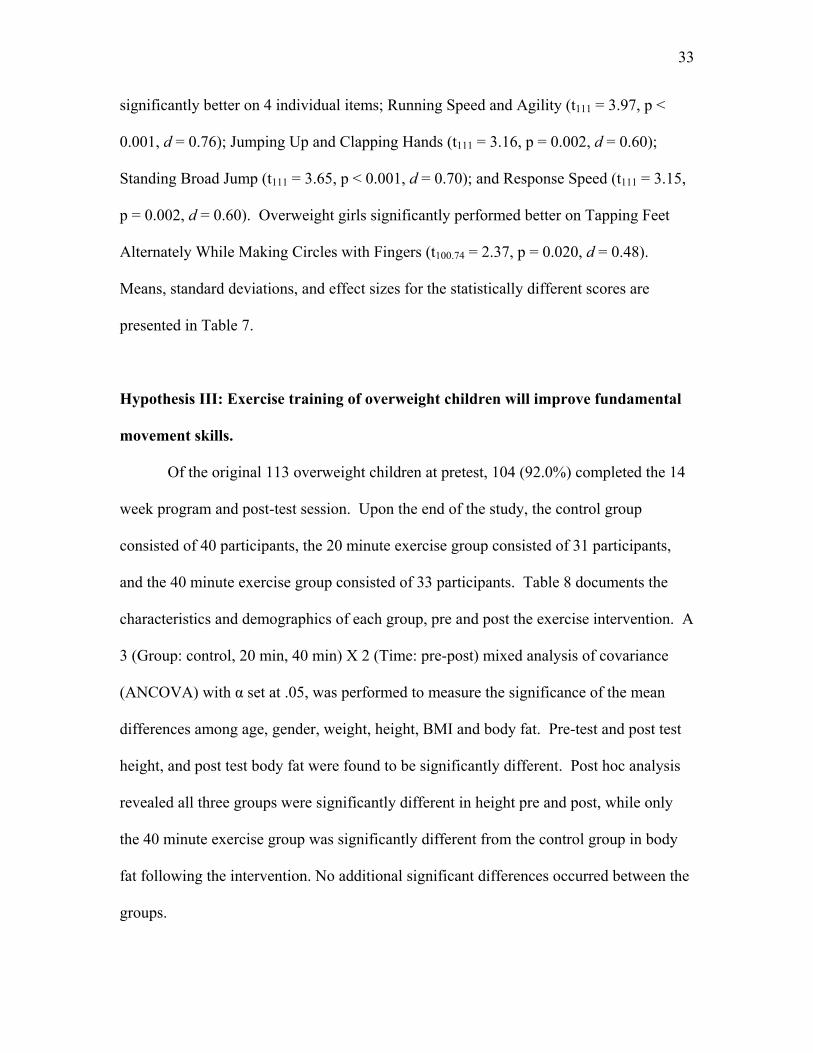
Of the original 113 overweight children at pretest, 104 (92.0%) completed the 14
week program and post-test session. Upon the end of the study, the control group
consisted of 40 participants, the 20 minute exercise group consisted of 31 participants,
and the 40 minute exercise group consisted of 33 participants. Table 8 documents the
characteristics and demographics of each group, pre and post the exercise intervention. A
3 (Group: control, 20 min, 40 min) X 2 (Time: pre-post) mixed analysis of covariance
(ANCOVA) with α set at .05, was performed to measure the significance of the mean
differences among age, gender, weight, height, BMI and body fat. Pre-test and post test
height, and post test body fat were found to be significantly different. Post hoc analysis
revealed all three groups were significantly different in height pre and post, while only
the 40 minute exercise group was significantly different from the control group in body
fat following the intervention. No additional significant differences occurred between the
groups.
34
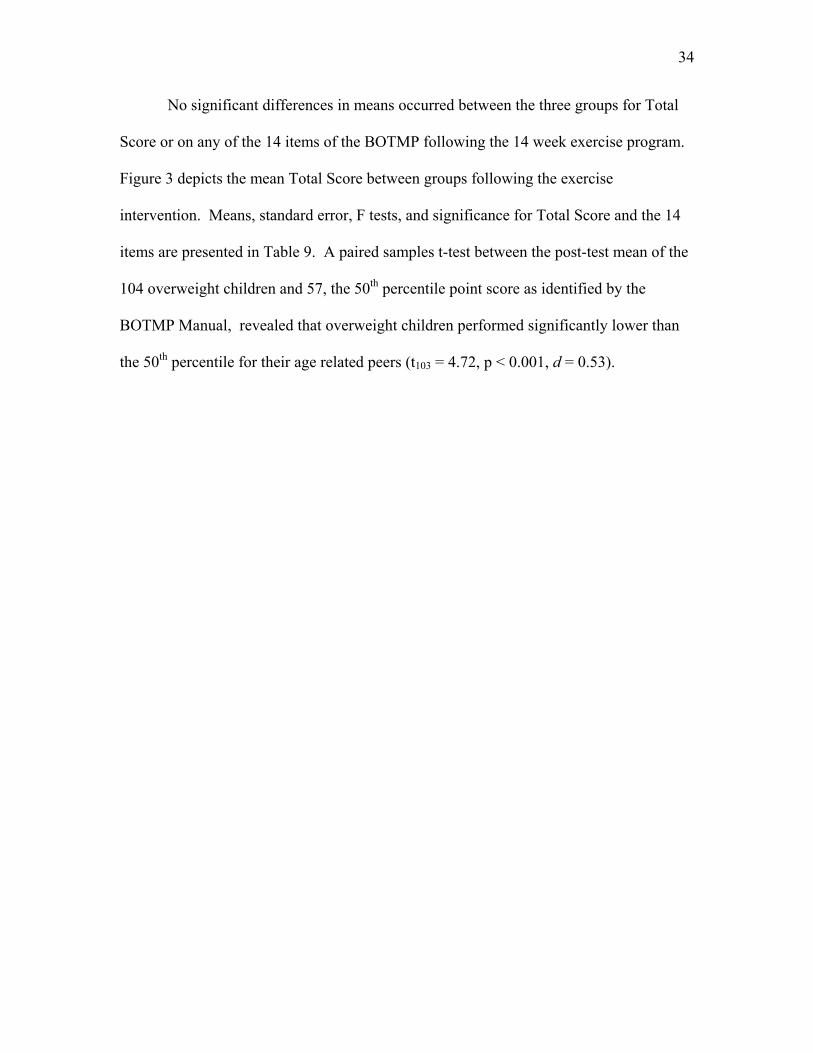
No significant differences in means occurred between the three groups for Total
Score or on any of the 14 items of the BOTMP following the 14 week exercise program.
Figure 3 depicts the mean Total Score between groups following the exercise
intervention. Means, standard error, F tests, and significance for Total Score and the 14
items are presented in Table 9. A paired samples t-test between the post-test mean of the
104 overweight children and 57, the 50th percentile point score as identified by the
BOTMP Manual, revealed that overweight children performed significantly lower than
the 50th percentile for their age related peers (t103 = 4.72, p < 0.001, d = 0.53).
35
CHAPTER V
CONCLUSION AND DISCUSION
Conclusion.
Results from this study indicate normal weight children run faster, have better
static balance (stork stance on a balance beam), better control over simultaneous feet and
hand movements, greater strength, can catch better, have quicker reaction, and can sort
more efficiently, which results in overall superior motor skill proficiency than their
overweight peers. In addition, moderate to strong negative relationships were found
between BMI and overall motor skill proficiency, running speed, static balance, jumping
and clapping, strength, response speed, and making dots inside circles. These results
support the hypothesis that overweight children are less proficient than normal weight
children in fundamental motor skills. However, the results also indicate children are
similar in performance in specific motor skills regardless of adiposity. These motor skills
include dynamic balance (walking on a balance beam), and many fine motor skills such
as drawing lines, replicating drawings (such as circles and pencils), and rapid hand-eye
coordinated movements. Therefore, this study points toward greater performance of
gross motor skills in normal weight children which results in an overall greater
performance in fundamental motor skills as identified by the short-form BOTMP.
Gender specific differences which have been summarized by Jürimäe and Jürimäe
(2000) and were the basis for the hypothesis that gender differences will remain similar
for boys and girls regardless of weight were not supported by this study. Normal weight
boys and girls only differed on one item of the short form BOTMP, Copying a Circle
with Preferred Hand. Established gender differences, such as boys demonstrating greater
36
performance on gross motor skills and girls performing better on fine motor skills were
not identified. While there was difference on Copying a Circle with Preferred Hand, this
is only one item of three (Drawing a Line Through a Straight Path with Preferred Hand,
and Copying Overlapping Pencils with Preferred Hand are the other two items) which on
the short form BOTMP describes the motor skill, visual-motor control. Hence, this study
did not observe any gender specific differences in motor skills in normal weight children.
Among overweight children, however, gender differences were observed.
Overweight boys have a higher performance overall on motor skills than overweight
girls. In addition, overweight boys performed superior on two gross motor skills; running
and standing broad jump. Overweight boys were also found to have faster response
speed, a fine motor skill. Overweight boys performed better on Jumping Up and
Clapping Hands while overweight girls performed better on Tapping Feet Alternately
While Making Circles with Fingers. Both of these items are used to determine the gross
motor skill of bilateral coordination. It appears that overweight children display gender
specific differences in motor skills while their normal weight peers do not when being
measured by the short form BOTMP.
Finally, the results did not support the hypothesis that an exercise intervention
would improve motor skill performance for overweight children in overall performance
or for any specific motor skill, even despite a significant loss of body fat for children in
the 40 minute exercise group. In addition, it was observed that the overweight children
were below the 50th percentile performance in fundamental motor skill proficiency for
their age-related peers.
Discussion.
37
The present findings are consistent with previous research examining the
relationship between excessive adiposity in children and fundamental motor skill
performance (Biskanaki et al., 2004; McKenzie et al., 2002; Okely, Booth and Chey,
2004). However, correlations between fundamental motor skills and BMI observed in
this study are higher than previously reported. For example, the Total Score on the short
form BOTMP had a correlation of -0.48 compared to -0.29 as found by Okely, Booth and
Chey (2004) on their standardized fundamental motor skill index for 4th graders. The
large disparity in correlations may be due to this being one of the few studies to use a test
battery designed to measure fundamental motor skill proficiency to examine the
differences in normal weight and overweight children.
The present study did not support the previously founded gender differences in
normal weight children. It did, however, upheld these differences in overweight children.
Future research should examine the relationship between gender, age, and fundamental
motor skills in overweight children.
Graf, Koch, and Falkowski (2005) were the first to attempt an exercise
intervention in overweight children and determine its impact on fundamental motor skill
performance. The authors observed overweight children did not improve in fundamental
motor skill proficiency following a 20 month intervention. The exercise intervention
consisted of five minutes of activities which included focused on improving coordination,
balance, relaxation, rhythm, creativity, back training, and group participation. One
interesting finding was the observation that normal weight children improved in
fundamental motor skill performance. Despite an exercise intervention of moderate-
vigorous activity, and for 20 or 40 minutes for 14 weeks, the current study failed to
38
observe improvements in fundamental motor skills in overweight children. While the
current study did not have an intervention program designed to improve fundamental
motor skills, as did the intervention program by Graf, Koch, and Falkowski (2005), the
duration of physical activity was considerably longer. It would be important for future
research to focus on intervention programs designed to improve fundamental motor skills
and decrease adiposity in overweight children.
The evidence obtained from the present study and Graf, Koch, and Falkowski
(2005) points to the need for structured physical education classes for overweight
children that emphasize fundamental motor skill development. There is a large gap in
performance of motor skills between normal weight and overweight children. Physical
education practitioners should design lessons that assist in the development of motor
skills in these children. Physical education teachers should also be aware that teaching
fundamental motor skills to overweight children is needed. In addition, P.E. practitioners
should be aware that a loss in body fat, independent of teaching fundamental motor skills,
will not necessarily mean an improvement in fundamental motor skill proficiency.
Establishing sound fundamental motor skills in children is essential for future motor skill
achievement and success (Gallahue & Ozmun, 2002). Overweight children lacking
sound fundamental motor skills may be less willing to participate in physical activity due
to such psychological determinants as, motivation, self-efficacy, and sense of control.
Goran, Reynolds, and Lindquist (1999) identify the importance of overcoming
psychological determinants as a critical milestone for overweight children to begin
participating in physical activity. Children, both normal weight and overweight, who
establish a solid foundation in fundamental motor skills may be more likely to participate
39
in regular physical activity, such as basketball and volleyball. In turn, overweight
children may establish behaviors which support the continuation of physical activity in
adulthood.
In conclusion, a large gap between normal weight and overweight children on
fundamental motor skill performance exists with many gender differences between
overweight children. An exercise intervention, alone, does not appear to improve the
fundamental motor skill performance in overweight children, even if a decrease in body
fat occurs. This study supports the need for fundamental motor skills to be part of the
physical education curriculum and developing a sound base of fundamental motor skill
proficiency may be an avenue toward continued physical activity and reaching the goals
of ‘Healthy People 2010’.
40
Table1: Control Group Overweight and Normal Weight Participant Characteristics and Demographics
Group N Age*
(yrs) Gender
Boys:Girls Weight**
(kg) Height*
(cm) BMI** Race+
African American: Caucasian
Education+
Overweight
43 9.38 ±1.18
18 : 25 52.68 ±16.33
140.30 ±1.00
26.27 ±5.27
26 : 17 5.00 ±0.96
Normal Weight
41 9.79 ±1.06
21 : 21 34.93 ±5.70
143.05 ±8.29
16.97 ±1.11
20 : 19 5.03 ±1.58
*Significance at p < 0.05 **Significance at p < 0.01
+Race and Parental Education were assessed from a voluntary demographic questionnaire completed by parents/legal guardians, therefore total respondents of questionnaire may not be equal to the number of children tested. Parental Education Scale: 1 = less than 7th Grade, 2 = 8th or 9th Grade, 3 = 10th or 11th Grade, 4 = High School diploma, 5 = Partial College, 6 = College Graduate, 7 = Post-Graduate.
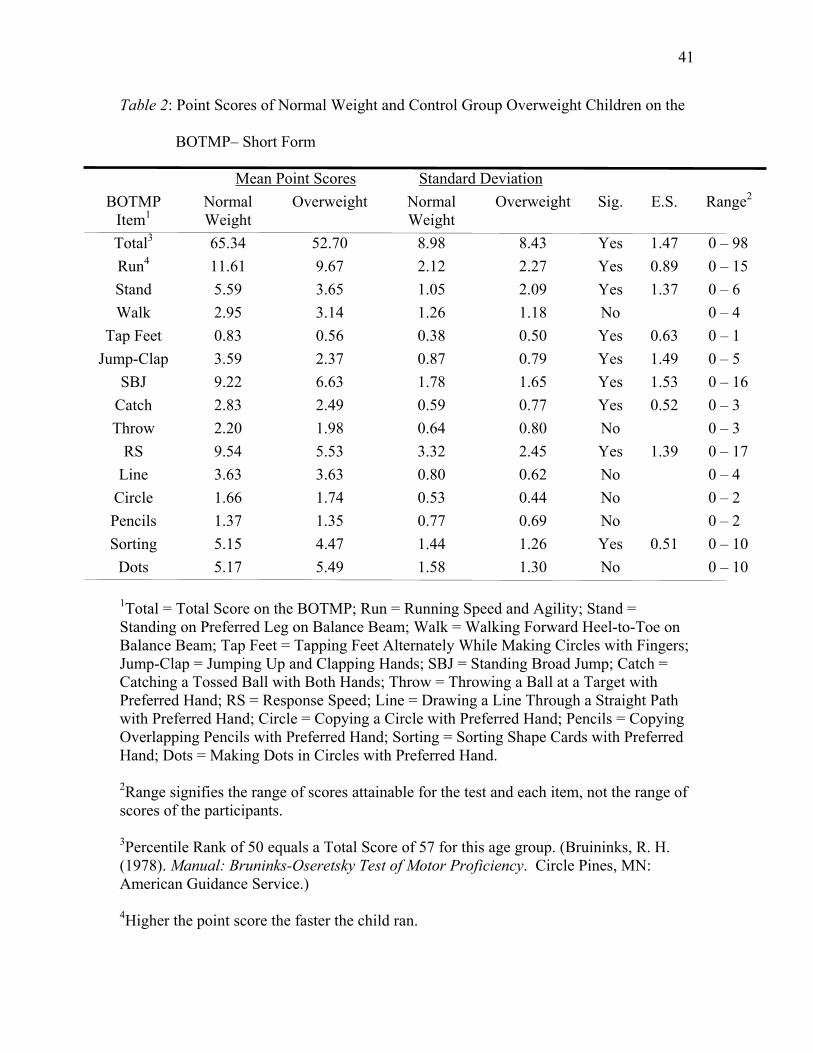
41
Table 2: Point Scores of Normal Weight and Control Group Overweight Children on the
BOTMP– Short Form Mean Point Scores Standard Deviation
BOTMP Item1
Normal Weight
Overweight Normal Weight
Overweight Sig. E.S. Range2
Total3 65.34 52.70 8.98 8.43 Yes 1.47 0 – 98
Run4 11.61 9.67 2.12 2.27 Yes 0.89 0 – 15
Stand 5.59 3.65 1.05 2.09 Yes 1.37 0 – 6
Walk 2.95 3.14 1.26 1.18 No 0 – 4
Tap Feet 0.83 0.56 0.38 0.50 Yes 0.63 0 – 1
Jump-Clap 3.59 2.37 0.87 0.79 Yes 1.49 0 – 5
SBJ 9.22 6.63 1.78 1.65 Yes 1.53 0 – 16
Catch 2.83 2.49 0.59 0.77 Yes 0.52 0 – 3
Throw 2.20 1.98 0.64 0.80 No 0 – 3
RS 9.54 5.53 3.32 2.45 Yes 1.39 0 – 17
Line 3.63 3.63 0.80 0.62 No 0 – 4
Circle 1.66 1.74 0.53 0.44 No 0 – 2
Pencils 1.37 1.35 0.77 0.69 No 0 – 2
Sorting 5.15 4.47 1.44 1.26 Yes 0.51 0 – 10
Dots 5.17 5.49 1.58 1.30 No 0 – 10
1Total = Total Score on the BOTMP; Run = Running Speed and Agility; Stand = Standing on Preferred Leg on Balance Beam; Walk = Walking Forward Heel-to-Toe on Balance Beam; Tap Feet = Tapping Feet Alternately While Making Circles with Fingers; Jump-Clap = Jumping Up and Clapping Hands; SBJ = Standing Broad Jump; Catch = Catching a Tossed Ball with Both Hands; Throw = Throwing a Ball at a Target with Preferred Hand; RS = Response Speed; Line = Drawing a Line Through a Straight Path with Preferred Hand; Circle = Copying a Circle with Preferred Hand; Pencils = Copying Overlapping Pencils with Preferred Hand; Sorting = Sorting Shape Cards with Preferred Hand; Dots = Making Dots in Circles with Preferred Hand.
2Range signifies the range of scores attainable for the test and each item, not the range of scores of the participants. 3Percentile Rank of 50 equals a Total Score of 57 for this age group. (Bruininks, R. H. (1978). Manual: Bruninks-Oseretsky Test of Motor Proficiency. Circle Pines, MN: American Guidance Service.) 4Higher the point score the faster the child ran.
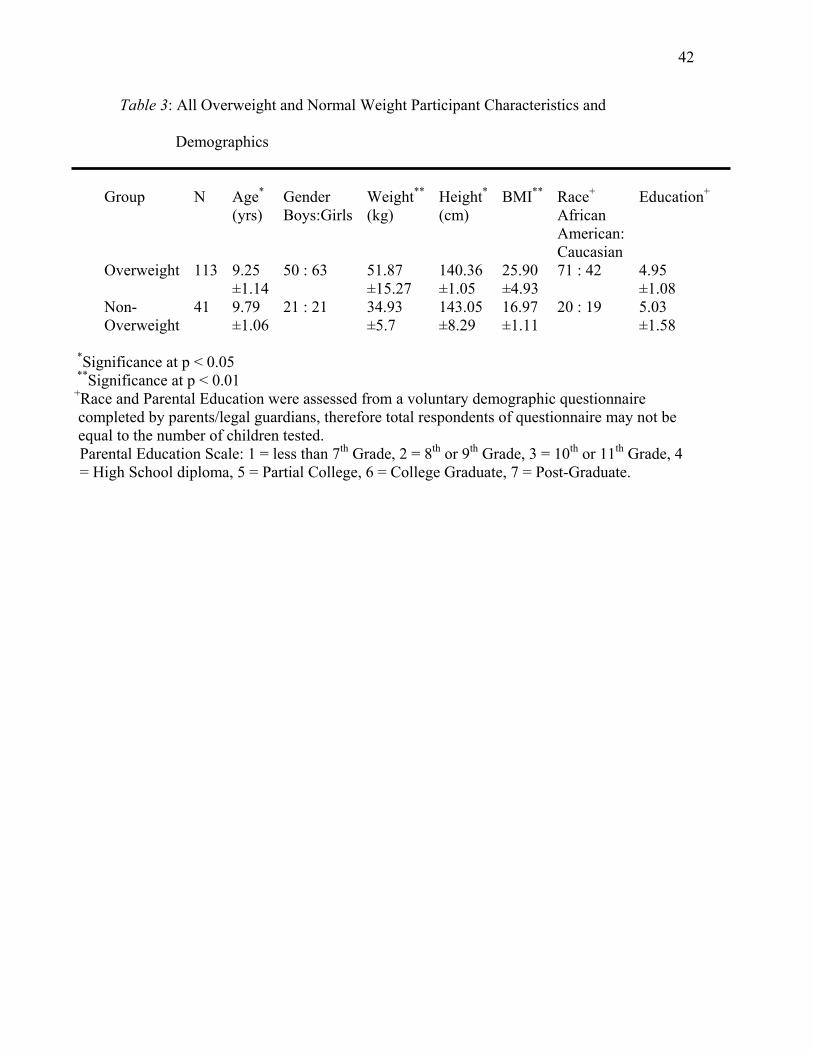
42
Table 3: All Overweight and Normal Weight Participant Characteristics and
Demographics
Group N Age* (yrs)
Gender Boys:Girls
Weight** (kg)
Height* (cm)
BMI** Race+ African American: Caucasian
Education+
Overweight
113 9.25 ±1.14
50 : 63
51.87 ±15.27
140.36 ±1.05
25.90 ±4.93
71 : 42 4.95 ±1.08
Non-Overweight
41 9.79 ±1.06
21 : 21 34.93 ±5.7
143.05 ±8.29
16.97 ±1.11
20 : 19 5.03 ±1.58
*Significance at p < 0.05 **Significance at p < 0.01
+Race and Parental Education were assessed from a voluntary demographic questionnaire completed by parents/legal guardians, therefore total respondents of questionnaire may not be equal to the number of children tested. Parental Education Scale: 1 = less than 7th Grade, 2 = 8th or 9th Grade, 3 = 10th or 11th Grade, 4 = High School diploma, 5 = Partial College, 6 = College Graduate, 7 = Post-Graduate.
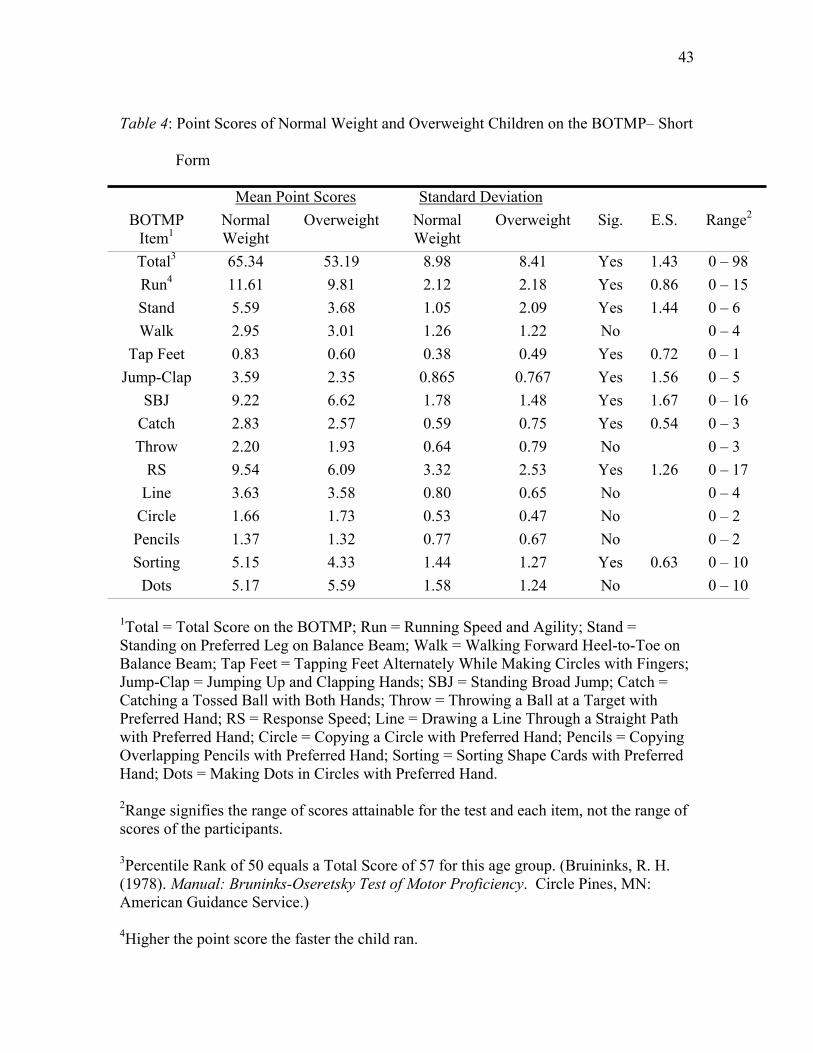
43
Table 4: Point Scores of Normal Weight and Overweight Children on the BOTMP– Short
Form
Mean Point Scores Standard Deviation
BOTMP Item1
Normal Weight
Overweight Normal Weight
Overweight Sig. E.S. Range2
Total3 65.34 53.19 8.98 8.41 Yes 1.43 0 – 98
Run4 11.61 9.81 2.12 2.18 Yes 0.86 0 – 15
Stand 5.59 3.68 1.05 2.09 Yes 1.44 0 – 6
Walk 2.95 3.01 1.26 1.22 No 0 – 4
Tap Feet 0.83 0.60 0.38 0.49 Yes 0.72 0 – 1
Jump-Clap 3.59 2.35 0.865 0.767 Yes 1.56 0 – 5
SBJ 9.22 6.62 1.78 1.48 Yes 1.67 0 – 16
Catch 2.83 2.57 0.59 0.75 Yes 0.54 0 – 3
Throw 2.20 1.93 0.64 0.79 No 0 – 3
RS 9.54 6.09 3.32 2.53 Yes 1.26 0 – 17
Line 3.63 3.58 0.80 0.65 No 0 – 4
Circle 1.66 1.73 0.53 0.47 No 0 – 2
Pencils 1.37 1.32 0.77 0.67 No 0 – 2
Sorting 5.15 4.33 1.44 1.27 Yes 0.63 0 – 10
Dots 5.17 5.59 1.58 1.24 No 0 – 10
1Total = Total Score on the BOTMP; Run = Running Speed and Agility; Stand = Standing on Preferred Leg on Balance Beam; Walk = Walking Forward Heel-to-Toe on Balance Beam; Tap Feet = Tapping Feet Alternately While Making Circles with Fingers; Jump-Clap = Jumping Up and Clapping Hands; SBJ = Standing Broad Jump; Catch = Catching a Tossed Ball with Both Hands; Throw = Throwing a Ball at a Target with Preferred Hand; RS = Response Speed; Line = Drawing a Line Through a Straight Path with Preferred Hand; Circle = Copying a Circle with Preferred Hand; Pencils = Copying Overlapping Pencils with Preferred Hand; Sorting = Sorting Shape Cards with Preferred Hand; Dots = Making Dots in Circles with Preferred Hand.
2Range signifies the range of scores attainable for the test and each item, not the range of scores of the participants. 3Percentile Rank of 50 equals a Total Score of 57 for this age group. (Bruininks, R. H. (1978). Manual: Bruninks-Oseretsky Test of Motor Proficiency. Circle Pines, MN: American Guidance Service.) 4Higher the point score the faster the child ran.
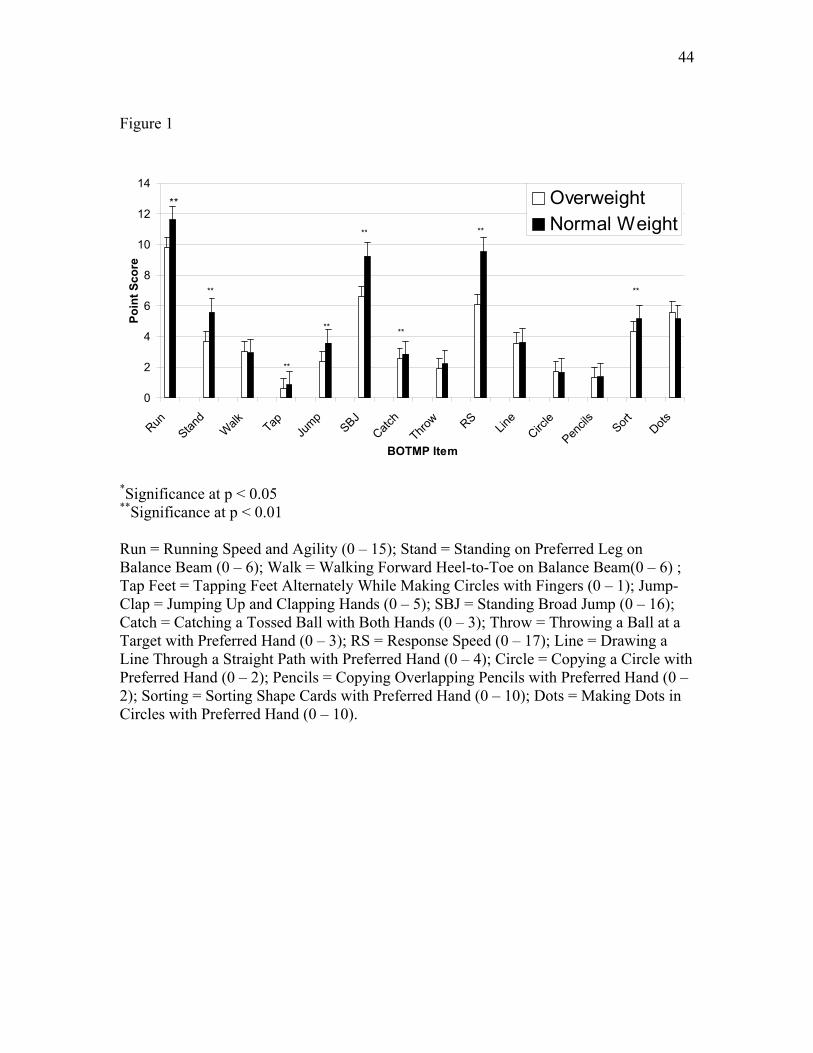
44
Figure 1
0
2
4
6
8
10
12
14
Run
Stand
Walk
Tap
Jump
SBJ
Catch
Throw R
SLine
Circle
Pencils
Sort
Dots
BOTMP Item
Point Score
Overweight
Normal Weight
**
**
**
**
**
**
**
**
*Significance at p < 0.05 **Significance at p < 0.01 Run = Running Speed and Agility (0 – 15); Stand = Standing on Preferred Leg on Balance Beam (0 – 6); Walk = Walking Forward Heel-to-Toe on Balance Beam(0 – 6) ; Tap Feet = Tapping Feet Alternately While Making Circles with Fingers (0 – 1); Jump-Clap = Jumping Up and Clapping Hands (0 – 5); SBJ = Standing Broad Jump (0 – 16); Catch = Catching a Tossed Ball with Both Hands (0 – 3); Throw = Throwing a Ball at a Target with Preferred Hand (0 – 3); RS = Response Speed (0 – 17); Line = Drawing a Line Through a Straight Path with Preferred Hand (0 – 4); Circle = Copying a Circle with Preferred Hand (0 – 2); Pencils = Copying Overlapping Pencils with Preferred Hand (0 – 2); Sorting = Sorting Shape Cards with Preferred Hand (0 – 10); Dots = Making Dots in Circles with Preferred Hand (0 – 10).
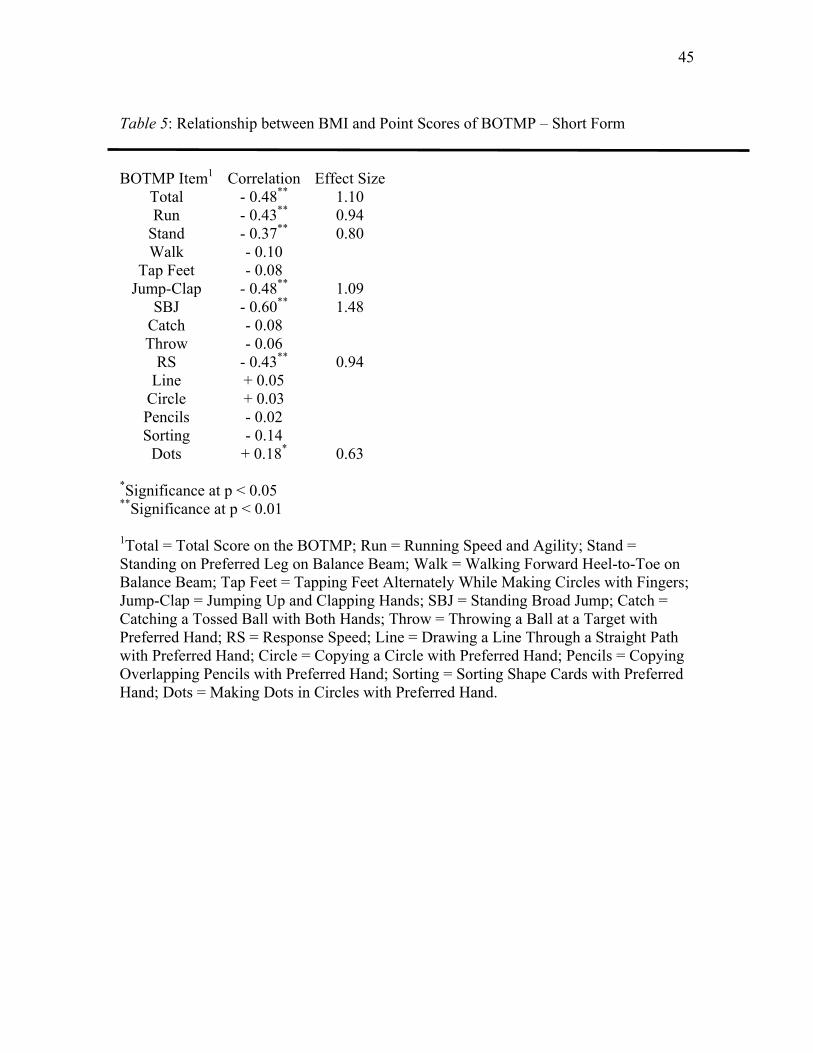
45
Table 5: Relationship between BMI and Point Scores of BOTMP – Short Form BOTMP Item1 Correlation Effect Size
Total - 0.48** 1.10 Run - 0.43** 0.94
Stand - 0.37** 0.80 Walk - 0.10
Tap Feet - 0.08 Jump-Clap - 0.48** 1.09
SBJ - 0.60** 1.48 Catch - 0.08 Throw - 0.06
RS - 0.43** 0.94 Line + 0.05
Circle + 0.03 Pencils - 0.02 Sorting - 0.14 Dots + 0.18* 0.63
*Significance at p < 0.05 **Significance at p < 0.01 1Total = Total Score on the BOTMP; Run = Running Speed and Agility; Stand = Standing on Preferred Leg on Balance Beam; Walk = Walking Forward Heel-to-Toe on Balance Beam; Tap Feet = Tapping Feet Alternately While Making Circles with Fingers; Jump-Clap = Jumping Up and Clapping Hands; SBJ = Standing Broad Jump; Catch = Catching a Tossed Ball with Both Hands; Throw = Throwing a Ball at a Target with Preferred Hand; RS = Response Speed; Line = Drawing a Line Through a Straight Path with Preferred Hand; Circle = Copying a Circle with Preferred Hand; Pencils = Copying Overlapping Pencils with Preferred Hand; Sorting = Sorting Shape Cards with Preferred Hand; Dots = Making Dots in Circles with Preferred Hand.
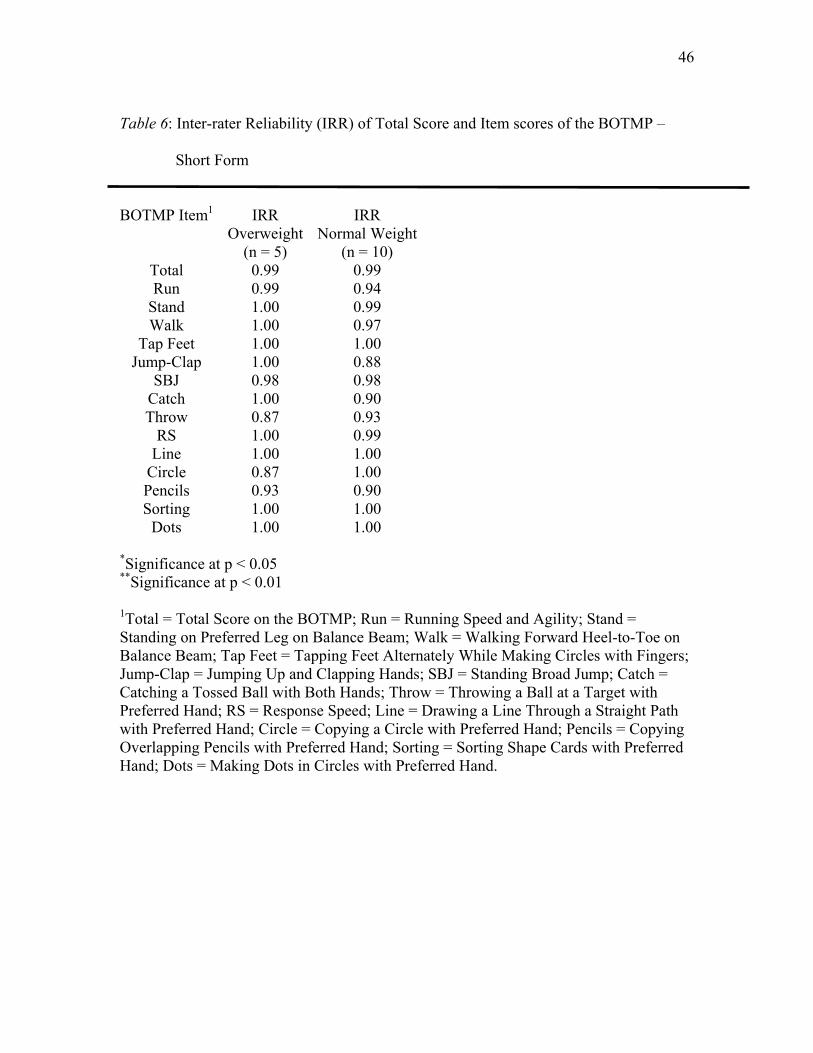
46
Table 6: Inter-rater Reliability (IRR) of Total Score and Item scores of the BOTMP –
Short Form BOTMP Item1 IRR
Overweight (n = 5)
IRR Normal Weight
(n = 10) Total 0.99 0.99 Run 0.99 0.94
Stand 1.00 0.99 Walk 1.00 0.97
Tap Feet 1.00 1.00 Jump-Clap 1.00 0.88
SBJ 0.98 0.98 Catch 1.00 0.90 Throw 0.87 0.93
RS 1.00 0.99 Line 1.00 1.00
Circle 0.87 1.00 Pencils 0.93 0.90 Sorting 1.00 1.00 Dots 1.00 1.00
*Significance at p < 0.05 **Significance at p < 0.01 1Total = Total Score on the BOTMP; Run = Running Speed and Agility; Stand = Standing on Preferred Leg on Balance Beam; Walk = Walking Forward Heel-to-Toe on Balance Beam; Tap Feet = Tapping Feet Alternately While Making Circles with Fingers; Jump-Clap = Jumping Up and Clapping Hands; SBJ = Standing Broad Jump; Catch = Catching a Tossed Ball with Both Hands; Throw = Throwing a Ball at a Target with Preferred Hand; RS = Response Speed; Line = Drawing a Line Through a Straight Path with Preferred Hand; Circle = Copying a Circle with Preferred Hand; Pencils = Copying Overlapping Pencils with Preferred Hand; Sorting = Sorting Shape Cards with Preferred Hand; Dots = Making Dots in Circles with Preferred Hand.
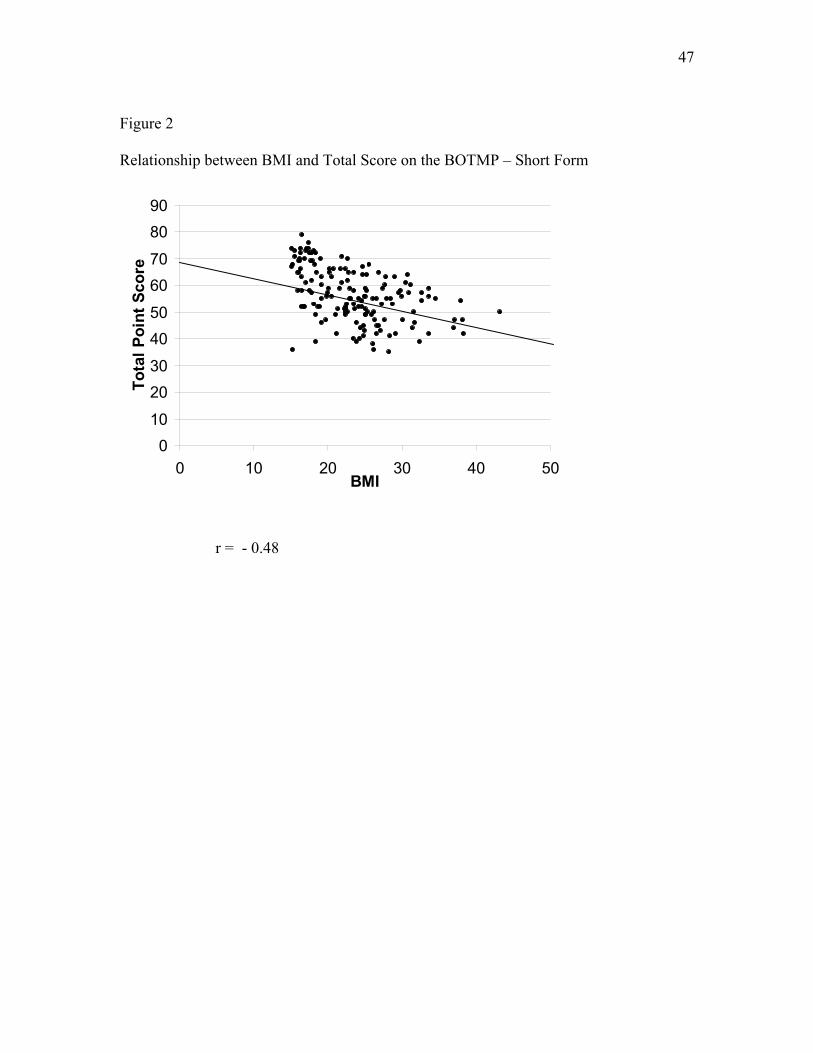
47
Figure 2 Relationship between BMI and Total Score on the BOTMP – Short Form
0
10
20
30
40
50
60
70
80
90
0 10 20 30 40 50BMI
Total Point Score
r = - 0.48
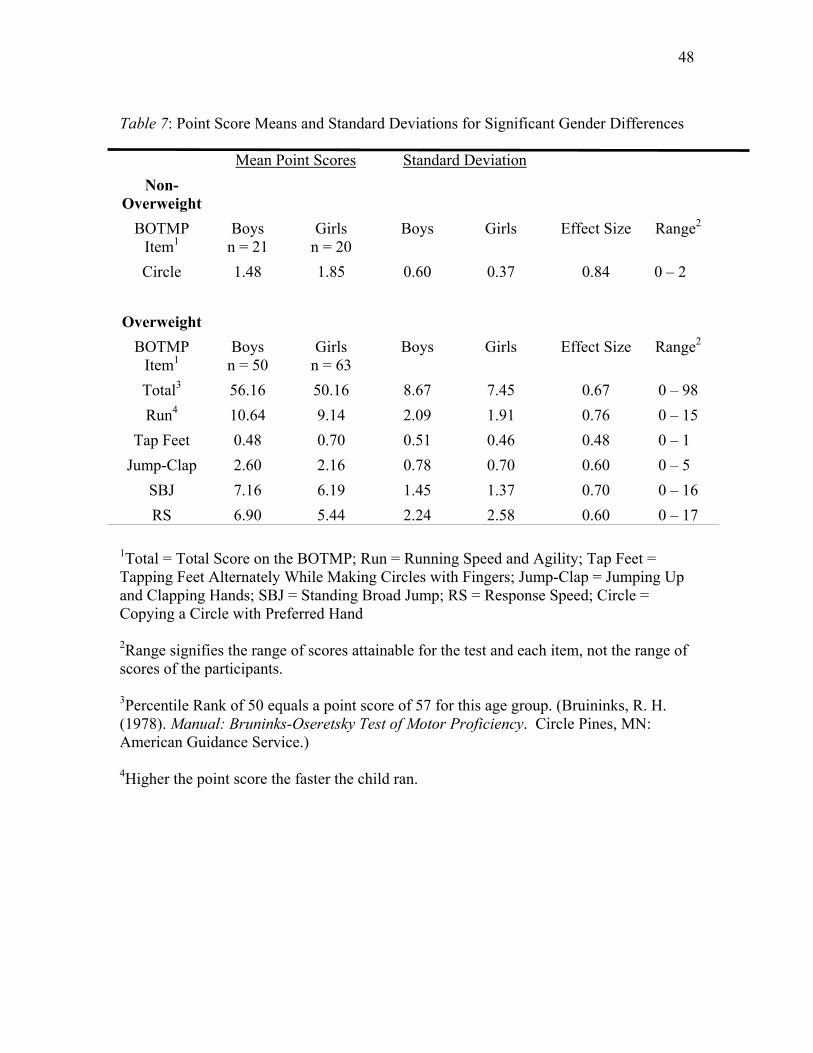
48
Table 7: Point Score Means and Standard Deviations for Significant Gender Differences Mean Point Scores Standard Deviation
Non-
Overweight
BOTMP Item1
Boys n = 21
Girls n = 20
Boys Girls Effect Size Range2
Circle 1.48 1.85 0.60 0.37 0.84 0 – 2
Overweight
BOTMP Item1
Boys n = 50
Girls n = 63
Boys Girls Effect Size Range2
Total3 56.16 50.16 8.67 7.45 0.67 0 – 98
Run4 10.64 9.14 2.09 1.91 0.76 0 – 15
Tap Feet 0.48 0.70 0.51 0.46 0.48 0 – 1
Jump-Clap 2.60 2.16 0.78 0.70 0.60 0 – 5
SBJ 7.16 6.19 1.45 1.37 0.70 0 – 16
RS 6.90 5.44 2.24 2.58 0.60 0 – 17
1Total = Total Score on the BOTMP; Run = Running Speed and Agility; Tap Feet = Tapping Feet Alternately While Making Circles with Fingers; Jump-Clap = Jumping Up and Clapping Hands; SBJ = Standing Broad Jump; RS = Response Speed; Circle = Copying a Circle with Preferred Hand
2Range signifies the range of scores attainable for the test and each item, not the range of scores of the participants. 3Percentile Rank of 50 equals a point score of 57 for this age group. (Bruininks, R. H. (1978). Manual: Bruninks-Oseretsky Test of Motor Proficiency. Circle Pines, MN: American Guidance Service.) 4Higher the point score the faster the child ran.
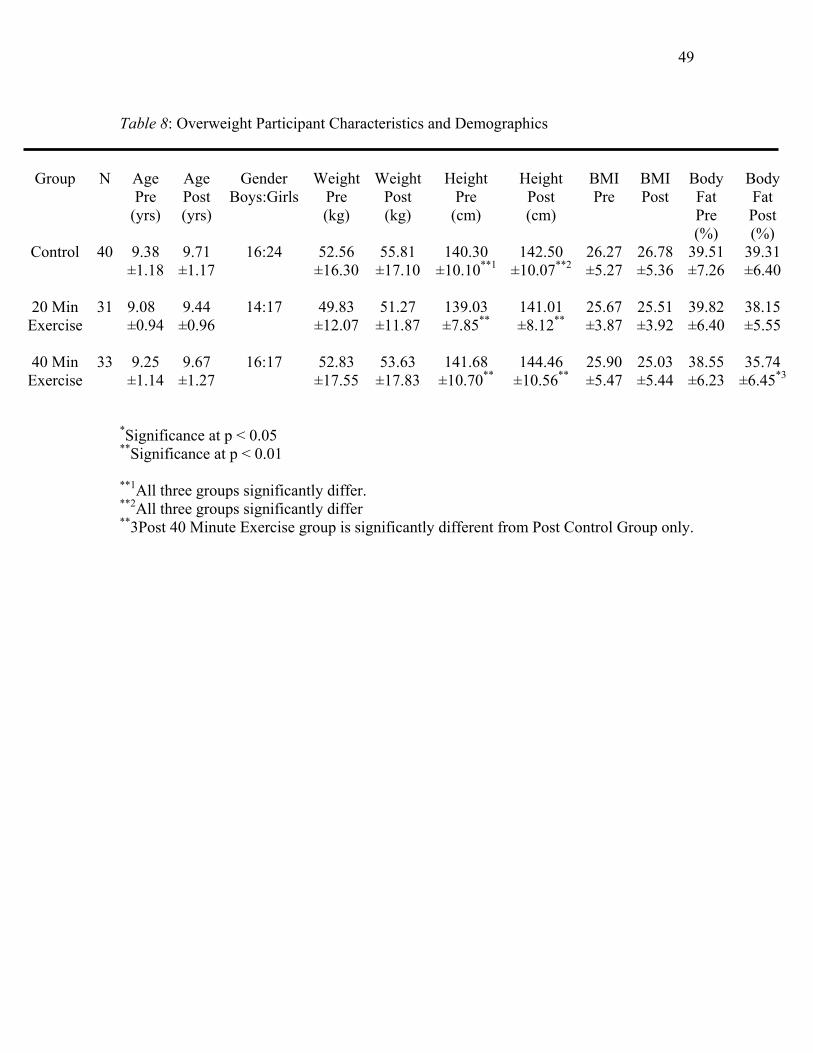
49
Table 8: Overweight Participant Characteristics and Demographics
Group N Age Pre
(yrs)
Age Post (yrs)
Gender Boys:Girls
Weight Pre (kg)
Weight Post (kg)
Height Pre (cm)
Height Post (cm)
BMI Pre
BMI Post
Body Fat Pre (%)
Body Fat Post (%)
Control
40 9.38 ±1.18
9.71 ±1.17
16:24 52.56 ±16.30
55.81 ±17.10
140.30 ±10.10**1
142.50 ±10.07**2
26.27 ±5.27
26.78 ±5.36
39.51 ±7.26
39.31 ±6.40
20 Min Exercise
31 9.08 ±0.94
9.44 ±0.96
14:17 49.83 ±12.07
51.27 ±11.87
139.03 ±7.85**
141.01 ±8.12**
25.67 ±3.87
25.51 ±3.92
39.82 ±6.40
38.15 ±5.55
40 Min Exercise
33 9.25 ±1.14
9.67 ±1.27
16:17 52.83 ±17.55
53.63 ±17.83
141.68 ±10.70**
144.46 ±10.56**
25.90 ±5.47
25.03 ±5.44
38.55 ±6.23
35.74 ±6.45*3
*Significance at p < 0.05 **Significance at p < 0.01 **1All three groups significantly differ. **2All three groups significantly differ **3Post 40 Minute Exercise group is significantly different from Post Control Group only.
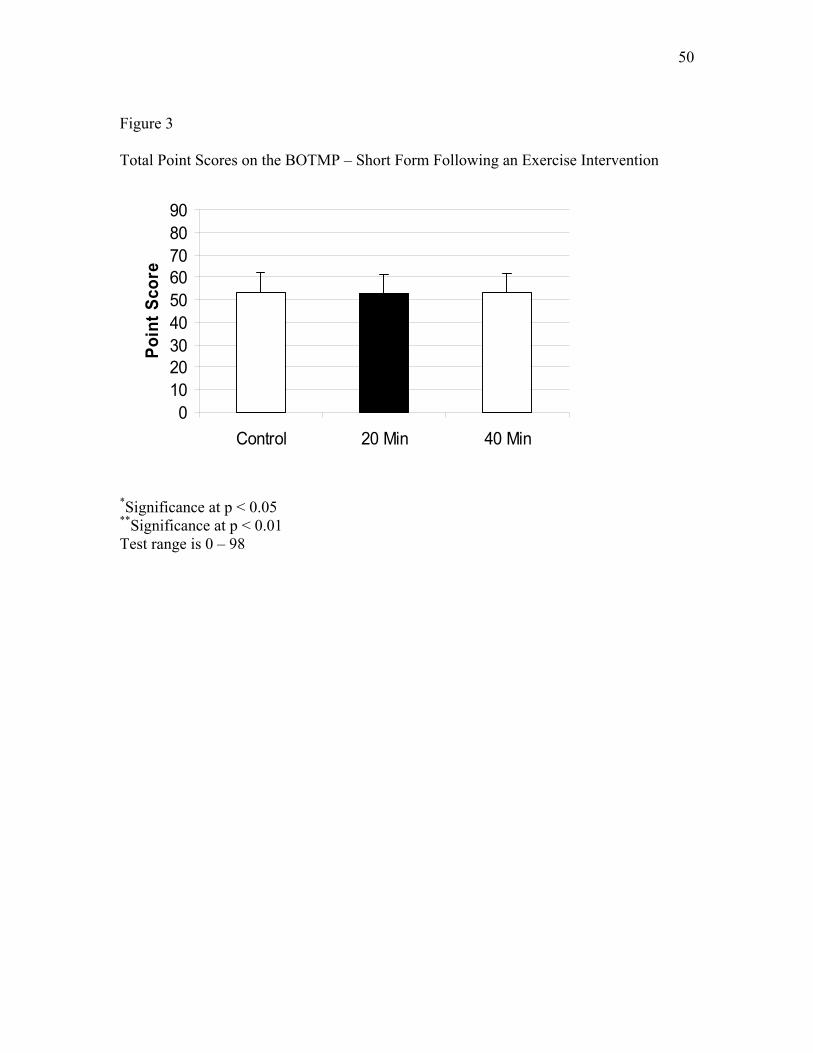
50
Figure 3 Total Point Scores on the BOTMP – Short Form Following an Exercise Intervention
0
10
20
30
40
50
60
70
80
90
Control 20 Min 40 Min
Point Score
*Significance at p < 0.05 **Significance at p < 0.01 Test range is 0 – 98
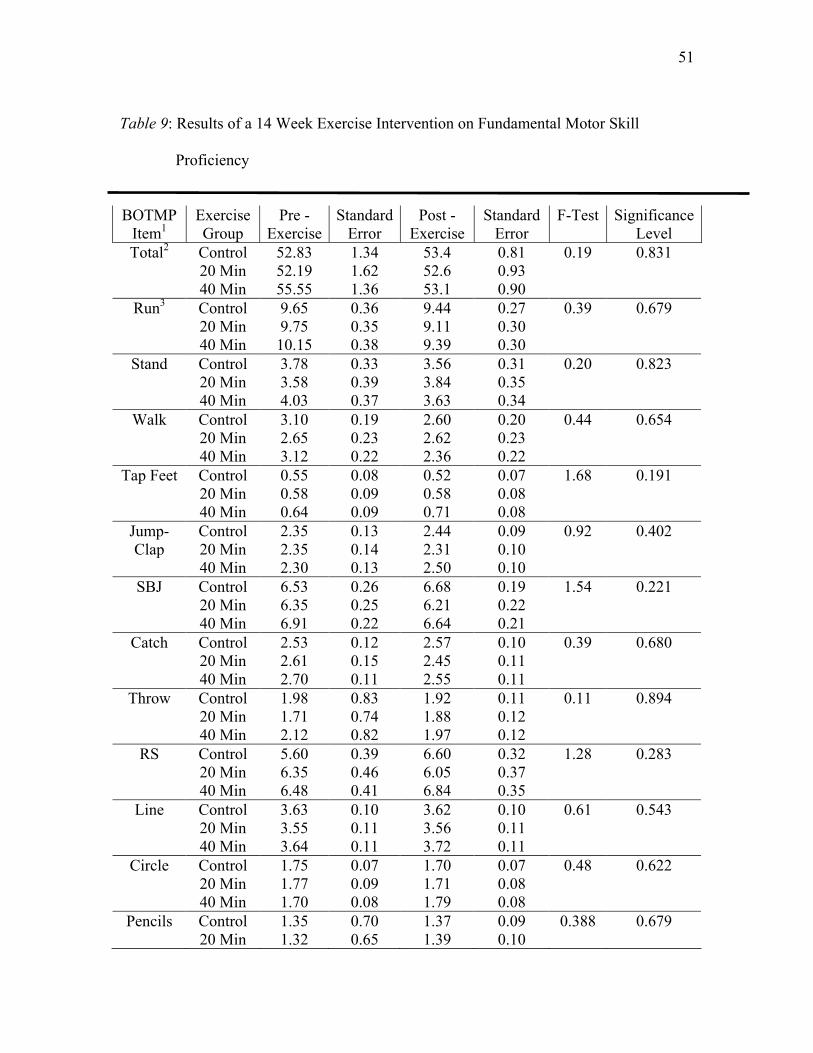
51
Table 9: Results of a 14 Week Exercise Intervention on Fundamental Motor Skill
Proficiency BOTMP
Item1 Exercise Group
Pre -Exercise
Standard Error
Post - Exercise
Standard Error
F-Test Significance Level
Total2 Control 20 Min 40 Min
52.83 52.19 55.55
1.34 1.62 1.36
53.4 52.6 53.1
0.81 0.93 0.90
0.19 0.831
Run3 Control 20 Min 40 Min
9.65 9.75 10.15
0.36 0.35 0.38
9.44 9.11 9.39
0.27 0.30 0.30
0.39 0.679
Stand Control 20 Min 40 Min
3.78 3.58 4.03
0.33 0.39 0.37
3.56 3.84 3.63
0.31 0.35 0.34
0.20 0.823
Walk Control 20 Min 40 Min
3.10 2.65 3.12
0.19 0.23 0.22
2.60 2.62 2.36
0.20 0.23 0.22
0.44 0.654
Tap Feet Control 20 Min 40 Min
0.55 0.58 0.64
0.08 0.09 0.09
0.52 0.58 0.71
0.07 0.08 0.08
1.68 0.191
Jump-Clap
Control 20 Min 40 Min
2.35 2.35 2.30
0.13 0.14 0.13
2.44 2.31 2.50
0.09 0.10 0.10
0.92 0.402
SBJ Control 20 Min 40 Min
6.53 6.35 6.91
0.26 0.25 0.22
6.68 6.21 6.64
0.19 0.22 0.21
1.54 0.221
Catch Control 20 Min 40 Min
2.53 2.61 2.70
0.12 0.15 0.11
2.57 2.45 2.55
0.10 0.11 0.11
0.39 0.680
Throw Control 20 Min 40 Min
1.98 1.71 2.12
0.83 0.74 0.82
1.92 1.88 1.97
0.11 0.12 0.12
0.11 0.894
RS Control 20 Min 40 Min
5.60 6.35 6.48
0.39 0.46 0.41
6.60 6.05 6.84
0.32 0.37 0.35
1.28 0.283
Line Control 20 Min 40 Min
3.63 3.55 3.64
0.10 0.11 0.11
3.62 3.56 3.72
0.10 0.11 0.11
0.61 0.543
Circle Control 20 Min 40 Min
1.75 1.77 1.70
0.07 0.09 0.08
1.70 1.71 1.79
0.07 0.08 0.08
0.48 0.622
Pencils Control 20 Min
1.35 1.32
0.70 0.65
1.37 1.39
0.09 0.10
0.388 0.679
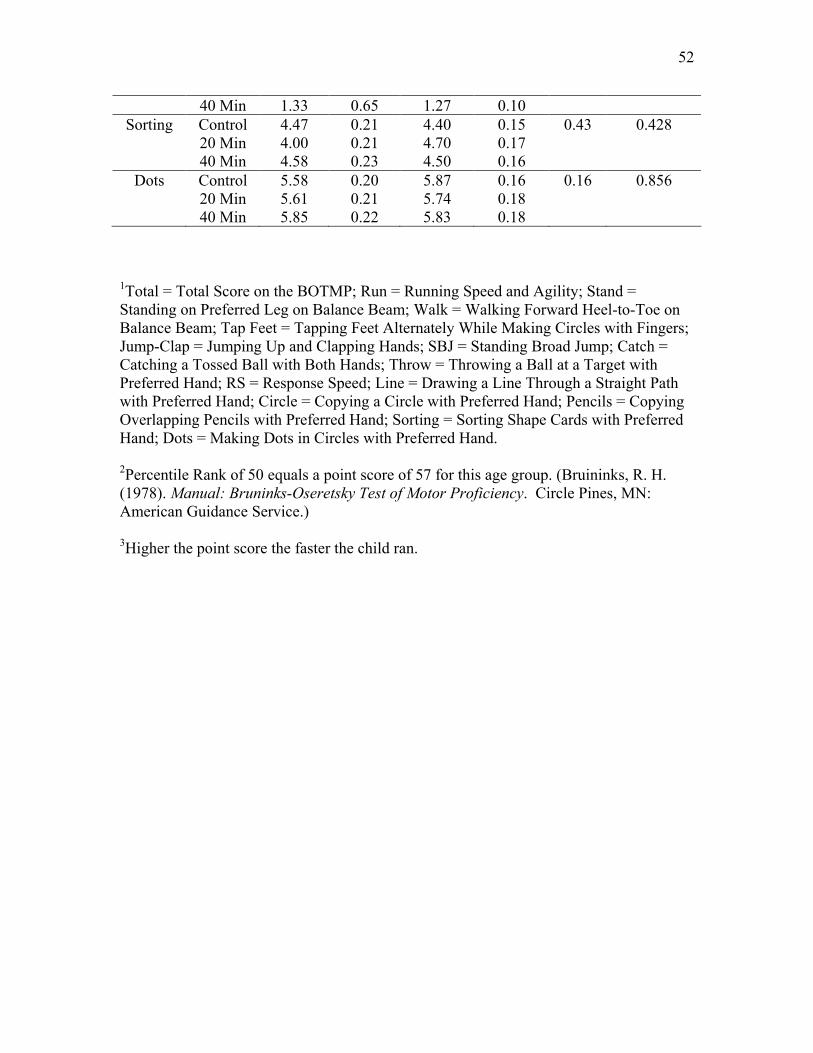
52
40 Min 1.33 0.65 1.27 0.10
Sorting Control 20 Min 40 Min
4.47 4.00 4.58
0.21 0.21 0.23
4.40 4.70 4.50
0.15 0.17 0.16
0.43 0.428
Dots Control 20 Min 40 Min
5.58 5.61 5.85
0.20 0.21 0.22
5.87 5.74 5.83
0.16 0.18 0.18
0.16 0.856
1Total = Total Score on the BOTMP; Run = Running Speed and Agility; Stand = Standing on Preferred Leg on Balance Beam; Walk = Walking Forward Heel-to-Toe on Balance Beam; Tap Feet = Tapping Feet Alternately While Making Circles with Fingers; Jump-Clap = Jumping Up and Clapping Hands; SBJ = Standing Broad Jump; Catch = Catching a Tossed Ball with Both Hands; Throw = Throwing a Ball at a Target with Preferred Hand; RS = Response Speed; Line = Drawing a Line Through a Straight Path with Preferred Hand; Circle = Copying a Circle with Preferred Hand; Pencils = Copying Overlapping Pencils with Preferred Hand; Sorting = Sorting Shape Cards with Preferred Hand; Dots = Making Dots in Circles with Preferred Hand.
2Percentile Rank of 50 equals a point score of 57 for this age group. (Bruininks, R. H. (1978). Manual: Bruninks-Oseretsky Test of Motor Proficiency. Circle Pines, MN: American Guidance Service.) 3Higher the point score the faster the child ran.
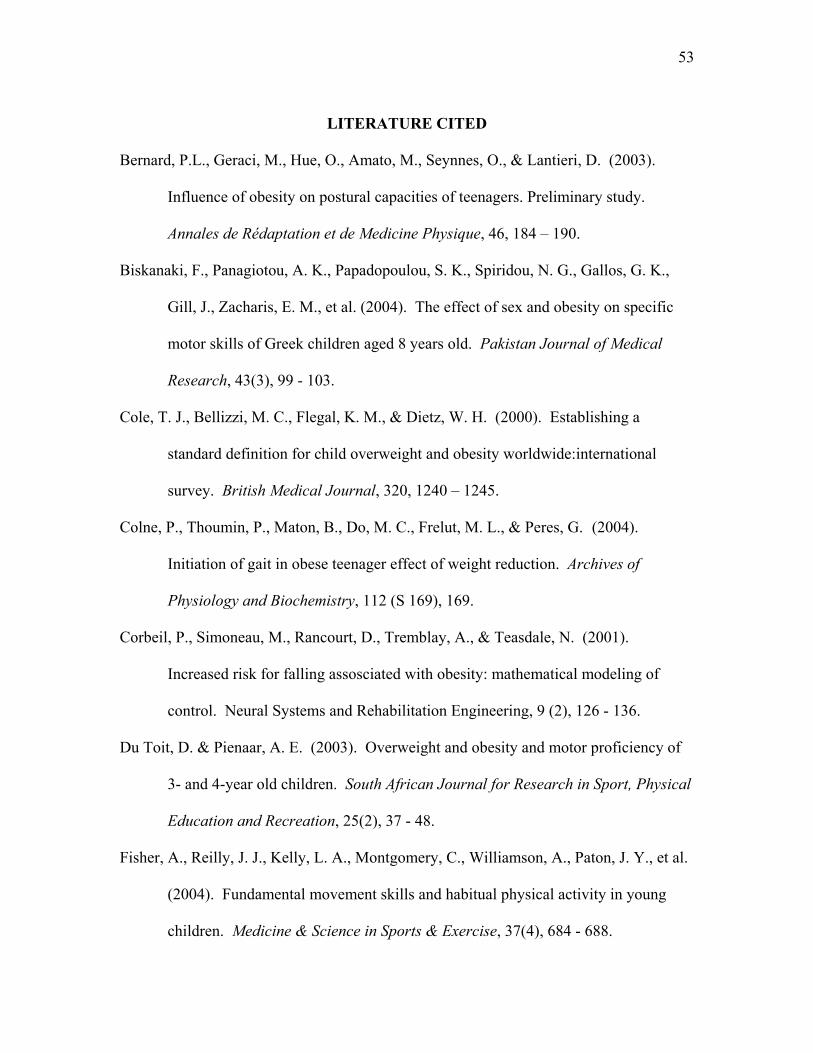
53
LITERATURE CITED
Bernard, P.L., Geraci, M., Hue, O., Amato, M., Seynnes, O., & Lantieri, D. (2003). Influence of obesity on postural capacities of teenagers. Preliminary study.
Annales de Rédaptation et de Medicine Physique, 46, 184 – 190.
Biskanaki, F., Panagiotou, A. K., Papadopoulou, S. K., Spiridou, N. G., Gallos, G. K.,
Gill, J., Zacharis, E. M., et al. (2004). The effect of sex and obesity on specific motor skills of Greek children aged 8 years old. Pakistan Journal of Medical
Research, 43(3), 99 - 103. Cole, T. J., Bellizzi, M. C., Flegal, K. M., & Dietz, W. H. (2000). Establishing a
standard definition for child overweight and obesity worldwide:international survey. British Medical Journal, 320, 1240 – 1245.
Colne, P., Thoumin, P., Maton, B., Do, M. C., Frelut, M. L., & Peres, G. (2004).
Initiation of gait in obese teenager effect of weight reduction. Archives of
Physiology and Biochemistry, 112 (S 169), 169.
Corbeil, P., Simoneau, M., Rancourt, D., Tremblay, A., & Teasdale, N. (2001).
Increased risk for falling assosciated with obesity: mathematical modeling of
control. Neural Systems and Rehabilitation Engineering, 9 (2), 126 - 136.
Du Toit, D. & Pienaar, A. E. (2003). Overweight and obesity and motor proficiency of
3- and 4-year old children. South African Journal for Research in Sport, Physical
Education and Recreation, 25(2), 37 - 48.
Fisher, A., Reilly, J. J., Kelly, L. A., Montgomery, C., Williamson, A., Paton, J. Y., et al.
(2004). Fundamental movement skills and habitual physical activity in young
children. Medicine & Science in Sports & Exercise, 37(4), 684 - 688.
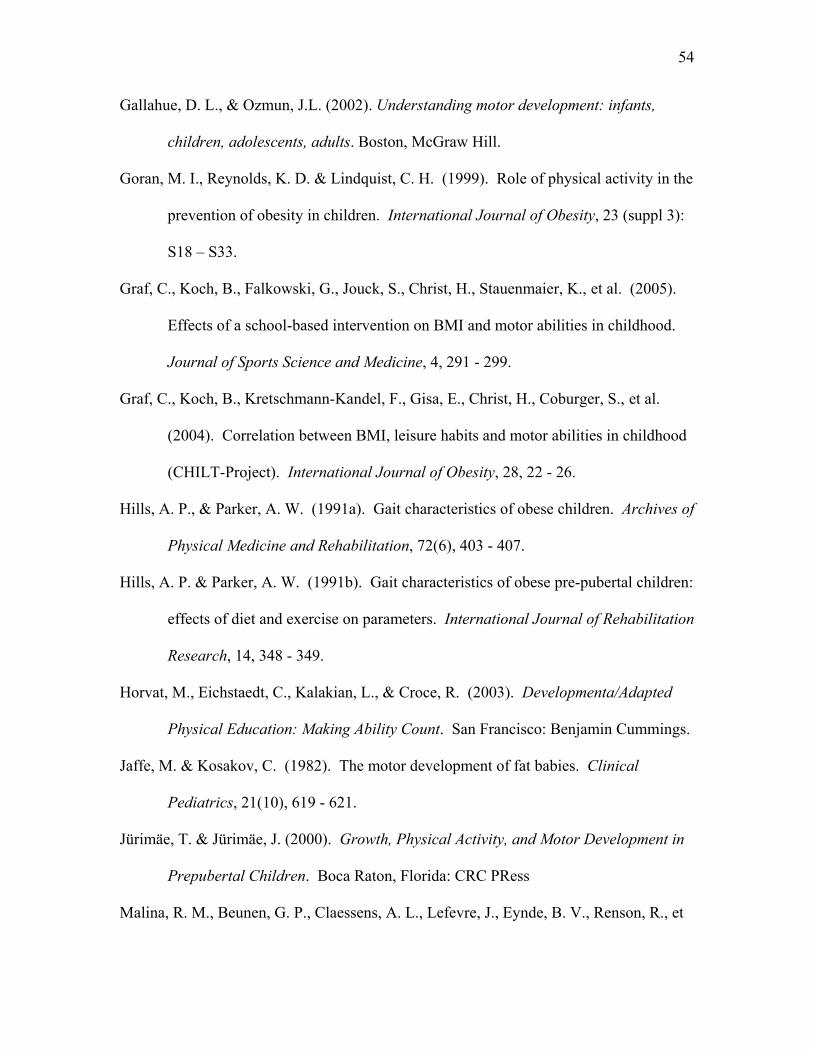
54
Gallahue, D. L., & Ozmun, J.L. (2002). Understanding motor development: infants,
children, adolescents, adults. Boston, McGraw Hill.
Goran, M. I., Reynolds, K. D. & Lindquist, C. H. (1999). Role of physical activity in the
prevention of obesity in children. International Journal of Obesity, 23 (suppl 3):
S18 – S33.
Graf, C., Koch, B., Falkowski, G., Jouck, S., Christ, H., Stauenmaier, K., et al. (2005).
Effects of a school-based intervention on BMI and motor abilities in childhood. Journal of Sports Science and Medicine, 4, 291 - 299.
Graf, C., Koch, B., Kretschmann-Kandel, F., Gisa, E., Christ, H., Coburger, S., et al. (2004). Correlation between BMI, leisure habits and motor abilities in childhood (CHILT-Project). International Journal of Obesity, 28, 22 - 26.
Hills, A. P., & Parker, A. W. (1991a). Gait characteristics of obese children. Archives of
Physical Medicine and Rehabilitation, 72(6), 403 - 407.
Hills, A. P. & Parker, A. W. (1991b). Gait characteristics of obese pre-pubertal children:
effects of diet and exercise on parameters. International Journal of Rehabilitation
Research, 14, 348 - 349.
Horvat, M., Eichstaedt, C., Kalakian, L., & Croce, R. (2003). Developmenta/Adapted
Physical Education: Making Ability Count. San Francisco: Benjamin Cummings.
Jaffe, M. & Kosakov, C. (1982). The motor development of fat babies. Clinical
Pediatrics, 21(10), 619 - 621.
Jürimäe, T. & Jürimäe, J. (2000). Growth, Physical Activity, and Motor Development in
Prepubertal Children. Boca Raton, Florida: CRC PRess
Malina, R. M., Beunen, G. P., Claessens, A. L., Lefevre, J., Eynde, B. V., Renson, R., et
55
al. (1994). Fatness and physical fitness of girls 7 to 17 years. Obesity Research, 3, 221 - 231.
McGraw, B., McClenaghan, B. A., Williams, H. G., Dickerson, J., Ward, D. S. (2000). Gait and postural stability in obese and nonobese prepubertal boys. Archives of
Physical Medicine and Rehabilitation, 81, 484 – 489. McKenzie, T. L., Sallis, J. F., Broyles, S. L., Zive, M. M., Nader, P. R., Charles, B. C.,
et al. (2002). Childhood movement skills: predictors of physical activity in anglo
american and mexican american adolescents? Research Quarterly for Exercise
and Sport, 73(3), 238 - 244.
Okely, A. D., Booth, M. L., & Chey, T. (2004). Relationships between body
composition and fundamental movement skills among children and adolescents.
Research Quarterly for Exercise and Sport, 75(3), 238 - 247.
Okely, A. D., Booth, M. L., Patterson, J. W. (2001). Relationship of physical activity to
fundamental movement skills among adolescents. Medicine & Science in Sports
& Exercise, 33(11), 1899 - 1904.
Pacquette, C., Teasdale, N., Prud'Homme, D., & Tremblay, A. (2000). Weight reduction
yields a more stable postural behavior in obese men. Archives of Physiology and
Biochemistry, 108, 223.
Peatman, J. G., & Higgons, R. A. (1942). Relation of infants' weight and body build to
locomotor development. American Journal of Orthopsychiatry, 12, 243 - 246.
Pietrobelli, A., Faith, M. S., Allison, D. B., Gallagher, D., Chiumello, G., & Heymsfield,
S. B. (1998). Body mass index as a measure of adiposity among children and
adolescents: a validation study. The Journal of Pediatrics, 132(2), 204 – 210.
56
Raudsepp, L., & Jürimäe, T. (1997). Relationships of physical activity and somatic
characteristics with physical fitness and motor skill in prepubertal girls. American
Journal of Human Biology, 9, 513 - 521.
Reeves, L., Broeder, G. E., Kennedy-Honeycutt, L., & East, C. (1999). Relationship of
fitness and gross motor skills for five- to six-yr.-old children. Perceptual and
Motor Skills, 89, 739 - 747.
Rosner, B., Prineas, R., Loggie, J., & Daniels, S. R. (1998). Percentiles for body mass
index in U.S. children 5 to 17 years of age. The Journal of Pediatrics, 132(2) 211
- 222
Seefeldt V. & Haubenstricker J. (1982). Patterns, phases or stages: An analytical model
for the study of developmental movement. In Kelso JAS, Clark JE, eds., The
Development of Movement Control and Coordination (pp. 309–318). New York,
NY: John Wiley and Sons.
Shumway-Cook, A., & Woollacott, M. (2001). Motor Control: Theory and Practical
Applications. Philadelphia: Lippincott Williams and Wilkins.
Thomas J. & French K. E. (1985). Gender differences across age in motor performance a
meta-analysis. Psychological Bulletin, 98(2), 260-282.
Ulrich, B. D. (1987). Perceptions of physical competence, motor competence, and
participation in organized sport: their interrelationships in young children.
Research Quarterly for Exercise and Sport, 58(1), 57 - 67.


![[Victor Hillier Peter Coombs] Hillier s Fundamental of motor vehicle tech Book 1](https://img.pdfslide.us/doc/110x75/552b3fdd4a79593a588b4612/victor-hillier-peter-coombs-hillier-s-fundamental-of-motor-vehicle-tech-book-1.jpg)